CATS II TORFP # J01B9200028 Maryland Transportation Authority

Transportation Sector Update
Colleen Turner
Assistant Director, Office of Planning and Capital Programming
Maryland Department of Transportation
[email protected] | 410-865-2773
May 12, 2020 Mitigation Working Group Meeting
1

2
Presentation Outline
➢ 2030 MDOT GGRA Plan Update➢ Update approach, organization, analysis status
➢ Reference Case Details➢ VMT Update, 2017 Baseline, 2030 Standards, EV Projections
➢ Policy Scenarios➢ Policy Scenario 1 – “On-the-books”➢ Policy Scenario 2 – “Unfunded, Emerging, and Innovative Strategies”
➢ What have we learned so far (COVID-19)➢ Data insights and view of trends and potential impacts on transportation
➢ Accomplishments Progress on MWG Workplan➢ Transportation Demand Management – Commute Choicer Maryland➢ Progress on MWG Workplan ➢ MDOT Fleet Acquisition – Fleet Innovation Plan
➢ Next Steps (2020)
2030 MDOT GGRA Plan Update How has our approach changed since 2018 and
what impacts could these changes have on 2030 emissions?
3

2018 Approach & Results
• VMT Growth Rate (2014 Baseline) and 2018 MPO model forecasts
• EV Assumptions to reflect MDOT/MDE scenario of 600,000 EVs
• Based on 2018-2023 MDOT CTP and MPO LRTPs
• Federal Standards Rollback (Sensitivity Analysis)
• Strategies organized as “On-The-Books”, “Emerging”, and “Innovative”
• Included a Pricing Scenario (2015 TCI Revenue Analysis)
2018 MDOT GGRA
Draft Plan
2018 Analysis Takeaways
• Funded plans, projects, and programs plus meeting Federal standards and ZEV Mandate goals…approached a 31% CO2e reduction from 2006 by 2030
• Estimated over $10 billion in spending (with constant economic growth)
• Estimated up to $18 billion more along with aggressive technology adoption to reach the 40% reduction goal
4

2020 Modeling Updates
• VMT Growth Rate (2017 Baseline) and latest MPO model forecasts
• Updated demographics and transportation demand data
• Uses TCI’s Reference Case for EV projections (consistent with MDE)
• Updated to 2020-2025 MDOT CTP and MPO LRTPs
• Safer Affordable Fuel Efficient (SAFE) fuel efficiency standards rollback
• Updated policy scenarios reflecting current status and revenue realities
2020 MDOT GGRA
Final Plan
Early 2020 Takeaways
• New CTP (2020-2025), updated MPO plans, recent significant project advancements, changing (beneficial) vehicle ownership and travel trends
• More uncertain economic growth and transportation revenue picture
• Picture mostly the same on widespread vehicle technology advancement (ZEVs, connected and autonomous vehicles)
5

2030 Reference CaseDraft 2030 forecast update
How does it differ from the 2018 GGRA analysis?
6

2030 Reference Case & Policy Scenarios VMT Growth Summary
69
,39
2
64
.51
8
10
,64
5
9,8
97
2030Reference
ScenarioPolicyScenario 1
• Adjusted VMT base
from
2014 to 2017
• County level
projection
changes (based
on observed VMT
trend)
• Creates a 2030
VMT forecast
building from 2018
VMT
• Reflects mix of low
and high VMT
growth since 2010
7
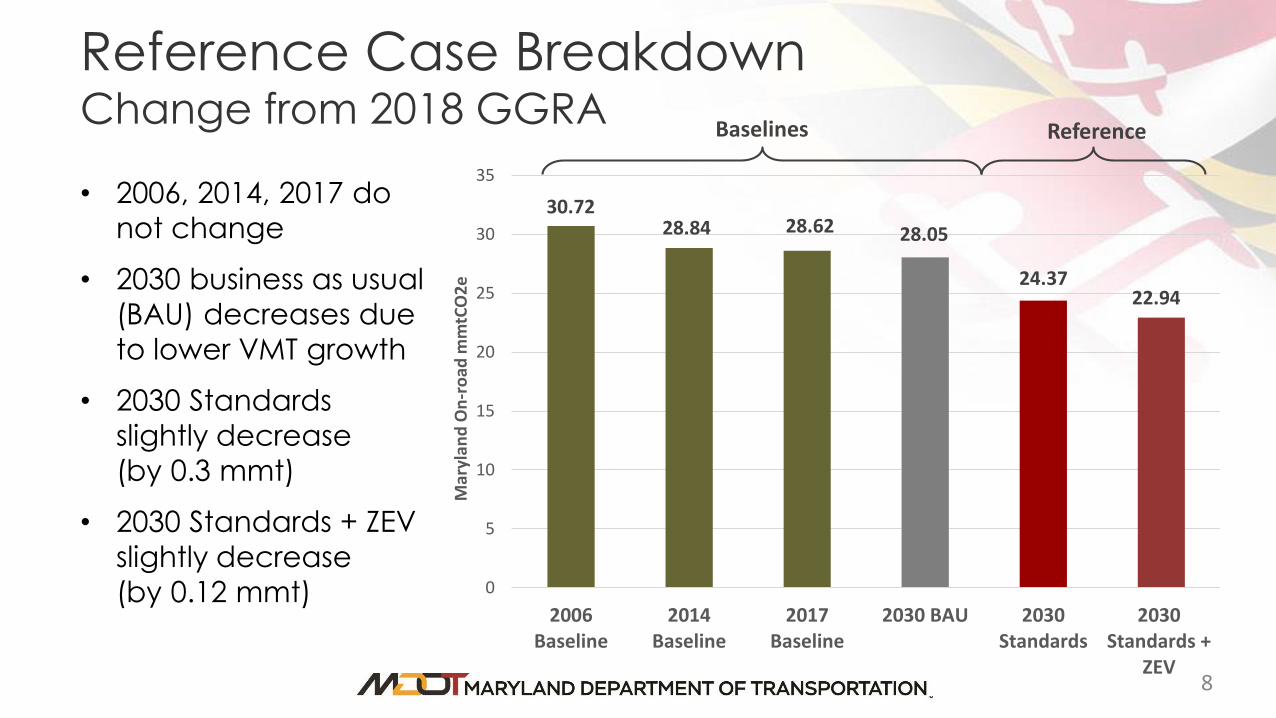
Reference Case BreakdownChange from 2018 GGRA
• 2006, 2014, 2017 do
not change
• 2030 business as usual
(BAU) decreases due
to lower VMT growth
• 2030 Standards
slightly decrease
(by 0.3 mmt)
• 2030 Standards + ZEV
slightly decrease
(by 0.12 mmt)
30.7228.84 28.62 28.05
24.3722.94
0
5
10
15
20
25
30
35
2006Baseline
2014Baseline
2017Baseline
2030 BAU 2030Standards
2030Standards +
ZEV
Mar
ylan
d O
n-r
oad
mm
tCO
2e
Baselines Reference
8

Reference CaseEV Projections Update
• ZEV target 540,000 EVs by 2030
• 2018 MDOT/MDE scenario
estimated 604,840 EVs by 2030
• 2020 scenario(based on TCI)
estimates 460,366 EVs by 2030
• Estimated 1.43 mmt reduction
(compared to 1.62 MMTCO2e
reductions from 2018 modeling)
-
100,000
200,000
300,000
400,000
500,000
600,000
700,000
2017* 2018 2019 2020 2021 2022 2023 2024 2025 2026 2027 2028 2029 2030
2018 MDOT MDE Scenario 2020 Updated TCI Reference Case ZEV Target 2030
9

Estimated % of Vehicles – 2017 Vehicle Age Distribution
32%30%33%4%
Range of Fuel Economy
Performance Targets
Pact w/ CA + 22 States (including MD)Ford, Honda, Volkswagen
BMW, Volvo
Side with AdministrationGeneral Motors, Fiat ChryslerToyota, Hyundai, Kia, Nissan
SAFE Vehicle Final Rulemaking – April 30, 2020
Reference Case OptionsComparison of Obama Era Fuel Economy Standards vs SAFE Vehicle Rule
10

2030 Policy ScenariosHow far can we get by 2030 based on current policies and funded programs
and what are the options to meet the 40 by 30 goal?
11

Policy Scenario Definitions
• Policy Scenario 1 (On-the-books & funded under current revenue
projections and outlook)
• Currently Funded (documented in the 2020-2025 CTP, MPO plans)
• Extension of current funding projection beyond 2025 for CTP
• Projects/Plans/Initiatives funded and operational by 2030 from the MPO LRTPs
• Policy Scenario 2 (Unfunded Expanded, Emerging, and Innovative
Market-based Strategies)
• Organized into bundles of similar strategies
• Estimated reductions and costs in ranges based on level of uncertainty
• All require additional funding from new / replacement revenue sources (TBD)
12

The MDOT Scenario ProcessA Careful and Evidence Driven Approach to 2030
Reference Case
• Current VMT Growth Trend to 2030
• Existing Federal GHG Emission Standards
• Electric Vehicle Market Share Consistent with TCI Reference Case Projections
Policy Scenario 1
• Funded and Committed Transportation Projects; Programs and Initiatives through 2030
• Renewable Fuel Standard and Land-Use Efficiency Assumptions
Policy Scenario 2
• Mix of Expanded and Accelerated Traditional and Emerging strategies along with Innovative and Market-based Transportation Strategies
• Organized as Bundles broadly covering Technology, Freight; Transit and TDM Categories
Fully Funded for Implementation by 2030
Unfunded Strategies for Implementation by 2030
13

Policy Scenario 1 Update
2018 Policy Scenario 1 2020 Policy Scenario 1
Pre-2017 MPO Plans & Programs (1.4% VMT growth rate) 2018/2019 MPO Plans & Programs (0.6% VMT growth rate)
Renewable Fuel Standard (2% CO2 reduction from gasoline) Renewable Fuel Standard (2% CO2 reduction from gasoline)
On-Road Technology (CHART, Traveler Information)On-Road Technology (CHART, Traveler Information, plus new
SHA Transportation Systems Management and Operations Plan)
Freight and Freight Rail Programs (MDOT MTA rail and National Gateway)Freight and Freight Rail Programs (MTA rail projects, National Gateway,
plus fully funded Howard Street tunnel)
Public Transportation (New capacity, improved operations, Bus Rapid
Transit in MPO MTPs by 2030)
Public Transportation (New capacity, improved operations, Bus Rapid
Transit in MPO MTPs by 2030 – some minor project changes)
Public Transportation (fleet replacement / technology based on current
procurement approach)
Public Transportation (fleet replacement / technology based on current
procurement approach, some minor changes)
TDM (Commuter Choice MD, Commuter Connections ongoing and
expanding programs)
Transportation Demand Management (Commuter Choice MD, Commuter
Connections ongoing/expanding programs)
Pricing Initiatives (MDTA conversion to All Electronic Tolling) Pricing Initiatives (MDTA conversion to All Electronic Tolling)
Bicycle and Pedestrian Strategies (program continuation and expansion
through 2030)
Bicycle and Pedestrian Strategies (continuation of State, regional, and local
programs, some minor changes)
Land-Use and Location Efficiency (MDP assumptions) Land-Use and Location Efficiency (consistent with MDP assumptions)
Port of Baltimore Dray Track Replacements Fleet Replacements (Drayage Track Replacements, BWI Parking Shuttles,
MDOT Fleet Innovation Plan, etc..)BWI Airport parking shuttle bus replacements
14

Policy Scenario 1 Update
30.7228.84 28.62 28.05
24.3722.94
21.31
0
5
10
15
20
25
30
35
2006Baseline
2014Baseline
2017Baseline
2030 BAU 2030Standards
2030Standards
+ ZEV
2030 Plans/ Programs
Mar
ylan
d O
n-r
oad
mm
tCO
2e Estimate based on Reference
Case, with EVs, applied to 0.6% VMT growth rate
Need to add “off-model” estimates for program changes in prior slide
2018 Policy Scenario #1 result was 21.22 mmt CO2e
Likely to go below this estimate following complete analysis
15

Policy Scenario 2Unfunded Strategies Approach
Reorganized into bundles with a spectrum of strategies (and different
levels of uncertainty)
• Highway system operations and efficiency technologiesIncludes corridor operations and management and connected and
autonomous vehicles
• Freight mobility and commercial vehicle technologiesIncludes strategic capacity improvements, logistics pattern shifts, and commercial
vehicle technologies
• Multimodal (transit, bike/pedestrian, TDM, new mobility options)Includes full suite of multimodal strategies considered realistic for implementation by
2030 (assuming funding becomes available)
• Vehicle technology (non-commercial)Includes accelerated EV market share, electrified transit, cleaner fuels
16
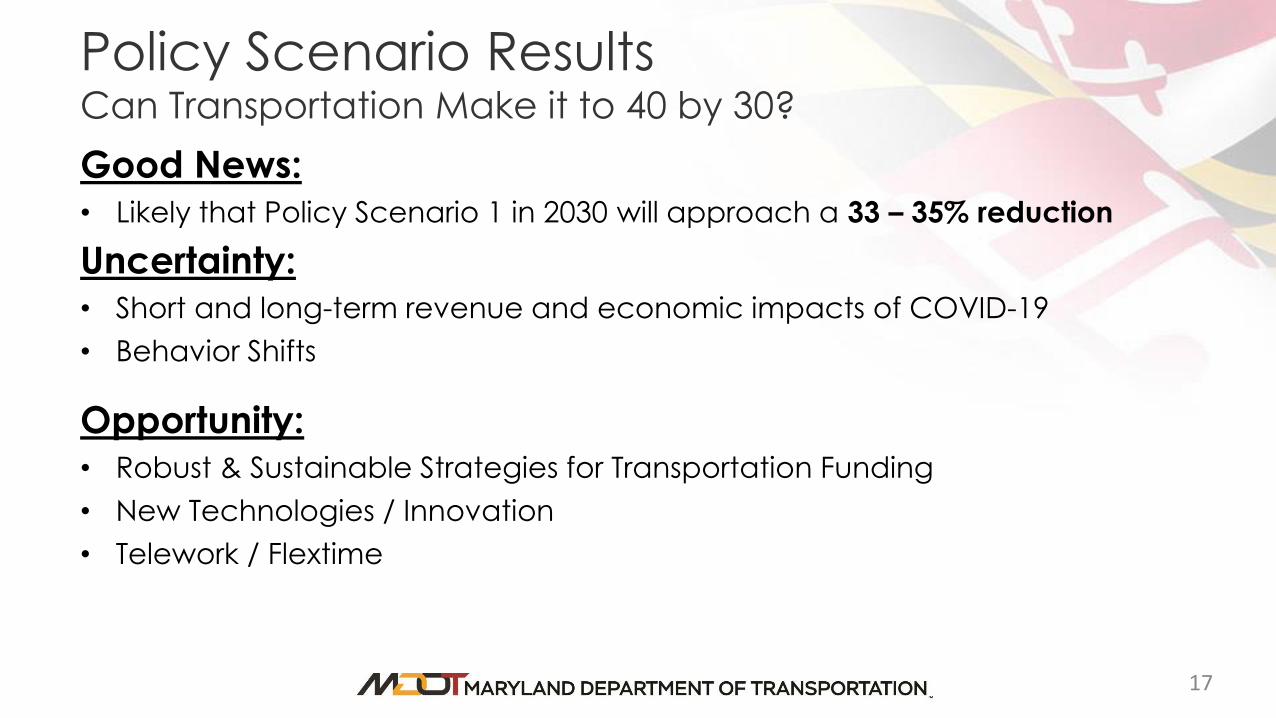
Policy Scenario ResultsCan Transportation Make it to 40 by 30?
Good News:
• Likely that Policy Scenario 1 in 2030 will approach a 33 – 35% reduction
Uncertainty:
• Short and long-term revenue and economic impacts of COVID-19
• Behavior Shifts
Opportunity:
• Robust & Sustainable Strategies for Transportation Funding
• New Technologies / Innovation
• Telework / Flextime
17

COVID-19 Perspectives
18
And Relevance to Current and Future GHG Emissions in Transportation
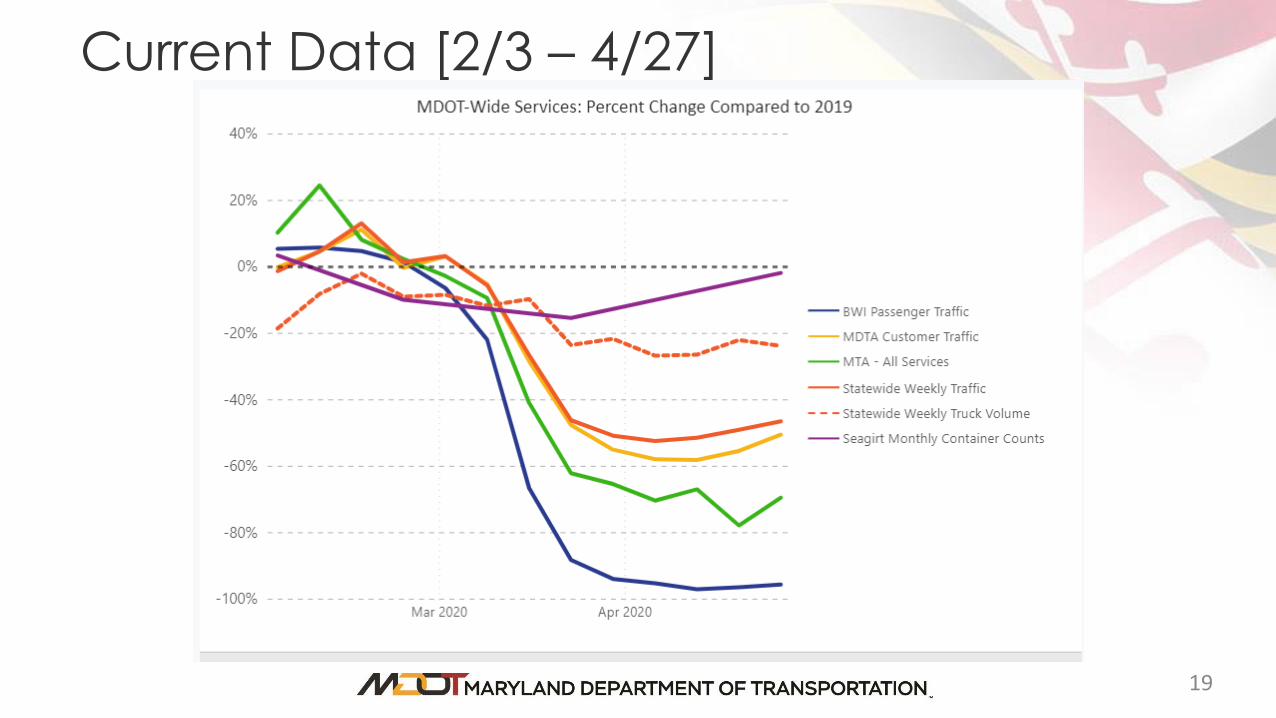
Current Data [2/3 – 4/27]
19

Evolving Impacts
Immediate
• VMT
• Transit Ridership
• Enplanements
• Fuel Tax and Titling
Revenues
• Cruise Ship Activity
Mid-Term (2020-2021)
• Revenue and
Transportation Spending
• Economic Uncertainty/
Recovery
• Transit System Adaption
• Expansion of TDM and
Telework
Longer-Term
• Future CTPs
• Long-range Plans
• Project Priorities
• Project/Urban
Design
20

AccomplishmentsInitiatives to date and upcoming efforts.
21
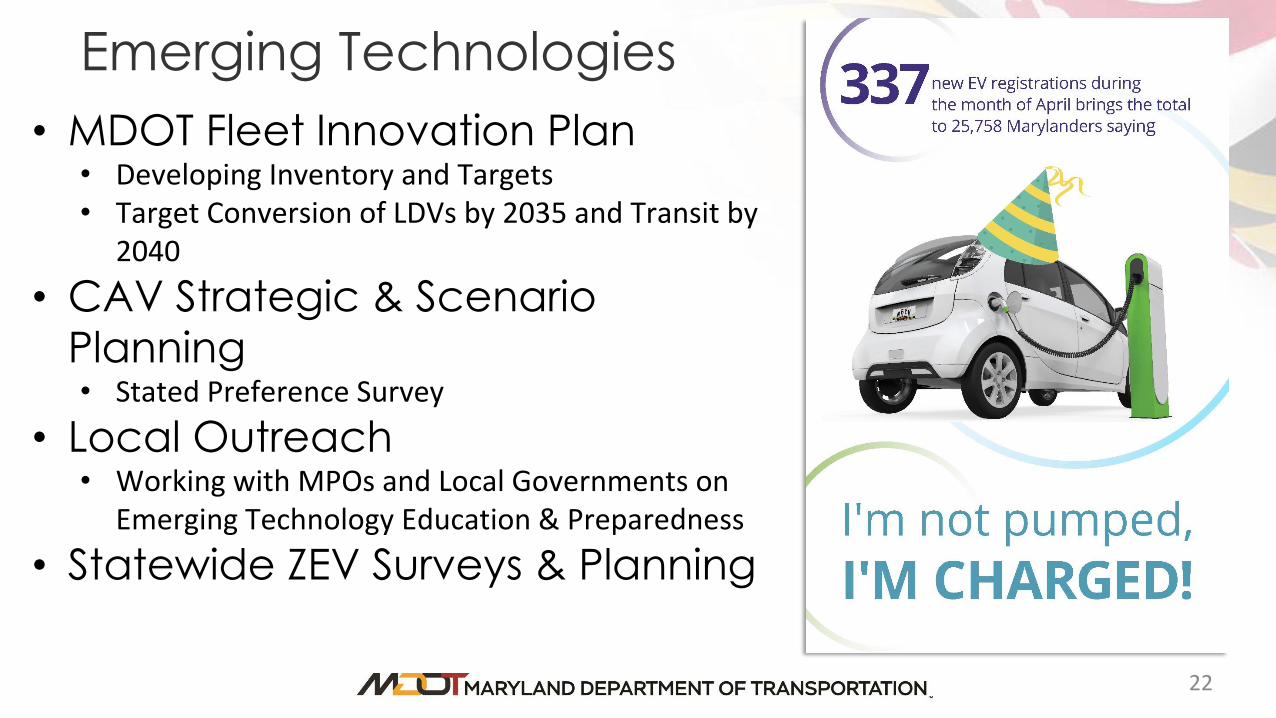
Emerging Technologies
• MDOT Fleet Innovation Plan• Developing Inventory and Targets• Target Conversion of LDVs by 2035 and Transit by
2040
• CAV Strategic & Scenario
Planning• Stated Preference Survey
• Local Outreach• Working with MPOs and Local Governments on
Emerging Technology Education & Preparedness
• Statewide ZEV Surveys & Planning
22

Travel Demand Management (TDM)
23

Next StepsThe 2020 Plan
24

2020 and Beyond
➢ 2019 GGRA Plan and MDOT Report Publication➢ Coordinate with MDE and Consultants on Reference & Policy Scenarios
➢ Develop a Better Understanding of Funding Needs & Impactshttps://fundingfinance.transportation.org/wp-
content/uploads/sites/16/2019/02/Matrix_of_Funding_Options.pdf
➢ Scenario Analyses
➢ Improve Communication & Outreach on MDOT and Maryland
Transportation Initiatives
➢ Track Progress through MDOT’s State Agency Report, Annual
Attainment Report, and MDOT Excellerator
25
26
ResourcesMDOT’s Response to COVID-19
http://www.mdot.maryland.gov/coronavirus
Maryland’s Zero Emission Electric Vehicle Infrastructure Councilhttp://www.mdot.maryland.gov/newMDOT/Planning/Electric_Vehicle/About_the_Council.html
Maryland EV [@MarylandEV]https://marylandev.org/
Commuter Choice MDhttp://www.mdot.maryland.gov/newMDOT/Commuter/Commuting
MDOT Office of Planning & Capital Programming Newsletterhttp://www.mdot.maryland.gov/newMDOT/Commuter/ccm/newsletter_webinar