Transportation Revolution October ‘17 - Amazon S3 · Transportation Revolution October ‘17...
13
Transportation Revolution October ‘17 ©2017, Green Street Advisors, LLC. Use of this report is subject to the Terms of Use listed at the end of the report.
Transcript of Transportation Revolution October ‘17 - Amazon S3 · Transportation Revolution October ‘17...
Transportation Revolution October ‘17
©2017, Green Street Advisors, LLC.Use of this report is subject to the Terms of Use listed at the end of the report.
Transportation Revolution October ‘17
©2017, Green Street Advisors, LLC.Use of this report is subject to the Terms of Use listed at the end of the report.
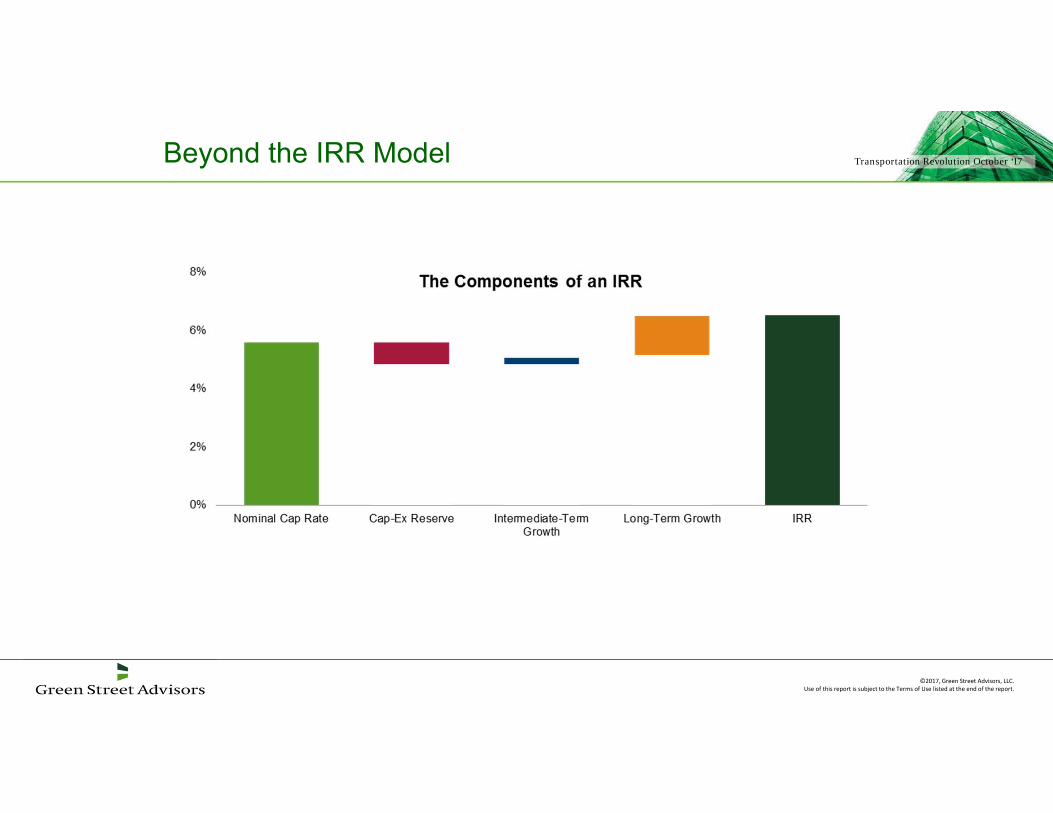
Beyond the IRR Model

Transportation Revolution October ‘17
©2017, Green Street Advisors, LLC.Use of this report is subject to the Terms of Use listed at the end of the report.
Beyond the IRR Model
Uncertainty in the distant future is
high. Great humility is in order.

Transportation Revolution October ‘17
©2017, Green Street Advisors, LLC.Use of this report is subject to the Terms of Use listed at the end of the report.
Ride-Hailing is Already Here
Transportation Revolution October ‘17
©2017, Green Street Advisors, LLC.Use of this report is subject to the Terms of Use listed at the end of the report.
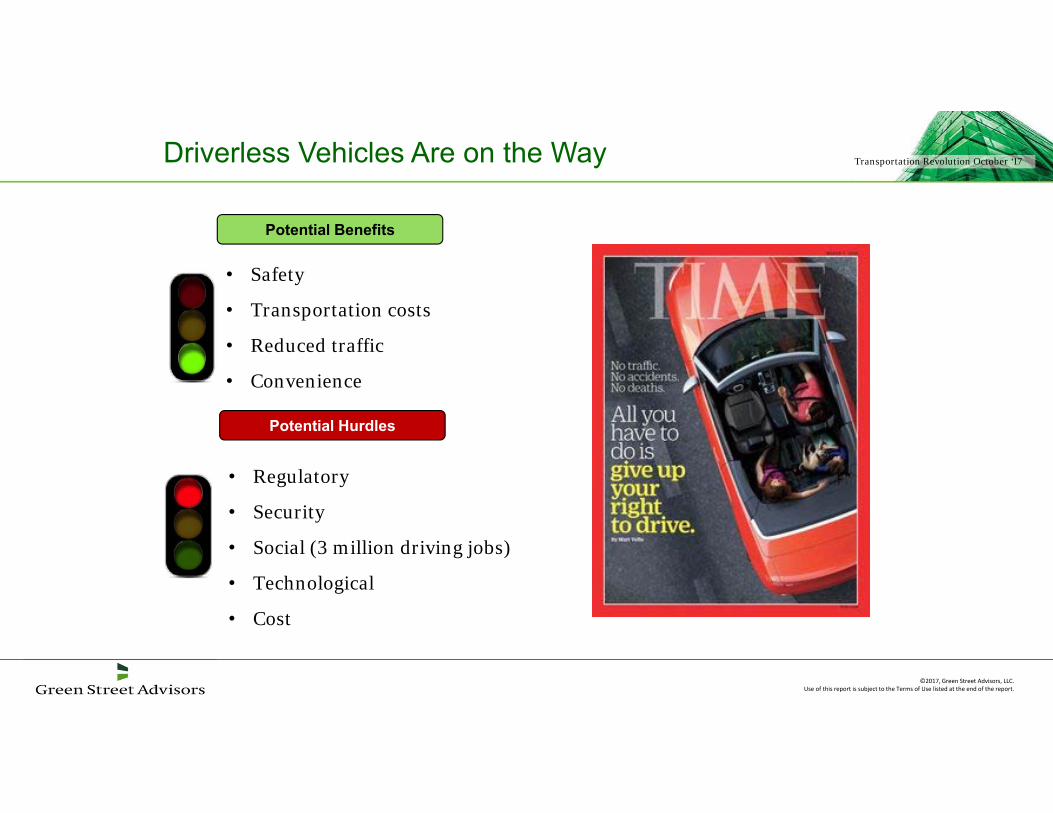
Driverless Vehicles Are on the Way
Potential Benefits
Potential Hurdles
• Regulatory
• Security
• Social (3 million driving jobs)
• Technological
• Cost
• Safety
• Transportation costs
• Reduced traffic
• Convenience

Transportation Revolution October ‘17
©2017, Green Street Advisors, LLC.Use of this report is subject to the Terms of Use listed at the end of the report.
The Outlook for Vehicle Car Ownership
$0.75
$0.59
$0.41
$0.15$0.00
$0.25
$0.50
$0.75
$1.00
Owned Vehicle:10,000 miles/year
Owned Vehicle:15,000 miles/year
Shared DriverlessVehicles
Shared DriverlessPurpose-Built
Vehicles
Estimated Cost Per Mile
Most Americans Drive Alone to WorkTransportation is the #2 Household Cost
Transportation Revolution October ‘17
©2017, Green Street Advisors, LLC.Use of this report is subject to the Terms of Use listed at the end of the report.
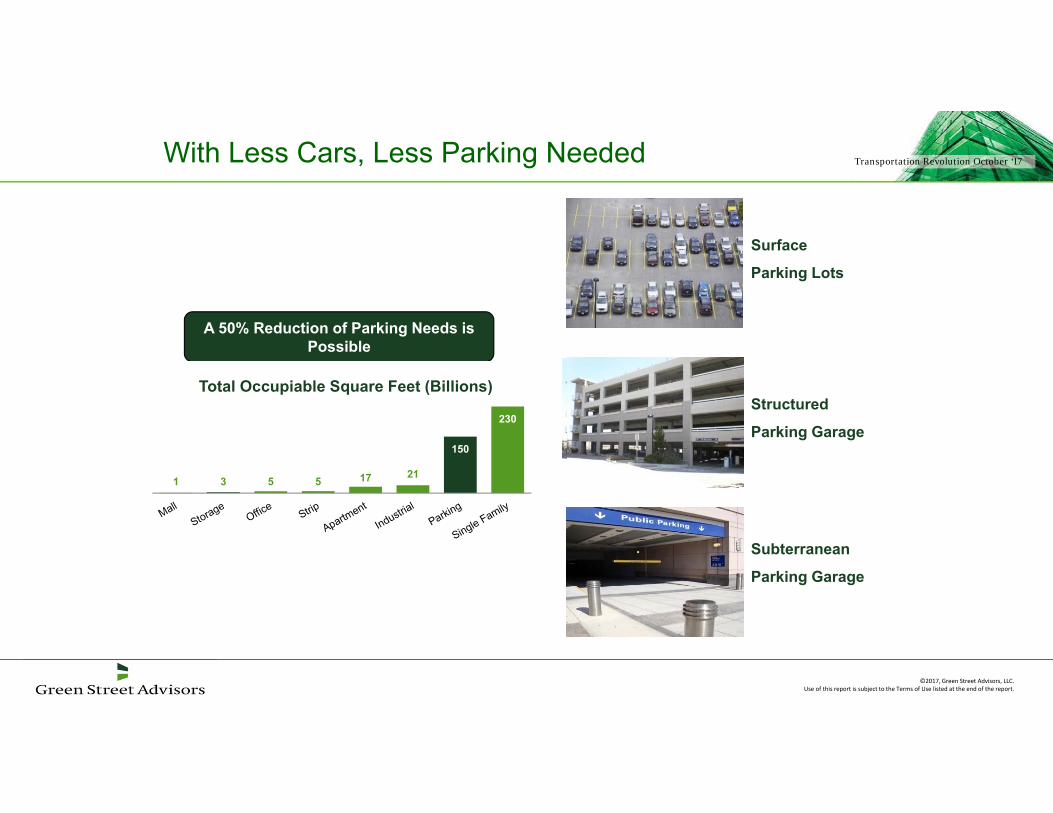
With Less Cars, Less Parking Needed
A 50% Reduction of Parking Needs is Possible
1 3 5 5 17 21
150
230
Total Occupiable Square Feet (Billions)
Surface
Parking Lots
Structured
Parking Garage
Subterranean
Parking Garage
Transportation Revolution October ‘17
©2017, Green Street Advisors, LLC.Use of this report is subject to the Terms of Use listed at the end of the report.
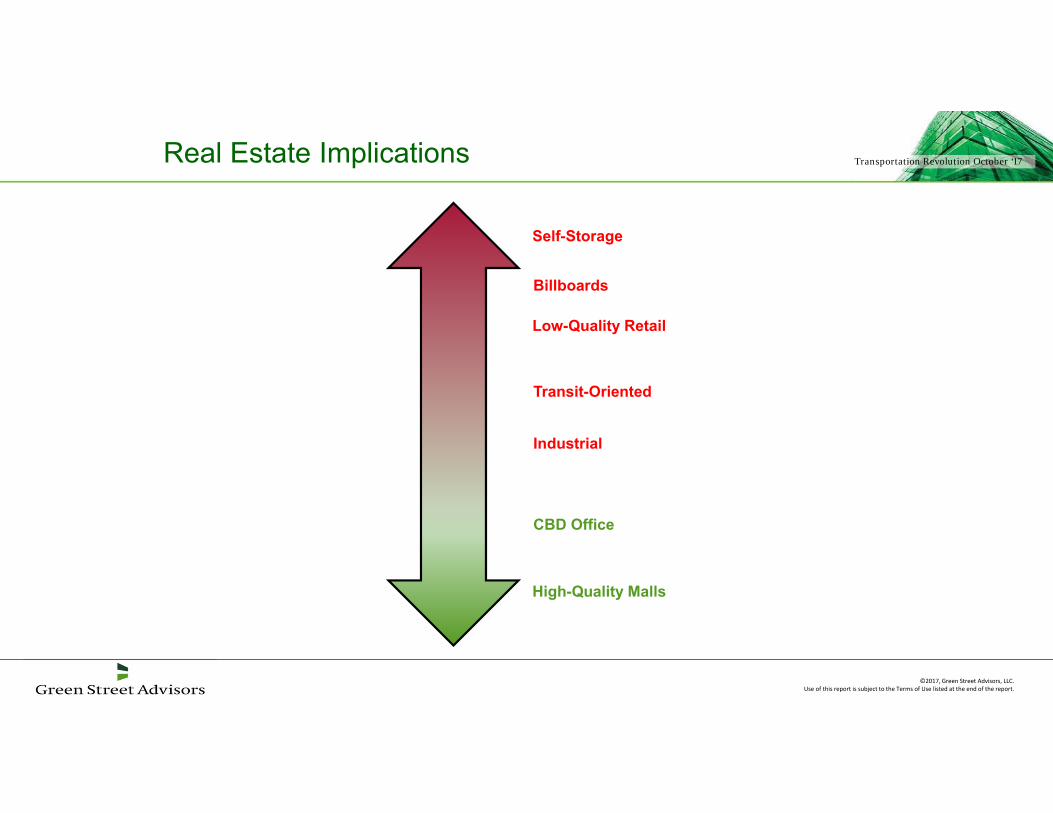
Real Estate Implications
Self-Storage
Billboards
Low-Quality Retail
Transit-Oriented
Industrial
CBD Office
High-Quality Malls

Transportation Revolution October ‘17
©2017, Green Street Advisors, LLC.Use of this report is subject to the Terms of Use listed at the end of the report.
Real Estate Implications: Top Malls
Transportation Revolution October ‘17
©2017, Green Street Advisors, LLC.Use of this report is subject to the Terms of Use listed at the end of the report.
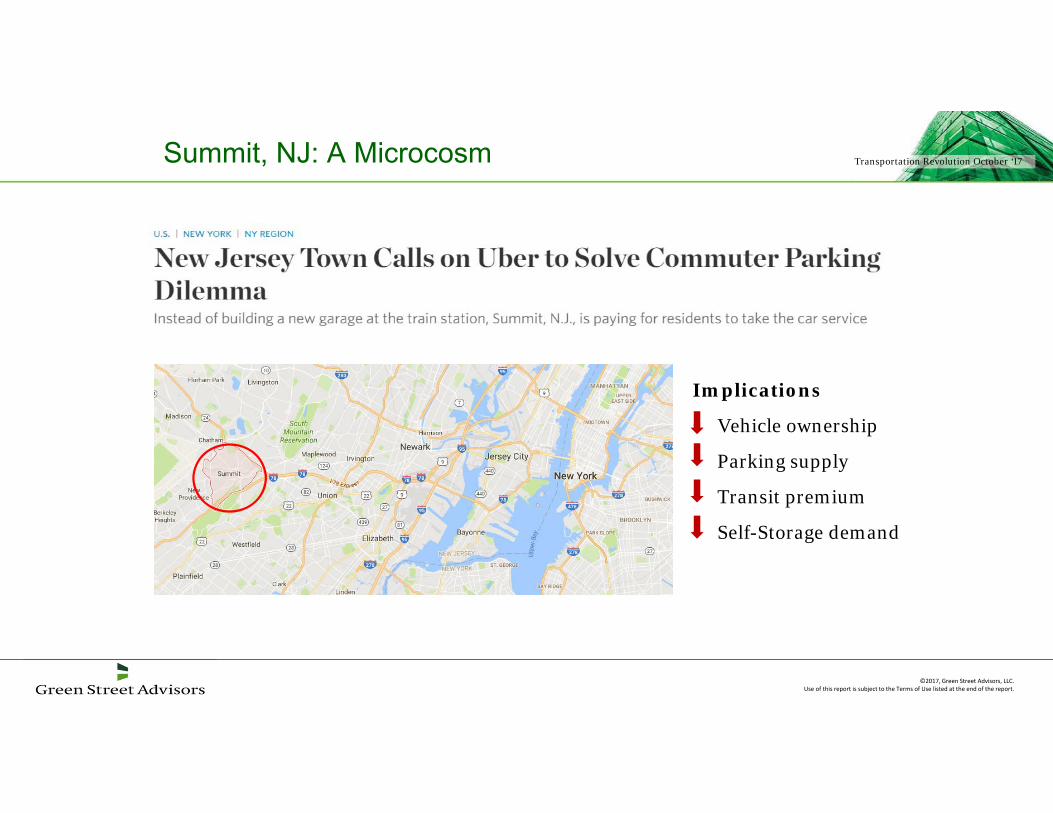
Summit, NJ: A Microcosm
Implications
• Vehicle ownership
• Parking supply
• Transit premium
• Self-Storage demand

Transportation Revolution October ‘17
©2017, Green Street Advisors, LLC.Use of this report is subject to the Terms of Use listed at the end of the report.
Source: Green Street Advisors
For a copy of this presentation, please contact:
Amanda [email protected]
(949) 640-8780
Transportation Revolution October ‘17
©2017, Green Street Advisors, LLC.Use of this report is subject to the Terms of Use listed at the end of the report.
Green Street’s Disclosure Information
Management of Conflicts of Interest: Conflicts of interest can seriously impinge the ability of analysts to do their job, and investors should demand unbiased research. In that spirit, Green Street adheres to the following policies regardingconflicts of interest:
• Green Street employees are prohibited from owning the shares of any company in our coverage universe.• Green Street employees do not serve as officers or directors of any of our subject companies.• Neither Green Street nor its employees/analysts receives any compensation from subject companies for inclusion in our research.• On occasion, Green Street analysts may be contacted by companies within the firm’s coverage universe regarding potential employment opportunities. Additional disclosure will be made when appropriate.• The research analysts who authored this presentation may hold shares of the non REIT companies mentioned in this research presentation. These are not companies in our coverage universe.
Please also have regard to the Affiliate Disclosures listed above when considering the extent to which you place reliance on this research presentation and any research recommendations made herein.
Green Street, at times, assists Eastdil Secured, a real estate brokerage and investment bank, when Eastdil Secured provides investment banking services to companies in Green Street’s coverage universe. Green Street is never part of the underwriting syndicate or the selling group, but Green Street may receive compensation from Eastdil Secured for consulting services that Green Street provides to Eastdil Secured related to Eastdil Secured's investment banking services. Green Street does not control, have ownership in, or make any business or investment decisions for, Eastdil Secured.
A number of companies covered by Green Street research reports pay an annual fee to receive Green Street’s research reports. Green Street may periodically solicit this business from the subject companies. In the aggregate, annual fees forGSA (US) and GSA (UK) research reports received from subject companies represent approximately 3% of each of GSA (US)’s and GSA (UK)'s respective total revenues.
Green Street publishes research reports covering issuers that may offer and sell securities in an initial or secondary offering. Broker-dealers involved with selling the issuer’s securities or their affiliates may pay compensation to GSA upon theirown initiative, or at the request of Green Street's clients in the form of “soft dollars,” for receiving research reports published by Green Street.
The information contained in this presentation is based on data obtained from sources we deem to be reliable; it is not guaranteed as to accuracy and does not purport to be complete. This presentation is produced solely for informationalpurposes and is not intended to be used as the primary basis of investment decisions. Because of individual client requirements, it is not, and it should not be construed as, advice designed to meet the particular investment needs of anyinvestor. This presentation is not an offer or the solicitation of an offer to sell or buy any security.
For Green Street’s advisory customers, this research presentation is for informational purposes only and the firm is not responsible for implementation. Nor can the firm be liable for suitability obligations.
GSA (US) generally prohibits research analysts from sending draft research reports to subject companies. However, it should be presumed that the analyst(s) who authored this presentation has(/have) had discussions with the subjectcompany to ensure factual accuracy prior to publication, and has(/have) had assistance from the company in conducting due diligence, including visits to company sites and meetings with company management and other representatives.
References to “Green Street” in Disclosures in this section and in the Other Important Information section apply to:
GSA (US) to the extent that this presentation has been disseminated in the USA; or GSA (UK) to the extent that this presentation has been disseminated in the EEA.
Green Street Advisors US is exempt from the requirement to hold an Australian financial services license under the Act in respect of the financial services; and is regulated by the SEC under US laws, which differ from Australian laws.
Green Street Advisors UK Ltd. is exempt from the requirement to hold an Australian financial services license under the Act in respect of the financial services; and is regulated by the FCA under UK laws, which differ from Australian laws.
Green Street reserves the right to update the disclosures and policies set out in this document at any time. We encourage a careful comparison of these disclosures and policies with those of other research providers, and welcome the opportunity to discuss them.
Affiliate Disclosures: Green Street does not directly engage in investment banking, underwriting or advisory work with any of the companies in our coverage universe.However, the following are potential conflicts regarding our affiliates that should be considered:
Green Street has an advisory & consulting practice servicing investors seeking to acquire interests in publicly-traded companies.Green Street may provide such valuation services to prospective acquirers of companies which are the subject(s) of Green Street’s research reports.
• An affiliate of Green Street is an investment manager implementing a real estate securities strategy focused on REITs. The portfolios managed by this affiliate contain securities of issuers covered by Green Street’s research department. The affiliate is located in separate offices, employs an investment strategy based on Green Street’s published research, and does not trade with Green Street’s affiliated trading desk, Green Street Trading (GST). However, the investment
management affiliate has engaged GST as a placement agent for an investment partnership it manages. The principals of Green Street Advisors, Green Street Investors and affiliates have invested in GSREF, L.P.
Transportation Revolution October ‘17
©2017, Green Street Advisors, LLC.Use of this report is subject to the Terms of Use listed at the end of the report.
Green Street’s Disclosure Information
Terms of Use
Protection of Proprietary Rights: To the extent that this presentation is issued by GSA (US), this material is the proprietary and confidential information of Green Street Advisors, LLC, and is protected by copyright. To the extent that this presentation is issued by GSA (UK), this material is the proprietary and confidential information of Green Street Advisors (U.K.) Limited, and is protected by copyright.
This presentation may be used solely for reference for internal business purposes. This presentation may not be reproduced, re-distributed, sold, lent, licensed or otherwise transferred without the prior consent of Green Street. All other rights with respect to this presentation are reserved by Green Street.
EEA Recipients: For use only by Professional Clients and Eligible Counterparties: GSA (UK) is authorized by the Financial Conduct Authority of the United Kingdom to issue this presentation to "Professional Clients" and "Eligible Counterparties" only and is not authorized to issue this presentation to "Retail Clients", as defined by the rules of the Financial Conduct Authority. This presentation is provided in the United Kingdom for the use of the addressees only and is intended for use only by a person or entity that qualifies as a "Professional Client" or an "Eligible Counterparty". Consequently, this presentation is intended for use only by persons having professional experience in matters relating to investments. This presentation is not intended for use by any other person. In particular, this presentation intended only for use by persons who have received written notice from GSA (UK) that he/she/it has been classified, for the purpose of receiving services from GSA (UK), as either a "Professional Client" or an "Eligible Counterparty". Any other person who receives this presentation should not act on the contents of this presentation.
Review of Recommendations:
• Unless otherwise indicated, Green Street reviews all investment recommendations on at least a monthly basis.• The research recommendation contained in this report was first released for distribution on the date identified on the cover of this report.
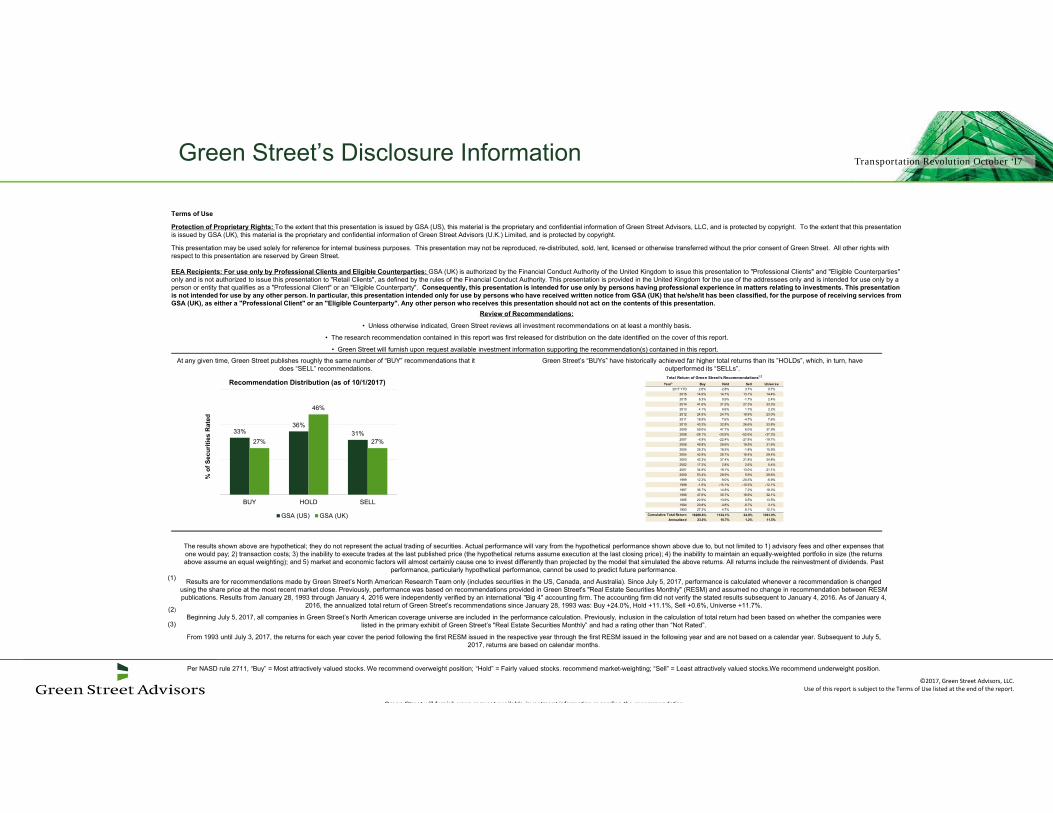
• Green Street will furnish upon request available investment information supporting the recommendation(s) contained in this report. At any given time, Green Street publishes roughly the same number of “BUY” recommendations that it
does “SELL” recommendations.Green Street’s “BUYs” have historically achieved far higher total returns than its ”HOLDs”, which, in turn, have
outperformed its “SELLs”.
(1)
(2)
(3)
The results shown above are hypothetical; they do not represent the actual trading of securities. Actual performance will vary from the hypothetical performance shown above due to, but not limited to 1) advisory fees and other expenses that one would pay; 2) transaction costs; 3) the inability to execute trades at the last published price (the hypothetical returns assume execution at the last closing price); 4) the inability to maintain an equally-weighted portfolio in size (the returns above assume an equal weighting); and 5) market and economic factors will almost certainly cause one to invest differently than projected by the model that simulated the above returns. All returns include the reinvestment of dividends. Past
performance, particularly hypothetical performance, cannot be used to predict future performance.
Results are for recommendations made by Green Street’s North American Research Team only (includes securities in the US, Canada, and Australia). Since July 5, 2017, performance is calculated whenever a recommendation is changed using the share price at the most recent market close. Previously, performance was based on recommendations provided in Green Street's "Real Estate Securities Monthly" (RESM) and assumed no change in recommendation between RESM publications. Results from January 28, 1993 through January 4, 2016 were independently verified by an international "Big 4" accounting firm. The accounting firm did not verify the stated results subsequent to January 4, 2016. As of January 4,
2016, the annualized total return of Green Street’s recommendations since January 28, 1993 was: Buy +24.0%, Hold +11.1%, Sell +0.6%, Universe +11.7%.
Beginning July 5, 2017, all companies in Green Street’s North American coverage universe are included in the performance calculation. Previously, inclusion in the calculation of total return had been based on whether the companies were listed in the primary exhibit of Green Street’s "Real Estate Securities Monthly” and had a rating other than “Not Rated”.
From 1993 until July 3, 2017, the returns for each year cover the period following the first RESM issued in the respective year through the first RESM issued in the following year and are not based on a calendar year. Subsequent to July 5, 2017, returns are based on calendar months.
Per NASD rule 2711, “Buy” = Most attractively valued stocks. We recommend overweight position; “Hold” = Fairly valued stocks. recommend market-weighting; “Sell” = Least attractively valued stocks.We recommend underweight position.
Green Street will furnish upon request available investment information regarding the recommendation
Total Return of Green Street's Recommendations1,2
Year3 Buy Hold Sell Universe2017 YTD 2.6% -2.8% 3.7% 0.7%
2016 14.9% 14.7% 13.1% 14.4%2015 8.3% 0.9% -1.7% 2.4%2014 41.6% 31.5% 27.3% 33.3%2013 4.1% 0.6% 1.7% 2.2%2012 24.5% 24.7% 18.9% 23.0%2011 18.9% 7.6% -4.7% 7.6%2010 43.3% 32.8% 26.6% 33.8%2009 59.0% 47.7% 6.0% 37.9%2008 -28.1% -30.9% -52.6% -37.3%2007 -6.9% -22.4% -27.8% -19.7%2006 45.8% 29.6% 19.5% 31.6%2005 26.3% 18.5% -1.8% 15.9%2004 42.8% 28.7% 16.4% 29.4%2003 43.3% 37.4% 21.8% 34.8%2002 17.3% 2.8% 2.6% 5.4%2001 34.9% 19.1% 13.0% 21.1%2000 53.4% 28.9% 5.9% 29.6%1999 12.3% -9.0% -20.5% -6.9%1998 -1.6% -15.1% -15.5% -12.1%1997 36.7% 14.8% 7.2% 18.3%1996 47.6% 30.7% 18.9% 32.1%1995 22.9% 13.9% 0.5% 13.5%1994 20.8% -0.8% -8.7% 3.1%1993 27.3% 4.7% 8.1% 12.1%
Cumulative Total Return 16288.8% 1134.1% 34.9% 1361.0%Annualized 23.0% 10.7% 1.2% 11.5%
33%36%
31%27%
46%
27%
BUY HOLD SELL
% o
f Sec
uriti
es R
ated
Recommendation Distribution (as of 10/1/2017)
GSA (US) GSA (UK)