
Transportation Research Record 1070 Characterizing...
12
30 Transportation Research Record 1070 Characterizing Premature Deformation in Asphalt Concrete Placed over Portland Cement Concrete Pavements SAMUEL H. CARPENTER and THOMAS J. FREEMAN ABSTRACT An analytical study of the problem of premature deformation in asphalt concrete overlays of concrete pavements is presentedi topics that have not been investi- gated previously are suggested for consideration. Premature deformation is con- sidered to be the development of failure level rutting after only 1 or 2 years of service. The study indicates that there are stress and strain fields in an overlay that . have not been considered in previous analysis procedures, which could indicate why premature rutting developing on Interstate pavements could be different when the original surface is concrete than when it is asphalt. The strain energy of distortion, or octahedral shear stress, was chosen from a study of failure theories as best representing the stress state relating to the onset of inelastic deformation under one load cycle rather than only the vertical stress as is usually used. Analysis indicates that different stress conditions can develop in the overlay when it is placed on a concrete surface compared with when it is placed on an asphalt surface. Interface bonding between the overlay and the original surface alters this stress state, which is very much closer to a failure condition than previously believed. The computer analysis indicates that current testing does not model the material behavior at a stress level or with boundary conditions comparable to those existing in the field. Material nonlinearity under field conditions, and the proximity of the existing stresses to a failure state for that material, may indicate why current proce- dures have not been able to accurately characterize a material's potential for rapid permanent deformation failure within the first 1 or 2 years. In recent years, the performance of asphalt concrete (AC) overlays on heavily trafficked Interstate con- crete pavements has not been as good as was expected. Reasons suggested for this include changes in the asphalt cements, changes in equipment for compaction and placement, changes in mixing equipment or proce- dures, and changes in traffic. Whatever the rcaoon, an increase has been noted in the premature deforma- tion of these AC overlays. Premature deformation here refers to the failure of an overlay within 1 or 2 years after it has been placed, and not the gradual steady-state appearance of rutting under long-term traffic. The problem produced by changes in asphalt cement or equipment and procedures is beyond the scope of this paper. The problems of altered traffic condi- tions and mix design considerations can be investi- gated in the laboratory or with computer simulation. Presented in this paper is the initial phase of a study designed to describe developments in a mixture placed over a concrete pavement that could be used to account for any noted increase in the occurrence of premature deformation. CHARACTERIZATION OF PREMATURE DEFORMATION To accurately characterize the development of any distress, the stress or strain conditions causing S.H. Carpenter, University of Illinois at Urbana- Champaign, Urbana, Ill. 61801. T.J. Freeman, ERES Consultants, Inc., Champaign, Ill. 61820. the distress to occur must be accurately determined. The stress or strain must also relate directly to the development of the distress. As an extreme exam- ple, the radial strain in the asphalt layer should not be used to predict the rutting potential in the subgrade even though a relationship may be developed. The respon&e parameter& indicate what i& happenin<J in the material being investigated. Current testing for permanent deformation typi- cally uses the tr iaxial unconfined compressive test either with repetitive or creep loading. The one response parameter selected to model the pavement in the laboratory is typically vertical stress. For example, VESYS uses a 20 psi vertical stress, and creep testing usually starts with a similar value. These stresses relate directly to deformation resis- tance in a material, but the question is whether they relate to the failure mechanism that actually develops in the pavement when premature deformation is occurring. Using compressive stress may not ac- curately indicate the failure taking place because it may have only a proportional and/or nonlinear relationship with the mechanism occurring in the overlay, not a direct unique relationship. At low stress levels, the compressive stress is proportional to the deformation and presents the proper relationship for gradual accumulation of rutting over a prolonged time. This test has not provided an accurate relationship with any mode of deformation that develops rapidly, which may be why some computer models have a difficult time modeling the rapid failure of a pavement. This inadequacy is not due to an inadequacy in the theoretical modeling
Transcript of Transportation Research Record 1070 Characterizing...
30 Transportation Research Record 1070
Characterizing Premature Deformation in Asphalt Concrete Placed over Portland Cement Concrete Pavements SAMUEL H. CARPENTER and THOMAS J. FREEMAN
ABSTRACT
An analytical study of the problem of premature deformation in asphalt concrete overlays of concrete pavements is presentedi topics that have not been investigated previously are suggested for consideration. Premature deformation is considered to be the development of failure level rutting after only 1 or 2 years of service. The study indicates that there are stress and strain fields in an overlay that . have not been considered in previous analysis procedures, which could indicate why premature rutting developing on Interstate pavements could be different when the original surface is concrete than when it is asphalt. The strain energy of distortion, or octahedral shear stress, was chosen from a study of failure theories as best representing the stress state relating to the onset of inelastic deformation under one load cycle rather than only the vertical stress as is usually used. Analysis indicates that different stress conditions can develop in the overlay when it is placed on a concrete surface compared with when it is placed on an asphalt surface. Interface bonding between the overlay and the original surface alters this stress state, which is very much closer to a failure condition than previously believed. The computer analysis indicates that current testing does not model the material behavior at a stress level or with boundary conditions comparable to those existing in the field. Material nonlinearity under field conditions, and the proximity of the existing stresses to a failure state for that material, may indicate why current procedures have not been able to accurately characterize a material's potential for rapid permanent deformation failure within the first 1 or 2 years.
In recent years, the performance of asphalt concrete (AC) overlays on heavily trafficked Interstate concrete pavements has not been as good as was expected. Reasons suggested for this include changes in the asphalt cements, changes in equipment for compaction and placement, changes in mixing equipment or procedures, and changes in traffic. Whatever the rcaoon, an increase has been noted in the premature deformation of these AC overlays. Premature deformation here refers to the failure of an overlay within 1 or 2 years after it has been placed, and not the gradual steady-state appearance of rutting under long-term traffic.
The problem produced by changes in asphalt cement or equipment and procedures is beyond the scope of this paper. The problems of altered traffic conditions and mix design considerations can be investigated in the laboratory or with computer simulation. Presented in this paper is the initial phase of a study designed to describe developments in a mixture placed over a concrete pavement that could be used to account for any noted increase in the occurrence of premature deformation.
CHARACTERIZATION OF PREMATURE DEFORMATION
To accurately characterize the development of any distress, the stress or strain conditions causing
S.H. Carpenter, University of Illinois at UrbanaChampaign, Urbana, Ill. 61801. T.J. Freeman, ERES Consultants, Inc., Champaign, Ill. 61820.
the distress to occur must be accurately determined. The stress or strain must also relate directly to the development of the distress. As an extreme example, the radial strain in the asphalt layer should not be used to predict the rutting potential in the subgrade even though a relationship may be developed. The respon&e parameter& indicate what i& happenin<J in the material being investigated.
Current testing for permanent deformation typically uses the tr iaxial unconfined compressive test either with repetitive or creep loading. The one response parameter selected to model the pavement in the laboratory is typically vertical stress. For example, VESYS uses a 20 psi vertical stress, and creep testing usually starts with a similar value. These stresses relate directly to deformation resistance in a material, but the question is whether they relate to the failure mechanism that actually develops in the pavement when premature deformation is occurring. Using compressive stress may not accurately indicate the failure taking place because it may have only a proportional and/or nonlinear relationship with the mechanism occurring in the overlay, not a direct unique relationship.
At low stress levels, the compressive stress is proportional to the deformation and presents the proper relationship for gradual accumulation of rutting over a prolonged time. This test has not provided an accurate relationship with any mode of deformation that develops rapidly, which may be why some computer models have a difficult time modeling the rapid failure of a pavement. This inadequacy is not due to an inadequacy in the theoretical modeling
Carpenter and Freeman
process, but rather through the use of a parameter that does not completely model the existing stress or strain state in the overlay to describe the behavior of the pavement.
The development of premature deformation being studied in this paper is better related to failure under a one-time load than it is to the gradual accumulation of strain under repeated loadings because of the rapidity with which it occurs. Although failure theory is not exactly applicable to this si tuation, rapid failure clearly indicates that the stress-strain condition in the asphalt layer could be closer to a failure value than previously believed, depending on pavement type, conditions, and material quality. Thus, the principles of failure mechanics may be more applicable to bituminous mixes placed as an overlay than previously believed. Although failure mechanics is more appropriate in studying incipient failure, the rapid shear failure being investigated here is more similar to incipient failure than to the accumulation of rutting in a normal pavement.
FAILURE THEORY
Failure theories involve the application of mechanics to predict the stress-strain condition in a sample at failure. If the stress-strain condition of an in-place material exceeds the failure stress-strain value predicted from the theory, the material will fail under that one loading.
In examining failure related to ductile behavior, the theories of octahedral shear stress or maximum strain energy of distortion stand out as most applicable to the situation in which failure is predominantly ductile and not brittle fracture (1).
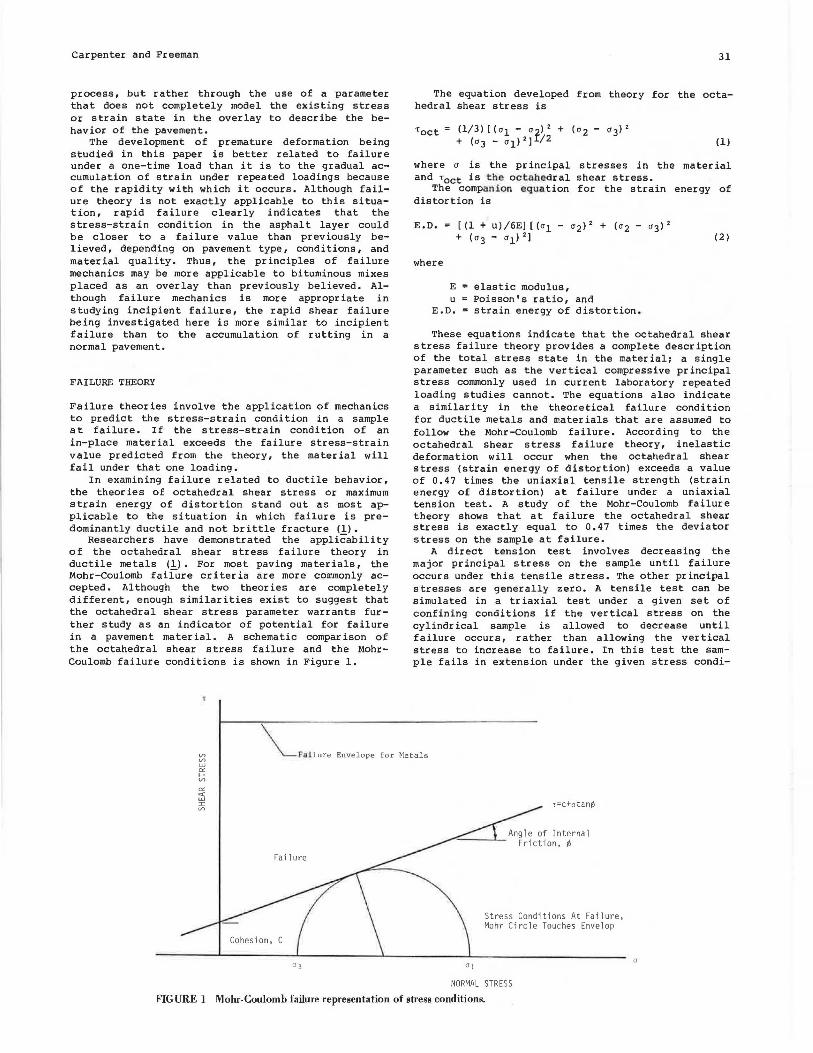
Researchers have demonstrated the applicability of the octahedral shear stress failure theory in ductile metals (1). For most paving materials, the Mohr-Coulomb failure er i ter ia are more commonly accepted. Although the two theories are completely different, enough similarities exist to suggest that the octahedral shear stress parameter warrants further study as an indicator of potential for failure in a pavement material. A schematic comparison of the octahedral shear stress failure and the MohrCoulomb failure conditions is shown in Figure 1.
T
31
The equation developed from theory for the octahedral shear stress is
(1)
where a is the principal stresses in the material and Toct is the octahedral shear stress.
The companion equation for the strain energy of distortion is
E.D.
where
[(l + u)/6E] [(a1 - a2) 2 + (cr2 - a3) 2
+ ('13 - rJ1l'l
E elastic modulus, u =Poisson's ratio, and
E.D. =strain energy of distortion.
(2)
These equations indicate that the octahedral shear stress failure theory provides a complete description of the total stress state in the material; a single parameter such as the vertical compressive principal stress commonly used in current laboratory repeated loading studies cannot. The equations also indicate a similarity in the theoretical failure condition for ductile metals and materials that are assumed to follow the Mohr-Coulomb failure. According to the octahedral shear stress failure theory, inelastic deformation will occur when the octahedral shear stress (strain energy of distortion) exceeds a value of 0.47 times the uniaxial tensile strength (strain energy of distortion) at failure under a uniaxial tension test. A study of the Mohr-Coulomb failure theory shows that at failure the octahedral shear stress is exactly equal to 0.47 times the deviator stress on the sample at failure.
A direct tension test involves decreasing the major principal stress on the sample until failure occurs under this tensile stress. The other principal stresses are generally zero. A tensile test can be simulated in a tr iaxial test under a given set of confining conditions if the vertical stress on the cylindrical sample is allowed to decrease until failure occurs, rather than allowing the vertical stress to increase to failure. In this test the sample fails in extension under the given stress condi-
Vl Vl
\_l'nllure Envelope for Metals
"' "" ..... Vl
"' ct
"' ::c Vl
a 3
T=c+otan¢
Stress Conditions At Failure, Mohr Circle Touches Envelop
NORMAL STRESS
FIGURE I Mohr-Coulomb failure representation of stress conditions.
32
tions, and the deviator stress is equal to a quasitensile strength of the sample under the given stress conditions. Thus, a similarity of failure conditions exists between the two theories even though they are not the same. More important, the octahedral shear stress or strain energy of distortion theory provides a single numerical parameter that describes the total stress state in the material that accurately relates to the onset of inelastic de f ormation, or yield, in the material. I·t is not stated in this theory that permanent deformation cannot occur until the stress level exceeds failure.
The hypothesis for the remainder of this paper is that the octahedral shear stress provides a unique numerical indicator that allows the engineer to examine how close to failure an AC mixture may be after it is placed. Further, it allows the mixture quality to be examined and included in the analysis through a description of the failure envelope. If the Mohr failure envelope can be defined for a bituminous mixture and the stress condition in that material when placed on a pavement can be accurately predicted, then a comparison can be made between the stress in the material produced by a wheel loading and the stress that will cause failure under one load. Although it is not expected that failure under one wheel load is likely to occur, the proximity of the stress state in the pavement to the stress state defined by the failure envelope can provide an indication of how close to failure the material in the pavement may be and the potential for premature deformation to develop. If the stresses in the existing overlay sections placed on portland cement concrete (PCC) pavements today show excessively high octahedral shear stresses compared with similar installations in flexible pavements, a rationale exists for expecting more rapid deformation in the overlay sections on concrete pavements.
COMPARISON OF OVERLAYS
The initial phase of this investigation was set up to determine if a significant difference could be found between the octahedral shear stresses in an overlay of a rigid pavement and those in an overlay of a flexible pavement. The two standard sections
EAC 100,000 psi Variable
EPCC 4,000,000 psi t = 9"
EBASE 40,000
ESUBGRADE 5,000
EAC 100,000 psi Variable
EAC 400,000 psi 911
40,000 9"
ESUBGRADE = 5• OOO
Transportation Research Record 1070
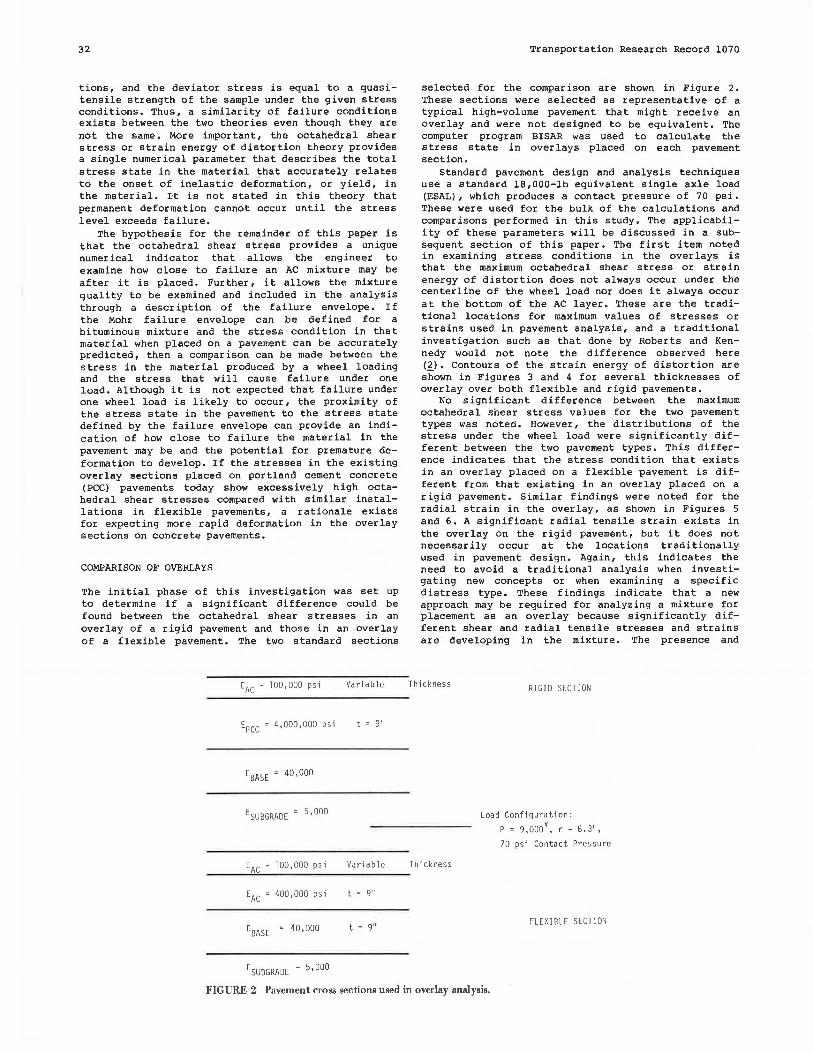
selected for the comparison are shown in Figure 2. These sections were selected as representative of a typ1cal high-volume pavement that might receive an overlay and were not designed to be equivalent. The computer program BISAR was used to calculate the stress state in overlays placed on each pavement section.
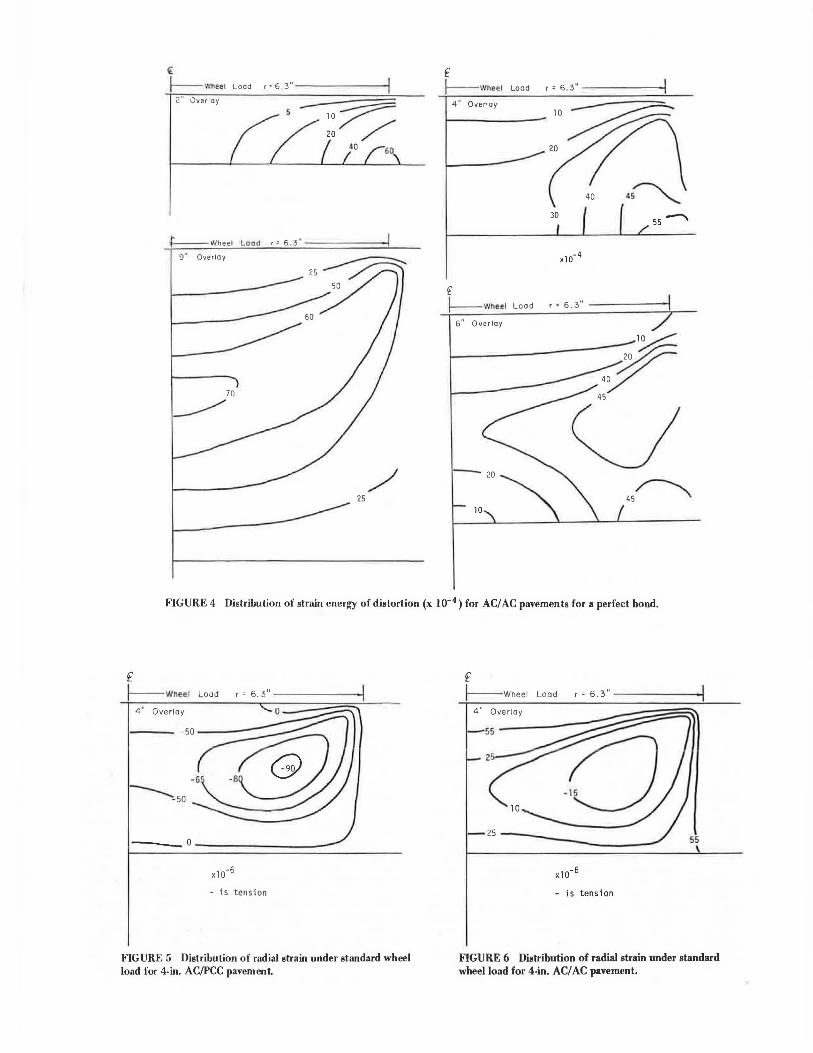
Standard pavement design and analysis techniques use a standard 18,000-lb equivalent single axle load (ESAL), which produces a contact pressure of 70 psi. These were used for the bulk of the calculations and comparisons performed in this study. The applicability of these parameters will be discussed in a subsequent section of this paper. The first item noted in examining stress conditions in the over lays is that the maximum octahedral shear stress or strain energy of distortion does not always occur under the centerline of the wheel load nor does it always occur at the bottom of the AC layer. These are the traditional locations for maximum values of stresses or strains used in pavement analysis, and a traditional investigation such as that done by Roberts and Kennedy would not note the difference observed here (~).Contours of the strain energy of distortion are shown in Figures 3 and 4 for several thicknesses of overlay over both flexible and rigid pavements.
No significant difference between the maximum octahedral shear stress values for the two pavement types was noted. However, the distributions of the stress under the wheel load were significantly different between the two pavement types. This difference indicates that the stress condition that exists in an overlay placed on a flexible pavement is different from that existing in an overlay placed on a rigid pavement. Similar findings were noted for the radial strain in the overlay, as shown in Figures 5 and 6. A significant radial tensile strain exists in the overlay on the rigid pavement, but it does not necessarily occur at the locations traditionally used in pavement design. Again, this indicates the need to avoid a traditional analysis when investigating new concepts or when examining a specific distress type. These findings indicate that a new approach may be required for analyzing a mixture for placement as an overlay because significantly different shear and radial tensile stresses and strains are developing in the mixture. The presence and
Thickness
Thickness
RIGID SECTION
Load Conf1gurat1on:
p = 9,ooo•, r = 6.3",
70 psi Contact Pressure
FLEXIBLE SECTION
FIGURE 2 Pavement cross sections used in overlay analysis.

Carpenter and Freeman 33
It f ~Wheel Load r ~ 6 . 3"----------; I---- '/hee l Loa d
z- Over~
5 30
4" Ove rl ay
~Whee l Load « 6 . 3"
9" Overlay
\jJhee l Load r = 6.311 - --- ----l
6 1' Overlay
(.0
FIGURE 3 Distribution of strain energy of distortion (x io-4 ) for AC/PCC pavements for a perfect bond condition.
magnitude of these stresses may also indicate the need for different mix design considerations.
The octahedral shear stress varies considerably with the thickness of the overlay, as shown previously. As the overlay becomes thicker, the maximum value increases and moves under the centerline of the wheel load at the middepth portion of the overlay. Thus, if the bottom of the overlay was examined, only low stress levels would be reported even though a problem of shearing in the middle of the mixture could be developing.
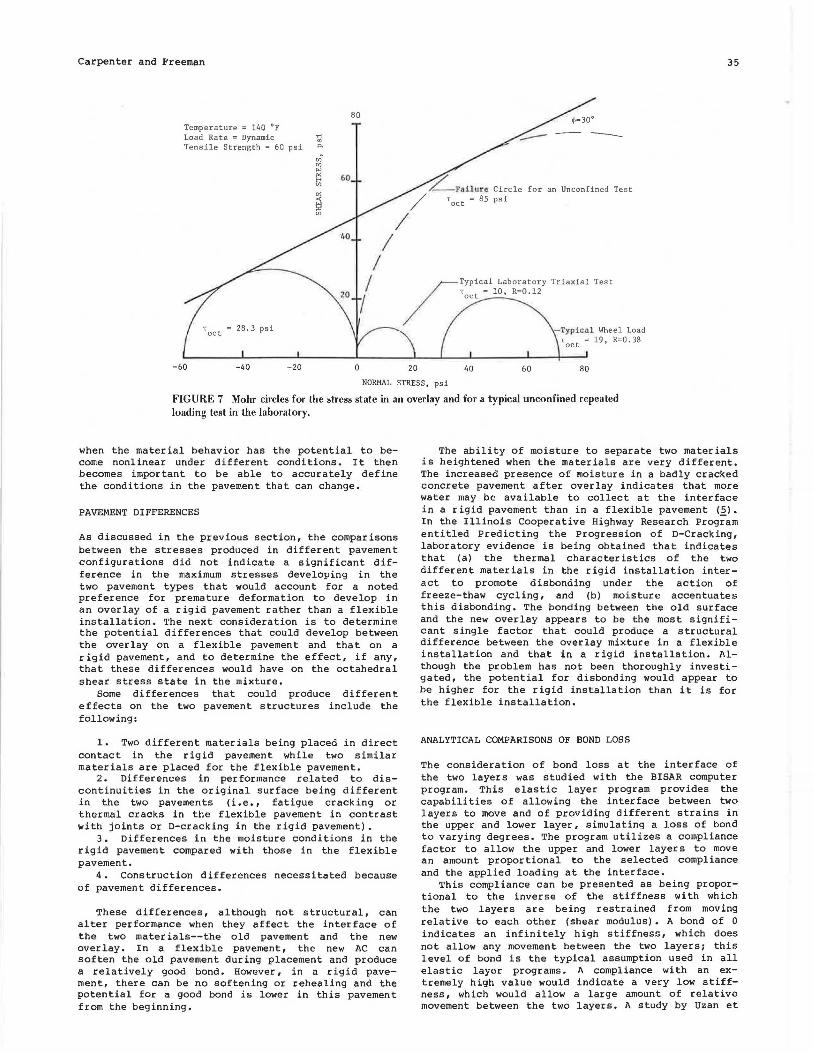
Figure 7 shows a failure envelope developed by using an estimated angle of internal friction and a measured tensile strength, and as such can be considered as representing a potential material quality level. The stress condition produced by a standard wheel is shown and the stress level usually used in laboratory repeated load triaxial testing is also shown. At this temperature and loading rate, an unconfined sample would fail with an applied octahedral shear stress of 85 psi. The octahedral shear stress induced by the loadings is shown with each Mohr's circle. These values have been used to calculate the ratio of actual stress to failure stress, R. These ratios clearly indicate that the standard wheel load is three times closer to failure than the stress
usually used to characterize permanent deformation in the laboratory.
Because the failure envelope may change with different boundary conditions such as temperature and rate of load (~), these ratios are only relative indicators and their magnitude can change. The point is that failure in the field under traffic will be significantly different from that predicted in the laboratory. This point was evident in the 1974 study by Morris et al., which examined permanent deformation under stress conditions varying from compression to tension (,!) • The unifying factor they did not develop was the octahedral shear stress, which unifies all the stress conditions.
To evaluate the impact that differences in stress state have on performance requires data indicating how the behavior of a mixture changes as the stress state approaches failure. It must be demonstrated whether current laboratory testing produces the same performance that develops in the field, or whether laboratory testing should be changed to better account for the conditions developing in the field. Material behavior assumed to be linear at low stress levels may be decidedly nonlinear as the stress level increases. The magnitude of the in situ stresses relative to the failure envelope becomes crucial
{
~'l/neei Lood r•6.3"--- ---- --l
2" Overlay
- :-;::::::::= 10 / /
20 / 40 60
-t-------wheel Lood r • 6 ,3"
9 " Overlay
25~
25
f ~Wllee.I Load r • 6 . 3" --------!
4 " Overlay
30
€ ~•/heel Load r • 6.3" -------t
6" Overlay
~ .:;r 45
45~ 10
FIGURE 4 Distribution of strain energy of distortion (x 10-4 ) for AC/AC pavements for a perfect bond.
f wneel
4" Overlay
____ o __________ _
- is tension
FIGURE 5 Distribution of radial strain under standard wheel load for 4-in. AC/PCC pavement.
f I-wheel Load r • 6.3" -------~
4" Overlay
- 25 ----- 55
- is tension
FIGURE 6 Distribution of radial strain under standard wheel load for 4-in. AC/ AC pavement.
Carpenter and Freeman
Temperature = 140 °F Load Rate = Dynamic Tensile Strength = 60 psi
80
60
35
"2_ Pailure Circle for an Unconfined Test / Toct = 85 psi
/ I
I 20 I
I 28. 3 psi
-60 -40 - 20 0
~Typical Laboratory Triaxial Test
~ ;' Toct = 10, R=0.12
20 40 60
Typic:nl Wheel Load 'oct = 19, R=0.38
80
NORMAL STRESS, ps i
FIGURE 7 Mohr circles for the stress state in an overlay and for a typical unconfined repeated loading test in the laboratory.
when the material behavior has the potential to become nonlinear under different conditions. It then becomes important to be able to accurately define the conditions in the pavement that can change.
PAVEMENT DIFFERENCES
As discussed in the previous section, the comparisons between the stresses produced in different pavement configurations did not indicate a significant difference in the maximum stresses developing in the two pavement types that would account for a noted preference for premature deformation to develop in an overlay of a rigid pavement rather than a flexible installation. The next consideration is to determine the potential differences that could develop between the overlay on a flexible pavement and that on a rigid pavement, and to determine the effect, if any, that these differences would have on the octahedral shear stress state in the mixture.
Some differences that could produce different effects on the two pavement structures include the following:
1. Two different materials being placed in direct contact in the rigid pavement while two similar materials are placed for the flexible pavement.
2. Differences in performance related to discontinuities in the original surface being different in the two pavements (i.e., fatigue cracking or thermal cracks in the flexible pavement in contrast with joints or D-cracking in the rigid pavement).
3. Differences in the moisture conditions in the rigid pavement compared with those in the flexible pavement.
4. Construction differences necessitated because of pavement differences.
These differences, although not structural, can alter performance when they affect the interface of the two materials--the old pavement and the new overlay. In a flexible pavement, the new AC can soften the old pavement during placement and produce a relatively good bond. However, in a rigid pavement, there can be no softening or rehealing and the potential for a good bond is lower in this pavement from the beginning.
The ability of moisture to separate two materials is heightened when the materials are very different. The increased presence of moisture in a badly cracked concrete pavement after overlay indicates that more water may be available to collect at the interface in a rigid pavement than in a flexible pavement (5). In the Illinois Cooperative Highway Research Prog~am entitled Predicting the Progression of n-Cracking, laboratory evidence is being obtained that indicates that (a) the thermal characteristics of the two different materials in the rigid installation interact to promote disbonding under the action of freeze-thaw cycling, and (b) moisture accentuates this disbonding. The bonding between the old surface and the new overlay appears to be the most significant single factor that could produce a structural difference between the overlay mixture in a flexible installation and that in a rigid installation. Although the problem has not been thoroughly investigated, the potential for disbonding would appear to be higher for the rigid installation than it is for the flexible installation.
ANALYTICAL COMPARISONS OF BOND LOSS
The consideration of bond loss at the interface of the two layers was studied with the BISAR computer program. This elastic layer program provides the capabilities of allowing the interface between two layers to move and of providing different strains in the upper and lower layer, simulating a loss of bond to varying degrees. The program utilizes a compliance factor to allow the upper and lower layers to move an amount proportional to the selected compliance and the applied loading at the interface.
This compliance can be presented as being proportional to the inverse of the stiffness with which the two layers are being restrained from moving relative to each other (shear modulus). A bond of O indicates an infinitely high stiffness, which does not allow any movement between the two layers; this level of bond is the typical assumption used in all elastic layer programs. A compliance with an extremely high value would indicate a very low stiffness, which would allow a large amount of relative movement between the two layers. A study by Uzan et
36
al. on flexible pavements defined some limiting values typical of pavement materials (6). The values used in that study are presented in -the following table.
Compliance 0 2 20 10,000
Bond Condition Perfect bonding 25% loss of bond 75% loss of bond 95% loss of bond
The same pavement configurations used in calculating the octahedral shear stress and strain energy of distortion shown previously were analyzed with the BI SAR program applying the different bond factors at the interface. As expected, the octahedral shear stress increased dramatically as the bonding decreased, and the position of the maximum octahedral shear stress also changed considerably.
Position of Maximum Octahedral Shear Str e£s
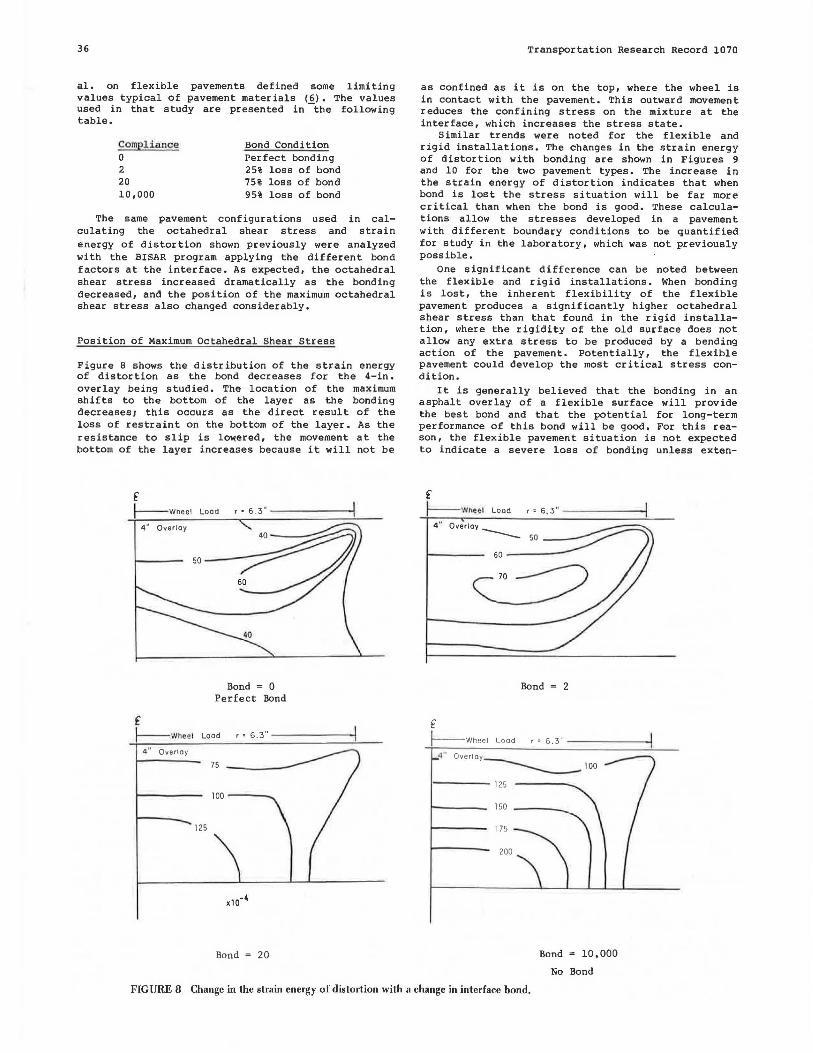
Figure 8 shows the distribution of the strain energy of distortion as the bond decreases for the 4-in. overlay being studied. The location of the maximum shifts to the bottom of the layer as the bonding decreases; this occurs as the direct result of the loss of restraint on the bottom of the layer. As the resistance to slip is lowered, the movement at the bottom of the layer increases because it will not be
f f--wheel
4 " Overlay
f
Bond = 0 Perfect Bond
f---wheel Lood r • 6.3" - - ------<
4" Overlay
75
100----
125
Bond 20
Transportation Research Record 1070
as confined as it is on the top, where the wheel is in contact with the pavement. This outward movement reduces the confining stress on the mixture at the interface, which increases the stress state.
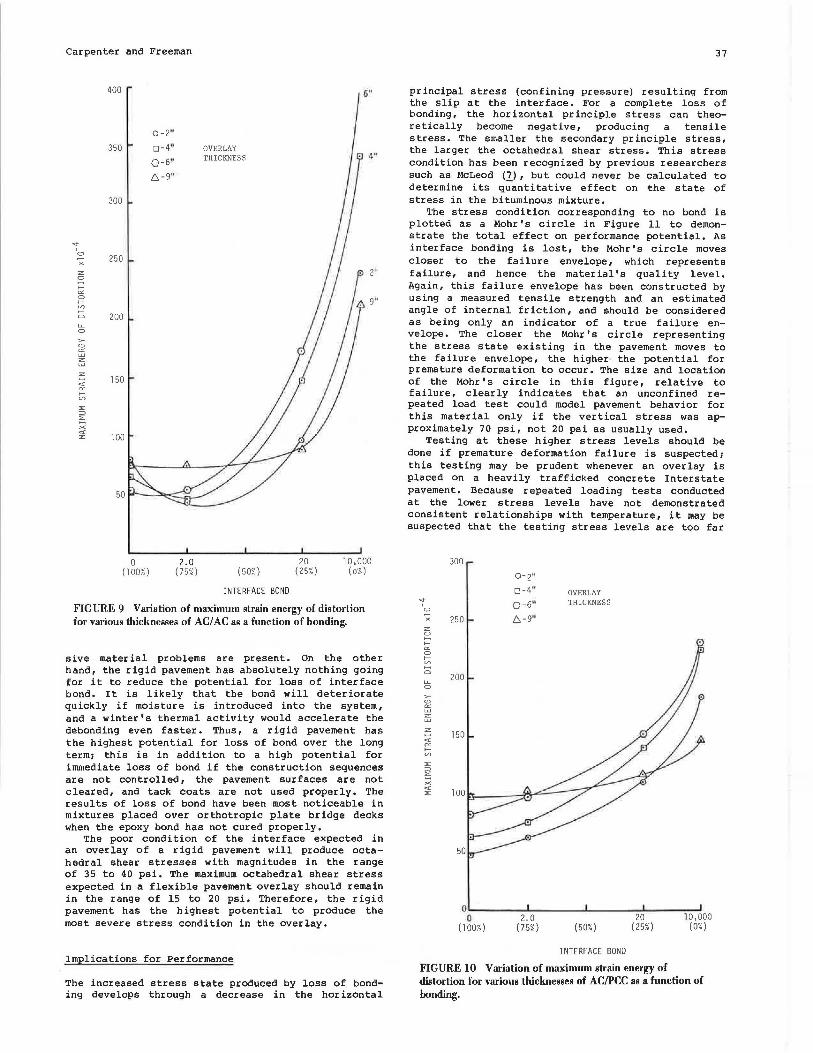
Similar trends were noted for the flexible and rigid installations. The changes in the strain energy of distortion with bonding are shown in Figures 9 and 10 for the two pavement types. The increase in the strain energy of distortion indicates that when bond is lost the stress situation will be far more critical than when the bond is good. These calculations allow the stresses developed in a pavement with different boundary conditions to be quantified for study in the laboratory, which was not previously possible.
One significant difference can be noted between the flexible and rigid installations. When bonding is lost, the inherent flexibility of the flexible pavement produces a significantly higher octahedral shear stress than that found in the rigid installation, where the rigidity of the old surface does not allow any extra stress to be produced by a bending action of the pavement. Potentially, the flexible pavement could develop the most critical stress condition.
It is generally believed that the bonding in an asphalt overlay of a flexible surface will provide the best bond and that the potential for long-term performance of this bond will be good. For this reason, the flexible pavement situation is not expected to indicate a severe loss of bonding unless exten-
f f--wheel Load
Bond 2
f f--wheel Load r • 6.3" --------<
Overlay------100
1---- - 125
150
175
200
Bond = 10,000
No Bond
FIGURE 8 Change in the strain energy of distortion with a change in interface bond.
Carpenter and Freeman
z: 0
fa: 0 fV)
"-0
>'-" "' w z: w
0 (100%)
2.0 (75%) (50'.0
INTERFACE BOND
20 (25%)
10,000 (0%)
FIGURE 9 Variation of maximum strain energy of distortion for various thicknesses of AC/ AC as a function of bonding.
sive material problems are present. On the other hand, the rigid pavement has absolutely nothing going for it to reduce the potential for loss of interface bond. It is likely that the bond will deteriorate quickly if moisture is introduced into the system, and a winter's thermal activity would accelerate the debonding even faster. Thus, a rigid pavement has the highest potential for loss of bond over the long term; this is in addition to a high potential for immediate loss of bond if the construction sequences are not controlled, the pavement surfaces are not cleared, and tack coats are not used properly. The results of loss of bond have been most noticeable in mixtures placed over orthotropic plate bridge decks when the epoxy bond has not cured properly.
The poor condition of the interface expected in an overlay of a rigid pavement will produce octahedral shear stresses with magnitudes in the range of 35 to 40 psi. The maximum octahedral shear stress expected in a flexible pavement overlay should remain in the range of 15 to 20 psi. Therefore, the rigid pavement has the highest potential to produce the most severe stress condition in the overlay.
Implications for Performance
The increased stress state produced by loss of bonding develops through a decrease in the horizontal
37
principal stress (confining pressure) resulting from the slip at the interface. For a complete loss of bonding, the horizontal principle stress can theoretically become negative, producing a tensile stress. The smaller the secondary principle stress, the larger the octahedral shear stress. This stress condition has been recognized by previous researchers such as McLeod (_l), but could never be calculated to determine its quantitative effect on the state of stress in the bituminous mixture.
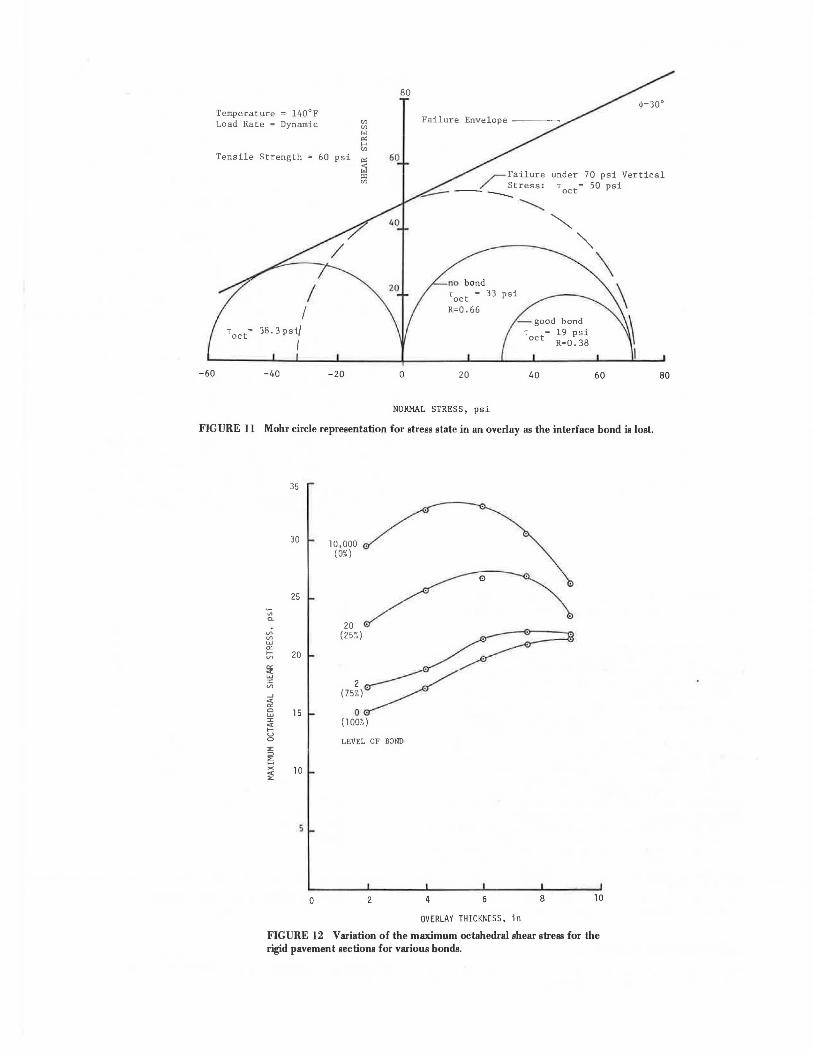
The stress condition corresponding to no bond is plotted as a Mohr's circle in Figure 11 to demonstrate the total effect on performance potential. As interface bonding is lost, the Mohr's circle moves closer to the failure envelope, which represents failure, and hence the material's quality level. Again, this failure envelope has been constructed by using a measured tensile strength and an estimated angle of internal friction, and should be considered as being only an indicator of a true failure envelope. The closer the Mohr's circle representing the stress state existing in the pavement moves to the failure envelope, the higher the potential for premature deformation to occur. The size and location of the Mohr's circle in this figure, relative to failure, clearly indicates that an unconfined repeated load test could model pavement behavior for this material only if the vertical stress was approximately 70 psi, not 20 psi as usually used.
Testing at these higher stress levels should be done if premature deformation failure is suspected; this testing may be prudent whenever an overlay is placed on a heavily trafficked concrete Interstate pavement. Because repeated loading tests conducted at the lower stress levels have not demonstrated consistent relationships with temperature, it may be suspected that the testing stress levels are too far
" ' 0
x z: 0
fa: 0
~ 0 "-0
>'-" ::::; z: w
300
0-2'' o-4" OVERLAY Q-6" THICKNESS
250 L';-9"
01-.~~~.l.-~~~.l.-~~--1'--~--:~ 0 2.0 20 10,000
(100:0 (75%) (50%) (25%) (0%)
INTERFACE BOND
FIGURE 10 Variation of maximum strain energy of distortion for various thicknesses of AC/PCC as a function of bonding.
-60
Temperature = 140°F Load Rate = Dynamic
Tensile Strength
38.3pst/
I
-40
<ll <ll
"' "' ~ 60 psi °'
- 20
.,; "' <ll
80
60
no bond T = 33 oct R=0.66
0 20
NORMAL STRESS, psi
40
under 70 psi Vertical Toct= 50 psi
60 80
FIGURE 11 Mohr circle representation for stress state in an overlay as the interface bond is lost.
35
30 10,000 (0%)
0
25
"' CL
.,; 20 V1 (25:0 w
"' >-- 20 Vl
!;? w :r 2 Vl
...J (75%)
"" "' 8 15 0 . :r (100%) "" >--u 0 LEVEL OF BOND >: ::>
~ >< 10 ~
5
0 2 4 8 10
OVERLAY THIC KNESS, in
FIGURE 12 Variation of the maximum octahedral shear stress for the rigid pavement sections for various bonds.
Carpenter and Freeman
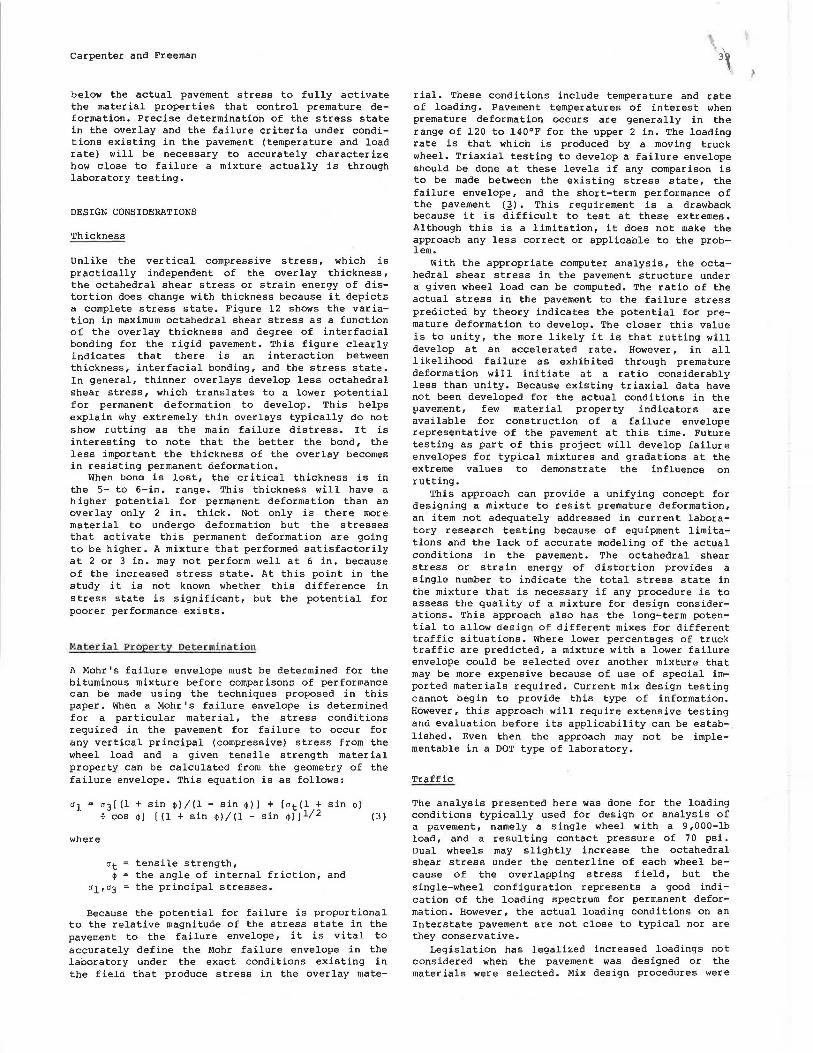
below the actual pavement stress to fully activate the material properties that control premature deformation. Precise determination of the stress state in the overlay and the failure criteria under conditions existing in the pavement (temperature and load rate) will be necessary to accurately characterize how close to failure a mixture actually is through laboratory testing.
DESIGN CONSIDERATIONS
Thickness
Unlike the vertical compressive stress, which is practically independent of the overlay thickness, the octahedral shear stress or strain energy of distortion does change with thickness because it depicts a complete stress state. Figure 12 shows the variation in maximum octahedral shear stress as a function of the overlay thickness and degree of interfacial bonding for the rigid pavement. This figure clearly indicates that there is an interaction between thickness, interfacial bonding, and the stress state. In general, thinner overlays develop less octahedral shear stress, which translates to a lower potential for permanent deformation to develop. This helps explain why extremely thin overlays typically do not show rutting as the main failure distress. It is interesting to note that the better the bond, the less important the thickness of the overlay becomes in resisting permanent deformation.
When bond is lost, the critical thickness is in the 5- to 6-in. range. This thickness will have a higher potential for permanent deformation than an overlay only 2 in. thick. Not only is there more material to undergo deformation but the stresses that activate this permanent deformation are going to be higher. A mixture that performed satisfactorily at 2 or 3 in. may not perform well at 6 in. because of the increased stress state. At this point in the study it is not known whether this difference in stress state is significant, but the potential for poorer performance exists.
Ma tez: ial Property Determination
A Mohr's failure envelope must be determined for the bituminous mixture before comparisons of performance can be made using the techniques proposed in this paper. When a Mohr's failure envelope is determined for a particular material, the stress conditions required in the pavement for failure to occur for any vertical principal (compressive) stress from the wheel load and a given tensile strength material property can be calculated from the geometry of the failure envelope. This equation is as follows:
cr 1 = a 3 [(1 +sin q,)/(l - sin q,)] + [crt(l +sin <1>) cos q,] [ (1 + sin <1>)/(l - sin q,) 11/2 (3)
where
tensile strength, the angle of internal friction, and the principal stresses.
Because the potential for failure is proportional to the relative magnitude of the stress state in the pavement to the failure envelope, it is vital to accurately define the Mohr failure envelope in the laboratory under the exact conditions existing in the field that produce stress in the overlay mate-
rial. These conditions include temperature and rate of loading. Pavement temperatures of interest when premature deformation occurs are generally in the range of 120 to 140°F for the upper 2 in. The loading rate is that which is produced by a moving truck wheel. Triaxial testing to develop a failure envelope should be done at these levels if any comparison is to be made between the existing stress state, the failure envelope, and the short-term performance of the pavement (3). This requirement is a drawback because it is difficult to test at these extremes. Although this is a limitation, it does not make the approach any less correct or applicable to the problem.
With the appropriate computer analysis, the octahedral shear stress in the pavement structure under a given wheel load can be computed. The ratio of the actual stress in the pavement to the failure stress predicted by theory indicates the potential for premature deformation to develop. The closer this value is to unity, the more likely it is that rutting will develop at an accelerated rate. However, in all likelihood failure as exhibited through premature deformation will initiate at a ratio considerably less than unity. Because existing triaxial data have not been developed for the actual conditions in the pavement, few material property indicators are available for construction of a failure envelope representative of the pavement at this time. Future testing as part of this project will develop failure envelopes for typical mixtures and gradations at the extreme values to demonstrate the influence on rutting.
This approach can provide a unifying concept for designing a mixture to resist premature deformation, an item not adequately addressed in current laboratory research testing because of equipment limitations and the lack of accurate modeling of the actual conditions in the pavement. The octahedral shear stress or strain energy of distortion provides a single number to indicate the total stress state in the mixture that is necessary if any procedure is to assess the quality of a mixture for design considerations. This approach also has the long-term potential to allow design of different mixes for different traffic situations. Where lower percentages of truck traffic are predicted, a mixture with a lower failure envelope could be selected over another mixture that may be more expensive because of use of special imported materials required. Current mix design testing cannot begin to provide this type of information. However, this approach will require extensive testing and evaluation before its applicability can be established. Even then the approach may not be implementable in a DOT type of laboratory.
Traffic
The analysis presented here was done for the loading conditions typically used for design or analysis of a pavement, namely a single wheel with a 9,000-lb load, and a resulting contact pressure of 70 psi. Dual wheels may slightly increase the octahedral shear stress under the centerline of each wheel because of the overlapping stress field, but the single-wheel configuration represents a good indication of the loading spectrum for permanent deformation. However, the actual loading conditions on an Interstate pavement are not close to typical nor are they conservative.
Legislation has legalized increased loadings not considered when the pavement was designed or the materials were selected. Mix design procedures were
/, ' •J
I•; TABLE 1 Tire Pressure Readings
Reading No. Air Pressure Reading No. Air Pressure
I 2 3 4 5 6 7 8 9
10 II ]?
13 14 15 16 17 18
94 110 101 94
100 100 104 '"; ;i... 82 75 ' ( 80 ..,,.,f
100 96 86 · I
110 90
105 c~
95 94
19 20 21 22 23 24 25 26 27 28 29 3P 31 32 33 34 35 36
94 100 102 130 100
RR 108 Li 80 '!)
108 '· 104 7 86 '30 90 91 72 "llJ
103 100 100 92
Note: AJI readings were taken on May 3, 1984, from the 1ast axle on the trailer; they were conducted on FAl-57 m Mlil'ion, Ulinois.
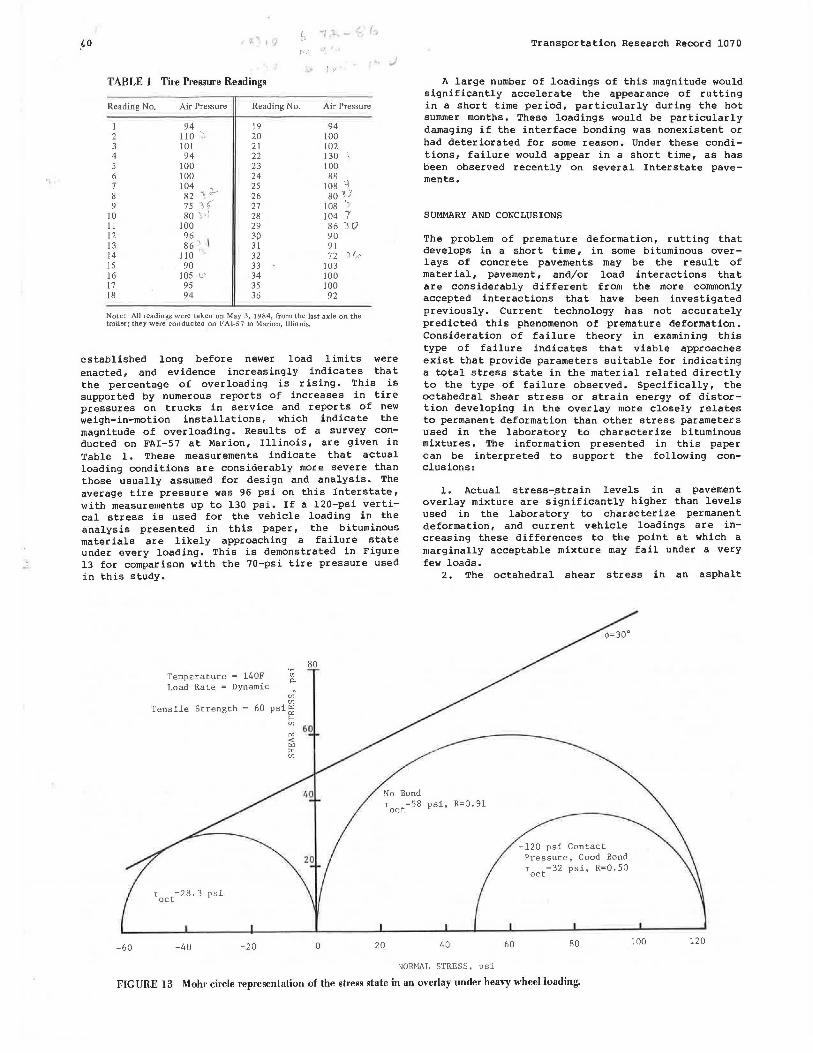
established long before newer load limits were enacted, and evidence increasingly indicates that the percentage of overloading is rising. This is supported by numerous reports of increases in tire pressures on trucks in service and reports of new weigh-in-motion installations, which indicate the magnitude of overloading. Results of a survey conducted on FAI-57 at Marion, Illinois, are given in Table 1. These measurements indicate that actual loading conditions are considerably more severe than those usually assumed for design and analysis. The average tire pressure was 96 psi on this Interstate, with measurements up to 130 psi. If a 120-psi vertical stress is used for the vehicle loading in the analysis presented in this paper, the bituminous materials are likely approaching a failure state under every loading. This is demonstrated in Figure 13 for comparison with the 70-psi tire pressure used in this study.
-60
Temperature = 140F Load Rate = Dynamic
Tensile Strength = 60
'oct=28.3 psi
-40 -20
(/]
(/]
psi~ H
80
(/] 60
~ (/]
0 20
Transportation Research Record 1070
A large number of loadings of this magnitude would significantly accelerate the appearance of rutting in a short time period, particularly during the hot summer months. These loadings would be particularly damaging if the interface bonding was nonexistent or had deteriorated for some reason. Under these conditions, failure would appear in a short time, as has been observed recently on several Interstate pavements.
SUMMARY AND CONCLUSIONS
The problem of premature deformation, rutting that develops in a short time, in some bituminous overlays of concrete pavements may be the result of material, pavement, and/or load interactions that are considerably different from the more commonly accepted interactions that have been investigated previously. Current technology has not accurately predicted this phenomenon of premature deformation. Consideration of failure theory in examining this type of failure indicates that viable approaches exist that provide parameters suitable for indicating a total stress state in the material related directly to the type of failure observed. Specifically, the octahedral shear stress or strain energy of distortion developing in the overlay more closely relates to permanent deformation than other stress parameters used in the laboratory to characterize bituminous mixtures. The information presented in this paper can be interpreted to support the following conclusions:
1. Actual stress-ptrain levels in a pavement overlay mixture are significantly higher than levels used in the laboratory to characterize permanent deformation, and current vehicle loadings are increasing these differences to the point at which a marginally acceptable mixture may fail under a very few loads.
2. The octahedral shear stress in an asphalt
psi, R=0.91
40 60
-120 psi Contact Pressure, Good Bond 'oct=32 psi, R=0.50
80 100 120
NORMAL STRESS, osi
FIGURE 13 Mohr circle representation of the stress state in an overlay under heavy wheel loading.
Carpenter and Freeman
mixture provides a unique parameter capable of describing the stress state in the mixture. When the Mohr-Coulomb failure envelope is defined, the octahedral shear stress in the pavement can indicate how close to failure the mixture may be when loaded. Adjustments to mix quality can be made to improve the relationship between loading and failure stresses.
3. By using octahedral shear stress to indicate the total stress state in the mix, it can be demonstrated how varying pavement conditions can alter the potential for premature deformation. These pavement conditions include original pavement type, temperature, rate of load, and--most critically--the condition of the bond at the interface between the overlay and the original surface.
4. Laboratory testing of mixes must be changed to allow testing to be performed at the boundary conditions found in the actual pavement, primarily temperature, rate of load, and stress level, as indicated by the octahedral shear stress.
5. Interface bonding needs to be investigated, particularly for h igh-vol.ume rigid pavement installations where the potential for loss of bonding is greatest and the need for good bonding is also greatest.
6. Further in-depth studies into the actual loading conditions of today's trucks need to be conducted to accurately define the loading parameters that should be used to characterize mixture performance.
7. Laboratory testing using triaxial compression and tensile strength determinations and repeated loadings must be conducted to validate the possible applicability of the octahedral shear stress as a mixture design parameter for laboratory use. The results must be substantiated by field performance data.
ACKNOWLEDGMENTS
This paper was prepared as a part of the study entitled Structural Characterization of Bituminous Mixes used as Overlays on Heavily Trafficked Concrete Pavements, by the Department of Civil Engineering in the Engineering Experiment Station, University of Illinois at Urbana-Champaign. This study is funded by the FHWA, u.s. Department of Transportation, as a part of the DOT's Program of University
41
Research. The authors would like to extend their appreciation to all those who provided data to this study.
REFERENCES
1. F.B. Seely and J.O. Smith. Advanced Mechanics of Materials. John Wiley & Sons, Inc., New York, 1966.
2. F.L. Roberts and T.W. Kennedy. Asphalt Concrete Overlay Design Considerations. Report FHWZ/TX-84/13+318-lF. Center for Transportation Research, University of Texas at Austin, Austin, Feb. 1984.
3, s.H. Carpenter and T.J. Freeman. An Analytical Study of Bituminous Mixtures Used as Overlays on Concrete Pavements. Interim Report. FHWA, U.S. Department of Transportation, Jan. 1984.
4. J. Morris, R.C.G. Haas, P. Reilly, and T.T. Hignell. Permanent Def or ma tion in Asphalt Pavements Can Be Predicted. Proc., Association of Asphalt Paving Technologists, Vol. 43, 1974, pp. 41-76.
5. D. Janssen. The Influence of Asphalt Concrete Overlays on the Durability of Portland Cement Concrete Pavements. Ph.D. dissertation. Civil Engineering Department, University of Illinois, Urbana, Aug. 1985.
6, J. Uzan, M. Livneh, and Y. Eshed. Investigation of Adhesion Properties Between Asphaltic-Concrete Layers. Proc., Association of Asphalt Paving Technologists, Vol. 47, 1978, pp. 495-521.
7 • N. w. McLeod. A Rational Approach to the Design of Bituminous Paving Mixtures. Proc., Association of Asphalt Paving Technologists, Vol. 21, 1952, pp. 82-224.
The contents of this paper reflect the views of the authors, who are responsible for the facts and the accuracy of the data presented herein. The contents do not necessarily reflect the official views or policies of the U.S. Department of Transportation or the FHWA. This paper does not constitute a standard, specification, or regulation.
Publication of this paper sponsored by Committee on Strength and Deformation Characteristics of Pavement Sections.