Transportation Research Part C - Politehnica Timișoara
13
Ensemble based traffic light control for city zones using a reduced number of sensors Dan Pescaru, Daniel-Ioan Curiac ⇑ Faculty of Automatics and Computers, ‘‘Politehnica’’ University of Timis ßoara, Bd. V. Parvan No. 2, Timisoara 300223, Romania article info Article history: Received 7 June 2013 Received in revised form 11 June 2014 Accepted 25 June 2014 Keywords: Intelligent traffic light control Ensemble based system Wireless sensor and actuator network abstract Rapid advances in computing, sensing and telecommunication technology offer unprece- dented opportunities for artificial intelligence concepts to expand their applications in the field of traffic management and control. Our methodology gravitates around a powerful decision-making method: ensemble-based systems. This technique is used to accurately classify the near future traffic conditions and to make efficient decisions for adapting the traffic lights sequences within an urban area to optimize the traffic flows. The proposed approach requires only measurements provided by traffic sensors located along the princi- pal roads entering the zone. This reduced number of sensors are considered to be enough relevant for classifying the near future state of the traffic and moreover, their measure- ments can be validated through analytical/hardware redundancy. Our methodology is meant to be implemented within the framework of a wireless sensor and actuator network and is confirmed by computer simulation, including normal or abnormal traffic conditions, for the central part of the city of Timisoara-Romania. Ó 2014 Elsevier Ltd. All rights reserved. 1. Introduction Urban traffic represents a highly complex phenomenon that becomes more and more a major concern for our everyday life. The escalating demand for people and goods mobility in urban areas (with limited road infrastructure) has caused fre- quent traffic congestion, with various undesirable consequences: delays, energy waste, noise, pollution or road accidents. Over the years a diverse range of solutions had been applied to reduce the level of traffic congestion and to minimize the consequences. Due to the intricate set of interactions between road infrastructure, diverse types of vehicles, weather condi- tions and multitude of technologies involved, a general approach has yet to be found. With the continuous advancements in computing, communication and sensing technology, a series of artificial intelli- gence concepts had been employed in traffic management and optimization: expert systems (Findler and Stapp, 1992), pre- diction-based optimization (Tavladakis and Voulgaris, 1999; Liu et al., 2002), fuzzy logic (Tan et al., 1995; Lee et al., 1995), neural networks (Srinivasan et al., 2006; Vlahogianni et al., 2005), evolutionary algorithms (Taale et al., 1998), reinforcement learning (Thorpe and Andersson, 1996; Sutton, 1996), etc. Their direct outcome resides in an overall improvement of traffic flows in both normal and abnormal traffic circumstances. This paper proposes a new perspective upon adaptive traffic light control in urban areas employing not a single expert system but a mixture of experts (ensemble based system), in order to boost the traffic decision accuracy. Our approach is based on the following premises: (i) only a small number of roads entering a city zone coagulate the majority of traffic – the http://dx.doi.org/10.1016/j.trc.2014.06.006 0968-090X/Ó 2014 Elsevier Ltd. All rights reserved. ⇑ Corresponding author. Tel.: +40 256 403 227; fax: +40 256 403 214. E-mail addresses: [email protected] (D. Pescaru), [email protected] (D.-I. Curiac). Transportation Research Part C 46 (2014) 261–273 Contents lists available at ScienceDirect Transportation Research Part C journal homepage: www.elsevier.com/locate/trc
Transcript of Transportation Research Part C - Politehnica Timișoara

Transportation Research Part C 46 (2014) 261–273
Contents lists available at ScienceDirect
Transportation Research Part C
journal homepage: www.elsevier .com/locate / t rc
Ensemble based traffic light control for city zones using areduced number of sensors
http://dx.doi.org/10.1016/j.trc.2014.06.0060968-090X/� 2014 Elsevier Ltd. All rights reserved.
⇑ Corresponding author. Tel.: +40 256 403 227; fax: +40 256 403 214.E-mail addresses: [email protected] (D. Pescaru), [email protected] (D.-I. Curiac).
Dan Pescaru, Daniel-Ioan Curiac ⇑Faculty of Automatics and Computers, ‘‘Politehnica’’ University of Timis�oara, Bd. V. Parvan No. 2, Timisoara 300223, Romania
a r t i c l e i n f o a b s t r a c t
Article history:Received 7 June 2013Received in revised form 11 June 2014Accepted 25 June 2014
Keywords:Intelligent traffic light controlEnsemble based systemWireless sensor and actuator network
Rapid advances in computing, sensing and telecommunication technology offer unprece-dented opportunities for artificial intelligence concepts to expand their applications inthe field of traffic management and control. Our methodology gravitates around a powerfuldecision-making method: ensemble-based systems. This technique is used to accuratelyclassify the near future traffic conditions and to make efficient decisions for adapting thetraffic lights sequences within an urban area to optimize the traffic flows. The proposedapproach requires only measurements provided by traffic sensors located along the princi-pal roads entering the zone. This reduced number of sensors are considered to be enoughrelevant for classifying the near future state of the traffic and moreover, their measure-ments can be validated through analytical/hardware redundancy. Our methodology ismeant to be implemented within the framework of a wireless sensor and actuator networkand is confirmed by computer simulation, including normal or abnormal traffic conditions,for the central part of the city of Timisoara-Romania.
� 2014 Elsevier Ltd. All rights reserved.
1. Introduction
Urban traffic represents a highly complex phenomenon that becomes more and more a major concern for our everydaylife. The escalating demand for people and goods mobility in urban areas (with limited road infrastructure) has caused fre-quent traffic congestion, with various undesirable consequences: delays, energy waste, noise, pollution or road accidents.Over the years a diverse range of solutions had been applied to reduce the level of traffic congestion and to minimize theconsequences. Due to the intricate set of interactions between road infrastructure, diverse types of vehicles, weather condi-tions and multitude of technologies involved, a general approach has yet to be found.
With the continuous advancements in computing, communication and sensing technology, a series of artificial intelli-gence concepts had been employed in traffic management and optimization: expert systems (Findler and Stapp, 1992), pre-diction-based optimization (Tavladakis and Voulgaris, 1999; Liu et al., 2002), fuzzy logic (Tan et al., 1995; Lee et al., 1995),neural networks (Srinivasan et al., 2006; Vlahogianni et al., 2005), evolutionary algorithms (Taale et al., 1998), reinforcementlearning (Thorpe and Andersson, 1996; Sutton, 1996), etc. Their direct outcome resides in an overall improvement of trafficflows in both normal and abnormal traffic circumstances.
This paper proposes a new perspective upon adaptive traffic light control in urban areas employing not a single expertsystem but a mixture of experts (ensemble based system), in order to boost the traffic decision accuracy. Our approach isbased on the following premises: (i) only a small number of roads entering a city zone coagulate the majority of traffic – the

262 D. Pescaru, D.-I. Curiac / Transportation Research Part C 46 (2014) 261–273
situation is similar to the one known from internet network traffic where large ‘‘elephant flows’’ have a much higher effecton the traffic than small ‘‘mice flows’’ (Erman et al., 2007); (ii) sensors are the traffic devices most prone to malfunctioning –considering a plethora of sensors to measure the traffic parameters on every unimportant road will complicate the decisionalarchitecture with no relevant results in terms of accuracy; (iii) for an optimal traffic light control we need a precise evaluator ofthe near future state of the traffic – the concept we identified to fit this task is an ensemble-based decisional system (mixtureof experts).
As a consequence, we propose an integrated methodology for adaptive traffic light control within a city zone based on anensemble of classifiers that intelligently process the input data measured by a reduced number of sensors placed only onprincipal roads entering that zone. This approach can be naturally implemented in the framework of Wireless Sensor/Actu-ator Network (WSAN) that extends the capabilities of the well-known wireless sensor network to cope with complex controlsituations.
The rest of the paper is organized as follows. Section 2 presents the kernel of our methodology – the ensemble based sys-tem. In Section 3 we present the overall methodology for adaptive traffic light control, accompanied by the system architec-ture described in Section 4. In Section 5 a relevant simulation case study for traffic light optimization in the central part ofTimisoara-Romania is presented, while the last section outlines the conclusions and final remarks.
2. Ensemble of classifiers
Having its roots in the human nature to request two, three or even more qualified opinions every time a complex decisionhas to be made, the artificial intelligence concept of ensemble of classifiers has rapidly expanded in the automated decision-making research field (Polikar, 2006; Curiac and Volosencu, 2012). The strategy pursued by these ensemble-based systems isto create a group of diverse classifiers and to combine their outputs in a form that significantly improves the generalizationfeature when compared with single classifiers (Chandra and Yao, 2006). Thus, when carefully designed, these committees ofclassifiers outperform any individual classifier in the majority of complex applications (Llorca et al., 2012; Geisler et al.,2012), including traffic control.
The general structure for an ensemble of classifiers is presented in Fig. 1.All of the Q classifiers Cq are formulating their own individual hypothesis hq, which are later aggregated in an overall deci-
sion h:
h ¼ f ðh1;w1; . . . ;hq;wq; . . . ;hQ ;wQ Þ; ð1Þ
where wq are the weights corresponding to each individual hypothesis hq.One of the important characteristics that are inherently associated with an accurate mixture of classifiers is the diversity
between classifiers (Kuncheva and Whitaker, 2003). Even if individual classifiers are accurately covering different parts ofthe classification space, their combination must work precisely in the entire space. Between different sorts of ensembleforming and training techniques, two approaches are considered to be the most influential (Ahmed and Abdel-Aty, 2013):
- Bootstrap aggregating (bagging) is a model averaging technique that uses randomly extracted subsets of a given trainingset – obtained through a resampling and replacement procedure – to train different models (Breiman, 1996). The classi-fiers are trained independently and their outputs are combined by simply averaging or voting to generate the overallensemble output.
- Boosting is a technique that builds the ensemble sequentially by adding new weak learners and train them individuallyusing predominantly the subsets of training data that were previously misclassified by other models (Schapire, 1990;Freund and Schapire, 1997). In order to obtain the ensemble’s output, the individual classifiers’ outputs are weightedaccording to their accuracy.
The methodology presented in this paper gravitates around the preciseness of classification offered by a carefully con-structed ensemble based system (EBS). At every precise moment in time t, EBS receives the measurements Mi(t) from each
Fig. 1. General structure for an ensemble of classifiers.

D. Pescaru, D.-I. Curiac / Transportation Research Part C 46 (2014) 261–273 263
of the traffic sensors Si with i = 1, . . ., n and precisely selects the most appropriate class Classj, j = 1, . . ., p which encloses allthe time specifications for the traffic lights within the city zone (Fig. 2).
The construction of such an EBS can be done using automatic training procedures implying bagging or boosting methods.During the training process, the ensemble is constructed and configured based on carefully selected input–output sets of theform: {M1(t),. . ., Mn(t), Classq} obtained through direct traffic observations and computer simulation. Depending on the typeof the classification problem that has to be solved, either bagging or boosting may yield better accuracy (Banfield et al.,2007). In order to identify which method is the most suitable in our case, we conducted an evaluation process started withthe selection of decision trees (Karlaftis and Vlahogianni, 2011) as the weak classifiers because of their simplicity, ease ofmanipulation and general applicability. A decision tree is actually a graphical diagram where every branch is a choice froma set of alternatives and every leaf is a classification decision (Karlaftis and Vlahogianni, 2011). Its input is represented by aseries of queries, its output represents the decision (in our case it is the optimal class containing traffic lights phase timings)and the tree depth is defined as the number of branches followed along the path from the root to the farthest leaf.
Analyzing a variety of automated ensemble forming methodologies including AdaBoost, LPBoost, TotalBoost or Bagging,with comparative studies presented in Section 5, we concluded that the most suitable algorithm for solving our problem isTotalBoost (Warmuth et al., 2006). As a consequence, the ensemble used in our adaptive traffic control methodology wasdeveloped using this efficient boosting variant (TotalBoost) and classifies the actual traffic conditions for a city zone inclasses that correspond to judiciously selected sets of traffic lights phase timings.
TotalBoost is a totally corrective algorithm meaning that in each iteration step it adapts the set of weights (the distribu-tion) to obtain a small edge (i.e. the weighted margin (Grove and Schuurmans, 1998; Warmuth et al., 2007) with respect toall past hypothesis. It uses entropic regularization (Warmuth et al., 2006) by minimizing a variant of the Kullback–Leiblerdivergence (Kullback and Leibler, 1951) obtained using a quadratic expansion of the divergence.
The relative entropy is defined as follows:
DðW;W0Þ ¼XN
n¼1
WðnÞ � logWðnÞW0ðnÞ
; ð2Þ
where W is the current weight distribution (entire set of weights), W0 is the initial weight distribution considered to be uni-form, n is the current input–output pair taken into consideration in ensemble training, N is the total number of input–outputpairs, while W(n) and W0(n) are the weights at the current and first iteration, respectively.
By approximating (2) as a second order Taylor series, in the vicinity of W0(n), we obtain:
DðW;W0Þ �XN
n¼1
ð1þ logWðnÞW0ðnÞ
Þ � dðnÞ þ 12WðnÞ � dðnÞ
2; ð3Þ
with
d ¼WðnÞ �W0ðnÞ: ð4Þ
Each iteration step, the objective function (2) will be minimized with respect to d using a ‘‘vanilla’’ sequential quadraticprogramming algorithm (Nocedal and Wright, 2000) and considering the constraint that the edge is lower than a given value.
TotalBoost is efficient in multiclass classifications and exhibits two valuable characteristics: is self-terminating whichmeans that it obtains the best fitting ensemble in a finite time; and it constructs ensembles with very small weights offeringthe possibility to shrink the resulting ensemble by safely removing some irrelevant classifiers.
The step-by-step methodology is fully described in the next paragraph, implementing details being provided in Section 4.
Fig. 2. Ensemble based system as an on-line decision making entity for adaptive traffic lights control.

264 D. Pescaru, D.-I. Curiac / Transportation Research Part C 46 (2014) 261–273
3. Proposed methodology
Our methodology, designed to optimize the urban traffic in a city zone, relies on the power of ensemble classification toselect among different carefully constructed classes (i.e. optimal patterns of traffic flows, described by individualized andinterlinked traffic signal schedules for all intersections included in a city zone). It basically implements an adaptive trafficcontrol system characterized by: fixed cycle length common to all traffic signals within the zone; changing traffic signals’timings every time another traffic pattern is identified by the ensemble based system; a control time and a measurementtime equal to the fixed cycle length.
Due to different constraints (environment-related – pollution, noise, induced vibrations, maximum size available for roadconstruction, etc.) urban traffic is almost always channelized through a limited road network, recognized as significant forthe area in which it is situated. This traffic channelization process was done in an efficient manner by choosing a set ofprincipal roads and a set of principal crossroads.
Definition 1. principal road (major road) – a high-capacity street that attracts the traffic from the surrounding area
The other roads in the zone, with less traffic are called side roads.
Definition 2. principal crossroad – intersection between a minimum of two principal roads
The rest of the crossroads are labeled as secondary intersections.Consequently, each city zone is formally characterized by a set of principal roads R and a set of principal crossroads J,
with their respective cardinality card (R) and card (J).Based on knowing the principal roads and principal crossroads in the city, our methodology pursues the following steps:
Step 1: Delimiting the urban area for methodology application.Our methodology is applied on city zone level. Indelimiting the area where our methodology will take effect, we will consider the following assumptions:i) The area will have between 5 and 10 principal roads crossing by ð5 6 cardðRÞ 6 10Þ and no more than 20 major inter-
sections ðcardðIÞ 6 20Þii) The area will be compact and its radius will be between 2 and 4 km. This size of the city zone guarantees the basic
objectives of our methodology: high efficiency of traffic management by assuring the time-period needed for tuning thetraffic signal phase timings in accordance with near-future traffic values; and low implementation/operation costs.
Apparently these assumptions may seem restrictive, but, in fact, the methodology can be simply expanded to larger urbanareas: we need only to split the region into zones configured according to mentioned prescriptions and after that to apply ourmethodology for each of these zones.
Step 2: Establishing the position of the traffic sensors.
The traffic sensors will be placed on the exit of the last intersection for all the principal roads entering the investigatedzone (Fig. 3). This will add some important time for our precise decision making process and for switching the set of trafficsignals’ timings to optimize the traffic in the entire zone.
The number of sensors used in our methodology is reduced because we will locate sensors only for monitoring the trafficon major roads entering the zone. Certainly these sensors will need some hardware or analytic redundancy (Chow andWillsky, 1984) in case, for different reasons, they are working incorrectly – either we install more than one sensor on eachprincipal road, or we compute an estimated value for that sensor using measurements obtained from other sensors.
Step 3: Obtaining the ensemble training datasets.
Urban traffic is extremely complex and, as an effect, difficult to be forecasted or simulated (Sun et al., 2005; Istin et al.,2011). The ensemble of classifiers used in our methodology must deal efficiently with the strong volatility and almost chaoticnature of urban traffic. For this reason the training and testing processes of the ensemble have to be done using well-con-structed datasets that can envelop various aspects of an intricate reality, provided by two independent sources:
� real traffic sensors deployed in the proximity of investigated area – The most important source for training or testing data-sets is represented by historical data measured by real traffic sensors. Although, the real measurements may reflect thetraffic patterns in usual or unusual circumstances, sometimes they may be statistically inefficient; and� computer traffic simulation – In theory, urban traffic can be simulated to obtain pertinent data for training and testing. This
endeavor, even though it has been proven to be error prone, can enlarge the authentic datasets with pertinent scenariosthat may not be revealed by collected measurements.
By joining information provided by these two independent sources with sets (classes) of optimal traffic-lights phaselengths for every intersection included in the zone, we can form consistent training and testing datasets.

Fig. 3. Example of sensors’ locations outside the investigated zone.
Table 1Structure of the training/testing datasets used in the case study.
Setno.
Input1(2)West [arrivalsper cycle]
Input3 West[arrivals percycle]
Input4 North[arrivals percycle]
Input5 North[arrivals percycle]
Input6 East[arrivals percycle]
Input7 East[arrivals percycle]
Input8 South[arrivals percycle]
Optimalclass fortraffic lights
Training/testing
1 3 4 5 4 2 6 8 Class 1 Training2 18 21 5 4 2 6 8 Class 4 Training3 3 4 26 21 2 6 8 Class 3 Training4 3 4 5 4 14 28 8 Class 1 Training5 3 4 5 4 2 6 30 Class 4 Training6 13 12 16 15 6 19 21 Class 4 Training7 3 4 5 4 14 28 30 Class 2 Training
. . .
60 21 29 7 7 15 33 4 Class 1 Training61 17 21 5 4 2 2 26 Class 4 Testing
. . .
105 21 13 25 4 27 40 1 Class1 Testing
Table 2Classes containing traffic lights time periods used in the case study.
Class Intersection/phase 7 7 7 7 7 7 7 7 7 7 7 7 7 7
Cycle duration = 98 s
Class1 N3/0 G G G G G G G G G G R R R RN3/1 G G G G G G G G R R R R R R. . .
N25/6 R R G G G G G G R R R R R R. . .
Class4 N3/0 G G G G G R R R R R R G G GN3/1 G G G G G R R R R R R R R R. . .
N25/6 R R R R R R R G G G G G G G
R-red signal, G-green signal.
D. Pescaru, D.-I. Curiac / Transportation Research Part C 46 (2014) 261–273 265
The structure of the training and testing datasets is presented in Table 1, where the classes for traffic signals’ timings havethe shape described in Table 2.
In order to form the optimal set of classes for traffic lights phase timings Class1, . . ., ClassN we started with the analysis oftraffic patterns in usual and unusual conditions (traffic events that block a road or intersection, major cultural or sporting

266 D. Pescaru, D.-I. Curiac / Transportation Research Part C 46 (2014) 261–273
events, etc.). As a result, we will choose the number of classes (N) by allocating a class for each significant pattern. Then,based on particular inputs (traffic measurements on each principal road entering the zone) for each pattern we first assignedtraffic signals’ timings for principal intersections and then for secondary intersections to favor the traffic on principal roadsand applying, wherever possible, the ‘green wave’ strategy (Madireddy et al., 2011). This optimization process to find besttraffic-lights phase timings is, for every class, iterative and involves computer simulations, real traffic analysis and even theintuition of human experts.
Step 4: Forming and training the ensemble of classifiers.
The core element of our methodology is represented by a powerful artificial intelligence concept: ensemble of classifiers.Basically, such an ensemble combines the decisions made by its individual constituents to obtain an overall accurate decisionwhen classifying new examples. In our case, this committee of diverse classifiers has the crucial goal to accurately select theset of traffic lights phase timings for the entire zone based on traffic sensor measurements.
To accomplish this mission we adopted the boosting method (Freund and Shapire, 1996) to form and train the ensemble.This effective method learns a series of weak base classifiers (in our case the decision trees) through an iterative processfocused on correcting the errors made in previous iteration and is currently considered one of the best inductive methods(Hastie et al., 2001) to obtain accurate ensembles of classifiers.
Between multiple boosting methods developed for multi-class classification, we selected the TotalBoost (Warmuth et al.,2006) variant for its simplicity, provable convergence and accuracy and used ClassificationEnsemble class (Matlab R2012b) forits computer implementation.
Using the training dataset developed in the previous step of our methodology, we are now able to provide an ensemble ofdecision-tree classifiers. This ensemble is afterward tested against a totally independent dataset. If this validation process issuccessful (the classification error is zero) the ensemble is able to be used in adaptive on-line traffic control. If not, we caneither modify the number/configuration of the classes (basically we can add new classes) or reconfigure the training datasetand retrain the ensemble within the new circumstances.
Step 5: On-line ensemble-based traffic light control.
Once the ensemble is trained and tested it can be included in an on-line adaptive traffic control strategy that enablesadapting the traffic light signals to traffic demands based on three stages:
- Read the traffic sensors every t seconds (t – traffic light cycle duration, common for all intersections within the zone), thesensors are providing the number of vehicles that passed on that road in the last time-interval of t seconds;
- Request the set of traffic lights phase timings from ensemble based on traffic measurement data, the ensemble will pick theoptimal set of traffic signals’ timings;
- Adjust the traffic lights phase timings after the current cycle duration ends, the traffic lights in each intersection of the zonewill be reprogrammed to satisfy the actual traffic demands.
4. System architecture
The traffic control scheme proposed in this paper was thought for an efficient implementation within the frame of Wire-less Sensor/Actuator Network (WSAN) architecture Akyildiz and Kasimoglu, 2004; Rezgui and Eltoweissy, 2007; Xia et al.,2007 where traffic sensors and traffic light actuators are all interconnected with a central controller over wireless links(Fig. 4):
The chosen topology for WSAN is cluster-tree. Each cluster of sensor nodes is deployed for measuring the traffic on a spec-ified principal road (Fig. 3). It locally aggregates the measurements (on the cluster-head level) to increase the accuracy. Theaggregated traffic values are then sent in a single-hop or multi-hop fashion to the base station where the ensemble baseddecisional system, acting as a zonal traffic controller, selects the correct parameters for every traffic light and transmits themto the actuators placed in each intersection.
For each principal road entering the zone we allocated a static cluster consisting of three traffic sensor nodes (the redun-dancy coefficient r = 2), one of them acting as a cluster-head and having the measurement aggregation responsibility. Theaggregation considered in this paper is a simple and efficient one: it averages the measurements proposed by each sensorwithin the cluster, excluding the measurement with the greatest absolute deviation. This procedure is proficiently copingwith a possible case where one sensor is providing erroneous measurements. Based on the sensor redundancy (the numberof cars per cycle length in every location is measured by three different sensors), we can compute a reliable traffic valueusing the formula:
Maggregated ¼1r
Xrþ1
i¼1;i–j
MðiÞ ¼ 12
X3
i¼1;i–j
MðiÞ: ð6Þ
with

(a)
(b)Fig. 4. WSAN architecture with explicit ensemble-based controller. (a) Network general topology, (b) Abstraction of traffic control application.
D. Pescaru, D.-I. Curiac / Transportation Research Part C 46 (2014) 261–273 267
j ¼ arg maxiðjM �MðiÞjÞ: ð7Þ
M(i) being the measured value of sensor i, while �M being the average value of the sensors measuring the traffic in the samelocation.
As can be seen from Eqs. (6) and (7), this aggregation technique requires a set of simple operations and can be easilyimplemented on the cluster-head sensor nodes.
Our implementation proposal within the WSAN framework includes the following set of wireless equipments: traffic sen-sors grouped in clusters, actuators for each intersection equipped with traffic lights, wireless signal repeaters and one basestation (a laptop class device) running the EBS software. While the number of sensors (NS) and the number of traffic-lightsactuators (NA) are given by (8) and (9) formulas, in the case of wireless signal repeaters we can compute a maximum numberof repeaters (MNR) using (10). The number of repeaters in real implementations may be less than MNR if some repeaters areused for two or more adjacent braches of the cluster-tree architecture:
NS ¼ ðr þ 1Þ � cardðRÞ; ð8ÞNA ¼ no: of crossroads equipped with traffic lights; ð9Þ
MNR ¼XcardðRÞ
i¼1
distðcluster headi; base stationÞwireless range
þXNS
j¼1
distðactuatorj; base stationÞwireless range
; ð10Þ
where r represents the redundancy coefficient (number of backup sensors for each traffic sensor), dist(A,B) is the Euclidiandistance between the locations A and B, wireless_range is the range in which the repeaters are reliably working.
As can be seen from (8), the number of sensor nodes included in our methodology is a reduced one, even if applying hard-ware redundancy, due to their placement only on principal roads entering the zone.
5. Case study – simulations and experiments
In order to validate the presented approach we developed a complex case study addressing the crowded traffic in the citycenter of Timisoara, Romania. This urban area is characterized by various traffic magnitudes induced by daily events likehome-to-workplace or home-to-school travels or by exceptional conditions including major cultural and sport events oreven traffic collisions. The road network of the investigated area, presented in Fig. 5, comprises seven principal and eightside roads, six major and five secondary intersections which are spread on an area of around 12 square kilometers.
Our method is intended to be implemented within the framework of a wireless sensor and actuator network. In this case,the WSAN deployment must include seven clusters of sensors nodes to capture the traffic flow on all principal roads enteringthe zone, six actuators for all crossroads equipped with traffic lights, four signal repeaters (we considered a reliable wirelessrange of up to 750 m in open area) to assure reliable communication flows and a base station which runs the ensemble-based decision software, as depicted by Fig. 5.
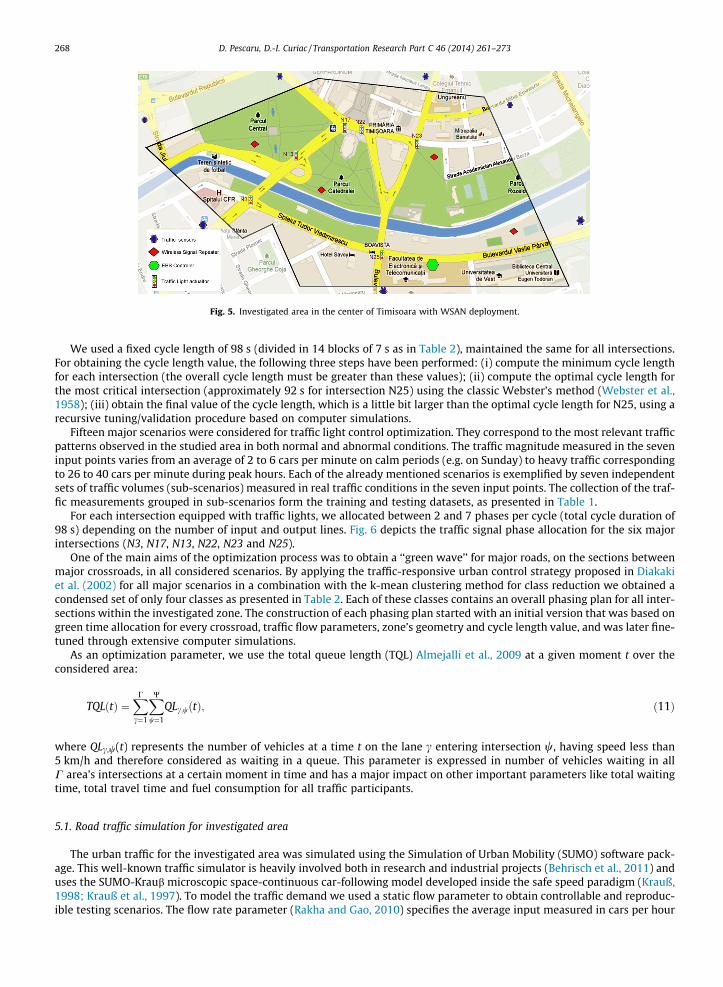
Fig. 5. Investigated area in the center of Timisoara with WSAN deployment.
268 D. Pescaru, D.-I. Curiac / Transportation Research Part C 46 (2014) 261–273
We used a fixed cycle length of 98 s (divided in 14 blocks of 7 s as in Table 2), maintained the same for all intersections.For obtaining the cycle length value, the following three steps have been performed: (i) compute the minimum cycle lengthfor each intersection (the overall cycle length must be greater than these values); (ii) compute the optimal cycle length forthe most critical intersection (approximately 92 s for intersection N25) using the classic Webster’s method (Webster et al.,1958); (iii) obtain the final value of the cycle length, which is a little bit larger than the optimal cycle length for N25, using arecursive tuning/validation procedure based on computer simulations.
Fifteen major scenarios were considered for traffic light control optimization. They correspond to the most relevant trafficpatterns observed in the studied area in both normal and abnormal conditions. The traffic magnitude measured in the seveninput points varies from an average of 2 to 6 cars per minute on calm periods (e.g. on Sunday) to heavy traffic correspondingto 26 to 40 cars per minute during peak hours. Each of the already mentioned scenarios is exemplified by seven independentsets of traffic volumes (sub-scenarios) measured in real traffic conditions in the seven input points. The collection of the traf-fic measurements grouped in sub-scenarios form the training and testing datasets, as presented in Table 1.
For each intersection equipped with traffic lights, we allocated between 2 and 7 phases per cycle (total cycle duration of98 s) depending on the number of input and output lines. Fig. 6 depicts the traffic signal phase allocation for the six majorintersections (N3, N17, N13, N22, N23 and N25).
One of the main aims of the optimization process was to obtain a ‘‘green wave’’ for major roads, on the sections betweenmajor crossroads, in all considered scenarios. By applying the traffic-responsive urban control strategy proposed in Diakakiet al. (2002) for all major scenarios in a combination with the k-mean clustering method for class reduction we obtained acondensed set of only four classes as presented in Table 2. Each of these classes contains an overall phasing plan for all inter-sections within the investigated zone. The construction of each phasing plan started with an initial version that was based ongreen time allocation for every crossroad, traffic flow parameters, zone’s geometry and cycle length value, and was later fine-tuned through extensive computer simulations.
As an optimization parameter, we use the total queue length (TQL) Almejalli et al., 2009 at a given moment t over theconsidered area:
TQLðtÞ ¼XC
c¼1
XW
w¼1
QLc;wðtÞ; ð11Þ
where QLc,w(t) represents the number of vehicles at a time t on the lane c entering intersection w, having speed less than5 km/h and therefore considered as waiting in a queue. This parameter is expressed in number of vehicles waiting in allC area’s intersections at a certain moment in time and has a major impact on other important parameters like total waitingtime, total travel time and fuel consumption for all traffic participants.
5.1. Road traffic simulation for investigated area
The urban traffic for the investigated area was simulated using the Simulation of Urban Mobility (SUMO) software pack-age. This well-known traffic simulator is heavily involved both in research and industrial projects (Behrisch et al., 2011) anduses the SUMO-Kraub microscopic space-continuous car-following model developed inside the safe speed paradigm (Krauß,1998; Krauß et al., 1997). To model the traffic demand we used a static flow parameter to obtain controllable and reproduc-ible testing scenarios. The flow rate parameter (Rakha and Gao, 2010) specifies the average input measured in cars per hour

Fig. 6. Crossroads’ configurations in investigated area.
D. Pescaru, D.-I. Curiac / Transportation Research Part C 46 (2014) 261–273 269
entering each intersection. This parameter was computed as a mean value of several measurements on the seven inputpoints during relaxed or peek intervals.
During model calibration and validation we used the SW zone of the investigated area, delimitated by N25 and In7, withthe assumption that driving behavior is homogeneous inside the entire scenario’s area. For calibration we used root meansquare error analyses between the simulation output and observation. Calibration data were collected at N25 and In7 duringtwo 20 min. intervals, one with heavy traffic on Monday 9:00 AM and one with light traffic on Sunday 3:00 PM. The goal wasto find the best SUMO parameter combination in order to minimize the mean square error for speed data. The model’sparameters were acceleration, deceleration, r and s. The first two parameters refer to maximum acceleration and deceler-ation of simulated vehicles. Corresponding to typical compact cars, predominant in investigated traffic, they were approx-imate to 2.5 m/s2 and 3 m/s2, respectively. The r represents the driver imperfection related with human behaviorexpressed as a real number in the interval 0.0–1.0. The s parameter models the driver reaction time in seconds. For calibra-tion we consider the r values in the range 0.1–0.9 with a 0.1 step and the s values in the range 1.0–3.0 with a 0.3 step. Aftercalibration we found the best values as r = 0.4 and s = 1.8 s. For model validation we collected data during six 20-min inter-vals covering various traffic conditions. The resulting root-mean-square error (RMSE) for traffic leaving the area was12.35 km/h, which is acceptable considering the measured traffic speed in the considered lane is in the range of40–56 km/h.
The roadmap area representation was imported in SUMO from OpenStreetMap (Zilske et al., 2011). The maximum speedfor all lanes was set to 50 km/h, representing the legal speed for the considered segments.
We simulated 15 traffic scenarios, each of them comprising of seven sub-scenarios which implement diverse traffic con-ditions on each major road, from low to medium or even to extreme traffic conditions. They include 60 sub-scenarios usedfor ensemble training and also 45 testing sub-scenarios. Moreover, we prepared five SUMO network settings correspondingto the four traffic light control classes (Class1, Class2, Class3 and Class4) plus one setting having all traffic lights switched off.Afterward, we use these four traffic light control settings and the special setting with no traffic control to simulate all the 105sub-scenarios. Simulations have been run for 30 min with 10 min allocated for traffic stabilization. We run the ensemble inparallel with simulation for each scenario and compare the resulting class with the simulation output. To simplify the sim-ulation, we considered the number of vehicles that stop inside the case study area as equal to the number of vehicles leavingparking space on the same area. To compute TQL from SUMO simulation output file we developed some extra Java modules.They extract all cars that have a velocity less than 5 km/s in a certain moment of time and therefore are considered as wait-ing in queues.
5.2. Identifying the most suitable algorithm for ensemble construction and training
In order to identify the most suitable algorithm for constructing and training the ensemble of classifiers, we analyzed fourdifferent algorithms (AdaBoost Freund and Schapire, 1997, TotalBoost (Warmuth et al., 2006), LPBoost (Warmuth et al.,2006) and Bagging (Breiman, 1996). For this, we developed a Matlab program based on ClassificationEnsemble class (MatlabR2012b) to study the efficiency of each mentioned algorithms in terms of resulted classification error and resources neededto run the trained ensemble. Using the training and testing datasets presented in Table 1 we started the automated training

0 10 20 30 40 50 60 70 80 90 1000
0.1
0.2
0.3
0.4
0.5
0.6
0.7
Number of stumps
Tra
inin
g er
ror
AdaBoostTotalBoostLPBoostBagging
Fig. 7. Ensemble error during training.
Table 3Comparison between the four algorithms.
Criterion AdaBoost TotalBoost LPBoost Bagging
Percentage of classification error for the testing dataset [%] 2 0 2 4Number of trees for resulted ensemble 100 9 17 100Maximum tree depth 1 1 1 5Memory needed for resulted ensemble [KB] 275.13 42.60 63.76 393.26
Table 4Testing sub-scenarios involving high traffic.
Testing sub-scenario Mean traffic inputs Ensemble output Mean TQL [no. of cars]
Class1 Class2 Class3 Class4
WMSH {15,15,4,4,2,2,26} Class4 79 154 182 52WHNHEM {25,42,28,28,10,14,6} Class4 104 186 208 82WMNHSM {9,10,32,47,3,3,10} Class3 98 121 88 92NHEHSM {3,4,36,34,14,28,18} Class2 189 103 168 136EHSH {5,4,2,5,16,28,60} Class2 112 102 177 188NHEM {2,2,42,26,15,15,2} Class3 102 143 46 154WMEH {15,15,5,4,27,40,1} Class1 89 114 109 131EMSH {3,8,4,5,20,16,52} Class2 112 73 177 81NHSH {6,8,44,25,2,2,61} Class3 119 184 92 94WHNH {25,50,32,47,10,6,4} Class4 132 121 133 112WMNMEH {21,13,25,4,27,40,1} Class1 101 184 195 128
270 D. Pescaru, D.-I. Curiac / Transportation Research Part C 46 (2014) 261–273
process of each algorithm with 100 decision stumps. The error decrease in the training process is illustrated in Fig. 7, whilesome relevant comparative data are presented in Table 3.
The conclusion is that TotalBoost outperforms the rest of the investigated algorithms needing only 9 stumps to accuratelyclassify all entries of the training set, while LPBoost needs 17. The rest of the investigated algorithms need to train all 100stumps to get a minimum classification error. Moreover, in the testing process, the ensemble constructed by TotalBoost wasthe only one that obtained a zero error for all 45 sets of the testing dataset. By selecting TotalBoost we not only significantlydecrease the memory demand (42.6 KB for Totalboost and a minimum of 63.76 KB for the other algorithms), but also sped upthe decision-making process due to the smallest number of classifiers included in the resulted ensemble.
5.3. Methodology evaluation
As expected, the ensemble traffic state classification was 100% accurate for all 60 scenarios used in ensemble training. Italso holds its accuracy for the 45 low, medium and extreme traffic conditions used for testing.

0 200 400 600 800 1000 1200 1400 1600 1800 20000
50
100
150
200
250
300
350
time [s]
TQ
L [N
o. o
f car
s]TQL Class 1TQL Class 2TQL Class 3TQL Class 4
Fig. 8. Total queue length for WMSH sub-scenario.
0 200 400 600 800 1000 1200 1400 1600 1800 20000
50
100
150
200
250
time [s]
TQ
L [N
o. o
f car
s]
TQL Class 1TQL Class 2TQL Class 3TQL Class 4
Fig. 9. Total queue length for NHEM sub-scenario.
D. Pescaru, D.-I. Curiac / Transportation Research Part C 46 (2014) 261–273 271
To exemplify the accuracy of our presented method, between the scenarios that included extreme traffic conditions(Table 4), we will present two comparative analyses corresponding to WMSH and NHEM sub-scenarios used during the test-ing process.
Fig. 8 presents the TQL parameter evolution corresponding to all four traffic lights control classes for the WMSH sub-sce-nario involving high traffic from South, medium traffic from West and low traffic from North and East. The output of theensemble in this case was Class4, which corresponds to the lowest development of TQL in the graphic.
In the case of NHEM sub-scenario implying high traffic from North and medium from East, the ensemble output points toClass3. This option was proved to minimize the total queues length over considered area as shown in Fig. 9.
As can be seen from Fig. 8 and Fig. 9, only the optimal class of traffic lights parameters (the one chosen by EBS – Class4 forFig. 8 and Class3 for Fig. 9) assures a bounded TQL, the rest conducting to increasing queues and even to intersectionblocking.
In order to underline the impact of our method, we compared the number of sensors and their total operational cost dur-ing lifetime (includes the sensors’ purchase price and the costs for maintenance during entire sensors’ lifetime) for different

Table 5Total costs for sensors during expected sensors’ lifetime.
Method Number ofinductive loopsensors
Sensor purchase cost(Klein et al., 2006a)($)
Annualized maintenancecost/sensor (Klein et al.,2006b) ($)
Expected sensor’s life(Klein et al., 2006b)(years)
Total cost expected forsensors’ lifetime (perzone) ($)
Actuated control ofisolatedintersections
43 500 62 10 48,160
ATLC MI (Zhouet al., 2011)
86 500 62 10 96,320
Our method 12 500 62 10 13,440
272 D. Pescaru, D.-I. Curiac / Transportation Research Part C 46 (2014) 261–273
methods tackling the traffic control in the investigated zone. As depicted by Fig. 5, the area covers seven major input pointswith a total of twelve lanes, six major intersections (presented in Fig. 6) comprising 27 lanes and ten minor intersectionswith an amount of 16 lanes. In case of choosing an approach based on actuated control of isolated intersections (Liuet al., 2002), 43 inductive-loops are needed to cover all lanes entering major or minor crossroads using an inductive-loopper lane. We also investigated a more complex adaptive traffic signal control approach for multiple intersections, describedin Zhou et al. (2010, 2011), where two inductive-loops are used for each lane entering the crossroads. The results are sum-marized in Table 5 and demonstrate the efficiency of our method in terms of total costs over expected sensors’ lifetime.
6. Conclusions
This paper introduces an integrated methodology for adaptive traffic signal control within a city zone. Its efficiency isbased on three pillars: proficient traffic control decisions using an ensemble based system; efficient traffic measuring, usingsensors located only on principal roads entering the zone; and a cost-effective implementation using wireless sensor andactuator network architecture. Validation through extensive computer simulations for a group of 16 intersections in thecentral zone of Timisoara-Romania gave plausible results proving significant performances for a set of 105 different trafficscenarios. The methodology, being implemented in a generic manner, can be customized according to the needs of any givenurban area with a radius under 4 km.
References
Ahmed, M., Abdel-Aty, M., 2013. A data fusion framework for real-time risk assessment on freeways. Transp. Res. Part C 26, 203–213.Akyildiz, I.F., Kasimoglu, I.H., 2004. Wireless sensor and actor networks: research challenges. Ad Hoc Netw. 2 (4), 351–367.Almejalli, K., Dahal, K., Hossain, M.A., 2009. An intelligent multi-agent approach for road traffic management systems. IEEE Control Appl. Intell. Control,
825–830.Banfield, R.E., Hall, L.O., Bowyer, K.W., Kegelmeyer, W.P., 2007. A comparison of decision tree ensemble creation techniques. IEEE Trans. Pattern Anal. Mach.
Intell. 29 (1), 173–180.Behrisch, M., Bieker, L., Erdmann, J., Krajzewicz, D., 2011. SUMO – Simulation of Urban MObility: an overview. The Third International Conference on
Advances in System Simulation SIMUL’11, pp. 63–68.Breiman, L., 1996. Bagging predictors. Mach. Learn. 24 (2), 123–140.Chandra, A., Yao, X., 2006. Evolving hybrid ensembles of learning machines for better generalisation. Neurocomputing 69 (7), 686–700.Chow, E., Willsky, A., 1984. Analytical redundancy and the design of robust failure detection systems. IEEE Trans. Autom. Control 29 (7), 603–614.Curiac, D.I., Volosencu, C., 2012. Ensemble based sensing anomaly detection in wireless sensor networks. Expert Syst. Appl. 39 (10), 9087–9096.Diakaki, C., Papageorgiou, M., Aboudolas, K., 2002. A multivariable regulator approach to traffic-responsive network-wide signal control. Control Eng. Pract.
10 (2), 183–195.Erman, J., Mahanti, A., Arlitt, M., 2007. Byte Me: a case for byte accuracy in traffic classification. ACM SIGMETRICS MineNet Workshop, 35–38.Findler, N., Stapp, J., 1992. A distributed approach to optimized control of street traffic signals. J. Transp. Eng. 118 (1), 99–110.Freund, Y., Schapire, R.E., 1997. A decision-theoretic generalization of on-line learning and an application to Boosting. J. Comput. Syst. Sci. 55 (1), 119–139.Freund, Y., Shapire, R.E., 1996. Experiments with a new boosting algorithm. The Thirteenth International Conference on Machine Learning, pp. 148–156.Geisler, S., Quix, C., Schiffer, S., Jarke, M., 2012. An evaluation framework for traffic information systems based on data streams. Transp. Res. Part C 23, 29–55.Grove, A.J., Schuurmans, D., 1998. Boosting in the limit: Maximizing the margin of learned ensembles. The 10th Conference on Artificial Intelligence. ACM
Press, pp. 692–699.Hastie, T., Tibshirani, R., Friedman, J., 2001. The Elements of statistical learning; Data mining, Inference and Prediction. Springer Verlag, New York.Istin, C., Pescaru, D., Doboli, A., 2011. Stochastic model-based heuristics for fast field of view loss recovery in urban traffic management through networks of
video cameras. IEEE Trans. Intell. Traff. Syst. 12 (3), 895–907.Karlaftis, M.G., Vlahogianni, E.I., 2011. Statistical methods versus neural networks in transportation research: differences, similarities and some insights.
Transp. Res. Part C 19 (3), 387–399.Klein, L.A., Mills, M.K., Gibson, D.R.P., 2006a. Traffic Detector Handbook: Third Edition – Volume I. Tech. Rep. FHWA-HRT-06-108. Federal Highway
Administration, Washington, DC, USA.Klein, L.A., Mills, M.K., Gibson, D.R.P., 2006b. Traffic Detector Handbook: Third Edition – Volume II. Tech. Rep. FHWA-HRT-06-139. Federal Highway
Administration, Washington, DC, USA.Krauß, S., 1998. Microscopic Modelling of Traffic Flow: Investigation of Collision Free Vehicle Dynamics. Hauptabteilung Mobilität und Systemtechnik des
DLR Köln, ISSN 1434-845.Krauß, S., Wagner, P., Gawron, G., 1997. Metastable states in a microscopic model of traffic flow. Phys. Rev. E 55 (304), 55–97.Kullback, S., Leibler, R.A., 1951. On information and sufficiency. Ann. Math. Stat. 22 (1), 79–86.Kuncheva, L.I., Whitaker, C.J., 2003. Measures of diversity in classifier ensembles and their relationship with the ensemble accuracy. Mach. Learn. 51 (2),
181–207.

D. Pescaru, D.-I. Curiac / Transportation Research Part C 46 (2014) 261–273 273
Lee, J.H., Lee, K.M., Seong, K.A., Kim, C.B., Lee-Kwang, H., 1995. Traffic control of intersection group based on fuzzy logic. The 6th International Fuzzy SystemsAssociation World Congress, pp. 465–468.
Liu, H.L., Oh, J.S., Recker, W., 2002. Adaptive signal control system with online performance measure for a single intersection. Transp. Res. Rec. 1811 (1),131–138.
Llorca, D.F., Sotelo, M.A., Hellín, A.M., Orellana, A., Gavilan, M., Daza, I.G., Lorente, A.G., 2012. Stereo regions-of-interest selection for pedestrian protection: asurvey. Transp. Res. Part C 25, 226–237.
Madireddy, M., De Coensel, B., Can, A., Degraeuwe, B., Beusen, B., De Vlieger, I., Botteldooren, D., 2011. Assessment of the impact of speed limit reduction andtraffic signal coordination on vehicle emissions using an integrated approach. Transp. Res. Part D 16 (7), 504–508.
Nocedal, J., Wright, S., 2000. Numerical optimization. Springer Series in Operations Research and Financial Engineering. Springer.Polikar, R., 2006. Ensemble based systems in decision making. IEEE Circuits Syst. Mag., 21–45.Rakha, H., Gao, Y., 2010. Calibration of Steady-State Car-Following Models Using Macroscopic Loop Detector Data. Virginia Tech Transportation Institute,
Final Report VT-2008-01.Rezgui, A., Eltoweissy, M., 2007. Service-oriented sensor-actuator networks: promises, challenges, and the road ahead. Comput. Commun. 30, 2627–2648.Schapire, R.E., 1990. The strength of weak learnability. Mach. Learn. 5 (2), 197–227.Srinivasan, D., Choy, M.C., Cheu, R.L., 2006. Neural networks for real-time traffic signal control. IEEE Trans. Intell. Transp. Syst. 7 (3), 261–272.Sun, T., Chen, L.J., Han, C.C., Gerla, M., 2005. Reliable sensor networks for planet exploration. The IEEE International Conference on Networking, Sensing and
Control ICNSC’2005, Tucson, USA, pp. 816–821.Sutton, R.S., 1996. Generalization in reinforcement learning: successful examples using sparse coarse coding. Adv. Neural Inf. Process. Syst. 8, 1038–1044.Taale, H., Back, T., Preuß, M., Eiben, A.E., de Graaf, J.M., Schippers, C.A., 1998. Optimizing traffic light controllers by means of evolutionary algorithms.
European Congress on Intelligent Techniques and Soft Computing EUFIT’98, pp. 1730–1734.Tan, K.K., Khalid, M., Yusof, R., 1995. Intelligent traffic lights control by fuzzy logic. Malays. J. Comp. Sci. 9 (2), 29–35.Tavladakis, K., Voulgaris, N.C., 1999. Development of an autonomous adaptive traffic control system. The European Symposium on Intelligent Techniques
ESIT ’99.Thorpe, T.L., Andersson, C., 1996. Traffic Light Control using Sarsa with Three State Representations. Technical Report IBM Corporation.Vlahogianni, E.I., Karlaftis, M.G., Golias, J.C., 2005. Optimized and meta-optimized neural networks for short-term traffic flow prediction: a genetic approach.
Transp. Res. Part C 13 (3), 211–234.Warmuth, M.K., Liao, J., Ratsch, G., 2006. Totally corrective boosting algorithms that maximize the margin. The 23rd International Conference on Machine
Learning ICML’06. ACM Press, pp. 1001–1008.Warmuth, M.K., Glocer, K., Rätsch, G., 2007. Boosting Algorithms for Maximizing the Soft Margin. Advances in Neural Information Processing Systems. MIT
Press, Cambridge, pp. 1585–1592.Webster, F., 1958. Traffic signal settings. Road Research Technical Paper 39. Road Research Laboratory, HMSO, London.Xia, F., Tian, Y.C., Li, Y., Sun, Y., 2007. Wireless sensor/actuator network design for mobile control applications. MDPI Sensors 7 (10), 2157–2173.Zhou, B., Cao, J., Zeng, X., Wu, H., 2010. Adaptive traffic light control in wireless sensor network-based intelligent transportation system. The IEEE 72rd
Vehicular Technology Conference Fall (VTC Fall), Ottawa, Canada, pp. 1–5.Zhou, B., Cao, J., Wu, H., 2011. Adaptive traffic light control of multiple intersections in WSN-based ITS. The IEEE 73rd Vehicular Technology Conference (VTC
Spring), Budapest, Hungary, pp. 1–5.Zilske, M., Neumann, A., Nagel, K., 2011. OpenStreetMap For Traffic Simulation. State of the Map Europe 2011 (SOTM-EU), Vienna, pp. 126–134.