Transportation Research Division · 2018-01-09 · Seismic cone penetration test, Presumpscot clay...
394
. . . . . . . . . . . . . . . . . . . . Transportation Research Division Technical Report 15-12 CORRELATION OF ENGINEERING PARAMETERS OF THE PRESUMPSCOT FORMATION TO THE SEISMIC CONE PENETRATION TEST (SCPTU) 16 State House Station Augusta, Maine 04333
Transcript of Transportation Research Division · 2018-01-09 · Seismic cone penetration test, Presumpscot clay...
. . . . . .. . . .
. . . . . . . . . .
Transportation Research Division
Technical Report 15-12
CORRELATION OF ENGINEERING PARAMETERS OF THE PRESUMPSCOT FORMATION TO THE SEISMIC CONE PENETRATION TEST (SCPTU)
16 State House Station Augusta, Maine 04333
Technical Report Documentation Page 1. Report No. 2. 3. Recipient’s Accession No.
ME 15-12
4. Title and Subtitle 5. Report Date CORRELATION OF ENGINEERING PARAMETERS OF THE PRESUMPSCOT FORMATION TO THE SEISMIC CONE PENETRATION TEST (SCPTU)
August 2015
6.
7. Author(s) 8. Performing Organization Report No.
Mathew A. Hardison, University of Maine Melissa L. Landon, Ph. D., Associate Professor of Civil Engineering, Advisor
9. Performing Organization Name and Address 10. Project/Task/Work Unit No.
University of Maine – Advanced Structures and Composites Center
11. Contract © or Grant (G) No.
12. Sponsoring Organization Name and Address 13. Type of Report and Period Covered
Maine Department of Transportation State House Station 16 Augusta, Maine 04333
14. Sponsoring Agency Code
15. Supplementary Notes
16. Abstract (Limit 200 words)
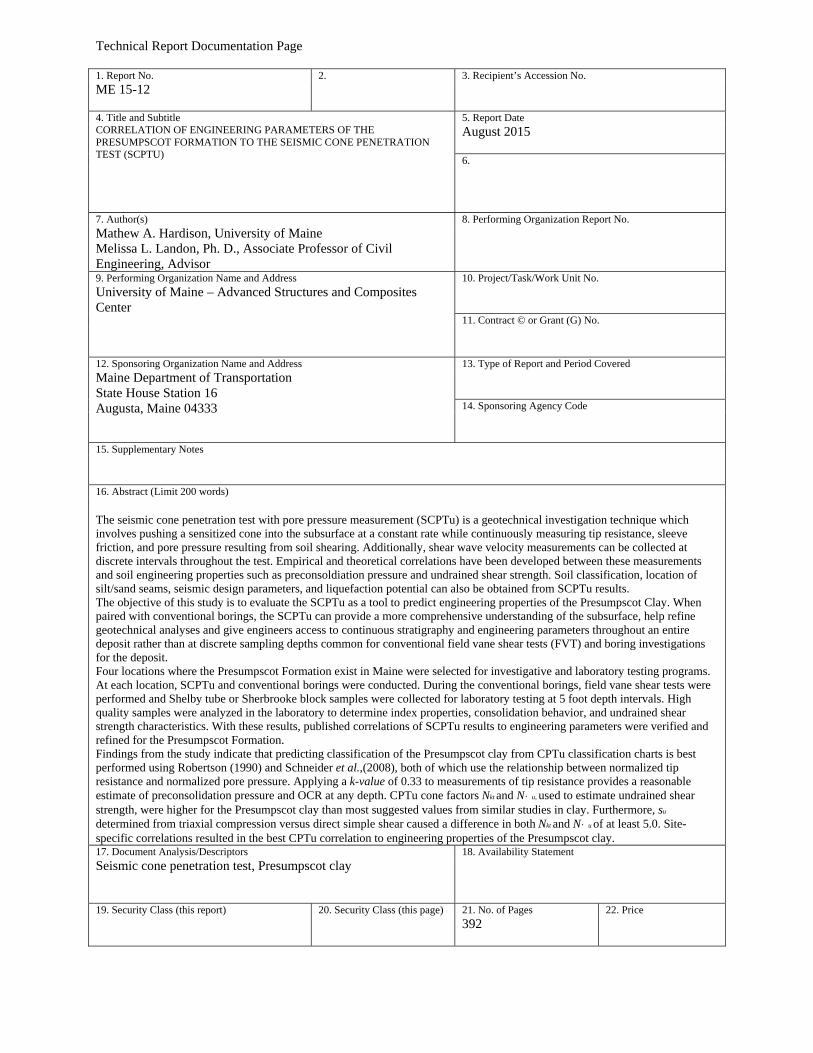
The seismic cone penetration test with pore pressure measurement (SCPTu) is a geotechnical investigation technique which involves pushing a sensitized cone into the subsurface at a constant rate while continuously measuring tip resistance, sleeve friction, and pore pressure resulting from soil shearing. Additionally, shear wave velocity measurements can be collected at discrete intervals throughout the test. Empirical and theoretical correlations have been developed between these measurements and soil engineering properties such as preconsoldiation pressure and undrained shear strength. Soil classification, location of silt/sand seams, seismic design parameters, and liquefaction potential can also be obtained from SCPTu results. The objective of this study is to evaluate the SCPTu as a tool to predict engineering properties of the Presumpscot Clay. When paired with conventional borings, the SCPTu can provide a more comprehensive understanding of the subsurface, help refine geotechnical analyses and give engineers access to continuous stratigraphy and engineering parameters throughout an entire deposit rather than at discrete sampling depths common for conventional field vane shear tests (FVT) and boring investigations for the deposit. Four locations where the Presumpscot Formation exist in Maine were selected for investigative and laboratory testing programs. At each location, SCPTu and conventional borings were conducted. During the conventional borings, field vane shear tests were performed and Shelby tube or Sherbrooke block samples were collected for laboratory testing at 5 foot depth intervals. High quality samples were analyzed in the laboratory to determine index properties, consolidation behavior, and undrained shear strength characteristics. With these results, published correlations of SCPTu results to engineering parameters were verified and refined for the Presumpscot Formation. Findings from the study indicate that predicting classification of the Presumpscot clay from CPTu classification charts is best performed using Robertson (1990) and Schneider et al.,(2008), both of which use the relationship between normalized tip resistance and normalized pore pressure. Applying a k-value of 0.33 to measurements of tip resistance provides a reasonable estimate of preconsolidation pressure and OCR at any depth. CPTu cone factors Nkt and N・u, used to estimate undrained shear strength, were higher for the Presumpscot clay than most suggested values from similar studies in clay. Furthermore, su
determined from triaxial compression versus direct simple shear caused a difference in both Nkt and N・u of at least 5.0. Site-specific correlations resulted in the best CPTu correlation to engineering properties of the Presumpscot clay. 17. Document Analysis/Descriptors 18. Availability Statement
Seismic cone penetration test, Presumpscot clay
19. Security Class (this report) 20. Security Class (this page) 21. No. of Pages 22. Price
392

CORRELATION OF ENGINEERING PARAMETERS OF THE PRESUMPSCOT
FORMATION TO THE SEISMIC CONE PENETRATION TEST (SCPTU)
By
Mathew A. Hardison
B.S. University of Maine, 2013
A THESIS
Submitted in Partial Fulfillment of the
Requirements for the Degree of
Master of Science
(in Civil Engineering)
The Graduate School
The University of Maine
August 2015
Advisory Committee:
Melissa L. Landon, Ph. D., Associate Professor of Civil Engineering, Advisor
Thomas C. Sandford, Ph.D., P.E., Associate Professor of Civil Engineering
Edwin Nagy, Ph. D., P.E., S.E., Lecturer in Civil Engineering
ii
THESIS ACCEPTANCE STATEMENT
On the behalf of the Graduate Committee for Mathew A. Hardison, I affirm that this
manuscript is the final accepted thesis. Signatures of all committee members are on file with the
Graduate School at the University of Maine, 42 Stodder Hall, Orono, Maine.
Melissa Landon, Associate Professor of Civil Engineering Date

LIBRARY RIGHTS STATEMENT
In presenting this thesis in partial fulfillment of the requirements for an advanced degree
at the University of Maine, I agree that the Library shall make it freely available for inspection. I
further agree that permission for "fair use" copying of this thesis for scholarly purposes may be
granted by the Librarian. It is understood that any copying or publication of this thesis for
financial gain shall not be allowed without my written permission.
Signature:
Date:
CORRELATION OF ENGINEERING PARAMETERS OF THE PRESUMPSCOT
FORMATION TO THE SEISMIC CONE PENETRATION TEST (SCPTU)
By Mathew A. Hardison
Thesis Advisor: Dr. Melissa Landon
An Abstract of the Thesis Presented in Partial Fulfillment of the Requirements for the
Degree of Master of Science (in Civil Engineering)
August 2015
The seismic cone penetration test with pore pressure measurement (SCPTu) is a
geotechnical investigation technique which involves pushing a sensitized cone into the subsurface
at a constant rate while continuously measuring tip resistance, sleeve friction, and pore pressure
resulting from soil shearing. Additionally, shear wave velocity measurements can be collected at
discrete intervals throughout the test. Empirical and theoretical correlations have been developed
between these measurements and soil engineering properties such as preconsoldiation pressure
and undrained shear strength. Soil classification, location of silt/sand seams, seismic design
parameters, and liquefaction potential can also be obtained from SCPTu results.
The objective of this thesis is to evaluate the SCPTu as a tool to predict engineering
properties of the Presumpscot Clay. When paired with conventional borings, the SCPTu can
provide a more comprehensive understanding of the subsurface, help refine geotechnical analyses
(i.e. settlement, slope stability), and give engineers access to continuous stratigraphy and
engineering parameters throughout an entire deposit rather than at discrete sampling depths
common for conventional field vane shear tests (FVT) and boring investigations for the deposit.
Four locations where the Presumpscot Formation exist in Maine were selected for
investigative and laboratory testing programs. At each location, SCPTu and conventional borings
were conducted. During the conventional borings, field vane shear tests were performed and
Shelby tube or Sherbrooke block samples were collected for laboratory testing at 5 foot depth
intervals. High quality samples were analyzed in the laboratory to determine index properties,
consolidation behavior, and undrained shear strength characteristics. With these results, published
correlations of SCPTu results to engineering parameters were verified and refined for the
Presumpscot Formation.
Findings from the study indicate that predicting classification of the Presumpscot clay
from CPTu classification charts is best performed using Robertson (1990) and Schneider et al.,
(2008), both of which use the relationship between normalized tip resistance and normalized pore
pressure. Applying a k-value of 0.33 to measurements of tip resistance provides a reasonable
estimate of preconsolidation pressure and OCR at any depth. There appeared to be an increasing
relationship between k-value and OCR which should be further investigated. CPTu cone factors
Nkt and Nu, used to estimate undrained shear strength, were higher for the Presumpscot clay than
most suggested values from similar studies in clay. Furthermore, su determined from triaxial
compression versus direct simple shear caused a difference in both Nkt and Nu of at least 5.0.
Site-specific correlations resulted in the best CPTu correlation to engineering properties of the
Presumpscot clay.

iii
DEDICATION
To Mom and Dad: For your patience, love, and support.

iv
ACKNOWLEDGEMENTS
Firstly, I'd like to thank Dale Peabody, Laura Krusinksi, and the Maine DOT for the
interest and funding for this project.
A great deal of the site investigation and laboratory data results were obtained by others,
or with the help of others, such as Adam Sampson, Chris Marchetti, Brad Hall, Nick Langlais,
various personnel from UMass Amherst, Haley & Aldrich, and Golder Associates, Inc.
Dr. Melissa Landon, Academic Advisor and Committee Chair, for her expertise in
laboratory procedures, data processing, data analysis, and Microsoft Word formatting. This thesis
was much more enjoyable for me having a down to earth and enthusiastic advisor.
Dr. Thomas Sandford, Committee Member, the vast knowledge you've passed onto me in
geotechnical engineering is invaluable, and I will carry it with me for my entire career. Go Sox.
The UMaine Civil & Environmental Engineering faculty members, I could not have
chosen a more intelligent, generous, and genuinely considerate group of people to learn from over
the past five and a half years.
Bill Peterlein and Craig Coolidge, for bringing me onto their consulting team and
introducing me to the geotechnical engineering profession. The exposure to a variety of projects,
especially those involving SCPTu testing, allowed me to integrate practical approaches to the
analyses in this thesis. I look forward to working with and learning from you.
Devin Carrier, Patrick McKeown, and Dan Casey, because Fogler torture is best shared
with good friends. Thanks for some of the best years of my life, I look forward to more.
v
TABLE OF CONTENTS
ACKNOWLEDGEMENTS ......................................................................................................... iv
LIST OF TABLES ......................................................................................................................... x
LIST OF FIGURES ................................................................................................................... xiii
LIST OF ABBREVIATIONS AND SYMBOLS .................................................................... xxiv
1 INTRODUCTION ................................................................................................................. 1
1.1 Objective and Approach ................................................................................................. 4
1.2 Organization ................................................................................................................... 7
1.3 Exclusions from Research .............................................................................................. 8
2 LITERATURE REVIEW ...................................................................................................... 9
2.1 Presumpscot Formation .................................................................................................. 9
2.1.1 Geotechnical Considerations ........................................................................... 12
2.1.2 Index Properties .............................................................................................. 15
2.1.3 Stress History .................................................................................................. 16
2.1.4 Undrained Shear Strength ............................................................................... 17
2.2 Cone Penetration Testing (CPTu) ................................................................................ 22
2.2.1 CPTu Use in Geotechnical Investigations in Soft Clay .................................. 25
2.2.2 Use of CPTu to Supplement Laboratory and Field Testing ............................ 25
2.2.3 Use of CPTu to Characterize Silty Clay .......................................................... 28
2.3 CPTu Correlation to Classification and Engineering Properties .................................. 29
2.3.1 Classification ................................................................................................... 29
2.3.2 Stress History .................................................................................................. 32
2.3.3 Undrained Shear Strength ............................................................................... 39
2.3.4 Seismic Measurements in CPTu testing .......................................................... 48
3 METHODS .......................................................................................................................... 51
3.1 Seismic Cone Penetration Testing ................................................................................ 52
3.1.1 Seismic Testing ............................................................................................... 56
3.1.2 CPTu Measurements ....................................................................................... 58
3.2 Field Vane Shear Testing ............................................................................................. 61
3.3 Soil Sampling ............................................................................................................... 64
3.3.1 Tube Sampling ................................................................................................ 65
vi
3.3.2 Sherbrooke Block Sampling............................................................................ 69
3.4 LABORATORY TESTING ......................................................................................... 70
3.4.1 Index Testing ................................................................................................... 70
3.4.2 Sample Preparation ......................................................................................... 72
3.4.3 Constant Rate of Strain (CRS) Consolidation Testing .................................... 73
3.4.4 Anisotropically Consolidated Undrained Triaxial (CAUC) Shear Testing ............................................................................................................. 76
3.4.5 Direct Simple Shear Testing ........................................................................... 79
3.4.6 SHANSEP Consolidated Undrained Triaxial Shear Testing .......................... 82
3.4.7 Sample Quality Assessment ............................................................................ 82
3.4.8 Shear Strength and Remolded Shear Strength Discussion .............................. 83
3.5 SCPTu Correlations...................................................................................................... 84
4 ROUTE 26/100 FALMOUTH BRIDGE ............................................................................. 85
4.1 Site Overview and Geology ......................................................................................... 85
4.1.1 Previous Geotechnical Investigations ............................................................. 87
4.1.2 Sherbrooke Block Sampling............................................................................ 88
4.2 Laboratory Characterization ......................................................................................... 89
4.2.1 Index Testing ................................................................................................... 90
4.2.2 One Dimensional Consolidation Results ......................................................... 97
4.2.3 Direct Simple Shear Undrained Strength Results ......................................... 100
4.2.4 SHANSEP Direct Simple Shear Analysis ..................................................... 105
4.2.5 Summary and Interpretation of Laboratory Results ...................................... 106
4.3 Seismic Cone Penetration Testing Results ................................................................. 108
4.3.1 Results ........................................................................................................... 108
4.3.2 Correlations to Classification ........................................................................ 112
4.3.3 Correlations to Stress History ....................................................................... 117
4.3.4 Correlation to Undrained Shear Strength ...................................................... 120
4.3.5 Seismic Properties ......................................................................................... 127
5 MARTIN'S POINT BRIDGE ............................................................................................ 130
5.1 Site Overview ............................................................................................................. 130
5.1.1 Previous Geotechnical Investigations ........................................................... 131
5.1.2 Site Geology .................................................................................................. 134
vii
5.2 Laboratory Characterization ....................................................................................... 134
5.2.1 Index Test Results ......................................................................................... 136
5.2.2 One Dimensional Consolidation Results ....................................................... 141
5.2.3 Recompression Undrained Triaxial Shear ..................................................... 144
5.2.4 SHANSEP Consolidated Undrained Triaxial Shear Results ......................... 149
5.2.5 Summary and Interpretations of Laboratory Testing Results........................ 153
5.3 Seismic Cone Penetration Testing .............................................................................. 155
5.3.1 Results ........................................................................................................... 156
5.3.2 Correlation to Classification .......................................................................... 161
5.3.3 Correlations to Stress History ....................................................................... 169
5.3.4 Correlations to Undrained Shear Strength .................................................... 174
6 ROUTE 197 BRIDGE SITE .............................................................................................. 182
6.1 Site Overview ............................................................................................................. 182
6.1.1 Geotechnical Investigation ............................................................................ 183
6.1.2 Site Geology .................................................................................................. 185
6.2 Laboratory Characterization ....................................................................................... 185
6.2.1 Index Test Results ......................................................................................... 186
6.2.2 One Dimensional Consolidation Results ....................................................... 192
6.2.3 Recompression Undrained Triaxial Shear ..................................................... 195
6.2.4 SHANSEP Consolidated Undrained Triaxial Shear ..................................... 201
6.2.5 Summary and Interpretations of Laboratory Testing Results........................ 203
6.3 Seismic Cone Penetration Results .............................................................................. 205
6.3.1 Results ........................................................................................................... 206
6.3.2 Correlations to Classification ........................................................................ 210
6.3.3 Correlations to Stress History ....................................................................... 216
6.3.4 Correlations to Shear Strength ...................................................................... 219
7 I-395 TERMINUS SITE .................................................................................................... 224
7.1 Site Overview ............................................................................................................. 224
7.1.1 Geotechnical Investigation ............................................................................ 224
7.1.2 Site Geology .................................................................................................. 226
7.2 Laboratory Characterization ....................................................................................... 228
7.2.1 Index Test Results ......................................................................................... 228
viii
7.2.2 One Dimensional Consolidation Results ....................................................... 233
7.2.3 Recompression Undrained Triaxial Shear ..................................................... 237
7.2.4 SHANSEP Consolidated Undrained Triaxial Shear Results ......................... 241
7.2.5 Summary and Interpretations of Laboratory Testing Results........................ 244
7.3 Seismic Cone Penetration Testing Results ................................................................. 246
7.3.1 Results ........................................................................................................... 247
7.3.2 Correlations to Classification ........................................................................ 251
7.3.3 Correlations to Stress History ....................................................................... 257
7.3.4 Correlations to Shear Strength ...................................................................... 259
8 COMPREHENSIVE COMPARATVE ANALYSIS ......................................................... 265
8.1 Chapter Overview ...................................................................................................... 265
8.1.1 The Route 26/100 Falmouth Bridge Site ....................................................... 265
8.1.2 Martin's Point Bridge Site ............................................................................. 266
8.1.3 The Route 197 Richmond-Dresden Bridge Site ............................................ 267
8.1.4 I-395 Terminus Site in Brewer ...................................................................... 268
8.1.5 Comparison of the Measured Soil Properties ................................................ 269
8.2 Benefits of Continuous Profiling ................................................................................ 277
8.3 CPTu Classification Correlations ............................................................................... 280
8.4 Stress History ............................................................................................................. 297
8.4.1 Saye et al. (2013) Method ............................................................................. 306
8.4.2 Stress History Sensitivity Analysis ............................................................... 308
8.4.3 Summary ....................................................................................................... 312
8.5 Undrained Shear Strength .......................................................................................... 313
8.5.1 Correlations to Nkt and Nu ............................................................................ 319
8.5.2 Been et al., (2010) Method............................................................................ 325
8.5.3 Undrained Shear Strength Sensitivity Analysis ............................................ 329
8.5.4 Shear Strength Summary ............................................................................... 337
8.6 Seismic Characteristics .............................................................................................. 340
9 CONCLUSIONS AND RECOMMENDATIONS ............................................................ 343
9.1 Non-parametric CPTu Interpretations ........................................................................ 344
9.2 Classification of Soil Type ......................................................................................... 345
9.3 CPTu Correlation to Stress History ............................................................................ 346
ix
9.4 CPTu Correlation to Undrained Shear Strength ......................................................... 348
9.5 Shear Stiffness ............................................................................................................ 353
9.6 Future Work ............................................................................................................... 354
REFERENCES .......................................................................................................................... 356
BIOGRAPHY OF THE AUTHOR ............................................................................................ 362
x
LIST OF TABLES
Table 2.1: Holtz & Kovacs clay sensitivity scale (Holtz et al., 2011). ........................................ 20
Table 2.2: Summary of SHANSEP parameters obtained from studies on Presumpscot clay and Boston Blue clay. ................................................................................... 22
Table 2.3: Saye et al., (2013) Qnc and mCPTu equations for determining OCR of clays ............... 39
Table 2.4: Suggested ranges and correlations of cone factor Nkt for studies on different types of clays (reproduced from Remai, 2013). ................................................... 42
Table 2.5: Summary of results from the Been et al. (2010) analysis on the estuarine clay. Each scenario represents a combination of selected Nkt and S value to achieve a k-value output. ...................................................................................... 44
Table 3.1: Summary of field testing, sampling, and laboratory testing of the Presumpscot clay conducted at all four sites. ............................................................................ 51
Table 4.1: Approximate distances between CPTu testing and borings conducted at the Falmouth Bridge Site. ........................................................................................... 88
Table 4.2: Summary of Atterberg Limits determined from Shelby tube and Sherbrook block samples collected at the Route 26/100 Falmouth Bridge site (reproduced from Langlais, 2011). ....................................................................... 93
Table 4.3: Summary of grain size, unit weight, and USCS determined from Shelby tube and Sherbrook block samples collected at the Route 26/100 Falmouth Bridge site (after Langlais) 2011). ........................................................................ 94
Table 4.4: Summary of fall cone undrained shear strength and sensitivity for recovered tube and block samples at the Route 26/100 Falmouth Bridge Site (after Langlais, 2011). .................................................................................................... 96
Table 4.5: Constant rate of strain (CRS) consolidation specimen properties and results from tube and Sherbrooke block samples collected at the Route 26/100 Falmouth Bridge Site (after Langlais, 2011). ....................................................... 98
Table 4.6: Summary of Direct Simple Shear Testing soil properties and pre-shear conditions of Presumpscot clay specimens from Route 26/100 Falmouth Bridge Site (after Langlais, 2011). ..................................................................... 102
Table 4.7: Summary of Direct Simple Shear Testing results for the Presumpscot clay specimens from Route 26/100 Falmouth Bridge Site (after Langlais, 2011). .... 102
Table 4.8: Summary of Nkt(DSS) and Nu(DSS) values at the Route 26/100 Bridge site. ................ 121
Table 4.9: Summary of Nkt(FVT) and Nu(FVT) values, averages, and coefficient of variations from the FVT results in the Presumpscot clay at the Route 26/100 Falmouth Bridge using SCPTu-P301 (data from Langlais, 2011). .................... 126
Table 5.1: Summary of Atterberg Limits and plasticity data for Presumpscot clay collected from Boring BB-FPPR-317 at the Martin's Point Bridge site. ............ 136
Table 5.2: Summary of grain size distribution, density, and USCS classification for Presumpscot clay collected from Boring BB-FPPR-317 at the Martin's Point Bridge site. ................................................................................................ 139
xi
Table 5.3: Summary of fall cone undrained shear strength and sensitvity for Presumpscot clay collected from Boring BB-FPPR-317 at the Martin's Point Bridge site. .... 141
Table 5.4: Constant Rate of Strain (CRS) consolidation specimen properties and results for Presumpscot clay collected from Boring BB-FPPR-317 at the Martin's Point Bridge site. ................................................................................................ 142
Table 5.5: Summary of recompression consolidated undrained triaxial shear specimen and consolidation properties for Presumpscot clay collected from Boring BB-FPPR-317 at the Martin's Point Bridge site. ................................................ 145
Table 5.6: Summary of recompression consolidated undrained triaxial shear results for Presumpscot clay collected from Boring BB-FPPR-317 at Martin's Point Bridge. ................................................................................................................ 145
Table 5.7: Summary of specimen and consolidation properties for SHANSEP undrained triaxial tests conducted on specimens from Sample 8U of Presumpscot clay collected from Boring BB-FPPR-317 at the Martin's Point Bridge site. .... 150
Table 5.8: Summary of shear properties for SHANSEP undrained triaxial tests conducted on specimens from sample 8U of Presumpscot clay collected from Boring BB-FPPR-317 at the Martin's Point Bridge site. ................................................ 150
Table 5.9: Location and profile depths of four CPT soundings at the Martin's Point Bridge site. .......................................................................................................... 156
Table 5.10: Summary of CPTu classification chart effectiveness for SCPTu 101 and CPTu 104 conducted at the Martin's Point Bridge site. ...................................... 167
Table 5.11: Comparison of OCR values between IL laboratory testing and a k-value of 0.38 applied to SCPTu101 and CPTu 10 of Presumpscot Clay at Martin's Point Bridge (some data from Golder Associates 2011a, b). ............................. 173
Table 5.12: Summary of Nkt(CAUC) and Nu(CAUC) values at the Martin’s Point Bridge site. ....... 175
Table 5.13: Distances between SCPTu 101 and field vane shear test borings of the Presumpscot clay at the Martin's Point Bridge site. ........................................... 179
Table 5.14: Summary of Nkt(FVT) and Nu(FVT) values, averages, and coefficient of variations from the FVT results in the Presumpscot clay at Martin's Point Bridge using SCPTu 101. ................................................................................... 180
Table 6.1: Summary of Atterberg Limit plasticity data for Presumpscot clay samples tested from BB-RDKR-206 conducted at the Route 197 Bridge site. ............... 190
Table 6.2: Summary of grain size distribution, density, and USCS classification for Presumpscot clay samples tested from BB-RDKR-206 conducted at the Route 197 Bridge site. ........................................................................................ 190
Table 6.3: Summary of fall cone undrained shear strength and sensitivity results for tested samples of Presumpscot clay collected from Boring BB-RDKR-206 at the Route 197 Bridge site. ........................................................................................ 191
Table 6.4: Summary of Constant Rate of Strain (CRS) consolidation specimen properties and sample quality for tested samples of Presumpscot clay collected from Boring BB-RDKR-206 at the Route 197 Bridge site. ........................................ 193
Table 6.5: Summary of pre-shear recompression anisotropically consolidated undrained triaxial shear specimen and consolidation properties from Presumpscot

xii
clay specimens collected from Boring BB-RDKR-206 at the Route 197 Bridge Site. ......................................................................................................... 196
Table 6.6: Summary of recompression consolidated undrained triaxial shear results on tested samples of Presumpscot clay collected from Boring BB-RDKR-206 at the Route 197 Bridge. ..................................................................................... 197
Table 6.7: Summary of Specimen and consolidation properties for SHANSEP undrained triaxial tests conducted on specimens from BB-RDKR-206 Sample 8U at the Route 197 Bridge site. .................................................................................. 201
Table 6.8: Summary of CPT classification chart effectiveness for SCPTu 109 at the Route 197 Bridge site. ................................................................................................... 214
Table 6.9: Summary of Nkt and Nu values at the Route 197 Bridge site. .................................. 219
Table 7.1: Summary of Atterberg Limits Plasticity Data for Presumpscot clay samples collected from Boring HB-BREW-102 at the I-395 Terminus site. ................... 230
Table 7.2: Summary of grain size distribution, density, and USCS classification for Presumpscot clay samples collected from Boring HB-BREW-102 at the I-395 Terminus site. .............................................................................................. 230
Table 7.3: Summary of fall cone undrained shear strength and sensitivity for Presumpscot clay samples collected from Boring HB-BREW-102 at the I-395 Terminus site. ..................................................................................................................... 233
Table 7.4: Summary of Constant Rate of Strain (CRS) consolidation specimen properties and sample quality for Presumpscot clay samples collected from Boring HB-BREW-102 at the I-395 Terminus site. ....................................................... 234
Table 7.5: Summary of pre-shear recompression consolidated undrained triaxial shear specimen and consolidation properties for Presumpscot clay samples collected from Boring HB-BREW-102 at the I-395 Terminus site. ................... 238
Table 7.6: Summary of recompression consolidated undrained triaxial shear results for Presumpscot clay samples collected from Boring HB-BREW-102 at the I-395 Terminus site. .............................................................................................. 238
Table 7.7: Summary of specimen and consolidation properties for SHANSEP undrained triaxial tests for Presumpscot clay samples collected from Boring HB-BREW-102 at the I-395 Terminus site. .............................................................. 242
Table 7.8: Summary of specimen and consolidation properties for SHANSEP undrained triaxial tests for Presumpscot clay samples collected from Boring HB-BREW-102 at the I-395 Terminus site. .............................................................. 242
Table 7.9: Location and depths of the six (S)CPTu soundings performed at the I-395 Terminus site (reproduced from ConeTec, 2013). ............................................. 247
Table 7.10: Summary of CPT classification chart effectiveness for the Presumpscot clay using SBT based on results from SCPTu 101 and SCPTu 106 at the I-395 Terminus site. ..................................................................................................... 256
Table 7.11: Summary of Nkt and Nu values at the I-395 Terminus site. ................................... 260
Table 8.1: Summary of the SCPTu sounding and the boring with sampling used at each for the correlations presented in this section ...................................................... 270
xiii
Table 8.2: Summary of SCPTu classfication chart effectiveness for each Presumpscot clay site based on comparison to Unified Soil Classification System determined classification. ................................................................................... 281
Table 8.3: Stress history k-values back-calculated using discrete preconsolidation pressure measurments and depth corresponding CPTu results for Presumpscot clay. ............................................................................................... 299
Table 8.4: Summary of R2 values for 'p calculated versus 'p measured using different CPTu stress history methods. ............................................................................. 307
Table 8.5: Values used in CPTu settlement analysis, reference ................................................ 309
Table 8.6: Magntidues of predicted settlement of the Presumpscot clay at the I-395 Terminus site using stress history modeled from the laboratory testing and the k-value CPTu method. .................................................................................. 310
Table 8.7: Summary of Presumpscot clay CPTu cone factor Nkt. ............................................. 314
Table 8.8: Summary of Presumpscot clay CPTu cone factor Nu. ............................................. 315
Table 8.9: Summary of k-values and Nkt values from Route 197 Bridge after the Been et al., (2010) method. ............................................................................................. 329
Table 8.10: Undrained shear strength (su) values for the 12 modeled Presumpscot layer in the sensitivty analysis. ........................................................................................ 334
Table 8.11: Factors of safety of the Presumpscot clay slope model at the Route 26/100 Falmouth Bride modeled with different undrained shear strength methods ....... 335
LIST OF FIGURES
Figure 1.1: Approximate location of the four research sites from this study relative to the mapped surficial geology of southern Maine. (reproduced from the Maine Geologic Survey, 2010). ......................................................................................... 6
Figure 2.1: Extent of the Presumpscot Formation, shown in blue, along the coast of Maine and inland along the Kennebec and Penobscot River valleys (Maine Geological Survey, 2005). .................................................................................... 10
Figure 2.2: Idealized clay platelet structure for a) flocculated and b) dispersed clay (Lambe and Whitman, 1967). ............................................................................... 14
Figure 2.3: SEM Photomicrograph of Boston Blue Clay (Terzaghi et al., 1996). ....................... 14
Figure 2.4: Slope failure modes replicated by laboratory shear strength testing of clays. (from Holtz et al., 2011). ...................................................................................... 19
Figure 2.5: Normalized undrained shear strength vs. plasticity index for triaxial compression (TC), direct simple shear (DSS), and triaxial extension (TE) testing on various silts and clays (such as Norwegian clay and Boston Blue clay, but excluding varved deposits) (from Ladd & DeGroot, 2003). .................. 19
Figure 2.6: Theoretical soil behavior around the tip of an advancing cone (from Robertson, 2012). ................................................................................................. 24
Figure 2.7: Embankment cross section of Brazilian Sergipe clay redesigned after the initial failure (Ladd and DeGroot, 2003). ............................................................. 26
xiv
Figure 2.8: Interpreted stress history and undrained shear strength of the Boston Blue Clay site using CPTu correlations (Ladd and DeGroot, 2003). ............................ 28
Figure 2.9: CPTu soil behavior type (SBT) classification charts developed by: a) Robertson (1990), b) Robertson, (1990), c) Robertson (2009), d) Schneider et al., (2008). ......................................................................................................... 31
Figure 2.10: Schneider et al., (2008) SCPTu classification chart (bold lines) overlaying the Robertson (1990) Bq-Qt classification chart comparingpredicted soil behavior type (from Schneider et al., 2008). ........................................................ 32
Figure 2.11: Relationship between normalized shear strength values and OCR of clay (note: cu = undrained shear strength) (Robertson and Campanella, 1983). .......... 34
Figure 2.12: Yield stress (i.e. preconsolidation pressure) versus net cone resistance (qnet) showing individual data points and the trendline of k = 0.33 (Mayne 2009). .................................................................................................................... 36
Figure 2.13: SHANSEP based approach for determining OCR of clays applied to the in situ data of Connecticut Valley Varved Clay (Saye et al., 2013). ........................ 37
Figure 2.14: CPTu factors Qnc and mCPTu for determining OCR of clays plotted with Atterberg Limits (Saye et al., 2013). .................................................................... 38
Figure 2.15: Computed cone factor Nkt vs. Plasticity Index (from Aas et al., 1986). .................. 41
Figure 2.16: Comparison of CPTu predicted undrained shear strength (Nkt = 12) to laboratory undrained shear strength of a soft clay site in New Orleans (Wei et al., 2010). .......................................................................................................... 43
Figure 2.17: Plot of CPTu tip resistance term on the right hand side of Equation 2.13 with the median value shown as a bold line (Been et al. 2010). ................................... 45
Figure 2.18: Computed cone factor Nu vs. Bq (from Karlsrud et al., 1996). .............................. 46
Figure 2.19: Relationship between NDu, St, and Ip (Karlsrud et al., 2005). .................................. 47
Figure 3.1: Schematic of electric peizocones used at the research site (ASTM, 2012). .............. 53
Figure 3.2: Image of a 1.4" diameter cone penetrometer showing the cone tip, pore pressure filter element, and friction sleeve (Vertek, 2014). ................................. 54
Figure 3.3: Schematic of Seismic Shear Wave Velocity testing during the CPT (from ConeTec, 2013). ................................................................................................... 57
Figure 3.4: Pore water pressure effects on cone penetrometer (Lunne et al, 1997). .................... 59
Figure 3.5: Schematic of the seismic testing during a CPT sounding using the pseudo-interval method (from Butcher, et al. 2005). ........................................................ 61
Figure 3.6: Image of field vane (left) and theoretical failure plane used for the calculation of undrained shear strength (right) (www.gouda-geo.com and www.igeotest.com). .............................................................................................. 62
Figure 3.7: Modified Shelby tube fixed piston sampler with a 5o machined cutting angle (from Landon, 2004). ........................................................................................... 66
Figure 3.8: Image of a tube sample of clay illustrating sample disturbance from drag along the inside of the tube (from Hvorslev, 1949) .............................................. 68
Figure 3.9: Sherbrooke block sampler (from Landon, 2007) ....................................................... 69

xv
Figure 3.10: Geonor fall cone apparatus (from Geonor, 2010). ................................................... 72
Figure 3.11: Schematic of sample extraction method (from Ladd and DeGroot, 2003). ............. 73
Figure 3.12: Image of the CRS chamber cell setup used for all consolidation testing and the Trautwein GeoTAC Sigma-1 Automated Load Test Frame (from Langlais, 2011). .................................................................................................... 74
Figure 4.1: Aerial image of the Route 26/100 Falmouth Bridge Site (Google Earth, 2014a). .................................................................................................................. 86
Figure 4.2: Laboratory determined results of a) natural water content, b) plasticity index, c) liquidity index, d) grain size distribution, e) index undrained and remolded shear strength from the fall cone apparatus, f) sensitivity from the fall cone results ,g) organic content, and h) unit weight (total, dry, and solids) of Presumpscot clay at the north approach of Route 26/100 Falmouth Bridge (data from Langlais, 2011). ...................................................... 92
Figure 4.3: USCS Classification chart for fine content of tube and Sherbrook block samples from the Route 26/100 Falmouth Bridge Site (from Langlais, 2011). .................................................................................................................... 95
Figure 4.4: Plasticity Index versus clay fraction for tube and Sherbrook block samples recovered at the Route 26/100 Falmouth Bridge site (from Langlais, 2011). ...... 96
Figure 4.5: Subsurface profiles of a) 'p, b) OCR, c) sample quality assessment from CRS consolidation testing on samples from the Route 26/100 Falmouth Bridge Site (after Langlais, 2011). ................................................................................... 99
Figure 4.6: Subsurface profile of a) undrained shear strength (su), b) normalized shear strength and c) sample quality assessment obtained from DSS testing of samples from the Route 26/100 Falmouth Bridge Site reproduced from (from Langlais, 2011). ........................................................................................ 104
Figure 4.7: Plot of normalized shear strength from recompression DSS tests vs. OCR for Presumpscot clay speciments collected from Route 26/100 Falmouth Bridge Site (from Langlais, 2011) ...................................................................... 106
Figure 4.8: Depth profile of (a) corrected tip resistance, (b) sleeve friction, (c) and pore pressure showing hydrostatic pore pressure from soil surface from CPT testing at Route 26/100 Bridge in Falmouth (reproduced from Langlais, 2011). .................................................................................................................. 109
Figure 4.9: Profile comparing remolded shear strength values (su(r)) obtained from nearby field vane test results and fall cone tests with sleeve friction from SCPTu-P301 and –P305(data from Langlais 2011). ....................................................... 111
Figure 4.10: Profile of a) normalized tip resistance (Qt), b) sleeve friction ratio (Fr), and c) normalized pore pressure ratio (Bq) with depth for SCPTu-P301, P302, and P305 at Route 26/100 Falmouth Bridge (data from Langlais, 2011). .......... 113
Figure 4.11 Soil classification results from SCPTuP301 comparing laboratory-determined USCS classification to classification charts using a) Qt vs. Fr (Robertson 1990), b) Qt vs. Bq (Robertson 1990), c) Qt vs. Fr (Robertson 2009), d) Qt vs. Bq (Schneider et al., 2008) at the Route 26/100 Falmouth Bridge (data from Langlais, 2011). ......................................................................................... 115
xvi
Figure 4.12: Soil classification results from SCPTuP305 comparing laboratory-determined USCS classification to classification charts using a) Qt vs. Fr (Robertson 1990), b) Qt vs. Bq (Robertson 1990), c) Qt vs. Fr (Robertson 2009), d) Qt vs. Bq (Schneider et al., 2008) at the Route 26/100 Falmouth Bridge (data from Langlais, 2011). .................................................................... 116
Figure 4.13: Subsurface profiles of a) k values determined from SCPTu-P301, SCPTu-P302, and SCPTu-P305, and b) preconsolidation pressure estimated using average, minimum, and maximum k values from SCPTu-P301 compared to the laboratory-determine values at the Route 26/100 Falmouth Bridge site (after Langlais, 2011). .................................................................................. 119
Figure 4.14: Subsurface profiles of Nkt(DSS), Nke(DSS), and Nu(DSS) correlated from SCPTu-P301, P302, and P305 with su from DSS testing for Presumpscot clay at Route 26/100 Falmouth Bridge (data from Langlais, 2011). ............................. 122
Figure 4.15: Profile of undrained shear strength of Presumpscot clay at Route 26/100 Falmouth Bridge site using empirical cone factors a) Nkt(DSS) and b) Nu(DSS) applied to SCPTu-P301. Undrained shear strength determined from DSS testing is shown as the gray circles (data from Langlais, 2011). ....... 124
Figure 4.16: Subsurface profiles of a) Nkt(FVT), b) Nu(FVT), and v) Nke(FVT) correlated from (S)CPTu-P301 and field vane shear testing (FVT) from borings within 200 feet of SCPTu-P301(data from Langlais, 2011). ................................................ 126
Figure 4.17: a) Shear wave velocity (Vs), b) small-strain shear modulus (Go), and c) rigidity index (Ir) determined from SCPTu-P301, -P302, and –P305 conducted in Presumpscot clay at the Route 26/100 Falmouth Bridge (data from Langlais, 2011). ......................................................................................... 128
Figure 5.1: Location of Martin's Point Bridge between Portland and Falmouth, Maine at the mouth of the Preusmpcot River and Casco Bay (Google Earth 2013a). ...... 130
Figure 5.2: Martin's Point Bridge between Portland and Falmouth, Maine at the mouth of the Presumpscot River and Casco Bay during low tide (from MaineDOT 2013). .................................................................................................................. 131
Figure 5.3: Aerial view of boring and CPTu locations along the a) entire length of the bridge b) Falmouth side bridge approach for the newly constructed Martin's Point Bridge (Google Earth, 2015). ...................................................... 133
Figure 5.4: Interpreted subsurface profile from borings (Figure 5.3) conducted along the new Martin's Point Bridge alignment. ................................................................ 135
Figure 5.5: Aerial photograph of the Martin's Point Bridge site illustrating the effect of the Presumpscot River on the subsurface material (Googe Earth, 2014). .......... 135
Figure 5.6 Laboratory test specimen use for BB-FPPR-317 3 in. Shelby tubes 1U - 6U from the Martin's Point Bridge site. ................................................................... 137
Figure 5.7: Laboratory test specimen use for BB-FPPR-317 3 in. Shelby tubes 7U - 13U from the Martin's Point Bridge site. ................................................................... 137
Figure 5.8: Laboratory determined results of a) Atterberg limits and natural water content, b) plasticity index, c) liquidity index, d) grain size distribution, e) index (su) and remolded undrained shear strength (su(r)) from the fall cone, f) sensitivity from the fall cone, g) organic content, and h) unit weight
xvii
(total, dry, solids) of Presumpscot clay collected from the Martin's Point Bridge site. .......................................................................................................... 138
Figure 5.9: USCS Classification Charts using Atterberg Limits for Presumpscot clay collected from Boring BB-FPPR-317 at the Martin's Point Bridge site. ............ 140
Figure 5.10: Subsurface profiles of a) 'p, b) OCR, c) initial void ratio, d) sample quality assessment from CRS consolidation testing for Presumpscot clay collected from Boring BB-FPPR-317 at the Martin's Point Bridge site. ........................... 143
Figure 5.11: Subsurface profile of a) undrained shear strength (su), b) remolded undrained shear strength and c) and sensitivity from laboratory testing on undisturbed samples (BB-317) and field vane shear testing (other borings) at the Martin's Point Bridge site. .................................................................................. 146
Figure 5.12: Recompression Consolidated Undrained Triaxial (CAUC) normalized effective stress paths for specimens from BB-FPPR-317 from the Martin's Point Bridge site. ................................................................................................ 148
Figure 5.13: Normalized effective stress paths for SHANSEP Triaxial tests conducted on specimens from Sample 8U of Presumpscot clay collected from Boring BB-FPPR-317 at the Martin's Point Bridge site. ................................................ 151
Figure 5.14: Comparison of normalized undrained shear strength from recompression and SHANSEP triaxial compression tests of Presumpscot clay collected from Boring BB-FPPR-317 at the Martin's Point Bridge site. .................................... 152
Figure 5.15: Comparison of undrained shear strength and normalized undrained shear strength measured from triaxial recompression and SHANSEP compression (S = 0.28, m = 0.83) tests and best-fit SHANSEP estimates (S = 0.25, m = 0.75) for the Martin's Point Bridge Presumpscot clay. ................... 153
Figure 5.16: Depth profile of (a) corrected tip resistance, (b) sleeve friction, (c) and pore pressure showing hydrostatic pore pressure from soil surface from CPT testing of Presumpscot clay at the Martin's Point Bridge site. ........................... 157
Figure 5.17: Profile comparing remolded shear strength values (su(r)) obtained from Boring 311, 312, and 316 field vane test results and fall cone tests from BB-FPPR-317 with sleeve friction from SCPTu 101 from the Martin's Point Bridge site. ................................................................................................ 159
Figure 5.18: Depth profile of a) shear wave velocity (Vs), b) small strain shear modulus (G0) and Rigidity index (Ir) for SCPTu101 and 103 conducted at the Martin's Point Bridge site. .................................................................................. 161
Figure 5.19: Profile of a) normalized tip resistance (Qt), b) sleeve friction ration (Fr), and c) normalized pore pressure (Bq) collected from SCPTu 101, 103, and 104 at the Martin's Point Bridge site. ........................................................................ 163
Figure 5.20: Soil classification results comparing laboratory-determined USCS classification to classification charts using a) Qt vs. Fr (Robertson 1990), b) Qt vs. Bq (Robertson 1990), c) Qt vs. Fr (Robertson 2009), d) Qt vs. Bq (Schneider et al., 2008) from SCPTu 101 conducted at the Martin's Point Bridge site. .......................................................................................................... 164
Figure 5.21: Soil classification results comparing laboratory-determined USCS classification to classification charts using a) Qt vs. Fr (Robertson 1990), b)
xviii
Qt vs. Bq (Robertson 1990), c) Qt vs. Fr (Robertson 2009), d) Qt vs. Bq (Schneider et al., 2008) from CPTu 104 conducted at the Martin's Point Bridge site. .......................................................................................................... 165
Figure 5.22: Comparison of laboratory and field determined soil properties to plotted SBT trends for a) OCR (Robertson 1990), b) normalized remolded undrained shear strength (Robertson 2009), and c) Normalized remolded undrained shear strength with lower data range (Robertson 2009) from SCPTu 101 at the Martin's Point Bridge site. ..................................................... 166
Figure 5.23: Subsurface profile showing (a) the CPTu correlated preconsolidation stress k-value and (b) preconsolidation pressure correlated from SCPTu 101 based on the range of correlated values from the Martin's Point Bridge site. .... 170
Figure 5.24: Profile of a) overconsolidation ratio and b) sample quality for the consolidation samples collected and tested by Golder Associates in 2011 at Martin's Point Bridge. ......................................................................................... 172
Figure 5.25 Subsurface profiles of Nkt(CAUC), Nke(CAUC), and Nu(CAUC) correlated from (S)CPTu 101,103, and 104 with su from triaxial CAUC testing of Presumpscot clay at the Martin's Point Bridge site. ........................................... 175
Figure 5.26: Profile of undrained shear strength of Presumpscot clay at Martin's Point Bridge using empirical cone factors Nkt(CAUC) and Nu(CAUC) applied to SCPTu 101. ........................................................................................................ 177
Figure 5.27: Subsurface profiles of Nkt(FVT), Nu(FVT), and Nke(FVT) correlated from SCPTu-101 and field vane shear testing (FVT) from borings conducted in Presumpscot clay at Martin's Point Bridge. ........................................................ 180
Figure 6.1: Aerial image of the Richmond Dresden Bridge site Route 197 Bridge site showing recent construction of the new bridge on the north side of the existing bridge stucture (Google Earth, 2014).................................................... 182
Figure 6.2: Image of the new bridge during construction in the foreground with the old bridge in the background (centralmaine.com, 2014) .......................................... 183
Figure 6.3: Interpretive subsurface profile at the Route 197 Bridge showing the approximate locationf of Boring BB-RDKR-206 and SCPTu 109 (after MaineDOT, 2011). Note: the elevation in feet is shown on the left of the figure and the station in feet is shown on the bottom. ........................................ 184
Figure 6.4: Sample usage for laboratory testing of the collected tube samples of Presumpscot clay at the Route 197 Bridge site. ................................................. 187
Figure 6.5: Laboratory determined results of a) natural water content, b) plasticity index, c) liquidity index, d) grain size distribution, e) index undrained and remolded shear strength from the fall cone apparatus, f) sensitivity from fall cone results ,g) organic content, and h) unit weight (total, dry, and solids) of Presumpscot clay from BB-RDKR-206 performed at the Route 197 Bridge site. ................................................................................................... 189
Figure 6.6: Plasticity data from laboratory testing of Presumpscot clay samples collected from Boring BB-RDKR-206 plotted on USCS Classification Charts at the Route 197 Bridge site. ........................................................................................ 191
xix
Figure 6.7: Subsurface profiles of a) 'p, b) OCR, c) initial void ratio, and d) sample quality assessment from CRS consolidation tests on samples of Presumpscot clay collected from Boring BB-RDKR-206 at the Route 197 Bridge site. .......................................................................................................... 194
Figure 6.8: Subsurface profile of a) undrained shear strength (su), b) normalized shear strength and c) NGI sample quality assessment obtained from CAUC triaxial testing on samples of Presumpscot clay collected from Boring BB-RDKR-206 at the Route 197 Bridge. ................................................................. 197
Figure 6.9: Subsurface profile of a) undrained shear strength (su), b) remolded undrained shear strength and c) and sensitivity from laboratory testing on speicmens of Presumpscot clay collected from Boring BB-RDKR-206 at the Route 197 Bridge site. ................................................................................................... 198
Figure 6.10: Recompression Consolidated Undrained Triaxial (CAUC) Normalized Effective Stress Paths for specimens from BB-RDKR-206 at the Route 197 Bride site............................................................................................................. 200
Figure 6.11: SHANSEP Recompression Consolidated Undrained Triaxial (CAUC) Normalized Effective Stress Paths for Presumpscot clay specimens from boring BB-RDKR-206 8U conducted at the Route 197 Bridge. ........................ 202
Figure 6.12: Comparison of normalized undrained shear strength from recompression and SHANSEP triaxial compression tests for Presumpscot clay specimens from boring BB-RDKR-206 8U conducted at the Route 197 Bridge site. ......... 203
Figure 6.13: Depth profile of (a) corrected tip resistance, (b) sleeve friction, (c) and pore pressure showing hydrostatic pore pressure from SCPTu 109 conducted at the Route 197 Bridge. ......................................................................................... 207
Figure 6.14:Profile comparing remolded shear strength values (su(r)) obtained from Boring 104, 105B, and 207 field vane test results and fall cone tests from BB-RDKR-206 with sleeve friction from SCPTu 109 at the Route 197 Bridge site. ..................................................................................................................... 208
Figure 6.15: Profile of a) shear wave velocity (Vs), b) small strain shear modulus (G0), and c) rigidity index (Ir) for SCPTu 109 at the Route 197 Bridge site. ............. 210
Figure 6.16: Profile of a) normalized tip resistance (Qt), b) sleeve friction ratio (Fr), and c) Normalized Pore Pressure (Bq) from SCPTu 109 conducted in Presumpscot clay at the Route 197 Bridge. ........................................................ 212
Figure 6.17: Soil classification results from SCPTu109 comparing laboratroy-determined USCS classification to classification charts using a) Qt vs. Fr (Robertson 1990), b) Qt vs. Bq (Robertson 1990), c) Qt vs. Fr (Robertson 2009), d) Qt vs. Bq (Schneider et al., 2008). ........................................................................... 213
Figure 6.18 Soil trend results from SCPTu109 comparing laboratory and field determined soil properties to plotted trends on chart for a) OCR (Robertson 1990), b) Normalized remolded undrained shear strength (Robertson 2009). ................... 215
Figure 6.19: Subsurface profile of a) k-value, b) estimated ’p from applying min, max, and average k-values to the entire SCPTu 109 qnet profile compared to laboratory-determine ’p of Presumpscot clay at the Route 197 Bridge site. ..... 218

xx
Figure 6.20 : Subsurface profiles of Nkt, Nu, and Nke correlated from SCPTu109 with su from CAUC triaxial and field vane testing of Presumpscot clay at the Route 197 Bridge site. ........................................................................................ 220
Figure 6.21: Profiles of undrained shear strength using Nkt(CAUC) and Nu(CAUC) values as shown on the figure applied to SCPTu 109, compared to the laboratory-determined undrained shear stength of Presumpscot clay at the Route 197 Bridge site. .......................................................................................................... 222
Figure 7.1: Image of the I-395 Terminus site in Brewer, Maine (Google Earth, 2014b). ......... 224
Figure 7.2: Boring and CPTu sounding locations at the 395 Terminus site (Google Earth, 2014b). ................................................................................................................ 226
Figure 7.3: Laboratory specimen use for HB-BREW-102 3" Shelby tubes 1U through 9U. .... 229
Figure 7.4: Laboratory determined results of a) natural water content, b) plasticity index, c) liquidity index, d) grain size distribution, e) index undrained and remolded shear strength from the fall cone, f) sensitivity from fall cone results ,g) organic content, and h) unit weight (total, dry, and solids) for Presumpscot clay samples collected from Boring HB-BREW-102 at the I-395 Terminus site. .............................................................................................. 231
Figure 7.5: USCS Classification Charts using Atterberg Limits for Presumpscot clay samples collected from Boring HB-BREW-102 at the I-395 Terminus site. ..... 232
Figure 7.6: Subsurface profiles of a) 'p, b) OCR, c) sample quality assessment from CRS consolidation testing for Presumpscot clay samples collected from Boring HB-BREW-102 at the I-395 Terminus site. ....................................................... 235
Figure 7.7: Subsurface profile of a) undrained shear strength (su), b) normalized shear strength and c) NGI sample quality assessment obtained from CAUC triaxial testing for Presumpscot clay samples collected from Boring HB-BREW-102 at the I-395 Terminus site. .............................................................. 239
Figure 7.8: Recompression consolidated undrained triaxial (CAUC) normalized effective stress paths for Presumpscot clay samples collected from Boring HB-BREW-102 at the I-395 Terminus site. .............................................................. 241
Figure 7.9: SHANSEP recompression consolidated undrained triaxial (CAUC) normalized effective stress paths for Presumpscot clay sample 8U from Boring HB-BREW-102 conducted at the I-395 Terminus site. .......................... 243
Figure 7.10: Comparison of normalized undrained shear strength from recompression and SHANSEP triaxial compression tests for Presumpscot clay specimens from boring HB-BREW-102 6U conducted at the I-395 Terminus site. ............ 244
Figure 7.11: Measured values of (a) corrected tip resistance, (b) sleeve friction, and (c) pore pressure from SCPTu 101, CPTu 102, and SCPTu 106 performed at the I-395 Terminus site. ...................................................................................... 248
Figure 7.12: Profile comparing remolded shear strength values (su(r)) obtained from HB-BREW-101 field vane tests and fall cone tests from HB-BREW-102 samples with sleeve friction from SCPTu 101 at the I-395 Terminus site. ........ 249
Figure 7.13: Depth profile of shear wave velocity (Vs), shear modulus (G0), and rigidity index (Ir) for SCPTu101 and -106 at the I-395 Terminus site. ........................... 251
xxi
Figure 7.14: Measurements of a) normalized tip resistance (Qt), b) sleeve friction ratio (Fr), and c) normalized pore pressure (Bq) for SCPTu 101, 102, and 106 conducted at the I-395 Terminus site. ................................................................ 252
Figure 7.15: Soil classification results from SCPTu 101 at the I-395 Terminus site comparing laboratory-determined USCS classification to classification charts using a) Qt vs. Fr (Robertson 1990), b) Qt vs. Bq (Robertson 1990), c) Qt vs. Fr (Robertson 2009), d) Qt vs. Bq (Schneider et al., 2008) ................... 254
Figure 7.16: Soil classification results from SCPTu 106 at the I-395 Terminus site comparing laboratory-determined USCS classification to classification charts using a) Qt vs. Fr (Robertson 1990), b) Qt vs. Bq (Robertson 1990), c) Qt vs. Fr (Robertson 2009), d) Qt vs. Bq (Schneider et al., 2008). .................. 255
Figure 7.17: Subsurface profiles of a) stress history k values determined from SCPTu 101, CPTu 102, and SCPTu 106, b) ’p using minimum, maximum, and average k-values from SCPTu 106 for (S)CPTu testing at the I-395 Terminus site. ..................................................................................................... 258
Figure 7.18: Subsurface profiles of Nkt(CAUC and FVT), Nke(CAUC and FVT), and Nu(CAUC and FVT) correlated from (S)CPTu 101,102, and 106 with su from triaxial CAUC testing and field vane shear testing (FVT) of Presumpscot clay at the I-395 Terminus site. ..................................................................................................... 261
Figure 7.19: Subsurface profile of undrained shear strength (su) with depth using the Nkt
(CAUC) and Nu(CAUC) values from SCPTu 106 applied to measurements from SCPTu 106 and compared to the laboratory-determined su of Presumpscot clay samples from the I-395 Terminus site. ....................................................... 263
Figure 8.1: Laboratory test results of overconsolidation ratio (OCR), undrained shear strength (su) from triaxial shear, and sensitivity (St) of Presumpscot clay collected at the four research sites. ..................................................................... 270
Figure 8.2: Laboratory test results of overconsolidation ratio undrained shear strength (su) shown as the gray circles compared to field vane shear test results (FVT) at a) Route 26/100 Bridge b) Martin's Point Bridge c) Route 197 Bride and d) I-395 Terminus site. ....................................................................................... 271
Figure 8.3: CPTu measurements of corrected a) tip resistance (qt), b) sleeve friction (fs), and c) pore water pressure (u2) collected in the Presumpscot clay deposits at the four research sites. .................................................................................... 275
Figure 8.4: CPTu measurements of a) normalized tip resistance (Qt), b) sleeve friction ratio (Fr), and c) normalized pore water pressure (Bq) in the Presumpscot clay deposits at the four research sites. .............................................................. 276
Figure 8.5: CPTu measurements compared to measured values of undrained shear strength and OCR of Presumpscot clay. ............................................................. 277
Figure 8.6: Schematic illustrating discrete sampling locations at 2 foot and 5 foot intervals within the subsurface of the Route 197 Bridge alongside the CPTu profile of corrected tip resistance. ............................................................ 279
Figure 8.7: Comparison of CPTu profile collected at the Route 197 Bridge (modification of Figure 6.13, showing the soil layers by color) to the corresponding normalized measurement plotted on SBT classification charts. ......................... 283
xxii
Figure 8.8: CPTu normalized data from all four Presumpscot clay research sites plotted with corresponding USCS classification of undisturbed soil samples. Note: CH = fat clay, CL = lean clay, CL-ML = silty clay, and ML = silt. ................... 287
Figure 8.9: Comparison of Robertson (1990) a) Qt-Fr and b) Qt-Bq classification illustrating difference in predicted soil behavior type for CPTu data from the Route 197 Bridge site. .................................................................................. 289
Figure 8.10: Comparison of CPTu data of Presumpscot clay from the four research sites plotted on SBT classification charts in accordance with silt content of the undisturbed soil samples. A and b show the data from all four sites and c and d show the results from only Route 26/100 Bridge and Route 197 sites (senstive deposits). ............................................................................................. 291
Figure 8.11: Evaluation of the predicted engineering properties from the Robertson (1990) and Robertson (2009) SBT classification charts of the Presumpscot clay. Values of OCR, St, and normalized remolded undrained shear strength (su(r)/'vo) were measured in the laboratory on high-quality samples. .............................................................................................................. 295
Figure 8.12 Evaluation of the predicted engineering properties from the Robertson (1990) and Schneider et al., (2008) - Bq SBT classification charts of the Presumpscot clay. Values of OCR, and St,were measured in the laboratory on high-quality samples. ..................................................................................... 296
Figure 8.13: Overconsolidation ratio (OCR) and preconsolidation pressure estimated using a k-value of 0.33 as suggested by Mayne (2014). ..................................... 301
Figure 8.14: CPTu k-value versus OCR for the Presumpscot clay. ........................................... 302
Figure 8.15: Esitmates of 'p versus depth for a) Route 26/100 Bridge b) Martin's Point Bridge c) Route 197 Bridge and d) I-395 Terminus using average and ±1 standard deviation for each site. ......................................................................... 304
Figure 8.16: Analysis of OCR and Bq relationship for the Presumpscot clay research sites. .... 306
Figure 8.17: Analysis of the Saye et al., (2013) method using Presumpscot clay data. ............ 307
Figure 8.18: Nkt and Nu factors determined from laboratory testing and field vane shear testing (FVT) at all four Presumpscot clay research sites. ................................. 318
Figure 8.19: CPTu cone factor Nkt(CAUC or DSS) for the Presumpscot clay correlated to a) overconsolidation ratio (OCR), b) Plasticiy Index (PI), c) undrained shear strength (su) and d) normalized pore pressure (Bq). ............................................ 322
Figure 8.20: CPTu cone factor Nu(CAUC or DSS) for the Presumpscot clay correlated to a) overconsolidation ratio (OCR), b) Plasticiy Index (PI), c) undrained shear strength (su) and d) normalized pore pressure (Bq). ............................................ 323
Figure 8.21: Presumpscot clay CPTu data compared to ranges from a) Aas et al., (1986) b) Karlsrud et al., (1996), and c) Lunne et al., (1985) and Karlsrud (1996). ...... 324
Figure 8.22: Undrained shear strength coefficient Nu vs. OCR, separating data points of high sensitivity and low sensitivity for Presumpscot clay. ................................. 326
Figure 8.23: Nkt and k-value estimated from the Been et al., (2013) method compared to actual values back-calculated from laboratory testing of Presumpscot clay ...... 328

xxiii
Figure 8.24: Profile of undraind shear strength (su) using the site-specific CPTu Nkt values compared to the laboratory determine su for a) Route 26/100 Bridge, b) Martin's Point Bridge, c) Route 197 Bridge, and d) I-395 Terminus ............................................................................................................. 332
Figure 8.25: Profile of undraind shear strength (su) using the site-specific CPTu Nu values compared to the laboratory determine su for a) Route 26/100 Bridge, b) Martin's Point Bridge, c) Route 197 Bridge, and d) I-395 Terminus. ............................................................................................................ 333
Figure 8.26: Slope stability results of Presumpscot clay at the Route 26/100 Famlouth Bridge site using direct simple shear (DSS) and field vane shear testing (FVT) su models. ................................................................................................ 336
Figure 8.27: Slope stability results of Presumpscot clay at the Route 26/100 Famlouth Bridge site using CPTu cone factors Nkt and Nu undrained shear strength models ................................................................................................................ 336
Figure 8.28 Measurements of a) Shear wave velocity (Vs) b) Small strain shear modulus (G0) and c) Rigidity index (Ir) in the Presumpscot clay. ..................................... 341
Figure 8.29: a) Go vs. OCR and b) G0 vs. void ratio (e0) for the Presumpscot clay research sites. .................................................................................................................... 342
xxiv
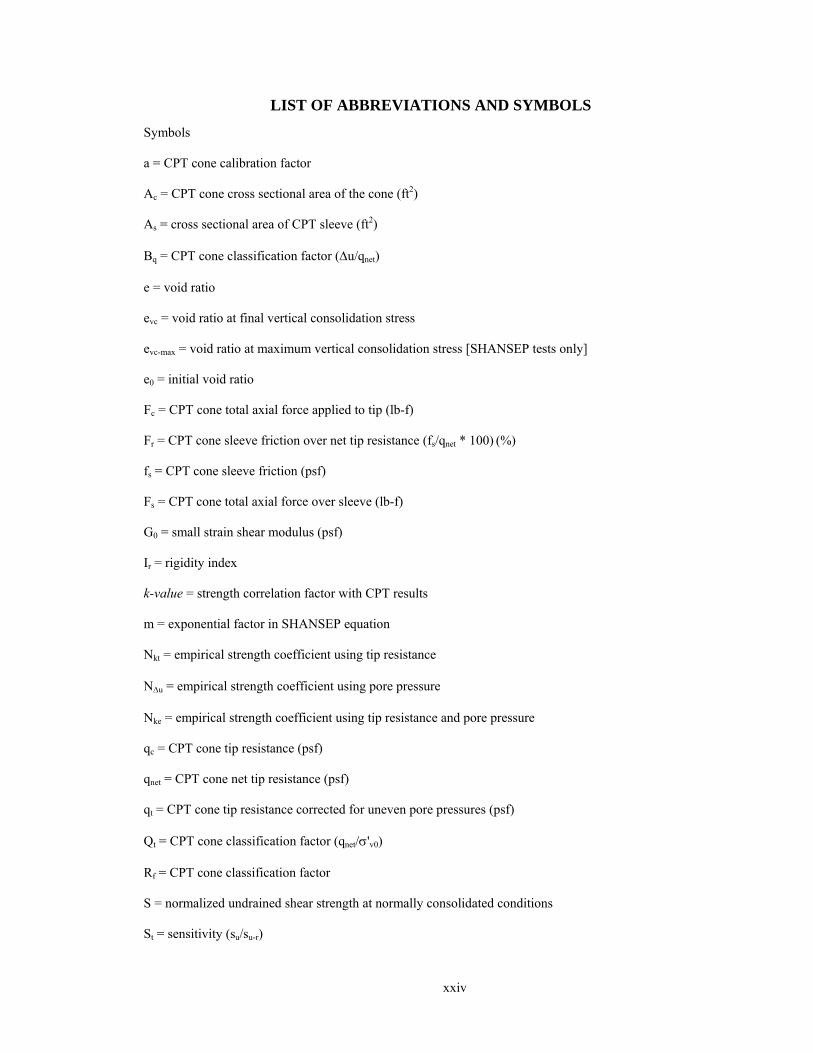
LIST OF ABBREVIATIONS AND SYMBOLS
Symbols
a = CPT cone calibration factor
Ac = CPT cone cross sectional area of the cone (ft2)
As = cross sectional area of CPT sleeve (ft2)
Bq = CPT cone classification factor (u/qnet)
e = void ratio
evc = void ratio at final vertical consolidation stress
evc-max = void ratio at maximum vertical consolidation stress [SHANSEP tests only]
e0 = initial void ratio
Fc = CPT cone total axial force applied to tip (lb-f)
Fr = CPT cone sleeve friction over net tip resistance (fs/qnet * 100) (%)
fs = CPT cone sleeve friction (psf)
Fs = CPT cone total axial force over sleeve (lb-f)
G0 = small strain shear modulus (psf)
Ir = rigidity index
k-value = strength correlation factor with CPT results
m = exponential factor in SHANSEP equation
Nkt = empirical strength coefficient using tip resistance
Nu = empirical strength coefficient using pore pressure
Nke = empirical strength coefficient using tip resistance and pore pressure
qc = CPT cone tip resistance (psf)
qnet = CPT cone net tip resistance (psf)
qt = CPT cone tip resistance corrected for uneven pore pressures (psf)
Qt = CPT cone classification factor (qnet/'v0)
Rf = CPT cone classification factor
S = normalized undrained shear strength at normally consolidated conditions
St = sensitivity (su/su-r)

xxv
su = undrained shear strength for intact soil (psf)
su-r = undrained shear strength for remolded soil (psf)
u1 = CPT cone penetrometer pore pressure measurement at apex of cone (psf)
u2 = CPT cone penetrometer pore pressure measurement at shoulder of cone (psf)
u3 = CPT cone penetrometer pore pressure measurement behind friction sleeve (psf)
ub = base pore pressure measured during CRS consolidation (psf)
U = CPT cone classification factor
Vs = shear wave velocity (ft/s)
wn = natural water content (%)
ΔL = horizontal displacement (in)
u = difference in u2 measured and hydrostatic pore pressure (psf)
uf = change in pore pressure from the start of shear to failure (psf)
εvc = vertical consolidation strain (%)
= shear strain (= horizontal displacement/specimen height) (%)
f = shear strain at failure (%)
γt = total unit weight (pcf)
γd = dry unit weight (pcf)
v = total vertical stress (psf)
σ'vc = vertical consolidation effective stress (psf)
σ'vc-max = maximum vertical consolidation effective stress (psf) [SHANSEP OCR >]
σ'vf = vertical effective stress at failure (psf)
σ'v0 = estimated vertical consolidation stress (psf)
qf = shear stress (psf)
Acronyms
ASCE = American Society of Civil Engineers
bgs = below ground surface
BP = back pressure

xxvi
CAUC = consolidated anisotropic undrained compression [laboratory strength method]
CIUC = consolidated isotropic undrained compression [laboratory strength method]
CPT = cone penetrometer testing
CPTu = cone penetrometer testing with pore pressure measurement
CRS = constant rate of strain [laboratory consolidation method]
MaineDOT = Maine Department of Transportation
DSS = direct simple shear [laboratory strength method]
FV = field vane shear test
IBC = International Building Code
IL = incremental load [laboratory consolidation method]
LI = liquidity index (= [wn-LL]/PI)
LIR = load increment ratio (= [(i+1)-i]/i)
LL = liquid limit
MSL = mean sea level
PI = plasticity index (= LL-PL)
PL = plastic limit
OCR = overconsolidation ratio (= 'vc-max/'vc)
SCPTu = cone penetrometer testing with pore pressure measurement and seismic testing
SHANSEP = stress history and normalized soil engineering parameters [analysis]
SPT = standard penetration testing
TX = triaxial testing
ybp = years before presents
Units
feet = ft (')
inches = in (")
ksf = kips per square foot
pcf = pounds per cubic foot

xxvii
psf = pounds per square foot
tsf = tons per square foot

1
1 INTRODUCTION
The Presumpscot Formation is a glacial marine sediment deposit located along the coast
of Maine and inland along the Kennebec and Penobscot River valleys. The deposit consists of
predominantly soft, silty clay with some interbedded silt and fine sand seams. Thickness of
Presumpscot Formation (also known as "Presumpscot clay") deposits can vary from a couple of
feet to over 200 feet (Thompson, 1987), generally increasing in depth closer to the coast. The
Presumpscot clay is a challenging material with regards to characterization and design, as
composition and engineering properties vary widely on both a local and regional scale.
Geotechnical investigations of the Presumpscot Formation traditionally involve the
drilling of investigative borings, performing discrete disturbed sampling to obtain samples for
index testing and classification, and conducting field vane shear tests (FVT) to identify in situ
undrained shear strength at discrete depths. Additionally, when budget permits, undisturbed
Shelby tube samples may be collected and tested in the laboratory to obtain compressibility,
stress history, and strength. These tests are typically time-consuming and expensive, and the
results from a few tests are assumed to apply over a broad portion of the deposit's lateral extent
and depth. These methods have been used with success, however, assumptions (e.g., distance
between drainage layers, approximate overconsolidation ratios) and empirical relationships (e.g.,
between index properties and compressibility) must sometimes be made to complete the design
process. Thus routine, and often successful, geotechnical designs can rely heavily on past
experience and the understanding of nearby conditions at similar Presumpscot clay sites.
The variability of the Presumpscot with depth and lateral extent creates a need for
engineers to identify this variability quickly and use the information to interpret geotechnical
properties as well. Seismic cone penetration testing with pore pressure measurements (SCPTu)
can serve as a tool to fill in the gaps of discrete geotechnical testing and provide complete profiles
2
of soil behavior. There are many applications of the tool which can be employed throughout any
stage of a geotechnical investigation. The SCPTu provides quick profiling of the subsurface
which can be vital in identifying "depths of interest" (e.g. soft, compressible layers) for possible
sampling and laboratory testing. Furthermore, the SCPTu can be used to confirm observations
made during the drilling of traditional borings. CPTu results can also identify layering, supply
engineering parameters based on appropriate correlations, and provide shear wave velocity used
to directly determine stress-strain properties.
The CPTu is a geotechnical investigation technique which involves pushing a sensitized
cone into the subsurface at a constant rate while continuously measuring tip resistance, sleeve
friction, and pore pressure (hydrostatic in granular soils and excess from soil shearing of cohesive
soils). Additionally, shear wave velocity measurements can be collected at discrete intervals
throughout the test (this is denoted by the "S" in the SCPTu acronym). The "u" in the SCPTu or
CPTu acronym indicates that dynamic pore pressure was measured during the cone penetration
test. Empirical and theoretical correlations have been developed between these measurements and
soil engineering properties such as preconsolidation pressure ('p) and undrained shear strength
(su). Soil classification, location of silt/sand seams, seismic design parameters, and liquefaction
potential can also be obtained from CPTu results. Results from the CPTu test can be used to
delineate the subsurface stratigraphy and correlate to engineering parameters which may
otherwise be expensive and time consuming to obtain from laboratory testing.
As Maine's population grows, specifically in the southern and coastal region of the state,
infrastructure will inevitably involve continuous interaction with the Presumpscot Formation. It
will be worthwhile for geotechnical engineers to utilize the most effective tools in determining
properties of the Presumpscot clay. This will improve engineering design, in turn increasing the
reliability of infrastructure performance.

3
The advantage of the CPTu over other testing methods (such as the in situ field vane
shear test and laboratory consolidation, index and classification, or laboratory shear strength
testing) is that the results are continuous, rapid, and repeatable (DeGroot and Ladd, 2010). For
classification purposes, the CPTu is widely used and especially useful for determining if deposits
are homogeneous (DeGroot and Ladd, 2010) as well as locating discrete low strength horizons
which may otherwise be missed in discrete testing (Rogers, 2006). The ability to determine the
homogeneity of a Presumpscot clay despot can help support or disprove the assumption of
applying engineering properties determined from a discrete test to an entire deposit, which is
common practice.
Correlations of SCPTu sounding results in the Presumpscot clay are valuable for
estimating engineering properties for design. Preconsolidation pressure ('p) of clays refers to the
maximum stress applied at that particular depth within the deposit, and is essential for
geotechnical design for effective estimation of settlement or stress-strain behavior (Saye et al.
2013, DeGroot and Ladd, 2010). Continuous estimates of 'p can be interpreted from SCPTu
results by applying an empirical factor to the measured tip resistance. Undrained shear strength
(su) is used to evaluate the stability of earth slopes, estimate deep foundation (e.g., pile) capacity,
estimate pressure on retaining structures, and interpret bearing capacity of shallow foundations in
clay. Undrained shear refers to the shearing process which occurs quickly enough to prevent
water from flowing out of the sheared clay. This is representative of the most critical shear mode
for soft Presumpscot clay. Similar to 'p, continuous estimates of su can be made available by
applying empirical factors to CPTu measurements. However, unlike 'p, su is not a unique clay
property as su is dependent on the orientation of the principal stress causing the shear failure as
well as the shear rate (Lambe and Whitman 1969, DeGroot and Ladd, 2010, Holtz et al. 2011).
4
Engineering properties (e.g. 'p and su) of Presumpscot clay deposits are typically
determined at discrete depths. If the desired 'p or su of a clay deposit is at a particular depth, this
approach is valid and probably the most effective way to determine the properties for
geotechnical analyses. However, in almost all geotechnical analyses of soft clay sites, it is
preferable to have a complete profile of engineering properties since calculations such as total
settlement, retaining structure pressures, and deep foundation capacity, depth (and therefore the
potential change in properties with depth) is incorporated into the analysis. Geotechnical
engineers have the opportunity to perform more accurate analyses with a complete profile of
engineering properties and classification of Presumpscot clay, which the CPTu can provide with
the right data interpretation methods, which this thesis aims to provide. They also have the ability
to identify layers and other variation in the soil profile and correlated properties that may be
critical to design, yet may have been missed when using discrete sampling alone.
The (S)CPTu is a powerful complimentary tool to other existing geotechnical
investigation techniques. For site characterization (i.e. determining soil type, location and extent
of the deposit, and groundwater condition), the (S)CPTu is the most suitable technique (DeGroot
and Ladd, 2010). The results can also be used in conjunction with laboratory and field tests to
refine and enhance geotechnical analyses based on the complete profile of measurements from
the (S)CPTu. Practically all literature reviewed by the author about geotechnical design in soft
clay suggested that a combination of in situ field testing (i.e. SPT, CPTu, sample collection, FVT,
etc.) be used for the most effective design (Lunne et al. 1997, Rogers 2006, Long, 2008, Been
and Sancio 2010, Ladd and DeGroot 2010, Saye et al. 2013, Ching and Phoon, 2013).
1.1 Objective and Approach
The objective of this research is to evaluate the SCPTu as a geotechnical investigation
technique in the Presumpscot clay at several sites in Maine and to develop a suite of correlations
to classification, preconsolidation pressure ('p), undrained shear strength (su) that are both site
5
specific and universal. Since the measurements taken from a SCPTu sounding are continuous
with depth with discrete shear wave velocity measurements, if the classification and engineering
properties predicted prove to be reasonable, geotechnical engineers can use the results to refine
and improve analyses of Presumpscot clay to allow for time and cost savings and reduced risk.
Four sites were selected in Maine by MaineDOT, for whom this research was conducted,
with known deposits of Presumpscot clay from surficial geologic mapping, previous experience
in area, and preliminary phase geotechnical investigations. Since the Presumpscot clay deposit
varies from site to site, it was important to encompass sites with a wide range of properties. It is
impossible to completely represent the Presumpscot clay as a "whole" since the deposit differs so
widely, however some common characteristics were represented from these four sites. Some of
the characteristics included previous construction, stress history, sensitivity, silt and sand seams,
marine or freshwater environments, and fine grained soil content. Specific properties are
discussed within each site's chapter. The four sites are listed below:
The four sites are listed below:
1) Route 26/100 Bridge Replacement – Falmouth, ME
2) Martin's Point Bridge Replacement – Portland and Falmouth, ME
3) Route 197 Bridge Replacement – Richmond and Dresden, ME
4) I-395 Terminus – I-395 Brewer, ME
Figure 1.1 shows the approximate location of each site relative to the mapped surficial geologic
deposits of Maine.

6
Figure 1.1: Approximate location of the four research sites from this study relative to the mapped surficial geology of southern Maine. (reproduced from the Maine Geologic Survey, 2010).
The following tasks were performed at each of the four sites:
SCPTu testing within the Presumpscot layer to obtain continuous profiles of tip
resistance, sleeve friction, and pore pressure. Additionally, perform discrete shear wave
velocity during at least one SCPTu sounding per site.
Traditional borings within the Presumpscot layer. During these borings, conduct field
vane shear testing to obtain in situ undrained shear strength (su) and collect undisturbed
samples of Presumpscot clay for index and advanced laboratory testing.
Typical index testing for each sample, which includes moisture contents, Atterberg limits,
fall cone su, hydrometer, and organic content.
One dimensional constant rate of strain (CRS) consolidation testing on samples from all
undisturbed Shelby tube samples collected to determine stress history profiles.
Direct simple shear (DSS) or undrained anisotropic consolidation triaxial (CAUC) testing
on samples from all Shelby tubes collected from each site to determine su profiles.
Falmouth
Martin’s Point Bridge (Portland)
Richmond‐Dresden
Brewer
7
Comparison of consolidation and su obtained from laboratory testing to predicted values
from empirical correlations from published CPTu literature
Evaluation of the applicability and accuracy of published empirical correlations and
provide range, minimum, maximum, and average resulting coefficients.
1.2 Organization
Chapter 2 presents a literature review on the Presumpscot Formation and the CPTu.
Geologic history, composition and stratigraphy, and engineering properties are the focus of the
Presumpscot Formation literature review.
Chapter 3 presents the field and laboratory testing methods used in the research. The
chapter includes a description of the CPTu, soil sampling, field vane testing, and laboratory
testing methods.
Chapter 4 through Chapter 7 provide a summary of research conducted at each site,
including the layout of the site, summary of the previous geotechnical investigations conducted at
the site, and the field testing performed for this study. The chapters present the laboratory results
for index properties, stress histories, and undrained shear strengths determined from the
undisturbed soil samples. The chapters conclude by presenting the SCPTu results from the site
and the subsequent correlations for classification, stress history, and undrained shear strength.
Chapter 4 focuses on the Route 26/100 Bridge Replacement Site in Falmouth. Chapter 5 focuses
on the Martin's Point Bridge Replacement Site in Falmouth and Portland. Chapter 6 focuses on
the Route 197 Bridge Replacement Site in Richmond and Dresden. Chapter 7 focuses on the I-
395 Terminus Site in Brewer.
Chapter 8 presents correlations developed within the Presumpscot clay as a whole deposit
in result of the four sites in this thesis. Chapter 9 summarizes the findings and provides
recommendations for use of the SCPTu in Presumpscot clay and for future research.

8
1.3 Exclusions from Research
This thesis evaluates the use of SCPTu for predicting classification, 'p, and su in
Presumpscot clay. There are many other geotechnical uses for the SCPTu which are excluded
from this research. The first major exclusion is the interpretation of SCPTu results in granular
soils. At all of our sites, the Presumpscot clay was either underlain over overlain by granular,
non-cohesive material. SCPTu results can be used to estimate SPT-N blow counts, drained
friction angle, liquefaction susceptibility, or other properties of these soils (Lunne et al., 1997)
Other engineering properties of clay soils besides 'p and su estimated from SCPTu were
not evaluated. This includes constrained modulus and compressibility. DeGroot and Ladd (2010)
state that predicting these properties from SCPTu results are unreliable and are not recommended
for geotechnical practitioners. Permeability estimates were not conducted in the Presumpscot clay
from SCPTu dissipation tests. Liquefaction potential and seismic site class (in accordance with
the International Building Code) can be predicted from shear wave velocity testing. This was not
conducted at the sites in this thesis. If the reader is interested in learning more about the analyses
excluded herein, please refer to Lunne et al., (1997) and NCHRP (2007).

9
2 LITERATURE REVIEW
The cone penetration test with pore pressure measurements (CPTu) is a geotechnical
investigation technique which provides near-continuous measurements of tip resistance, sleeve
friction, and pore pressure that can be used to profile the subsurface and identify layering within
the soil stratigraphy. When performed in clay deposits, the results from a CPTu can be interpreted
to provide engineering parameters such as undrained shear strength (su) and preconsolidation
pressure ('p) with appropriate empirical correlations. The advantage to engineering properties
obtained from a CPTu are that they are both continuous and determined from in situ behavior,
eliminating the need to interpolate between discrete testing results as well as removing the
influence of sample disturbance on testing results.
In Maine, the Presumpscot Formation (also known as Presumpscot clay) is a common
surficial geologic deposit which presents major challenges to geotechnical engineers, mainly the
characterization of su and 'p. The purpose of this thesis is to characterize four sites containing
Presumpscot clay using current site investigation techniques (e.g., field vane shear testing and
undisturbed sampling with subsequent laboratory testing) and correlate the results from this
testing to CPTu results. This chapter summarizes Maine's Presumpscot clay deposit including its
geologic history and range of engineering properties based on decades of geotechnical
investigations performed throughout the deposit. Afterwards, the chapter will discuss the current
use of CPTu to conduct investigations in similar soft clay deposits throughout the globe, its
advantages and disadvantages, and the resulting empirical correlations used for determining
classification, su¸ and 'p which will be evaluated in the Presumpscot clay.
2.1 Presumpscot Formation
The Presumpscot Formation is a glacial marine sediment deposit located along the coast
of Maine and inland along the Kennebec and Penobscot River valleys (Figure 2.1). The deposit
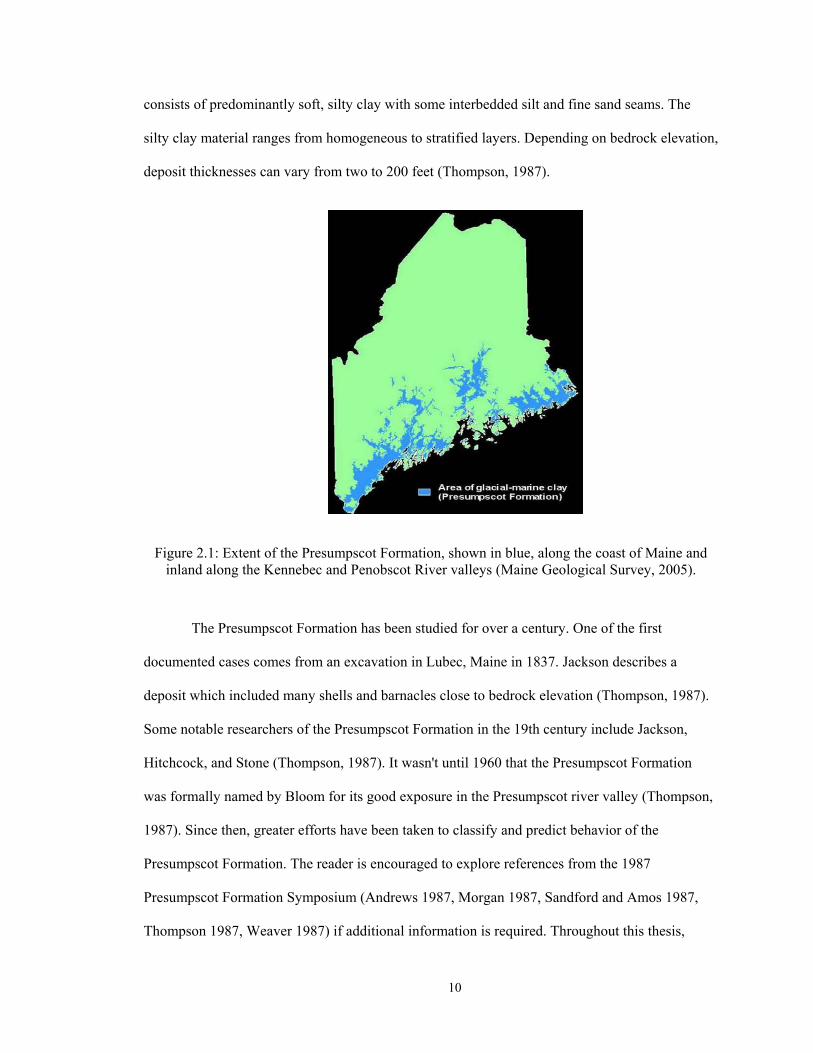
10
consists of predominantly soft, silty clay with some interbedded silt and fine sand seams. The
silty clay material ranges from homogeneous to stratified layers. Depending on bedrock elevation,
deposit thicknesses can vary from two to 200 feet (Thompson, 1987).
Figure 2.1: Extent of the Presumpscot Formation, shown in blue, along the coast of Maine and inland along the Kennebec and Penobscot River valleys (Maine Geological Survey, 2005).
The Presumpscot Formation has been studied for over a century. One of the first
documented cases comes from an excavation in Lubec, Maine in 1837. Jackson describes a
deposit which included many shells and barnacles close to bedrock elevation (Thompson, 1987).
Some notable researchers of the Presumpscot Formation in the 19th century include Jackson,
Hitchcock, and Stone (Thompson, 1987). It wasn't until 1960 that the Presumpscot Formation
was formally named by Bloom for its good exposure in the Presumpscot river valley (Thompson,
1987). Since then, greater efforts have been taken to classify and predict behavior of the
Presumpscot Formation. The reader is encouraged to explore references from the 1987
Presumpscot Formation Symposium (Andrews 1987, Morgan 1987, Sandford and Amos 1987,
Thompson 1987, Weaver 1987) if additional information is required. Throughout this thesis,
11
"Presumpscot Formation," "Presumpscot clay," "Presumpscot," and "the deposit" all refer to the
fine-grained geologic deposit described in this section.
During the Late Pleistocene era, approximately 17,000 years before present, an ice sheet
covered Maine and New England (i.e. pre-Presumpscot clay deposition) and remained stagnant,
resting against George's Bank in the Atlantic Ocean. Although the cause of the warming climactic
change which initiated the retreat of the ice sheet is largely unknown, around 17,000 years before
present (YBP) the ice sheet began melting and completely receded over the course of
approximately 5,000 years (Kelley et al., 2010). As the glacier retreated in a northern direction
across the current landscape of Maine, a mixture of silt, sand, and clay flocculated out of
suspension in the marine water either directly beneath or in front of the retreating glacier while
the bedrock was depressed below sea level.
Subglacial and englacial meltwater stream systems within the Laurentide Ice Sheet
carried a wide range of chemically and mechanically weathered material which was deposited at
the front of the glacier. The resulting plume carried the fine grained material (i.e. materials that
later formed the Presumpscot Formation) in suspension out away from the margin while the
coarse grained material (i.e. glacial till, sand and gravel) settled out immediately. The depth of
Presumpscot clay deposits are a function of how long (if at all) the glacier remained stagnant, as
well as meltwater plume volume. The overall deposition of Presumpscot occurred from
approximately 16,000 YBP to 11,000 YBP, a relatively rapid process in terms of geologic
deposits.
After the Presumpscot Formation was deposited and the ice sheet melted, the weight
relief of the removed glacier caused isostatic rebound of the bedrock and subsequent lowering of
the relative mean sea level (MSL). In places, bedrock rebounded 200 feet over a 2,000 year
period. This exposed the Presumpscot in some places to freshwater conditions. Since the

12
lowstand of the MSL (about 12,000 YBP), MSL has since risen approximately 200 feet and
continues to rise slowly (Kelley et al., 2010).
Material which underlies the Presumpscot clay generally consists of a combination of
silty or clean sand, bedrock, or glacial till. If glacial till is the underlying material, the bottom of
the Presumpscot layer may be interfingered or intermixed at the transitional zone, indicating an
ice-pinning point during glacial retreat (Belknap, 1987). Abrupt transition from till to clay
indicates that the glacier was retreating relatively quickly and the clay was sedimented in a low
energy environment at the proximal zone of the glacier, where interfingering or intermixing
indicates glacial stagnation and formation of the clay directly beneath the glacial contact zone.
"Downward coarsening [of a Presumpscot Formation deposit] reflects the higher energy
environment that prevailed when meltwater currents were still issuing from the nearby ice
margin" (Thompson, 1987).
2.1.1 Geotechnical Considerations
Presumpscot clay may cause difficulties for infrastructure design including major
settlement, embankment shear failures, unpredictable time rate of consolidation, and reoccurring
landslides. Properties of the deposit that can lead to these issues include high in situ water
content, high sensitivity, interbedded silt and sand seams, varying deposit thicknesses, low
undrained shear strength (su), and high compressibility. The deposit has a reputation for
characterization and design challenges. Often times the solution to the unpredictable behavior of
the deposit results in over conservative designs and over engineered approaches, which can lead
to major project expenses (Morgan, 1987). Examples of this may include the construction of deep
foundations where shallow foundations are adequate, unnecessary pre-load magnitude and time
periods to account for compressibility, oversized toe slope berms, or even abandoning a project
due to the uncertainties of the clay properties.
13
Compositional characteristics of the Presumpscot Formation include the grain sizes and
the material mineralogy. Sandford & Amos (1987) summarize grain sizes throughout the
Presumpscot Formation as 0-35% fine sand, 20-55% silt, and 35-75% clay. The results of 43
grain size measurements performed by Goldthwait (1951) averaged values of 23.5% fine sand,
37.5% silt, and 39% clay. It is important to note that the presence of sand in the Presumpscot is
typically due to sand seams or intermixing with overlying and underlying material. Quartz is the
dominant material within Presumpscot clay, followed by feldspar and then muscovite mica
(Schnitiker & Borns, 1987). Thompson (1987) and Schnitiker & Borns (1987) indicate the
predominant clay mineral is illite with no traces of kaolinite or montmorillonite.
Due to the marine depositional environment, the clay particles, or "platelets," in the
Presumpscot Formation have a mostly flocculated soil structure (Mitchell and Soga, 2005). This
refers to the orientation of the particles being rather disorganized and having mostly edge-to-face
contact (Figure 2.2a) with strong electrochemical bonds at the points of contact. As the
Presumpscot clay platelets were originally deposited into the marine water by glacial streams at
the glacier margin, they became individually suspended particles floating in suspension. The
outside faces of the platelets were negatively charged while the ends of the platelets were
positively charged. As they settled onto the sea floor, end-to-face contacts (flocculated structure)
prevailed (Mitchell and Soga, 2005). Flocculated clay particles have su, higher permeability, and
lower compressibility at stresses less than 'p compared to dispersed particle arrangement (Figure
2.2b) (Lambe & Whitman, 1967). The higher su and low compressibility can be attributed to the
increased force required to break the electrochemical bonds, where the higher permeability is due
to the channels formed by the random arrangement of flocculated particles. Figure 2.3 is an SEM
photomicrograph of Boston Blue clay, showing the flocculated arrangement of clay particles
similar to that found in Presumpscot clay. Pulverized rock flour is present in Presumpscot clay.
Thompson (1987) even suggests that a majority of the clay-sized particles are rock flour. The

14
rock flour, very small and angular particles formed by mechanical weathering, exhibit no
plasticity and can greatly affect the engineering behavior by occupying voids between the clay
platelets (Terzaghi et al., 1996).
Figure 2.2: Idealized clay platelet structure for a) flocculated and b) dispersed clay (Lambe and Whitman, 1967).
Figure 2.3: SEM Photomicrograph of Boston Blue Clay (Terzaghi et al., 1996).
Engineering properties of the Presumpscot clay in this thesis refer to the preconsolidation
pressure ('p) and undrained shear strength (su). Engineering properties of the Presumpscot clay
are influenced by depositional and post-depositional processes. The depositional environment
controls the composition, layering and structure, which in turn influences plasticity, initial
permeability, compressibility, undrained shear strength, and void ratio. Post-depositional
15
processes (including surface loading, surface unloading, groundwater fluctuations, cation
exchange, etc.) controls water content, soil stresses, structure breakdown, and ion concentrations,
which in turn influences 'p, compressibility, su, and the relative changes from the initial states.
For example, shallow inland Presumpscot clay deposits are typically brown, oxidized stiff clay
with a higher su than the soft, gray wet clay, which can be normally consolidated. The only
differences between the crust and the lower, softer portion of these deposits are the water content
and reorganized platelet structure, which is often due to desiccation from groundwater
fluctuations.
2.1.2 Index Properties
Atterberg Limits represent water contents dividing where the clays act as a brittle, plastic,
or liquid material. The plastic limit (PL) is the water content at which the clay transitions from
brittle to plastic behavior (i.e. the clay can be deformed without volume change or cracking)
(Mitchell and Soga, 2005). Plastic limit for Presumpscot clay ranges from 15-25 (Andrews, 1987)
and averaged 22 for the sites in this thesis. Liquid limit (LL), defined as the water content at
which the clay begins to exhibit liquid behavior (with an su of approximately 50 psf) (Mitchell
and Soga, 2005) ranges from 25-41 (Andrew, 1987) and averaged 38 for the sites in this thesis.
Plasticity index is the difference between liquid limit and plastic limit. Liquidity index (LI)
relates the in situ water content to the plasticity behavior of the soil. LI below 0 indicates brittle
behavior, LI between 0 and 1 indicates plastic behavior, and LI greater than 1 indicates liquid
behavior. Based on the published LL and PL from Andrews (1987), Presumpscot clay PI typically
ranges from 10-26. Based on published moisture content values from Andrews (1987), LI can
range from 0 to 4.0.
Due to the low to moderate plasticity of the Presumpscot clay, it is almost always
classified as lean clay CL in accordance to ASTM D2487 Standard Practice for Classification of
16
Soils for Engineering Purposes (Unified Soil Classification System). Other possible
classifications of Presumpscot include silty clay CL-ML with fine sand, silt ML, and clayey silty
sand SC-SM. These are alternatives to lean clay that result from sand seams or material transition
zones into overlying or underlying material.
2.1.3 Stress History
Stress history refers to the changes in stress (mechanical, pore pressure, physiochemical,
and biochemical) which a soil deposit experiences after deposition. Preconsolidation pressure
('p) is defined as the apparent maximum past pressure and overconsolidation ratio (OCR) is the
ratio of 'p to the current in situ vertical effective stress ('v0). If the current estimated in situ
vertical effective stress, 'v0 is equivalent to the measured 'p, that soil is normally consolidated.
If the soil's existing 'v0 is lower than 'p, the soil is overconsolidated. Very few, if any, deposits
are truly normally consolidated due to the action of secondary compression (Holtz et al., 2011)
and aging. Mechanisms which contribute to 'p include the application of mechanical pressure to
the ground surface (soil, construction activities, buildings, etc.), pore pressure changes from
groundwater flow, desiccation from groundwater fluctuations, long-term drained creep
(secondary compression), and other less common physiochemical and biochemical processes
(Mitchell and Soga, 2005).
Stress history of Presumpscot clay deposits is a site-specific, complex phenomenon
which typically requires laboratory consolidation testing and inferring of the geologic history at a
site. Quantification of the stress history and overconsolidation ratio of a deposit at specific depths
is critical for determining settlement and stress-strain behavior expected from applied loads.
Volume change characteristics are directly related to the OCR of deposits, where samples which
remain in stress states below 'p (i.e. analogous to the recompression portion of the consolidation
curve from 1D consolidation testing) will experience less settlement than those soils loaded
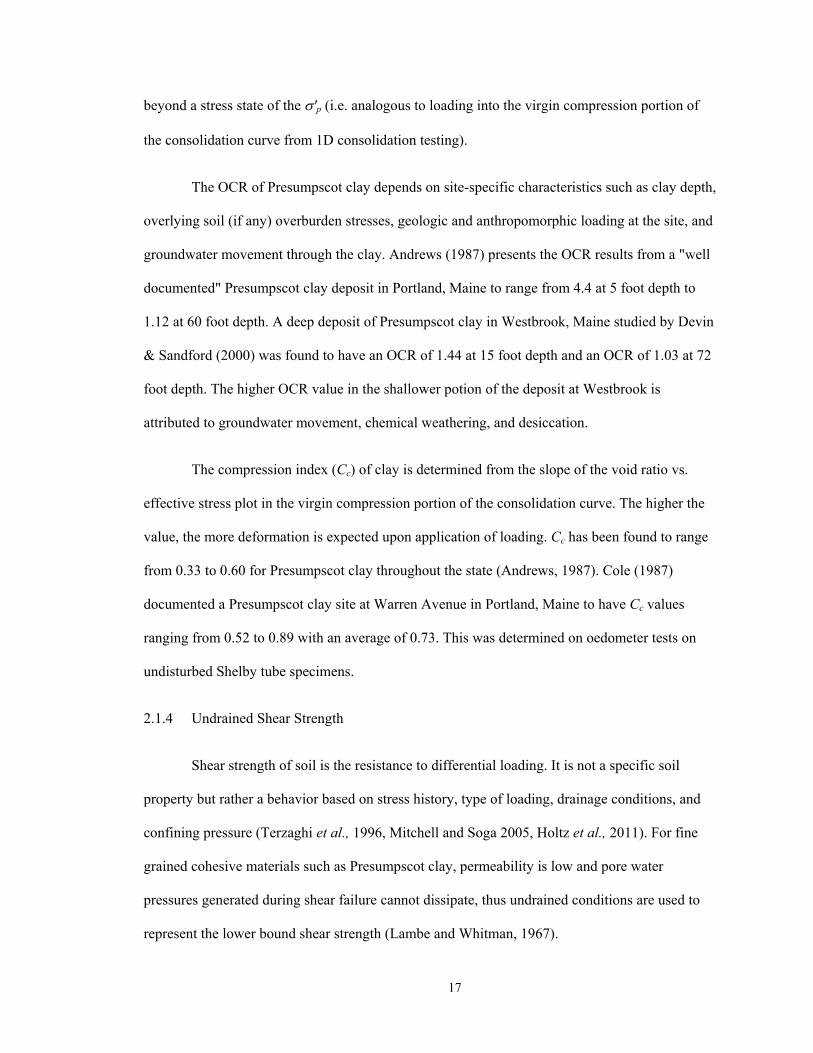
17
beyond a stress state of the 'p (i.e. analogous to loading into the virgin compression portion of
the consolidation curve from 1D consolidation testing).
The OCR of Presumpscot clay depends on site-specific characteristics such as clay depth,
overlying soil (if any) overburden stresses, geologic and anthropomorphic loading at the site, and
groundwater movement through the clay. Andrews (1987) presents the OCR results from a "well
documented" Presumpscot clay deposit in Portland, Maine to range from 4.4 at 5 foot depth to
1.12 at 60 foot depth. A deep deposit of Presumpscot clay in Westbrook, Maine studied by Devin
& Sandford (2000) was found to have an OCR of 1.44 at 15 foot depth and an OCR of 1.03 at 72
foot depth. The higher OCR value in the shallower potion of the deposit at Westbrook is
attributed to groundwater movement, chemical weathering, and desiccation.
The compression index (Cc) of clay is determined from the slope of the void ratio vs.
effective stress plot in the virgin compression portion of the consolidation curve. The higher the
value, the more deformation is expected upon application of loading. Cc has been found to range
from 0.33 to 0.60 for Presumpscot clay throughout the state (Andrews, 1987). Cole (1987)
documented a Presumpscot clay site at Warren Avenue in Portland, Maine to have Cc values
ranging from 0.52 to 0.89 with an average of 0.73. This was determined on oedometer tests on
undisturbed Shelby tube specimens.
2.1.4 Undrained Shear Strength
Shear strength of soil is the resistance to differential loading. It is not a specific soil
property but rather a behavior based on stress history, type of loading, drainage conditions, and
confining pressure (Terzaghi et al., 1996, Mitchell and Soga 2005, Holtz et al., 2011). For fine
grained cohesive materials such as Presumpscot clay, permeability is low and pore water
pressures generated during shear failure cannot dissipate, thus undrained conditions are used to
represent the lower bound shear strength (Lambe and Whitman, 1967).

18
Undrained shear strength (su) of Presumpscot clay is typically estimated using either in
situ field vane shear testing (FVT) (Figure 3.6) or advanced laboratory testing on undisturbed
samples collected from the subsurface (Andrew 1987, Morgan 1987, Devin and Sandford, 2000,
Langlais 2011). For both FVT and laboratory testing, su will vary depending on mode and rate of
shear and testing method. For laboratory testing, three types of undrained shear tests have been
developed to estimate su based on three common expected failure mechanisms. These are triaxial
compression (TC), direct simple shear (DSS), and triaxial extension (TE). The three types of su
are illustrated using a theoretical slope failure in Figure 2.4. The difference in su from these three
methods is due to the variation in the angle of the applied load during the test, also known as the
deviator stress. In TC testing, the deviator stress is directly vertical (0o), where the deviator stress
for DSS testing is somewhere between 30o and 60o (DeGroot and Ladd 2010), and the deviator
stress for TE is 90o. Laboratory testing on an identical specimen of clay would result in su
magnitudes from highest to lowest from TC, DSS, and TE, respectively. Figure 2.5 illustrates the
difference in su measured from triaxial CAUC (anisotropically consolidated undrained
compression; or named "triaxial compression" in Figure 2.5) and DSS. It should be noted that the
plasticity index (PI, seen as the x-axis in Figure 2.5) of Presumpscot clay is generally around 20,
and the expected ratio of su/'v0 for TC testing to range from approximately 0.28 to 0.35 and of
su/'v0 for DSS testing to range from 0.18 to 0.28. su can also be measured in situ using the field
vane shear test (FVT). Typical values of su in soft, normally to lightly overconsolidated
Presumpscot clay were observed to range from 215 to 750 psf (Weaver 1984, Sandford and Amos
1987, Morgan 1987, Andrews 1987, Devin 1990). This includes values from FVT, anisotropic
consolidated triaxial compression, and isotropic consolidated triaxial compression testing.
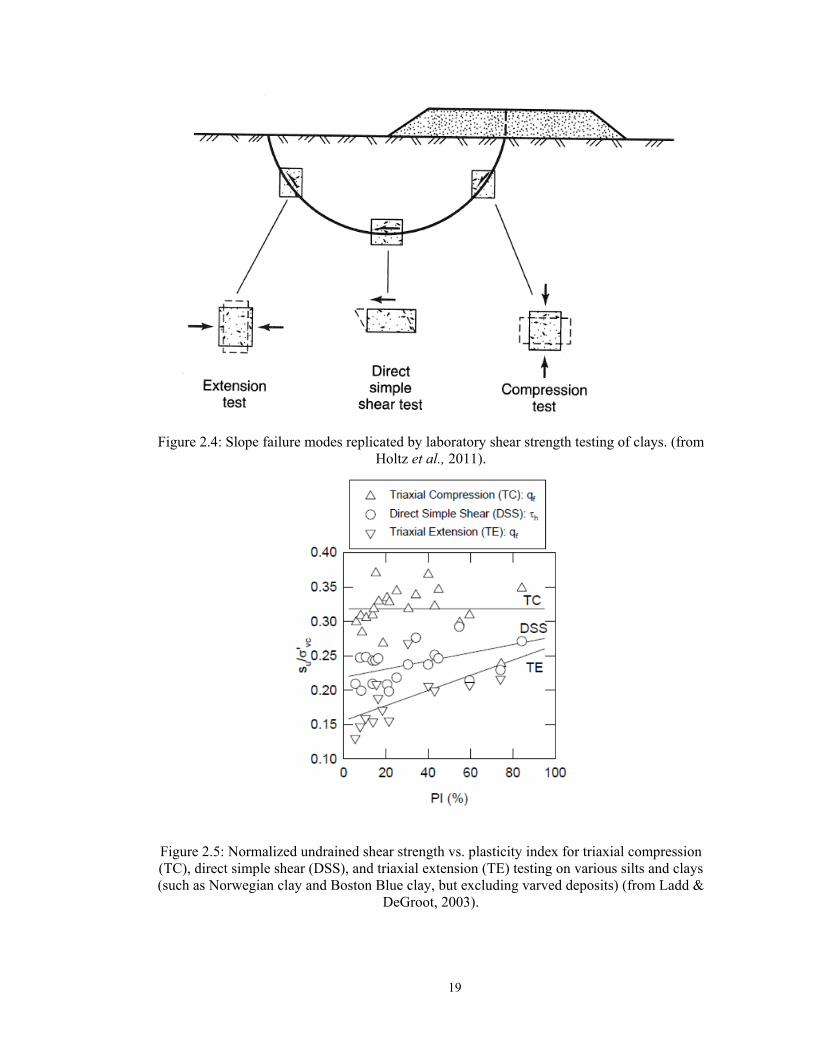
19
Figure 2.4: Slope failure modes replicated by laboratory shear strength testing of clays. (from Holtz et al., 2011).
Figure 2.5: Normalized undrained shear strength vs. plasticity index for triaxial compression (TC), direct simple shear (DSS), and triaxial extension (TE) testing on various silts and clays (such as Norwegian clay and Boston Blue clay, but excluding varved deposits) (from Ladd &
DeGroot, 2003).
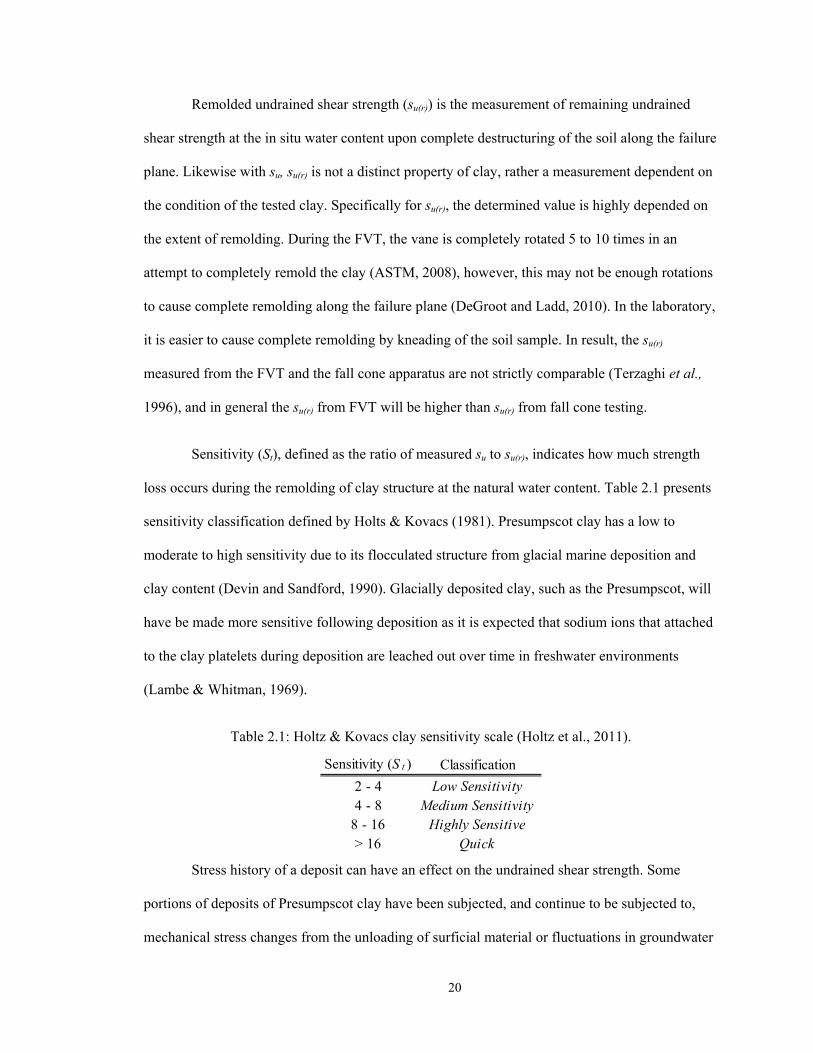
20
Remolded undrained shear strength (su(r)) is the measurement of remaining undrained
shear strength at the in situ water content upon complete destructuring of the soil along the failure
plane. Likewise with su, su(r) is not a distinct property of clay, rather a measurement dependent on
the condition of the tested clay. Specifically for su(r), the determined value is highly depended on
the extent of remolding. During the FVT, the vane is completely rotated 5 to 10 times in an
attempt to completely remold the clay (ASTM, 2008), however, this may not be enough rotations
to cause complete remolding along the failure plane (DeGroot and Ladd, 2010). In the laboratory,
it is easier to cause complete remolding by kneading of the soil sample. In result, the su(r)
measured from the FVT and the fall cone apparatus are not strictly comparable (Terzaghi et al.,
1996), and in general the su(r) from FVT will be higher than su(r) from fall cone testing.
Sensitivity (St), defined as the ratio of measured su to su(r), indicates how much strength
loss occurs during the remolding of clay structure at the natural water content. Table 2.1 presents
sensitivity classification defined by Holts & Kovacs (1981). Presumpscot clay has a low to
moderate to high sensitivity due to its flocculated structure from glacial marine deposition and
clay content (Devin and Sandford, 1990). Glacially deposited clay, such as the Presumpscot, will
have be made more sensitive following deposition as it is expected that sodium ions that attached
to the clay platelets during deposition are leached out over time in freshwater environments
(Lambe & Whitman, 1969).
Table 2.1: Holtz & Kovacs clay sensitivity scale (Holtz et al., 2011).
Stress history of a deposit can have an effect on the undrained shear strength. Some
portions of deposits of Presumpscot clay have been subjected, and continue to be subjected to,
mechanical stress changes from the unloading of surficial material or fluctuations in groundwater
Sensitivity (S t ) Classification
2 - 4 Low Sensitivity4 - 8 Medium Sensitivity
8 - 16 Highly Sensitive> 16 Quick

21
table elevation that result in total stress changes. Changes in total and effective stress (due to pore
pressure fluctuation or dissipation following loading) re-orients the clay platelet structure and
reduces the water content, effectively densifying the material and decreasing voids. This is
common in the upper few feet of Presumpscot clay deposits, called the "crust," which produce
samples of clay with a brown, oxidized, and/or mottled appearance which is stiffer than the softer
clay below. OCR in this crust can range from 2 to 37 (Devin and Sandford, 1995). Andrews
(1987) found the su in this layer to range from 2,000 psf to 3,500 psf.
Ladd and Foott (1974) observed a relationship between the stress history and the su of
clay deposits. They determine that the stress-strain behavior and undrained shear strength of clays
is directly controlled by the amount of overconsolidation of a deposit. For clay under normally
consolidated conditions (i.e., OCR=1), the undrained shear strength normalized by effective
overburden stress (su/'v0) was found to be more or less constant (Ladd and DeGroot, 2003). As
OCR increases, su increases exponentially. This relationship is called the Stress History and
Normalized Soil Engineering Parameter (SHANSEP) relationship and is shown in Equation 2.1:
(su/'v0)(OC) = S*OCRm 2.1
where su = undrained shear strength, 'v0 = in situ vertical effective stress, OC notates
overconsolidated state, S = (su/'v0) for normally consolidated conditions, OCR =
overconsolidation ratio, and m = exponential coefficient found to range from approximately 0.5 to
1.0 (Karlsrud and Hernandez-Martinez, 2013).
A relationship exists between the effective overburden stress and su. For normally
consolidated clays, su/'v0 or S, is assumed constant for a deposit and generally ranges from 0.19
to 0.25 (Ladd & DeGroot, 2003). This results in a linearly increasing profile of su with increasing
confining pressure, which is often the assumed condition in geotechnical design. However, in
overconsolidated portions of the clays, including Presumpscot clay, su/'v0 will increase
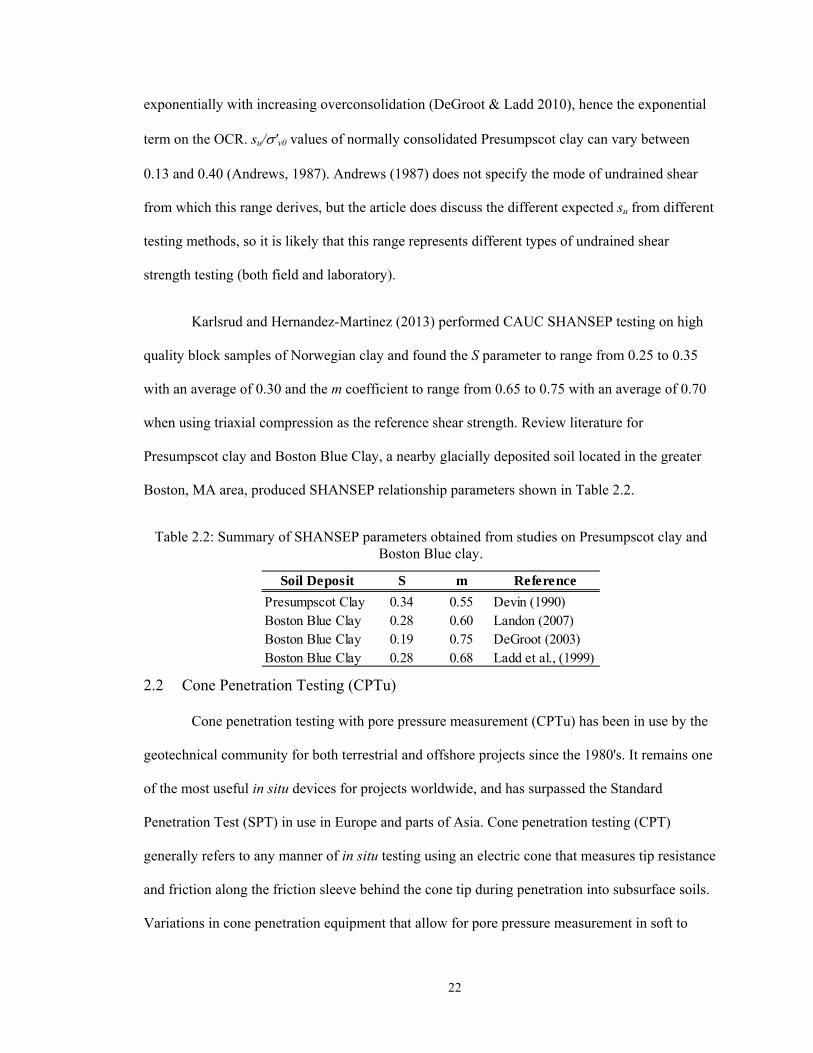
22
exponentially with increasing overconsolidation (DeGroot & Ladd 2010), hence the exponential
term on the OCR. su/'v0 values of normally consolidated Presumpscot clay can vary between
0.13 and 0.40 (Andrews, 1987). Andrews (1987) does not specify the mode of undrained shear
from which this range derives, but the article does discuss the different expected su from different
testing methods, so it is likely that this range represents different types of undrained shear
strength testing (both field and laboratory).
Karlsrud and Hernandez-Martinez (2013) performed CAUC SHANSEP testing on high
quality block samples of Norwegian clay and found the S parameter to range from 0.25 to 0.35
with an average of 0.30 and the m coefficient to range from 0.65 to 0.75 with an average of 0.70
when using triaxial compression as the reference shear strength. Review literature for
Presumpscot clay and Boston Blue Clay, a nearby glacially deposited soil located in the greater
Boston, MA area, produced SHANSEP relationship parameters shown in Table 2.2.
Table 2.2: Summary of SHANSEP parameters obtained from studies on Presumpscot clay and Boston Blue clay.
2.2 Cone Penetration Testing (CPTu)
Cone penetration testing with pore pressure measurement (CPTu) has been in use by the
geotechnical community for both terrestrial and offshore projects since the 1980's. It remains one
of the most useful in situ devices for projects worldwide, and has surpassed the Standard
Penetration Test (SPT) in use in Europe and parts of Asia. Cone penetration testing (CPT)
generally refers to any manner of in situ testing using an electric cone that measures tip resistance
and friction along the friction sleeve behind the cone tip during penetration into subsurface soils.
Variations in cone penetration equipment that allow for pore pressure measurement in soft to
Soil Deposit S m Reference
Presumpscot Clay 0.34 0.55 Devin (1990)Boston Blue Clay 0.28 0.60 Landon (2007)Boston Blue Clay 0.19 0.75 DeGroot (2003)Boston Blue Clay 0.28 0.68 Ladd et al., (1999)
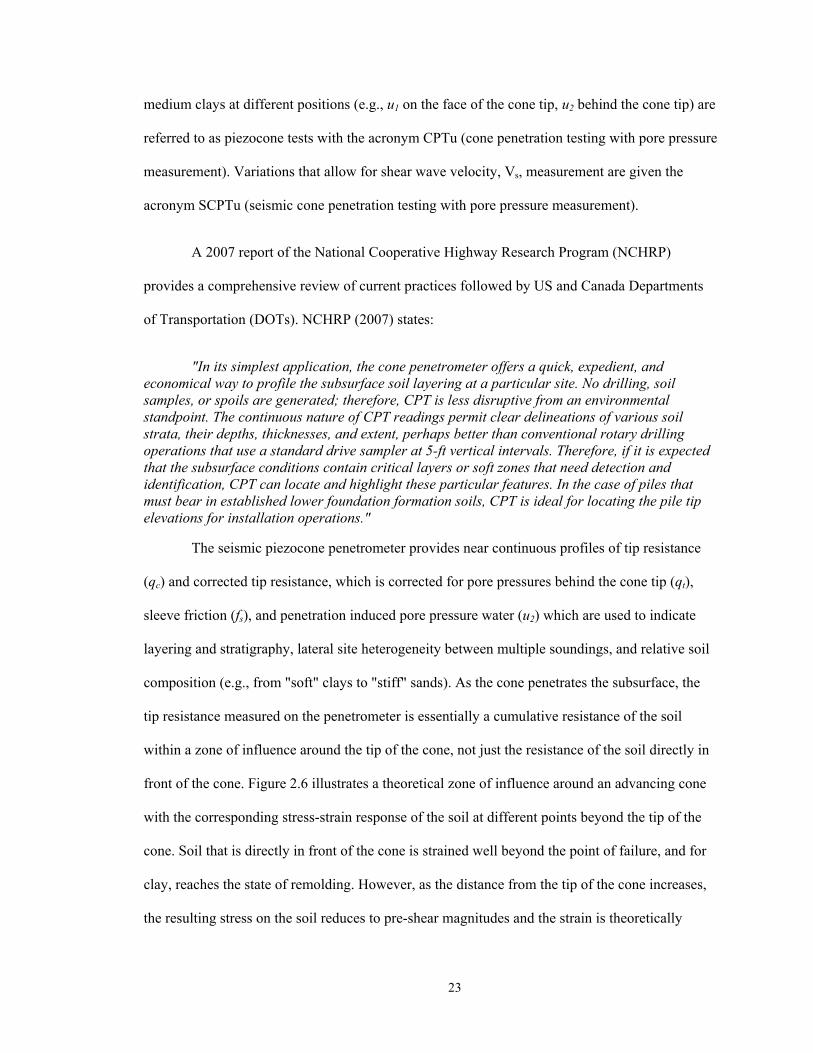
23
medium clays at different positions (e.g., u1 on the face of the cone tip, u2 behind the cone tip) are
referred to as piezocone tests with the acronym CPTu (cone penetration testing with pore pressure
measurement). Variations that allow for shear wave velocity, Vs, measurement are given the
acronym SCPTu (seismic cone penetration testing with pore pressure measurement).
A 2007 report of the National Cooperative Highway Research Program (NCHRP)
provides a comprehensive review of current practices followed by US and Canada Departments
of Transportation (DOTs). NCHRP (2007) states:
"In its simplest application, the cone penetrometer offers a quick, expedient, and economical way to profile the subsurface soil layering at a particular site. No drilling, soil samples, or spoils are generated; therefore, CPT is less disruptive from an environmental standpoint. The continuous nature of CPT readings permit clear delineations of various soil strata, their depths, thicknesses, and extent, perhaps better than conventional rotary drilling operations that use a standard drive sampler at 5-ft vertical intervals. Therefore, if it is expected that the subsurface conditions contain critical layers or soft zones that need detection and identification, CPT can locate and highlight these particular features. In the case of piles that must bear in established lower foundation formation soils, CPT is ideal for locating the pile tip elevations for installation operations."
The seismic piezocone penetrometer provides near continuous profiles of tip resistance
(qc) and corrected tip resistance, which is corrected for pore pressures behind the cone tip (qt),
sleeve friction (fs), and penetration induced pore pressure water (u2) which are used to indicate
layering and stratigraphy, lateral site heterogeneity between multiple soundings, and relative soil
composition (e.g., from "soft" clays to "stiff" sands). As the cone penetrates the subsurface, the
tip resistance measured on the penetrometer is essentially a cumulative resistance of the soil
within a zone of influence around the tip of the cone, not just the resistance of the soil directly in
front of the cone. Figure 2.6 illustrates a theoretical zone of influence around an advancing cone
with the corresponding stress-strain response of the soil at different points beyond the tip of the
cone. Soil that is directly in front of the cone is strained well beyond the point of failure, and for
clay, reaches the state of remolding. However, as the distance from the tip of the cone increases,
the resulting stress on the soil reduces to pre-shear magnitudes and the strain is theoretically
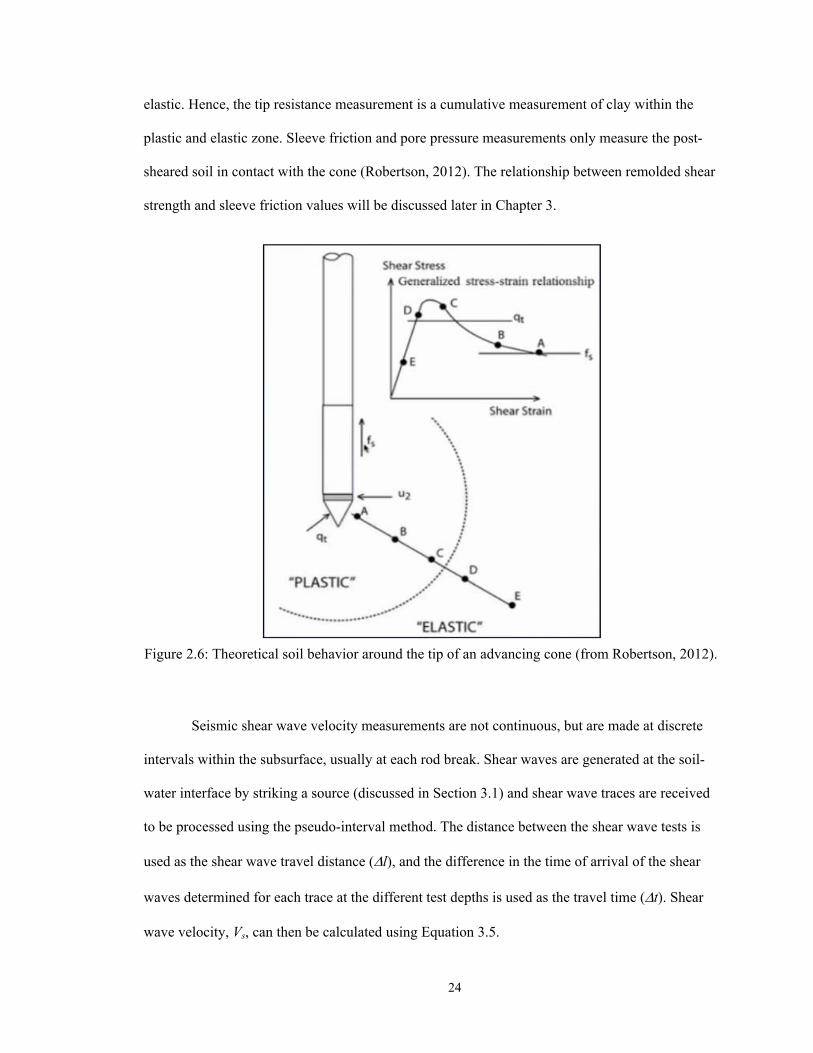
24
elastic. Hence, the tip resistance measurement is a cumulative measurement of clay within the
plastic and elastic zone. Sleeve friction and pore pressure measurements only measure the post-
sheared soil in contact with the cone (Robertson, 2012). The relationship between remolded shear
strength and sleeve friction values will be discussed later in Chapter 3.
Figure 2.6: Theoretical soil behavior around the tip of an advancing cone (from Robertson, 2012).
Seismic shear wave velocity measurements are not continuous, but are made at discrete
intervals within the subsurface, usually at each rod break. Shear waves are generated at the soil-
water interface by striking a source (discussed in Section 3.1) and shear wave traces are received
to be processed using the pseudo-interval method. The distance between the shear wave tests is
used as the shear wave travel distance (l), and the difference in the time of arrival of the shear
waves determined for each trace at the different test depths is used as the travel time (t). Shear
wave velocity, Vs, can then be calculated using Equation 3.5.
25
2.2.1 CPTu Use in Geotechnical Investigations in Soft Clay
Successful applications of CPTu in embankment stability and structure foundation
designs of soft clays have been well-documented. Ladd and DeGroot (2003) highlight the
importance of site-specific correlations when interpreting CPTu results for geotechnical design.
Empirical cone factors used to determine su have a wide range based on published data, and have
been found to vary based on clay sensitivity, plasticity, overconsolidation ratio (OCR), as well as
types of piezocones used and test operators (Robertson 2009, Rogers 2006, Ladd and DeGroot
2003). Two sites of Boston Blue Clay (BBC, a marine clay deposited in the greater Boston area
during the same time period of the Presumpscot clay) were examined for their correlated su values
to the CPTu. The BBC at both sites is covered by 30 feet of fill and contains an overconsolidated
crust overlying low OCR clay. Both sites have been studies extensively at the Massachusetts
Institute of Technology (MIT) which includes high quality laboratory tested specimens. Cone
factor Nkt was determined at each site by back-calculating to laboratory determined values of su
from direct simple shear (DSS) testing. Nkt varied from approximately 8 to 13 for one site and 17
to 22 for the other. Ladd and DeGroot (2003) state that the difference in strength correlations is
not soil plasticity and is from unknown reasons.
2.2.2 Use of CPTu to Supplement Laboratory and Field Testing
Wei et al., (2010) performed a geotechnical investigation that included CPTu soundings
at the crown of a levee in New Orleans which consists of silty and sandy clay fill over a deep
deposit of high plasticity clay to characterize the undrained shear strength and determine the
stability of the clay-supported levee. Adjacent to CPTu sounding, high quality tube samples were
collected and tested in unconsolidated unconfined compression and triaxial unconsolidated
undrained compression tests (the consolidation conditions were not specified) to determine su
with depth. Analysis of the laboratory results and correlation to the CPTu measurements provided

26
an optimum cone factor Nkt 12.0 and Wei et al., (2010) concluded that the CPTu correlation
derived su profile correlated well with the laboratory undrained shear testing results, even when
the measured strengths were scattered.
Another geotechnical investigation described by Ladd and DeGroot (2003) involved the
use of SCPTu in a failing earth embankment in Brazil. The project consisted of the construction
of an approximately 25 foot earth embankment over 13 feet of sand over 25 feet of soft, plastic
Sergipe clay (Figure 2.7).
Figure 2.7: Embankment cross section of Brazilian Sergipe clay redesigned after the initial failure (Ladd and DeGroot, 2003).
When the embankment failed, the contractor hired MIT to perform testing of the clay
samples to help redesign the slope and ensure failure would not occur. 18 one dimensional (1D)
consolidation tests and 10 automated SHANSEP CK0U and DSS undrained shear tests were
performed in the laboratory, which resulted in considerable scatter in measured the
preconsolidation pressure ('p) from consolidation testing. The scatter caused uncertainty in the
stress history across the site and made settlement calculations difficult. In result, MIT performed
27
CPTu testing at four locations throughout the site, which provided laterally consistent profiles of
qnet, which could be correlated to measured 'p. This led to more accurate predictions of 'p and
settlement of the earth embankment, which may not have been possible without the use of CPTu
testing.
Ladd and DeGroot (2003) present an additional case history which illustrates the ability
of the CPTu to provide acceptable estimates of su and 'p profiles even with insufficient results
from other testing methods, including Standard Penetration Testing (SPT) blow counts of "weight
of rod," scattered field vane shear test (FVT) results, and poor quality laboratory testing results
from undisturbed tube samples. This situation is particularly applicable to the Presumpscot clay,
since these aforementioned testing procedures are common practice for geotechnical
investigations in Maine and furthermore since the case history is in BBC, a deposit very similar to
the Presumpscot clay. The case history covers the design of a bridge replacement for a soil profile
consisting of thin sand deposits overlying a 130 foot thick deposit of soft, silty BBC. Poor quality
laboratory samples improperly characterized the deposit to be underconsolidated (i.e. OCR <
1.0), which is impossible due to the known geologic history of the site. Furthermore, the FVT
results were scattered throughout the entire profile, likely the result of no drilling mud used
during the boring. However, a CPTu sounding performed at the site proved to be the most useful
testing method in terms of determining su and 'p of the clay. Using a conservative stress history
k-value of 0.30 (by matching the 'p profile to the in situ vertical effective stress profile assuming
the clay is normally consolidated, which is a conservative approach) and an Nkt of 18.0, complete
profiles of 'p and su values were available at the site. The resulting profiles compared to the poor
laboratory and FVT results are shown in Figure 2.8.
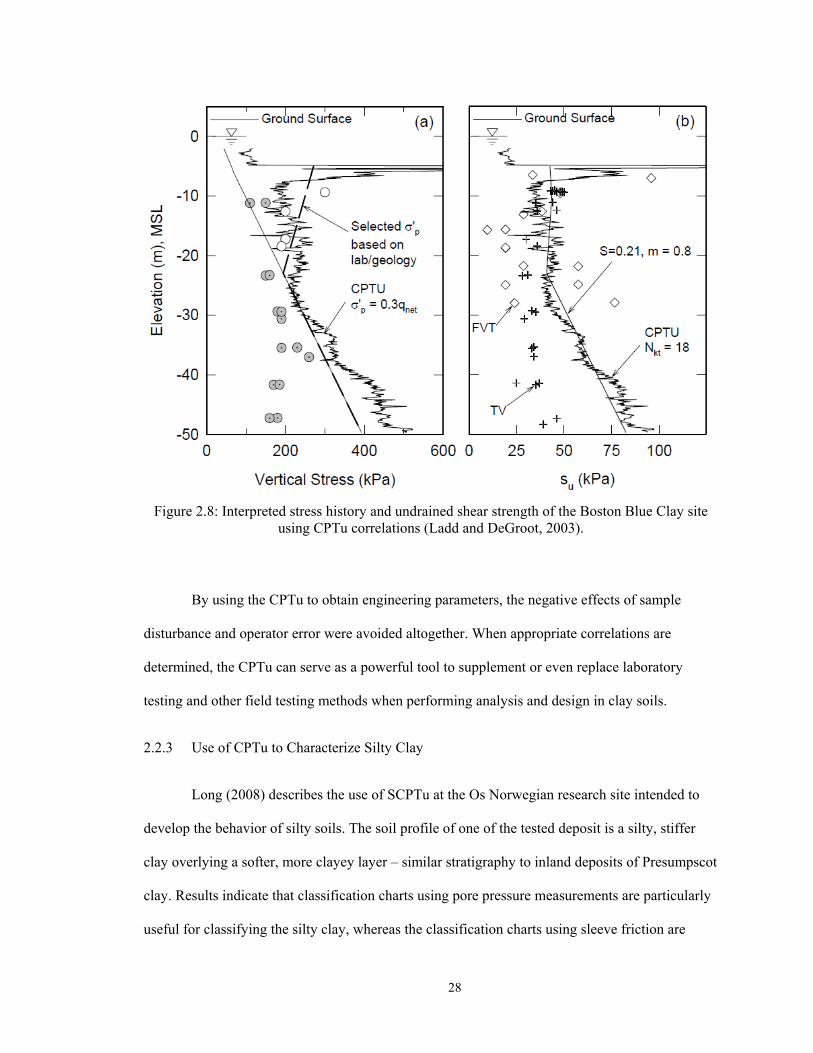
28
Figure 2.8: Interpreted stress history and undrained shear strength of the Boston Blue Clay site using CPTu correlations (Ladd and DeGroot, 2003).
By using the CPTu to obtain engineering parameters, the negative effects of sample
disturbance and operator error were avoided altogether. When appropriate correlations are
determined, the CPTu can serve as a powerful tool to supplement or even replace laboratory
testing and other field testing methods when performing analysis and design in clay soils.
2.2.3 Use of CPTu to Characterize Silty Clay
Long (2008) describes the use of SCPTu at the Os Norwegian research site intended to
develop the behavior of silty soils. The soil profile of one of the tested deposit is a silty, stiffer
clay overlying a softer, more clayey layer – similar stratigraphy to inland deposits of Presumpscot
clay. Results indicate that classification charts using pore pressure measurements are particularly
useful for classifying the silty clay, whereas the classification charts using sleeve friction are
29
much less suitable (Long, 2008). Karlsrud (2005) performed anisotropically consolidated triaxial
compression (CAUC) testing on the same Norwegian clay alongside SCPTu testing and found
that su predicted using cone factor Nu (Section 3.1, which uses pore pressure measurements)
provided a much more reliable and narrower range of su than other empirical cone factors, mainly
Nkt. Boylan et al., (2007) completed similar testing on the Bothkennar Norwegian test site using
high quality Sherbrooke block sampling, and concluded that Nu predicted shear strength most
accurately, reinforcing Karlsrud (2005) findings.
2.3 CPTu Correlation to Classification and Engineering Properties
Classification and engineering properties of soils can be estimated from CPTu
measurements through simple empirical methods. Classification is estimated based on normalized
measurements of tip resistance, sleeve friction, and pore pressure, which, when plotted with one
another on two-dimensional charts, form zones designated for specific soil types.
2.3.1 Classification
More than 25 different empirical classification charts have been developed by researchers
for use with CPTu results (NCHRP, 2007). In current geotechnical practice, charts created by
Robertson (1990) have emerged as some of the most useful and applicable charts for general
classification of soils with CPTu results (NCHRP, 2007). The two charts published by Robertson
(1990) plot normalized tip resistance (Qt) versus both sleeve friction ratio (Fr; Figure 2.9a) and
normalized pore pressure (Bq; Figure 2.9b). Robertson (2009) acknowledges the convenience of
normalizing the parameters by in situ vertical effective and total stresses in attempt to eliminate
the influence of depth increasing overburden stresses on CPTu measurements (Equations 2.2
through 2.4).
Qt = (qt – v0) / 'v0 = qnet / 'v0 2.2

30
Fr = fs / (qt – v0) = fs / qnet 2.3
Bq = (u2 – u0) / (qt – v0) = u / qnet 2.4
where qt = measured corrected tip resistance (psf), v0 = estimated in situ total vertical effective
stress (psf), 'v0 = estimated in situ vertical effective stress (psf), fs = measured sleeve friction
(psf), u2 = measured pore pressure (psf), and u0 = hydrostatic water pressure (psf).
Normalization using overbearing pressures is not a "perfect" solution since they are not
the only factor altering CPTu measurements; however it is the most practical and easiest
normalization method (Schneider et al., 2008). Normalizing by overburden stresses also allows
for the plotted CPTu data to be classified based on other soil properties. The regions within the
two charts by Robertson (1990) represent a large spectrum of soil types, ranging from sensitive
fine grained soil to gravelly sand. The regions were empirically created based on a wealth of
worldwide published and unpublished test data. Robertson (2009) provided an updated version of
the Robertson (1990) Qt vs. Fr plot to include trends in the values of OCR, soil sensitivity, and
normalized remolded shear strength based on additional data collected (Figure 2.9c). Schneider et
al. (2008) developed a new classification chart (Figure 2.9d) using Qt and Bq with refined regions
based more on deposits of soft clay and silty clay with varying degrees of clay sensitivity.
Essentially, the data plot at the same Qt-Bq space at Figure 2.9b, but the classification regions
differ from Robertson (1990). Figure 2.10 illustrates the two charts together for comparison. The
curvature of the region separation lines within Figure 2.9d is due to the theory of increasing Qt
with decreasing Bq from partial drainage and consolidation that occurs in stiffer soils, which is
supported by data presented by Schneider et al. (2008). In addition, the sensitive clay region for
the updated chart encompasses a wider range of measured values of Bq. Schneider et al. (2008)
states that this region isn't necessarily intended to capture all sensitive clay deposits, but is more
for the purpose of identifying clays with highly collapsible structure.
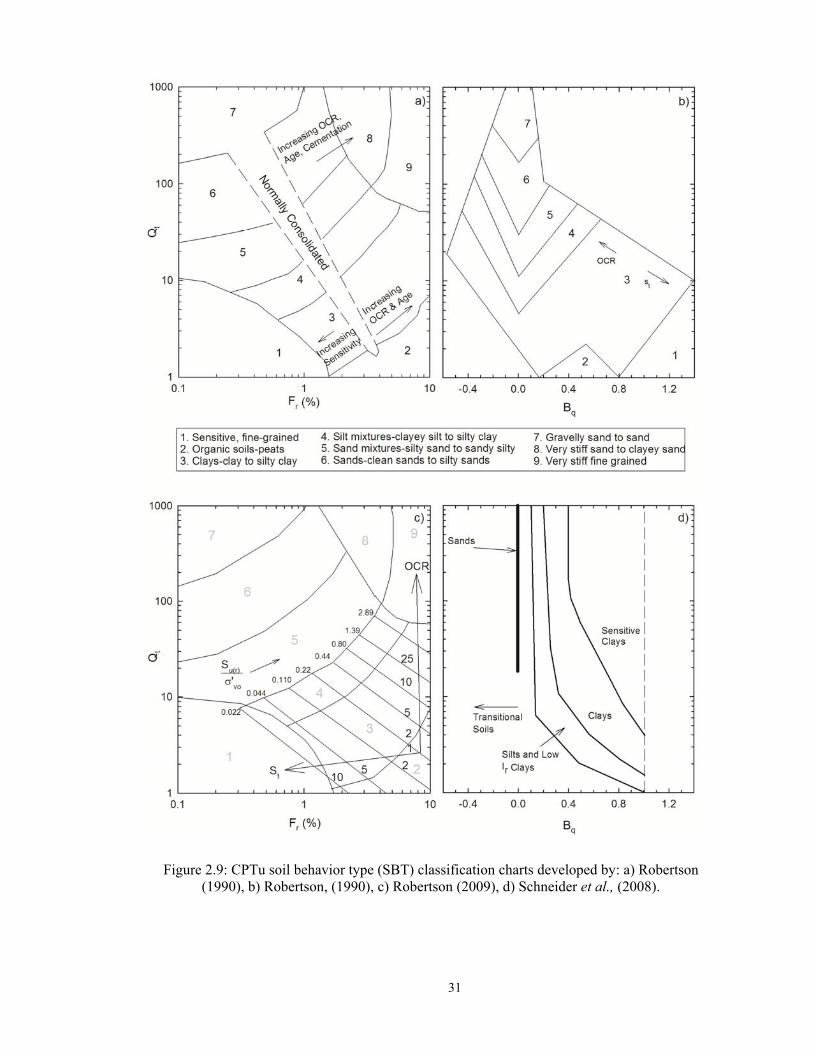
31
Figure 2.9: CPTu soil behavior type (SBT) classification charts developed by: a) Robertson (1990), b) Robertson, (1990), c) Robertson (2009), d) Schneider et al., (2008).
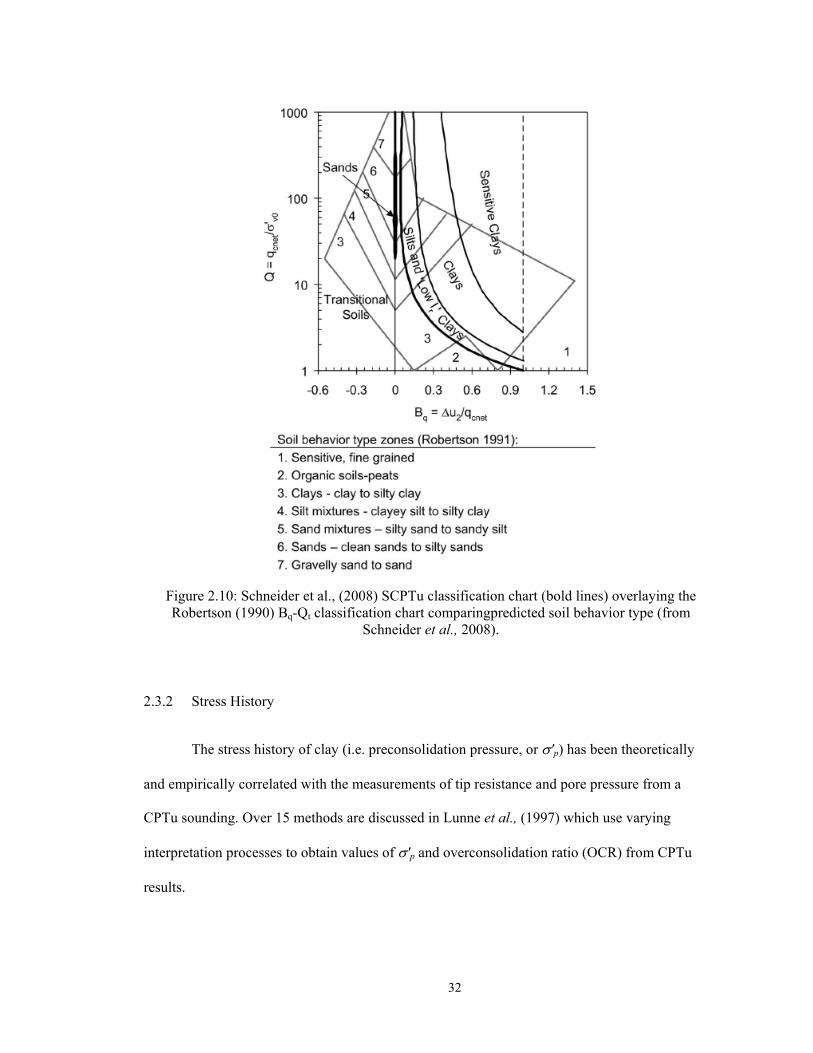
32
Figure 2.10: Schneider et al., (2008) SCPTu classification chart (bold lines) overlaying the Robertson (1990) Bq-Qt classification chart comparingpredicted soil behavior type (from
Schneider et al., 2008).
2.3.2 Stress History
The stress history of clay (i.e. preconsolidation pressure, or 'p) has been theoretically
and empirically correlated with the measurements of tip resistance and pore pressure from a
CPTu sounding. Over 15 methods are discussed in Lunne et al., (1997) which use varying
interpretation processes to obtain values of 'p and overconsolidation ratio (OCR) from CPTu
results.
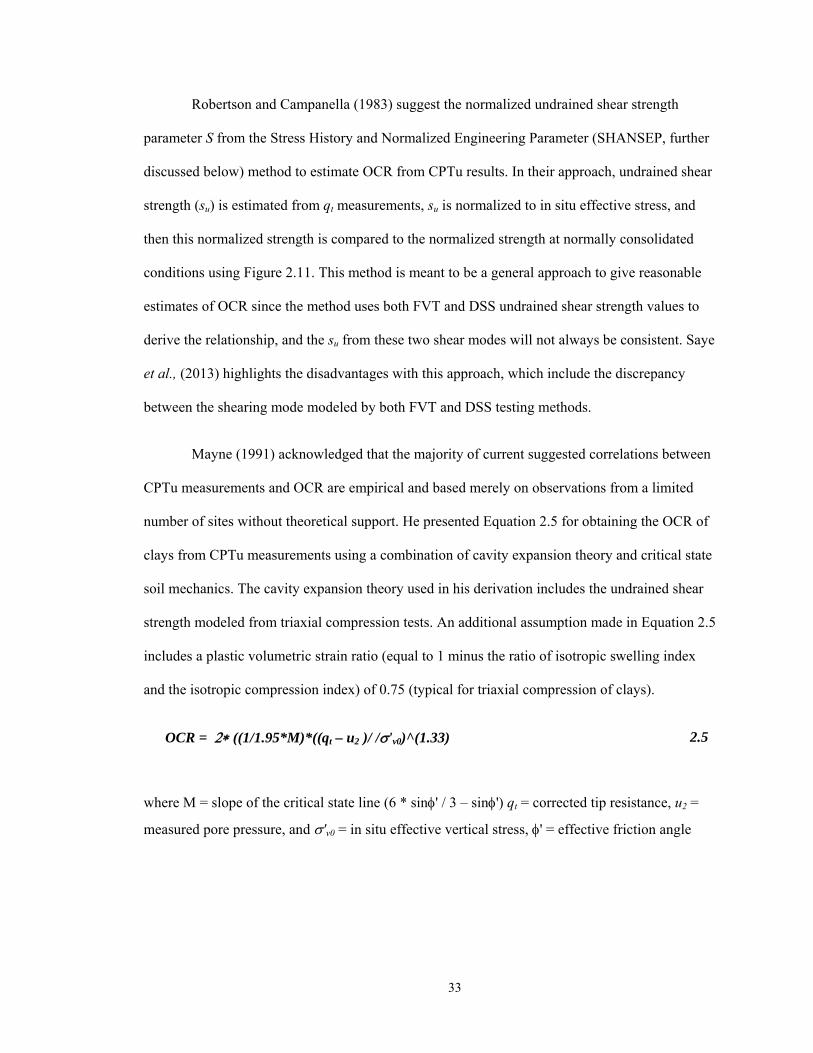
33
Robertson and Campanella (1983) suggest the normalized undrained shear strength
parameter S from the Stress History and Normalized Engineering Parameter (SHANSEP, further
discussed below) method to estimate OCR from CPTu results. In their approach, undrained shear
strength (su) is estimated from qt measurements, su is normalized to in situ effective stress, and
then this normalized strength is compared to the normalized strength at normally consolidated
conditions using Figure 2.11. This method is meant to be a general approach to give reasonable
estimates of OCR since the method uses both FVT and DSS undrained shear strength values to
derive the relationship, and the su from these two shear modes will not always be consistent. Saye
et al., (2013) highlights the disadvantages with this approach, which include the discrepancy
between the shearing mode modeled by both FVT and DSS testing methods.
Mayne (1991) acknowledged that the majority of current suggested correlations between
CPTu measurements and OCR are empirical and based merely on observations from a limited
number of sites without theoretical support. He presented Equation 2.5 for obtaining the OCR of
clays from CPTu measurements using a combination of cavity expansion theory and critical state
soil mechanics. The cavity expansion theory used in his derivation includes the undrained shear
strength modeled from triaxial compression tests. An additional assumption made in Equation 2.5
includes a plastic volumetric strain ratio (equal to 1 minus the ratio of isotropic swelling index
and the isotropic compression index) of 0.75 (typical for triaxial compression of clays).
OCR = ((1/1.95*M)*((qt – u2 )/ /'v0)^(1.33) 2.5
where M = slope of the critical state line (6 * sin' / 3 – sin') qt = corrected tip resistance, u2 =
measured pore pressure, and 'v0 = in situ effective vertical stress, ' = effective friction angle
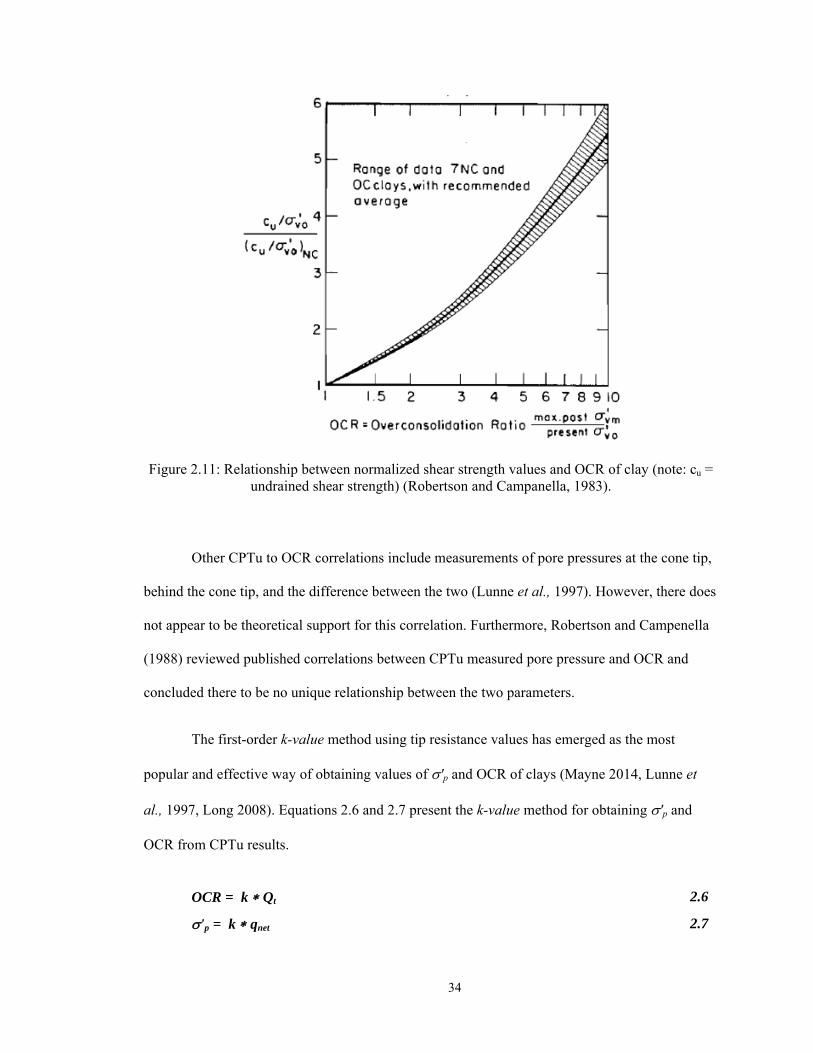
34
Figure 2.11: Relationship between normalized shear strength values and OCR of clay (note: cu = undrained shear strength) (Robertson and Campanella, 1983).
Other CPTu to OCR correlations include measurements of pore pressures at the cone tip,
behind the cone tip, and the difference between the two (Lunne et al., 1997). However, there does
not appear to be theoretical support for this correlation. Furthermore, Robertson and Campenella
(1988) reviewed published correlations between CPTu measured pore pressure and OCR and
concluded there to be no unique relationship between the two parameters.
The first-order k-value method using tip resistance values has emerged as the most
popular and effective way of obtaining values of 'p and OCR of clays (Mayne 2014, Lunne et
al., 1997, Long 2008). Equations 2.6 and 2.7 present the k-value method for obtaining 'p and
OCR from CPTu results.
OCR = kQt 2.6
'p = kqnet 2.7
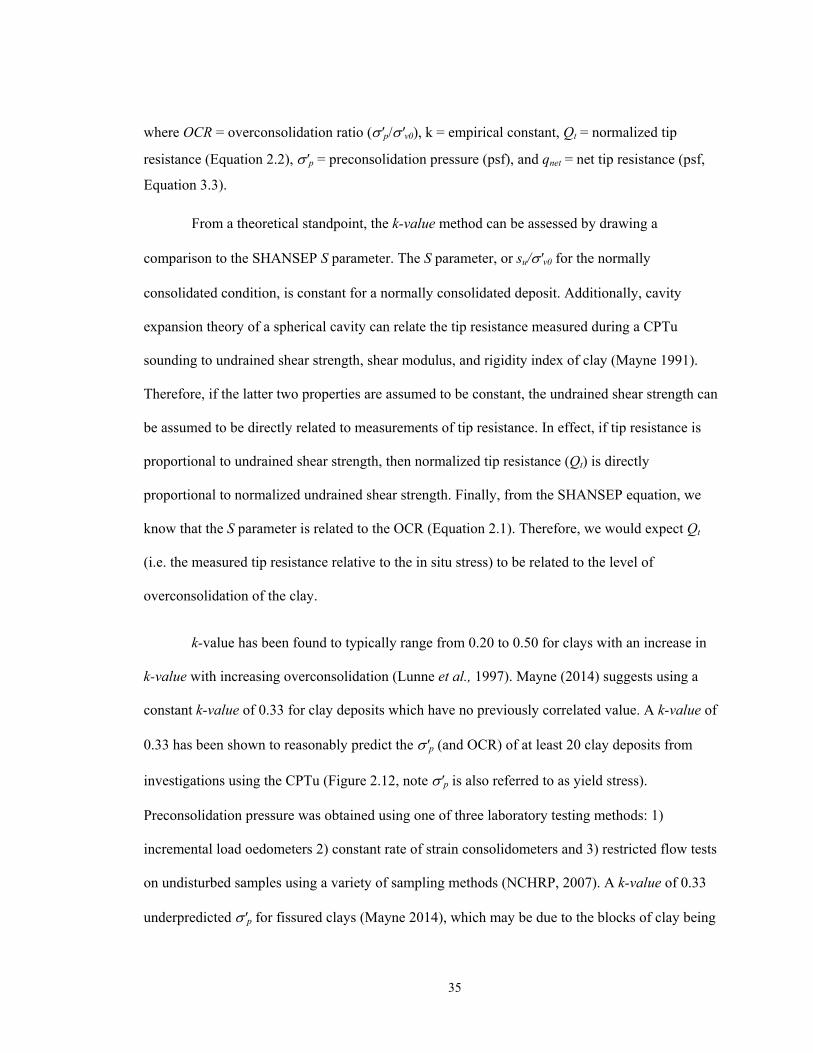
35
where OCR = overconsolidation ratio ('p/'v0), k = empirical constant, Qt = normalized tip
resistance (Equation 2.2), 'p = preconsolidation pressure (psf), and qnet = net tip resistance (psf,
Equation 3.3).
From a theoretical standpoint, the k-value method can be assessed by drawing a
comparison to the SHANSEP S parameter. The S parameter, or su/'v0 for the normally
consolidated condition, is constant for a normally consolidated deposit. Additionally, cavity
expansion theory of a spherical cavity can relate the tip resistance measured during a CPTu
sounding to undrained shear strength, shear modulus, and rigidity index of clay (Mayne 1991).
Therefore, if the latter two properties are assumed to be constant, the undrained shear strength can
be assumed to be directly related to measurements of tip resistance. In effect, if tip resistance is
proportional to undrained shear strength, then normalized tip resistance (Qt) is directly
proportional to normalized undrained shear strength. Finally, from the SHANSEP equation, we
know that the S parameter is related to the OCR (Equation 2.1). Therefore, we would expect Qt
(i.e. the measured tip resistance relative to the in situ stress) to be related to the level of
overconsolidation of the clay.
k-value has been found to typically range from 0.20 to 0.50 for clays with an increase in
k-value with increasing overconsolidation (Lunne et al., 1997). Mayne (2014) suggests using a
constant k-value of 0.33 for clay deposits which have no previously correlated value. A k-value of
0.33 has been shown to reasonably predict the 'p (and OCR) of at least 20 clay deposits from
investigations using the CPTu (Figure 2.12, note 'p is also referred to as yield stress).
Preconsolidation pressure was obtained using one of three laboratory testing methods: 1)
incremental load oedometers 2) constant rate of strain consolidometers and 3) restricted flow tests
on undisturbed samples using a variety of sampling methods (NCHRP, 2007). A k-value of 0.33
underpredicted 'p for fissured clays (Mayne 2014), which may be due to the blocks of clay being
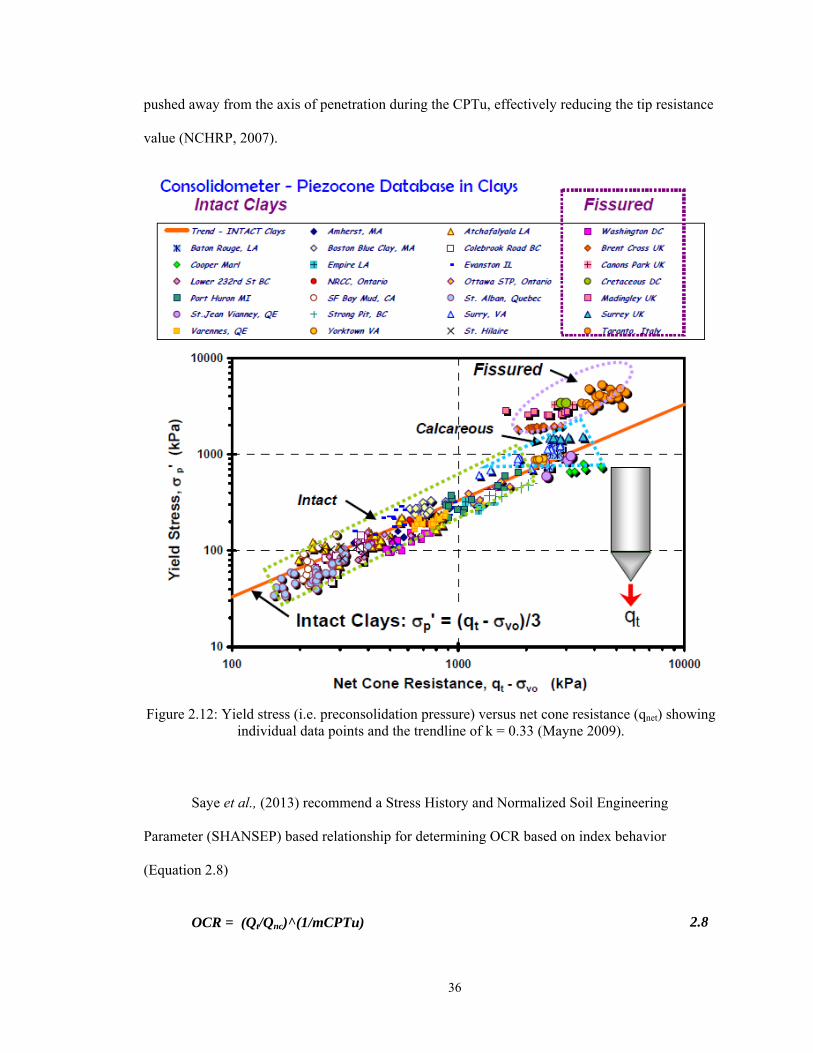
36
pushed away from the axis of penetration during the CPTu, effectively reducing the tip resistance
value (NCHRP, 2007).
Figure 2.12: Yield stress (i.e. preconsolidation pressure) versus net cone resistance (qnet) showing individual data points and the trendline of k = 0.33 (Mayne 2009).
Saye et al., (2013) recommend a Stress History and Normalized Soil Engineering
Parameter (SHANSEP) based relationship for determining OCR based on index behavior
(Equation 2.8)
OCR = (Qt/Qnc)^(1/mCPTu) 2.8

37
where OCR = overconsolidation ratio ('p/'v0), Qt = normalized tip resistance (Equation 2.2), Qnc
= empirical coefficient dependent on Liquid Limit (LL) or Plastic Limit (PL), and mCPTu =
empirical coefficient dependent on LL or PL.
Saye et al., (2013) observed a linear relationship between the log-log plot of OCR versus
Qt, OCR versus normalized field vane strength, and OCR versus the flat dilatometer horizontal
stress index (Figure 2.13) for Connecticut Valley Varved Clay, a glacially deposited layered lake
deposit. The empirically observed relationship between Qt and OCR (an R2 value of 0.99, with a
Qnc value of 3.59 and an mCPTu of 0.92) was applied to other tested clay sites to evaluate the
resulting coefficients. This included clay deposits in Norway, United States, Canada, and others.
OCR was obtained at the sites using laboratory oedometer tests on undisturbed soil samples (Saye
et al., 2013). The resulting Qnc and mCPTu values were compared to Atterberg limits of the tested
samples in order to evaluate a relationship between index testing and the CPTu coefficients.
Figure 2.14 illustrates the resulting comparisons.
Figure 2.13: SHANSEP based approach for determining OCR of clays applied to the in situ data of Connecticut Valley Varved Clay (Saye et al., 2013).
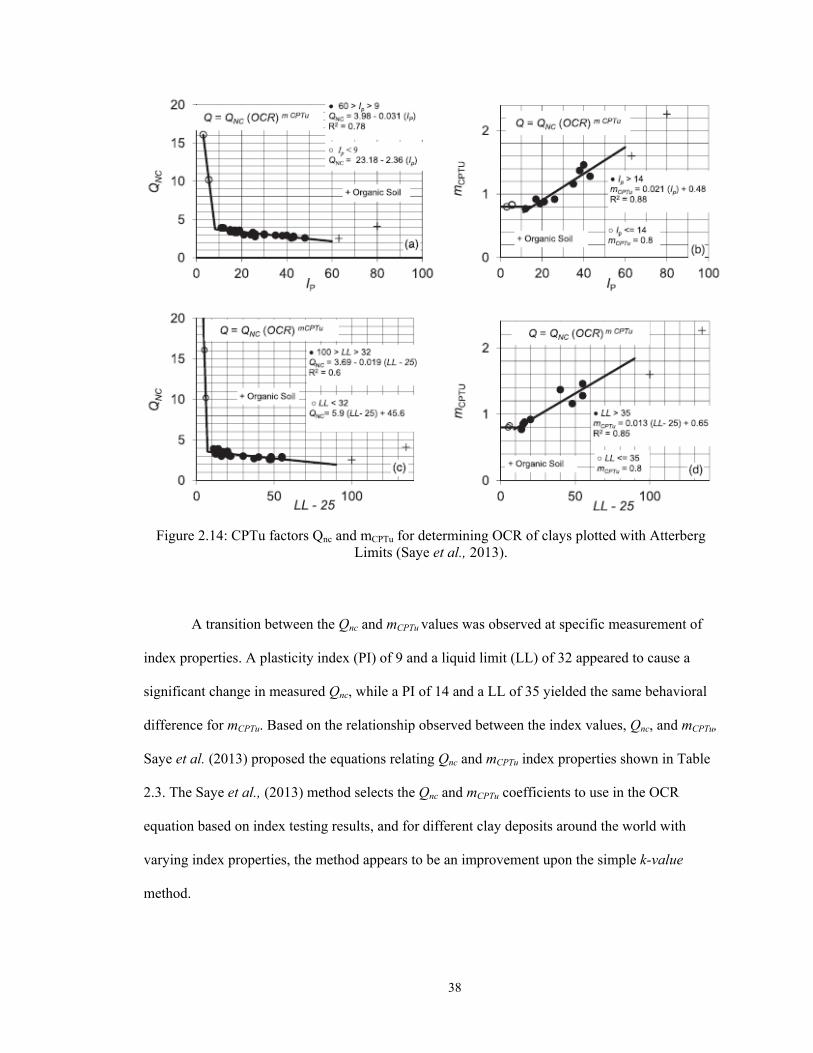
38
Figure 2.14: CPTu factors Qnc and mCPTu for determining OCR of clays plotted with Atterberg Limits (Saye et al., 2013).
A transition between the Qnc and mCPTu values was observed at specific measurement of
index properties. A plasticity index (PI) of 9 and a liquid limit (LL) of 32 appeared to cause a
significant change in measured Qnc, while a PI of 14 and a LL of 35 yielded the same behavioral
difference for mCPTu. Based on the relationship observed between the index values, Qnc, and mCPTu,
Saye et al. (2013) proposed the equations relating Qnc and mCPTu index properties shown in Table
2.3. The Saye et al., (2013) method selects the Qnc and mCPTu coefficients to use in the OCR
equation based on index testing results, and for different clay deposits around the world with
varying index properties, the method appears to be an improvement upon the simple k-value
method.

39
Table 2.3: Saye et al., (2013) Qnc and mCPTu equations for determining OCR of clays
2.3.3 Undrained Shear Strength
Undrained shear strength, su, can be predicted from CPTu results using empirical
correlations developed based on in-situ effective stress, cone tip resistance, and in situ and cone-
measured pore pressures. Although theoretical methods have been developed to predict undrained
shear strength from (S)CPTu results, Lunne et al., (1997) state that since CPTs are elaborate tests,
the simplifying assumptions made in theoretical methods are ineffective in determining accurate
su values, and empirical methods should be used. Thus, su correlations used herein are empirically
based.
Three primary methods exist for determining undrained shear strength (su) from CPTu
results. These include empirical correlations developed based on in-situ effective stress, tip
resistance, and pore pressure (Lunne et al., 1997, Remai 2013). Equations 2.9 through 2.11 are
used to obtained su from CPTu measurements.
Nkt = qnet/su 2.9
Nke = ([qt-u2]/su) 2.10
Nu = u/su 2.11
Condition Equation
PI < 9 Qnc = 23.18 - 2.36*PI
65 > PI > 9 Qnc = 3.98 – 0.031*PI
PI > 14 mCPTu = 0.021*PI -+ 0.48
PI <= 14 mCPTu = 0.80
LL < 32 Qnc = 5.9*(LL-25) – 45.6
100 > LL > 32 Qnc = 3.69 – 0.019*(LL-25)
LL > 35 mCPTu = 0.013*(LL-25) + 0.65
LL <= 35 mCPTu = 0.80
Note: PI = Plasticity Index, LL = Liquid Limit
40
where qnet = net tip resistance (psf, Equation 3.3), su = undrained shear strength, qt = corrected tip
resistance (psf, Equation 3.2), u2 = measured pore pressure (psf), u = difference between
measured pore pressure and hydrostatic pore pressure (psf, u2 and u0).
Strength coefficient Nkt is considered the classical approach and is most commonly used
for correlating CPTu and su for clays and clayey silts (NCHRP, 2007). Nkt incorporates tip
resistance and 'v0 to correlate to su, and is derived assuming an undrained bearing capacity
failure at the cone tip during penetration for a soil with undrained friction angle, = 0° (Wei et
al., 2010). A wide range of Nkt values exist depending on the type of clay, type of laboratory
testing used for correlation to CPTu results (i.e., mode of shear), and quality of samples tested in
the laboratory. Nkt has been found to typically range from 10 to 20, and average 15, when CPTu
results are correlated to triaxial compression or field vane shear testing (FVT) reference su (Lunne
et al., 1997).
Aas et al. (1986) calculated Nkt cone factors of onshore Norwegian clays and North Sea
clays using direct simple shear (DSS), triaxial compression (TC), and triaxial extension (TE)
measured laboratory su. When the resulting Nkt cone factors were compared to plasticity index of
the same undisturbed soil samples, PI, an increasing trend was observed between the two
parameters (Figure 2.15). Note that the Nkt cone factors displayed in the top plot in Figure 2.15
are calculated using the average su value from DSS, TC, and TE, while the Nkt in the bottom plot
of Figure 2.15 are calculated using only TC. Nkt values using the average su ranged from 8 to 16.
Wei et al. (2010) calculated the Nkt cone factor for a clay deposit underlying an existing
levee in New Orleans using a single CPTu sounding and an adjacent boring from which 5 Shelby
tube samples were collected at various depths and unconsolidated unconfined compression and
triaxial unconsolidated undrained compression tests (the consolidation conditions were not
specified) was performed to determine su with depth. The resulting Nkt values ranged from 10 to
15, with a best-fit value of 12. The resulting undrained shear strength profile estimated from the
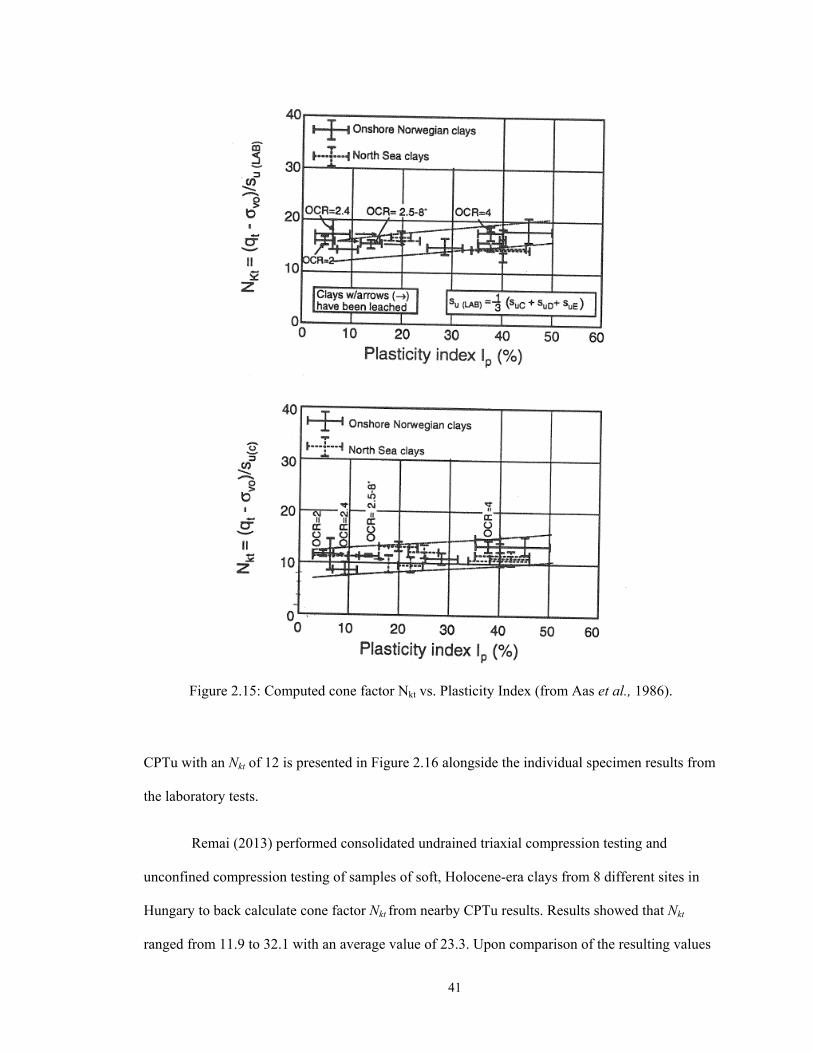
41
Figure 2.15: Computed cone factor Nkt vs. Plasticity Index (from Aas et al., 1986).
CPTu with an Nkt of 12 is presented in Figure 2.16 alongside the individual specimen results from
the laboratory tests.
Remai (2013) performed consolidated undrained triaxial compression testing and
unconfined compression testing of samples of soft, Holocene-era clays from 8 different sites in
Hungary to back calculate cone factor Nkt from nearby CPTu results. Results showed that Nkt
ranged from 11.9 to 32.1 with an average value of 23.3. Upon comparison of the resulting values
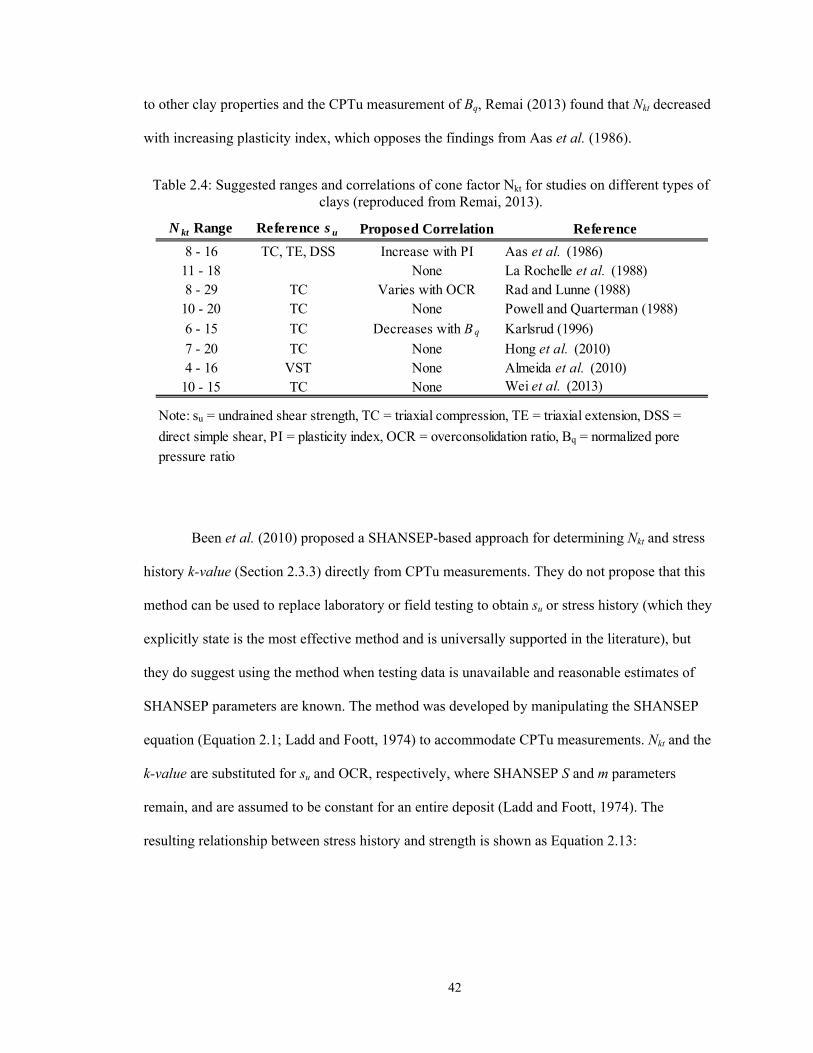
42
to other clay properties and the CPTu measurement of Bq, Remai (2013) found that Nkt decreased
with increasing plasticity index, which opposes the findings from Aas et al. (1986).
Table 2.4: Suggested ranges and correlations of cone factor Nkt for studies on different types of clays (reproduced from Remai, 2013).
Been et al. (2010) proposed a SHANSEP-based approach for determining Nkt and stress
history k-value (Section 2.3.3) directly from CPTu measurements. They do not propose that this
method can be used to replace laboratory or field testing to obtain su or stress history (which they
explicitly state is the most effective method and is universally supported in the literature), but
they do suggest using the method when testing data is unavailable and reasonable estimates of
SHANSEP parameters are known. The method was developed by manipulating the SHANSEP
equation (Equation 2.1; Ladd and Foott, 1974) to accommodate CPTu measurements. Nkt and the
k-value are substituted for su and OCR, respectively, where SHANSEP S and m parameters
remain, and are assumed to be constant for an entire deposit (Ladd and Foott, 1974). The
resulting relationship between stress history and strength is shown as Equation 2.13:
N kt Range Reference s u Proposed Correlation Reference
8 - 16 TC, TE, DSS Increase with PI Aas et al. (1986)11 - 18 None La Rochelle et al. (1988)8 - 29 TC Varies with OCR Rad and Lunne (1988)
10 - 20 TC None Powell and Quarterman (1988)
6 - 15 TC Decreases with B q Karlsrud (1996)
7 - 20 TC None Hong et al. (2010)4 - 16 VST None Almeida et al. (2010)
10 - 15 TC None Wei et al. (2013)
Note: su = undrained shear strength, TC = triaxial compression, TE = triaxial extension, DSS =
direct simple shear, PI = plasticity index, OCR = overconsolidation ratio, Bq = normalized pore
pressure ratio
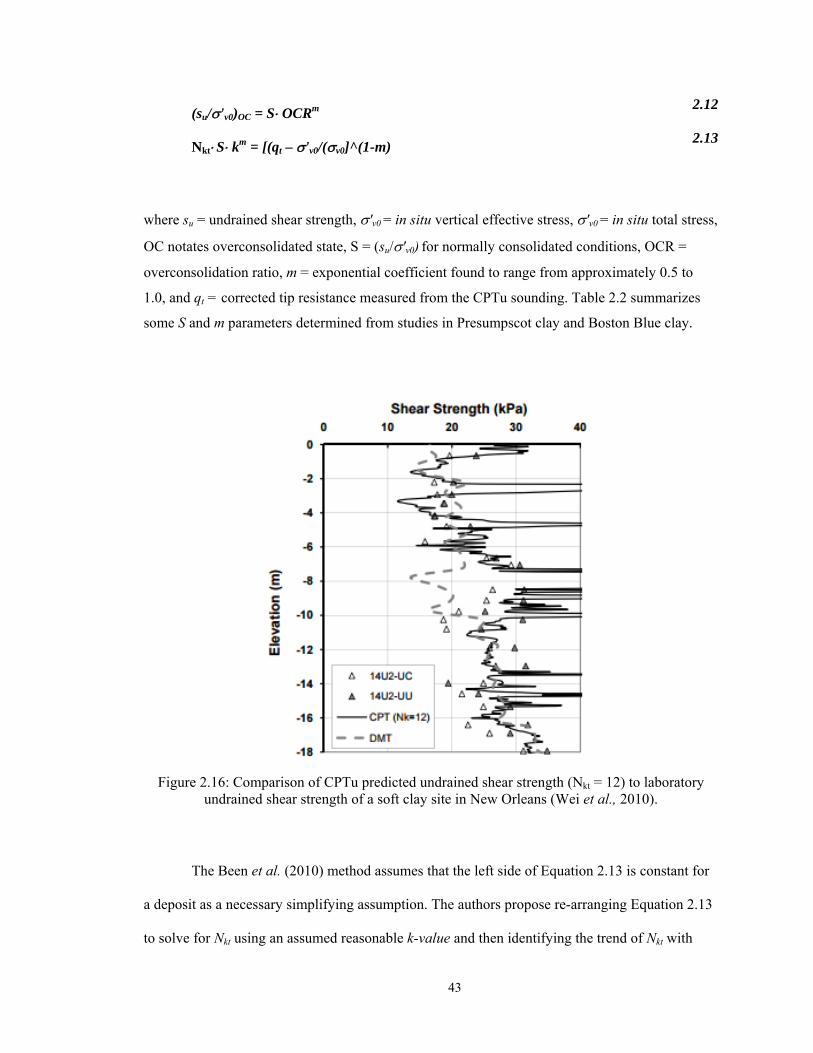
43
(su/'v0)OC = SOCRm 2.12
Nkt Skm = [(qt – 'v0/(v0]^(1-m) 2.13
where su = undrained shear strength, 'v0 = in situ vertical effective stress, 'v0 = in situ total stress,
OC notates overconsolidated state, S = (su/'v0) for normally consolidated conditions, OCR =
overconsolidation ratio, m = exponential coefficient found to range from approximately 0.5 to
1.0, and qt = corrected tip resistance measured from the CPTu sounding. Table 2.2 summarizes
some S and m parameters determined from studies in Presumpscot clay and Boston Blue clay.
Figure 2.16: Comparison of CPTu predicted undrained shear strength (Nkt = 12) to laboratory undrained shear strength of a soft clay site in New Orleans (Wei et al., 2010).
The Been et al. (2010) method assumes that the left side of Equation 2.13 is constant for
a deposit as a necessary simplifying assumption. The authors propose re-arranging Equation 2.13
to solve for Nkt using an assumed reasonable k-value and then identifying the trend of Nkt with
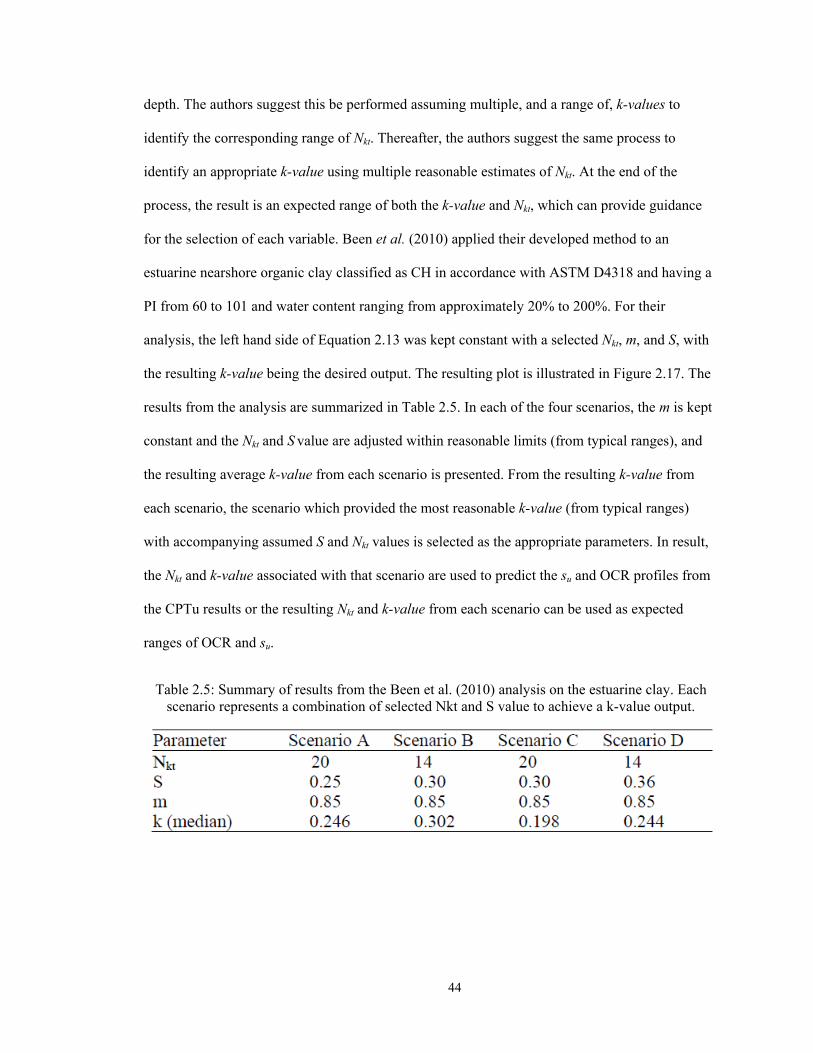
44
depth. The authors suggest this be performed assuming multiple, and a range of, k-values to
identify the corresponding range of Nkt. Thereafter, the authors suggest the same process to
identify an appropriate k-value using multiple reasonable estimates of Nkt. At the end of the
process, the result is an expected range of both the k-value and Nkt, which can provide guidance
for the selection of each variable. Been et al. (2010) applied their developed method to an
estuarine nearshore organic clay classified as CH in accordance with ASTM D4318 and having a
PI from 60 to 101 and water content ranging from approximately 20% to 200%. For their
analysis, the left hand side of Equation 2.13 was kept constant with a selected Nkt, m, and S, with
the resulting k-value being the desired output. The resulting plot is illustrated in Figure 2.17. The
results from the analysis are summarized in Table 2.5. In each of the four scenarios, the m is kept
constant and the Nkt and S value are adjusted within reasonable limits (from typical ranges), and
the resulting average k-value from each scenario is presented. From the resulting k-value from
each scenario, the scenario which provided the most reasonable k-value (from typical ranges)
with accompanying assumed S and Nkt values is selected as the appropriate parameters. In result,
the Nkt and k-value associated with that scenario are used to predict the su and OCR profiles from
the CPTu results or the resulting Nkt and k-value from each scenario can be used as expected
ranges of OCR and su.
Table 2.5: Summary of results from the Been et al. (2010) analysis on the estuarine clay. Each scenario represents a combination of selected Nkt and S value to achieve a k-value output.
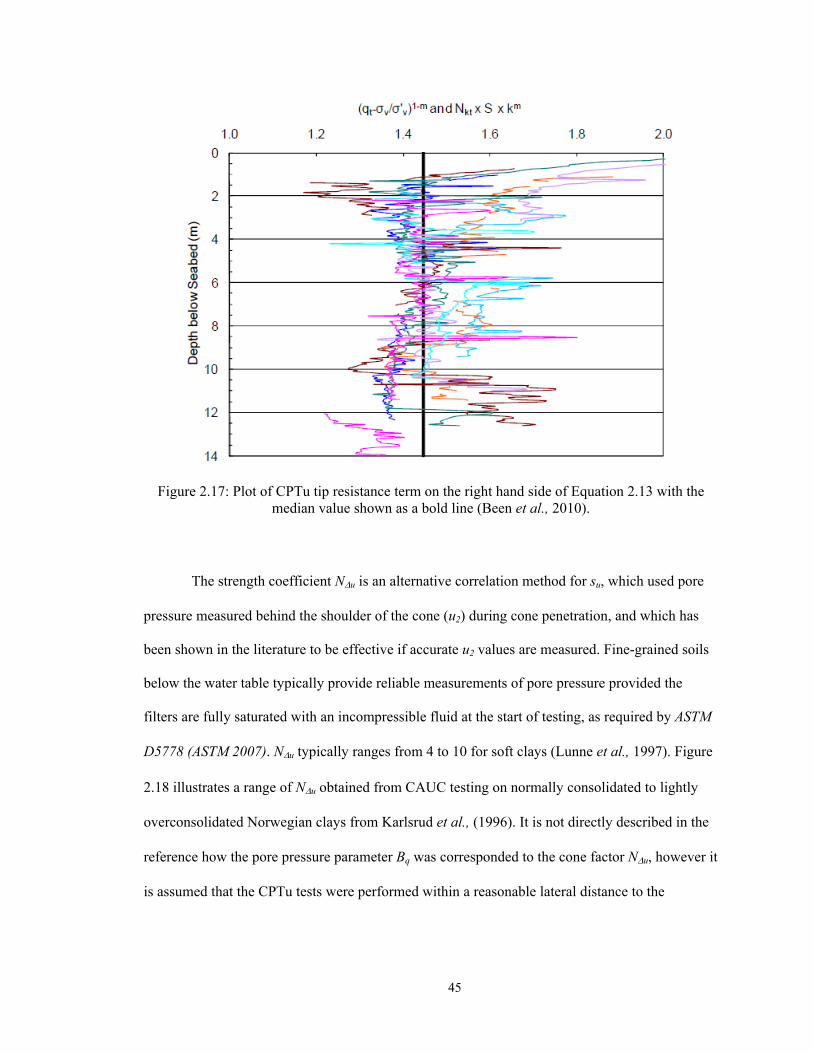
45
Figure 2.17: Plot of CPTu tip resistance term on the right hand side of Equation 2.13 with the median value shown as a bold line (Been et al., 2010).
The strength coefficient Nu is an alternative correlation method for su, which used pore
pressure measured behind the shoulder of the cone (u2) during cone penetration, and which has
been shown in the literature to be effective if accurate u2 values are measured. Fine-grained soils
below the water table typically provide reliable measurements of pore pressure provided the
filters are fully saturated with an incompressible fluid at the start of testing, as required by ASTM
D5778 (ASTM 2007). Nu typically ranges from 4 to 10 for soft clays (Lunne et al., 1997). Figure
2.18 illustrates a range of Nu obtained from CAUC testing on normally consolidated to lightly
overconsolidated Norwegian clays from Karlsrud et al., (1996). It is not directly described in the
reference how the pore pressure parameter Bq was corresponded to the cone factor Nu, however it
is assumed that the CPTu tests were performed within a reasonable lateral distance to the
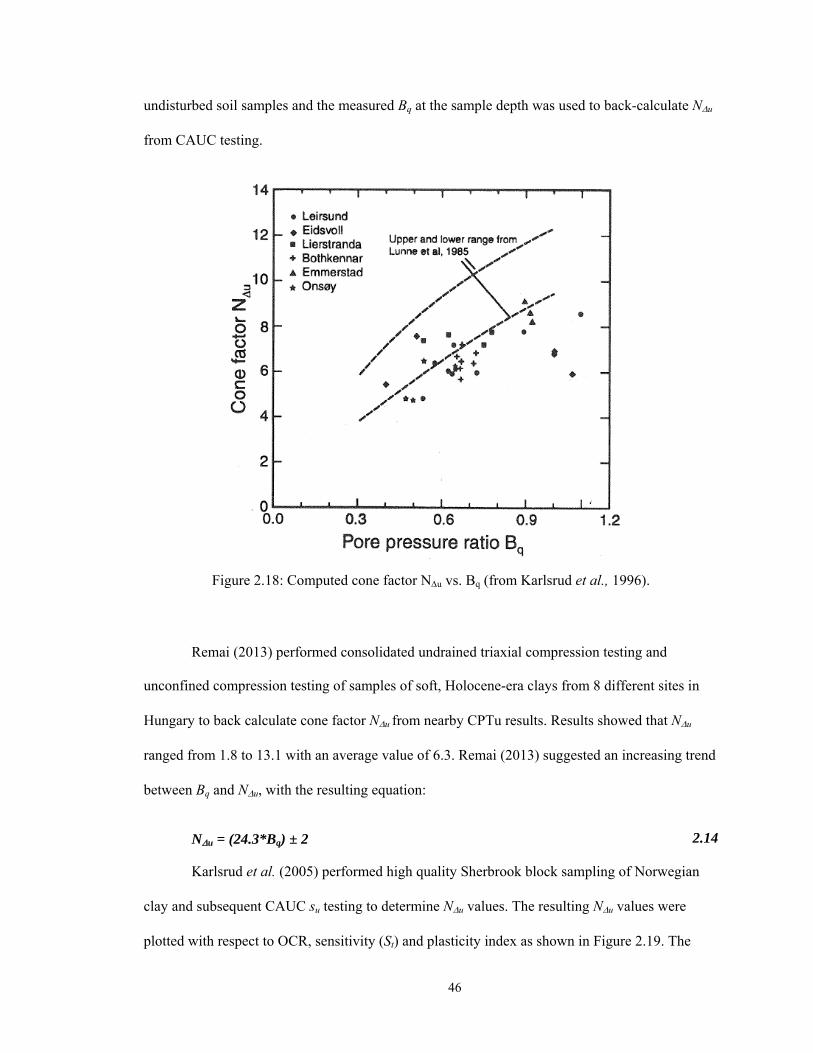
46
undisturbed soil samples and the measured Bq at the sample depth was used to back-calculate Nu
from CAUC testing.
Figure 2.18: Computed cone factor Nu vs. Bq (from Karlsrud et al., 1996).
Remai (2013) performed consolidated undrained triaxial compression testing and
unconfined compression testing of samples of soft, Holocene-era clays from 8 different sites in
Hungary to back calculate cone factor Nu from nearby CPTu results. Results showed that Nu
ranged from 1.8 to 13.1 with an average value of 6.3. Remai (2013) suggested an increasing trend
between Bq and Nu, with the resulting equation:
Nu = (24.3*Bq) ± 2 2.14
Karlsrud et al. (2005) performed high quality Sherbrook block sampling of Norwegian
clay and subsequent CAUC su testing to determine Nu values. The resulting Nu values were
plotted with respect to OCR, sensitivity (St) and plasticity index as shown in Figure 2.19. The
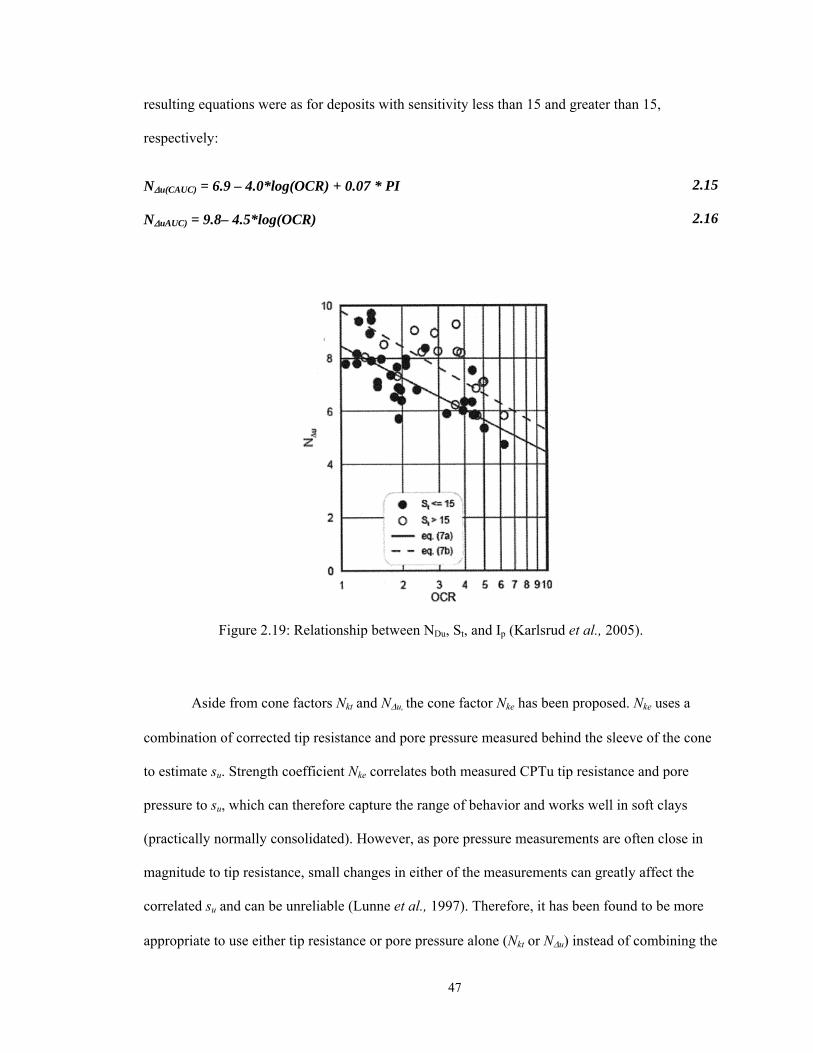
47
resulting equations were as for deposits with sensitivity less than 15 and greater than 15,
respectively:
Nu(CAUC) = 6.9 – 4.0*log(OCR) + 0.07 * PI 2.15
NuAUC) = 9.8– 4.5*log(OCR) 2.16
Figure 2.19: Relationship between NDu, St, and Ip (Karlsrud et al., 2005).
Aside from cone factors Nkt and Nu, the cone factor Nke has been proposed. Nke uses a
combination of corrected tip resistance and pore pressure measured behind the sleeve of the cone
to estimate su. Strength coefficient Nke correlates both measured CPTu tip resistance and pore
pressure to su, which can therefore capture the range of behavior and works well in soft clays
(practically normally consolidated). However, as pore pressure measurements are often close in
magnitude to tip resistance, small changes in either of the measurements can greatly affect the
correlated su and can be unreliable (Lunne et al., 1997). Therefore, it has been found to be more
appropriate to use either tip resistance or pore pressure alone (Nkt or Nu) instead of combining the

48
two parameters (Remai 2013) Typical values of Nke range between 6 and 12 and average of 9
(Lunne et al., 1997).
2.3.4 Seismic Measurements in CPTu testing
During seismic CPTu testing, seismic shear wave velocity measurements can be
conducted at discrete intervals throughout the subsurface profile. The generated shear waves
cause low, non-destructive shear strains in the clay which can be correlated to elastic stress-strain
behavior of clay (Mayne, 2000). The measurement of shear wave velocity during a CPTu test is
described subsequently in methods Section 3.1.2.
Small strain shear modulus, G0, is soil property used to determine soil response to
dynamic loading from earthquakes, construction activity, or pile installations. It is an important
measure of soil stiffness and is an essential input parameter for the analysis and design of
foundations on clay (Nguyen et al., 2014). Shear wave velocity measured during seismic cone
penetration testing can be related to the G0 through Equation 2.17. Shear straining during the
seismic testing imparts strains less than 0.001%, which is non-destructive and well within the
linear portion of the stress-strain curve (Kim and Stokoe, 1995).
G0 = t*Vs2 2.17
where is total unit weight (pcf) and Vs is measured shear wave velocity (ft/s)
Additionally, the small strain shear modulus can be relation to the rigidity index (Ir) of
the soil (Equation 2.18), which can be used in foundation design to estimate displacement
response to surface loading. This relationship requires the undrained shear strength of the
material.
Ir = G0/su 2.18
where G0 = the small strain shear modulus (psf) and su = undrained shear strength (psf)
49
A study by Long and Donohue (2008) examined 11 Norwegian clay sites using both
surface waves and CPTu to obtain Vs values. The studied clay ranged from 17% to 60% clay, had
OCR of 1.0 to 6.0, and sensitivities ranging from 2 to 1000. Values of Vs in the study ranged from
131 ft/s to 1,148 ft/s and G0 values ranged from 56 ksf to 5,140 ksf. The study suggested that G0
is related to in situ applied stress, void ratio, and OCR.
Landon (2007) conducted SCPTu testing on Boston Blue clay, a silty clay deposit in
Massachusetts which has similar silt content to the Presumpscot clay and was deposited from the
same geologic process and period as the Presumpscot clay. At the Newbury, Massachusetts site
Landon (2007) measured the Vs of the BBC to range from 410 ft/s to 525 ft/s on a clay deposit
which ranged on OCR from 4.6 to 2.1.
Review of published literature has identified that geotechnical analyses and design in the
silty Presumpscot clay has posed considerable challenges when it comes to settlement and slope
stability. The challenges are mainly due to the highly variable properties of the Presumpscot clay
and the inevitable sample disturbance from conventional sampling methods and inconsistency of
current in situ techniques (i.e. field vane shear testing, FVT) effecting test results. While both
sampling and FVT can be performed with skilled operators and proper procedures, there still
remains a gap between the test results and their reliability of in situ behavior due to inevitable
effects of sample disturbance.
Review of published literature on the CPTu method has shown that the CPTu can be used
to properly characterize deposits of clay based on measurement of tip resistance, pore pressure,
sleeve friction, and shear wave velocity. Where current sampling techniques rely on discrete
sampling and test results, the CPTu provides nearly continuous measurements over the entire
deposit. The resulting measurements can be used to classify the clay based on empirical "soil
behavior type" classification chart and can also be correlated to engineering properties of
50
undrained shear strength and OCR. Correlations to these parameters have been proposed between
index properties and CPTu measurements, however most (if not all) literature suggests that the
development of engineering properties using CPTu results should be performed on a site-specific
basis using other forms of testing. Conclusively, the CPTu appears to contain great potential for
helping to solve geotechnical challenges for the Presumpscot clay.
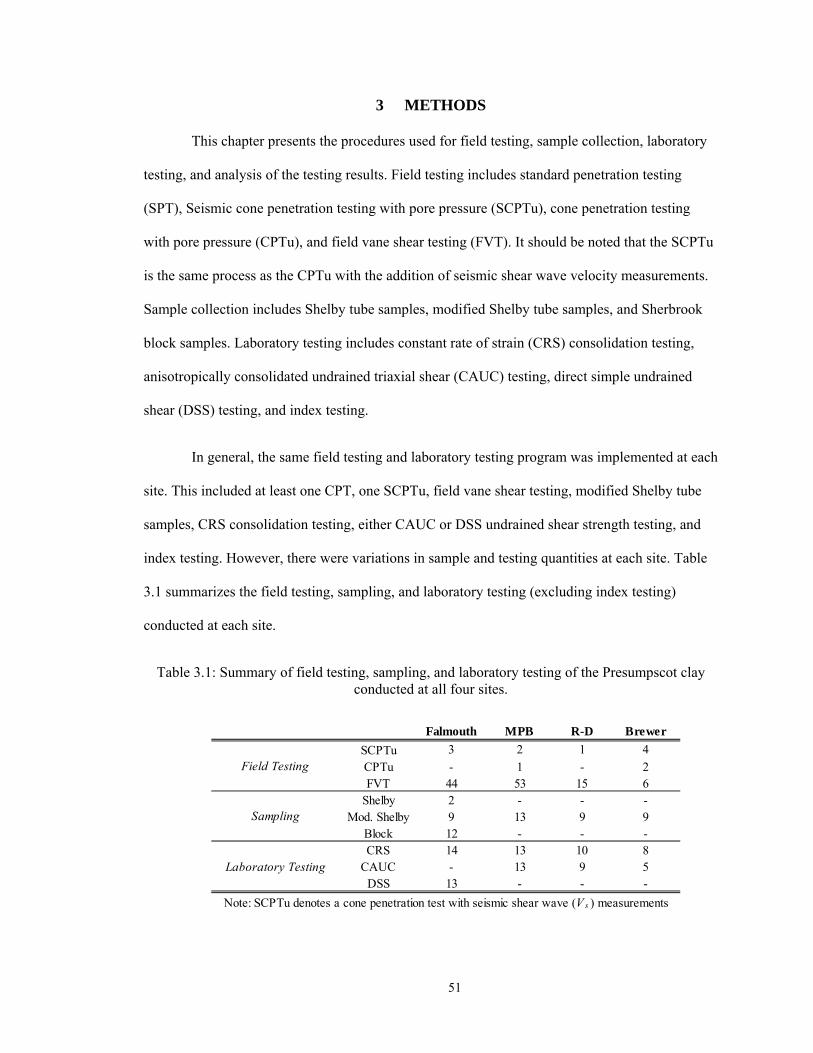
51
Falmouth MPB R-D Brewer
SCPTu 3 2 1 4
CPTu - 1 - 2FVT 44 53 15 6
Shelby 2 - - -Mod. Shelby 9 13 9 9
Block 12 - - -CRS 14 13 10 8
CAUC - 13 9 5DSS 13 - - -
Field Testing
Sampling
Laboratory Testing
Note: SCPTu denotes a cone penetration test with seismic shear wave (V s ) measurements
3 METHODS
This chapter presents the procedures used for field testing, sample collection, laboratory
testing, and analysis of the testing results. Field testing includes standard penetration testing
(SPT), Seismic cone penetration testing with pore pressure (SCPTu), cone penetration testing
with pore pressure (CPTu), and field vane shear testing (FVT). It should be noted that the SCPTu
is the same process as the CPTu with the addition of seismic shear wave velocity measurements.
Sample collection includes Shelby tube samples, modified Shelby tube samples, and Sherbrook
block samples. Laboratory testing includes constant rate of strain (CRS) consolidation testing,
anisotropically consolidated undrained triaxial shear (CAUC) testing, direct simple undrained
shear (DSS) testing, and index testing.
In general, the same field testing and laboratory testing program was implemented at each
site. This included at least one CPT, one SCPTu, field vane shear testing, modified Shelby tube
samples, CRS consolidation testing, either CAUC or DSS undrained shear strength testing, and
index testing. However, there were variations in sample and testing quantities at each site. Table
3.1 summarizes the field testing, sampling, and laboratory testing (excluding index testing)
conducted at each site.
Table 3.1: Summary of field testing, sampling, and laboratory testing of the Presumpscot clay conducted at all four sites.
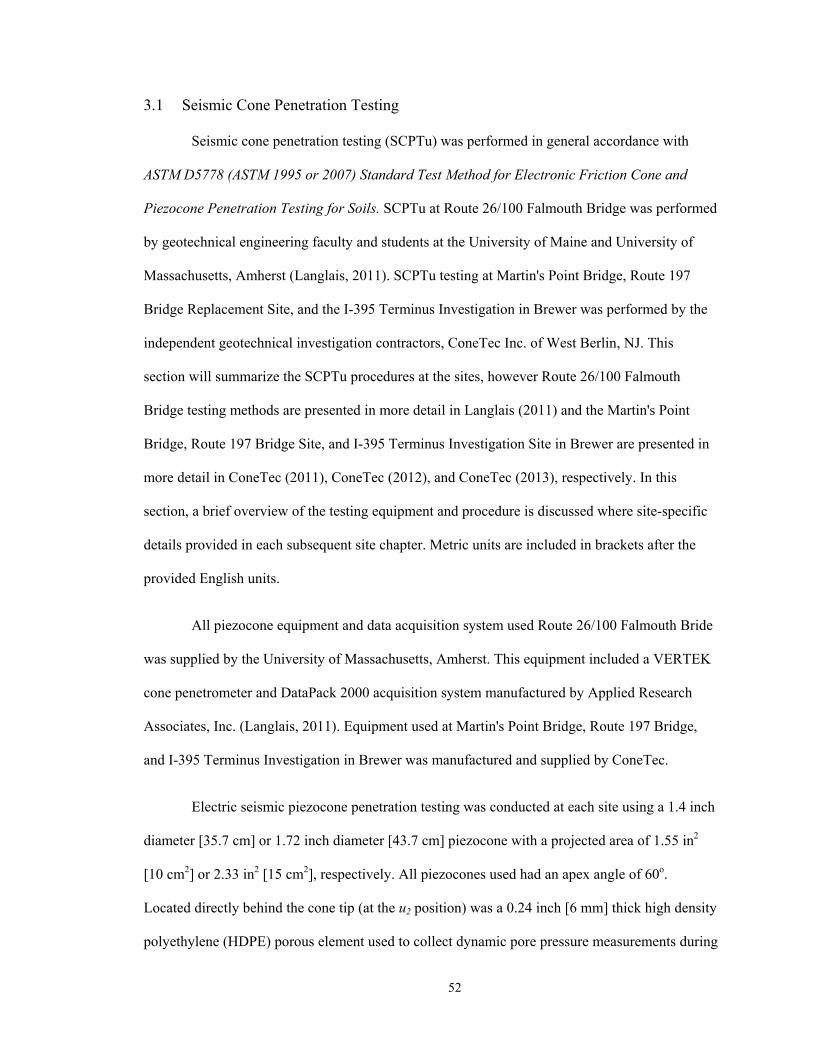
52
3.1 Seismic Cone Penetration Testing
Seismic cone penetration testing (SCPTu) was performed in general accordance with
ASTM D5778 (ASTM 1995 or 2007) Standard Test Method for Electronic Friction Cone and
Piezocone Penetration Testing for Soils. SCPTu at Route 26/100 Falmouth Bridge was performed
by geotechnical engineering faculty and students at the University of Maine and University of
Massachusetts, Amherst (Langlais, 2011). SCPTu testing at Martin's Point Bridge, Route 197
Bridge Replacement Site, and the I-395 Terminus Investigation in Brewer was performed by the
independent geotechnical investigation contractors, ConeTec Inc. of West Berlin, NJ. This
section will summarize the SCPTu procedures at the sites, however Route 26/100 Falmouth
Bridge testing methods are presented in more detail in Langlais (2011) and the Martin's Point
Bridge, Route 197 Bridge Site, and I-395 Terminus Investigation Site in Brewer are presented in
more detail in ConeTec (2011), ConeTec (2012), and ConeTec (2013), respectively. In this
section, a brief overview of the testing equipment and procedure is discussed where site-specific
details provided in each subsequent site chapter. Metric units are included in brackets after the
provided English units.
All piezocone equipment and data acquisition system used Route 26/100 Falmouth Bride
was supplied by the University of Massachusetts, Amherst. This equipment included a VERTEK
cone penetrometer and DataPack 2000 acquisition system manufactured by Applied Research
Associates, Inc. (Langlais, 2011). Equipment used at Martin's Point Bridge, Route 197 Bridge,
and I-395 Terminus Investigation in Brewer was manufactured and supplied by ConeTec.
Electric seismic piezocone penetration testing was conducted at each site using a 1.4 inch
diameter [35.7 cm] or 1.72 inch diameter [43.7 cm] piezocone with a projected area of 1.55 in2
[10 cm2] or 2.33 in2 [15 cm2], respectively. All piezocones used had an apex angle of 60o.
Located directly behind the cone tip (at the u2 position) was a 0.24 inch [6 mm] thick high density
polyethylene (HDPE) porous element used to collect dynamic pore pressure measurements during
53
penetration. Located directly behind the porous element was the friction sleeve with a length of
5.28 inches [134 mm] or [164 mm], dependent on the size of the cone tip (larger cone tip with
larger friction sleeve). Projected friction sleeve areas are 23.25 in2 [150 cm2] and 34.88 in2 [225
cm2], respectively. The diameter of the bottom of the friction sleeve matched the diameter of the
cone base. The electric piezocone used at Route 26/100 Falmouth Bridge gradually increased in
diameter from 1.42 inch [36 mm] at the bottom to 1.60 inch [40.5 mm] over a distance of 1.46
inches [37 mm] to allow for easier pushing at greater depths (Langlais, 2011). The diameter of the
friction sleeve remained constant for the piezocones used at the other three sites. Figure 3.1
provides a schematic with dimensions of the two types of piezocones used at the research sites.
Figure 3.2 presents a picture of a typical cone penetrometer.
Figure 3.1: Schematic of electric peizocones used at the research site (ASTM, 2012).

54
Figure 3.2: Image of a 1.4" diameter cone penetrometer showing the cone tip, pore pressure filter element, and friction sleeve (Vertek, 2014).
On the interior of the cones, two separate compression load cells measure the force
applied to the cone tip and the friction sleeve independently. A pressure transducer, which is
hydraulically connected to the porous filter element located at the u2 position, measured dynamic
pore pressure on the cone during advancement. Operational capacity of the tip resistance load
cell, sleeve friction load cell, and pore pressure transducers for the cone used at the Route 26/100
Falmouth Bridge Site was 6,440 psi [44,400 kPa], 189 psi [1300 kPa], and 250 psi [1724 kPa],
respectively (Langlais, 2011). Operational capacity of the cones used at the remaining three sites
was not provided, however, it is expected that they are relatively similar to the ones mentioned
above and that the readings at all three sites never surpassed the capacity of the load cells or
transducers.
All piezocones used were also equipped with inclinometers used to determine inclination
during the advancement of the cone, thermistor to determine temperature during penetration,
analog geophones positioned 90o from each other in the horizontal plane to determine the
horizontal and vertical components of the arriving shear wave, and up-hole oscilloscope. Since
geophones were only positioned at one location inside of the piezocones, the pseudo-interval

55
method was used to determine shear wave velocity. Seismic measurements were collected during
the test at the addition of every new rod (3.28 feet).
Prior to the SCPTu procedures, the HDPE porous filter elements were saturated in high
viscosity silicone oil. The viscosity of the silicone oil for Route 26/100 Falmouth Bridge SCPTu
was 10,000 centistokes, and was unspecified for the SCPTu conducted at the other three sites.
Cables which collect the data during the test were pre-strung through the 3.28 foot [1 m] rod
lengths before the test began. One end of the cable connects to the back of the penetrometer and
the other end connects to the data acquisition system. With the cone tip separated from the cone
body, the silicone oil is either poured or injected into the pore pressure transducer (where the
cone tip threads into the body) to make a hydraulic connection with the porous filter and the
transducer. Water is not used due to the difficulties with removing air from the liquid, and since
the air is compressible, incorrect pore pressures can be measured during the test or de-saturation
can occur. Once the cone tip is tightly threaded onto the body of the cone, the excess silicone oil
squeezed out from the insertion of the cone tip is wiped clean from the outside of the cone. One
end of the cable was attached to the back of the cone and the other attached to the data acquisition
system. The cone is held stationary vertically and the readings are zeroed. Langlais (2011)
discusses the zeroing procedure for the SCPTu conducted at Route 26/100 Bridge in more detail.
For the remaining three sites, before each sounding, the analog to digital conversion is checked
using a multi-meter to ensure the readings being collected (or "digitized") on the screen are
accurate. After each test, baseline readings are collected to observe any baseline drift which may
have occurred during the test. ASTM (2012) states that SCPTu measurements collected with a
baseline drift smaller than 2% of the cone's full scale output (FSO) is acceptable. Baseline drift at
all four sites did not exceed 0.1% of FSO. The push rig used at each site differed between the
sites and will be covered in the specific site chapters.
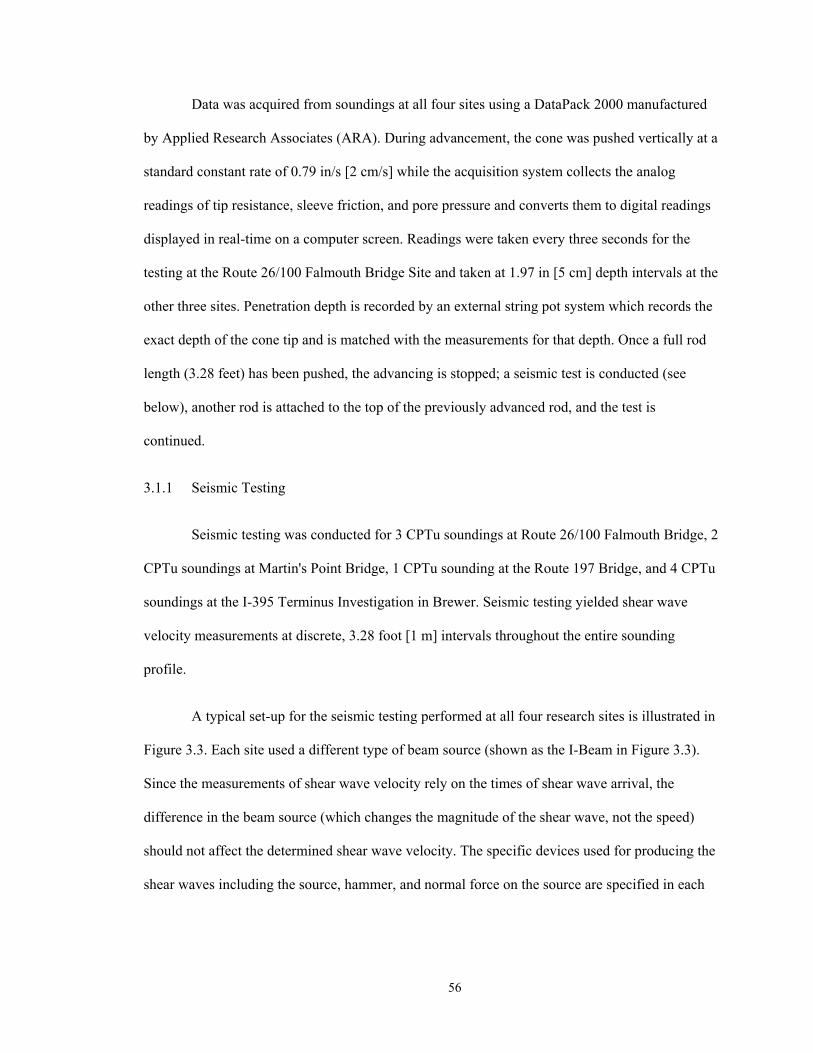
56
Data was acquired from soundings at all four sites using a DataPack 2000 manufactured
by Applied Research Associates (ARA). During advancement, the cone was pushed vertically at a
standard constant rate of 0.79 in/s [2 cm/s] while the acquisition system collects the analog
readings of tip resistance, sleeve friction, and pore pressure and converts them to digital readings
displayed in real-time on a computer screen. Readings were taken every three seconds for the
testing at the Route 26/100 Falmouth Bridge Site and taken at 1.97 in [5 cm] depth intervals at the
other three sites. Penetration depth is recorded by an external string pot system which records the
exact depth of the cone tip and is matched with the measurements for that depth. Once a full rod
length (3.28 feet) has been pushed, the advancing is stopped; a seismic test is conducted (see
below), another rod is attached to the top of the previously advanced rod, and the test is
continued.
3.1.1 Seismic Testing
Seismic testing was conducted for 3 CPTu soundings at Route 26/100 Falmouth Bridge, 2
CPTu soundings at Martin's Point Bridge, 1 CPTu sounding at the Route 197 Bridge, and 4 CPTu
soundings at the I-395 Terminus Investigation in Brewer. Seismic testing yielded shear wave
velocity measurements at discrete, 3.28 foot [1 m] intervals throughout the entire sounding
profile.
A typical set-up for the seismic testing performed at all four research sites is illustrated in
Figure 3.3. Each site used a different type of beam source (shown as the I-Beam in Figure 3.3).
Since the measurements of shear wave velocity rely on the times of shear wave arrival, the
difference in the beam source (which changes the magnitude of the shear wave, not the speed)
should not affect the determined shear wave velocity. The specific devices used for producing the
shear waves including the source, hammer, and normal force on the source are specified in each
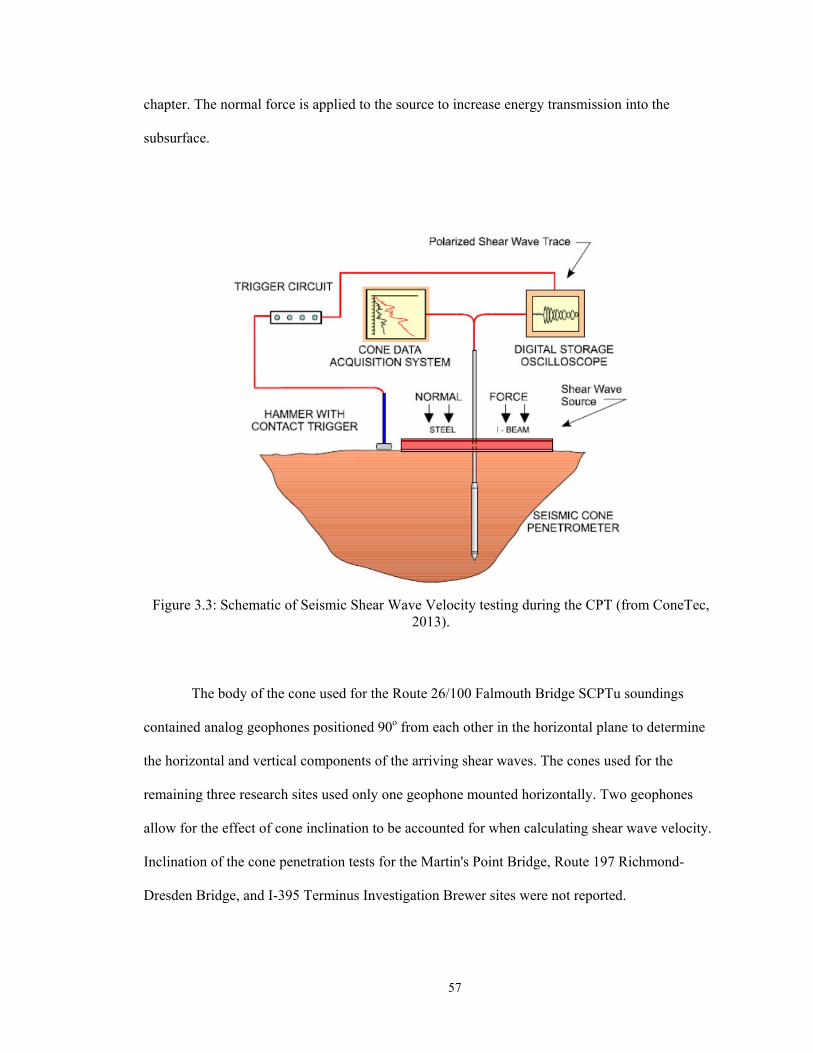
57
chapter. The normal force is applied to the source to increase energy transmission into the
subsurface.
Figure 3.3: Schematic of Seismic Shear Wave Velocity testing during the CPT (from ConeTec, 2013).
The body of the cone used for the Route 26/100 Falmouth Bridge SCPTu soundings
contained analog geophones positioned 90o from each other in the horizontal plane to determine
the horizontal and vertical components of the arriving shear waves. The cones used for the
remaining three research sites used only one geophone mounted horizontally. Two geophones
allow for the effect of cone inclination to be accounted for when calculating shear wave velocity.
Inclination of the cone penetration tests for the Martin's Point Bridge, Route 197 Richmond-
Dresden Bridge, and I-395 Terminus Investigation Brewer sites were not reported.
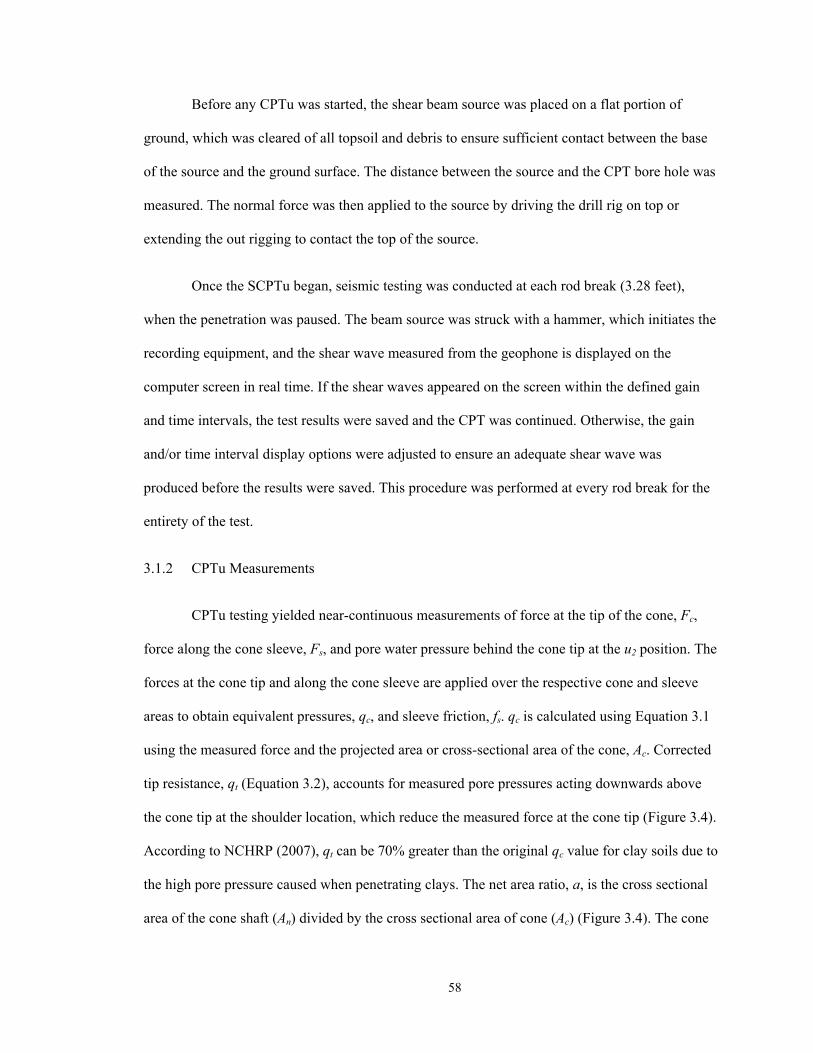
58
Before any CPTu was started, the shear beam source was placed on a flat portion of
ground, which was cleared of all topsoil and debris to ensure sufficient contact between the base
of the source and the ground surface. The distance between the source and the CPT bore hole was
measured. The normal force was then applied to the source by driving the drill rig on top or
extending the out rigging to contact the top of the source.
Once the SCPTu began, seismic testing was conducted at each rod break (3.28 feet),
when the penetration was paused. The beam source was struck with a hammer, which initiates the
recording equipment, and the shear wave measured from the geophone is displayed on the
computer screen in real time. If the shear waves appeared on the screen within the defined gain
and time intervals, the test results were saved and the CPT was continued. Otherwise, the gain
and/or time interval display options were adjusted to ensure an adequate shear wave was
produced before the results were saved. This procedure was performed at every rod break for the
entirety of the test.
3.1.2 CPTu Measurements
CPTu testing yielded near-continuous measurements of force at the tip of the cone, Fc,
force along the cone sleeve, Fs, and pore water pressure behind the cone tip at the u2 position. The
forces at the cone tip and along the cone sleeve are applied over the respective cone and sleeve
areas to obtain equivalent pressures, qc, and sleeve friction, fs. qc is calculated using Equation 3.1
using the measured force and the projected area or cross-sectional area of the cone, Ac. Corrected
tip resistance, qt (Equation 3.2), accounts for measured pore pressures acting downwards above
the cone tip at the shoulder location, which reduce the measured force at the cone tip (Figure 3.4).
According to NCHRP (2007), qt can be 70% greater than the original qc value for clay soils due to
the high pore pressure caused when penetrating clays. The net area ratio, a, is the cross sectional
area of the cone shaft (An) divided by the cross sectional area of cone (Ac) (Figure 3.4). The cone
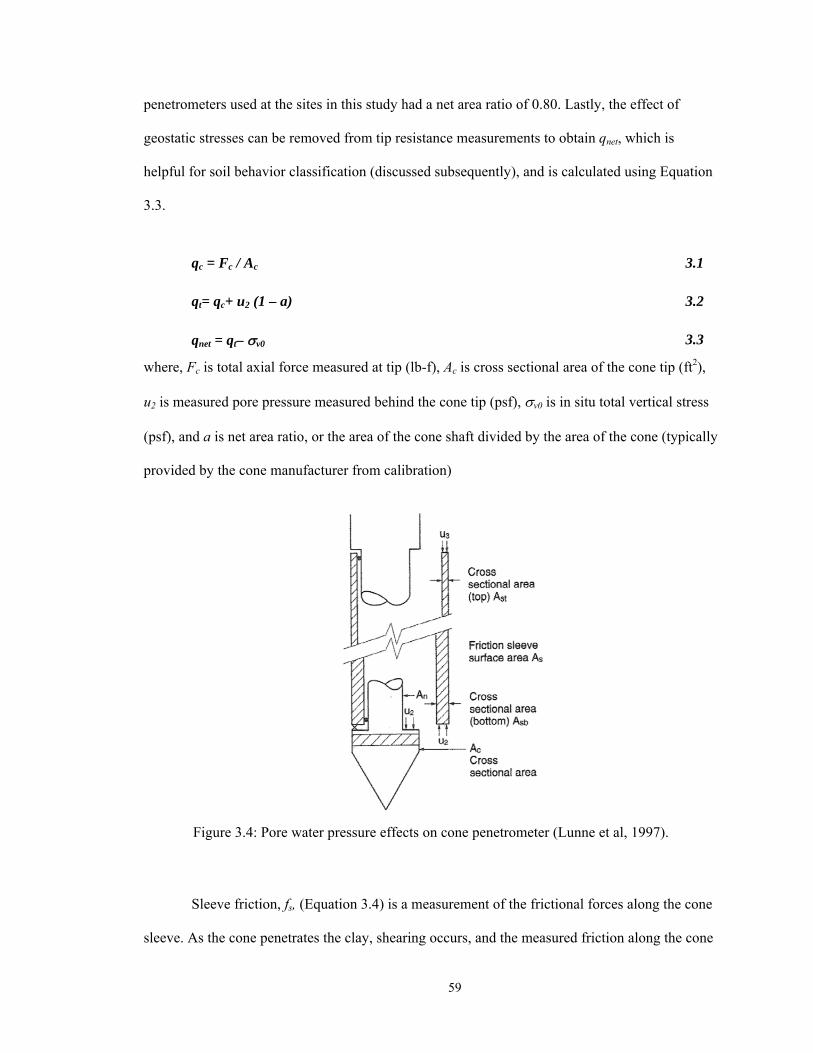
59
penetrometers used at the sites in this study had a net area ratio of 0.80. Lastly, the effect of
geostatic stresses can be removed from tip resistance measurements to obtain qnet, which is
helpful for soil behavior classification (discussed subsequently), and is calculated using Equation
3.3.
qc = Fc / Ac 3.1
qt= qc+ u2 (1 – a) 3.2
qnet = qt– v0 3.3
where, Fc is total axial force measured at tip (lb-f), Ac is cross sectional area of the cone tip (ft2),
u2 is measured pore pressure measured behind the cone tip (psf), v0 is in situ total vertical stress
(psf), and a is net area ratio, or the area of the cone shaft divided by the area of the cone (typically
provided by the cone manufacturer from calibration)
Figure 3.4: Pore water pressure effects on cone penetrometer (Lunne et al, 1997).
Sleeve friction, fs, (Equation 3.4) is a measurement of the frictional forces along the cone
sleeve. As the cone penetrates the clay, shearing occurs, and the measured friction along the cone
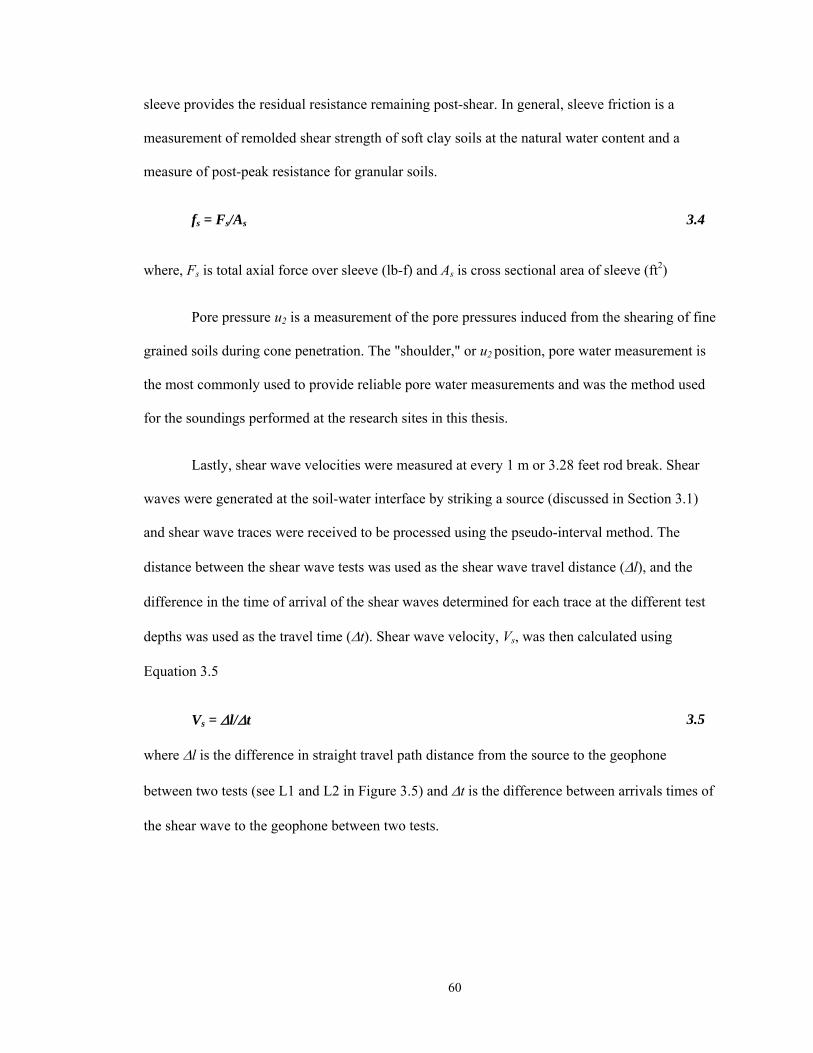
60
sleeve provides the residual resistance remaining post-shear. In general, sleeve friction is a
measurement of remolded shear strength of soft clay soils at the natural water content and a
measure of post-peak resistance for granular soils.
fs = Fs/As 3.4
where, Fs is total axial force over sleeve (lb-f) and As is cross sectional area of sleeve (ft2)
Pore pressure u2 is a measurement of the pore pressures induced from the shearing of fine
grained soils during cone penetration. The "shoulder," or u2 position, pore water measurement is
the most commonly used to provide reliable pore water measurements and was the method used
for the soundings performed at the research sites in this thesis.
Lastly, shear wave velocities were measured at every 1 m or 3.28 feet rod break. Shear
waves were generated at the soil-water interface by striking a source (discussed in Section 3.1)
and shear wave traces were received to be processed using the pseudo-interval method. The
distance between the shear wave tests was used as the shear wave travel distance (l), and the
difference in the time of arrival of the shear waves determined for each trace at the different test
depths was used as the travel time (t). Shear wave velocity, Vs, was then calculated using
Equation 3.5
Vs = l/t 3.5 where l is the difference in straight travel path distance from the source to the geophone
between two tests (see L1 and L2 in Figure 3.5) and t is the difference between arrivals times of
the shear wave to the geophone between two tests.
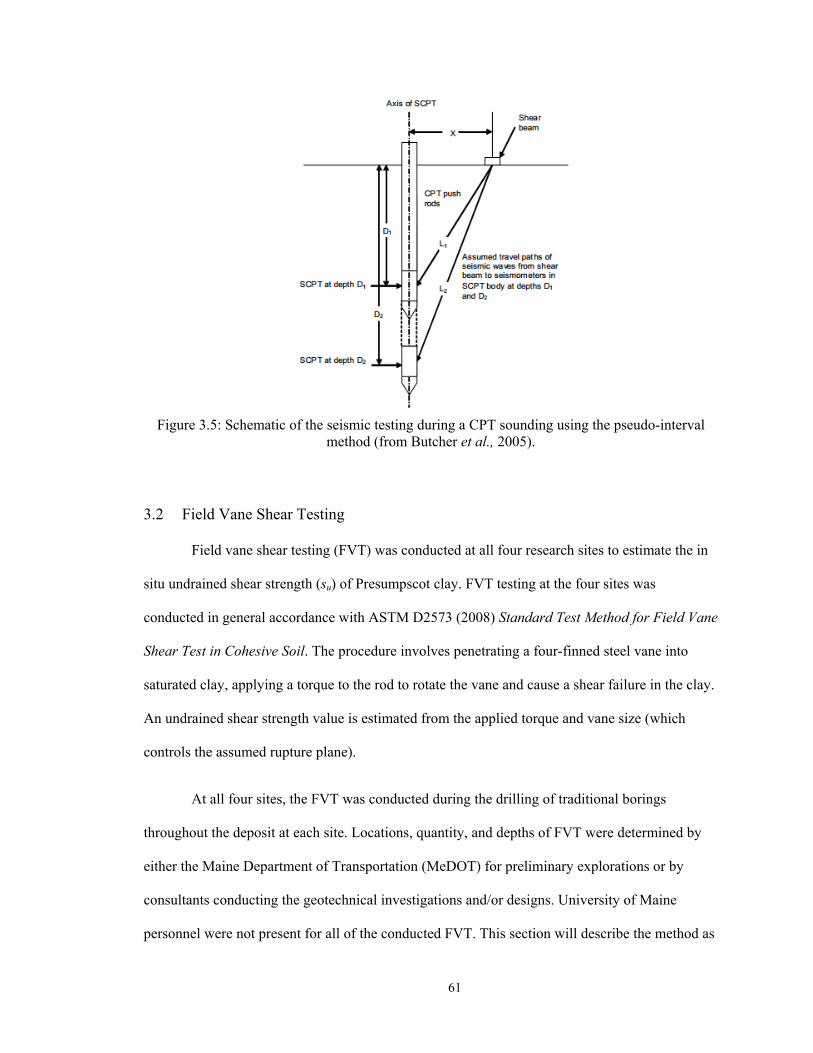
61
Figure 3.5: Schematic of the seismic testing during a CPT sounding using the pseudo-interval method (from Butcher et al., 2005).
3.2 Field Vane Shear Testing
Field vane shear testing (FVT) was conducted at all four research sites to estimate the in
situ undrained shear strength (su) of Presumpscot clay. FVT testing at the four sites was
conducted in general accordance with ASTM D2573 (2008) Standard Test Method for Field Vane
Shear Test in Cohesive Soil. The procedure involves penetrating a four-finned steel vane into
saturated clay, applying a torque to the rod to rotate the vane and cause a shear failure in the clay.
An undrained shear strength value is estimated from the applied torque and vane size (which
controls the assumed rupture plane).
At all four sites, the FVT was conducted during the drilling of traditional borings
throughout the deposit at each site. Locations, quantity, and depths of FVT were determined by
either the Maine Department of Transportation (MeDOT) for preliminary explorations or by
consultants conducting the geotechnical investigations and/or designs. University of Maine
personnel were not present for all of the conducted FVT. This section will describe the method as
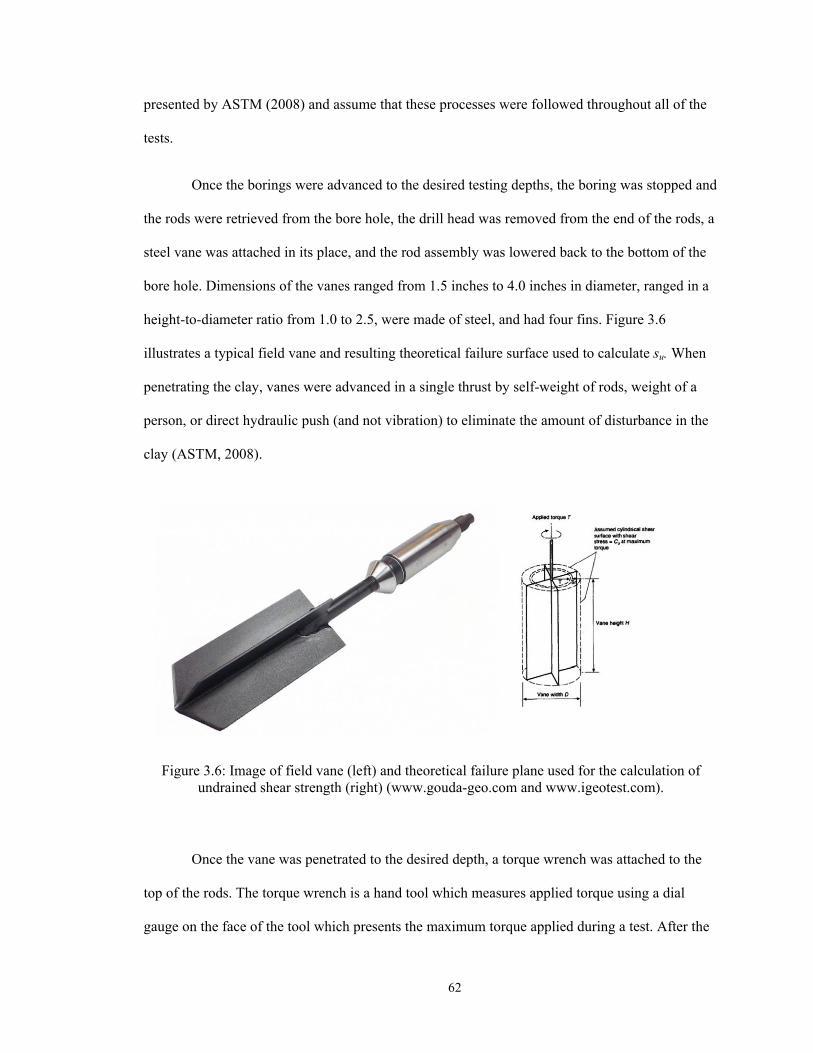
62
presented by ASTM (2008) and assume that these processes were followed throughout all of the
tests.
Once the borings were advanced to the desired testing depths, the boring was stopped and
the rods were retrieved from the bore hole, the drill head was removed from the end of the rods, a
steel vane was attached in its place, and the rod assembly was lowered back to the bottom of the
bore hole. Dimensions of the vanes ranged from 1.5 inches to 4.0 inches in diameter, ranged in a
height-to-diameter ratio from 1.0 to 2.5, were made of steel, and had four fins. Figure 3.6
illustrates a typical field vane and resulting theoretical failure surface used to calculate su. When
penetrating the clay, vanes were advanced in a single thrust by self-weight of rods, weight of a
person, or direct hydraulic push (and not vibration) to eliminate the amount of disturbance in the
clay (ASTM, 2008).
Figure 3.6: Image of field vane (left) and theoretical failure plane used for the calculation of undrained shear strength (right) (www.gouda-geo.com and www.igeotest.com).
Once the vane was penetrated to the desired depth, a torque wrench was attached to the
top of the rods. The torque wrench is a hand tool which measures applied torque using a dial
gauge on the face of the tool which presents the maximum torque applied during a test. After the
63
torque wrench is attached (and within 5 minutes of the vane penetrating the clay), the torque
wrench is rotated at 0.1 deg/s until failure occurs in the soil. Once this occurs, the maximum
torque is recorded and the undrained shear strength can be determined. To determine the
remolded undrained shear strength (su(r)), the field vane is rotated another five to ten times after
the initial failure to completely remold the soil. The test is then re-conducted at the same rate, the
maximum torque reported, and the su(r) evaluated.
The FVT is one of the most widely used in situ tests for estimating su of clay (Terzaghi et
al., 1996, DeGroot and Ladd, 2010, Holtz et al., 2011). The reason it is so popular is because the
test can be performed quickly and consistently during standard rotary drilling or cased wash
borings investigations, which saves time and money associated with additional sampling and
subsequent testing required for laboratory tests.
However, the FVT has flaws inherent in the test methods. Before a FVT is performed, the
weight relief of the extracted material overlying the tested portion can allow the clay to expand,
which results in stress applied to the sample due to the Terminus, as well as unrepresentative in
situ anisotropic conditions. Also, once the vane is penetrated into the clay, there is a "disturbed"
zone around the blades (Holtz et al. 2011) which reduces the undrained shear strength. For soft
clays such as the Presumpscot clay, bigger vanes must often be used to increase the size of the
rupture plane to allow for better torque resolution to properly determine su (ASTM 2008). The use
of bigger vanes results in larger zones of disturbance.
Additional sources of inaccurate FVT results can include ((Terzaghi et al., 1996,
DeGroot and Ladd, 2010, Holtz et al., 2011, ASTM 2008):
Increased strain rate
Non-verticality of applied torque
Loose rod connections being tightened during test

64
Inclusions of silt and sand seams
Rod friction
Damaged vane
If the test procedure is conducted correctly, the resulting su can be reliable. However,
there is currently no method to estimate sample quality of a conducted FVT so the engineer must
rely heavily on the operators' competency and adjust the predicted values of su accordingly.
3.3 Soil Sampling
Samples of the Presumpscot clay were collected at each site for laboratory testing of
engineering properties and index properties. Three methods were employed to collect these
samples: Shelby tube, modified Shelby tube, and Sherbrooke block sampling. All three methods,
described in the sections below, are sampling procedures for cohesive soils which aim to reduce
the amount of disturbance caused by the sampling process. This is important because clay
samples for laboratory tests of engineering properties should be as close to in situ state as
possible, including the water content, stress history, structure, and density (Holtz et. al., 2011,
Karlsrud and Hernandez-Martinez 2013, Landon, 2007). Increasing amounts of disturbance
increases the difference between in situ state and tested state, which subsequently decreases the
representation of the test results of the in situ state. Karlsrud and Hernandez-Martinez (2013)
states that undisturbed samples from Norwegian silty-type, sensitive, low plasticity clays are
particularly difficult to obtain. The Presumpscot clay is similar to the Norwegian silty clay.
Sample disturbance affects the properties determined from laboratory consolidation and
undrained shear strength (su) testing. For consolidation testing on a disturbed clay specimen,
recompression slope (Cr) will be steeper, reduced definition (lack of a distinct "break" between
recompression and virgin compression zones) for determining the preconsolidation pressure ('p)
will occur, and virgin compression slope (Cc) will be shallower (Hvorslev, 1949). For su testing,
65
increased sample disturbance decreases the effective stress on a soil sample, and in turn decreases
the resulting su and increase the strain to failure (Ladd and DeGroot, 2003). So with a disturbed
sample of clay tested in the laboratory, one can expect an under prediction of Cc, 'p, su and an
over prediction of Cr and strain rate at shear failure. It was important that the undisturbed soil
samples of Presumpscot clay at all of the research sites be obtained with minimal disturbance so
that the engineering properties determined from laboratory testing, and subsequently the
correlation of those properties to the CPTu measurements, be as representative of in situ
properties as possible.
During the process of clay sampling for laboratory testing, disturbance can occur at
stages other than just the sampling of the clay. Transportation, storage, extraction, trimming, and
test setup are all sources of potential sample disturbance in addition to the sampling process
(Landon 2007, Ladd and DeGroot 2003). These issues are addressed later in this chapter. All
processes of sampling, transportation, storage, extraction, trimming, and test setup were all
completed in an effort to minimize sample disturbance throughout this research.
Index properties of clay do not change with the amount of disturbance. Therefore, index
test were performed on the bottom 3" of the collected tube samples (which is considered to be
disturbed by DeGroot and Ladd (2010)), as well as trimmed portions of the tested clay specimens
for consolidation and shear strength testing.
3.3.1 Tube Sampling
Tube sampling, also called Shelby Tube sampling, of Presumpscot clay was performed at
all four research sites. Figure 3.7 presents an image of a fixed piston modified Shelby Tube
similar to the one used at the research sites. All undisturbed soil samples of Presumpscot clay at
Martin's Point Bridge, Route 197 Bridge, and the I-395 Terminus Investigation in Brewer were
collected via tube sampling. Presumpscot clay samples collected at the Route 26/100 Falmouth

66
Bridge were collected using a combination of tube sampling and Sherbrooke block sampling
(discussed in the next section). All Shelby tube sampling was conducted in general accordance
with ASTM D1587, Standard Practice for Thin-Walled Tube Sampling for Geotechnical
Purposes. This section will present the general method for tube sampling used at each site, and
the individual site chapters will summarize the specific equipment and sample depths.
To minimize disturbance to the undisturbed soil samples, piston tube sampling was used
instead of push sampling. Ladd and DeGroot (2003) and Terzaghi et al. (1996) highlight the
advantage of both higher quality and more recovery of piston tube sampling over push tube
sampling. The sampling tubes were 3 inch diameter, 24 inch long stainless steel or brass tubes
modified with an ICR (inside clearance ratio) of 0 and a cutting angle of 5o. To achieve this
modification, the bottom 0.5 inches of the Shelby tubes were removed and machined to match the
desired diameter
Figure 3.7: Modified Shelby tube fixed piston sampler with a 5o machined cutting angle (from Landon, 2004).
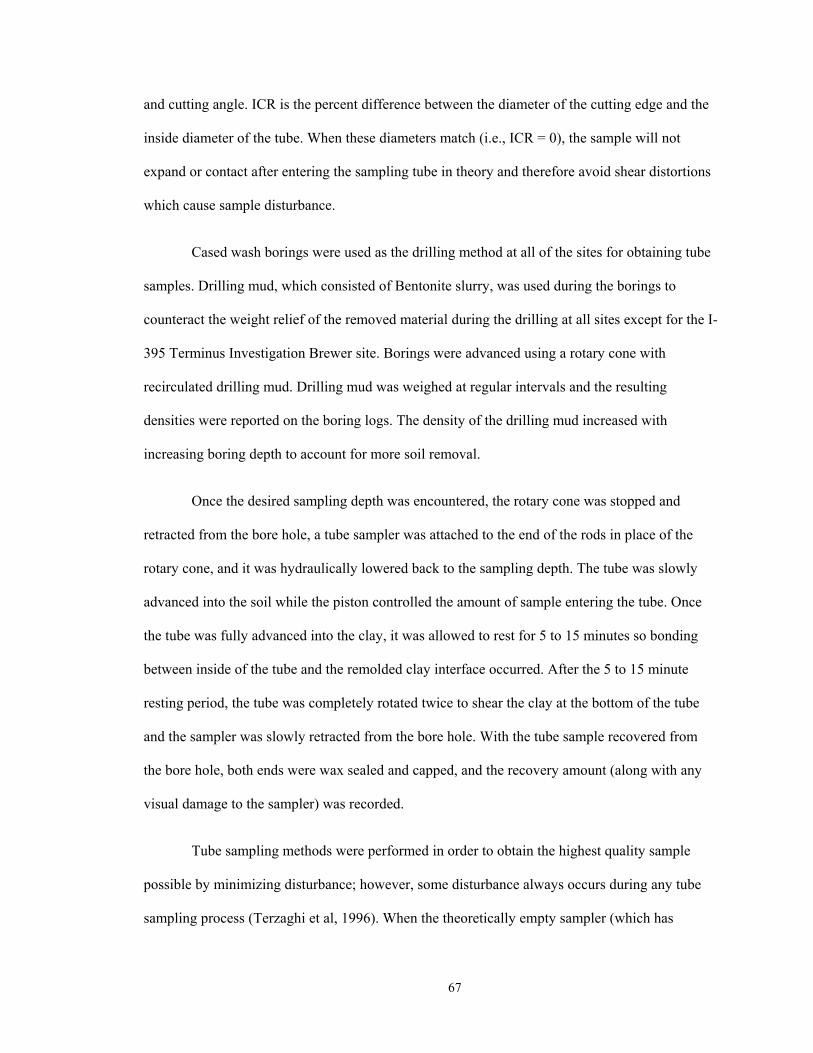
67
and cutting angle. ICR is the percent difference between the diameter of the cutting edge and the
inside diameter of the tube. When these diameters match (i.e., ICR = 0), the sample will not
expand or contact after entering the sampling tube in theory and therefore avoid shear distortions
which cause sample disturbance.
Cased wash borings were used as the drilling method at all of the sites for obtaining tube
samples. Drilling mud, which consisted of Bentonite slurry, was used during the borings to
counteract the weight relief of the removed material during the drilling at all sites except for the I-
395 Terminus Investigation Brewer site. Borings were advanced using a rotary cone with
recirculated drilling mud. Drilling mud was weighed at regular intervals and the resulting
densities were reported on the boring logs. The density of the drilling mud increased with
increasing boring depth to account for more soil removal.
Once the desired sampling depth was encountered, the rotary cone was stopped and
retracted from the bore hole, a tube sampler was attached to the end of the rods in place of the
rotary cone, and it was hydraulically lowered back to the sampling depth. The tube was slowly
advanced into the soil while the piston controlled the amount of sample entering the tube. Once
the tube was fully advanced into the clay, it was allowed to rest for 5 to 15 minutes so bonding
between inside of the tube and the remolded clay interface occurred. After the 5 to 15 minute
resting period, the tube was completely rotated twice to shear the clay at the bottom of the tube
and the sampler was slowly retracted from the bore hole. With the tube sample recovered from
the bore hole, both ends were wax sealed and capped, and the recovery amount (along with any
visual damage to the sampler) was recorded.
Tube sampling methods were performed in order to obtain the highest quality sample
possible by minimizing disturbance; however, some disturbance always occurs during any tube
sampling process (Terzaghi et al, 1996). When the theoretically empty sampler (which has
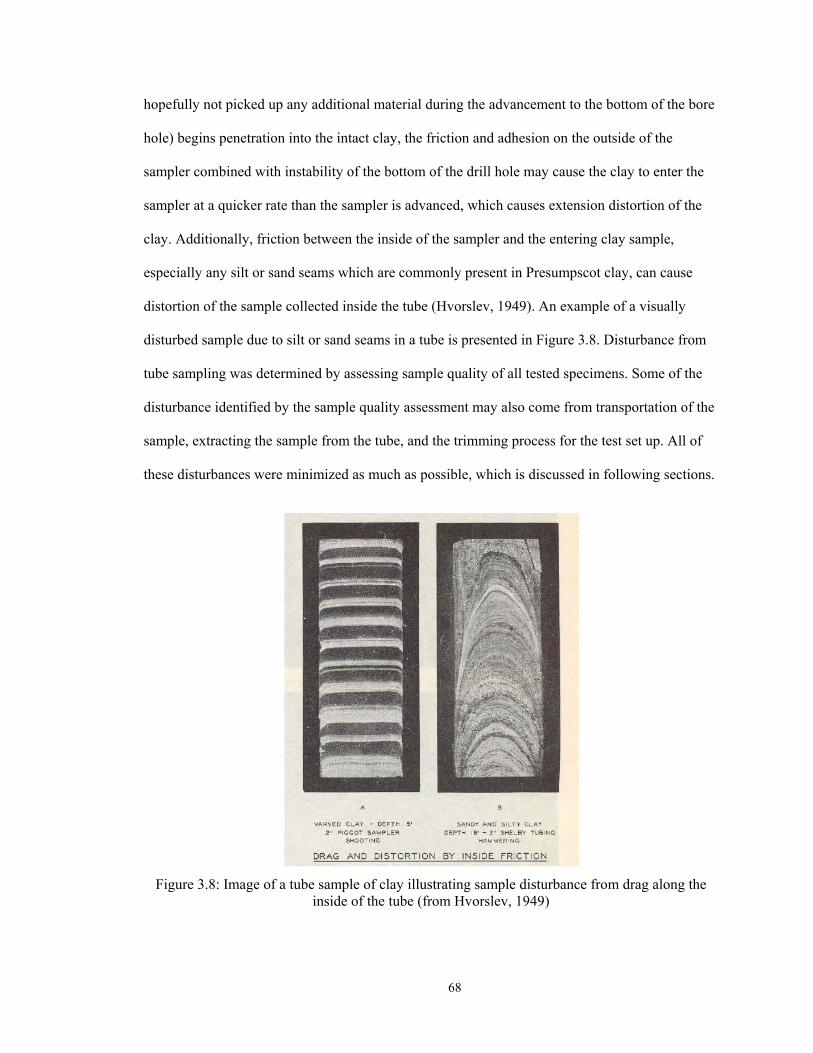
68
hopefully not picked up any additional material during the advancement to the bottom of the bore
hole) begins penetration into the intact clay, the friction and adhesion on the outside of the
sampler combined with instability of the bottom of the drill hole may cause the clay to enter the
sampler at a quicker rate than the sampler is advanced, which causes extension distortion of the
clay. Additionally, friction between the inside of the sampler and the entering clay sample,
especially any silt or sand seams which are commonly present in Presumpscot clay, can cause
distortion of the sample collected inside the tube (Hvorslev, 1949). An example of a visually
disturbed sample due to silt or sand seams in a tube is presented in Figure 3.8. Disturbance from
tube sampling was determined by assessing sample quality of all tested specimens. Some of the
disturbance identified by the sample quality assessment may also come from transportation of the
sample, extracting the sample from the tube, and the trimming process for the test set up. All of
these disturbances were minimized as much as possible, which is discussed in following sections.
Figure 3.8: Image of a tube sample of clay illustrating sample disturbance from drag along the inside of the tube (from Hvorslev, 1949)
69
3.3.2 Sherbrooke Block Sampling
Sherbrooke block sampling represents the state-of-the-art method to obtain the highest
quality samples of soft clays (Ladd and DeGroot 2010, Karlsrud and Hernandez-Martinez 2013).
Laboratory testing of clays for undrained shear strength and consolidation properties provides
unanimously higher quality results from block samples over any type of tube samples. Due to
budget and time constraints, block sampling was only performed at the Route 26/100 Falmouth
Bridge.
Block sampling has typically been performed by creating a large diameter open
excavation in the subsurface and "carving" out a block of the clay (Terzaghi et al., 1996). This
method was limited by the ability or access of cutting an open excavation as well as the stability
of an open cut. Lefebvre and Poulin (1979) developed the Sherbrooke Block sampler which
allows for the recovery of a block sample in a bore hole. Figure 3.9 presents an image of the
Sherbrook Block Sampler.
Figure 3.9: Sherbrooke block sampler (from Landon, 2007)
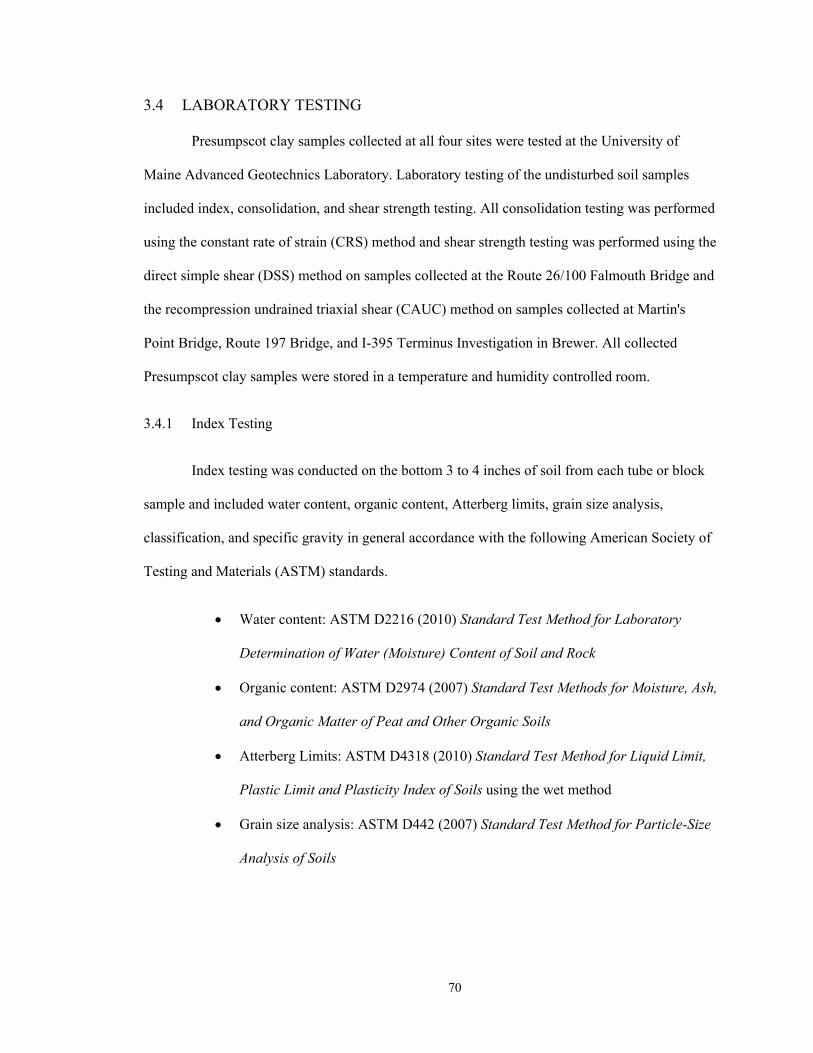
70
3.4 LABORATORY TESTING
Presumpscot clay samples collected at all four sites were tested at the University of
Maine Advanced Geotechnics Laboratory. Laboratory testing of the undisturbed soil samples
included index, consolidation, and shear strength testing. All consolidation testing was performed
using the constant rate of strain (CRS) method and shear strength testing was performed using the
direct simple shear (DSS) method on samples collected at the Route 26/100 Falmouth Bridge and
the recompression undrained triaxial shear (CAUC) method on samples collected at Martin's
Point Bridge, Route 197 Bridge, and I-395 Terminus Investigation in Brewer. All collected
Presumpscot clay samples were stored in a temperature and humidity controlled room.
3.4.1 Index Testing
Index testing was conducted on the bottom 3 to 4 inches of soil from each tube or block
sample and included water content, organic content, Atterberg limits, grain size analysis,
classification, and specific gravity in general accordance with the following American Society of
Testing and Materials (ASTM) standards.
Water content: ASTM D2216 (2010) Standard Test Method for Laboratory
Determination of Water (Moisture) Content of Soil and Rock
Organic content: ASTM D2974 (2007) Standard Test Methods for Moisture, Ash,
and Organic Matter of Peat and Other Organic Soils
Atterberg Limits: ASTM D4318 (2010) Standard Test Method for Liquid Limit,
Plastic Limit and Plasticity Index of Soils using the wet method
Grain size analysis: ASTM D442 (2007) Standard Test Method for Particle-Size
Analysis of Soils
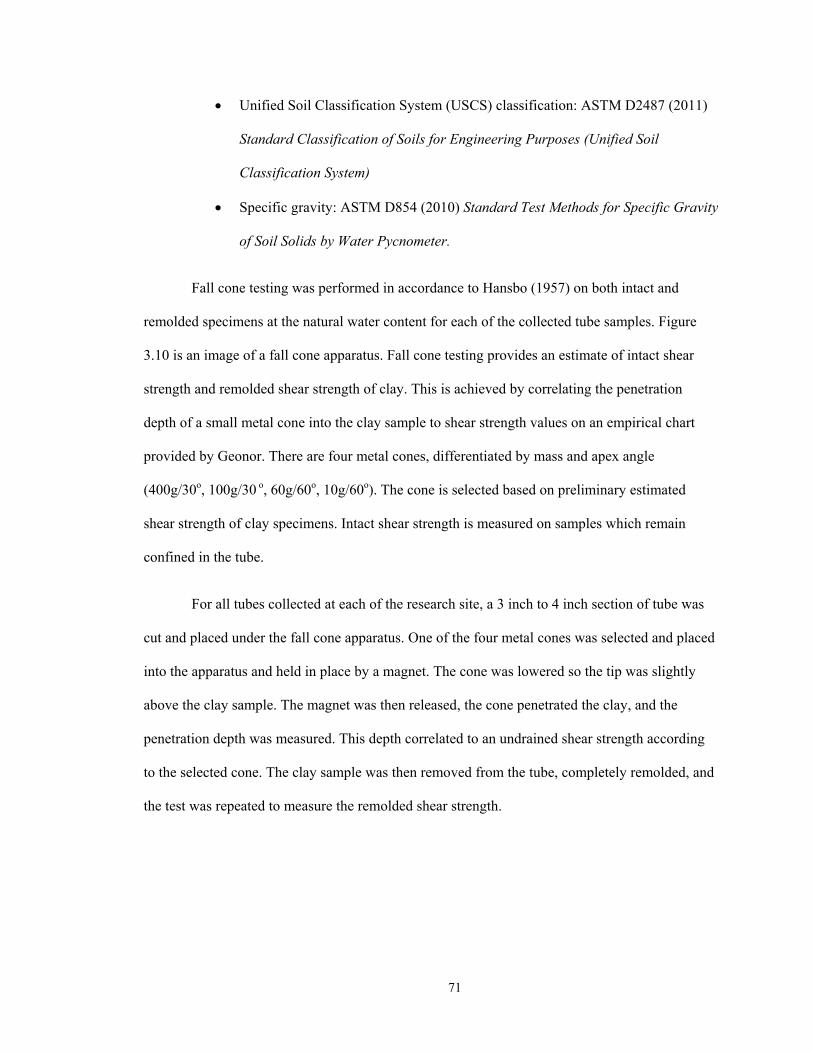
71
Unified Soil Classification System (USCS) classification: ASTM D2487 (2011)
Standard Classification of Soils for Engineering Purposes (Unified Soil
Classification System)
Specific gravity: ASTM D854 (2010) Standard Test Methods for Specific Gravity
of Soil Solids by Water Pycnometer.
Fall cone testing was performed in accordance to Hansbo (1957) on both intact and
remolded specimens at the natural water content for each of the collected tube samples. Figure
3.10 is an image of a fall cone apparatus. Fall cone testing provides an estimate of intact shear
strength and remolded shear strength of clay. This is achieved by correlating the penetration
depth of a small metal cone into the clay sample to shear strength values on an empirical chart
provided by Geonor. There are four metal cones, differentiated by mass and apex angle
(400g/30o, 100g/30 o, 60g/60o, 10g/60o). The cone is selected based on preliminary estimated
shear strength of clay specimens. Intact shear strength is measured on samples which remain
confined in the tube.
For all tubes collected at each of the research site, a 3 inch to 4 inch section of tube was
cut and placed under the fall cone apparatus. One of the four metal cones was selected and placed
into the apparatus and held in place by a magnet. The cone was lowered so the tip was slightly
above the clay sample. The magnet was then released, the cone penetrated the clay, and the
penetration depth was measured. This depth correlated to an undrained shear strength according
to the selected cone. The clay sample was then removed from the tube, completely remolded, and
the test was repeated to measure the remolded shear strength.
72
Figure 3.10: Geonor fall cone apparatus (from Geonor, 2010).
The total unit weight of all specimens was determined by using the measured volume and
total mass of the prepared intact specimens for one dimensional consolidation and triaxial
specimens. Measured water content and total unit weight values were used to compute the dry
unit weight.
3.4.2 Sample Preparation
Intact specimens from each of the tube samples were obtained by cutting sections of a
desired length from the tube using a four-wheel hinged cutter followed by a single wheel, three
point tube cutter. These specimen sections were then debonded from the tube wall by rotating a
thin wire along the soil-wall interface (Figure 3.11). Traditional hydraulic extrusion can cause
sample disturbance from the shear distortions resulting from the clay and tube wall interface
(Ladd and DeGroot, 2003). Thereafter, specimens were hand-extruded from the tube section with
minimal pressure using wood or plastic cut blocks. No specimens were hydraulically extruded or
cut from the tube using vibration devices.
73
Figure 3.11: Schematic of sample extraction method (from Ladd and DeGroot, 2003).
3.4.3 Constant Rate of Strain (CRS) Consolidation Testing
Constant rate of strain (CRS) consolidation testing was performed on intact specimens at
the natural water content in general accordance with ASTM D4186 Standard Test Method for
One-Dimensional Consolidation Properties of Soils Using Controlled-Strain Loading (2006) and
Sandbækken et al., (1986). The CRS has advantages over the more traditional incremental load
(IL) consolidation test. These advantages include continuous measurements of deformation,
vertical load, and pore pressure for direct calculation of coefficient of consolidation and
permeability. In addition, the continuous data points result in an improved consolidation curve
and more clear definition of the preconsolidation pressure ('p) (DeGroot and Ladd, 2010).
Figure 3.12 presents the CRS chamber cell setup used for all consolidation testing of the
Presumpscot clay samples. The load frames used for all consolidation testing is similar to the one
shown in Figure 3.12

74
Figure 3.12: Image of the CRS chamber cell setup used for all consolidation testing and the Trautwein GeoTAC Sigma-1 Automated Load Test Frame (from Langlais, 2011).
A Trautwein GeoTac Sigma-1™ automated load test system with computer control and
sensor data acquisition (including axial load cell, axial displacement sensor, cell and pore
pressure sensors, and a temperature sensor) was used. Prior to testing, the specimen chamber was
calibrated to determine system deflection under load and uplift forces.
Specimens were trimmed into a rigid ring with a sharp cutting edge using a wire saw and
lathe to finished dimensions of 2.5 inch diameter by 0.75 inch tall. Clean, moist porous stones
were fitted at the top and bottom of the specimen for drainage. The top porous stone matched the
diameter of the specimen, and the bottom porous stone was 1 inch diameter, fit into the base of
the CRS cell. The specimen was installed into a sealed chamber that allows for back pressure
saturation using deaired water. CRS testing included three test phases: seating and incremental
loading, saturation with back pressure, and constant rate of strain loading. Back pressure
saturation was used to eliminate air pockets and achieve more reliable water flow data.
A 104 psf seating load was applied for all specimens. This was followed by incremental
loading to ⅛ in situ vertical effective stress ('v0) and ¼ 'v0 using a load increment ratio (LIR) of
75
one. Axial strain was monitored during each increment to ensure primary consolidation was
complete before addition of the next increment. Upon full primary consolidation at ¼ 'v0, the
specimen chamber was filled with deionozied, deaired water and specimens were back pressure
saturated under constant height conditions in increments of 150 psf to a final back pressure of 607
psf. The final increment was applied for 12-18 hours to achieve 100% saturation before constant
rate of strain consolidation was initiated.
Constant rate of strain loading was performed at a rate of 2% axial strain per hour to a
maximum strain of 20 to 25%. As recommended by ASTM D4186 (2006), the base excess pore
pressure ratio (ub/v) was monitored to ensure it remained between 3% and 30%. It has been
found that a strain rate of 2% per hour typically results in a ub/v ratio of less than 20% for the
majority of the test duration. During CRS loading, the data acquisition system recorded all
transducers at an axial strain interval of about 0.08%. After the test was complete, the specimen
was retained and dried to determine density and water content, and the data processed according
to ASTM D4186 and Sandbækken et al., (1986).
'p was determined using the strain energy method of Becker et al., (1987). The method
identifies the intersection of tangent strain lines for the initial shallow slope recompression region
and higher stress steeper slope virgin compression regions of a strain energy vs. vertical effective
stress plot as 'p. The overconsolidation ratio (OCR, or 'p/'v0) is taken as the ratio of 'p
determined using the strain energy method to 'v0, the latter of which is determined using the unit
weights measured from undisturbed, intact CRS specimens.
Coefficient of consolidation was determined using the following equation:
cv= M*k/w 3.6
76
where, M = compressive modulus, k is hydraulic conductivity measured during the test at a
specific load increment, and w is the unit weight of water.
3.4.4 Anisotropically Consolidated Undrained Triaxial (CAUC) Shear Testing
Anisotropic Consolidation Undrained Triaxial Shear in Compression (CAUC) testing was
performed on intact, undisturbed specimens at the natural water content in general accordance
with ASTM D4767 (2011) Standard Test Method for Consolidated Undrained Triaxial
Compression Test for Cohesive Soils. A Trautwein GeoTac TruePath™ automated load test
system with computer control and sensor data acquisition (including vertical displacement,
internal and external axial loads, cell pump and witness pressures, pore pump and witness pore
water pressures, and temperature) was used. Sensor voltages were recorded at regular intervals
(time for seating and back-pressure phases and strain for consolidation and shear) and post-
processed to determine engineering units. Prior to testing, the triaxial pedestal, top cap, and stones
were calibrated to determine system deflection under vertical loading to correct test data for
system compliance and isolate specimen behavior.
Specimens were trimmed using a soil lathe, wire saw, and finally a knife edge to finished
dimensions of 1.4 inch diameter by 2.8 inches tall. Clean, moist porous stones and filter paper
were used at the top and bottom of each specimen for drainage. No filter paper was used around
the outside diameter of the specimens. The specimens were carefully placed on the bottom platen
and fitted with two thin (0.003 in. each) rubber membranes secured to the platens with O-rings to
prevent contact between the specimen and the confining fluid. Drainage lines were fitted to the
top and bottom platens, the cell wall and top cap were secured using three tie rods, and the cell
was placed into the load frame.
The cell was then filled with confining fluid, silicone oil in this case, to allow use of a
load cell inside the chamber between the piston and top cap for greater accuracy, and an initial
77
confining pressure of 104 psf (5 kPa) applied. Drainage lines and porous stones were then flushed
using deaired and deionized water, after which specimens were back pressure saturated at a
constant effective stress of 317 psf (15 kPa) up to a maximum cell pressure of 7310 psf (350 kPa)
at this final constant effective stress. Backpressure was maintained for 18 hours or longer. A
check of saturation was made using the Skempton B parameter, which is the ratio of the measured
change in pore pressure to change in cell pressure under undrained conditions. B parameters in
excess of 0.90 to 0.95 were accepted as100% saturation, allowing for greater stiffness of the silty
clay. If an appropriate B parameter was measured, the specimen stress was returned to pre- B
parameter test conditions, drainage reinitiated, and consolidation phase was initiated. If the B
parameter was too low, the cell pressure was increased at constant effective stress by an
additional 2090 psf (100 kPa) and maintained for another 24 hours. The B parameter was then
checked again to ensure an appropriate level of saturation was achieved.
Specimens were then reconsolidated to the estimated anisotropic in situ effective stress
state, where in situ vertical effective stress, 'v0, was estimated based on the saturated density
values determined from intact CRS consolidation specimens. The coefficient of lateral earth
pressure at rest, K0, was estimated based on the stress history and overconsolidation results from
CRS consolidation and published correlations between OCR, PI, and K0 (Equation 3.7; Mayne
and Kulhawy, 1982).
K0(OC) = K0(NC)·OCRh = (1-sin)OCRsin 3.7
where OC indicates overconsolidated and NC indicates normally consolidated states, is drained
friction angle, and h is an empirical coefficient generally equal to 0.5.
A K0(NC) value of 0.5 and OCR exponent h of 0.5 were assumed, which are generally
accepted assumptions made for clay soils. When specimens had an overconsolidation ratio that
lead to an estimate of K0 greater than 1, specimens were anisotropically consolidated to K0 = 0.95
78
(nearly isotropically consolidated) prior to shear. Laboratory capabilities did not allow K0 > 1
consolidation.
Specimens were consolidated in drained conditions up to the estimated in situ effective
stress at a constant K0 value using an axial strain rate of 0.1%/hour under constant cell pressure.
Thereafter, specimens were allowed to creep for 24 hours to allow for equilibration of internal
pore pressures, as pore pressure was measured only at the drainage boundaries. Following creep,
specimens were sheared in an undrained condition by application of a constant axial strain rate of
0.5%/hour to a maximum axial strain of 20%. The data acquisition system recorded all
transducers at an axial strain interval of 0.02%. After the test was complete, the specimen was
retained and dried to determine density and water content, and data processed according to
ASTM D4767 (2011).
The failure mode represented by anisotropically consolidated undrained triaxial
compression (CAUC) testing can be observed visually in Figure 2.4. The test simulates a
specimen of clay confined laterally by a constant stress with an increasing vertical load (deviator
stress angle of 0o) to failure. Undrained shear strength obtained from CAUC testing (su(TC)), where
the "TC" denotes triaxial compression, is the highest value of su obtained from the three
laboratory testing methods consisting of triaxial compression, triaxial extension, and direct simple
shear. CAUC testing was selected for the Martin's Point Bridge, Route 197 Bridge, and the I-395
Terminus Investigation in Brewer because the testing equipment allows for precise control of the
applied stresses throughout the entirety of the test, which permits boundary condition control and
provides in high quality test results.
An ideal CAUC testing procedure includes consolidation of the specimen, prior to shear,
under the same estimated in situ stresses in order to best re-create in situ su. However, due to test
equipment limitations, the vertical effective consolidation stress during recompression ('vc) will
79
inevitably be different from the estimated 'v0 and will affect the resulting su values. The
horizontal effective stress may also differ, resulting in a lateral earth pressure coefficient during
recompresion (Kc) to differ from the estimated K0. Kc and 'vc values are presented on all the test
result summary tables to compare to estimated in situ values.
The effect of the inevitable 'vc ≠ 'v0 condition can cause the su to increase and/or
decrease. While 'vc > 'v0 may increase the su since the clay is sheared under greater confining
pressure, the same condition may also weaken the specimen by breaking down soil structure and
pre-straining it. In general, the destructing of the clay from the 'vc > 'v0 condition likely
dominates and leads to lower su values, where the 'vc < 'v0 condition likely leads to higher su
values.
3.4.5 Direct Simple Shear Testing
Langlais (2011) describes the method for DSS testing: "Direct simple shear (DSS) testing
was performed on block and tube samples, using Recompression procedures, in general
accordance with ASTM D6528 (2007) Standard Test Method for Consolidated Undrained Direct
Simple Shear Testing of Cohesive Soils. Tests were conducted using a Trautwein GeoTAC
DigiShear® apparatus. The system consists of top and bottom caps, 14 steel confining rings,
horizontal and vertical motors and load cells, horizontal linear variable differential transducer
(LVDT), a vertical direct current digital transducer (DCDT), and burette. The testing procedure
consisted of specimen setup, recompression consolidation, and shear. All data acquisition
occurred through a computer using DigiShear computer software.
Porous stones and o-rings were cleaned in an ultrasonic cleaner, and the o-rings were
vacuum greased prior to use. The specimens were extruded and placed in the DSS trimming jig
on plastic wrap and trimmed with the lubricated DSS cutting ring and small spatula. Cuttings
were used to confirm the natural water content of the test specimen. The final cutting ring
80
position was approximately in the middle of the sample, and the top and bottom faces were
trimmed and smoothed with a wire saw. The soil in the cutting ring had an initial height of 0.75
inches [1.91 cm] and diameter of 2.62 inches [6.68 cm]. The trimmed specimen was extruded
from the cutting ring onto the bottom cap, and a latex membrane was installed around the bottom
cap and sample using a stretcher and vacuum pressure. Three o-rings were placed around the
membrane and bottom cap. The outside of the membrane and the steel rings were coated with
silicon oil, and the steel rings were stacked and lowered around the sample for lateral
confinement (Baxter et al., 2002). The top of the membrane was stretched down over the
confining rings, and the top cap was set on top of the sample. The top cap weight resulted in a
31.3 psf [1.5 kPa] seating load to engage lateral confinement. The membrane was stretched over
the top cap and secured with an o-ring. The confining pins were then tightened simultaneously to
prevent lateral displacement during consolidation, and the setup was transferred to the load
frame.
The positions of the base and top connector of the apparatus were manually adjusted
(horizontally and vertically, respectively), and the top and bottom caps were secured when in the
necessary position. The burette was attached to the bottom cap, a tube connecting the caps was
attached, and a drainage tube with an open/close valve was connected to the top cap. The
positions and readings on the load cells, LVDT, and DCDT were zeroed, and the consolidation
and shear phases were set up in the DigiShear software. The burette was filled with deionized
water to a height approximately level with the midpoint of the test specimen in the load frame.
For the recompression consolidation, the specimens were loaded to their approximate in
situ vertical effective stress, σ'v0 with a load increment ratio (LIR) of roughly 1. Loads of 1/8, 1/4,
and 1/2 of σ'v0 were applied until primary consolidation was approximately complete. The final
consolidation load of σ'v0 was applied for 12 to 18 hours to ensure consolidation to the final
stress was complete. The burette and drainage valves were opened just prior to the application of

81
the 1/8 σ'v0 load. The burette was kept open for the first few minutes of consolidation or until all
air was flushed from the system, while the water level in the burette was maintained. The drain
valve was closed when no air was noticeable, but the burette was kept open throughout the test to
prevent drying and facilitate drainage.
At the end of consolidation, the confining pins were removed, the horizontal load cell was
rezeroed, and shear was initiated. The vertical load during shear automatically adjusted itself to
maintain constant sample height (constant volume) during shear. The specimen was sheared at
approximately 4.8% per hour to a final shear strain of approximately 20%. Data was recorded by
the transducers at a shear strain interval of about 0.02% during shear. The setup was dismantled,
specimen retained and dried, and data reduced using a spreadsheet template. The data reduction
template was calibrated to account for confining ring friction and system deflection under
horizontal and vertical loading."
The failure mode represented by direct simple shear (DSS) testing can be observed
visually in Figure 2.4. The test simulates shearing along a horizontal plane, similar to conditions
at the deepest portion of any slope failure. Unlike triaxial compression or extension testing, DSS
has indeterminate and non-uniform states of stress and indeterminate deviator stress angle.
DeGroot and Ladd (2010) suggest that the deviator stress angle probably lies somewhere in
between 30o and 60o. The undrained shear strength obtained from DSS testing (su(DSS)) is generally
larger than triaxial extension and smaller than triaxial compression (i.e. su(TC) < su(DSS) < su(TE)).
Langlais (2011) states that DSS testing was selected for the Presumpscot clay at Falmouth
because of its applicability to slope stability determination as well as it's generally used to
estimate su(avg).

82
3.4.6 SHANSEP Consolidated Undrained Triaxial Shear Testing
Consolidated undrained triaxial compression tests were performed on specimens from
Martin's Point Bridge, Richmond Dresden Bridge, and I-395 Terminus site employing the Stress
History and Normalized Soil Engineering Parameter (SHANSEP) method in general accordance
with ASTM D4767 and Ladd (1991). Specimens were anisotropically consolidated to the in situ
'v0 and then K0 consolidated past 'v0 to a value representing either 10% axial strain or twice the
maximum past pressure, 'p, as determined from CRS consolidation tests. K0 consolidation by
definition is when axial strain and volumetric strain are continually equal. In our testing it was
maintained by active computer control. Two specimens from the same tube sample were
consolidated in this way. The first specimen was sheared at an OCR of 1 following a 24 hour
period of drained creep (e.g., secondary compression). The second specimen was first unloaded at
a rate of 0.02% axial strain to an OCR of 2 followed by a 24 hour period of drained creep prior to
shearing. The results of these tests were used to determine the relationship between undrained
shear strength and stress history using Equation 2.1 (Ladd and Foott 1974), where su is undrained
shear strength at either the normally consolidated (NC) or overconsolidated (OC) state and m is the
SHANSEP OCR exponent.
3.4.7 Sample Quality Assessment
Sample quality was evaluated using the Norwegian Geotechnical Institute (NGI) method
of Lunne et al. (2006). This method uses normalized change in void ratio upon recompression to
the estimated in situ effective stress state, e/e0 at 'v0, to determine sample quality, where e is
the change in void ratio, e0 is the initial void ratio of the specimen, and 'v0 is estimated in situ
vertical effective stress. Specimens experiencing low deformations upon reapplication to 'v0 are
of higher quality than those having greater deformations resulting from disturbance during the
sampling, transportation, storage, or specimen preparation. This method was developed for low
83
overconsolidation ratio (OCR < 4) soft clays having low to moderate sensitivity. It should be
noted that the Presumpscot clay that is the focus of this study occasionally has a higher OCR and
most often higher silt content then the soils used for development of the e/e0 sample quality
method. Soils with increasing silt content experience more rounded stress-strain curves than are
observed for predominately clayey soils, possibly leading to under predictions of sample quality
of Presumpscot clay.
3.4.8 Shear Strength and Remolded Shear Strength Discussion
Undrained shear strength (su) of the Presumpscot clay was estimated throughout this
research using the following methods:
Anisotropically Consolidated Undrained Compression (CAUC) [Laboratory]
Direct Simple Shear (DSS) [Laboratory]
Field Vane Shear Test (FVT) [Field]
Geonor fall cone apparatus [Laboratory]
Remolded undrained shear strength (su(r)) of the Presumpscot clay was estimated
throughout this research using the following methods:
Field Vane Shear Test (FVT) [Test]
Geonor fall cone apparatus [Laboratory]
The goal of the su correlations of Presumpscot clay to the CPTu is to accurately predict su
values directly from CPTu measurements. To achieve this, a "reference" su has to be selected to
back-calculate the empirical coefficients for the CPTu result (Nkt, Nu, Nke, Section 2.3.3). Since su
was estimated using multiple testing methods, Nkt, Nu, and Nke will always have a subscript
associated with it to denote which test was used as the "reference" strength. For instance, Nkt(CAUC)
denotes that the Nkt coefficient was calculated using triaxial compression as the reference su.
84
Laboratory determined su (i.e. CAUC and DSS testing) is the most reliable reference
shear strength because the sample quality of the tested specimens can be determined. In addition,
the boundary conditions and testing procedures of laboratory tests can be well controlled, whereas
the FVT can have some unexpected influences of testing error or unforeseen site conditions (such
as a silt or sand seam within the tested sample, which can easily be observed before testing is
conducted on laboratory samples). In no case should the fall cone apparatus be used to estimate su
values for design purposes. su determined from the fall cone is only used in conjunction with the
su(r) from the fall cone to estimate sensitivity. See Section 2.1.4 for a discussion between su
determined from CAUC and DSS testing methods.
3.5 SCPTu Correlations
Empirical correlations of SCPTu measurements to engineering properties and
classification were performed in the Presumpscot clay at each site. Methods were selected based
on two criteria: prevalence in current geotechnical practice as well as applicability to the
properties of Presumpscot clay. All of the selected methods are supported by tens, if not
hundreds, of empirical studies conducted in soft clays and in some cases sensitive and/or silty
clays which closely replicate the geologic deposition of the Presumpscot clay (Lunne et al., 1997;
NCHRP 2007; Mayne 2014; Schneider et al., 2008, Long 2008, Karlsrud 2005). Correlations to
classification, stress history, and undrained shear strength are outlined in Section 2.3.1 to 2.3.3.
85
4 ROUTE 26/100 FALMOUTH BRIDGE
The Route 26/100 Bride in Falmouth, Maine was the first of four Presumpscot clay
deposits investigated for this thesis. This chapter provides an overview of the site, a summary of
the geotechnical investigations conducted, results from the laboratory testing on high quality
samples of the clay, and the correlation of those results to the cone penetration testing (CPTu)
performed at the site.
4.1 Site Overview and Geology
The Route 26/100 Falmouth Bridge crosses the Presumpscot River in Falmouth, ME. The
bridge is approximately one-half mile east of Interstate 95 near Exit 53 (Figure 4.1) oriented in a
north-south direction. The new bridge, completed in 2012, consists of a 720 ft deck span
supported by three two-column concrete pier bents (H&A, 2009).
Presumpscot clay samples were collected and CPTu soundings were performed at the
northern approach of the Route 26/100 Falmouth Bridge. At this approach, Presumpscot clay was
the thickest throughout the entire site, at some locations up to 80 feet thick and approximately 63
feet at the location of the geotechnical investigation discussed herein. Two geotechnical
investigations were conducted by Haley & Aldrich (H&A) for the design of the new bridge. In
addition to this, Nick Langlais collected Presumpscot clay samples and conducted SCPTu testing
for his M.S. thesis, completed in 2011. This paper includes the results from Langlais’ 2011 M.S.
thesis as well as field vane shear testing (FVT) results from the two H&A geotechnical
investigations.
The subsurface conditions at the site consist of sand overlying stiff Presumpscot clay,
overlying soft Presumpscot clay, overlying silty sand, overlying glacial till, overlying bedrock
(Langlais 2011 and H&A 2009). All but the topmost layer of sand were deposited in the marine
environment during the last glacial retread of the Laurentide ice sheet.

86
Figure 4.1: Aerial image of the Route 26/100 Falmouth Bridge Site (Google Earth, 2014a).
The glacial till was deposited directly where the ice sheet made contact with the bedrock,
which was pushed below sea level due to the weight of the ice. As the ice sheet retreated, the
marine sand was deposited on top of the glacial till. Eventually, as the ice sheet retreated further,
the Presumpscot clay was deposited on top of the marine sand. All of these deposits were
submerged in marine water when formed.
The sand layer at the surface of the north bridge approach is a more recent stream
alluvium deposit. As glacial meltwater likely formed after deglaciation and the alluvial material
was deposited on top of the Presumpscot clay. Eventually, some of these streams dried up and
other formed permanent rivers. The Presumpscot River formed as a post-glacial river and carved
out what was likely once a similar deposit of glacial marine clay, marine sand, and glacial till into
the exiting river valley.
87
4.1.1 Previous Geotechnical Investigations
The Maine Department of Transportation (MaineDOT) subcontracted a preliminary
geotechnical investigation of the Falmouth Bridge Site in 2008, during which 6 test borings were
drilled along the proposed bridge alignment. Borings were drilled using a track-mounted B-50
rig, a CME 45 skid-mounted rig on a barge, or a CME550X ATV mounted rig. All drilling and is
situ testing was performed in accordance with Maine Department of Transportation (MaineDOT)
standards (H&A, 2009). In each boring, disturbed split spoon samples were collected at 5 foot
intervals through the Presumpscot clay for visual classification and laboratory index testing. Field
vane shear testing (FVT) was conducted at various depths. A second geotechnical investigation at
the Falmouth Bridge Site was completed in 2009 in addition to the preliminary investigation. A
total of twelve new borings were conducted along the proposed bridge and approach alignments
(H&A, 2009). Similar drilling and in situ testing procedures were deployed in the design phase
investigation as in the preliminary investigation described above.
A separate investigation was performed at the site by University of Maine and University
of Massachusetts Amherst personnel in 2010 for this research. This investigation included three
seismic cone penetration tests (SCPTu), one boring with twelve Sherbrook block samples, and
one boring with ten modified Shelby tube samples and two traditional Shelby tube samples. The
samples were transported to the University of Maine Advanced Geotechnics Laboratory for
subsequent testing. Table 4.1 summarizes the location of the FVT borings in respect to the
approximate location of the CPTu soundings.
Seismic cone penetration testing (SCPTu) was performed in general accordance with
ASTM D5778 (2007) Standard Test Method for Electronic Friction Cone and Piezocone
Penetration Testing for Soils and the methodology outlined in Section 3.1. Samples of the
Presumpscot clay were collected using Sherbrook block sampling, Shelby tube sampling using
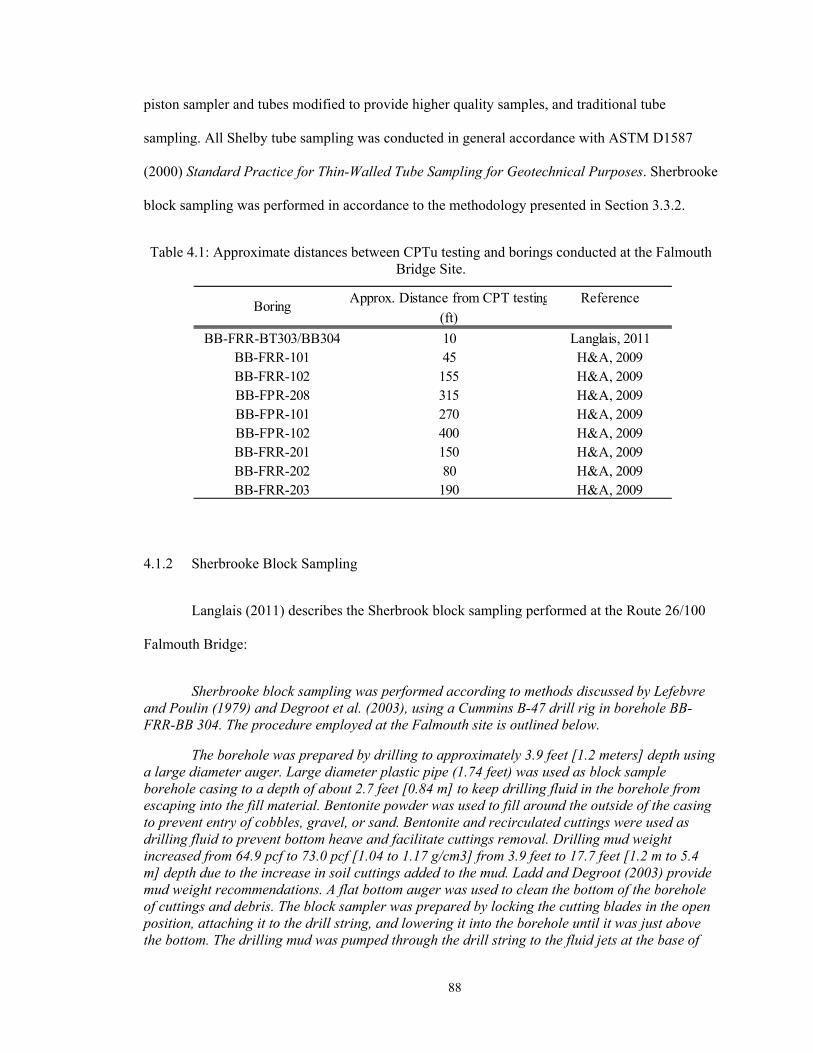
88
piston sampler and tubes modified to provide higher quality samples, and traditional tube
sampling. All Shelby tube sampling was conducted in general accordance with ASTM D1587
(2000) Standard Practice for Thin-Walled Tube Sampling for Geotechnical Purposes. Sherbrooke
block sampling was performed in accordance to the methodology presented in Section 3.3.2.
Table 4.1: Approximate distances between CPTu testing and borings conducted at the Falmouth Bridge Site.
4.1.2 Sherbrooke Block Sampling
Langlais (2011) describes the Sherbrook block sampling performed at the Route 26/100
Falmouth Bridge:
Sherbrooke block sampling was performed according to methods discussed by Lefebvre and Poulin (1979) and Degroot et al. (2003), using a Cummins B-47 drill rig in borehole BB-FRR-BB 304. The procedure employed at the Falmouth site is outlined below.
The borehole was prepared by drilling to approximately 3.9 feet [1.2 meters] depth using a large diameter auger. Large diameter plastic pipe (1.74 feet) was used as block sample borehole casing to a depth of about 2.7 feet [0.84 m] to keep drilling fluid in the borehole from escaping into the fill material. Bentonite powder was used to fill around the outside of the casing to prevent entry of cobbles, gravel, or sand. Bentonite and recirculated cuttings were used as drilling fluid to prevent bottom heave and facilitate cuttings removal. Drilling mud weight increased from 64.9 pcf to 73.0 pcf [1.04 to 1.17 g/cm3] from 3.9 feet to 17.7 feet [1.2 m to 5.4 m] depth due to the increase in soil cuttings added to the mud. Ladd and Degroot (2003) provide mud weight recommendations. A flat bottom auger was used to clean the bottom of the borehole of cuttings and debris. The block sampler was prepared by locking the cutting blades in the open position, attaching it to the drill string, and lowering it into the borehole until it was just above the bottom. The drilling mud was pumped through the drill string to the fluid jets at the base of
Approx. Distance from CPT testing Reference
(ft)
BB-FRR-BT303/BB304 10 Langlais, 2011BB-FRR-101 45 H&A, 2009BB-FRR-102 155 H&A, 2009BB-FPR-208 315 H&A, 2009BB-FPR-101 270 H&A, 2009BB-FPR-102 400 H&A, 2009BB-FRR-201 150 H&A, 2009BB-FRR-202 80 H&A, 2009BB-FRR-203 190 H&A, 2009
Boring
89
the sampler at 1462 psf to 4386 psf [70 to 210 kPa], depending on the sample, and rotation was started at approximately 25 to 60 revolutions per minute. The sampler was then lowered to the bottom of the borehole to begin sampling, with penetration rates ranging from approximately 0.6 inches to 6.0 inches [15 to150 mm] per minute for 11.8 inches to 13.8 inches [300 to 350 mm] of penetration. The rotation of the sampler and water jets carved the soil from the subsurface. The rate of advance and rotation was determined by analyzing the recovery of the previous samples. Generally, faster rotation rates and slower penetration rates were used on shallower samples, while slower rotation rates and faster penetration rates were used on deeper samples. It was found that the fastest rotation rates with slower penetration rates resulted in the least amount of sample recovery (diameter), as the drilling mud in the jets had more time to erode the soil.
After sampler penetration reached the desired depth, rotation and advance of the sampler was paused, and a donut drop hammer was lowered down the drill string and dropped 2 to 3 times on the sampler to release the cutting blades at the bottom of the sampler (locked in with cams). After the blades were activated, rotation was continued without advance for approximately 5 minutes while the fluid jets were active. This process allowed the cutting blades to shear the bottom of the sample from the underlying soil, and the blades in the closed position provide basal support for the block sample. Rotation and fluid circulation was stopped, and the block sample was lifted slowly out of the borehole. The sample was cleaned of cuttings and drilling mud, and the blades were opened to release the soil from the sampler. The samples were transported and the bottoms were trimmed, approximately 1.97 inches to 2.95 inches [50 to 75 mm], using one side of a 0.82 foot [0.25 m] diameter aluminum split mold. The sampler was then cleaned with a pressure washer and reset for reuse.
After the block sample was trimmed, the bottom was first painted with a wax/petroleum jelly mixture (approximately 50:50 by volume) and secured to a plywood base that was also covered with several layers of wax/petroleum and plastic cling film dipped in the mixture. The block was lifted upright, and the remainder of the sample was coated in several alternating layers of dipped plastic wrap and wax/petroleum jelly. Several of the finished blocks were also wrapped in a layer of cheese cloth. The samples were well sealed to minimize contact with air and prevent drying. When the samples were sealed, they were placed in wooden transportation boxes filled with packing peanuts (ASTM D4220, and Degroot et al. 2003) to mitigate sample disturbance. Some block samples could not be covered in several layers of the wax and plastic wrap in the field due to time constraints, so they were finished in the University of Maine laboratory and placed in a humid room. In all, 12 successful block samples were obtained to a depth of approximately 19.7 feet [6 m] in two days.
4.2 Laboratory Characterization
A total of 12 Sherbrooke block samples and 12 modified standard Shelby tube samples
were collected at the Route 26/100 Falmouth Bridge Site and tested at the University of Maine
Advanced Geotechnics Laboratory. Each collected sample was tested for index properties
(moisture content, Atterberg Limits, hydrometer, organics, specific gravity, and fall cone
90
strength), consolidation properties, and shear strength properties. All testing methods were in
general accordance with ASTM standards and are outlined in Chapter 3.
4.2.1 Index Testing
Figure 4.2 illustrates the depth trends of natural water content, Atterberg limits, grain size
distribution, index undrained shear strength (su) and sensitivity (St) measured using the fall cone
apparatus, organic content, and unit weight (total, dry, and solids) of Presumpscot clay from the
Route 26/100 Falmouth Bridge. Total and dry unit weights of the Presumpscot clay were
determined in accordance with ASTM D4186 (2006) using the tested specimen for each
consolidation test. Unit weight of solids was determined from the specific gravity index test using
ASTM D854 (2010) Standard Test Methods for Specific Gravity of Soil Solids by Water
Pycnometer.
Natural water content, Atterberg Limits (liquid limit, LL, plastic limit, PL, plasticity
index, PI, and liquidity index, LI), and Activity (the ratio of plasticity index to the percent grain
size finer than 0.002 mm, or clay fraction) values are summarized in Table 4.2. Grain size,
organic content, total, dry, and solids unit weights, and Unified Soil Classification System
(USCS) designations are tabulated in Table 4.3.
Natural water content ranged from 37% to 54% over the entire profile of Presumpscot
clay at the north approach, generally remaining constant in the top 25 feet of the layer around
47% and decreasing with depth below 25 feet. Plastic limit (PL) over the entire profile ranged
from 19 to 29 with no distinct trend with depth. The bottom three specimens resulted in PL from
19 to 21, indicating the reduction in plasticity as the clay transitions into the underlying outwash
sand. Liquid limit (LL) of the clay ranged from 29 to 54 and showed a distinct decreasing trend
below 25 feet depth, matching the trend of water content.
91
Plasticity index (PI), defined as the difference of LL and PL, ranged from 9 to 27 over the
entire deposit. In general, there was a minor decreasing trend in PI with depth. The three deepest
samples, collected from 52.0 to 62.0 feet below ground surface, resulted in low PI values ranging
from 10 to 13. The reduced plasticity with depth is consistent with an increase in silt and sand
content in the samples.
Fine-grained soils (those which contain greater than 50% of its material by weight
passing the #200 sieve) are classified in accordance to their plasticity behavior. Figure 4.3 plots
the PI vs. LL (ASTM D4318, 2010), which is the Unified Soil Classification System (USCS)
method for classifying fine grained soils. The resulting classification can be observed in Table 4.3
Sensitivity (St), defined as the ratio of undrained shear strength (su) to remolded shear
strength (su(r)) at the natural water content measured using the fall cone apparatus, ranged from 9
to 58 with one value greater than 100 (Table 4.4). This classifies the deposit as highly sensitive to
highly quick (Holtz et al., 2011). This may indicate a high degree of platelet flocculation, which
is supported by high void ratios measured on intact consolidation specimens. The open structure
of the Presumpscot clay at the Route 26/100 Falmouth Bridge suggests that the depositional
environment had a high salt ion concentration.
Increased salt ions present in sea water encourage end-to-end clay platelet bonding,
which results in flocculated clay with high void ratios and high degree of structure (Mitchell and
Soga, 2005). Since deposition, the subsequent replacement of sea water with fresh water has
caused the salt ion concentration to decrease, leading to very low shear strength when the
structure is eliminated during remolding. The measured sensitivity values provide an expected
resistance to shear when soil is fully disturbed along the shear failure plane. In addition, it can
provide insight on the in situ clay structure and potential response during cone penetration testing.
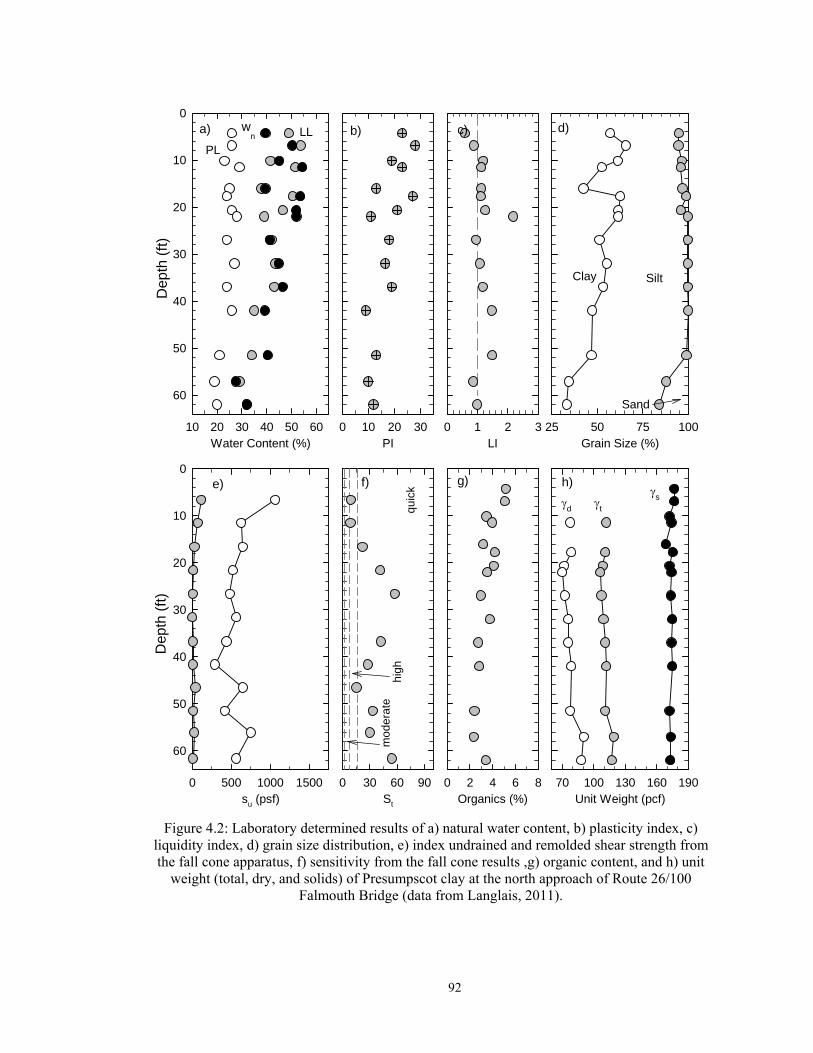
92
Figure 4.2: Laboratory determined results of a) natural water content, b) plasticity index, c) liquidity index, d) grain size distribution, e) index undrained and remolded shear strength from the fall cone apparatus, f) sensitivity from the fall cone results ,g) organic content, and h) unit
weight (total, dry, and solids) of Presumpscot clay at the north approach of Route 26/100 Falmouth Bridge (data from Langlais, 2011).
LI0 1 2 3
Unit Weight (pcf)70 100 130 160 190
su (psf)0 500 1000 1500
Dep
th (
ft)
0
10
20
30
40
50
60
Organics (%)0 2 4 6 8
St
0 30 60 90
Grain Size (%)25 50 75 100
PI0 10 20 30
Water Content (%)10 20 30 40 50 60
Dep
th (
ft)
0
10
20
30
40
50
60
PL
SiltClay
Sand
std
wn
a) b) c) d)
e) f) g) h)
LL
hig
hq
uic
k
mo
de
rate
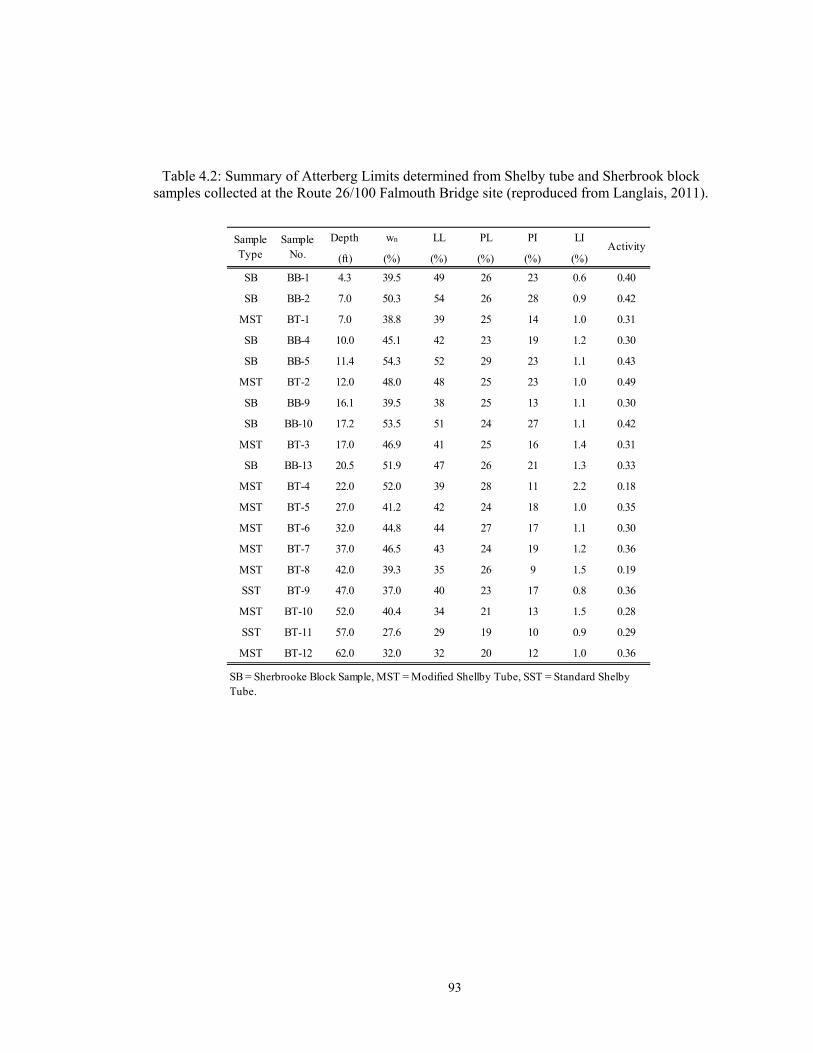
93
Table 4.2: Summary of Atterberg Limits determined from Shelby tube and Sherbrook block samples collected at the Route 26/100 Falmouth Bridge site (reproduced from Langlais, 2011).
Depth wn LL PL PI LI
(ft) (%) (%) (%) (%) (%)
SB BB-1 4.3 39.5 49 26 23 0.6 0.40
SB BB-2 7.0 50.3 54 26 28 0.9 0.42
MST BT-1 7.0 38.8 39 25 14 1.0 0.31
SB BB-4 10.0 45.1 42 23 19 1.2 0.30
SB BB-5 11.4 54.3 52 29 23 1.1 0.43
MST BT-2 12.0 48.0 48 25 23 1.0 0.49
SB BB-9 16.1 39.5 38 25 13 1.1 0.30
SB BB-10 17.2 53.5 51 24 27 1.1 0.42
MST BT-3 17.0 46.9 41 25 16 1.4 0.31
SB BB-13 20.5 51.9 47 26 21 1.3 0.33
MST BT-4 22.0 52.0 39 28 11 2.2 0.18
MST BT-5 27.0 41.2 42 24 18 1.0 0.35
MST BT-6 32.0 44.8 44 27 17 1.1 0.30
MST BT-7 37.0 46.5 43 24 19 1.2 0.36
MST BT-8 42.0 39.3 35 26 9 1.5 0.19
SST BT-9 47.0 37.0 40 23 17 0.8 0.36
MST BT-10 52.0 40.4 34 21 13 1.5 0.28
SST BT-11 57.0 27.6 29 19 10 0.9 0.29
MST BT-12 62.0 32.0 32 20 12 1.0 0.36
SB = Sherbrooke Block Sample, MST = Modified Shellby Tube, SST = Standard Shelby Tube.
Sample Type
Sample No.
Activity
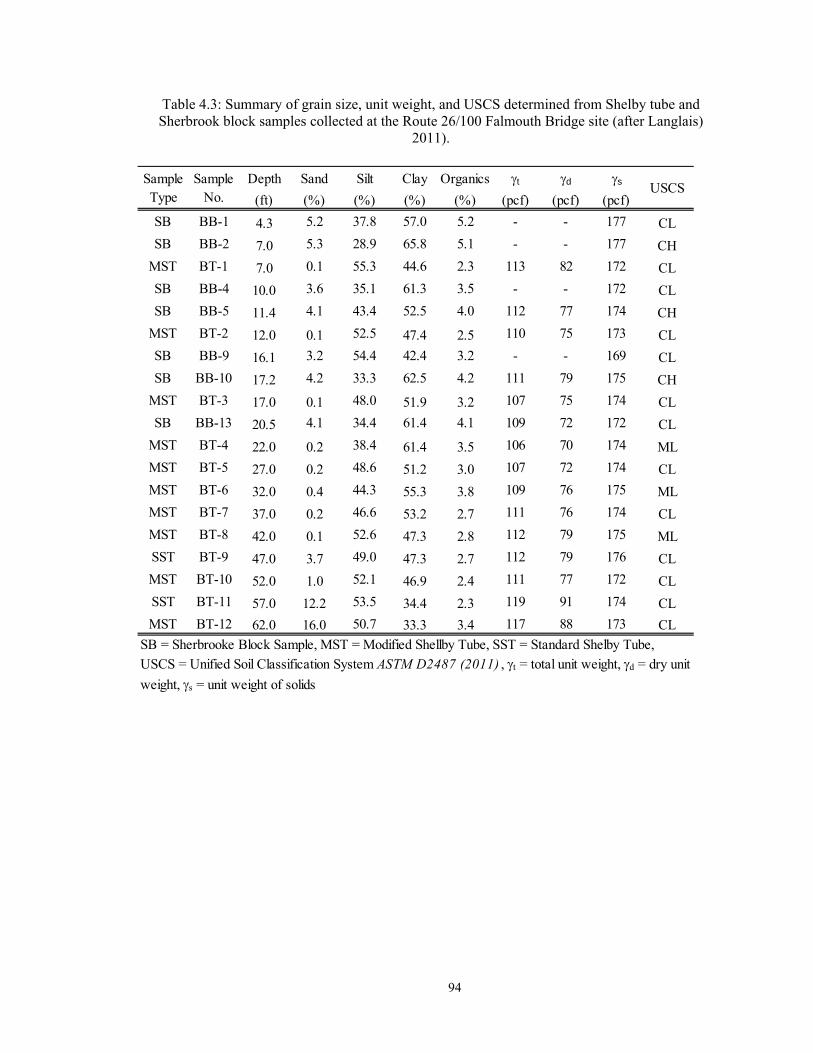
94
Table 4.3: Summary of grain size, unit weight, and USCS determined from Shelby tube and Sherbrook block samples collected at the Route 26/100 Falmouth Bridge site (after Langlais)
2011).
Depth Sand Silt Clay Organics t d s
(ft) (%) (%) (%) (%) (pcf) (pcf) (pcf)
SB BB-1 4.3 5.2 37.8 57.0 5.2 - - 177 CL
SB BB-2 7.0 5.3 28.9 65.8 5.1 - - 177 CH
MST BT-1 7.0 0.1 55.3 44.6 2.3 113 82 172 CL
SB BB-4 10.0 3.6 35.1 61.3 3.5 - - 172 CL
SB BB-5 11.4 4.1 43.4 52.5 4.0 112 77 174 CH
MST BT-2 12.0 0.1 52.5 47.4 2.5 110 75 173 CL
SB BB-9 16.1 3.2 54.4 42.4 3.2 - - 169 CL
SB BB-10 17.2 4.2 33.3 62.5 4.2 111 79 175 CH
MST BT-3 17.0 0.1 48.0 51.9 3.2 107 75 174 CL
SB BB-13 20.5 4.1 34.4 61.4 4.1 109 72 172 CL
MST BT-4 22.0 0.2 38.4 61.4 3.5 106 70 174 ML
MST BT-5 27.0 0.2 48.6 51.2 3.0 107 72 174 CL
MST BT-6 32.0 0.4 44.3 55.3 3.8 109 76 175 ML
MST BT-7 37.0 0.2 46.6 53.2 2.7 111 76 174 CL
MST BT-8 42.0 0.1 52.6 47.3 2.8 112 79 175 ML
SST BT-9 47.0 3.7 49.0 47.3 2.7 112 79 176 CL
MST BT-10 52.0 1.0 52.1 46.9 2.4 111 77 172 CL
SST BT-11 57.0 12.2 53.5 34.4 2.3 119 91 174 CL
MST BT-12 62.0 16.0 50.7 33.3 3.4 117 88 173 CL
SB = Sherbrooke Block Sample, MST = Modified Shellby Tube, SST = Standard Shelby Tube,
USCS = Unified Soil Classification System ASTM D2487 (2011) , t = total unit weight, d = dry unit
weight, s = unit weight of solids
USCSSample Type
Sample No.

95
Figure 4.3: USCS Classification chart for fine content of tube and Sherbrook block samples from the Route 26/100 Falmouth Bridge Site (from Langlais, 2011).
Figure 4.4 presents the PI versus the clay fraction of the tested Presumpscot clay at the
Route 26/100 Falmouth Bridge. This chart is commonly used to predict the mineralogy of tested
clay samples. Two lines are shown on the plot, A = 0.90 and A= 0.38. These correspond to illite
and kaolinite clay minerals, respectively. Kaolinite appears to be the dominant clay material in
Presumpscot clay; however, x-ray diffraction of Presumpscot clay indicates that kaolinite is not
present in Presumpscot clay (Schnitiker & Borns, 1987). The discrepancy is likely due to the
determination of clay fraction, which is defined as any particle smaller than 0.002 mm in
diameter. The pulverized rock flour portion of Presumpscot clay is incorporated into the “clay
fraction” portion. Therefore, the actual clay fraction of the Presumpscot clay is lower than
determined by the hydrometer test.
Liquid Limit
0 10 20 30 40 50 60 70 80 90 100 110
Pla
stic
ity In
dex
0
10
20
30
40
50
60 3- 13 ft
13- 23 ft
16- 33 ft
33- 49 ft
49- 66 ft
66- 82 ft
7- 20 ft
20- 43 ft
43- 62 ft
U-Lin
e
A-Line
CH
CL
ML
CL-ML
MLor
OLOH
orMH
7
4
Block
Tube
H&A (2009)
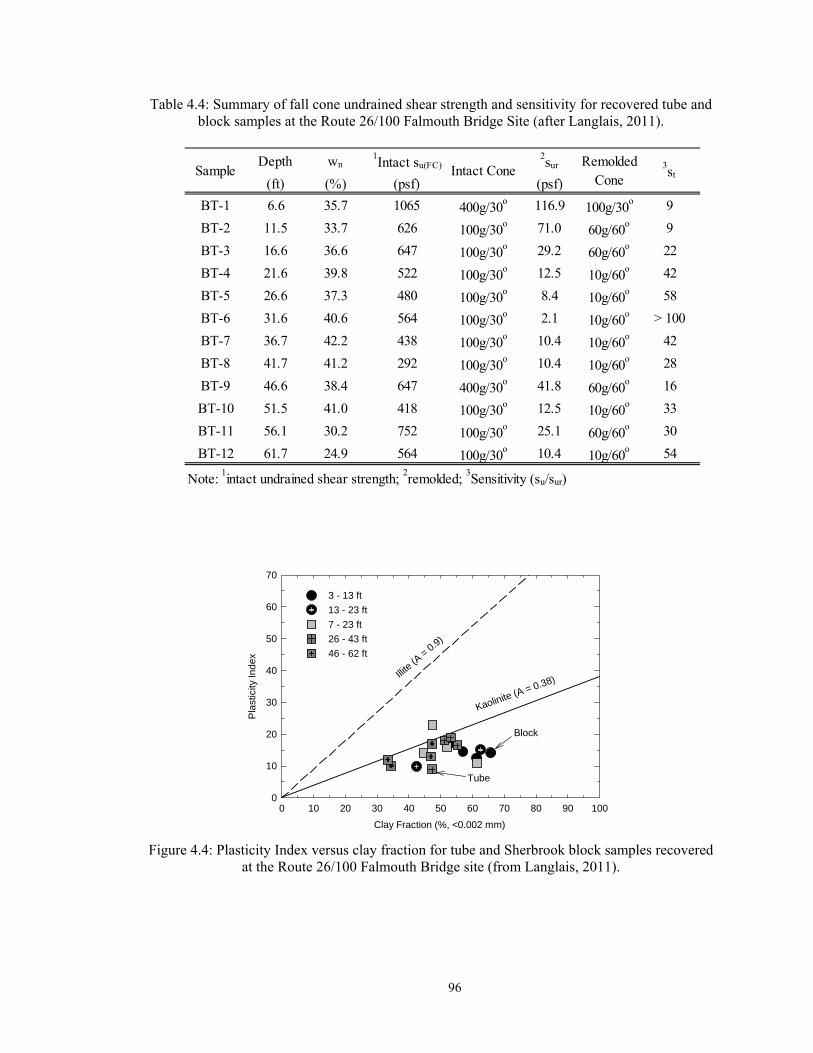
96
Table 4.4: Summary of fall cone undrained shear strength and sensitivity for recovered tube and block samples at the Route 26/100 Falmouth Bridge Site (after Langlais, 2011).
Figure 4.4: Plasticity Index versus clay fraction for tube and Sherbrook block samples recovered at the Route 26/100 Falmouth Bridge site (from Langlais, 2011).
Clay Fraction (%, <0.002 mm)
0 10 20 30 40 50 60 70 80 90 100
Pla
stic
ity In
dex
0
10
20
30
40
50
60
70
3 - 13 ft
13 - 23 ft
7 - 23 ft
26 - 43 ft
46 - 62 ft
Illite (A
= 0.9)
Kaolinite (A = 0.38)
Block
Tube
Depth wn1Intact su(FC)
2sur
(ft) (%) (psf) (psf)
BT-1 6.6 35.7 1065 400g/30o 116.9 100g/30
o 9
BT-2 11.5 33.7 626 100g/30o 71.0 60g/60
o 9
BT-3 16.6 36.6 647 100g/30o 29.2 60g/60
o 22
BT-4 21.6 39.8 522 100g/30o 12.5 10g/60
o 42
BT-5 26.6 37.3 480 100g/30o 8.4 10g/60
o 58
BT-6 31.6 40.6 564 100g/30o 2.1 10g/60
o > 100
BT-7 36.7 42.2 438 100g/30o 10.4 10g/60
o 42
BT-8 41.7 41.2 292 100g/30o 10.4 10g/60
o 28
BT-9 46.6 38.4 647 400g/30o 41.8 60g/60
o 16
BT-10 51.5 41.0 418 100g/30o 12.5 10g/60
o 33
BT-11 56.1 30.2 752 100g/30o 25.1 60g/60
o 30
BT-12 61.7 24.9 564 100g/30o 10.4 10g/60
o 54
Note: 1intact undrained shear strength;
2remolded;
3Sensitivity (su/sur)
Intact ConeRemolded
Cone3stSample
97
4.2.2 One Dimensional Consolidation Results
Constant rate of strain (CRS) consolidation testing was conducted on fourteen samples
collected at the Route 26/100 Falmouth Bridge Site. Preconsolidation pressure ('p) was
determined using the Becker et al., (1987) strain energy method. Table 4.5 presents specimen and
test parameters for the CRS consolidation tests, as well as stress-strain and flow parameters for
the loading phase of the tests and calculated 'p and compression indices. Specimens were
generally of very good to excellent quality with the exception of five specimens having good to
fair quality and one poor quality specimen based on the Lunne (2006) sample quality assessment
method. Specimens of poor quality may be less reliable in predicting 'p and other consolidation
parameters due to sample disturbance misrepresenting in situ conditions. In situ effective stress
('vo) for the determination of overconsolidation ratio (OCR) was estimated from unit weights
calculated from the tested consolidation samples and the groundwater levels observed in the cone
penetration tests.
'p at the Route 26/100 Falmouth Bridge Site ranged from 2,297 psf at the top of the
deposit to 4,573 psf near the bottom, decreasing from the shallow samples to a depth of
approximately 21 feet, after which it begins a nearly linearly increasing trend with depth. OCR,
defined as the ratio of 'p to the in situ effective stress ('vo) is highest at the shallowest depth of
the Presumpscot clay, starting at 3.4, and decreases to a value of 1.8 at 21.3 feet depth. Refer to
Figure 4.5 for the profile of laboratory determined 'p, OCR, and the associated sample quality of
the tested Presumpscot clay samples.
The resulting profile of 'p and OCR of the tested samples indicate a lightly
overconsolidated crust overlying a practically normally consolidated (i.e. OCR = 1) deposit.
Overconsolidation of the upper crust is likely due to the fluctuation of groundwater through this
sample depth and the resulting wetting and drying cycle altering the interparticle stresses. This
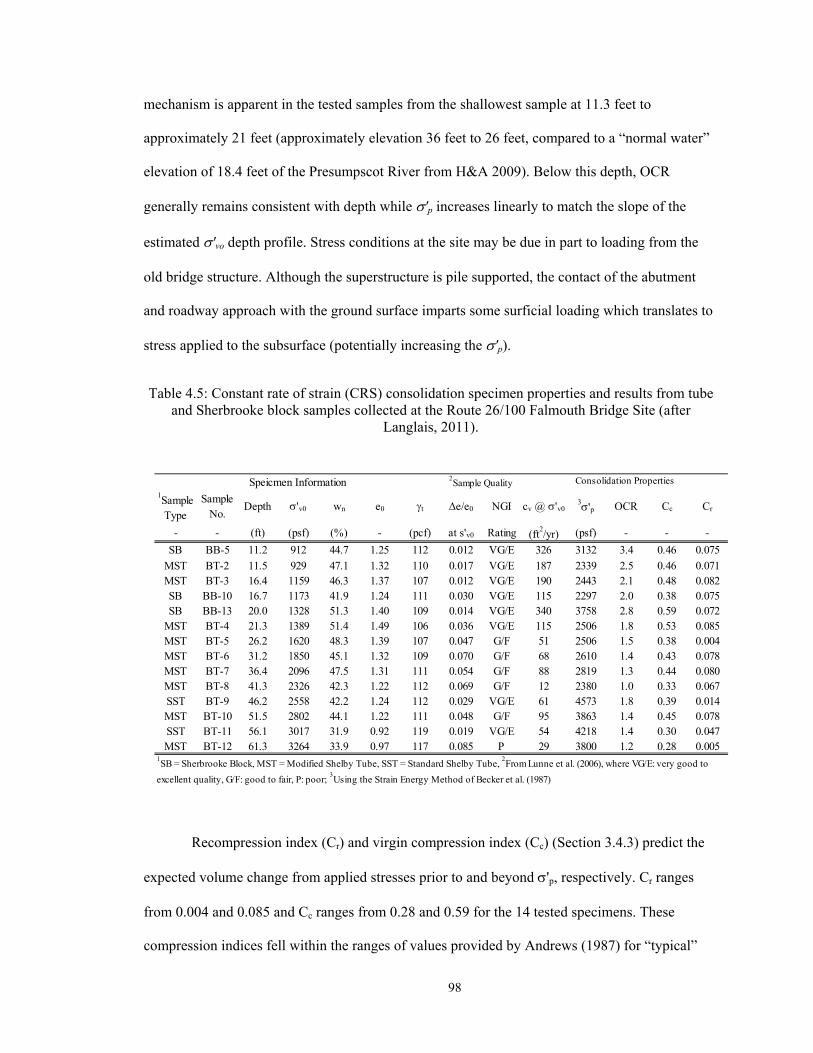
98
mechanism is apparent in the tested samples from the shallowest sample at 11.3 feet to
approximately 21 feet (approximately elevation 36 feet to 26 feet, compared to a “normal water”
elevation of 18.4 feet of the Presumpscot River from H&A 2009). Below this depth, OCR
generally remains consistent with depth while 'p increases linearly to match the slope of the
estimated 'vo depth profile. Stress conditions at the site may be due in part to loading from the
old bridge structure. Although the superstructure is pile supported, the contact of the abutment
and roadway approach with the ground surface imparts some surficial loading which translates to
stress applied to the subsurface (potentially increasing the 'p).
Table 4.5: Constant rate of strain (CRS) consolidation specimen properties and results from tube and Sherbrooke block samples collected at the Route 26/100 Falmouth Bridge Site (after
Langlais, 2011).
Recompression index (Cr) and virgin compression index (Cc) (Section 3.4.3) predict the
expected volume change from applied stresses prior to and beyond 'p, respectively. Cr ranges
from 0.004 and 0.085 and Cc ranges from 0.28 and 0.59 for the 14 tested specimens. These
compression indices fell within the ranges of values provided by Andrews (1987) for “typical”
1Sample Type
Sample No.
Depth 'v0 wn e0 t e/e0 NGI cv @ 'v03'p OCR Cc Cr
- - (ft) (psf) (%) - (pcf) at s'v0 Rating (ft2/yr) (psf) - - -
SB BB-5 11.2 912 44.7 1.25 112 0.012 VG/E 326 3132 3.4 0.46 0.075
MST BT-2 11.5 929 47.1 1.32 110 0.017 VG/E 187 2339 2.5 0.46 0.071MST BT-3 16.4 1159 46.3 1.37 107 0.012 VG/E 190 2443 2.1 0.48 0.082SB BB-10 16.7 1173 41.9 1.24 111 0.030 VG/E 115 2297 2.0 0.38 0.075SB BB-13 20.0 1328 51.3 1.40 109 0.014 VG/E 340 3758 2.8 0.59 0.072
MST BT-4 21.3 1389 51.4 1.49 106 0.036 VG/E 115 2506 1.8 0.53 0.085MST BT-5 26.2 1620 48.3 1.39 107 0.047 G/F 51 2506 1.5 0.38 0.004MST BT-6 31.2 1850 45.1 1.32 109 0.070 G/F 68 2610 1.4 0.43 0.078MST BT-7 36.4 2096 47.5 1.31 111 0.054 G/F 88 2819 1.3 0.44 0.080MST BT-8 41.3 2326 42.3 1.22 112 0.069 G/F 12 2380 1.0 0.33 0.067SST BT-9 46.2 2558 42.2 1.24 112 0.029 VG/E 61 4573 1.8 0.39 0.014MST BT-10 51.5 2802 44.1 1.22 111 0.048 G/F 95 3863 1.4 0.45 0.078SST BT-11 56.1 3017 31.9 0.92 119 0.019 VG/E 54 4218 1.4 0.30 0.047MST BT-12 61.3 3264 33.9 0.97 117 0.085 P 29 3800 1.2 0.28 0.005
1SB = Sherbrooke Block, MST = Modified Shelby Tube, SST = Standard Shelby Tube,
2From Lunne et al. (2006), where VG/E: very good to
excellent quality, G/F: good to fair, P: poor; 3Using the Strain Energy Method of Becker et al. (1987)
Speicmen Information 2Sample Quality Consolidation Properties
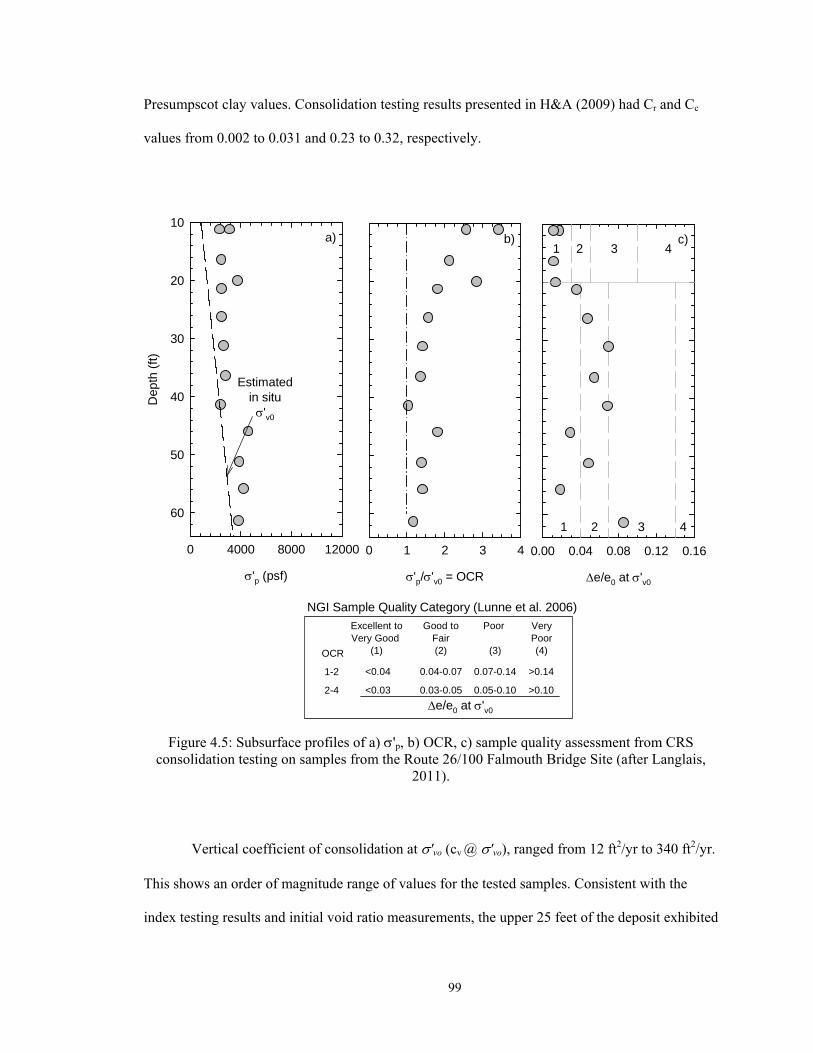
99
Presumpscot clay values. Consolidation testing results presented in H&A (2009) had Cr and Cc
values from 0.002 to 0.031 and 0.23 to 0.32, respectively.
Figure 4.5: Subsurface profiles of a) 'p, b) OCR, c) sample quality assessment from CRS consolidation testing on samples from the Route 26/100 Falmouth Bridge Site (after Langlais,
2011).
Vertical coefficient of consolidation at 'vo (cv @ 'vo), ranged from 12 ft2/yr to 340 ft2/yr.
This shows an order of magnitude range of values for the tested samples. Consistent with the
index testing results and initial void ratio measurements, the upper 25 feet of the deposit exhibited
'p (psf)
0 4000 8000 12000
Dep
th (
ft)
10
20
30
40
50
60
Estimatedin situ'v0
'p/'v0 = OCR
0 1 2 3 4
e/e0 at 'v0
0.00 0.04 0.08 0.12 0.16
NGI Sample Quality Category (Lunne et al. 2006)
Excellent toVery Good
(1)
Poor
(3)OCR
1-2
2-4
<0.04 0.04-0.07 0.07-0.14 >0.14
<0.03 0.03-0.05 0.05-0.10 >0.10
e/e0 at 'v0
Good toFair(2)
VeryPoor(4)
a) b) c)
1 2 3 4
1 2 3 4
100
a more open structure with cv values averaging 212 ft2/yr while the lower portion of the deposit
resulted in a cv average of 57 ft2/yr. The sand content average in the upper 25 feet is 2.7% while it
is 4.0% in the lower portion, showing a potential relationship between increased cv with
increasing sand content. Andrews (1987) reported the cv of Presumpscot clay in the Portland,
Maine region to range from 18 ft2/yr to 54 ft2/yr, indicating that the samples recovered at the
Route 26/100 Bridge resulted in higher than expected cv values.
4.2.3 Direct Simple Shear Undrained Strength Results
Direct simple shear (DSS) testing was performed on 13 undisturbed tube and Sherbrooke
block samples to determine undrained shear strength (su) values of the Presumpscot clay at the
Route 26/100 Falmouth Bridge. Table 4.6 presents specimen properties, conditions following
recompressions to the estimated in situ effective stress state, sample quality, and pre-shear
parameters of the tested DSS samples.
Table 4.7 presents the results of the DSS testing for all 13 specimens including strength,
pore pressure and strain. Sample quality (using the Norwegian Geotechnical Institute (NGI)
method of Lunne et al. 2006) is typically very good to excellent or good to fair for DSS
specimens from shallow depths and decreases with depth as stress relief from removal of
overburden increases. su is taken as the maximum measured shear stress during the test. For soils
with significant natural structure, sample disturbance can lead to structural break down (i.e.
breaking bonds). This diminishes its ability to withstand stress during shear compression. For
soils without significant natural structure, disturbance leads to densification (e.g., lower void
ratio) following reapplication of in situ stresses which subsequently leads to an increase in
strength compared to the higher void ratio in situ soil. For significantly structured soil, the effects
of structural damage and subsequent strength loss likely surpass increases in strength from
101
densification, and measured strength is less than in situ strength. Sensitivity, an indirect
measurement of the amount of is high for the sire soils, indicating a structured soil deposit. For
samples with low sample quality (see Table 4.6), it is likely that the resulting su is lower than the
in situ value.
su of the Presumpscot clay at the Route 26/100 Falmouth Bridge Site from DSS testing
ranged from 305 psf at 11.2 feet to 766 psf at 61.3 feet (Figure 4.6). In general, the su varied little
within the overconsolidated portion of the deposit from 11.2 feet to 26.2 feet ranging from 305
psf to 426 psf, where after, a nearly linearly increasing trend in su was apparent from 26.2 feet to
the bottom of the deposit at 61.3 feet (increasing from 401 psf to 766 psf). These values agree
well with the ranges of in situ su estimated from FVT testing by H&A (2009), which ranged from
200 psf to 1,100 psf. It is important to note that the failure mode imparted by the FVT method is
similar to the failure mode replicated by the direct simple shear (DSS) testing method (i.e.
horizontal failure plane) (Terzaghi et al., 1996). Therefore, the resulting su from both of the
methods can be expected to be reasonably similar. Based on the work of Karlsrud and Hernandez-
Martinez (2013), su from DSS is in the order of 0.74 times the anisotropically consolidated
undrained compression (CAUC) strength for high quality samples. Based on this, the equivalent
triaxial compression su of the Presumpscot clay at the Route 26/100 Bridge is estimated to range
from 411 psf to 969 psf. Analysis of the resulting equivalent CAUC su is presented in Chapter 8.
The summary and analysis provided in this chapter use only the DSS su.
Pore pressure at failure, calculated as the effective normal stress applied at the start of
shear minus the effective normal stress at failure, for specimens at Falmouth ranged from 173 psf
to 1,305 psf, generally increasing linearly with depth over the entire deposit. Sensitive clays are
especially subject to large positive pore pressures generated during shear failure as the metastable
skeleton collapses (Lambe & Whitman, 1969). In all but three tested specimens (BT-2, BB-5, and
BB-13), the pore pressure at failure was higher than the shear strength.
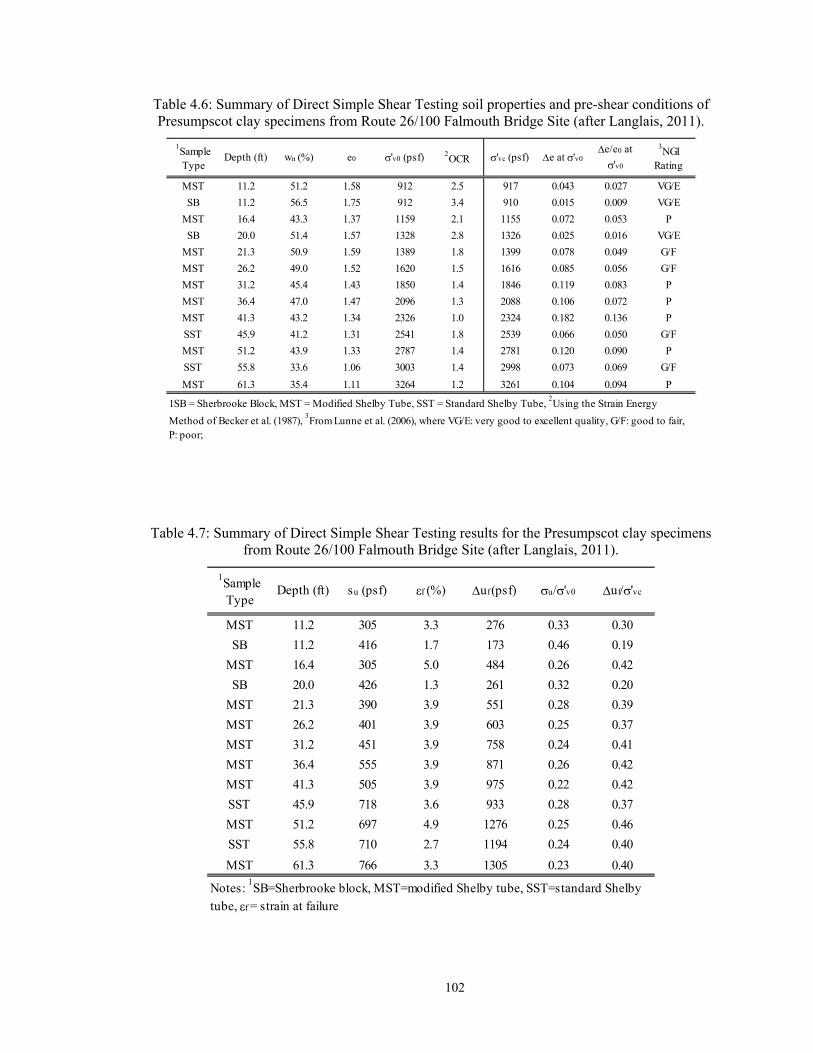
102
Table 4.6: Summary of Direct Simple Shear Testing soil properties and pre-shear conditions of Presumpscot clay specimens from Route 26/100 Falmouth Bridge Site (after Langlais, 2011).
Table 4.7: Summary of Direct Simple Shear Testing results for the Presumpscot clay specimens from Route 26/100 Falmouth Bridge Site (after Langlais, 2011).
MST 11.2 51.2 1.58 912 2.5 917 0.043 0.027 VG/E
SB 11.2 56.5 1.75 912 3.4 910 0.015 0.009 VG/E
MST 16.4 43.3 1.37 1159 2.1 1155 0.072 0.053 P
SB 20.0 51.4 1.57 1328 2.8 1326 0.025 0.016 VG/E
MST 21.3 50.9 1.59 1389 1.8 1399 0.078 0.049 G/F
MST 26.2 49.0 1.52 1620 1.5 1616 0.085 0.056 G/F
MST 31.2 45.4 1.43 1850 1.4 1846 0.119 0.083 P
MST 36.4 47.0 1.47 2096 1.3 2088 0.106 0.072 P
MST 41.3 43.2 1.34 2326 1.0 2324 0.182 0.136 P
SST 45.9 41.2 1.31 2541 1.8 2539 0.066 0.050 G/F
MST 51.2 43.9 1.33 2787 1.4 2781 0.120 0.090 P
SST 55.8 33.6 1.06 3003 1.4 2998 0.073 0.069 G/F
MST 61.3 35.4 1.11 3264 1.2 3261 0.104 0.094 P
wn (%) e0 'v0 (psf) 2OCR 'vc (psf) e at 'v0
e/e0 at
'v0
3NGI
Rating
1SB = Sherbrooke Block, MST = Modified Shelby Tube, SST = Standard Shelby Tube, 2Using the Strain Energy
Method of Becker et al. (1987), 3From Lunne et al. (2006), where VG/E: very good to excellent quality, G/F: good to fair,
P: poor;
1Sample Type
Depth (ft)
MST 11.2 305 3.3 276 0.33 0.30
SB 11.2 416 1.7 173 0.46 0.19
MST 16.4 305 5.0 484 0.26 0.42
SB 20.0 426 1.3 261 0.32 0.20
MST 21.3 390 3.9 551 0.28 0.39
MST 26.2 401 3.9 603 0.25 0.37
MST 31.2 451 3.9 758 0.24 0.41
MST 36.4 555 3.9 871 0.26 0.42
MST 41.3 505 3.9 975 0.22 0.42
SST 45.9 718 3.6 933 0.28 0.37
MST 51.2 697 4.9 1276 0.25 0.46
SST 55.8 710 2.7 1194 0.24 0.40
MST 61.3 766 3.3 1305 0.23 0.40
uf (psf) u/'v0 uf/'vc
Notes: 1SB=Sherbrooke block, MST=modified Shelby tube, SST=standard Shelby
tube, f = strain at failure
1Sample Type
Depth (ft) su (psf) f (%)
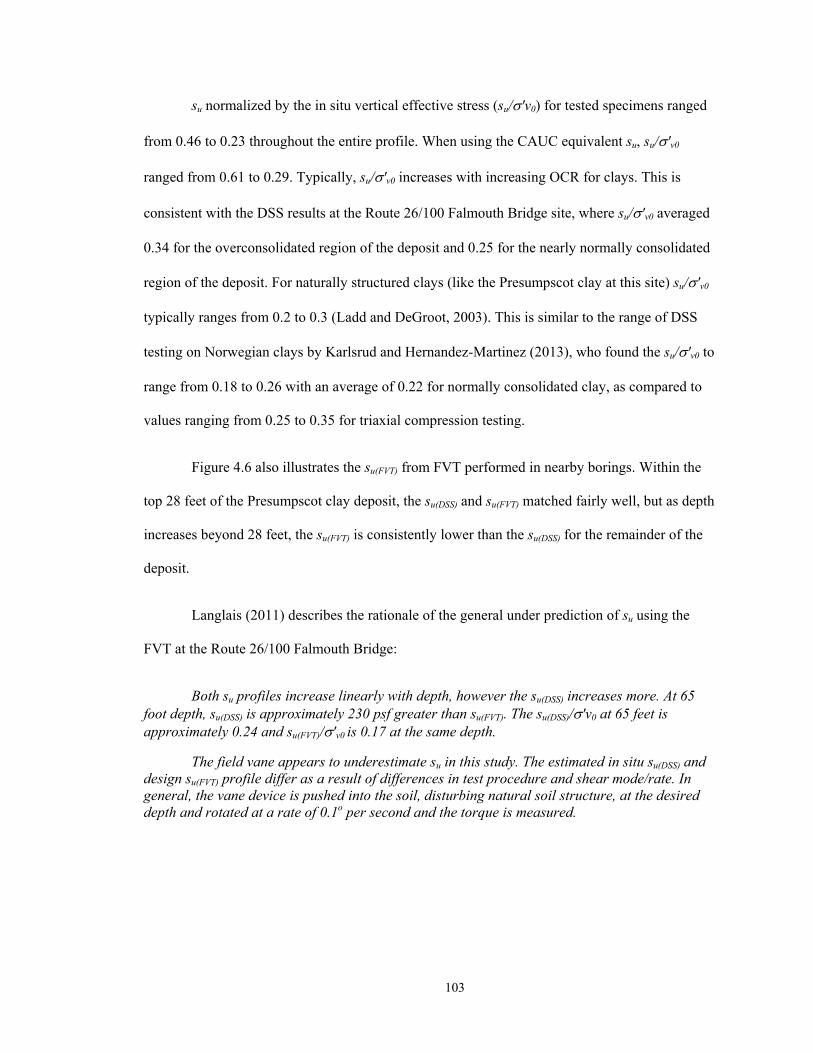
103
su normalized by the in situ vertical effective stress (su/'v0) for tested specimens ranged
from 0.46 to 0.23 throughout the entire profile. When using the CAUC equivalent su, su/'v0
ranged from 0.61 to 0.29. Typically, su/'v0 increases with increasing OCR for clays. This is
consistent with the DSS results at the Route 26/100 Falmouth Bridge site, where su/'v0 averaged
0.34 for the overconsolidated region of the deposit and 0.25 for the nearly normally consolidated
region of the deposit. For naturally structured clays (like the Presumpscot clay at this site) su/'v0
typically ranges from 0.2 to 0.3 (Ladd and DeGroot, 2003). This is similar to the range of DSS
testing on Norwegian clays by Karlsrud and Hernandez-Martinez (2013), who found the su/'v0 to
range from 0.18 to 0.26 with an average of 0.22 for normally consolidated clay, as compared to
values ranging from 0.25 to 0.35 for triaxial compression testing.
Figure 4.6 also illustrates the su(FVT) from FVT performed in nearby borings. Within the
top 28 feet of the Presumpscot clay deposit, the su(DSS) and su(FVT) matched fairly well, but as depth
increases beyond 28 feet, the su(FVT) is consistently lower than the su(DSS) for the remainder of the
deposit.
Langlais (2011) describes the rationale of the general under prediction of su using the
FVT at the Route 26/100 Falmouth Bridge:
Both su profiles increase linearly with depth, however the su(DSS) increases more. At 65 foot depth, su(DSS) is approximately 230 psf greater than su(FVT). The su(DSS)/'v0 at 65 feet is approximately 0.24 and su(FVT)/'v0 is 0.17 at the same depth.
The field vane appears to underestimate su in this study. The estimated in situ su(DSS) and design su(FVT) profile differ as a result of differences in test procedure and shear mode/rate. In general, the vane device is pushed into the soil, disturbing natural soil structure, at the desired depth and rotated at a rate of 0.1o per second and the torque is measured.
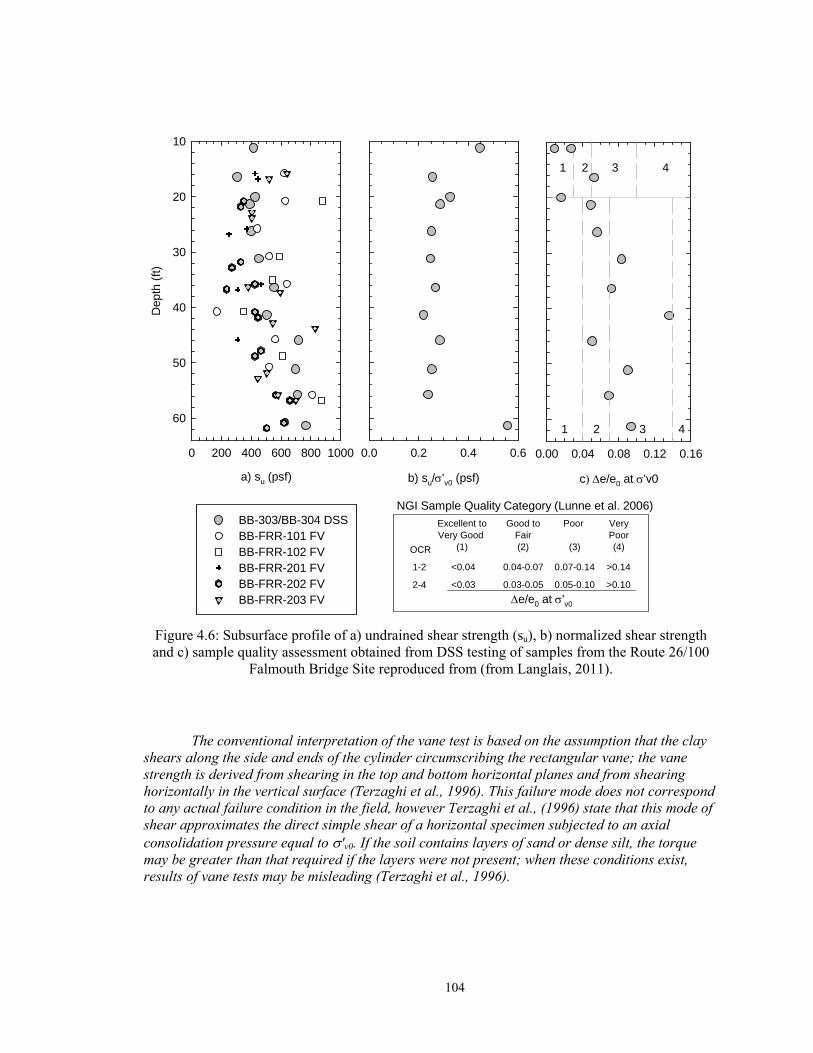
104
Figure 4.6: Subsurface profile of a) undrained shear strength (su), b) normalized shear strength and c) sample quality assessment obtained from DSS testing of samples from the Route 26/100
Falmouth Bridge Site reproduced from (from Langlais, 2011).
The conventional interpretation of the vane test is based on the assumption that the clay shears along the side and ends of the cylinder circumscribing the rectangular vane; the vane strength is derived from shearing in the top and bottom horizontal planes and from shearing horizontally in the vertical surface (Terzaghi et al., 1996). This failure mode does not correspond to any actual failure condition in the field, however Terzaghi et al., (1996) state that this mode of shear approximates the direct simple shear of a horizontal specimen subjected to an axial consolidation pressure equal to 'v0. If the soil contains layers of sand or dense silt, the torque may be greater than that required if the layers were not present; when these conditions exist, results of vane tests may be misleading (Terzaghi et al., 1996).
a) su (psf)
0 200 400 600 800 1000
Dep
th (
ft)
10
20
30
40
50
60
BB-303/BB-304 DSSBB-FRR-101 FV BB-FRR-102 FV BB-FRR-201 FV BB-FRR-202 FV BB-FRR-203 FV
b) su/'v0 (psf)
0.0 0.2 0.4 0.6
ce/e0 at 'v0
0.00 0.04 0.08 0.12 0.16
NGI Sample Quality Category (Lunne et al. 2006)
Excellent toVery Good
(1)
Poor
(3)OCR
1-2
2-4
<0.04 0.04-0.07 0.07-0.14 >0.14
<0.03 0.03-0.05 0.05-0.10 >0.10
e/e0 at 'v0
Good toFair(2)
VeryPoor(4)
1 2 3 4
1 2 3 4

105
4.2.4 SHANSEP Direct Simple Shear Analysis
Ladd and Foott (1974) empirically observed that the su of clay is directly related to the
stress history of the clay (i.e. OCR). They developed the Stress History and Normalized Soil
Engineering Parameter (SHANSEP) relationship which estimates su/'v0 at a selected OCR using
su/'v0 at normal consolidation (OCR = 1) and an empirical constant, both of which are constant
for any specific deposit (Equation 2.1). su/'v0 at normal consolidation is labeled as “S” and the
empirical constant is labeled as “m.” These two parameters were determined from the DSS
testing of Presumpscot clay at the Route 26/100 Falmouth Bridge.
SHANSEP testing is conducted using on specimens brought to a specific OCR after
compression into the normally consolidated zone. This method requires two or more tested
samples, and results in su/'v0 at normal consolidation (S) and su/'v0 at other defined OCRs. A
best-fit line can be fit through the data to provide the m coefficient.
A different analyses was used for the DSS results of the Presumpscot clay from Route
26/100 Falmouth Bridge using su/'v0 versus OCR, where OCR was determined from the
consolidation testing and S and the m from the best-fit line (Figure 4.7). The resulting relationship
for the Presumpscot clay collected from Route 26/100 Falmouth Bridge site is as follows:
su(OC) = 0.21∙OCR0.50 4.1
The resulting S (su/'v0 at OCR =1) is 0.21 and the resulting m is 0.50. Karlsrud and Hernandez-
Martinez (2013) provides a range of S values from 0.18 to 0.26, with an average of 0.22. The
range of values for m was 0.75 to 0.90 with an average of 0.80. This testing was conducted on
Norwegian marine clay. The S value matches well with Karlsrud and Hernandez-Martinez (2013)
results; however, the m is much lower for the Presumpscot clay than the Norwegian clay. If the su
106
is converted from DSS to CAUC strength using the conversion stated above, the resulting S and
m coefficients are 0.28 and 0.51, respectively.
Figure 4.7: Plot of normalized shear strength from recompression DSS tests vs. OCR for Presumpscot clay speciments collected from Route 26/100 Falmouth Bridge Site (from Langlais,
2011)
4.2.5 Summary and Interpretation of Laboratory Results
The Presumpscot clay at the north approach of the Route 26/100 Falmouth Bridge is soft,
sensitive, and structured. Analysis of the index, CRS, and DSS test results indicates a distinct
boundary within the deposit at a depth of 25 feet below ground surface, at which the deposit
transitions from a mildly overconsolidated, highly sensitive to highly quick flocculated structure
to a practically normally consolidated, mildly flocculated structure with moderate to high
sensitivity and lower void ratio. The surface water elevation of the Presumpscot river at the site is
approximately 18.3 feet (H&A, 2009), corresponding to a sample depth of approximately 30 feet.
Laboratory results in the upper portion of the deposit, which ranges from 4.3 feet to 25.0
feet, yielded higher sensitivity, moisture content, initial void ratio, OCR, clay content, plasticity,
107
organic content, recompression and compression indices, and su when compared to the bottom
portion of the deposit (25.0 feet to 63 feet). However, the differences in these properties between
the upper and lower portions of the deposit are not severe.
The following trends are apparent from the laboratory results of index, consolidation, and
shear strength testing of the Presumpscot clay samples tested from Route 26/100 Bridge:
A boundary was observed at 25 feet, above which the clay is more structured
(higher voids), and below which the influence of granular materials (e.g. silt and
sand) become more prominent with depth;
An overconsolidated crust lies above the soft clay which ranges from
approximately ground to surface to 4.0 feet;
Water content and void ratio decrease with depth. Water contents are generally at
or above the liquid limit (LI values range from 0.9 to 2.2); meaning that the clay
will act as a liquid, rather than a solid;
Silt content of the Presumpscot clay samples recovered below 25 feet increased
with depth. The increase of silt content with depth was accompanied by
reductions in void ratio, water content, organic content, and compression indices;
Sensitivity of the clay at the site ranged from 9 to greater than 100. The high
sensitivity causes the low remolded shear strength and the high virgin
compression index (Cc from the CRS testing was as high as 0.59);
Test results from Sherbrooke block sample specimens have sample quality that is
typically higher than tube samples, as shear strains are eliminated in this method
of sampling;
The deposit is mildly overconsolidated (OCR between 1.8 and 2.5) from 11.0
feet to 25.0 feet and nearly normally consolidated (OCR between 1.0 and 1.8)
from 25.0 to 62.0 feet.
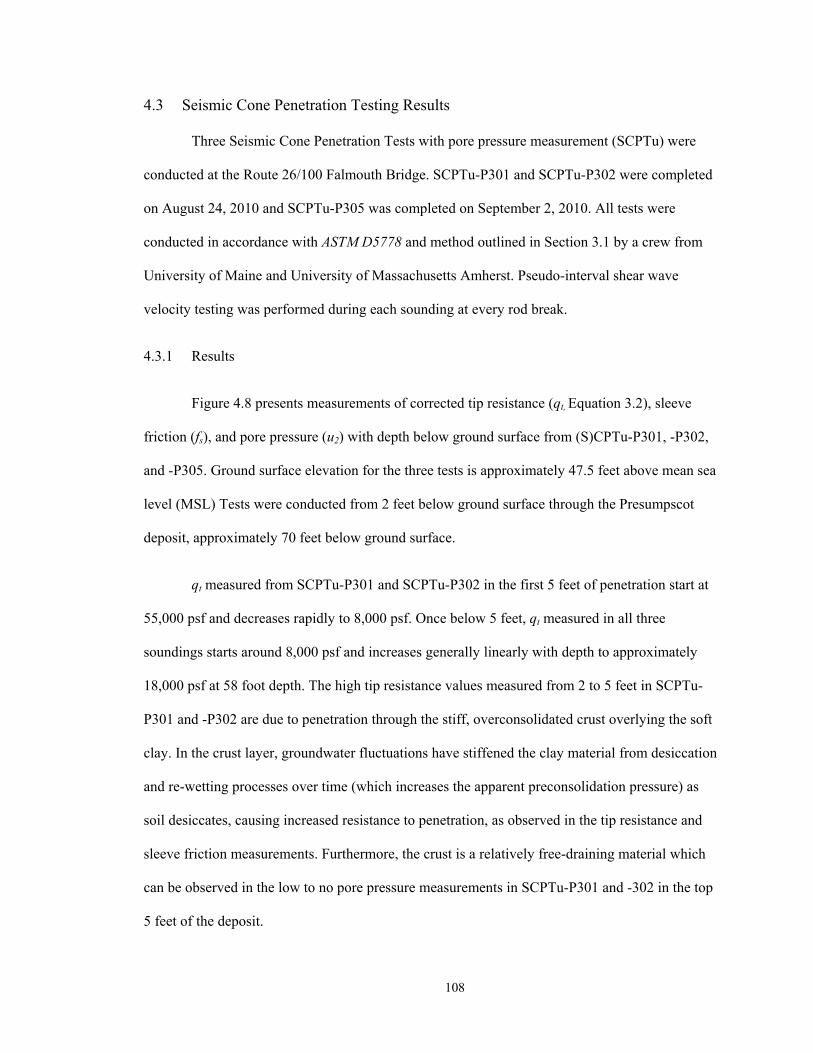
108
4.3 Seismic Cone Penetration Testing Results
Three Seismic Cone Penetration Tests with pore pressure measurement (SCPTu) were
conducted at the Route 26/100 Falmouth Bridge. SCPTu-P301 and SCPTu-P302 were completed
on August 24, 2010 and SCPTu-P305 was completed on September 2, 2010. All tests were
conducted in accordance with ASTM D5778 and method outlined in Section 3.1 by a crew from
University of Maine and University of Massachusetts Amherst. Pseudo-interval shear wave
velocity testing was performed during each sounding at every rod break.
4.3.1 Results
Figure 4.8 presents measurements of corrected tip resistance (qt, Equation 3.2), sleeve
friction (fs), and pore pressure (u2) with depth below ground surface from (S)CPTu-P301, -P302,
and -P305. Ground surface elevation for the three tests is approximately 47.5 feet above mean sea
level (MSL) Tests were conducted from 2 feet below ground surface through the Presumpscot
deposit, approximately 70 feet below ground surface.
qt measured from SCPTu-P301 and SCPTu-P302 in the first 5 feet of penetration start at
55,000 psf and decreases rapidly to 8,000 psf. Once below 5 feet, qt measured in all three
soundings starts around 8,000 psf and increases generally linearly with depth to approximately
18,000 psf at 58 foot depth. The high tip resistance values measured from 2 to 5 feet in SCPTu-
P301 and -P302 are due to penetration through the stiff, overconsolidated crust overlying the soft
clay. In the crust layer, groundwater fluctuations have stiffened the clay material from desiccation
and re-wetting processes over time (which increases the apparent preconsolidation pressure) as
soil desiccates, causing increased resistance to penetration, as observed in the tip resistance and
sleeve friction measurements. Furthermore, the crust is a relatively free-draining material which
can be observed in the low to no pore pressure measurements in SCPTu-P301 and -302 in the top
5 feet of the deposit.
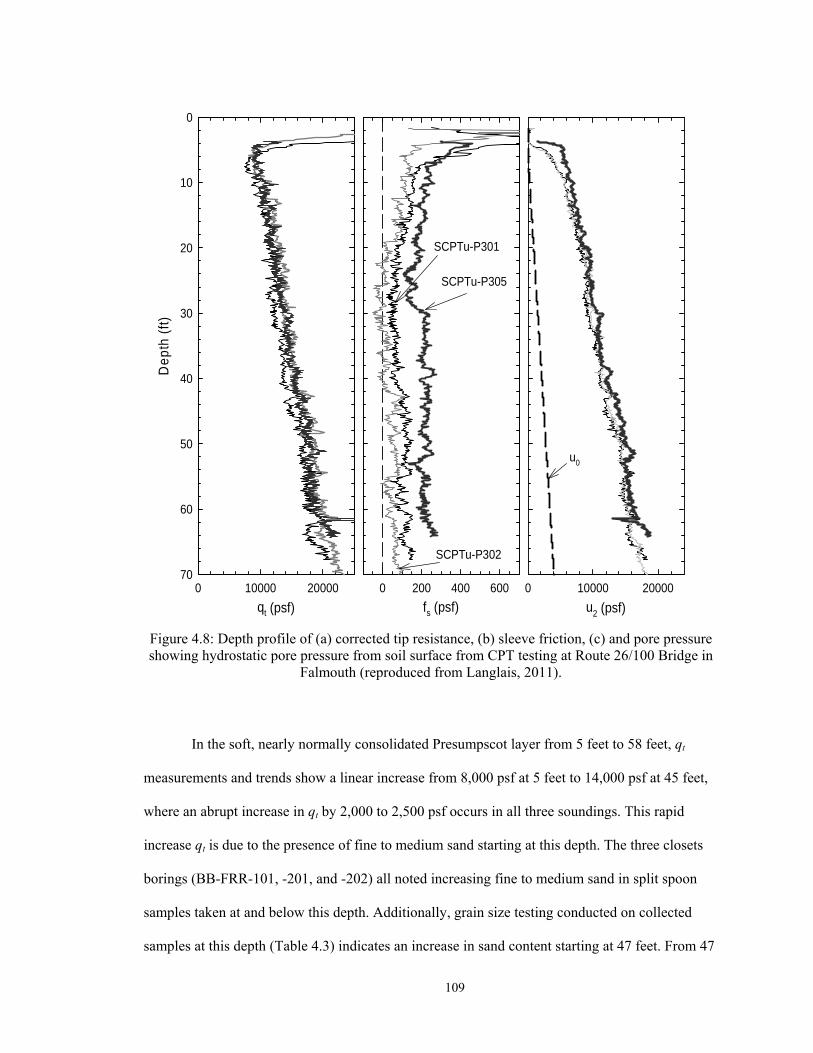
109
Figure 4.8: Depth profile of (a) corrected tip resistance, (b) sleeve friction, (c) and pore pressure showing hydrostatic pore pressure from soil surface from CPT testing at Route 26/100 Bridge in
Falmouth (reproduced from Langlais, 2011).
In the soft, nearly normally consolidated Presumpscot layer from 5 feet to 58 feet, qt
measurements and trends show a linear increase from 8,000 psf at 5 feet to 14,000 psf at 45 feet,
where an abrupt increase in qt by 2,000 to 2,500 psf occurs in all three soundings. This rapid
increase qt is due to the presence of fine to medium sand starting at this depth. The three closets
borings (BB-FRR-101, -201, and -202) all noted increasing fine to medium sand in split spoon
samples taken at and below this depth. Additionally, grain size testing conducted on collected
samples at this depth (Table 4.3) indicates an increase in sand content starting at 47 feet. From 47
fs (psf)0 200 400 600
u2 (psf)
0 10000 20000
u0
qt (psf)
0 10000 20000
Dep
th (
ft)
0
10
20
30
40
50
60
70
SCPTu-P301
SCPTu-P305
SCPTu-P302

110
feet to the bottom each sounding, qt increases consistently, with some increasing and decreasing
fluctuations from small silt and sand seams (also observed in the split spoon samples collected).
Measurements of fs in the Presumpscot clay ranged from -20 psf to 229 psf. fs values
measured from SCPTu-P301 and P302 decrease linearly from 200 psf to 0 psf from 5 feet to 20
feet depth, remain at 0 psf to 43 feet, where fs abruptly increases to and remains around 60 psf for
the remainder of penetration. SCPTu-P305 illustrated a different trend of measured values from
SCPTu-P301 and P305. fs measured from SCPTu-P305 decreased linearly from 200 psf to 100 psf
from 5 feet to 20 feet depth. Once at 20 feet, fs abruptly increases to approximately 200 psf and
remains at this value until the end of penetration. Difference in measured fs between SCPTuP305
and the other two soundings may be due to zero readings shifts on the load cell or other
environmental effects. SCPTu-P301 and P302 were conducted on August 24 and SCPTu-P305
was conducted on September 2.
Mayne (2014) hypothesizes that measured fs is analogous to remolded undrained shear
strength (su(r)) of clay. This is consistent with the assumption of complete shearing of penetrated
clay occurring at the tip. Once this penetrated clay is sheared, it passes by the sleeve of the cone
as penetration continues and the measured resistance (fs) would indicate the remolded shear
strength at the natural water content since shearing is undrained. However, su(r) measurements can
change dependent on the method of testing (i.e. field vane shear test (FVT) versus the fall cone
apparatus) and the level of remolding. To determine the accuracy of using fs to predict su(r), the fs
measured from SCPTu-P301 and SCPTu-P305 were compared to su(r) estimated from FVT and
fall cone apparatus testing (Figure 4.9). SCPTu-P302 was not included because it is practically
identical to SCPTu-P301.
111
Figure 4.9: Profile comparing remolded shear strength values (su(r)) obtained from nearby field vane test results and fall cone tests with sleeve friction from SCPTu-P301 and –P305(data from
Langlais 2011).
In general, fs values from SCPTu-P301 matched closest with the su(r) estimated from FVT.
In most cases the fs values were a little higher than the su(r), but for a few FVT conducted between
20 feet and 43 feet depth the su(r) resulted in a lower value than the fs. All su(r) measurements from
the fall cone apparatus gave values lower than the measured fs from both SCPTu-P301 and P305,
except for the deepest sample at 56 feet which fell above fs from SCPTu-P301 and remained
lower than fs from SCPTu-P305. Throughout the entire profile fs values from SCPTu-P305 were
fs (psf)
0 100 200 300 400
De
pth
(ft)
0
10
20
30
40
50
60
fs SCPTu-P301 fs SCPTu-P305Su(r) Fall Cone
Su(r) Field Vane
112
larger (in most cases more than double) than the su(r) from both the fall cone apparatus and FVT
results.
Karlsrud and Hernandez-Martinez (2013) states that the su(r) from FVT will generally be
higher than the su(r) from fall cone apparatus. They state that the two reasons for this are the
inability of the FVT to accurately read low su(r) as well as the effect of rod friction increasing the
measured su(r) . It is also likely that specimens remolded in the laboratory for fall cone testing are
“truly” remolded, where only partial remolding may be taking place during the FVT and CPTu
process. It appears that fs measured from CPTu soundings for Presumpscot clay at Route 26/100
Falmouth Bridge match closer with FVT results.
Measurements of u2 in the Presumpscot clay range from 3,000 psf to 15,000 psf,
increasing nearly linearly with depth. The slope of u2 is shallower than the hydrostatic water
pressure line, which indicates that these two pressures are independent. u2 measured in the crust is
either negative in magnitude or zero. This is consistent with the theory of negative pore pressures
which develop in overconsolidated clays subject to shearing.
4.3.2 Correlations to Classification
Empirical charts have been proposed by Robertson (1990), Schneider et al. (2008), and
Robertson (2009) to classify soils based on CPTu measurements (Section 2.3). These charts plot
normalized tip resistance (Qt) versus normalized sleeve friction (Fr) or normalized pore pressure
(Bq) and the resulting data fall into a region which has a corresponding soil type deemed the “Soil
Behavior Type” or SBT. The SBT regions were developed based on observed Qt, Fr, and Bq
measurements taken in specific types of soils. Normalized CPTu parameters are used to eliminate
the influence of depth increase in soil properties due to overburden stress on measurements.
Figure 4.10 displays the profiles of the three normalized parameters Qt, Fr, and Bq collected from
SCPTu-P301, P302, and P305.

113
Figure 4.10: Profile of a) normalized tip resistance (Qt), b) sleeve friction ratio (Fr), and c) normalized pore pressure ratio (Bq) with depth for SCPTu-P301, P302, and P305 at Route 26/100
Falmouth Bridge (data from Langlais, 2011).
Each of the four classification charts were evaluated for their correlation to the
Presumpscot clay classification at the Route 26/100 Falmouth Bridge. To do this, samples from
each of the undisturbed Shelby tube or Sherbrooke blocks were classified using laboratory results
of grain size analyses and plasticity in accordance with the Unified Soil Classification System
(USCS). In general, samples classified as CL “Lean Clay,” which is typical for Presumpscot clay.
Additionally, values of Qt, Fr, and Bq collected from SCPTu-P301 and P305 from depths
corresponding to the tested samples were plotted. SCPTu-P302 was not used because it is
Qt = qnet/'v0
0 2 4 6 8 10
Dep
th b
elow
mud
line
(ft)
0
20
40
60
SCPTu 301SCPTu 302SCPTu 305
Fr = fs/qnet
-1 0 1 2 3
Bq = u/qnet
0.0 0.4 0.8 1.2
a) b) c)
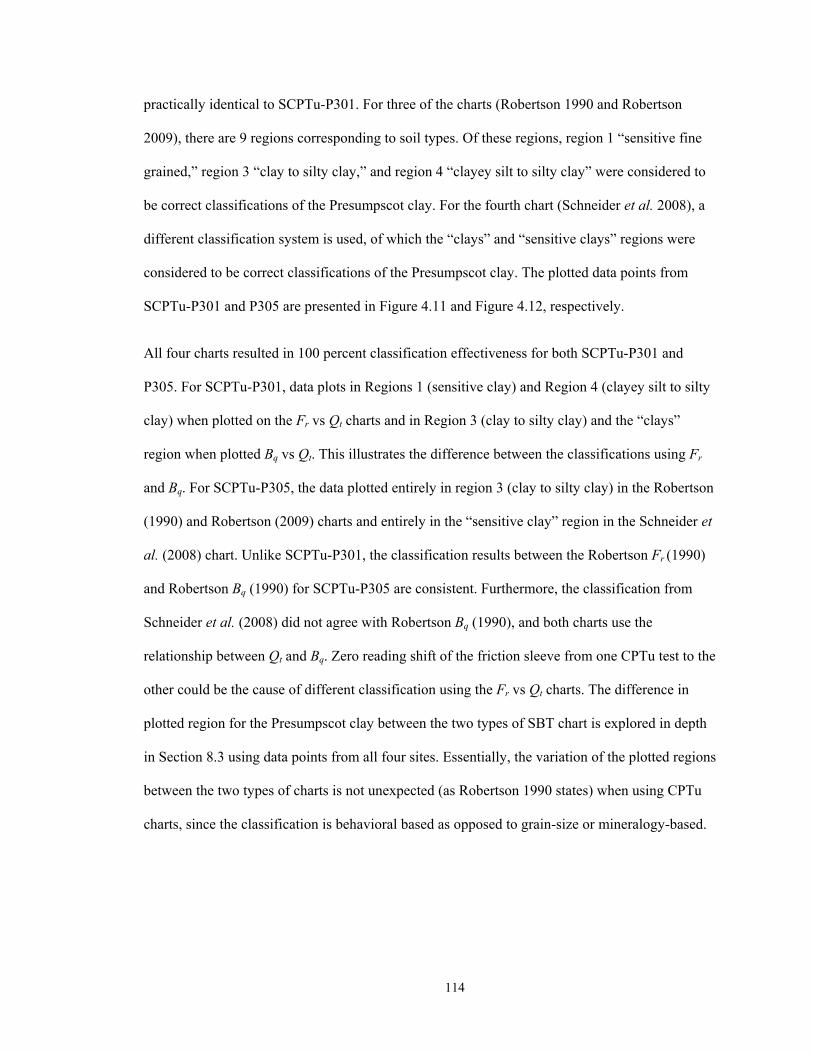
114
practically identical to SCPTu-P301. For three of the charts (Robertson 1990 and Robertson
2009), there are 9 regions corresponding to soil types. Of these regions, region 1 “sensitive fine
grained,” region 3 “clay to silty clay,” and region 4 “clayey silt to silty clay” were considered to
be correct classifications of the Presumpscot clay. For the fourth chart (Schneider et al. 2008), a
different classification system is used, of which the “clays” and “sensitive clays” regions were
considered to be correct classifications of the Presumpscot clay. The plotted data points from
SCPTu-P301 and P305 are presented in Figure 4.11 and Figure 4.12, respectively.
All four charts resulted in 100 percent classification effectiveness for both SCPTu-P301 and
P305. For SCPTu-P301, data plots in Regions 1 (sensitive clay) and Region 4 (clayey silt to silty
clay) when plotted on the Fr vs Qt charts and in Region 3 (clay to silty clay) and the “clays”
region when plotted Bq vs Qt. This illustrates the difference between the classifications using Fr
and Bq. For SCPTu-P305, the data plotted entirely in region 3 (clay to silty clay) in the Robertson
(1990) and Robertson (2009) charts and entirely in the “sensitive clay” region in the Schneider et
al. (2008) chart. Unlike SCPTu-P301, the classification results between the Robertson Fr (1990)
and Robertson Bq (1990) for SCPTu-P305 are consistent. Furthermore, the classification from
Schneider et al. (2008) did not agree with Robertson Bq (1990), and both charts use the
relationship between Qt and Bq. Zero reading shift of the friction sleeve from one CPTu test to the
other could be the cause of different classification using the Fr vs Qt charts. The difference in
plotted region for the Presumpscot clay between the two types of SBT chart is explored in depth
in Section 8.3 using data points from all four sites. Essentially, the variation of the plotted regions
between the two types of charts is not unexpected (as Robertson 1990 states) when using CPTu
charts, since the classification is behavioral based as opposed to grain-size or mineralogy-based.
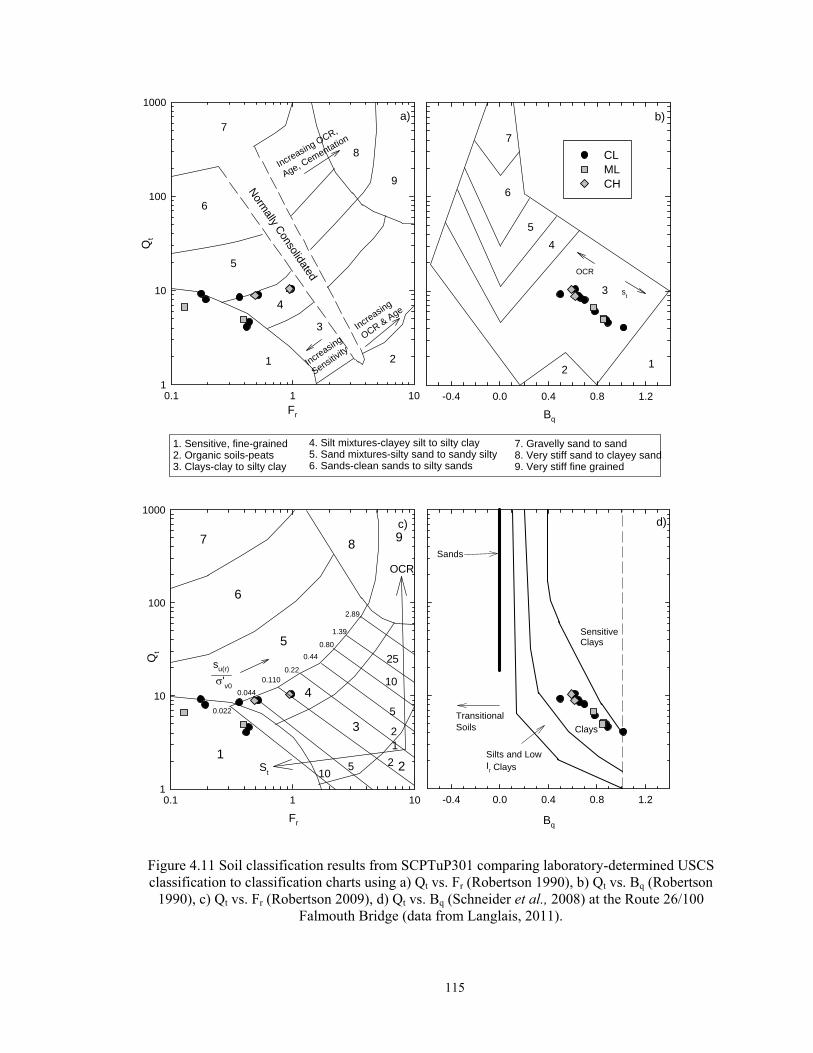
115
Figure 4.11 Soil classification results from SCPTuP301 comparing laboratory-determined USCS classification to classification charts using a) Qt vs. Fr (Robertson 1990), b) Qt vs. Bq (Robertson
1990), c) Qt vs. Fr (Robertson 2009), d) Qt vs. Bq (Schneider et al., 2008) at the Route 26/100 Falmouth Bridge (data from Langlais, 2011).
0.22
1. Sensitive, fine-grained 2. Organic soils-peats 3. Clays-clay to silty clay
4. Silt mixtures-clayey silt to silty clay5. Sand mixtures-silty sand to sandy silty6. Sands-clean sands to silty sands
7. Gravelly sand to sand8. Very stiff sand to clayey sand9. Very stiff fine grained
Bq
-0.4 0.0 0.4 0.8 1.2
7
6
5
4
3
2 1
OCR
st
b)
1
3
4
5
6
7
8
9
2
Norm
ally Consolidated
Increasing
Sensitivit
y
Increasing
OCR & Age
Increasing OCR,
Age, Cementation
a)
Fr
0.1 1 10
Qt
1
10
100
1000
CL MLCH
Fr
0.1 1 10
Qt
1
10
100
1000
7
6
5
89
4
3
21
St
OCR
0.022
0.044
0.44
0.80
2.89
0.110
1.39
su(r)
'v0
105 2
2
5
10
25
1
Bq
-0.4 0.0 0.4 0.8 1.2
Sands
TransitionalSoils
Silts and LowIr Clays
Clays
Sensitive Clays
d)c)
4
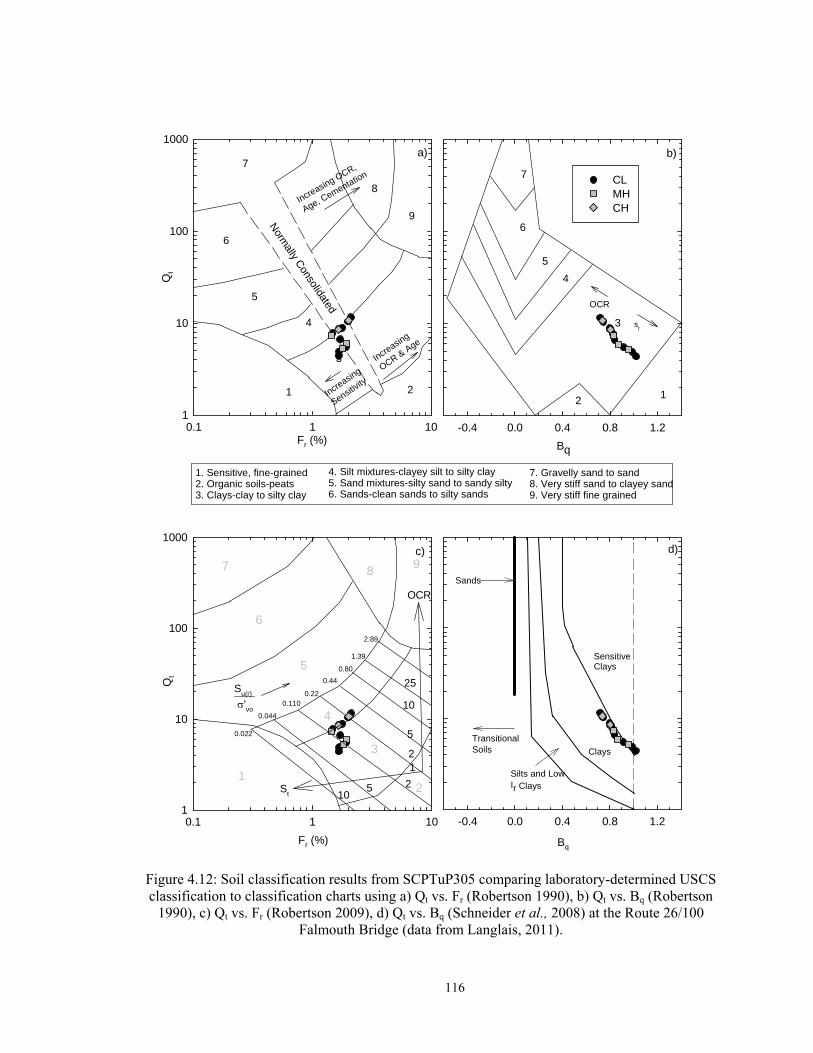
116
Figure 4.12: Soil classification results from SCPTuP305 comparing laboratory-determined USCS classification to classification charts using a) Qt vs. Fr (Robertson 1990), b) Qt vs. Bq (Robertson
1990), c) Qt vs. Fr (Robertson 2009), d) Qt vs. Bq (Schneider et al., 2008) at the Route 26/100 Falmouth Bridge (data from Langlais, 2011).
0.22
1. Sensitive, fine-grained 2. Organic soils-peats 3. Clays-clay to silty clay
4. Silt mixtures-clayey silt to silty clay5. Sand mixtures-silty sand to sandy silty6. Sands-clean sands to silty sands
7. Gravelly sand to sand8. Very stiff sand to clayey sand9. Very stiff fine grained
Bq
-0.4 0.0 0.4 0.8 1.2
7
6
5
4
3
2 1
OCR
st
b)
1
3
4
5
6
7
8
9
2
Norm
ally Consolidated
Increasing
Sensitivit
y
Increasing
OCR & Age
Increasing OCR,
Age, Cementation
a)
Fr (%)0.1 1 10
Qt
1
10
100
1000
CL MHCH
Fr (%)
0.1 1 10
Qt
1
10
100
1000
7
6
5
89
4
3
21
St
OCR
0.022
0.044
0.44
0.80
2.89
0.110
1.39
Su(r)
'vo
105 2
2
5
10
25
1
Bq
-0.4 0.0 0.4 0.8 1.2
Sands
TransitionalSoils
Silts and LowIr Clays
Clays
Sensitive Clays
d)c)

117
When CPTu data is collected in a clay deposit and plotted on the SBT charts, one might
expect the classification based on sleeve friction (i.e. Fr vs Qt) to not be entirely consistent with
the pore pressure classification (i.e. Bq vs Qt), which is the pattern observed at the Route 26/100
Bridge.
The Presumpscot clay at the Route 26/100 Falmouth Bridge site is sensitive clay,
apparent from the FVT and fall cone testing (Table 4.4). It is classified as sensitive clay using
Robertson Fr (1990) Robertson (2009) charts for SCPTu-P301 and using Schneider et al. (2008)
chart for SCPTu-P305. Fr values were lower (corresponding to a low remolded undrained shear
strength and hence a sensitive clay) for SCPTu-P301 and Bq values were higher (corresponding to
a higher pore pressure at shear failure hence a sensitive clay) for SCPTu-P305.
4.3.3 Correlations to Stress History
Stress history of the Presumpscot clay was estimated from the CPTu soundings
conducted at the Route 26/100 Falmouth Bridge site using the k-value method. Using Equation
2.7, k-value was back-calculated using preconsolidation pressure (’p) determined from constant
rate of strain (CRS) consolidation testing (Table 4.5) and qnet measured from the CPTu soundings
(Section 4.3.1) at the corresponding sample depths. ’p was estimated from CRS testing using the
Becker et al., (1987) method and in situ vertical effective stress (’v0) was estimated using unit
weights from the tested CRS specimens. Figure 4.13 presents the k-values determined for the
Presumpscot clay at the Route 26/100 Falmouth Bridge site along with the estimated ’p profile
using determined k-values applied to SCPTu-P301 (the closest sounding to the collected
samples).
In Figure 4.13a, each symbol represent a k-value back calculated from one of the CPTu
soundings. Each “set” of symbols (i.e. the multiple symbols shown at one specific depth)
correspond to a single ’p , with a qnet value taken from one of the CPTu soundings and applied to
118
that ’p to solve for k. The range of values between the symbols represents the difference in qnet
from the soundings. The soundings were conducted within approximately 20 feet of each other;
however, SCPTu-P301 was closest to the samples collected for the consolidation testing. The
dotted lines at values of 0.20 and 0.50 represent the “typical” range of values for clays (Lunne et
al., 1997). In Figure 4.13b, the average, minimum, and maximum k-values from SCPTu-P301
were applied to the entire profile of qnet from SCPTu-P301 and compared to the laboratory-
determined ’p.
k-values ranged from 0.20 to 0.43, which agrees with the published range from Lunne et
al. (1997) of 0.20 to 0.50. Between 10 feet and 42 feet depth, k-values are generally consistent
around 0.25 except for values deeper than 20 feet, which are approximately 0.40. This increase at
20 feet is due to the higher ’p value estimated at that depth. Sample quality of that specimen was
“very good to excellent,” so the higher ’p is unlikely to be from sample disturbance. Index
testing results from that depth do not indicate a significant change in composition, however,
sensitivity is significantly higher than the surrounding samples. Furthermore, the virgin
compression index (Cc) is highest for this sample of all of the tested samples (0.59), which is
indicative of greater structure and stiffness (DeGroot and Ladd, 2010).
Below 43 feet, there is a sustained increase in the k-value, which is directly due to greater
’p (refer to Figure 4.5). The k-value from SCPTu-P301 below 43 feet ranges from 0.35 to 0.43.
Typically, sample quality decreases with depth due to removal of larger amounts of overburden
stress during sampling, i.e. stress relief, often leading to lower estimates of ’p due to
destructuration. However, at the Route 26/100 Bride site, sample quality remained good with
depth and data from deeper depths are considered reliable. Samples collected and tested within
the middle depths of the profile (from 20 feet to 43 feet) were of slightly lower quality and
provided lower ’p estimates due to sample disturbance and subsequently caused k-values to be
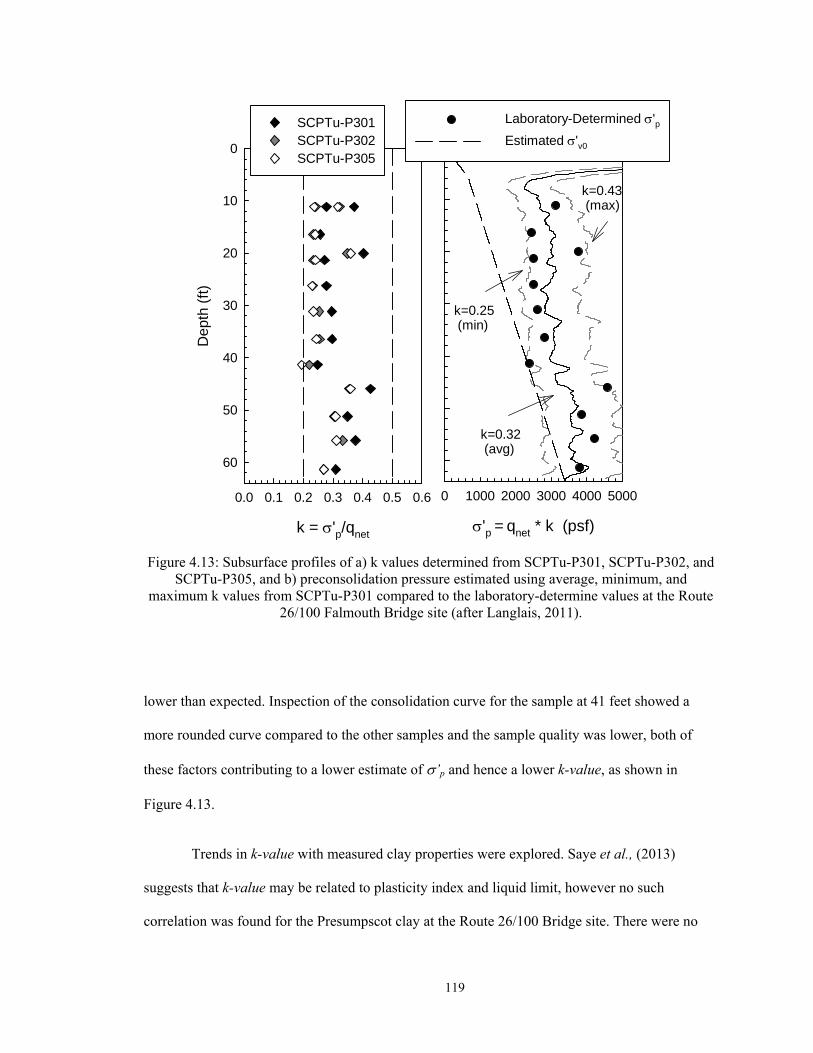
119
Figure 4.13: Subsurface profiles of a) k values determined from SCPTu-P301, SCPTu-P302, and SCPTu-P305, and b) preconsolidation pressure estimated using average, minimum, and
maximum k values from SCPTu-P301 compared to the laboratory-determine values at the Route 26/100 Falmouth Bridge site (after Langlais, 2011).
lower than expected. Inspection of the consolidation curve for the sample at 41 feet showed a
more rounded curve compared to the other samples and the sample quality was lower, both of
these factors contributing to a lower estimate of ’p and hence a lower k-value, as shown in
Figure 4.13.
Trends in k-value with measured clay properties were explored. Saye et al., (2013)
suggests that k-value may be related to plasticity index and liquid limit, however no such
correlation was found for the Presumpscot clay at the Route 26/100 Bridge site. There were no
k = 'p/qnet
0.0 0.1 0.2 0.3 0.4 0.5 0.6
Dep
th (
ft)
0
10
20
30
40
50
60
SCPTu-P301SCPTu-P302SCPTu-P305
'p = qnet * k (psf)
0 1000 2000 3000 4000 5000
Laboratory-Determined 'pEstimated 'v0
k=0.25 (min)
k=0.32 (avg)
k=0.43 (max)

120
apparent trends between k-value and plasticity, clay content, sand content, sensitivity, or any
other investigated property. This is analyzed further in Section 8.4.
4.3.4 Correlation to Undrained Shear Strength
Undrained shear strength (su) of clays can be estimated from CPTu results using
empirical cone factors Nkt, Nke, and Nu (Equations 2.9 through 2.11). Nkt is derived from tip
resistance (qt), Nke is derived from qt and pore pressure measurements (u2), and Nu is derived
from u2. These empirical coefficients were determined for the Presumpscot clay at the Route
26/100 Falmouth Bridge using su from laboratory direct simple shear (DSS) testing and field vane
shear testing (FVT) results conducted within a lateral distance of 200 feet of the CPTu soundings.
This 200 feet distance was chosen as an arbitrary limiting distance.
Throughout this section, the empirical cone factors will have a subscript of either or DSS,
FVT, indicating the reference undrained shear strength used to determine that cone factor. It is
important to note the reference su, because the su is not a distinct soil property, rather a
measurement dependent on many factors including rate of shear, anisotropy, and deviator stress
angle. The resulting su will differ when using the different test methods.
Figure 4.14 displays Nkt(DSS), Nke(DSS), and Nu(DSS) with depth calculated using each of the
three CPTu soundings. In Figure 4.14, each symbol represents one empirical cone factor back
calculated from one of the CPTu soundings. Each “set” of symbols (i.e. multiple symbols shown
at one specific depth) correspond to a single su(DSS) with a qt or u2 (or both for Nke(DSS)) value taken
from one of the CPTu soundings and applied to that su(DSS)to solve for the cone factor. The
soundings were conducted within close proximity of each other; however, SCPTu-P301 was
closest to the samples collected for the DSS testing. Note that the empirical cone factors are
inversely proportional to su, so that a higher cone factor predicts a lower su. Table 4.8 summarizes
the Nkt(DSS) and Nu(DSS) determined from the three CPTu soundings at the site.
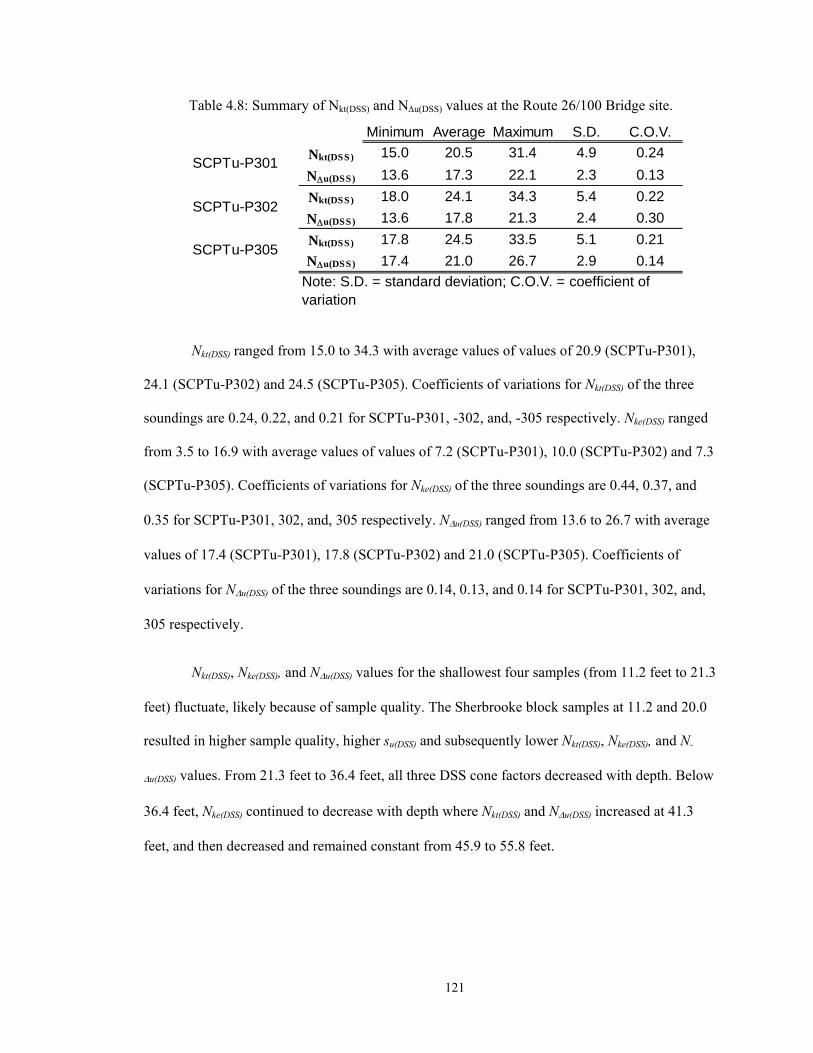
121
Table 4.8: Summary of Nkt(DSS) and Nu(DSS) values at the Route 26/100 Bridge site.
Nkt(DSS) ranged from 15.0 to 34.3 with average values of values of 20.9 (SCPTu-P301),
24.1 (SCPTu-P302) and 24.5 (SCPTu-P305). Coefficients of variations for Nkt(DSS) of the three
soundings are 0.24, 0.22, and 0.21 for SCPTu-P301, -302, and, -305 respectively. Nke(DSS) ranged
from 3.5 to 16.9 with average values of values of 7.2 (SCPTu-P301), 10.0 (SCPTu-P302) and 7.3
(SCPTu-P305). Coefficients of variations for Nke(DSS) of the three soundings are 0.44, 0.37, and
0.35 for SCPTu-P301, 302, and, 305 respectively. Nu(DSS) ranged from 13.6 to 26.7 with average
values of 17.4 (SCPTu-P301), 17.8 (SCPTu-P302) and 21.0 (SCPTu-P305). Coefficients of
variations for Nu(DSS) of the three soundings are 0.14, 0.13, and 0.14 for SCPTu-P301, 302, and,
305 respectively.
Nkt(DSS), Nke(DSS), and Nu(DSS) values for the shallowest four samples (from 11.2 feet to 21.3
feet) fluctuate, likely because of sample quality. The Sherbrooke block samples at 11.2 and 20.0
resulted in higher sample quality, higher su(DSS) and subsequently lower Nkt(DSS), Nke(DSS), and N-
u(DSS) values. From 21.3 feet to 36.4 feet, all three DSS cone factors decreased with depth. Below
36.4 feet, Nke(DSS) continued to decrease with depth where Nkt(DSS) and Nu(DSS) increased at 41.3
feet, and then decreased and remained constant from 45.9 to 55.8 feet.
Minimum Average Maximum S.D. C.O.V.
Nkt(DSS) 15.0 20.5 31.4 4.9 0.24
Nu(DSS) 13.6 17.3 22.1 2.3 0.13
Nkt(DSS) 18.0 24.1 34.3 5.4 0.22
Nu(DSS) 13.6 17.8 21.3 2.4 0.30
Nkt(DSS) 17.8 24.5 33.5 5.1 0.21
Nu(DSS) 17.4 21.0 26.7 2.9 0.14
SCPTu-P301
SCPTu-P302
SCPTu-P305
Note: S.D. = standard deviation; C.O.V. = coefficient of variation
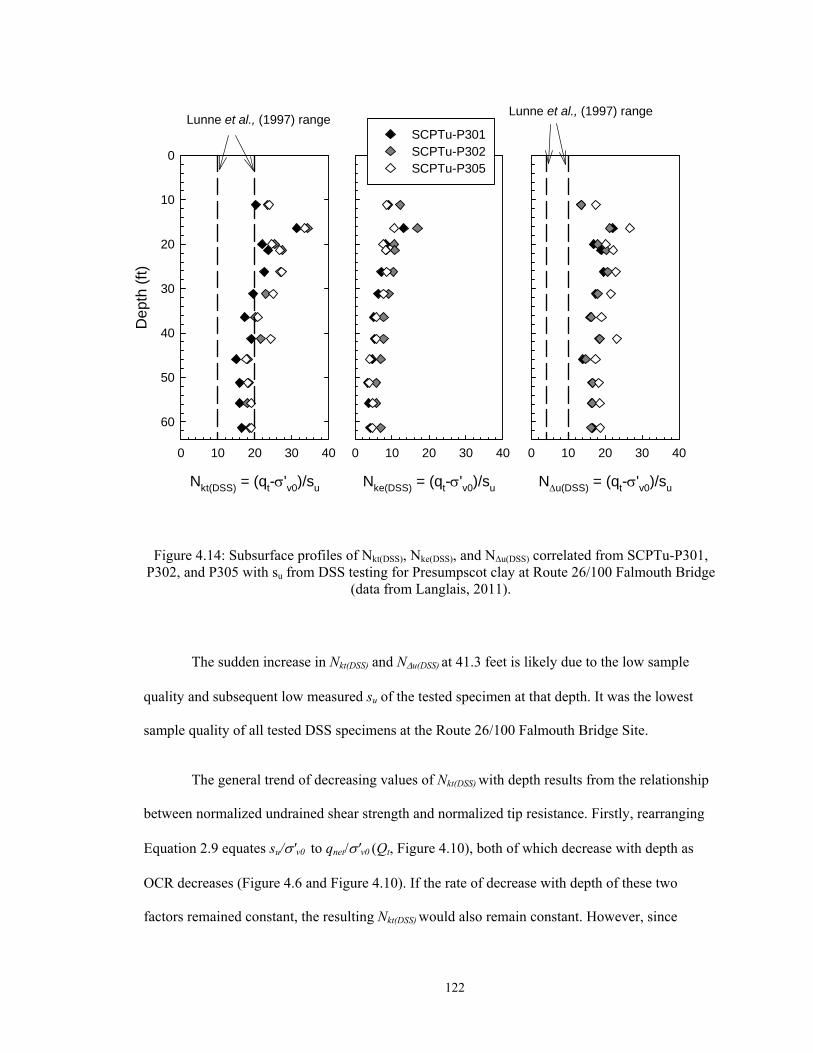
122
Figure 4.14: Subsurface profiles of Nkt(DSS), Nke(DSS), and Nu(DSS) correlated from SCPTu-P301, P302, and P305 with su from DSS testing for Presumpscot clay at Route 26/100 Falmouth Bridge
(data from Langlais, 2011).
The sudden increase in Nkt(DSS) and Nu(DSS) at 41.3 feet is likely due to the low sample
quality and subsequent low measured su of the tested specimen at that depth. It was the lowest
sample quality of all tested DSS specimens at the Route 26/100 Falmouth Bridge Site.
The general trend of decreasing values of Nkt(DSS) with depth results from the relationship
between normalized undrained shear strength and normalized tip resistance. Firstly, rearranging
Equation 2.9 equates su/'v0 to qnet/'v0 (Qt, Figure 4.10), both of which decrease with depth as
OCR decreases (Figure 4.6 and Figure 4.10). If the rate of decrease with depth of these two
factors remained constant, the resulting Nkt(DSS) would also remain constant. However, since
Nke(DSS) = (qt-'v0)/su
0 10 20 30 40
Nu(DSS) = (qt-'v0)/su
0 10 20 30 40
Nkt(DSS) = (qt-'v0)/su
0 10 20 30 40
De
pth
(ft
)0
10
20
30
40
50
60
SCPTu-P301SCPTu-P302SCPTu-P305
Lunne et al., (1997) rangeLunne et al., (1997) range
123
Nkt(DSS) decreases with depth, either the su/'v0 is disproportionally higher than the qnet/'v0, or vice
versa. Conclusively, the qnet/'v0 appears to decrease at a faster rate than the measured su/'v0. In
addition, Lunne et al., (1985) and Karlsrud (1996) suggest that Nkt(DSS) decreases with increasing
Bq, which is consistent with the results observed at the Route 26/100 Bridge since Bq increases
with depth.
Nu(DSS) remains relatively constant with depth, indicating the pore pressure measured
during the SCPTu soundings at the Route 26/100 Bridge provided a good estimation of su
behavior. Lunne et al., (1985) and Karlsrud (1996) suggest that Nu may increase slightly with
increasing Bq values (increasing depth), however their correlation is loose and the magnitude of
Bq at the Route 26/100 Bridge may not be severe enough to result in an Nu increase.
Cone factor Nke is an inconsistent method for determining su of clay (Lunne et al., 1997).
The factor is derived from the difference in measured tip resistance and pore pressure. In the
Presumpscot clay, the pore pressure measured during penetration can approach (and possibly
exceed) measured tip resistance, indicated by a high normalized pore pressure parameter Bq. The
resulting difference in measurements is small in magnitude, and in result, predicted su is sensitive
to small variations in this value. For instance, an increase in Nke from 10 to 11 might decrease the
predicted su by 200 psf where an increase in Nkt or Nu from 10 to 11 might decrease the predicted
su by 50 psf. In effect, the Nke factor has less “forgiveness” than the other two strength N factors.
Figure 4.15 illustrates su of the Presumpscot clay with depth at the Route 26/100
Falmouth Bridge site using Nkt and Nu cone factors applied to SCPTu-P301, which was
conducted closest to the undisturbed sampling.
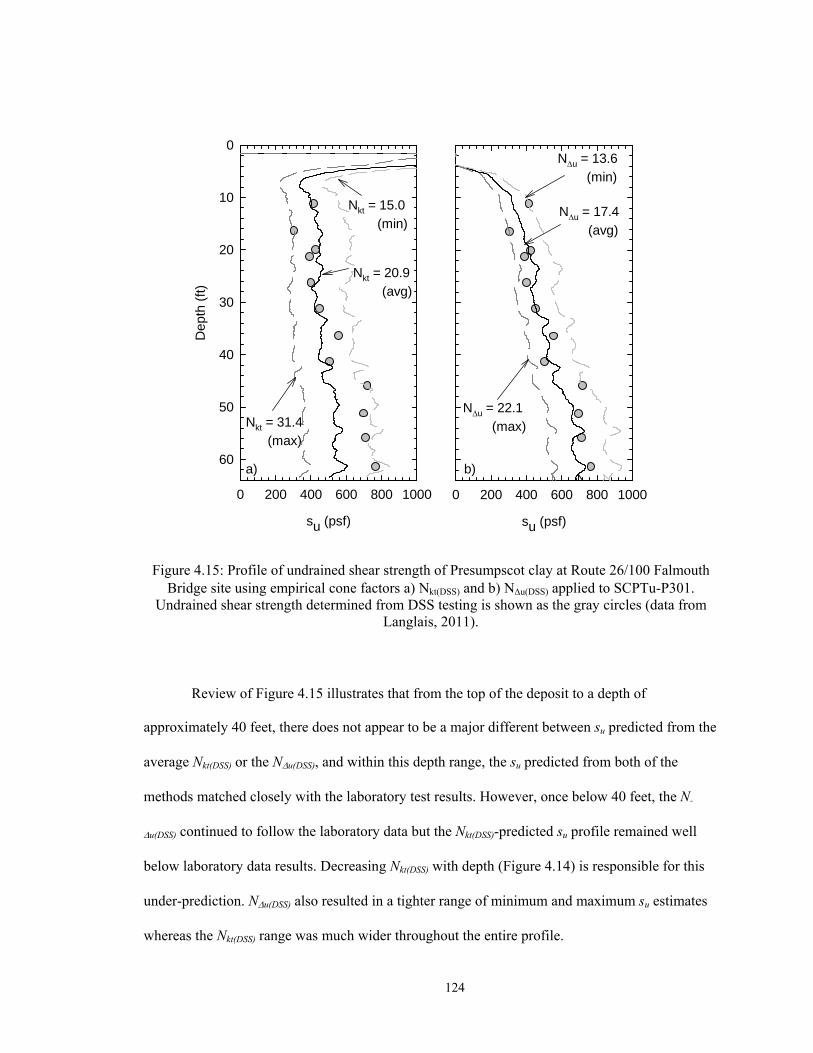
124
Figure 4.15: Profile of undrained shear strength of Presumpscot clay at Route 26/100 Falmouth Bridge site using empirical cone factors a) Nkt(DSS) and b) Nu(DSS) applied to SCPTu-P301.
Undrained shear strength determined from DSS testing is shown as the gray circles (data from Langlais, 2011).
Review of Figure 4.15 illustrates that from the top of the deposit to a depth of
approximately 40 feet, there does not appear to be a major different between su predicted from the
average Nkt(DSS) or the Nu(DSS), and within this depth range, the su predicted from both of the
methods matched closely with the laboratory test results. However, once below 40 feet, the N-
u(DSS) continued to follow the laboratory data but the Nkt(DSS)-predicted su profile remained well
below laboratory data results. Decreasing Nkt(DSS) with depth (Figure 4.14) is responsible for this
under-prediction. Nu(DSS) also resulted in a tighter range of minimum and maximum su estimates
whereas the Nkt(DSS) range was much wider throughout the entire profile.
su (psf)
0 200 400 600 800 1000
Dep
th (
ft)
0
10
20
30
40
50
60
Nkt = 15.0
(min)
Nkt = 31.4 (max)
Nkt = 20.9
(avg)
su (psf)
0 200 400 600 800 1000
Nu = 13.6
(min)
Nu = 17.4
(avg)
Nu = 22.1
(max)
a) b)
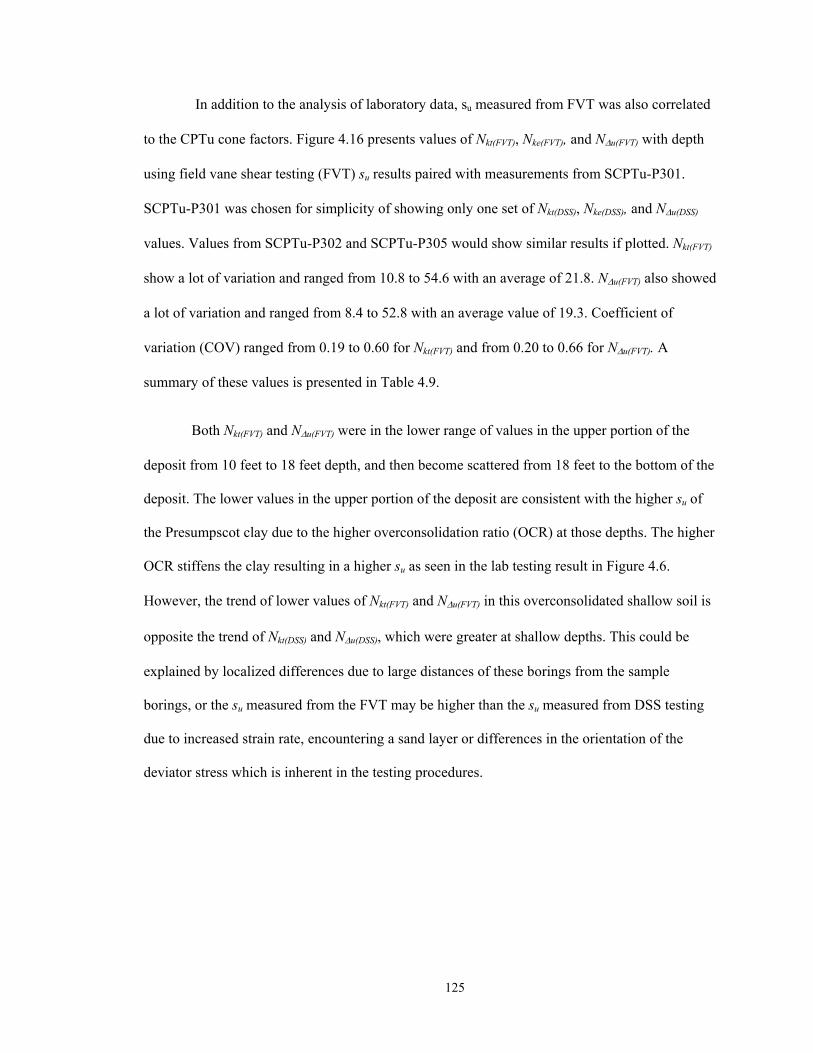
125
In addition to the analysis of laboratory data, su measured from FVT was also correlated
to the CPTu cone factors. Figure 4.16 presents values of Nkt(FVT), Nke(FVT), and Nu(FVT) with depth
using field vane shear testing (FVT) su results paired with measurements from SCPTu-P301.
SCPTu-P301 was chosen for simplicity of showing only one set of Nkt(DSS), Nke(DSS), and Nu(DSS)
values. Values from SCPTu-P302 and SCPTu-P305 would show similar results if plotted. Nkt(FVT)
show a lot of variation and ranged from 10.8 to 54.6 with an average of 21.8. Nu(FVT) also showed
a lot of variation and ranged from 8.4 to 52.8 with an average value of 19.3. Coefficient of
variation (COV) ranged from 0.19 to 0.60 for Nkt(FVT) and from 0.20 to 0.66 for Nu(FVT). A
summary of these values is presented in Table 4.9.
Both Nkt(FVT) and Nu(FVT) were in the lower range of values in the upper portion of the
deposit from 10 feet to 18 feet depth, and then become scattered from 18 feet to the bottom of the
deposit. The lower values in the upper portion of the deposit are consistent with the higher su of
the Presumpscot clay due to the higher overconsolidation ratio (OCR) at those depths. The higher
OCR stiffens the clay resulting in a higher su as seen in the lab testing result in Figure 4.6.
However, the trend of lower values of Nkt(FVT) and Nu(FVT) in this overconsolidated shallow soil is
opposite the trend of Nkt(DSS) and Nu(DSS), which were greater at shallow depths. This could be
explained by localized differences due to large distances of these borings from the sample
borings, or the su measured from the FVT may be higher than the su measured from DSS testing
due to increased strain rate, encountering a sand layer or differences in the orientation of the
deviator stress which is inherent in the testing procedures.
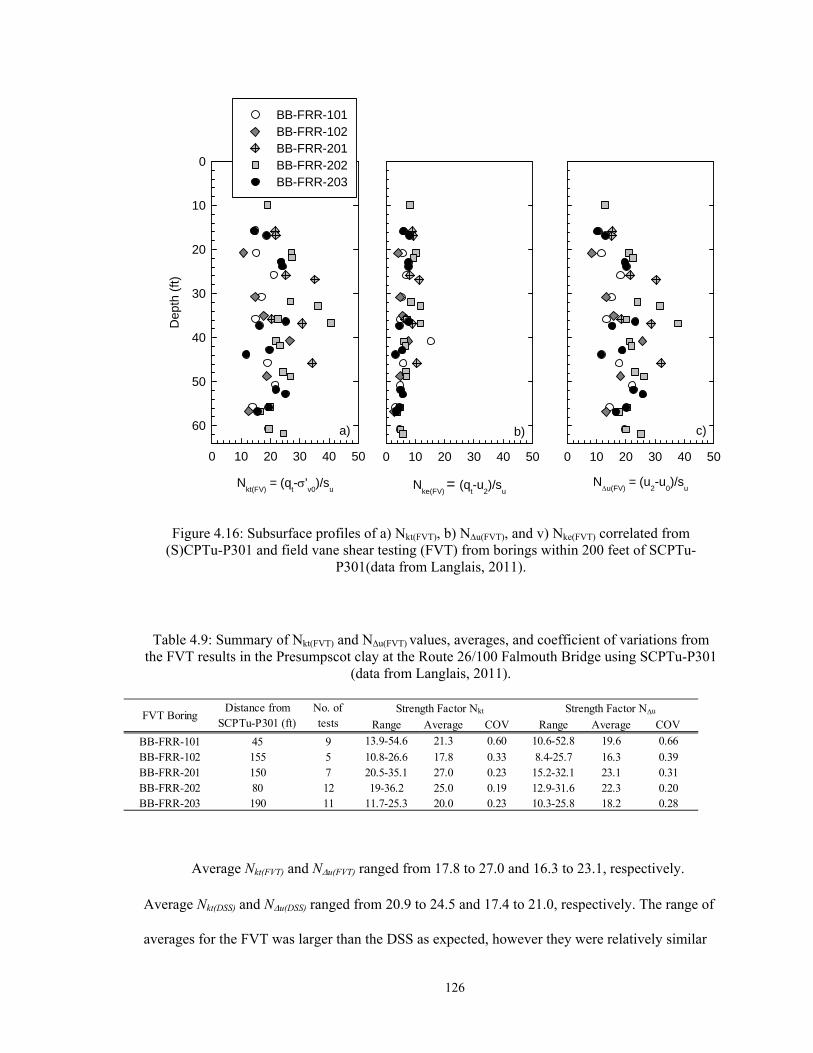
126
Figure 4.16: Subsurface profiles of a) Nkt(FVT), b) Nu(FVT), and v) Nke(FVT) correlated from (S)CPTu-P301 and field vane shear testing (FVT) from borings within 200 feet of SCPTu-
P301(data from Langlais, 2011).
Table 4.9: Summary of Nkt(FVT) and Nu(FVT) values, averages, and coefficient of variations from the FVT results in the Presumpscot clay at the Route 26/100 Falmouth Bridge using SCPTu-P301
(data from Langlais, 2011).
Average Nkt(FVT) and Nu(FVT) ranged from 17.8 to 27.0 and 16.3 to 23.1, respectively.
Average Nkt(DSS) and Nu(DSS) ranged from 20.9 to 24.5 and 17.4 to 21.0, respectively. The range of
averages for the FVT was larger than the DSS as expected, however they were relatively similar
Nkt(FV)
= (qt-'
v0)/s
u
0 10 20 30 40 50
Dep
th (
ft)
0
10
20
30
40
50
60
BB-FRR-101BB-FRR-102BB-FRR-201BB-FRR-202BB-FRR-203
Nke(FV)
= (qt-u
2)/s
u
0 10 20 30 40 50
Nu(FV)
= (u2-u
0)/s
u
0 10 20 30 40 50
a) b) c)
Range Average COV Range Average COV
BB-FRR-101 45 9 13.9-54.6 21.3 0.60 10.6-52.8 19.6 0.66
BB-FRR-102 155 5 10.8-26.6 17.8 0.33 8.4-25.7 16.3 0.39BB-FRR-201 150 7 20.5-35.1 27.0 0.23 15.2-32.1 23.1 0.31BB-FRR-202 80 12 19-36.2 25.0 0.19 12.9-31.6 22.3 0.20BB-FRR-203 190 11 11.7-25.3 20.0 0.23 10.3-25.8 18.2 0.28
Strength Factor NuFVT BoringDistance from
SCPTu-P301 (ft)No. of tests
Strength Factor Nkt

127
between testing methods. Furthermore, the maximum and minimum average Nkt(FVT) and Nu(FVT)
values came from borings which included no more than seven FVT conducted in that borings,
whereas the remaining borings which has increased number of FVT resulted in average values
closer to the DSS averages (Table 4.9).
Below 18 feet, neither Nkt(FVT) nor Nu(FVT) provided any overall trend with depth (i.e.,
increasing or decreasing). Taken together, correlated values are highly variable, however less
scatter occurs when isolating individual FVT borings. For both Nkt(FVT) and Nu(FVT), BB-FRR-201
and BB-FRR-202 are consistently in the upper range of values throughout the profile, where BB-
FRR-101 and BB-FRR-102 are consistently in the lower range, with BB-FRR-203 in the middle.
In summary, Nu(DSS) cone factor appeared to provide the best estimate of the su profile as
compared to the laboratory data at the Route 26/100 Bridge. In particular, an average value of
21.0 followed the su(DSS) closely throughout the entire profile when applied to SCPTu-P301.
Nkt(DSS) resulted in reasonable estimates of su from the surface of the deposit down to
approximately 40 feet, where after su was under predicted when using the average Nkt(FVT) of 24.5.
Scatter between minimum and maximum predicted su from Nkt(DSS) and Nu(DSS) values was larger
with Nkt(DSS). Nkt(FVT) and Nu(FVT) showed more scatter throughout the site than Nkt(DSS) and Nu(DSS)
values, however FVT borings which included greater number of FVT increased the similarity to
average Nkt(DSS) and Nu(DSS) values.
4.3.5 Seismic Properties
Shear wave velocity measurements were collected at 3.28 foot depth intervals for all
three CPTu soundings performed at Route 26/100 Falmouth Bridge. From these measurements,
small strain modulus and rigidity index can be obtained from Equations 2.17 and 2.18. Unit
weight in Equation 2.17 was assumed to be 109 pcf for all Presumpscot clay (an approximate
average from the laboratory testing results) and undrained shear strength (su) in Equation 2.18

128
was estimated using su estimated from a best-fit profile determined from DSS laboratory testing at
the depth that Vs was measured as shown in Langlais (2011). Shear wave velocity (Vs) was not
measured in the upper 45 feet of SCPTu-P305 due to malfunctioning data collection equipment.
The seismic properties are displayed with depth Figure 4.17.
Figure 4.17: a) Shear wave velocity (Vs), b) small-strain shear modulus (Go), and c) rigidity index (Ir) determined from SCPTu-P301, -P302, and –P305 conducted in Presumpscot clay at the Route
26/100 Falmouth Bridge (data from Langlais, 2011).
Measurements of Vs were consistent between SCPTu-P301 and P302 in the upper 38 feet
of the Presumpscot clay increasing linearly from 320 ft/s to 580 ft/s. Below 38 feet, Vs
measurements became more variable, without an apparent trend with depth. Between 38 feet and
G0 (ksi) = Vs
2 * t
0 10 20 30
Vs (ft/s)
0 250 500 750 1000
Dep
th (
ft)
0
20
40
60
SCPTu-P301SCPTu-P302SCPTu-P305a)
Ir = G0/su(DSS)
0 2000 4000 6000 8000
b) c)

129
60 feet, Vs from all three soundings ranged from 400 ft/s to 870 ft/s with one outlier of 1,200 ft/s
at a depth of 45 feet measured in SCPTu-P305 which was likely due to a silt or sand seam.
Go ranged from 3 to 8 ksi in the upper 38 feet of the deposit and ranged from 4 to 18 ksi
from 38 feet to 60 feet depth, excluding the outlier of 29 ksi at 45 feet. Ir ranged from 800 to
2,400 in the upper 38 feet of the deposit and ranged from 900 to 3,600 from 38 feet to 60 feet
depth, excluding the outlier of 7,400 at 45 feet.

130
5 MARTIN'S POINT BRIDGE
5.1 Site Overview
Martin's Point Bridge spans from the southern tip of Falmouth along Route 1 to Martin's
Point in Portland, Maine. It connects Route 1 over the outlet of the Presumpscot River into the
Portland Harbor. Figure 5.1 is an aerial imagine showing the location of the site.
Figure 5.1: Location of Martin's Point Bridge between Portland and Falmouth, Maine at the mouth of the Preusmpcot River and Casco Bay (Google Earth 2013a).
The previous Martin's Point Bridge structure (Figure 5.2) was constructed in 1943. The
bridge connects the city of Portland at its southern end to the Town of Falmouth at its northern
end over the Presumpscot River on U.S. Route 1.The old bridge superstructure consisted of a 47-
span painted steel girder system supported on timber pile bents extending to bedrock. The
southern (Portland) abutment was timber pile supported while the northern end (Falmouth) sat
atop bedrock. The substructure consisted entirely of timber piles. Both the superstructure and
substructure received a "Poor" rating by the 2010 Maine Department of Transportation
(MaineDOT) Bridge Maintenance Inspection Report (Maine DOT, 2010).
131
Figure 5.2: Martin's Point Bridge between Portland and Falmouth, Maine at the mouth of the Presumpscot River and Casco Bay during low tide (from MaineDOT 2013).
5.1.1 Previous Geotechnical Investigations
Three geotechnical investigations were conducted at the Martin's Point Bridge site for the
design of the replacement bridge. These included a preliminary geotechnical investigation in
2010 (MaineDOT, 2010), an additional preliminary geotechnical investigation conducted in 2011
(Golder Associates, 2011a), and a final supplemental geotechnical investigation in 2011 (Golder
Associates, 2011b). The results of all three investigations are summarized in Golder Associates
(2011b) Supplemental Geotechnical Data Report. The location of all pertinent borings, CPTu
soundings, and sampling locations from the geotechnical investigations are shown in Figure 5.3.
The preliminary geotechnical investigation included 11 test borings (BB-FPPR-101
through BB-FPPR-110) taken from the old bridge deck along US Route 1 that were spaced
approximately 250 ft apart. All borings were driven cased and wash drilled with solid stem auger
techniques. Standard Penetration Testing (SPT; ASTM D1586) was conducted at 5-ft intervals
using an automatic hammer calibrated within two months of testing. 2-in diameter split spoon
132
samples were collected and SPT N-values were recorded where applicable. In borings BB-FPPR-
105 through BB-FPPR-110, field vane shear testing (FVT) was performed at discrete intervals
throughout the Presumpscot clay to measure undrained shear strength (su) and remolded
undrained shear strength (su(r)) of the clay. FVT was performed at various intervals ranging in
depth spacing from 1 ft to greater than 10 ft.
A secondary geotechnical investigation was conducted east of the existing bridge along
the proposed new bridge alignment. (Golder Associates Inc., 2011a). Seven additional borings
(BB-FPPR-201 through -203 and BB-FPPR-205 through -208) were drilled in the tidal zone
using a skid rig on a spud barge. Boring BB-FPPR-204 was eliminated from the schedule due to
time constraints. Boring depths ranged from 60 ft to 134 ft below ground surface (bgs). Boring
BB-FPPR-201 and -203 were advanced with an HW steel casing using the drill and wash method
until refusal. The other five borings were started with HW casing driven 20 to 35 ft bgs and
completed with the open hole method. All drilling mud used for the borings had unit weights
between 75 and 85 pcf. Field vane shear tests were completed in accordance with ASTM D2573
using 55 x 100 mm and 65 x 130 mm vanes (specified in boring logs). Three inch diameter
undisturbed modified Shelby tube samples for laboratory testing were collected using a hydraulic
Gregory Undisturbed Sampler (GUS) in accordance with ASTM D6519.
The final supplemental geotechnical investigation including 15 borings (BB-FPPR-301
through BB-FPPR-316) was completed in 2011 (Golder Associates Inc., 2011b). In addition, a
sixteenth boring (BB-FPPR-317) was drilled to collect 3 inch diameter, modified Shelby tube
samples throughout the Presumpscot clay to test for this research. Three barge-mounted rigs were
used for over-water borings and a track-mounted rig was used for the land borings. Two of the
barges were spud barges with CME 45 drill rigs and the third was a jack-up barge with a Dietrich
D-50 drill rig. The track-mounted barge used a Mobile B-53 drill rig. Borings ranged in depth
from 13 to 145 ft bgs using wash boring methods. The borings were started with HW casing
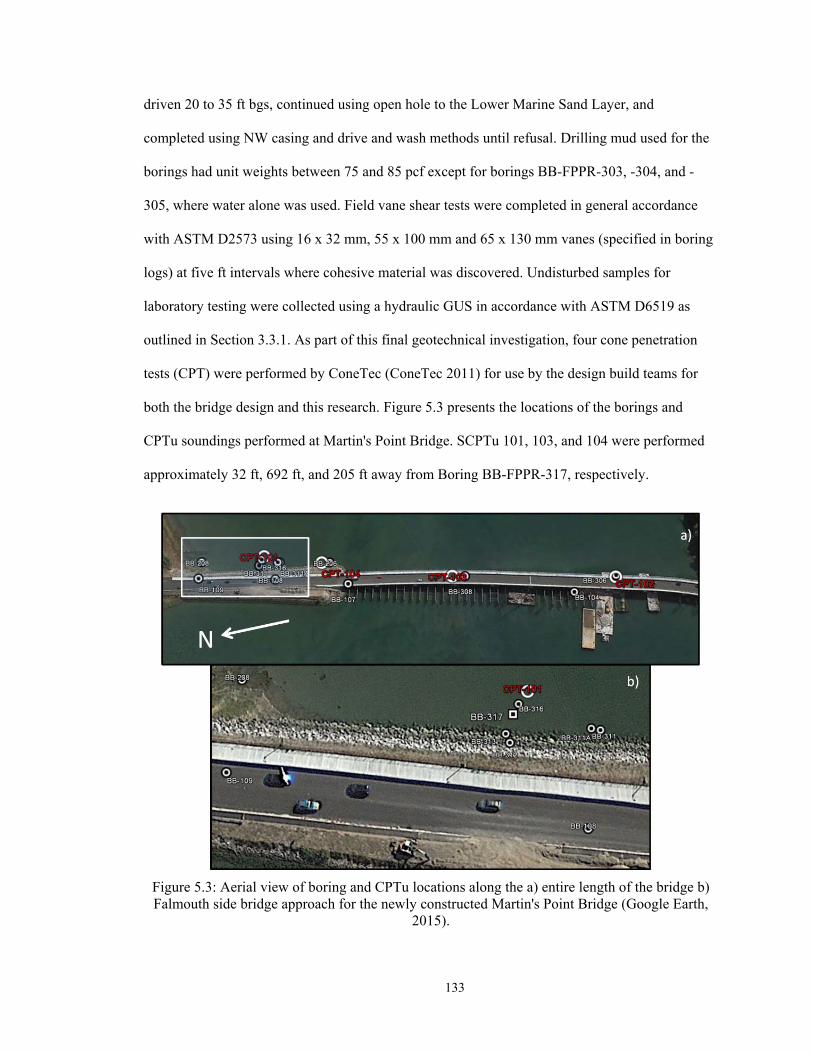
133
driven 20 to 35 ft bgs, continued using open hole to the Lower Marine Sand Layer, and
completed using NW casing and drive and wash methods until refusal. Drilling mud used for the
borings had unit weights between 75 and 85 pcf except for borings BB-FPPR-303, -304, and -
305, where water alone was used. Field vane shear tests were completed in general accordance
with ASTM D2573 using 16 x 32 mm, 55 x 100 mm and 65 x 130 mm vanes (specified in boring
logs) at five ft intervals where cohesive material was discovered. Undisturbed samples for
laboratory testing were collected using a hydraulic GUS in accordance with ASTM D6519 as
outlined in Section 3.3.1. As part of this final geotechnical investigation, four cone penetration
tests (CPT) were performed by ConeTec (ConeTec 2011) for use by the design build teams for
both the bridge design and this research. Figure 5.3 presents the locations of the borings and
CPTu soundings performed at Martin's Point Bridge. SCPTu 101, 103, and 104 were performed
approximately 32 ft, 692 ft, and 205 ft away from Boring BB-FPPR-317, respectively.
Figure 5.3: Aerial view of boring and CPTu locations along the a) entire length of the bridge b) Falmouth side bridge approach for the newly constructed Martin's Point Bridge (Google Earth,
2015).
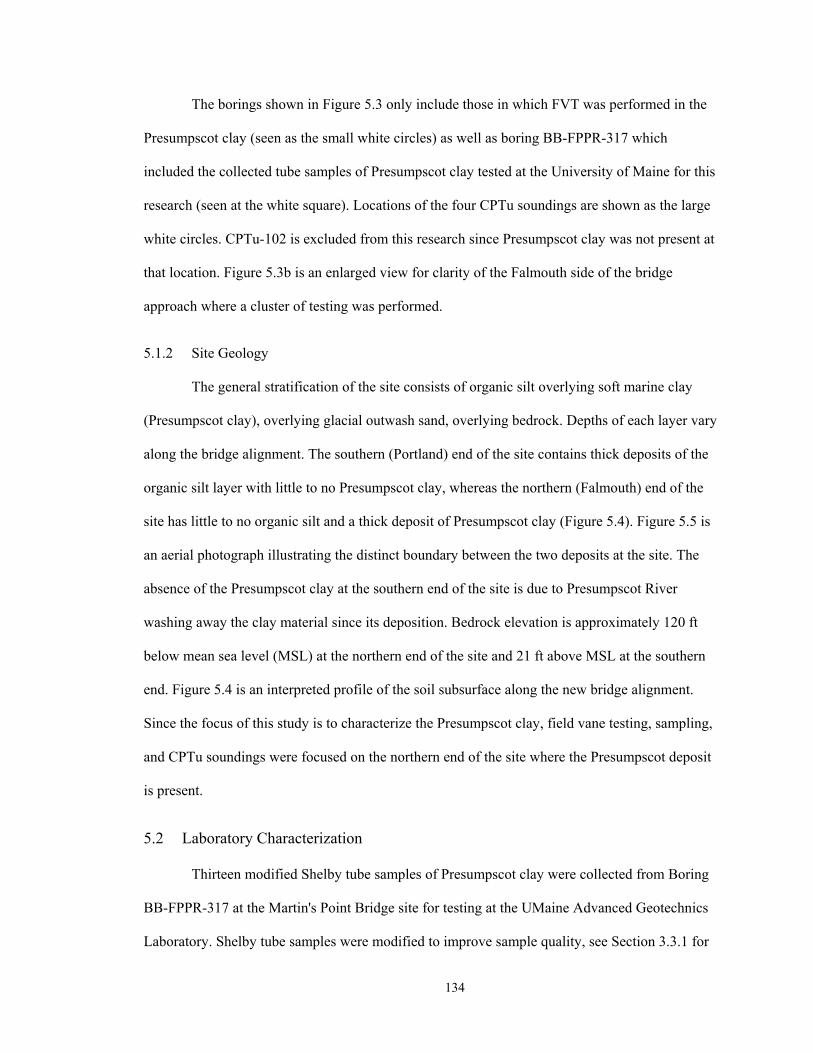
134
The borings shown in Figure 5.3 only include those in which FVT was performed in the
Presumpscot clay (seen as the small white circles) as well as boring BB-FPPR-317 which
included the collected tube samples of Presumpscot clay tested at the University of Maine for this
research (seen at the white square). Locations of the four CPTu soundings are shown as the large
white circles. CPTu-102 is excluded from this research since Presumpscot clay was not present at
that location. Figure 5.3b is an enlarged view for clarity of the Falmouth side of the bridge
approach where a cluster of testing was performed.
5.1.2 Site Geology
The general stratification of the site consists of organic silt overlying soft marine clay
(Presumpscot clay), overlying glacial outwash sand, overlying bedrock. Depths of each layer vary
along the bridge alignment. The southern (Portland) end of the site contains thick deposits of the
organic silt layer with little to no Presumpscot clay, whereas the northern (Falmouth) end of the
site has little to no organic silt and a thick deposit of Presumpscot clay (Figure 5.4). Figure 5.5 is
an aerial photograph illustrating the distinct boundary between the two deposits at the site. The
absence of the Presumpscot clay at the southern end of the site is due to Presumpscot River
washing away the clay material since its deposition. Bedrock elevation is approximately 120 ft
below mean sea level (MSL) at the northern end of the site and 21 ft above MSL at the southern
end. Figure 5.4 is an interpreted profile of the soil subsurface along the new bridge alignment.
Since the focus of this study is to characterize the Presumpscot clay, field vane testing, sampling,
and CPTu soundings were focused on the northern end of the site where the Presumpscot deposit
is present.
5.2 Laboratory Characterization
Thirteen modified Shelby tube samples of Presumpscot clay were collected from Boring
BB-FPPR-317 at the Martin's Point Bridge site for testing at the UMaine Advanced Geotechnics
Laboratory. Shelby tube samples were modified to improve sample quality, see Section 3.3.1 for
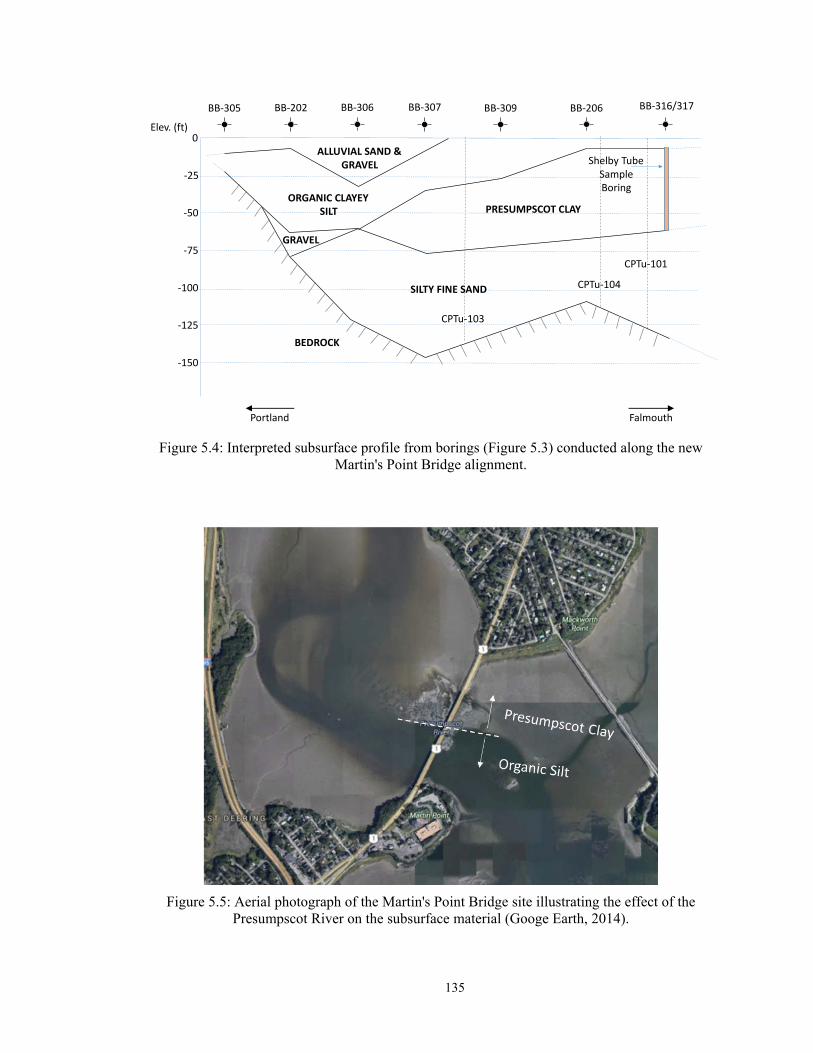
135
Figure 5.4: Interpreted subsurface profile from borings (Figure 5.3) conducted along the new Martin's Point Bridge alignment.
Figure 5.5: Aerial photograph of the Martin's Point Bridge site illustrating the effect of the Presumpscot River on the subsurface material (Googe Earth, 2014).
BB‐305 BB‐202 BB‐306 BB‐307 BB‐309 BB‐206 BB‐316/317
Elev. (ft)0
‐25
‐50
‐75
‐100
‐125
‐150
Portland Falmouth
BEDROCK
SILTY FINE SAND
GRAVEL
ORGANIC CLAYEYSILT
ALLUVIAL SAND &GRAVEL
PRESUMPSCOT CLAY
Shelby TubeSampleBoring
CPTu‐101
CPTu‐104
CPTu‐103
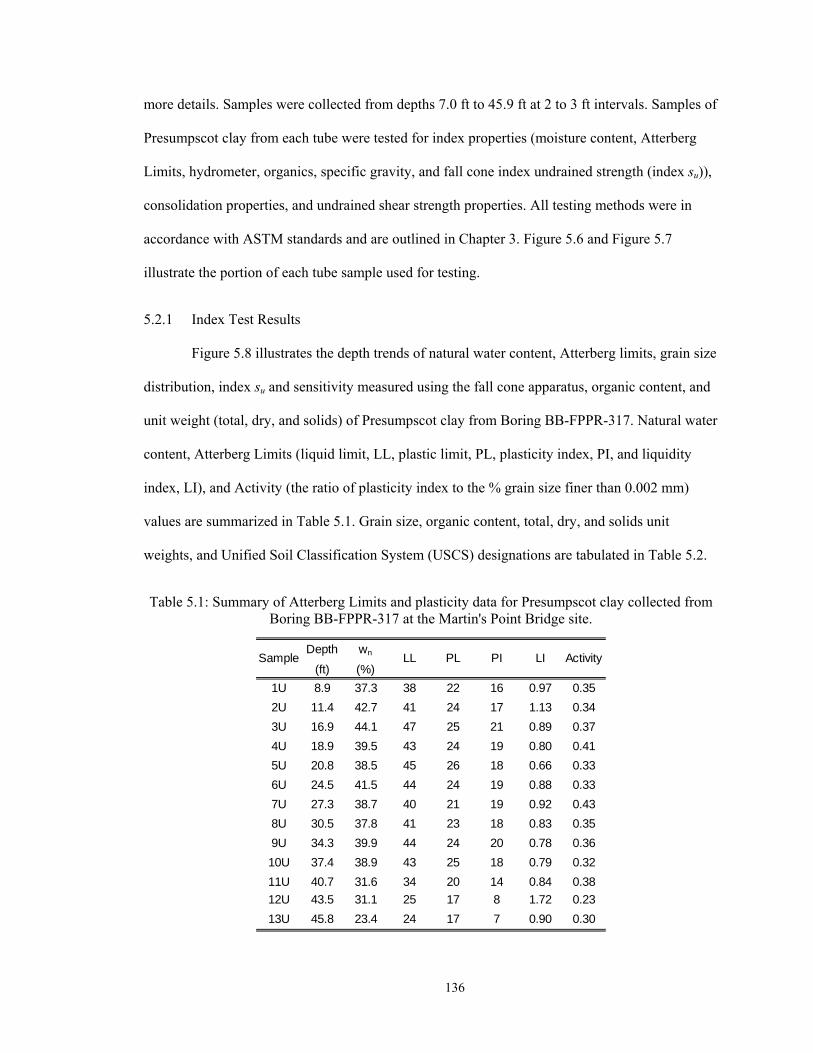
136
more details. Samples were collected from depths 7.0 ft to 45.9 ft at 2 to 3 ft intervals. Samples of
Presumpscot clay from each tube were tested for index properties (moisture content, Atterberg
Limits, hydrometer, organics, specific gravity, and fall cone index undrained strength (index su)),
consolidation properties, and undrained shear strength properties. All testing methods were in
accordance with ASTM standards and are outlined in Chapter 3. Figure 5.6 and Figure 5.7
illustrate the portion of each tube sample used for testing.
5.2.1 Index Test Results
Figure 5.8 illustrates the depth trends of natural water content, Atterberg limits, grain size
distribution, index su and sensitivity measured using the fall cone apparatus, organic content, and
unit weight (total, dry, and solids) of Presumpscot clay from Boring BB-FPPR-317. Natural water
content, Atterberg Limits (liquid limit, LL, plastic limit, PL, plasticity index, PI, and liquidity
index, LI), and Activity (the ratio of plasticity index to the % grain size finer than 0.002 mm)
values are summarized in Table 5.1. Grain size, organic content, total, dry, and solids unit
weights, and Unified Soil Classification System (USCS) designations are tabulated in Table 5.2.
Table 5.1: Summary of Atterberg Limits and plasticity data for Presumpscot clay collected from Boring BB-FPPR-317 at the Martin's Point Bridge site.
Depth wn
(ft) (%)
1U 8.9 37.3 38 22 16 0.97 0.35
2U 11.4 42.7 41 24 17 1.13 0.34
3U 16.9 44.1 47 25 21 0.89 0.37
4U 18.9 39.5 43 24 19 0.80 0.41
5U 20.8 38.5 45 26 18 0.66 0.33
6U 24.5 41.5 44 24 19 0.88 0.33
7U 27.3 38.7 40 21 19 0.92 0.43
8U 30.5 37.8 41 23 18 0.83 0.35
9U 34.3 39.9 44 24 20 0.78 0.36
10U 37.4 38.9 43 25 18 0.79 0.32
11U 40.7 31.6 34 20 14 0.84 0.38
12U 43.5 31.1 25 17 8 1.72 0.23
13U 45.8 23.4 24 17 7 0.90 0.30
Sample LL PL PI LI Activity
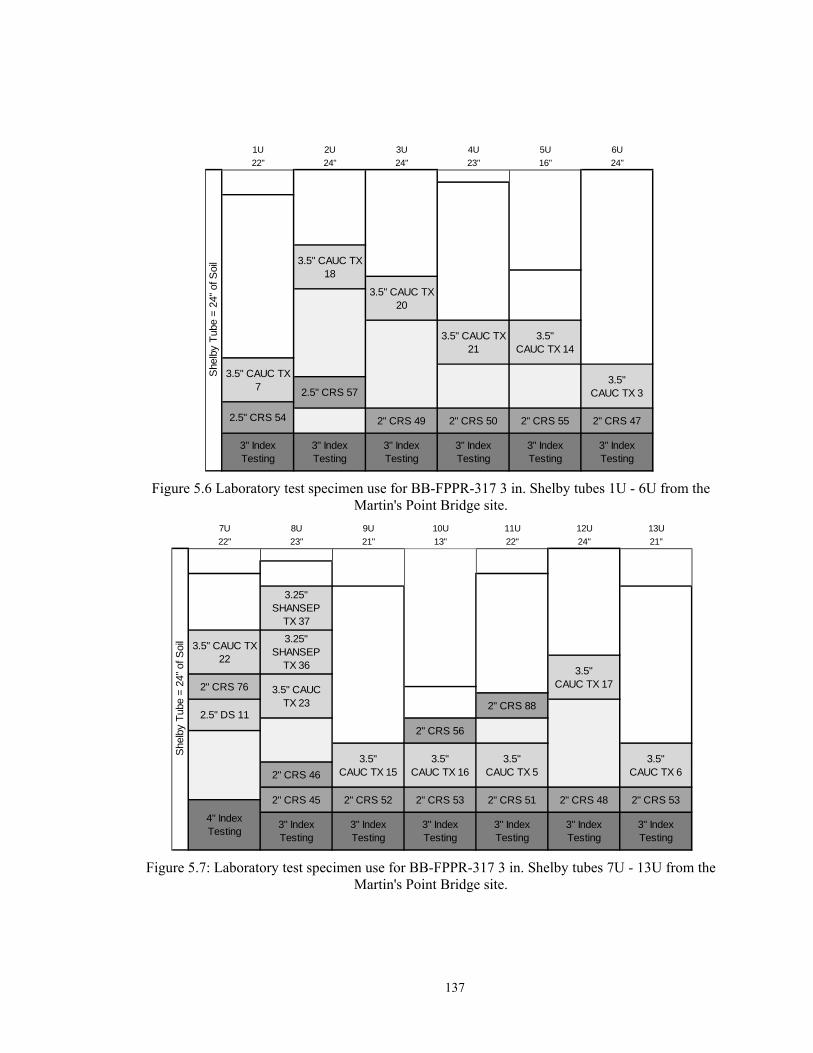
137
Figure 5.6 Laboratory test specimen use for BB-FPPR-317 3 in. Shelby tubes 1U - 6U from the Martin's Point Bridge site.
Figure 5.7: Laboratory test specimen use for BB-FPPR-317 3 in. Shelby tubes 7U - 13U from the Martin's Point Bridge site.
1U 2U 3U 4U 5U 6U
22" 24" 24" 23" 16" 24"
3" Index Testing
2" CRS 47
3.5" CAUC TX 7
3" Index Testing
3.5" CAUC TX 21
3.5" CAUC TX 14
3.5" CAUC TX 3
2" CRS 55
She
lby
Tub
e =
24"
of S
oil 3.5" CAUC TX
18
3.5" CAUC TX 20
2.5" CRS 54 2" CRS 49 2" CRS 50
3" Index Testing
3" Index Testing
3" Index Testing
3" Index Testing
2.5" CRS 57
7U 8U 9U 10U 11U 12U 13U
22" 23" 21" 13" 22" 24" 21"
She
lby
Tub
e =
24"
of S
oil
3" Index Testing
3" Index Testing
3" Index Testing
2" CRS 51
3.25" SHANSEP
TX 37
3" Index Testing
3" Index Testing
2" CRS 48 2" CRS 53
4" Index Testing
3" Index Testing
3.5" CAUC TX 16
3.5" CAUC TX 5
3.5" CAUC TX 6
2" CRS 45 2" CRS 52 2" CRS 53
3.5" CAUC TX 172" CRS 76
2" CRS 882.5" DS 11
3.25" SHANSEP
TX 36
3.5" CAUC TX 23
2" CRS 46
2" CRS 56
3.5" CAUC TX 22
3.5" CAUC TX 15
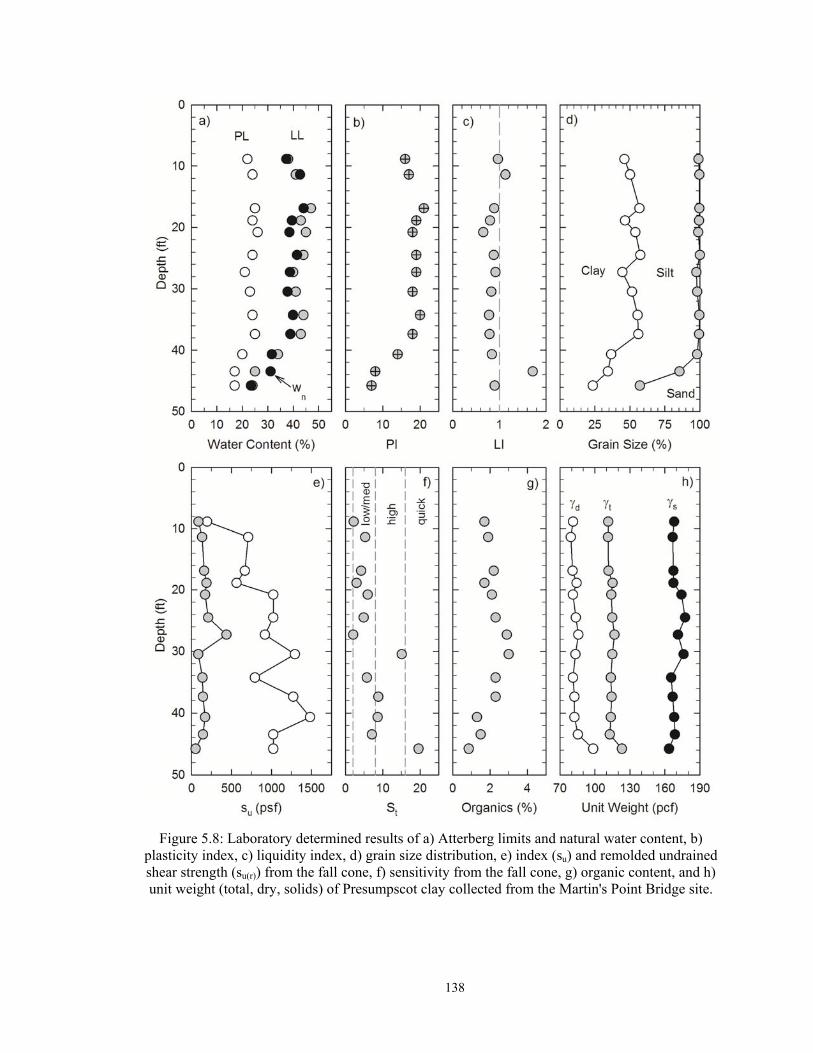
138
Figure 5.8: Laboratory determined results of a) Atterberg limits and natural water content, b) plasticity index, c) liquidity index, d) grain size distribution, e) index (su) and remolded undrained shear strength (su(r)) from the fall cone, f) sensitivity from the fall cone, g) organic content, and h) unit weight (total, dry, solids) of Presumpscot clay collected from the Martin's Point Bridge site.
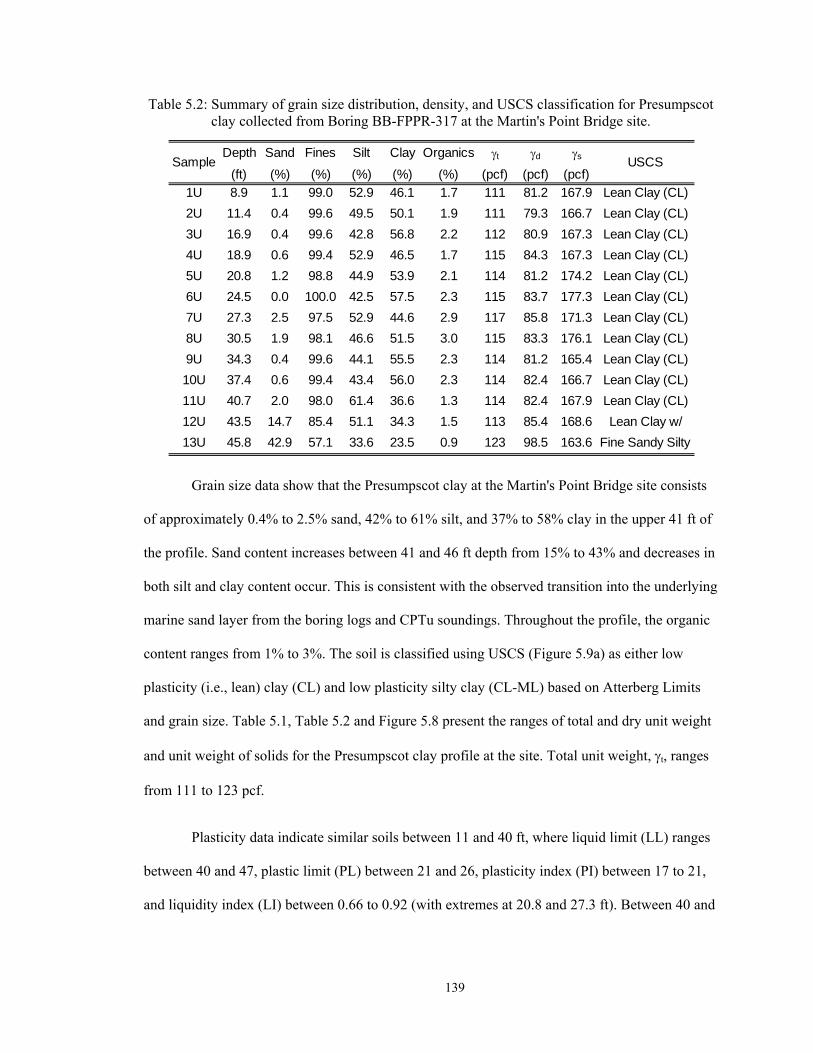
139
Table 5.2: Summary of grain size distribution, density, and USCS classification for Presumpscot clay collected from Boring BB-FPPR-317 at the Martin's Point Bridge site.
Grain size data show that the Presumpscot clay at the Martin's Point Bridge site consists
of approximately 0.4% to 2.5% sand, 42% to 61% silt, and 37% to 58% clay in the upper 41 ft of
the profile. Sand content increases between 41 and 46 ft depth from 15% to 43% and decreases in
both silt and clay content occur. This is consistent with the observed transition into the underlying
marine sand layer from the boring logs and CPTu soundings. Throughout the profile, the organic
content ranges from 1% to 3%. The soil is classified using USCS (Figure 5.9a) as either low
plasticity (i.e., lean) clay (CL) and low plasticity silty clay (CL-ML) based on Atterberg Limits
and grain size. Table 5.1, Table 5.2 and Figure 5.8 present the ranges of total and dry unit weight
and unit weight of solids for the Presumpscot clay profile at the site. Total unit weight, t, ranges
from 111 to 123 pcf.
Plasticity data indicate similar soils between 11 and 40 ft, where liquid limit (LL) ranges
between 40 and 47, plastic limit (PL) between 21 and 26, plasticity index (PI) between 17 to 21,
and liquidity index (LI) between 0.66 to 0.92 (with extremes at 20.8 and 27.3 ft). Between 40 and
Depth Sand Fines Silt Clay Organics t d s
(ft) (%) (%) (%) (%) (%) (pcf) (pcf) (pcf)
1U 8.9 1.1 99.0 52.9 46.1 1.7 111 81.2 167.9 Lean Clay (CL)
2U 11.4 0.4 99.6 49.5 50.1 1.9 111 79.3 166.7 Lean Clay (CL)
3U 16.9 0.4 99.6 42.8 56.8 2.2 112 80.9 167.3 Lean Clay (CL)
4U 18.9 0.6 99.4 52.9 46.5 1.7 115 84.3 167.3 Lean Clay (CL)
5U 20.8 1.2 98.8 44.9 53.9 2.1 114 81.2 174.2 Lean Clay (CL)
6U 24.5 0.0 100.0 42.5 57.5 2.3 115 83.7 177.3 Lean Clay (CL)
7U 27.3 2.5 97.5 52.9 44.6 2.9 117 85.8 171.3 Lean Clay (CL)
8U 30.5 1.9 98.1 46.6 51.5 3.0 115 83.3 176.1 Lean Clay (CL)
9U 34.3 0.4 99.6 44.1 55.5 2.3 114 81.2 165.4 Lean Clay (CL)
10U 37.4 0.6 99.4 43.4 56.0 2.3 114 82.4 166.7 Lean Clay (CL)
11U 40.7 2.0 98.0 61.4 36.6 1.3 114 82.4 167.9 Lean Clay (CL)
12U 43.5 14.7 85.4 51.1 34.3 1.5 113 85.4 168.6 Lean Clay w/ Fi S d (CL)13U 45.8 42.9 57.1 33.6 23.5 0.9 123 98.5 163.6 Fine Sandy Silty Cl (CL ML)
Sample USCS

140
46 ft, LL decreases with depth (from 34 to 24), PL decreases from 20 to 17, PI decreases from 14
to 7, and LI varies between 0.84 and 1.72. Increasing sand composition influences these results.
Index su values for the intact and remolded soil and strength sensitivity determined using
the fall cone apparatus are illustrated in Figure 5.8 and Table 5.3. Intact undrained shear strength,
su, generally increases with depth without a clear trend and ranges from 196 psf to 1,483 psf. Soil
remolded at the natural water content (su(r)) showed no depth increase trends in su, where values
range from 52 psf to 439 psf. The resulting sensitivity of the soil (where sensitivity, St, is the ratio
of the intact to remolded su) ranges from 2 to 9 over most of the profile, with outliers of 15.1 and
19.6 at depths 30.5 and 45.8 ft, respectively. Soils having sensitivity between 2 and 8 are
considered low to medium sensitivity, 8 to 16 are highly sensitive, and greater than 16 are quick
clays (Holtz et al., 2011; Table 2.1).
Figure 5.9: USCS Classification Charts using Atterberg Limits for Presumpscot clay collected from Boring BB-FPPR-317 at the Martin's Point Bridge site.
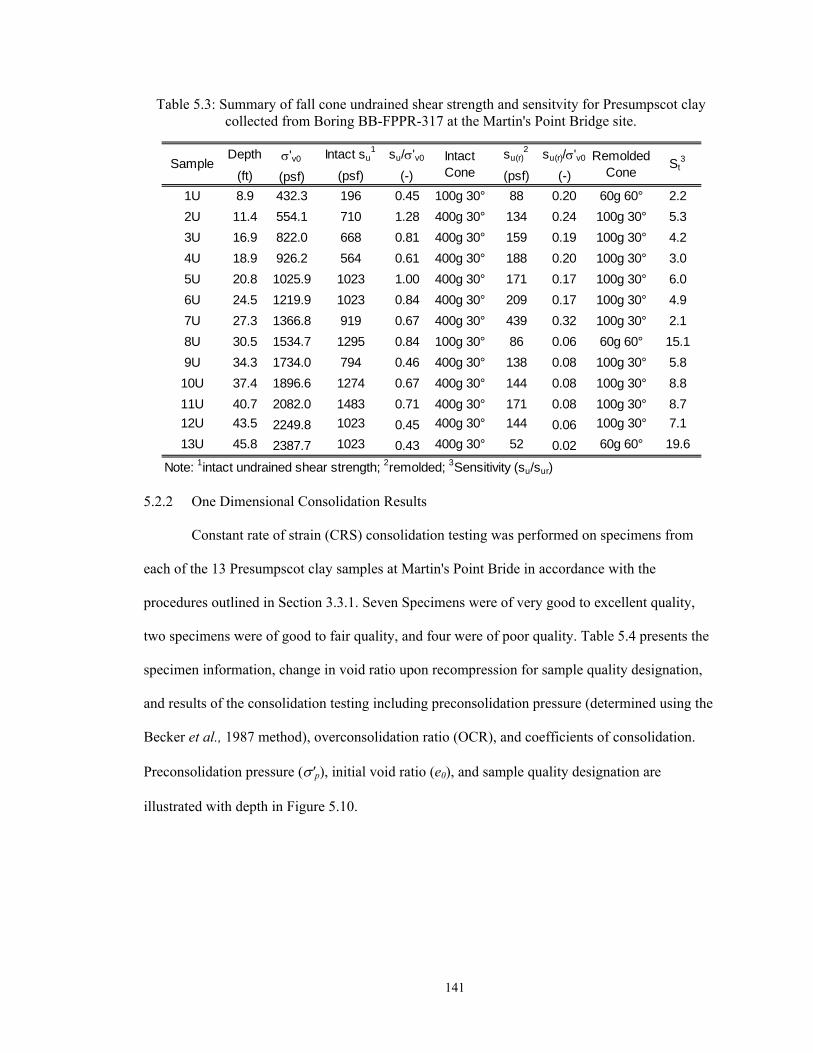
141
Table 5.3: Summary of fall cone undrained shear strength and sensitvity for Presumpscot clay collected from Boring BB-FPPR-317 at the Martin's Point Bridge site.
5.2.2 One Dimensional Consolidation Results
Constant rate of strain (CRS) consolidation testing was performed on specimens from
each of the 13 Presumpscot clay samples at Martin's Point Bride in accordance with the
procedures outlined in Section 3.3.1. Seven Specimens were of very good to excellent quality,
two specimens were of good to fair quality, and four were of poor quality. Table 5.4 presents the
specimen information, change in void ratio upon recompression for sample quality designation,
and results of the consolidation testing including preconsolidation pressure (determined using the
Becker et al., 1987 method), overconsolidation ratio (OCR), and coefficients of consolidation.
Preconsolidation pressure ('p), initial void ratio (e0), and sample quality designation are
illustrated with depth in Figure 5.10.
Depth 'v0 Intact su1 su/'v0 su(r)
2 su(r)/'v0
(ft) (psf) (psf) (-) (psf) (-)
1U 8.9 432.3 196 0.45 100g 30° 88 0.20 60g 60° 2.2
2U 11.4 554.1 710 1.28 400g 30° 134 0.24 100g 30° 5.3
3U 16.9 822.0 668 0.81 400g 30° 159 0.19 100g 30° 4.2
4U 18.9 926.2 564 0.61 400g 30° 188 0.20 100g 30° 3.0
5U 20.8 1025.9 1023 1.00 400g 30° 171 0.17 100g 30° 6.0
6U 24.5 1219.9 1023 0.84 400g 30° 209 0.17 100g 30° 4.9
7U 27.3 1366.8 919 0.67 400g 30° 439 0.32 100g 30° 2.1
8U 30.5 1534.7 1295 0.84 100g 30° 86 0.06 60g 60° 15.1
9U 34.3 1734.0 794 0.46 400g 30° 138 0.08 100g 30° 5.8
10U 37.4 1896.6 1274 0.67 400g 30° 144 0.08 100g 30° 8.8
11U 40.7 2082.0 1483 0.71 400g 30° 171 0.08 100g 30° 8.7
12U 43.5 2249.8 1023 0.45 400g 30° 144 0.06 100g 30° 7.1
13U 45.8 2387.7 1023 0.43 400g 30° 52 0.02 60g 60° 19.6
Note: 1intact undrained shear strength; 2remolded; 3Sensitivity (su/sur)
SampleIntact Cone
Remolded Cone
St3
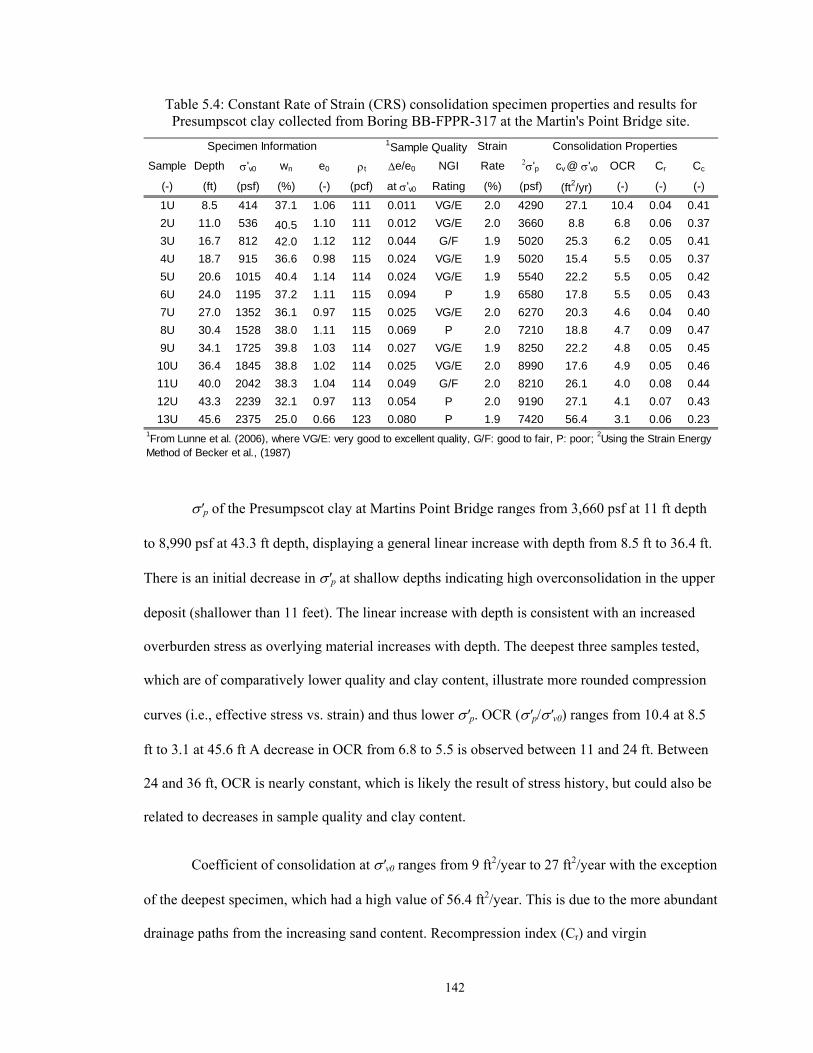
142
Table 5.4: Constant Rate of Strain (CRS) consolidation specimen properties and results for Presumpscot clay collected from Boring BB-FPPR-317 at the Martin's Point Bridge site.
'p of the Presumpscot clay at Martins Point Bridge ranges from 3,660 psf at 11 ft depth
to 8,990 psf at 43.3 ft depth, displaying a general linear increase with depth from 8.5 ft to 36.4 ft.
There is an initial decrease in 'p at shallow depths indicating high overconsolidation in the upper
deposit (shallower than 11 feet). The linear increase with depth is consistent with an increased
overburden stress as overlying material increases with depth. The deepest three samples tested,
which are of comparatively lower quality and clay content, illustrate more rounded compression
curves (i.e., effective stress vs. strain) and thus lower 'p. OCR ('p/'v0) ranges from 10.4 at 8.5
ft to 3.1 at 45.6 ft A decrease in OCR from 6.8 to 5.5 is observed between 11 and 24 ft. Between
24 and 36 ft, OCR is nearly constant, which is likely the result of stress history, but could also be
related to decreases in sample quality and clay content.
Coefficient of consolidation at 'v0 ranges from 9 ft2/year to 27 ft2/year with the exception
of the deepest specimen, which had a high value of 56.4 ft2/year. This is due to the more abundant
drainage paths from the increasing sand content. Recompression index (Cr) and virgin
Strain
Sample Depth 'v0 wn e0 t e/e0 NGI Rate 'p cv @ 'v0 OCR Cr Cc
(-) (ft) (psf) (%) (-) (pcf) at 'v0 Rating (%) (psf) (ft2/yr) (-) (-) (-)
1U 8.5 414 37.1 1.06 111 0.011 VG/E 2.0 4290 27.1 10.4 0.04 0.41
2U 11.0 536 40.5 1.10 111 0.012 VG/E 2.0 3660 8.8 6.8 0.06 0.37
3U 16.7 812 42.0 1.12 112 0.044 G/F 1.9 5020 25.3 6.2 0.05 0.41
4U 18.7 915 36.6 0.98 115 0.024 VG/E 1.9 5020 15.4 5.5 0.05 0.37
5U 20.6 1015 40.4 1.14 114 0.024 VG/E 1.9 5540 22.2 5.5 0.05 0.42
6U 24.0 1195 37.2 1.11 115 0.094 P 1.9 6580 17.8 5.5 0.05 0.43
7U 27.0 1352 36.1 0.97 115 0.025 VG/E 2.0 6270 20.3 4.6 0.04 0.40
8U 30.4 1528 38.0 1.11 115 0.069 P 2.0 7210 18.8 4.7 0.09 0.47
9U 34.1 1725 39.8 1.03 114 0.027 VG/E 1.9 8250 22.2 4.8 0.05 0.45
10U 36.4 1845 38.8 1.02 114 0.025 VG/E 2.0 8990 17.6 4.9 0.05 0.46
11U 40.0 2042 38.3 1.04 114 0.049 G/F 2.0 8210 26.1 4.0 0.08 0.44
12U 43.3 2239 32.1 0.97 113 0.054 P 2.0 9190 27.1 4.1 0.07 0.43
13U 45.6 2375 25.0 0.66 123 0.080 P 1.9 7420 56.4 3.1 0.06 0.231From Lunne et al. (2006), where VG/E: very good to excellent quality, G/F: good to fair, P: poor; 2Using the Strain Energy Method of Becker et al., (1987)
1Sample QualitySpecimen Information Consolidation Properties
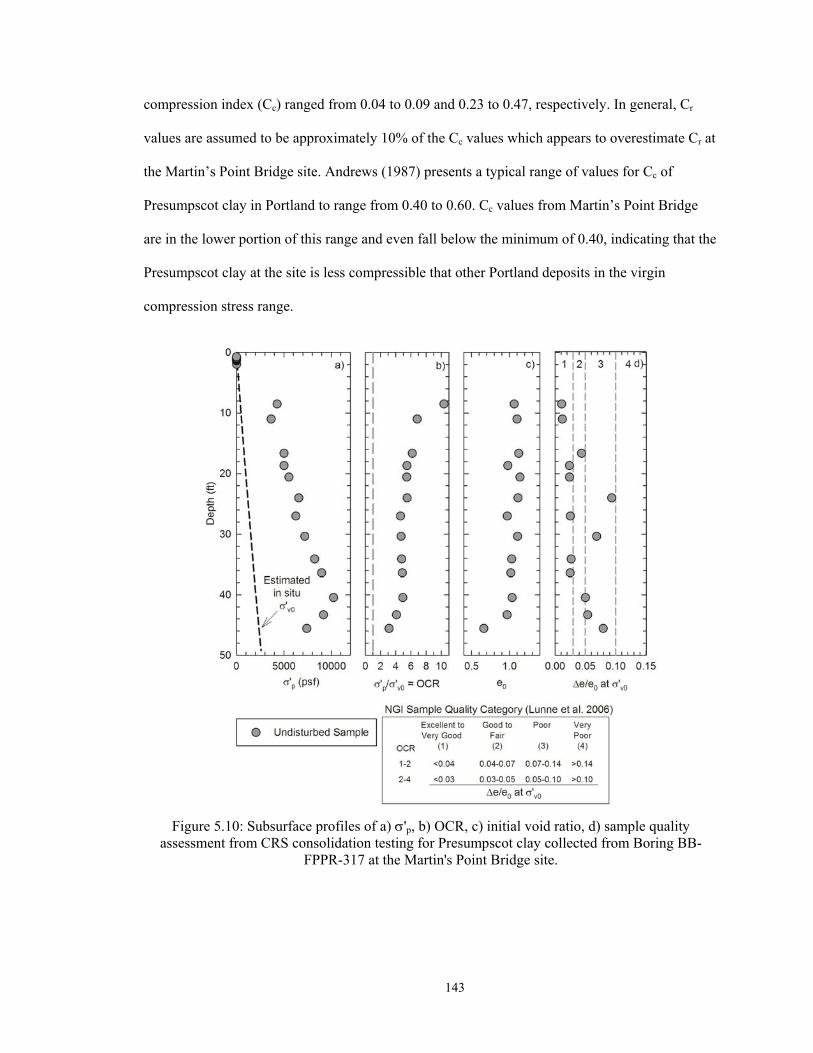
143
compression index (Cc) ranged from 0.04 to 0.09 and 0.23 to 0.47, respectively. In general, Cr
values are assumed to be approximately 10% of the Cc values which appears to overestimate Cr at
the Martin’s Point Bridge site. Andrews (1987) presents a typical range of values for Cc of
Presumpscot clay in Portland to range from 0.40 to 0.60. Cc values from Martin’s Point Bridge
are in the lower portion of this range and even fall below the minimum of 0.40, indicating that the
Presumpscot clay at the site is less compressible that other Portland deposits in the virgin
compression stress range.
Figure 5.10: Subsurface profiles of a) 'p, b) OCR, c) initial void ratio, d) sample quality assessment from CRS consolidation testing for Presumpscot clay collected from Boring BB-
FPPR-317 at the Martin's Point Bridge site.

144
Void ratio (e) remained relatively constant from 0.97 to 1.12 without a trend with depth.
The sample collected at the bottom of the deposit had an e of 0.66 due to the increased sand
content.
5.2.3 Recompression Undrained Triaxial Shear
Recompression consolidated undrained triaxial shear testing was performed on specimens
from each of the 13 Presumpscot clay samples at the Martin's Point Bridge site in accordance
with the procedures outlined in Section 3.4.4. Table 5.5 presents specimen properties, conditions
following recompression to the estimated 'v0, sample quality, and pre-shear parameters for the
triaxial specimens. Table 5.6 presents results from the shear phase of the triaxial tests, including
peak shear stress, strain at failure, pore pressure at failure, and undrained shear strength
normalized to vertical effective stress (note: su = qf = undrained shear strength). Specimens were
mainly of very good to excellent quality (10 total) with the exception of one specimen each
having good to fair quality, poor quality specimens, and very poor quality.
Undrained shear strength (su = qf) ranged from 661 psf at 10.2 ft depth to 1,557 psf at
42.5 ft depth. su normalized by the preshear vertical consolidation stress ('vc) ranges from 1.59 to
0.52 while su/'v0 ranges from 1.83 to 0.57. Normalized su typically ranges from 0.2 to 0.3 for
normally consolidated clays and increases with OCR, as expressed in Equation 2.1. The
difference in 'vc values and 'v0 is due to limitations of the test procedure. The effect of the 'vc ≠
'v0 condition on measured su is discussed in Section 3.4.4. In summary, the effect of the different
'v0 is not quantifiable; however, the 'vc > 'v0 condition likely results in a lower measured su
value than in situ conditions due to destructuring of the clay specimen, where 'vc < 'v0 condition
results in a higher su. Table 5.6 shows that all but three specimens were consolidated to
approximately 'vc < 'v0 or 'vc = 'v0 conditions.
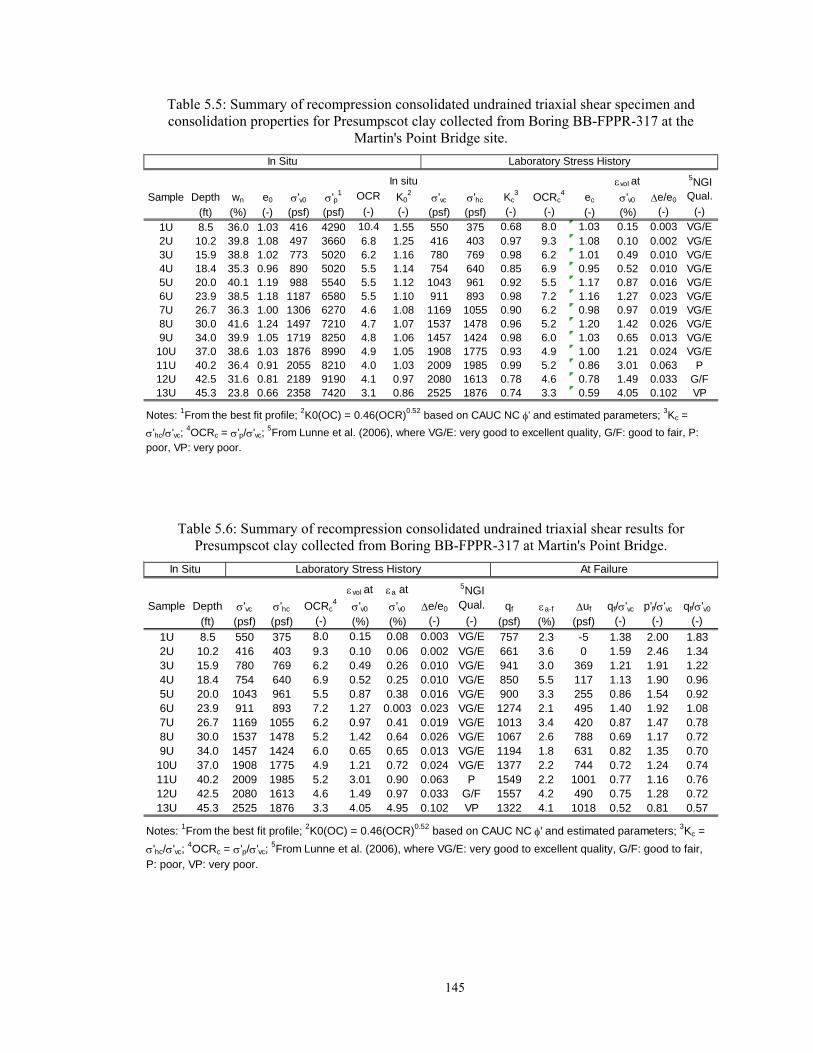
145
Table 5.5: Summary of recompression consolidated undrained triaxial shear specimen and consolidation properties for Presumpscot clay collected from Boring BB-FPPR-317 at the
Martin's Point Bridge site.
Table 5.6: Summary of recompression consolidated undrained triaxial shear results for Presumpscot clay collected from Boring BB-FPPR-317 at Martin's Point Bridge.
Sample Depth wn e0 'v0 'p1 OCR
In situ
K02 'vc 'hc Kc
3 OCRc4 ec
vol at
'v0 e/e0
5NGI Qual.
(ft) (%) (-) (psf) (psf) (-) (-) (psf) (psf) (-) (-) (-) (%) (-) (-)
1U 8.5 36.0 1.03 416 4290 10.4 1.55 550 375 0.68 8.0 1.03 0.15 0.003 VG/E2U 10.2 39.8 1.08 497 3660 6.8 1.25 416 403 0.97 9.3 1.08 0.10 0.002 VG/E3U 15.9 38.8 1.02 773 5020 6.2 1.16 780 769 0.98 6.2 1.01 0.49 0.010 VG/E4U 18.4 35.3 0.96 890 5020 5.5 1.14 754 640 0.85 6.9 0.95 0.52 0.010 VG/E5U 20.0 40.1 1.19 988 5540 5.5 1.12 1043 961 0.92 5.5 1.17 0.87 0.016 VG/E6U 23.9 38.5 1.18 1187 6580 5.5 1.10 911 893 0.98 7.2 1.16 1.27 0.023 VG/E7U 26.7 36.3 1.00 1306 6270 4.6 1.08 1169 1055 0.90 6.2 0.98 0.97 0.019 VG/E8U 30.0 41.6 1.24 1497 7210 4.7 1.07 1537 1478 0.96 5.2 1.20 1.42 0.026 VG/E9U 34.0 39.9 1.05 1719 8250 4.8 1.06 1457 1424 0.98 6.0 1.03 0.65 0.013 VG/E
10U 37.0 38.6 1.03 1876 8990 4.9 1.05 1908 1775 0.93 4.9 1.00 1.21 0.024 VG/E11U 40.2 36.4 0.91 2055 8210 4.0 1.03 2009 1985 0.99 5.2 0.86 3.01 0.063 P12U 42.5 31.6 0.81 2189 9190 4.1 0.97 2080 1613 0.78 4.6 0.78 1.49 0.033 G/F13U 45.3 23.8 0.66 2358 7420 3.1 0.86 2525 1876 0.74 3.3 0.59 4.05 0.102 VP
Laboratory Stress History
Notes: 1From the best fit profile; 2K0(OC) = 0.46(OCR)0.52 based on CAUC NC ' and estimated parameters; 3Kc =
'hc/'vc; 4OCRc = 'p/'vc;
5From Lunne et al. (2006), where VG/E: very good to excellent quality, G/F: good to fair, P: poor, VP: very poor.
In Situ
Sample Depth 'vc 'hc OCRc4
vol at
'v0
a at
'v0 e/e0
5NGI Qual. qf a-f uf qf/'vc p'f/'vc qf/'v0
(ft) (psf) (psf) (-) (%) (%) (-) (-) (psf) (%) (psf) (-) (-) (-)
1U 8.5 550 375 8.0 0.15 0.08 0.003 VG/E 757 2.3 -5 1.38 2.00 1.832U 10.2 416 403 9.3 0.10 0.06 0.002 VG/E 661 3.6 0 1.59 2.46 1.343U 15.9 780 769 6.2 0.49 0.26 0.010 VG/E 941 3.0 369 1.21 1.91 1.224U 18.4 754 640 6.9 0.52 0.25 0.010 VG/E 850 5.5 117 1.13 1.90 0.965U 20.0 1043 961 5.5 0.87 0.38 0.016 VG/E 900 3.3 255 0.86 1.54 0.926U 23.9 911 893 7.2 1.27 0.003 0.023 VG/E 1274 2.1 495 1.40 1.92 1.087U 26.7 1169 1055 6.2 0.97 0.41 0.019 VG/E 1013 3.4 420 0.87 1.47 0.788U 30.0 1537 1478 5.2 1.42 0.64 0.026 VG/E 1067 2.6 788 0.69 1.17 0.729U 34.0 1457 1424 6.0 0.65 0.65 0.013 VG/E 1194 1.8 631 0.82 1.35 0.70
10U 37.0 1908 1775 4.9 1.21 0.72 0.024 VG/E 1377 2.2 744 0.72 1.24 0.7411U 40.2 2009 1985 5.2 3.01 0.90 0.063 P 1549 2.2 1001 0.77 1.16 0.7612U 42.5 2080 1613 4.6 1.49 0.97 0.033 G/F 1557 4.2 490 0.75 1.28 0.7213U 45.3 2525 1876 3.3 4.05 4.95 0.102 VP 1322 4.1 1018 0.52 0.81 0.57
Laboratory Stress History At FailureIn Situ
Notes: 1From the best fit profile; 2K0(OC) = 0.46(OCR)0.52 based on CAUC NC ' and estimated parameters; 3Kc =
'hc/'vc; 4OCRc = 'p/'vc;
5From Lunne et al. (2006), where VG/E: very good to excellent quality, G/F: good to fair, P: poor, VP: very poor.

146
In situ K0 was estimated using Equation 3.7 and a ' of 32o. Kc, the lateral earth pressure
coefficient during the recompression phase of the CAUC test, ranged from 4% to 78% difference
between the estimated in situ values, generally decreasing with depth. Figure 5.11 illustrates su
from intact and remolded in situ field vane shear tests (FVT) from twelve other borings at the
Martin's Point Bridge site, fall cone tests conducted on tube sample ends from BB-FPPR-317, and
CAUC su from Table 5.6. The gray dotted line shown in Figure 5.11a is the approximated in situ
su profile. These data indicate the variability of the su across the site and with depth, as well as
variability inherent in measurement tools and states (e.g., field vane shear and triaxial tests were
near in situ effective stresses, fall cone tests were at the residual effective stress state (zero total
stress)) and FVT were conducted on soil from other locations/depths different than BB-FPPR-
317.
Figure 5.11: Subsurface profile of a) undrained shear strength (su), b) remolded undrained shear strength and c) and sensitivity from laboratory testing on undisturbed samples (BB-317) and field
vane shear testing (other borings) at the Martin's Point Bridge site.
su-r (psf)
0 200 400
BB-108, 109, 311, 311A, 312, 313, 316BB-306BB-308, 309BB-107, 206
su (psf)
0 500 1000 1500
Dep
th (
ft)
0
10
20
30
40
50
BB-317 Fall ConeBB-317 CAUC TX
St
0 5 10 15 20
c)a) b)
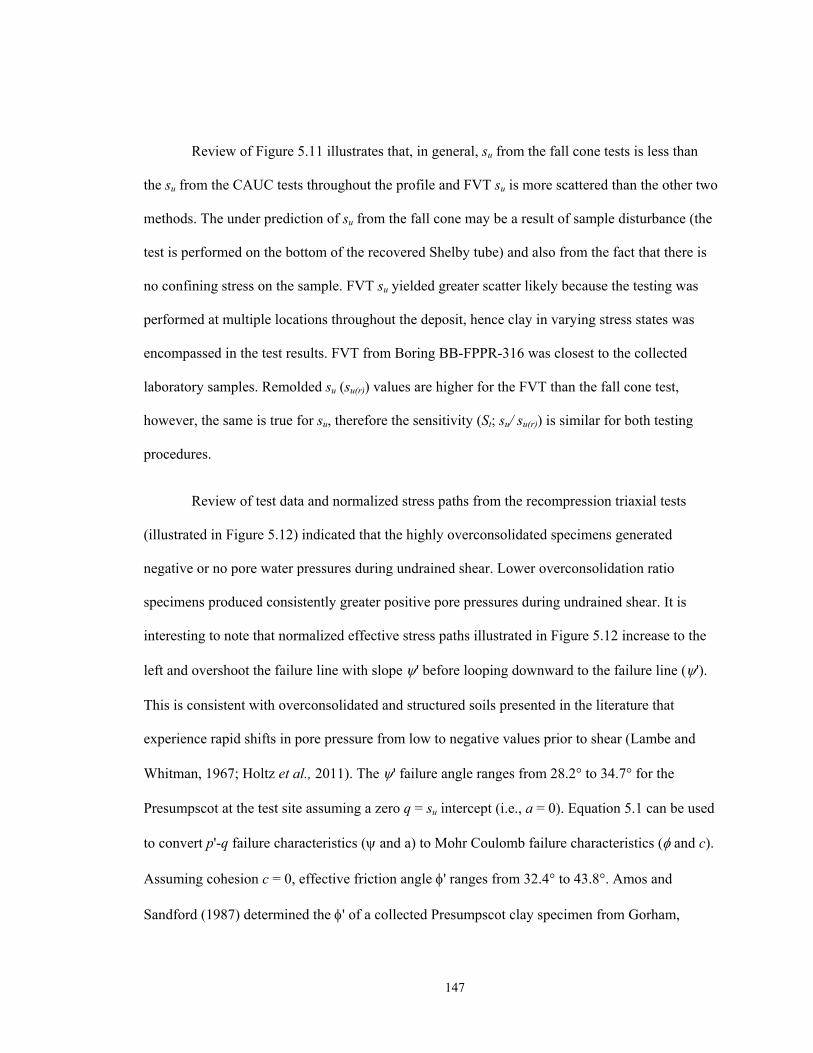
147
Review of Figure 5.11 illustrates that, in general, su from the fall cone tests is less than
the su from the CAUC tests throughout the profile and FVT su is more scattered than the other two
methods. The under prediction of su from the fall cone may be a result of sample disturbance (the
test is performed on the bottom of the recovered Shelby tube) and also from the fact that there is
no confining stress on the sample. FVT su yielded greater scatter likely because the testing was
performed at multiple locations throughout the deposit, hence clay in varying stress states was
encompassed in the test results. FVT from Boring BB-FPPR-316 was closest to the collected
laboratory samples. Remolded su (su(r)) values are higher for the FVT than the fall cone test,
however, the same is true for su, therefore the sensitivity (St; su/ su(r)) is similar for both testing
procedures.
Review of test data and normalized stress paths from the recompression triaxial tests
(illustrated in Figure 5.12) indicated that the highly overconsolidated specimens generated
negative or no pore water pressures during undrained shear. Lower overconsolidation ratio
specimens produced consistently greater positive pore pressures during undrained shear. It is
interesting to note that normalized effective stress paths illustrated in Figure 5.12 increase to the
left and overshoot the failure line with slope ' before looping downward to the failure line (').
This is consistent with overconsolidated and structured soils presented in the literature that
experience rapid shifts in pore pressure from low to negative values prior to shear (Lambe and
Whitman, 1967; Holtz et al., 2011). The ' failure angle ranges from 28.2° to 34.7° for the
Presumpscot at the test site assuming a zero q = su intercept (i.e., a = 0). Equation 5.1 can be used
to convert p'-q failure characteristics ( and a) to Mohr Coulomb failure characteristics ( and c).
Assuming cohesion c = 0, effective friction angle ' ranges from 32.4° to 43.8°. Amos and
Sandford (1987) determined the ' of a collected Presumpscot clay specimen from Gorham,
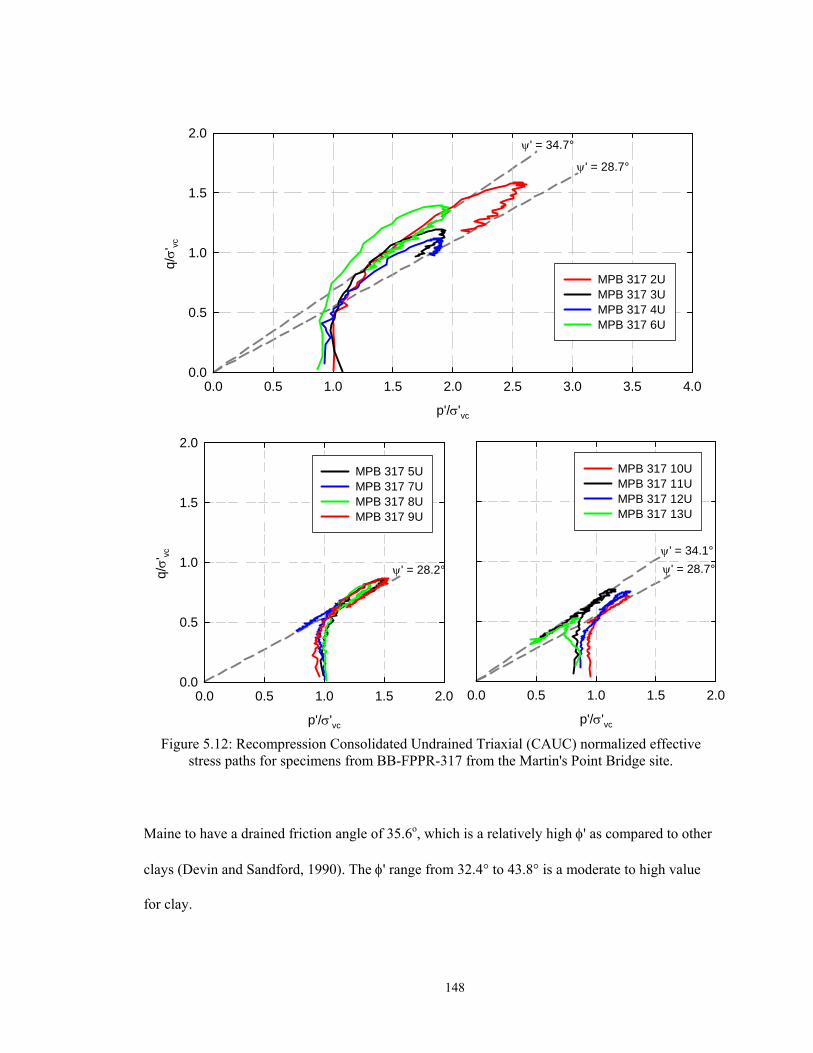
148
Figure 5.12: Recompression Consolidated Undrained Triaxial (CAUC) normalized effective stress paths for specimens from BB-FPPR-317 from the Martin's Point Bridge site.
Maine to have a drained friction angle of 35.6o, which is a relatively high ' as compared to other
clays (Devin and Sandford, 1990). The ' range from 32.4° to 43.8° is a moderate to high value
for clay.
p'/'vc
0.0 0.5 1.0 1.5 2.0
MPB 317 10UMPB 317 11UMPB 317 12UMPB 317 13U
p'/'vc
0.0 0.5 1.0 1.5 2.0
q/ '
vc
0.0
0.5
1.0
1.5
2.0
MPB 317 5UMPB 317 7UMPB 317 8UMPB 317 9U
p'/'vc
0.0 0.5 1.0 1.5 2.0 2.5 3.0 3.5 4.0
q/ '
vc
0.0
0.5
1.0
1.5
2.0
MPB 317 2UMPB 317 3UMPB 317 4UMPB 317 6U
' = 28.7°
' = 34.7°
' = 28.2° ' = 28.7°
' = 34.1°
149
sin = tan 5.1
(where c = 0 and a = 0)
The total stress path of sheared clay in p'-q space can be drawn as a 45o line measured
counterclockwise from the x-axis, starting at the initial stress point. The effective stress paths (the
lines shown on Figure 5.12) which remain to the left side of the total stress path line indicate a
soil which is exerting positive excess pore pressure (i.e. effective stress is less that total stress).
This is the behavior exhibited by all of the tested specimens displayed in Figure 5.12. However,
one thing to note is that the deeper that sample, the lower the OCR (Table 5.4) and the further
away the effective stress path from the total stress path, indicating higher excess pore pressure (as
shown in Table 5.6)
5.2.4 SHANSEP Consolidated Undrained Triaxial Shear Results
SHANSEP testing (Section 2.1.4) was conducted on the Presumpscot clay at the Martin's
Point Bridge test site to determine if this type of testing is appropriate for the overconsolidated
clay. Table 5.7 and Table 5.8 present results from SHANSEP triaxial compression tests including
peak shear stress, strain at failure, pore pressure at failure, and shear stress normalized to vertical
effective compressive stress and the predicted relationship between overconsolidation and
normalized shear strength. Figure 5.13 illustrates the normalized effective stress paths for the 8U,
29 ft depth, SHANSEP specimens.
The OCR = 1 specimen exhibited normally consolidated behavior as indicated in Figure
5.13. During undrained shear, positive pore water pressures were generated, causing the effective
stress path to curve to the left. The OCR = 2 specimen showed low positive pore pressure
generation during early shear (the effective stress path moving more vertical before transitioning
left in p'-q space). Following peak shear strength, the normalized effective stress path decreased
to the left and approached the failure line. The failure line was the same for both specimens,
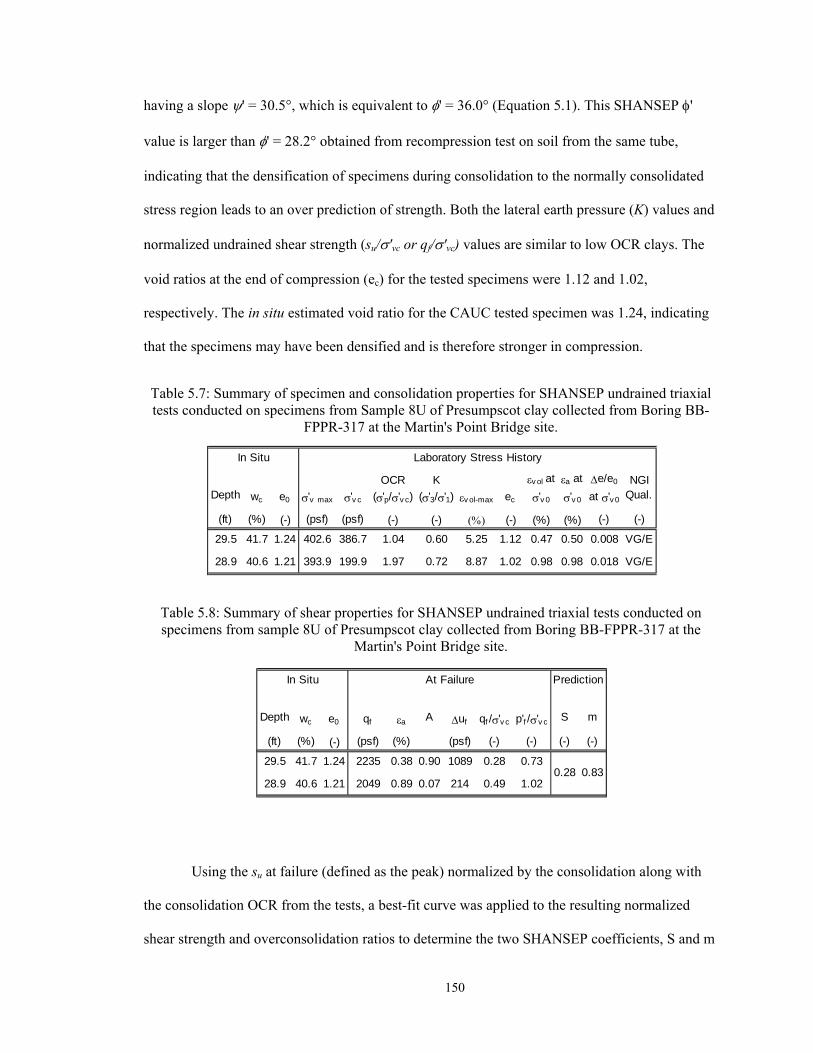
150
having a slope ' = 30.5°, which is equivalent to ' = 36.0° (Equation 5.1). This SHANSEP '
value is larger than ' = 28.2° obtained from recompression test on soil from the same tube,
indicating that the densification of specimens during consolidation to the normally consolidated
stress region leads to an over prediction of strength. Both the lateral earth pressure (K) values and
normalized undrained shear strength (su/'vc or qf/'vc) values are similar to low OCR clays. The
void ratios at the end of compression (ec) for the tested specimens were 1.12 and 1.02,
respectively. The in situ estimated void ratio for the CAUC tested specimen was 1.24, indicating
that the specimens may have been densified and is therefore stronger in compression.
Table 5.7: Summary of specimen and consolidation properties for SHANSEP undrained triaxial tests conducted on specimens from Sample 8U of Presumpscot clay collected from Boring BB-
FPPR-317 at the Martin's Point Bridge site.
Table 5.8: Summary of shear properties for SHANSEP undrained triaxial tests conducted on specimens from sample 8U of Presumpscot clay collected from Boring BB-FPPR-317 at the
Martin's Point Bridge site.
Using the su at failure (defined as the peak) normalized by the consolidation along with
the consolidation OCR from the tests, a best-fit curve was applied to the resulting normalized
shear strength and overconsolidation ratios to determine the two SHANSEP coefficients, S and m
Depth wc e0 'v max 'v c
OCR
('p/'v c)
K
('3/'1) v ol-max ec
v ol at
'v 0
a at
'v 0
e/e0
at 'v 0
NGI Qual.
(ft) (%) (-) (psf) (psf) (-) (-) (-) (%) (%) (-) (-)
29.5 41.7 1.24 402.6 386.7 1.04 0.60 5.25 1.12 0.47 0.50 0.008 VG/E
28.9 40.6 1.21 393.9 199.9 1.97 0.72 8.87 1.02 0.98 0.98 0.018 VG/E
In Situ Laboratory Stress History
Depth wc e0 qf a A uf qf /'v c p'f /'v c S m
(ft) (%) (-) (psf) (%) (psf) (-) (-) (-) (-)
29.5 41.7 1.24 2235 0.38 0.90 1089 0.28 0.73
28.9 40.6 1.21 2049 0.89 0.07 214 0.49 1.020.28 0.83
In Situ At Failure Prediction
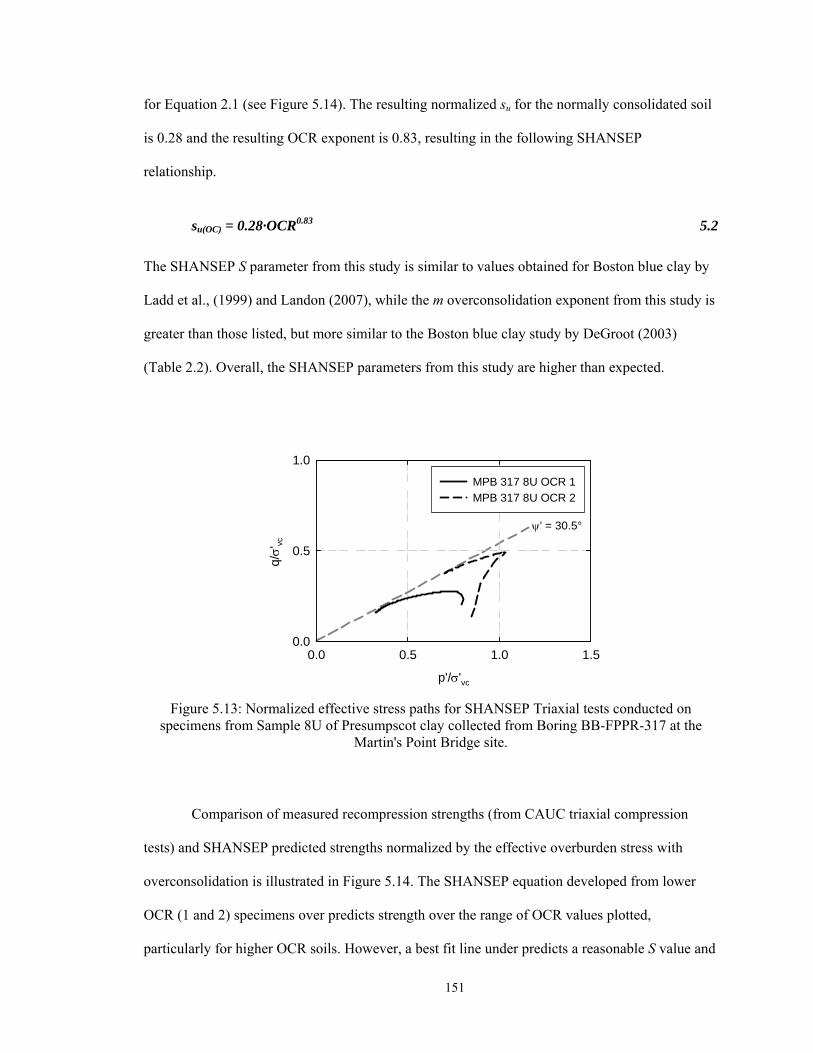
151
for Equation 2.1 (see Figure 5.14). The resulting normalized su for the normally consolidated soil
is 0.28 and the resulting OCR exponent is 0.83, resulting in the following SHANSEP
relationship.
su(OC) = 0.28·OCR0.83 5.2
The SHANSEP S parameter from this study is similar to values obtained for Boston blue clay by
Ladd et al., (1999) and Landon (2007), while the m overconsolidation exponent from this study is
greater than those listed, but more similar to the Boston blue clay study by DeGroot (2003)
(Table 2.2). Overall, the SHANSEP parameters from this study are higher than expected.
Figure 5.13: Normalized effective stress paths for SHANSEP Triaxial tests conducted on specimens from Sample 8U of Presumpscot clay collected from Boring BB-FPPR-317 at the
Martin's Point Bridge site.
Comparison of measured recompression strengths (from CAUC triaxial compression
tests) and SHANSEP predicted strengths normalized by the effective overburden stress with
overconsolidation is illustrated in Figure 5.14. The SHANSEP equation developed from lower
OCR (1 and 2) specimens over predicts strength over the range of OCR values plotted,
particularly for higher OCR soils. However, a best fit line under predicts a reasonable S value and
p'/'vc
0.0 0.5 1.0 1.5
q/ '
vc
0.0
0.5
1.0
MPB 317 8U OCR 1
MPB 317 8U OCR 2
' = 30.5°
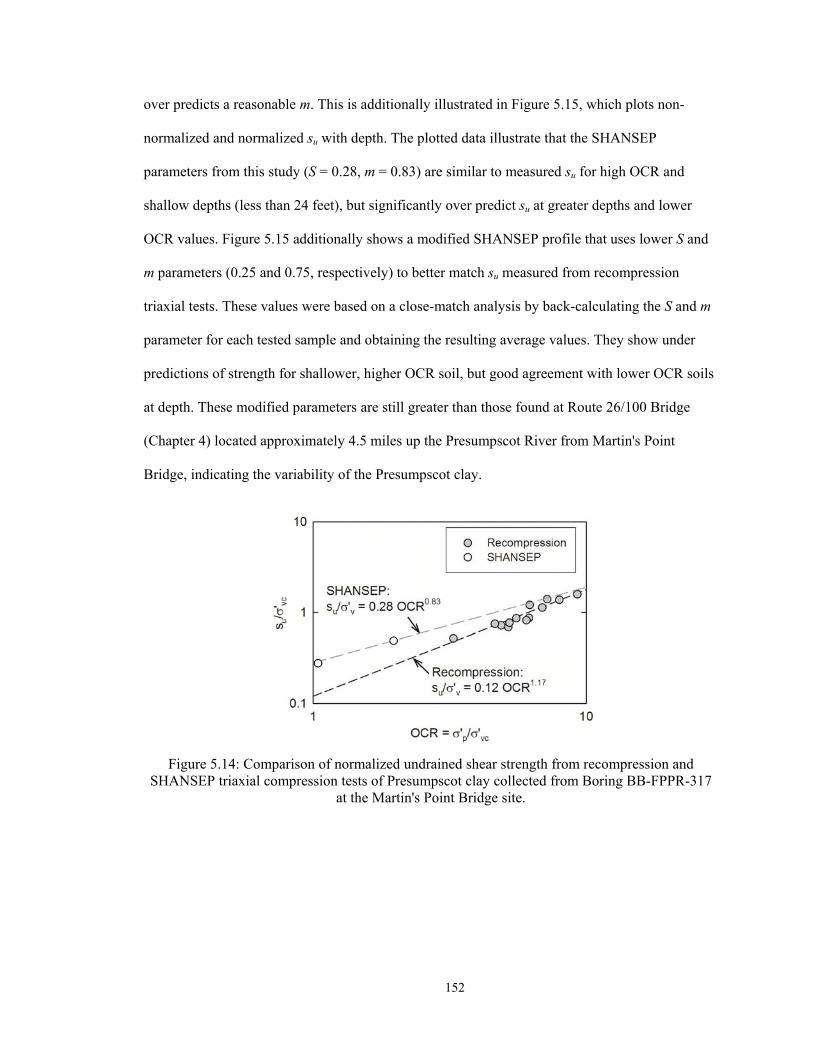
152
over predicts a reasonable m. This is additionally illustrated in Figure 5.15, which plots non-
normalized and normalized su with depth. The plotted data illustrate that the SHANSEP
parameters from this study (S = 0.28, m = 0.83) are similar to measured su for high OCR and
shallow depths (less than 24 feet), but significantly over predict su at greater depths and lower
OCR values. Figure 5.15 additionally shows a modified SHANSEP profile that uses lower S and
m parameters (0.25 and 0.75, respectively) to better match su measured from recompression
triaxial tests. These values were based on a close-match analysis by back-calculating the S and m
parameter for each tested sample and obtaining the resulting average values. They show under
predictions of strength for shallower, higher OCR soil, but good agreement with lower OCR soils
at depth. These modified parameters are still greater than those found at Route 26/100 Bridge
(Chapter 4) located approximately 4.5 miles up the Presumpscot River from Martin's Point
Bridge, indicating the variability of the Presumpscot clay.
Figure 5.14: Comparison of normalized undrained shear strength from recompression and SHANSEP triaxial compression tests of Presumpscot clay collected from Boring BB-FPPR-317
at the Martin's Point Bridge site.
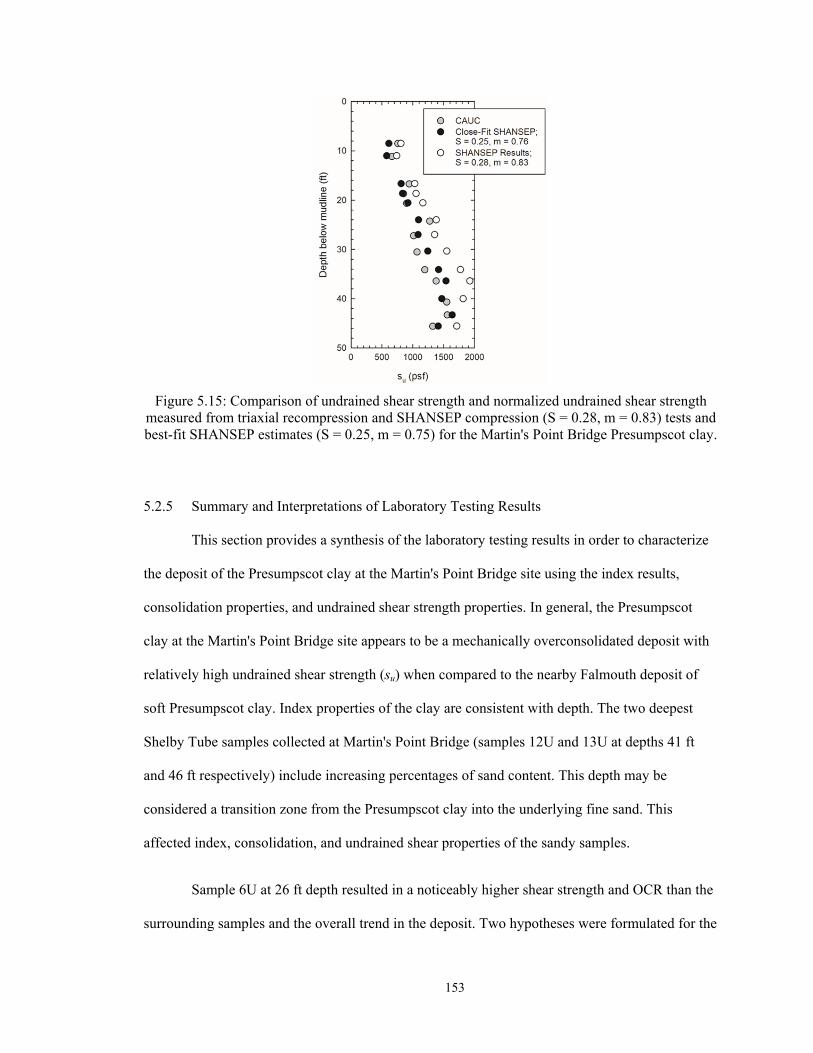
153
Figure 5.15: Comparison of undrained shear strength and normalized undrained shear strength measured from triaxial recompression and SHANSEP compression (S = 0.28, m = 0.83) tests and best-fit SHANSEP estimates (S = 0.25, m = 0.75) for the Martin's Point Bridge Presumpscot clay.
5.2.5 Summary and Interpretations of Laboratory Testing Results
This section provides a synthesis of the laboratory testing results in order to characterize
the deposit of the Presumpscot clay at the Martin's Point Bridge site using the index results,
consolidation properties, and undrained shear strength properties. In general, the Presumpscot
clay at the Martin's Point Bridge site appears to be a mechanically overconsolidated deposit with
relatively high undrained shear strength (su) when compared to the nearby Falmouth deposit of
soft Presumpscot clay. Index properties of the clay are consistent with depth. The two deepest
Shelby Tube samples collected at Martin's Point Bridge (samples 12U and 13U at depths 41 ft
and 46 ft respectively) include increasing percentages of sand content. This depth may be
considered a transition zone from the Presumpscot clay into the underlying fine sand. This
affected index, consolidation, and undrained shear properties of the sandy samples.
Sample 6U at 26 ft depth resulted in a noticeably higher shear strength and OCR than the
surrounding samples and the overall trend in the deposit. Two hypotheses were formulated for the
154
cause of this. The first is the possibility of this behavior signifying a geologic or depositional
change which occurred during formation of the deposit. Index and consolidation properties of the
overlying and underlying clay material are very similar to that of 6U, and perhaps this depth was
formerly deposited in a looser configuration and altered from the weight above. The second
possibility is that the increase in su and OCR is due to increased granular composition from either
a sand or silt seam. Sand or silt grains can increase frictional resistance to shearing and decrease
the compressibility of clay (increasing OCR). Seams were encountered during borings and CPT
testing. Although the hydrometer performed on sample 6U did not show an irregular increase in
silt or sand, it is likely that the seam was not located within the portion of the sample used for
index testing.
Overall index test data (Figure 5.8) show the following trends for the Presumpscot clay at the
Martin's Point Bridge site:
Water content is generally near the liquid limit, with liquidity index ranging between 0.66
and 1.13. There is no apparent relationship between clay content, depth, sensitivity, or
other measured parameters and Atterberg limits.
Sensitivity and clay content are generally well correlated in the upper 38 ft of the deposit,
but not correlated for depths greater than this, where fall cone su remains high while clay
content decreases and silt and sand content increase.
In situ void ratio (Figure 5.10) generally follows the trend of clay content, where soils
with higher void ratios typically have higher clay content.
Overall stress history (Figure 5.10) and undrained shear strength (Figure 5.11) show the
following trends for the Presumpscot clay at the Martin's Point Bridge site:
Between 11 and 40 ft (sample 2U to 11U), 'p increases with depth, which is consistent
with mechanical overconsolidation. OCR generally decreases from 6 to 3 for the deposit.
155
The cause of the significantly higher 'p of sample 1U is likely pore pressure induced
from tidal action extending to the sample depth.
Overconsolidation is likely caused by mechanical unloading (e.g., removal of previously
deposited sediment or ice), cycles of wetting or drying, cementation, aging, secondary
compression, or other biogeochemical processes.
The 'p of samples 12U and 13U are not representative of the Presumpscot clay deposit
due to the high sand content.
su from triaxial testing of the Presumpscot clay at the site ranged from 661 psf to 1557 psf
and showed a general increase with depth
The high su of sample 6U may represent a sand/silt seam inclusions in the sample
Shear strain at failure ranged from 1.8% to 5.5% with no observed trends with depth or
index properties.
5.3 Seismic Cone Penetration Testing
Four piezocone penetrometer tests were performed at the Martin's Point Bridge on
October 18 and 19, 2012 (Conetec, 2012) in general accordance ASTM D-5778 Standard Test
Method for Electronic Friction Cone and Piezocone Penetration Testing of Soils and the methods
outlined in Section 3.1. These included two piezocone penetrometer tests, CPTu 102 and CPTu
104, and two seismic piezocone penetrometer tests SCPTu 101 and SCPTu 103. Table 5.9
provides location information and test depths for the three profiles. Figure 5.3 indicates the
locations of these soundings. CPTu 102 was conducted in a location with no Presumpscot clay
and was therefore omitted from the analysis. The penetrometer used for CPTu testing at Martin's
Point Bridge contained a cone tip diameter of 1.4 inches. A Dietrich D-50 drill rig mounted on a
jack-up barge operated by Maine Test Borings was used to push the cones. Seismic waves were
created by striking an anvil on top of metal rods extending down to a wedge placed at the mudline
(Section 3.1.1).
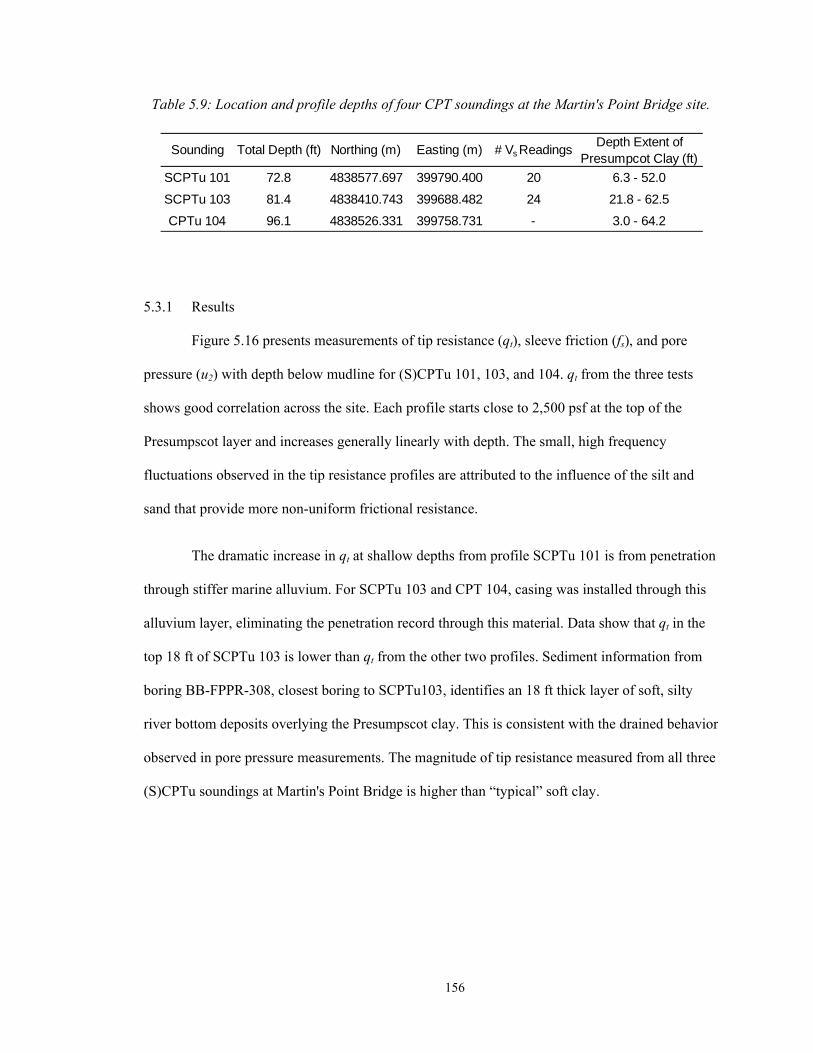
156
Table 5.9: Location and profile depths of four CPT soundings at the Martin's Point Bridge site.
5.3.1 Results
Figure 5.16 presents measurements of tip resistance (qt), sleeve friction (fs), and pore
pressure (u2) with depth below mudline for (S)CPTu 101, 103, and 104. qt from the three tests
shows good correlation across the site. Each profile starts close to 2,500 psf at the top of the
Presumpscot layer and increases generally linearly with depth. The small, high frequency
fluctuations observed in the tip resistance profiles are attributed to the influence of the silt and
sand that provide more non-uniform frictional resistance.
The dramatic increase in qt at shallow depths from profile SCPTu 101 is from penetration
through stiffer marine alluvium. For SCPTu 103 and CPT 104, casing was installed through this
alluvium layer, eliminating the penetration record through this material. Data show that qt in the
top 18 ft of SCPTu 103 is lower than qt from the other two profiles. Sediment information from
boring BB-FPPR-308, closest boring to SCPTu103, identifies an 18 ft thick layer of soft, silty
river bottom deposits overlying the Presumpscot clay. This is consistent with the drained behavior
observed in pore pressure measurements. The magnitude of tip resistance measured from all three
(S)CPTu soundings at Martin's Point Bridge is higher than “typical” soft clay.
Sounding Total Depth (ft) Northing (m) Easting (m) # Vs ReadingsDepth Extent of
Presumpcot Clay (ft)
SCPTu 101 72.8 4838577.697 399790.400 20 6.3 - 52.0
SCPTu 103 81.4 4838410.743 399688.482 24 21.8 - 62.5
CPTu 104 96.1 4838526.331 399758.731 - 3.0 - 64.2
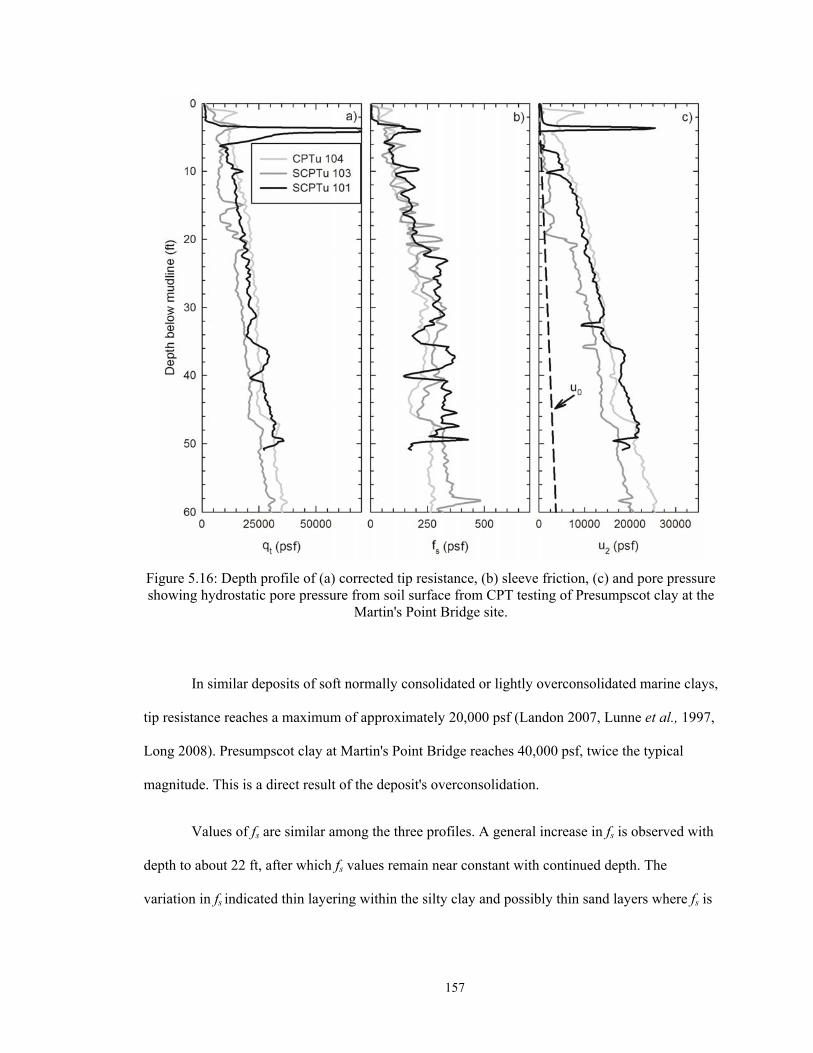
157
Figure 5.16: Depth profile of (a) corrected tip resistance, (b) sleeve friction, (c) and pore pressure showing hydrostatic pore pressure from soil surface from CPT testing of Presumpscot clay at the
Martin's Point Bridge site.
In similar deposits of soft normally consolidated or lightly overconsolidated marine clays,
tip resistance reaches a maximum of approximately 20,000 psf (Landon 2007, Lunne et al., 1997,
Long 2008). Presumpscot clay at Martin's Point Bridge reaches 40,000 psf, twice the typical
magnitude. This is a direct result of the deposit's overconsolidation.
Values of fs are similar among the three profiles. A general increase in fs is observed with
depth to about 22 ft, after which fs values remain near constant with continued depth. The
variation in fs indicated thin layering within the silty clay and possibly thin sand layers where fs is
158
greatest. SCPTu 103 shows more variation with depth at shallow layers (less than 20 ft), while
SCPTu 101 indicates more variation at deeper depths.
fs measurements provide information about the post-shear behavior of the soil, and can
approximate the remolded undrained shear strength of soft soils. fs measured within the
subsurface at the Martin's Point Bridge site are relatively high compared to other studied
Presumpscot clay deposits (Figure 8.3). Figure 5.17 compares fs from SCPTu101 with remolded
shear strength values, su(r), obtained from in situ field vane shear tests from nearby borings and
fall cone tests from BB-FPPR-317 (see Figure 5.8 for these data).
Generally, su(r) from field vane tests represent the upper bound remolded strength in the
top 22 ft of the subsurface and the fs profile is more closely matched to su(r) from the fall cone
measurements. Between 22 ft and 32 ft, fs is more similar to field vane shear measured su(r). At
greater depths, su(r) from both field vane shear and fall cone measurements are less than fs values
from piezocone measurements. Analysis of soil classification and index parameters yields no
conclusive correlation between changing fs compared to su(r). However, the strong correlation with
remolded su at shallow depths, but poor correlation with continued depth is likely the result of
stress two affects: 1) increased stress relief disturbance in field vane shear tests as the effects of
overburden removal increases resulting in lower su(r) compared to fs; and 2) decreased level of
remolding occurring at higher geostatic stresses that results in higher measured su(r) for both field
vane shear and piezocone profiling compared to su(r) from completely remolded fall cone
specimens.
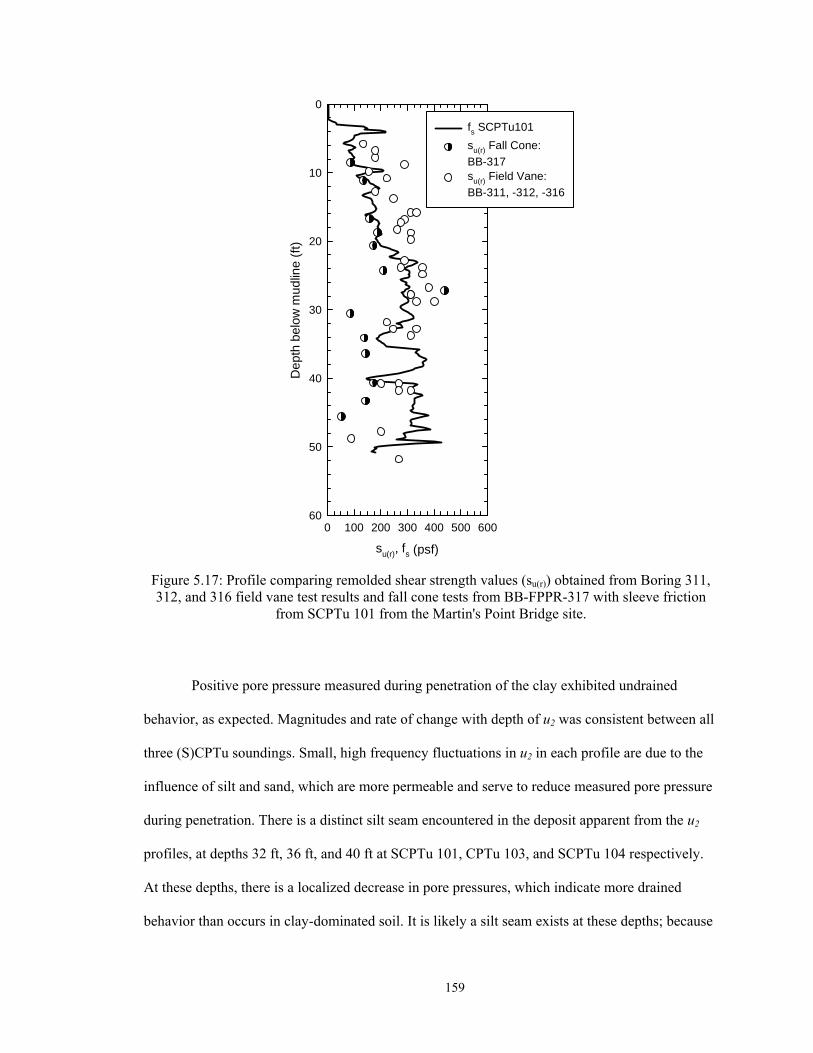
159
Figure 5.17: Profile comparing remolded shear strength values (su(r)) obtained from Boring 311, 312, and 316 field vane test results and fall cone tests from BB-FPPR-317 with sleeve friction
from SCPTu 101 from the Martin's Point Bridge site.
Positive pore pressure measured during penetration of the clay exhibited undrained
behavior, as expected. Magnitudes and rate of change with depth of u2 was consistent between all
three (S)CPTu soundings. Small, high frequency fluctuations in u2 in each profile are due to the
influence of silt and sand, which are more permeable and serve to reduce measured pore pressure
during penetration. There is a distinct silt seam encountered in the deposit apparent from the u2
profiles, at depths 32 ft, 36 ft, and 40 ft at SCPTu 101, CPTu 103, and SCPTu 104 respectively.
At these depths, there is a localized decrease in pore pressures, which indicate more drained
behavior than occurs in clay-dominated soil. It is likely a silt seam exists at these depths; because
su(r), fs (psf)
0 100 200 300 400 500 600
Dep
th b
elow
mud
line
(ft)
0
10
20
30
40
50
60
fs SCPTu101
su(r) Fall Cone:
BB-317su(r) Field Vane:
BB-311, -312, -316
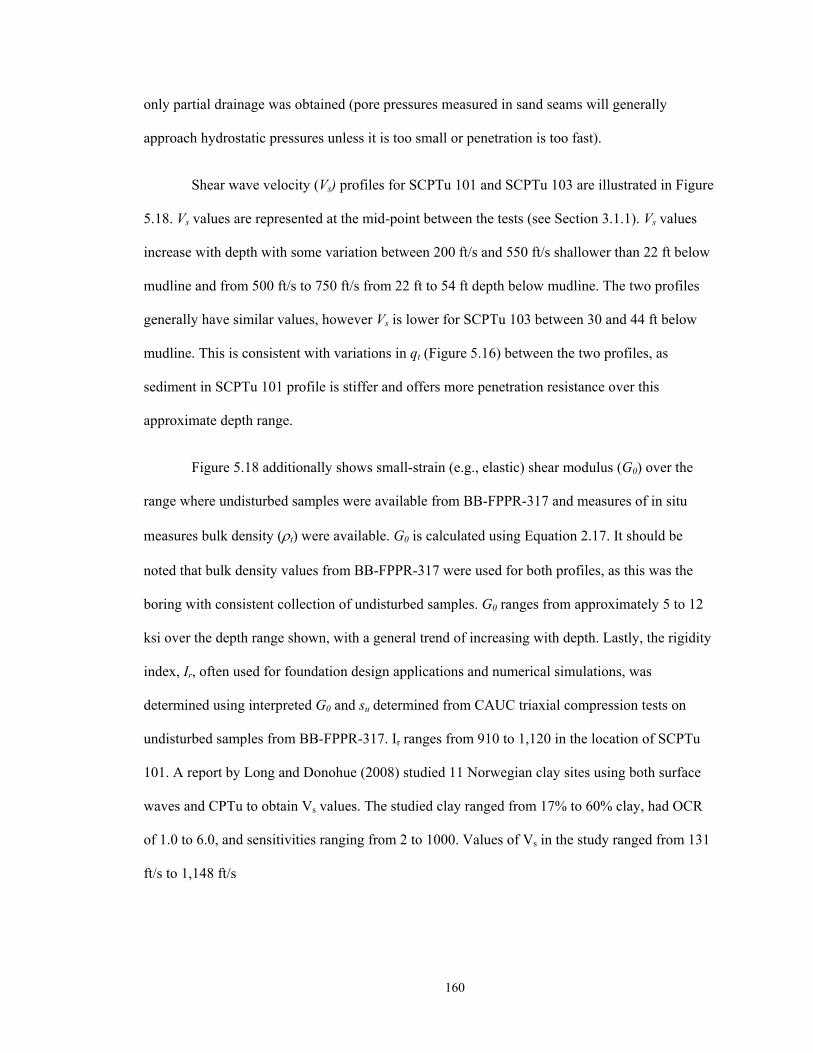
160
only partial drainage was obtained (pore pressures measured in sand seams will generally
approach hydrostatic pressures unless it is too small or penetration is too fast).
Shear wave velocity (Vs) profiles for SCPTu 101 and SCPTu 103 are illustrated in Figure
5.18. Vs values are represented at the mid-point between the tests (see Section 3.1.1). Vs values
increase with depth with some variation between 200 ft/s and 550 ft/s shallower than 22 ft below
mudline and from 500 ft/s to 750 ft/s from 22 ft to 54 ft depth below mudline. The two profiles
generally have similar values, however Vs is lower for SCPTu 103 between 30 and 44 ft below
mudline. This is consistent with variations in qt (Figure 5.16) between the two profiles, as
sediment in SCPTu 101 profile is stiffer and offers more penetration resistance over this
approximate depth range.
Figure 5.18 additionally shows small-strain (e.g., elastic) shear modulus (G0) over the
range where undisturbed samples were available from BB-FPPR-317 and measures of in situ
measures bulk density (t) were available. G0 is calculated using Equation 2.17. It should be
noted that bulk density values from BB-FPPR-317 were used for both profiles, as this was the
boring with consistent collection of undisturbed samples. G0 ranges from approximately 5 to 12
ksi over the depth range shown, with a general trend of increasing with depth. Lastly, the rigidity
index, Ir, often used for foundation design applications and numerical simulations, was
determined using interpreted G0 and su determined from CAUC triaxial compression tests on
undisturbed samples from BB-FPPR-317. Ir ranges from 910 to 1,120 in the location of SCPTu
101. A report by Long and Donohue (2008) studied 11 Norwegian clay sites using both surface
waves and CPTu to obtain Vs values. The studied clay ranged from 17% to 60% clay, had OCR
of 1.0 to 6.0, and sensitivities ranging from 2 to 1000. Values of Vs in the study ranged from 131
ft/s to 1,148 ft/s

161
Figure 5.18: Depth profile of a) shear wave velocity (Vs), b) small strain shear modulus (G0) and Rigidity index (Ir) for SCPTu101 and 103 conducted at the Martin's Point Bridge site.
5.3.2 Correlation to Classification
Empirical charts have been proposed by Robertson (1990), Schneider et al. (2008), and
Robertson (2009) to classify soils based on CPTu measurements (Section 2.3.1). The proposed
charts plot normalized tip resistance (Qt) versus sleeve friction ratio (Fr) or normalized pore
pressure (Bq) and place the resulting data point into a region which has a corresponding soil type
deemed the “Soil Behavior Type” or SBT. The SBT regions were developed based on observed
Qt, Fr, and Bq measurements taken in specific types of soils. Normalized values are used to
eliminate the influence of depth on measurements. Figure 5.19 displays the profiles of the three
normalized parameters Qt, Fr, and Bq collected from SCPTu 101, 103, and 104 with depth.

162
Each of the four classification charts were evaluated for their applicability to the
Presumpscot clay at Martin's Point Bridge using Unified Soil Classification System (USCS)
results from laboratory analyses of collected soil samples and values of Qt, Fr, and Bq collected
from SCPTu 101 and CPTu 104 at corresponding depths. SCPTu 104 was not used because it is
practically identical to SCPTu 101. For three of the charts (Robertson 1990 and Robertson 2009;
Figure 5.20a, b, and c), there are 9 regions corresponding to Soil Behavior Types (SBT). SBT 1
“sensitive fine grained,” SBT 3 “clay to silty clay,” and SBT 4 “clayey silt to silty clay” were
considered correct classifications of the Presumpscot clay at this site based on lab data. For the
fourth chart (Schneider et al., 2008; Figure 5.20d), a different classification system is used, of
which the “clays” and “sensitive clays” regions were considered to be correct classifications of
the Presumpscot clay. Plotted data from SCPTu 101 and 104 are presented in Figure 5.20 and
Figure 5.21, respectively. Table 5.10 presents a summary of this analysis including the number of
laboratory samples tested, number of USCS classifications matching the SBT classification, and
the resulting percent effectiveness (USCS-SBT matches divided by the number of samples).
In general, the Presumpscot clay at the Martin’s Point Bridge site plotted within SBT
regions 4 and 5 using the Qt-Fr plots of Robertson (1990) and Robertson (2009), while most data
plotted in SBT region 3 (with a minor amount in SBT region 4) when using the Bq-Qt plot of
Robertson (1990). Practically all data points plotted in the “clay” region of the Schneider et al.,
(2008) plot.
Comparison of SBT and USCS classification is tabulated in Table 5.10. Soil Behavior
Type (SBT) and Unified Soil Classification System (USCS) classifications match for 100% of the
samples when SBT is determined using Qt and Bq for both the Robertson (1990) and Schneider et
al., (2008). SBT and USCS classifications based on Qt and Fr have a lower prediction correlation,
which were 90% and 79% for SCPTu 101 and CPTu 104, respectively. Bq better predicts
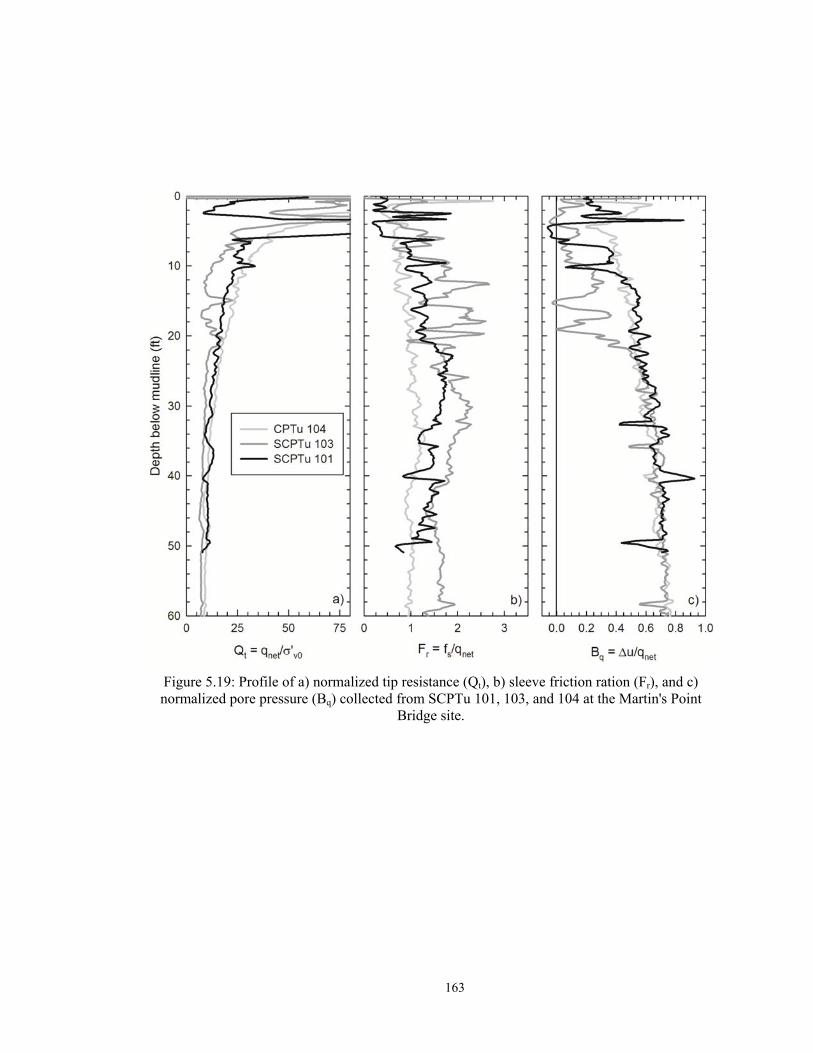
163
Figure 5.19: Profile of a) normalized tip resistance (Qt), b) sleeve friction ration (Fr), and c) normalized pore pressure (Bq) collected from SCPTu 101, 103, and 104 at the Martin's Point
Bridge site.

164
Figure 5.20: Soil classification results comparing laboratory-determined USCS classification to classification charts using a) Qt vs. Fr (Robertson 1990), b) Qt vs. Bq (Robertson 1990), c) Qt vs.
Fr (Robertson 2009), d) Qt vs. Bq (Schneider et al., 2008) from SCPTu 101 conducted at the Martin's Point Bridge site.
165
Figure 5.21: Soil classification results comparing laboratory-determined USCS classification to classification charts using a) Qt vs. Fr (Robertson 1990), b) Qt vs. Bq (Robertson 1990), c) Qt vs.
Fr (Robertson 2009), d) Qt vs. Bq (Schneider et al., 2008) from CPTu 104 conducted at the Martin's Point Bridge site.
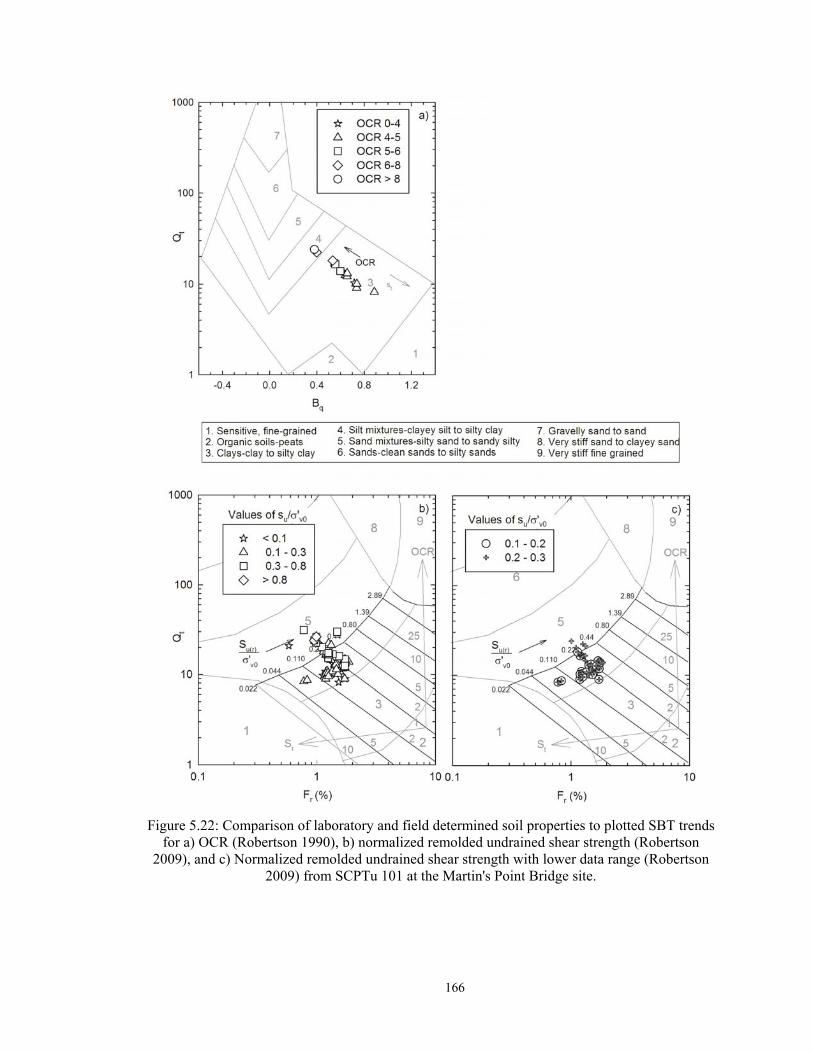
166
Figure 5.22: Comparison of laboratory and field determined soil properties to plotted SBT trends for a) OCR (Robertson 1990), b) normalized remolded undrained shear strength (Robertson
2009), and c) Normalized remolded undrained shear strength with lower data range (Robertson 2009) from SCPTu 101 at the Martin's Point Bridge site.
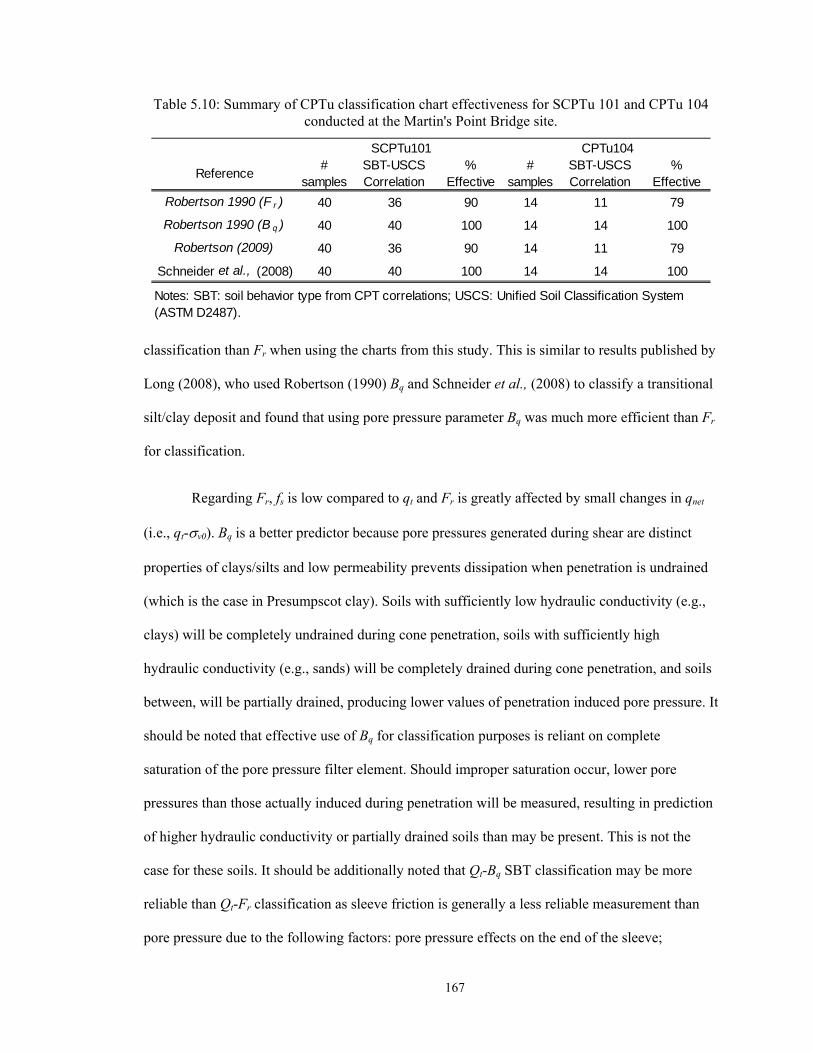
167
Table 5.10: Summary of CPTu classification chart effectiveness for SCPTu 101 and CPTu 104 conducted at the Martin's Point Bridge site.
classification than Fr when using the charts from this study. This is similar to results published by
Long (2008), who used Robertson (1990) Bq and Schneider et al., (2008) to classify a transitional
silt/clay deposit and found that using pore pressure parameter Bq was much more efficient than Fr
for classification.
Regarding Fr, fs is low compared to qt and Fr is greatly affected by small changes in qnet
(i.e., qt-v0). Bq is a better predictor because pore pressures generated during shear are distinct
properties of clays/silts and low permeability prevents dissipation when penetration is undrained
(which is the case in Presumpscot clay). Soils with sufficiently low hydraulic conductivity (e.g.,
clays) will be completely undrained during cone penetration, soils with sufficiently high
hydraulic conductivity (e.g., sands) will be completely drained during cone penetration, and soils
between, will be partially drained, producing lower values of penetration induced pore pressure. It
should be noted that effective use of Bq for classification purposes is reliant on complete
saturation of the pore pressure filter element. Should improper saturation occur, lower pore
pressures than those actually induced during penetration will be measured, resulting in prediction
of higher hydraulic conductivity or partially drained soils than may be present. This is not the
case for these soils. It should be additionally noted that Qt-Bq SBT classification may be more
reliable than Qt-Fr classification as sleeve friction is generally a less reliable measurement than
pore pressure due to the following factors: pore pressure effects on the end of the sleeve;
Reference#
samplesSBT-USCS Correlation
% Effective
# samples
SBT-USCS Correlation
% Effective
Robertson 1990 (F r ) 40 36 90 14 11 79
Robertson 1990 (B q ) 40 40 100 14 14 100
Robertson (2009) 40 36 90 14 11 79
Schneider et al., (2008) 40 40 100 14 14 100
SCPTu101 CPTu104
Notes: SBT: soil behavior type from CPT correlations; USCS: Unified Soil Classification System (ASTM D2487).
168
tolerance in dimensions between the cone and the sleeve; surface roughness of the sleeve; load
cell design and calibration (Lunne et al., 2006).
SBT charts from Robertson (1990, 2009) additionally provide information for using Qt,
Fr, and Bq to predict changes in overconsolidation (OCR), values of remolded su normalized by in
situ effective stress (su(r)/'v0), and sensitivity (St). Review of SCPTu 101 data plotted in Figure
5.22 shows a significant number of data points plotting in the central normally consolidated
region; however laboratory data from Boring BB-FPPR-317 indicate the Presumpscot is
overconsolidated with OCR values ranging from 10.4 to 3.1 within the layer. Thus, this aspect of
SBT chart is not reliable for the Presumpscot at this site. Figure 5.22a indicated that Qt vs. Bq may
be used to indicate the relative level of overconsolidation over the depth of a deposit. Data are
plotted by OCR grouping. Higher OCR soils have higher Qt and lower Bq values. Figure 5.22a
was additionally used to analyze for trends in sensitivity, St, for the Presumpscot (data not
shown), however a trend was not found for the soils at this site.
Figure 5.22b and Figure 5.22c show Qt vs. Fr data for SCPTu 101 categorically separated
by su(r)/'v0 measured from field vane shear testing (FVT) and fall cone testing on samples from
Shelby tubes. While SCPTu 101 data predicts su(r)/'v0 values ranging from 0.11 to 0.35,
measured su(r)/'v0 values from in situ and laboratory testing ranges from less than 0.1 to greater
than 0.8. Larger values are from in situ testing where complete remolding of specimens was
likely incomplete (the standard is 10 rotations of the shear vane between tests to disturb the
sheared zone). Review of fall cone data (Figure 5.12) indicates completely remolded specimens
yield su(r)/'v0 values of 0.02 to 0.06 for deeper soil and 0.17 and 0.32 for shallower soil.
Completely remolded su(r)/'v0 values are generally less than those predicted by Figure 5.22c by
SCPTu101 Qt and Fr data. In summary, it appears as though su(r)/'v0 can be loosely estimated
using plots of Qt vs. Fr, and these values may potentially more clustered than su(r)/'v0 derived

169
from field vane shear tests. Remolded undrained shear strength of the Presumpscot clay measured
by SCPTu 101 and field vane tests are higher than fall cone data due to the in situ horizontal and
vertical confining pressure on the specimen during the in situ tests.
5.3.3 Correlations to Stress History
CPTu sounding data of the Presumpscot clay data were correlated to measured stress
history of the site using the k-value correlation method outlined in Section 2.3.2. Using Equation
2.7, k-value was back-calculated using preconsolidation pressure ('p) determined from CRS
testing (Section 3.4.3) of laboratory specimens and qnet assessed from the CPTu soundings at the
corresponding sample depths. Figure 5.23 presents the k-values determined for the Presumpscot
clay at Martin's Point Bridge along with the estimated 'p profile using determined k-values
applied to SCPTu 101 (the closest sounding to the collected samples).
In Figure 5.23, each symbol represents a k-value back calculated from one of the CPTu
soundings. Each grouping of symbols at a common depth correspond to a single 'p , with a qnet
value taken from one of the CPTu soundings to solve for the k-value. The range of values in the
grouping represents the difference in qnet between the soundings. Presumpscot clay was not
encountered in SCPTu 103 until 22 ft depth, therefore the k-value was not calculated above 22 ft.
The vertical dotted lines at values of 0.20 and 0.50 represent the “typical” range of values
for clays (Lunne et al., 1997). In Figure 5.23b, the average, minimum, and maximum k-values
from SCPTu 101 were applied to the entire profile of qnet from SCPTu 101 and compared to the
laboratory-determined 'p.
The resulting k-values from the three soundings at Martin's Point Bridge ranged from
0.25 to 0.59 with average values of 0.38, 0.53, and 0.35 for SCPTu 101, 103 and 104,
respectively. With the exception of the k-value of 0.53 for SCPTu 101 calculated at 34 ft, all k-
values for SCPTu 101 and 104 remained within the proposed range of 0.20 to 0.50 given by
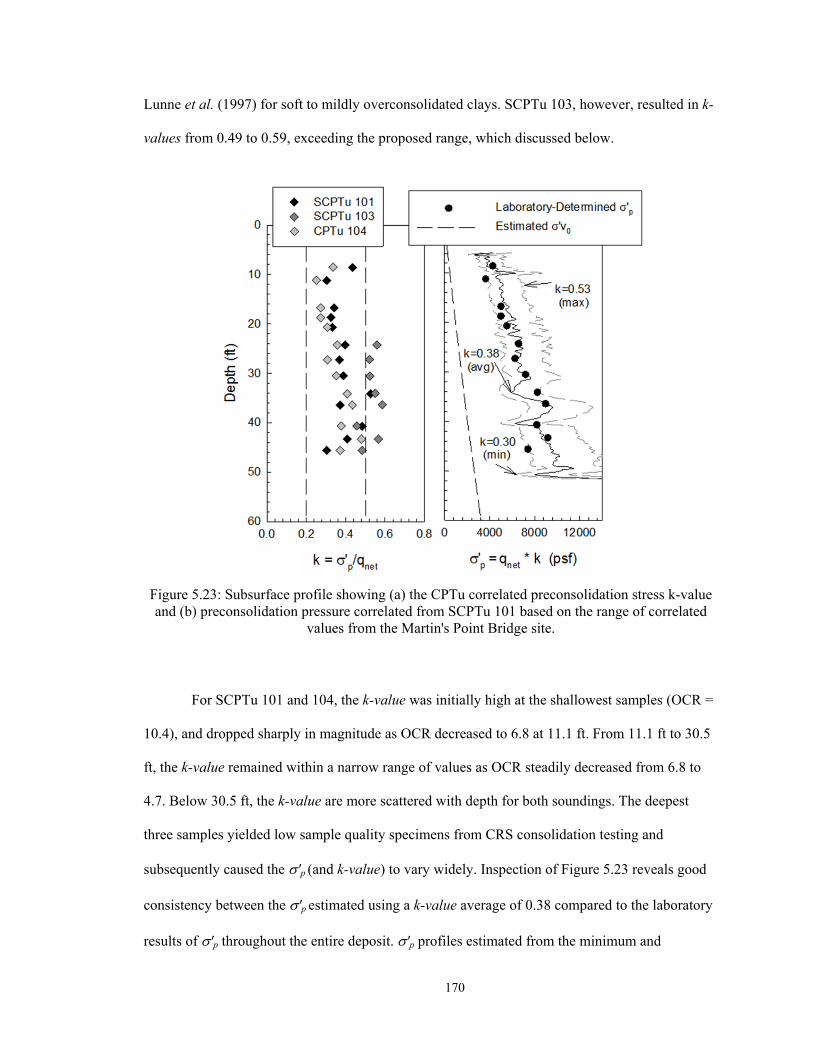
170
Lunne et al. (1997) for soft to mildly overconsolidated clays. SCPTu 103, however, resulted in k-
values from 0.49 to 0.59, exceeding the proposed range, which discussed below.
Figure 5.23: Subsurface profile showing (a) the CPTu correlated preconsolidation stress k-value and (b) preconsolidation pressure correlated from SCPTu 101 based on the range of correlated
values from the Martin's Point Bridge site.
For SCPTu 101 and 104, the k-value was initially high at the shallowest samples (OCR =
10.4), and dropped sharply in magnitude as OCR decreased to 6.8 at 11.1 ft. From 11.1 ft to 30.5
ft, the k-value remained within a narrow range of values as OCR steadily decreased from 6.8 to
4.7. Below 30.5 ft, the k-value are more scattered with depth for both soundings. The deepest
three samples yielded low sample quality specimens from CRS consolidation testing and
subsequently caused the 'p (and k-value) to vary widely. Inspection of Figure 5.23 reveals good
consistency between the 'p estimated using a k-value average of 0.38 compared to the laboratory
results of 'p throughout the entire deposit. 'p profiles estimated from the minimum and
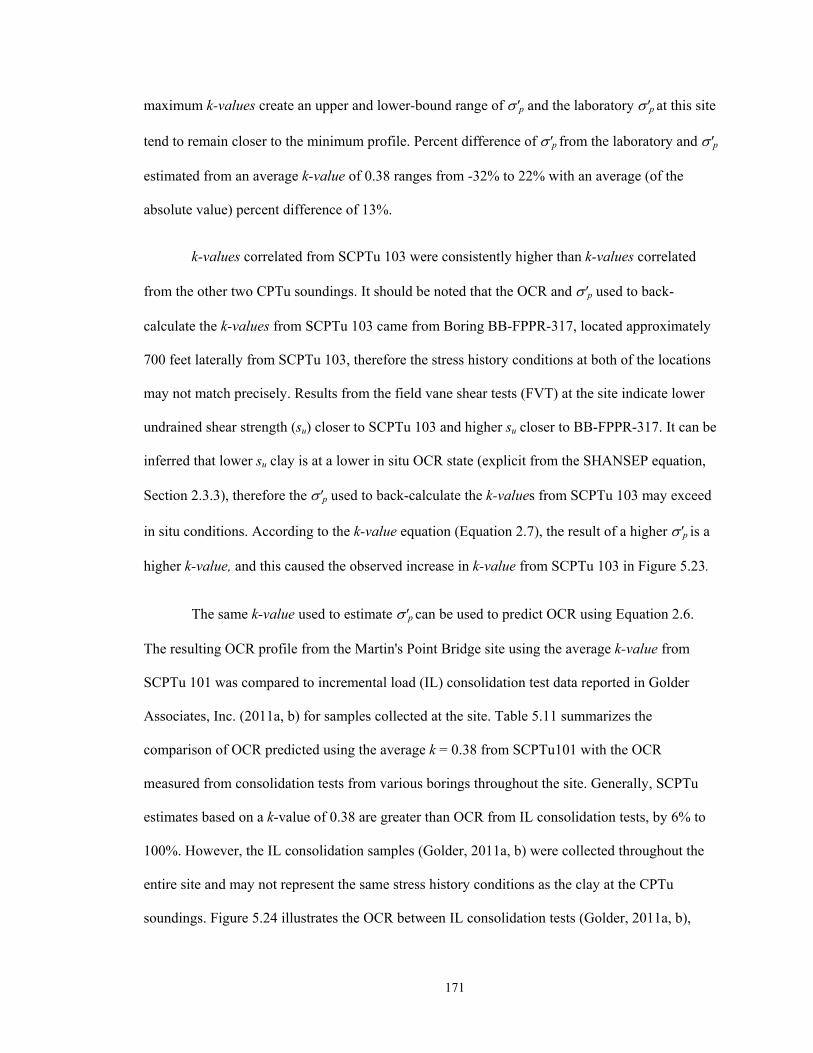
171
maximum k-values create an upper and lower-bound range of 'p and the laboratory 'p at this site
tend to remain closer to the minimum profile. Percent difference of 'p from the laboratory and 'p
estimated from an average k-value of 0.38 ranges from -32% to 22% with an average (of the
absolute value) percent difference of 13%.
k-values correlated from SCPTu 103 were consistently higher than k-values correlated
from the other two CPTu soundings. It should be noted that the OCR and 'p used to back-
calculate the k-values from SCPTu 103 came from Boring BB-FPPR-317, located approximately
700 feet laterally from SCPTu 103, therefore the stress history conditions at both of the locations
may not match precisely. Results from the field vane shear tests (FVT) at the site indicate lower
undrained shear strength (su) closer to SCPTu 103 and higher su closer to BB-FPPR-317. It can be
inferred that lower su clay is at a lower in situ OCR state (explicit from the SHANSEP equation,
Section 2.3.3), therefore the 'p used to back-calculate the k-values from SCPTu 103 may exceed
in situ conditions. According to the k-value equation (Equation 2.7), the result of a higher 'p is a
higher k-value, and this caused the observed increase in k-value from SCPTu 103 in Figure 5.23.
The same k-value used to estimate 'p can be used to predict OCR using Equation 2.6.
The resulting OCR profile from the Martin's Point Bridge site using the average k-value from
SCPTu 101 was compared to incremental load (IL) consolidation test data reported in Golder
Associates, Inc. (2011a, b) for samples collected at the site. Table 5.11 summarizes the
comparison of OCR predicted using the average k = 0.38 from SCPTu101 with the OCR
measured from consolidation tests from various borings throughout the site. Generally, SCPTu
estimates based on a k-value of 0.38 are greater than OCR from IL consolidation tests, by 6% to
100%. However, the IL consolidation samples (Golder, 2011a, b) were collected throughout the
entire site and may not represent the same stress history conditions as the clay at the CPTu
soundings. Figure 5.24 illustrates the OCR between IL consolidation tests (Golder, 2011a, b),
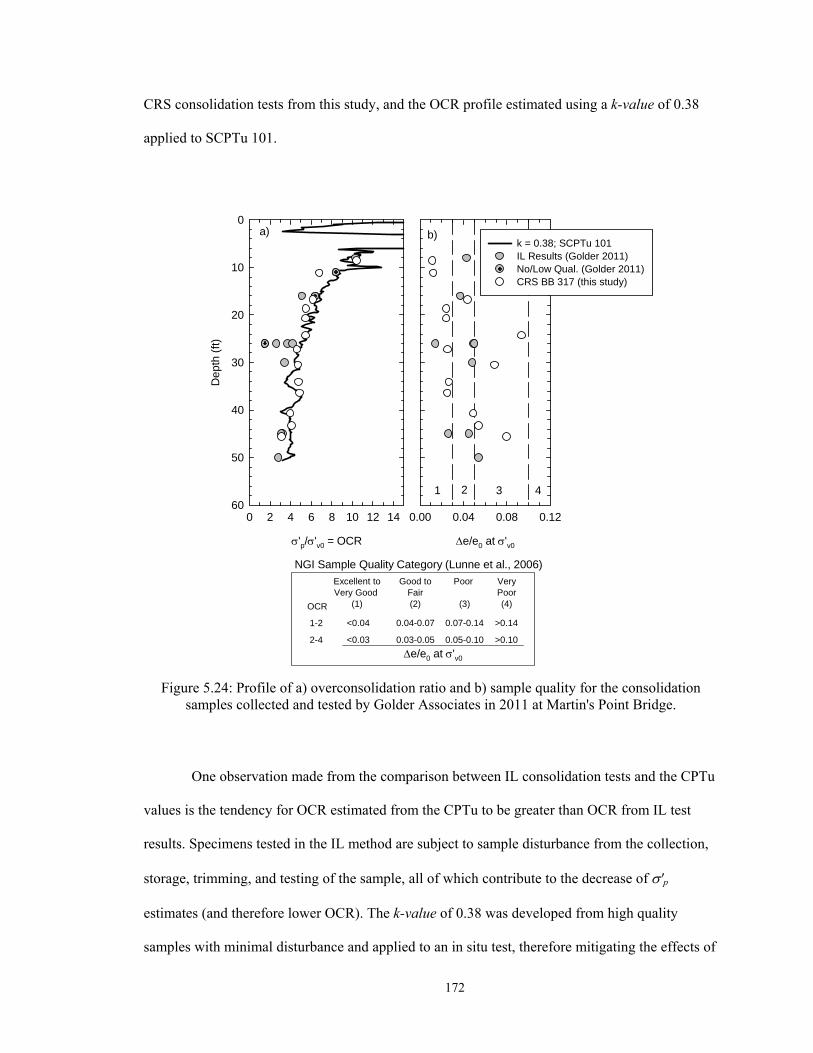
172
CRS consolidation tests from this study, and the OCR profile estimated using a k-value of 0.38
applied to SCPTu 101.
Figure 5.24: Profile of a) overconsolidation ratio and b) sample quality for the consolidation samples collected and tested by Golder Associates in 2011 at Martin's Point Bridge.
One observation made from the comparison between IL consolidation tests and the CPTu
values is the tendency for OCR estimated from the CPTu to be greater than OCR from IL test
results. Specimens tested in the IL method are subject to sample disturbance from the collection,
storage, trimming, and testing of the sample, all of which contribute to the decrease of 'p
estimates (and therefore lower OCR). The k-value of 0.38 was developed from high quality
samples with minimal disturbance and applied to an in situ test, therefore mitigating the effects of
e/e0 at 'v0
0.00 0.04 0.08 0.12
NGI Sample Quality Category (Lunne et al., 2006)
Excellent toVery Good
(1)
Poor
(3)OCR
1-2
2-4
<0.04 0.04-0.07 0.07-0.14 >0.14
<0.03 0.03-0.05 0.05-0.10 >0.10
e/e0 at 'v0
Good toFair(2)
VeryPoor(4)
a)
1 2 3 4
b)
'p/'v0 = OCR
0 2 4 6 8 10 12 14
Dep
th (
ft)
0
10
20
30
40
50
60
k = 0.38; SCPTu 101IL Results (Golder 2011) No/Low Qual. (Golder 2011)CRS BB 317 (this study)
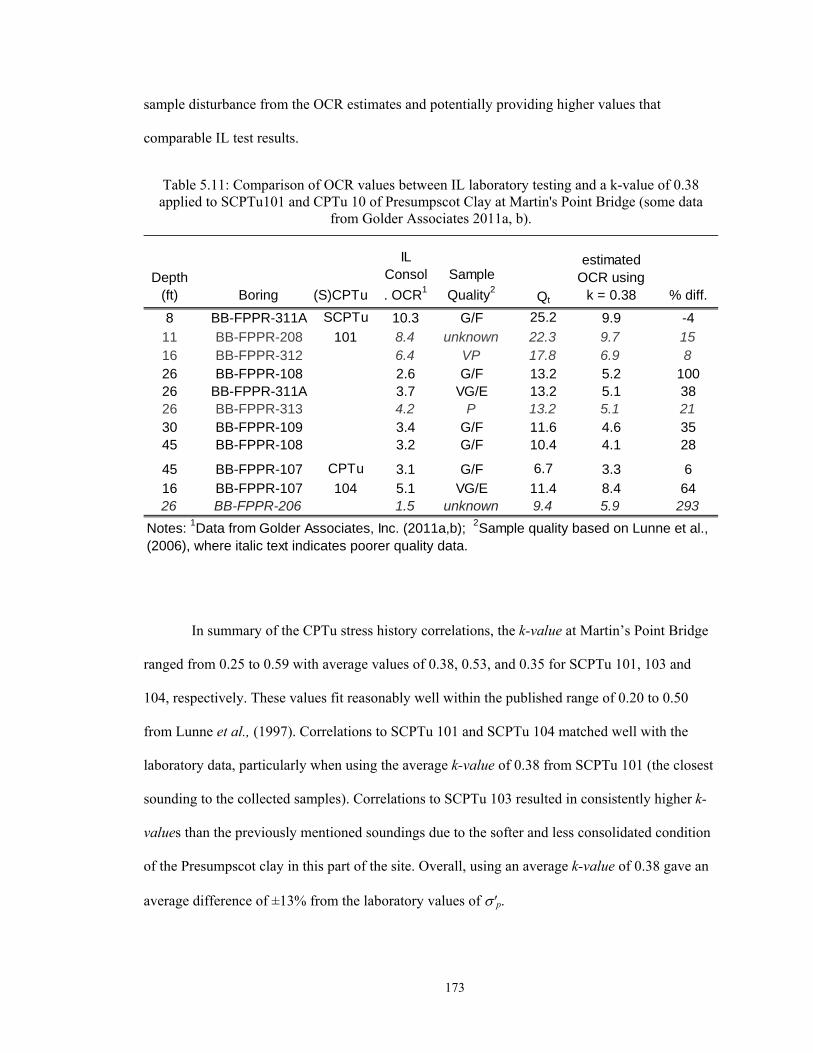
173
sample disturbance from the OCR estimates and potentially providing higher values that
comparable IL test results.
Table 5.11: Comparison of OCR values between IL laboratory testing and a k-value of 0.38 applied to SCPTu101 and CPTu 10 of Presumpscot Clay at Martin's Point Bridge (some data
from Golder Associates 2011a, b).
In summary of the CPTu stress history correlations, the k-value at Martin’s Point Bridge
ranged from 0.25 to 0.59 with average values of 0.38, 0.53, and 0.35 for SCPTu 101, 103 and
104, respectively. These values fit reasonably well within the published range of 0.20 to 0.50
from Lunne et al., (1997). Correlations to SCPTu 101 and SCPTu 104 matched well with the
laboratory data, particularly when using the average k-value of 0.38 from SCPTu 101 (the closest
sounding to the collected samples). Correlations to SCPTu 103 resulted in consistently higher k-
values than the previously mentioned soundings due to the softer and less consolidated condition
of the Presumpscot clay in this part of the site. Overall, using an average k-value of 0.38 gave an
average difference of ±13% from the laboratory values of 'p.
Depth (ft) Boring (S)CPTu
IL Consol
. OCR1
Sample
Quality2Qt
estimated OCR using
k = 0.38 % diff.
8 BB-FPPR-311A SCPTu 10.3 G/F 25.2 9.9 -411 BB-FPPR-208 101 8.4 unknown 22.3 9.7 1516 BB-FPPR-312 6.4 VP 17.8 6.9 826 BB-FPPR-108 2.6 G/F 13.2 5.2 10026 BB-FPPR-311A 3.7 VG/E 13.2 5.1 3826 BB-FPPR-313 4.2 P 13.2 5.1 2130 BB-FPPR-109 3.4 G/F 11.6 4.6 3545 BB-FPPR-108 3.2 G/F 10.4 4.1 28
45 BB-FPPR-107 CPTu 3.1 G/F 6.7 3.3 616 BB-FPPR-107 104 5.1 VG/E 11.4 8.4 6426 BB-FPPR-206 1.5 unknown 9.4 5.9 293
Notes: 1Data from Golder Associates, Inc. (2011a,b); 2Sample quality based on Lunne et al., (2006), where italic text indicates poorer quality data.
174
5.3.4 Correlations to Undrained Shear Strength
Undrained shear strength (su) of clay can be estimated from CPTu results using empirical
cone factors Nkt, Nke, and Nu (Equations 2.9 through 2.11). Section 2.3.3 outlines the
methodology used to obtain the three empirical coefficients. Nkt is derived from tip resistance (qt),
Nke is derived from qt and pore pressure measurements (u2) , and Nu is derived from u2. These
empirical coefficients were determined for the Presumpscot clay at the Martin's Point Bridge site
using su from laboratory CAUC triaxial shear testing and field vane shear testing (FVT) results.
Figure 5.25 presents the CPTu undrained shear strength factors Nkt(CAUC), Nke(CAUC), and
Nu(CAUC) calculated from SCPTu 101, 103, and 104 data where each symbol represents an
Nkt(CAUC), Nke(CAUC), or Nu(CAUC) value back-calculated from one of the CPTu soundings using the su
measured from the CAUC triaxial testing from BB-FPPR-317 at the corresponding depth. SCPTu
101 was the closest sounding to Boring BB-FPPR-317. CPTu 103 and SCPTu 104 were
conducted 692 ft and 205 ft away from Boring BB-FPPR-317, respectively. Nkt(CAUC), Nke(CAUC),
and Nu(CAUC) values are not reported for SCPTu 103 above 22 ft because Presumpscot clay was
not encountered during the sounding until this depth. Table 5.12 presents the Nkt(CAUC) and
Nu(CAUC) values correlated at the Martin’s Point Bridge site from all three soundings.
Nkt(CAUC) for the three profiles ranged from 9.3 to 22.1 with average values of values of
15.9 (SCPTu 101), 11.5 (SCPTu 103) and 17.6 (CPTu 104). Lunne et al., provides a general
range of values for Nkt between 10 and 20, illustrating that the ranges from Martin’s Point Bridge
fit in well with published data. Coefficients of variations for Nkt(CAUC) of the three soundings are
0.16, 0.10, and 0.18 for SCPTu 101, 103, and, 104 respectively. Nke(CAUC) ranged from 2.6 to 13.3
with average values of values of 7.4 (SCPTu 101), 5.5 (SCPTu 103) and 9.08 (CPTu 104).
Typical values of Nke range between 6 and 12 and average of 9 (Lunne et al., 1997). Coefficients
of variations for Nke(CAUC) of the three soundings are 0.31, 0.09, and 0.26 for SCPTu-101, 103,
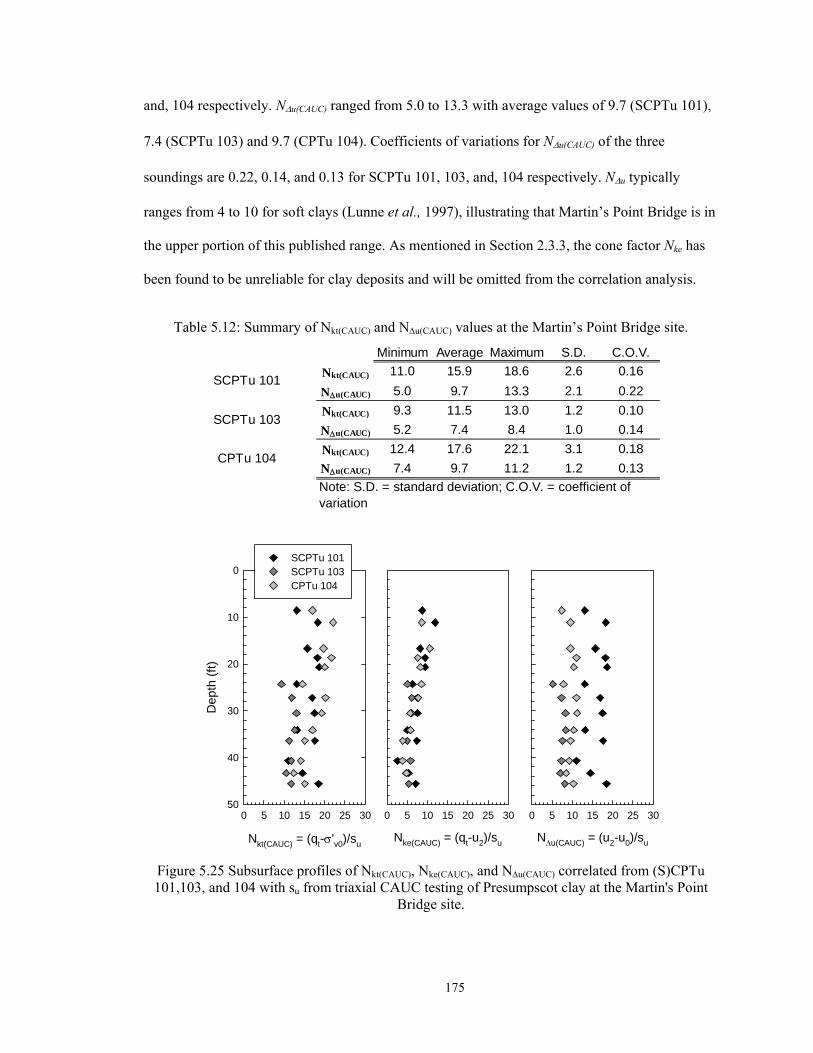
175
and, 104 respectively. Nu(CAUC) ranged from 5.0 to 13.3 with average values of 9.7 (SCPTu 101),
7.4 (SCPTu 103) and 9.7 (CPTu 104). Coefficients of variations for Nu(CAUC) of the three
soundings are 0.22, 0.14, and 0.13 for SCPTu 101, 103, and, 104 respectively. Nu typically
ranges from 4 to 10 for soft clays (Lunne et al., 1997), illustrating that Martin’s Point Bridge is in
the upper portion of this published range. As mentioned in Section 2.3.3, the cone factor Nke has
been found to be unreliable for clay deposits and will be omitted from the correlation analysis.
Table 5.12: Summary of Nkt(CAUC) and Nu(CAUC) values at the Martin’s Point Bridge site.
Figure 5.25 Subsurface profiles of Nkt(CAUC), Nke(CAUC), and Nu(CAUC) correlated from (S)CPTu 101,103, and 104 with su from triaxial CAUC testing of Presumpscot clay at the Martin's Point
Bridge site.
Minimum Average Maximum S.D. C.O.V.
Nkt(CAUC) 11.0 15.9 18.6 2.6 0.16
Nu(CAUC) 5.0 9.7 13.3 2.1 0.22
Nkt(CAUC) 9.3 11.5 13.0 1.2 0.10
Nu(CAUC) 5.2 7.4 8.4 1.0 0.14
Nkt(CAUC) 12.4 17.6 22.1 3.1 0.18
Nu(CAUC) 7.4 9.7 11.2 1.2 0.13CPTu 104
Note: S.D. = standard deviation; C.O.V. = coefficient of variation
SCPTu 101
SCPTu 103
Nke(CAUC) = (qt-u2)/su
0 5 10 15 20 25 30
Nu(CAUC) = (u2-u0)/su
0 5 10 15 20 25 30
Nkt(CAUC) = (qt-'v0)/su
0 5 10 15 20 25 30
Dep
th (
ft)
0
10
20
30
40
50
SCPTu 101SCPTu 103CPTu 104
176
Nkt(CAUC) values from SCPTu 101 ranged between 11.0 and 18.6 throughout the entire
profile. Nkt(CAUC) values from SCPTu 101 vary around a consistent value of approximately 18.0
with depth with occasional decreases in magnitude. These localized decreases were compared to
the laboratory testing results of index, consolidation properties, and undrained shear strength
properties of samples at these depths, along with the entire profile of the sounding in attempt to
identify the cause (or causes) of the decreases. The following factors were identified to cause the
decreases in magnitude of Nkt(CAUC) from SCPTu 101 seen throughout the profile at localized
depths:
Nkt(CAUC) of 13.1 at 24 ft depth is due to the unusually high su determined from
laboratory CAUC testing (see Figure 5.11). It is unclear what caused the high su,
however it is possible that the Presumpscot clay at this depth experienced a
change in geologic depositional setting and may have been exposed to stresses
which stiffened and strengthened the clay, which is consistent with the higher
preconsolidation pressure determined at this depth.
Nkt(CAUC) of 13.2 and 11.0 at depths 34.1 and 40.7 ft, respectively, were both
caused by localized decreases in corrected tip resistance (qt) at these depths
evident in Figure 5.16. The decreases in qt indicate a softer seam of clay (less
resistance to penetration), and would intuitively be accompanied by a decrease in
su, which does not occur in the CAUC results, therefore the Nkt(CAUC) values
decrease.
Further analysis of the Nkt(CAUC) and Nu(CAUC) factors from all three soundings yielded a
pattern of consistent values between SCPTu 101 and 104, where Nkt(CAUC) and Nu(CAUC) values
from SCPTu 103 are generally lower than both of the other soundings throughout the entire
profile, with the exception of Nkt(CAUC) at 40.7 ft being 11.7 for SCPTu 104 and 11.0 for SCPTu
101. The lower calculated values for SCPTu 103, which subsequently estimates a higher su,

177
matches the conclusion presented in the previous stress history analysis (Section 5.3.3) where the
Presumpscot clay at the location of SCPTu 103 is less consolidated and weaker in undrained
shear than the clay at the location of the other soundings. In result, the su used to correlated the
Nkt(CAUC) and Nu(CAUC) factors is high compared to the in situ strength, and therefore causes the
ratio of tip resistance or pore pressure to su (i.e. Nkt(CAUC) and Nu(CAUC)) to be reduced, hence lower
values.
Figure 5.26 presents estimated su profiles using the resulting average, minimum, and
maximum Nkt(CAUC) and Nu(CAUC) values from SCPTu 101 compared to the laboratory-determined
su.
Figure 5.26: Profile of undrained shear strength of Presumpscot clay at Martin's Point Bridge using empirical cone factors Nkt(CAUC) and Nu(CAUC) applied to SCPTu 101.
su (psf)
0 1000 2000 3000
Dep
th (
ft)
0
10
20
30
40
50
BB-FPPR-317 CAUC
Nkt = 15.9
(Avg)
Nkt = 11.0
(min)
Nkt = 18.6
(max)
su (psf)
0 1000 2000 3000 4000
Nu = 5.0
(min)
Nu = 9.7
(avg)Nu = 13.3
(max)
178
For both profiles, the average Nkt(CAUC) or Nu(CAUC) predicted slightly higher su than the
maximum value. Conversely, the minimum Nkt(CAUC) or Nu(CAUC) values overestimated su profiles
using CPTu data. This illustrates the importance of selecting an appropriate Nkt(CAUC) and Nu(CAUC)
to apply to a particular sounding.
Figure 5.27 presents values of Nkt(FVT), Nke(FVT), and Nu(FVT) with depth using field vane
shear testing (FVT) su results paired with measurements from SCPTu 101. SCPTu 101 was
chosen because it was the closest SCPTu sounding to the conducted FVT. Refer to Table 5.13 for
distances between the FVT borings and SCPTu 101. FVT borings BB-FPPR-108 and BB-FPPR-
109 were excluded from the analysis as both of the borings were conducted from the old bridge
deck and required extra lengths of rod, which in turn may have increased rod friction and
decreased su. Nkt(FVT) ranged from 8.6 to 41.0 with an average of 15.4. Nu(FVT) ranged from 0.4 to
18.0 with an average value of 8.3. Coefficient of variation (COV) ranged from 0.16 to 0.50 for
Nkt(FVT) and from 0.22 to 0.48 for Nu(FVT). A summary of these values is presented in Table 5.14.
Above 12 ft depth, Nkt(FVT) is variable, ranging from 8.3 to 21.6, whereas Nu(FVT) remained within
a narrow range of values between approximately 7.0 and 13.0. From 12 ft to approximately 30 ft,
both Nkt(FVT) and Nu(FVT) remained within a narrow range of values and appeared to be constant
with depth. Below 30 ft depth, Nkt(FVT) and Nu(FVT) both became scattered with depth but
illustrated an increasing trend with depth.
As expected, cone factors Nkt(FVT) and Nu(FVT) illustrated more scatter than Nkt(CAUC) and
Nu(CAUC) due to the wider range of su values from the FVT as compared to the CAUC laboratory
test (Figure 5.11). However, even with a wider range of values, the average Nkt(FVT) and Nu(FVT)
yielded values similar to Nkt(CAUC) and Nu(CAUC) average values. Nkt(FVT) and Nkt(CAUC) average values
from SCPTu 101 are 15.4 and 15.9 respectively, where Nu(FVT) and Nu(CAUC) average values are
8.3 and 7.4 respectively. It appears from the comparison of both cone factors, that utilizing the

179
average value from FVT and CAUC testing results at the Martin’s Point Bridge provides similar
estimates of su profiles when applied to the SCPTu soundings. As the number of FVT increases,
the influence of outlier values and/or erroneous results from poor testing methods become less
pronounced, and the averaged su profile approaches that of the laboratory tested conditions. It
appears that the number of FVT performed at the Martin’s Point Bridge site was adequate enough
to properly correlate to Nkt and Nu values for su profiling.
Table 5.13: Distances between SCPTu 101 and field vane shear test borings of the Presumpscot clay at the Martin's Point Bridge site.
Inspection of Figure 5.26 illustrates the applicability of average Nkt and Nu to
appropriately represent su profiles at the Martin’s Point Bridge. The su profile predicted from both
the average Nkt and Nu follows the laboratory profile closely with the exception of the bottom
three tested samples in the Nu profile. Excluding these bottom three samples, su predicted from
the laboratory and the Nkt(CAUC) CPTu profiles ranges in percent difference from -16% to 20%. On
the
(S)CPTu Sounding
Corresponding Boring
Sounding to Boring Distance (ft)
BB-FPPR-108 107.2BB-FPPR-109 218.9BB-FPPR-208 205.3BB-FPPR-311 53.1
BB-FPPR-311A 60.2BB-FPPR-312 34.7BB-FPPR-313 38.8BB-FPPR-316 11.9
SCPTu 101
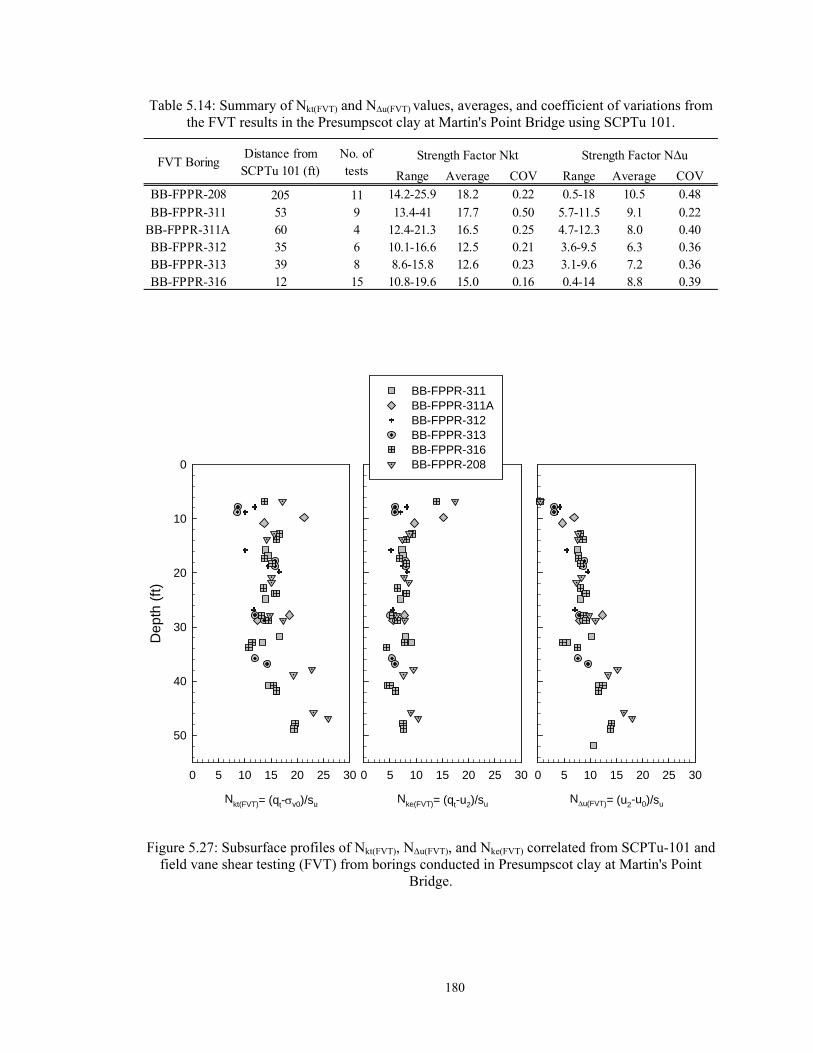
180
Table 5.14: Summary of Nkt(FVT) and Nu(FVT) values, averages, and coefficient of variations from the FVT results in the Presumpscot clay at Martin's Point Bridge using SCPTu 101.
Figure 5.27: Subsurface profiles of Nkt(FVT), Nu(FVT), and Nke(FVT) correlated from SCPTu-101 and field vane shear testing (FVT) from borings conducted in Presumpscot clay at Martin's Point
Bridge.
Range Average COV Range Average COV
BB-FPPR-208 205 11 14.2-25.9 18.2 0.22 0.5-18 10.5 0.48
BB-FPPR-311 53 9 13.4-41 17.7 0.50 5.7-11.5 9.1 0.22BB-FPPR-311A 60 4 12.4-21.3 16.5 0.25 4.7-12.3 8.0 0.40BB-FPPR-312 35 6 10.1-16.6 12.5 0.21 3.6-9.5 6.3 0.36BB-FPPR-313 39 8 8.6-15.8 12.6 0.23 3.1-9.6 7.2 0.36BB-FPPR-316 12 15 10.8-19.6 15.0 0.16 0.4-14 8.8 0.39
Strength Factor Nkt Strength Factor NuDistance from SCPTu 101 (ft)
No. of tests
FVT Boring
Nke(FVT)= (qt-u2)/su
0 5 10 15 20 25 30
Nu(FVT)= (u2-u0)/su
0 5 10 15 20 25 30
Nkt(FVT)= (qt-v0)/su
0 5 10 15 20 25 30
Dep
th (
ft)
0
10
20
30
40
50
BB-FPPR-311BB-FPPR-311ABB-FPPR-312BB-FPPR-313BB-FPPR-316BB-FPPR-208
181
other hand, Nu(CAUC) ranged from -17% to 65% (still excluding the bottom three samples) when
compared to laboratory results, generally over predicting su more than the Nkt(CAUC) cone factor. It
appears that Nkt(CAUC) value of 15.9 is the most appropriate correlation to use for su profiles
estimates using CPTu data at the Martin’s Point Bridge.
In summary, Nkt(CAUC) ranged from 9.3 to 22.1 with an average value of 15.9 (SCPTu 101)
and Nu(CAUC) ranged from 5.0 to 13.3 with an average value of 7.4 (SCPTu 101). Both cone
factors remained within published averages of values for similar testing of clays. Nkt(FVT) and
Nu(FVT) yielded a much larger scatter of values, but ultimately averaged at 15.4 and 8.3,
respectively, agreeing well with the CAUC cone factors. Nkt provided more consistent su
predictions compared to laboratory data than Nu when using the average values, therefore it
appears that utilizing an Nkt of 15.9 applied to the SCPTu profile at Martin’s Point Bridge yielded
the most effective prediction of su of the Presumpscot clay.

182
6 ROUTE 197 BRIDGE SITE
6.1 Site Overview
The Route 197 Bridge (Figure 6.1 and Figure 6.2) carries Route 197 between the towns
of Richmond and Dresden over the Kennebec River in Maine. The bridge was completed in
November of 2014, replacing the 1931 bridge. The newly constructed bridge is located
approximately 75 feet north (upstream) of the old bridge alignment. Instead of a pivoting section
to allow for watercraft passage, which is the system the old bridge used, the new bridge is built to
provide a permanent 75 foot clearance. The new bridge is supported by 6 piers spaced 240 feet
apart.
Figure 6.1: Aerial image of the Richmond Dresden Bridge site Route 197 Bridge site showing recent construction of the new bridge on the north side of the existing bridge stucture (Google
Earth, 2014)

183
Figure 6.2: Image of the new bridge during construction in the foreground with the old bridge in the background (centralmaine.com, 2014)
6.1.1 Geotechnical Investigation
Two geotechnical investigations were conducted at the Route 197 Bridge for the design
and construction of the new bridge. The first investigation was performed in November and
December of 2011 (MaineDOT, 2011). This investigation included nine test boring drilled within
the approximate proposed bridge alignment, using cased wash boring and solid stem auger
techniques. For over-water borings, a CME 45 skid rig on an anchor barge was used. During this
investigation, Presumpscot clay was encountered in Borings BB-RDKR-103, -104, and -105 near
the middle of the Kennebec River channel at the location of a proposed pier. A total of 12 Field
vane shear tests (FVT) were performed in BB-RDKR-104 at various depths within the
Presumpscot layer. Split spoon samples were also collected throughout the layer for visual
classification and index testing of the Presumpscot clay at alternating depths of the FVT.
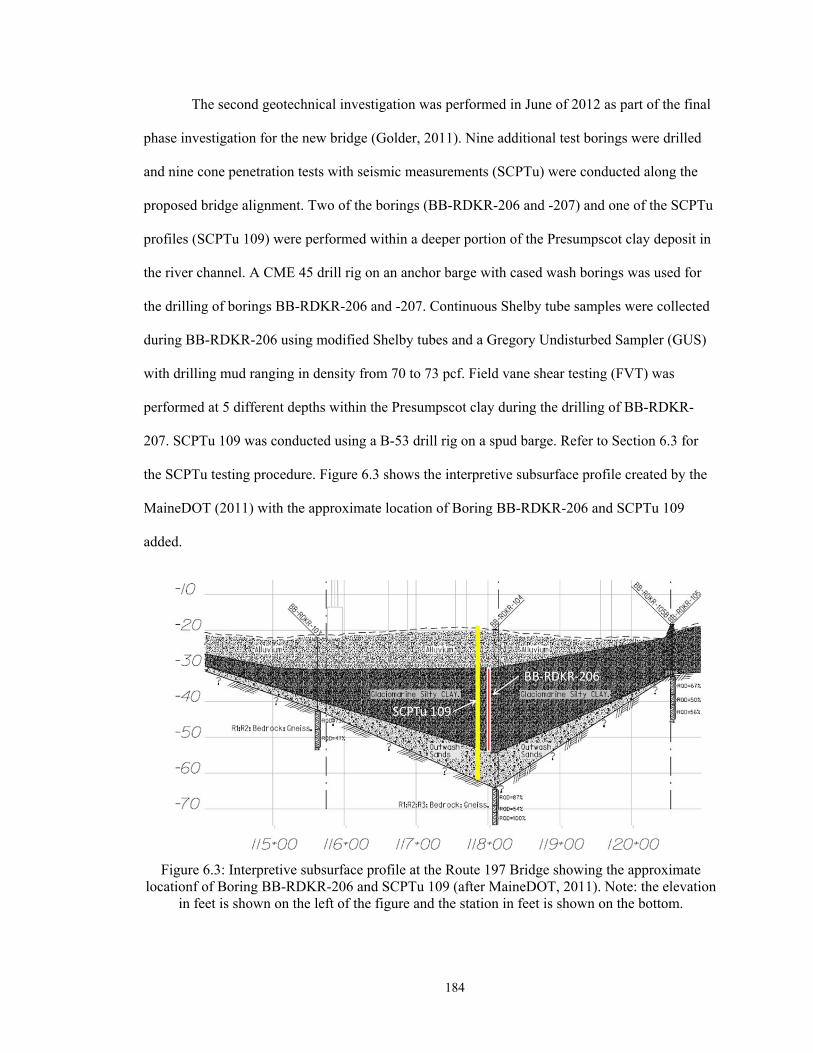
184
The second geotechnical investigation was performed in June of 2012 as part of the final
phase investigation for the new bridge (Golder, 2011). Nine additional test borings were drilled
and nine cone penetration tests with seismic measurements (SCPTu) were conducted along the
proposed bridge alignment. Two of the borings (BB-RDKR-206 and -207) and one of the SCPTu
profiles (SCPTu 109) were performed within a deeper portion of the Presumpscot clay deposit in
the river channel. A CME 45 drill rig on an anchor barge with cased wash borings was used for
the drilling of borings BB-RDKR-206 and -207. Continuous Shelby tube samples were collected
during BB-RDKR-206 using modified Shelby tubes and a Gregory Undisturbed Sampler (GUS)
with drilling mud ranging in density from 70 to 73 pcf. Field vane shear testing (FVT) was
performed at 5 different depths within the Presumpscot clay during the drilling of BB-RDKR-
207. SCPTu 109 was conducted using a B-53 drill rig on a spud barge. Refer to Section 6.3 for
the SCPTu testing procedure. Figure 6.3 shows the interpretive subsurface profile created by the
MaineDOT (2011) with the approximate location of Boring BB-RDKR-206 and SCPTu 109
added.
Figure 6.3: Interpretive subsurface profile at the Route 197 Bridge showing the approximate locationf of Boring BB-RDKR-206 and SCPTu 109 (after MaineDOT, 2011). Note: the elevation
in feet is shown on the left of the figure and the station in feet is shown on the bottom.
185
The field testing and sample collection of the Presumpscot clay at Route 197 Bridge used
in this study include the FVT results from Borings BB-RDKR-104 and -207, the modified Shelby
tubes collected during BB-RDKR-206, and SCPTu 109. The tube samples were all transported to
the UMaine Advanced Geotechnics Laboratory for the purpose of conducting testing for this
research.
6.1.2 Site Geology
The Presumpscot clay deposit at the Route 197 Bridge site is thickest in the middle of the
river channel and thins out towards each shoreline. Directly below the Presumpscot clay is a layer
of outwash sand which is atop bedrock. Overlying the Presumpscot clay is a layer of alluvial
sand.
The outwash sand and Presumpscot clay at the site was deposited on the ocean floor
during the last deglaciation of the Laurentide ice sheet as it retreated. The underlying outwash
sands were deposited before the Presumpscot clay. As the meltwater from the ice sheet
discharged into the ocean, it caused turbulence in the marine water, pushing fine-grained soils
(silt and clay) further away from the glacier margin, while the sand settled. Once the glacier
retreated further northward, the turbulence of the ocean at the location of the current Route 197
Bridge site decreased and the fine grained sediments (Presumpscot clay) were able to settle out.
The alluvial sand deposit overlying the Presumpscot clay is a postglacial deposit resulting from
soil transported by the Kennebec River.
6.2 Laboratory Characterization
Ten modified Shelby tube samples of Presumpscot clay were collected at the Route 197
Bridge site for testing at the UMaine Advanced Geotechnics Laboratory. Each tube sample was
tested for index properties (moisture content, Atterberg Limits, grain size, organic content,
specific gravity, and index undrained shear strength), consolidation properties, and undrained

186
shear strength properties. Testing methods used were in general accordance with ASTM
standards and are discussed in Chapter 3.
6.2.1 Index Test Results
Ten Shelby tube samples of Presumpscot clay were collected at the Route 197 Bridge for
testing at the UMaine Advanced Geotechnics Laboratory. Samples were collected during Boring
BB-RDKR-207 from depth 12.0 feet to 33.0 feet continuously. A sand seam was encountered
during the sampling of tube 6U which caused the samples to become disturbed, therefore the tube
sample was discarded. All collected tubes were sealed and transported back to the University of
Maine in temperature and moisture controlled storage. Figure 6.4 illustrates the portion of each
tube sample used for testing. Blank spaces in the figure indicate specimens which became
disturbed upon extraction and were not tested or specimens which were tested but later
superseded by a higher quality specimen from the same tube.
Natural water content, Atterberg Limits (liquid limit, LL; plastic limit, PL; plasticity
index, PI; and liquidity index, LI), and Activity (the ratio of plasticity index to the % grain size
finer than 0.002 mm, or clay fraction) values are summarized in Table 6.1. Grain size, organic
content, total, dry, and solids unit weights, and Unified Soil Classification System (USCS)
designations are tabulated in Table 6.2. All index testing results are presented with depth in
Figure 6.5.
Water content ranges from 42.3% at 14 ft to 26.7% at 33 ft and generally decreases with
depth. Plastic limit is consistent with depth throughout the deposit, ranging between 17 and 22
above 30 feet. Below 30 ft, increasing sand content (particularly the sand seams, which are
identified by the CPTu results in Figure 4.10) results in decreases in plasticity. The deepest
sample, 11U, could not be tested for Atterberg Limits because the sand content was too high and
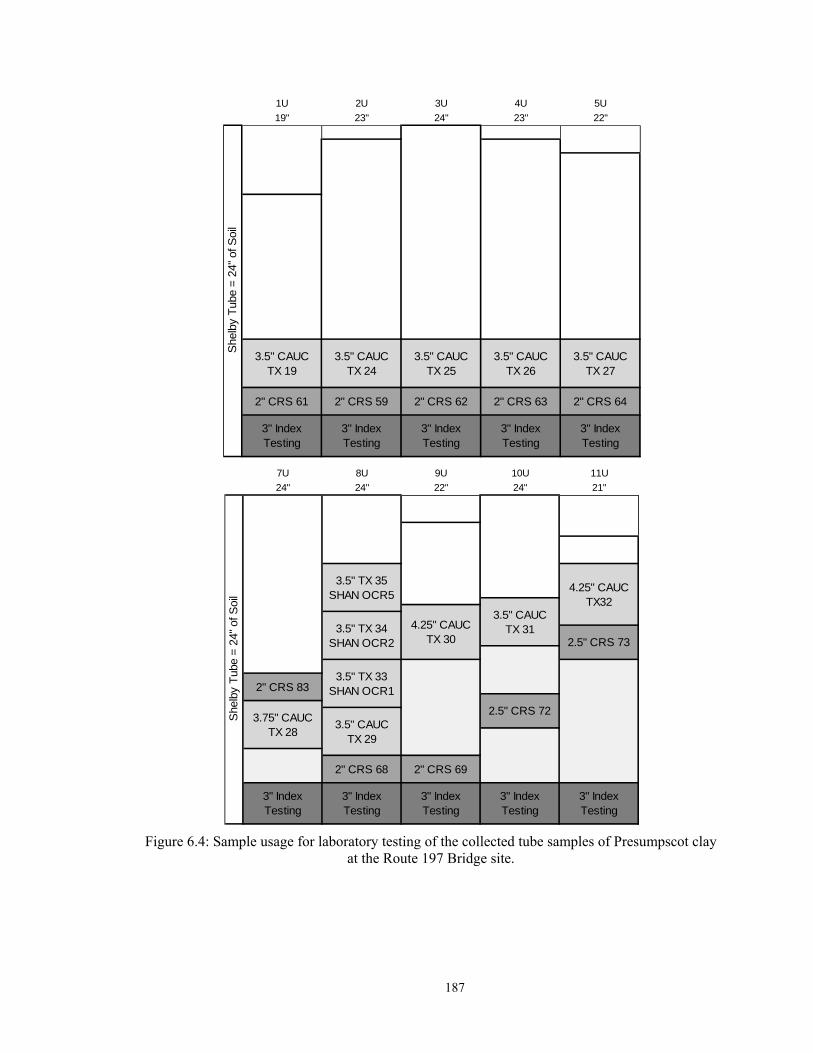
187
Figure 6.4: Sample usage for laboratory testing of the collected tube samples of Presumpscot clay at the Route 197 Bridge site.
1U 2U 3U 4U 5U
19" 23" 24" 23" 22"
She
lby
Tub
e =
24"
of S
oil
2" CRS 61 2" CRS 59 2" CRS 62 2" CRS 63 2" CRS 64
3.5" CAUC TX 19
3.5" CAUC TX 24
3.5" CAUC TX 25
3.5" CAUC TX 26
3.5" CAUC TX 27
3" Index Testing
3" Index Testing
3" Index Testing
3" Index Testing
3" Index Testing
7U 8U 9U 10U 11U
24" 24" 22" 24" 21"
She
lby
Tub
e =
24"
of S
oil
3.5" TX 35 SHAN OCR5
4.25" CAUC TX32
3.5" CAUC TX 314.25" CAUC
TX 303.5" TX 34
SHAN OCR2 2.5" CRS 73
3.5" TX 33 SHAN OCR12" CRS 83
2.5" CRS 723.75" CAUC
TX 283.5" CAUC
TX 29
2" CRS 68
3" Index Testing
3" Index Testing
2" CRS 69
3" Index Testing
3" Index Testing
3" Index Testing
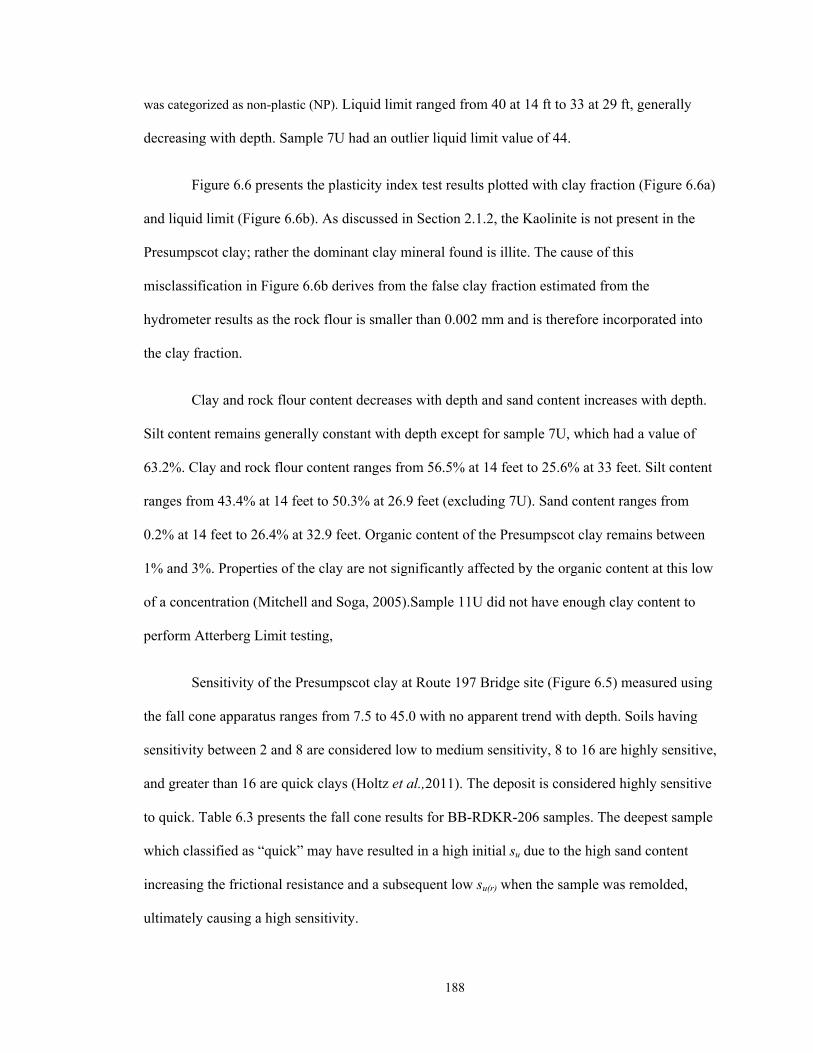
188
was categorized as non-plastic (NP). Liquid limit ranged from 40 at 14 ft to 33 at 29 ft, generally
decreasing with depth. Sample 7U had an outlier liquid limit value of 44.
Figure 6.6 presents the plasticity index test results plotted with clay fraction (Figure 6.6a)
and liquid limit (Figure 6.6b). As discussed in Section 2.1.2, the Kaolinite is not present in the
Presumpscot clay; rather the dominant clay mineral found is illite. The cause of this
misclassification in Figure 6.6b derives from the false clay fraction estimated from the
hydrometer results as the rock flour is smaller than 0.002 mm and is therefore incorporated into
the clay fraction.
Clay and rock flour content decreases with depth and sand content increases with depth.
Silt content remains generally constant with depth except for sample 7U, which had a value of
63.2%. Clay and rock flour content ranges from 56.5% at 14 feet to 25.6% at 33 feet. Silt content
ranges from 43.4% at 14 feet to 50.3% at 26.9 feet (excluding 7U). Sand content ranges from
0.2% at 14 feet to 26.4% at 32.9 feet. Organic content of the Presumpscot clay remains between
1% and 3%. Properties of the clay are not significantly affected by the organic content at this low
of a concentration (Mitchell and Soga, 2005).Sample 11U did not have enough clay content to
perform Atterberg Limit testing,
Sensitivity of the Presumpscot clay at Route 197 Bridge site (Figure 6.5) measured using
the fall cone apparatus ranges from 7.5 to 45.0 with no apparent trend with depth. Soils having
sensitivity between 2 and 8 are considered low to medium sensitivity, 8 to 16 are highly sensitive,
and greater than 16 are quick clays (Holtz et al.,2011). The deposit is considered highly sensitive
to quick. Table 6.3 presents the fall cone results for BB-RDKR-206 samples. The deepest sample
which classified as “quick” may have resulted in a high initial su due to the high sand content
increasing the frictional resistance and a subsequent low su(r) when the sample was remolded,
ultimately causing a high sensitivity.
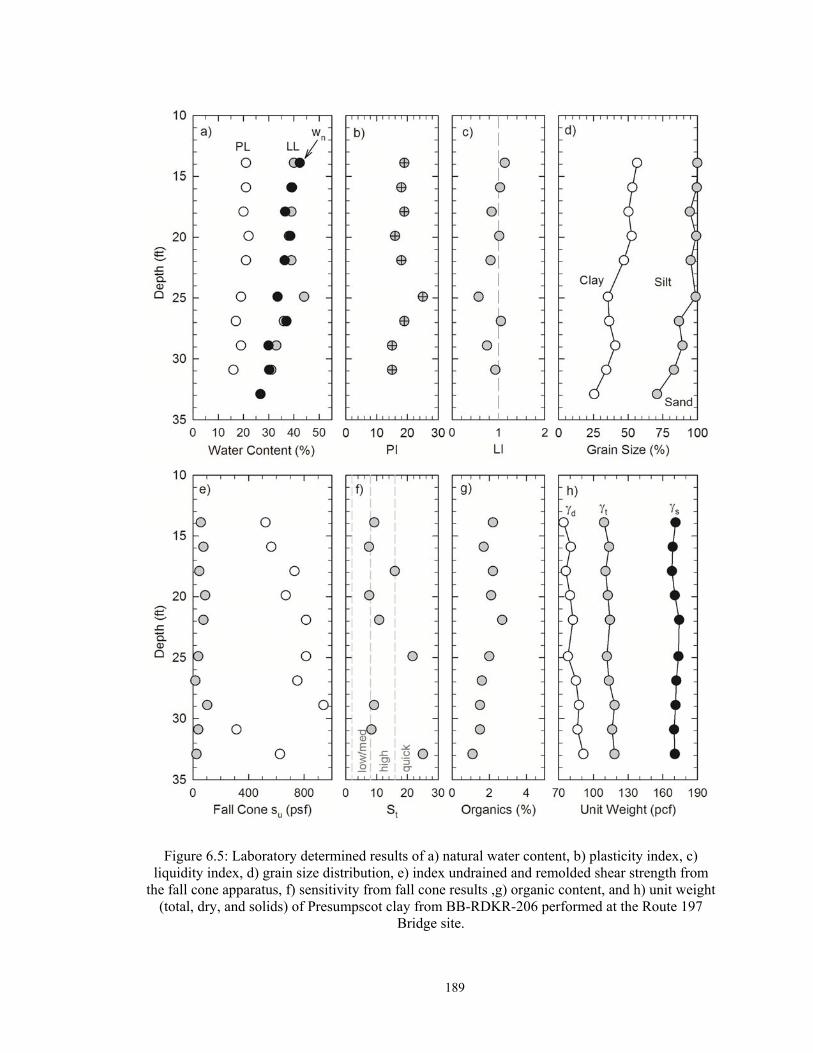
189
Figure 6.5: Laboratory determined results of a) natural water content, b) plasticity index, c) liquidity index, d) grain size distribution, e) index undrained and remolded shear strength from
the fall cone apparatus, f) sensitivity from fall cone results ,g) organic content, and h) unit weight (total, dry, and solids) of Presumpscot clay from BB-RDKR-206 performed at the Route 197
Bridge site.

190
Table 6.1: Summary of Atterberg Limit plasticity data for Presumpscot clay samples tested from BB-RDKR-206 conducted at the Route 197 Bridge site.
Table 6.2: Summary of grain size distribution, density, and USCS classification for Presumpscot clay samples tested from BB-RDKR-206 conducted at the Route 197 Bridge site.
Depth wn
(ft) (%)1U 13.9 42.3 40 21 19 1.14
2U 15.9 39.2 39 21 18 1.03
3U 17.9 36.5 39 20 19 0.85
4U 19.9 38.5 38 22 16 1.02
5U 21.9 36.3 39 21 18 0.83
7U 24.9 33.5 44 19 25 0.57
8U 26.9 37 36 17 19 1.05
9U 28.9 29.9 33 19 15 0.75
10U 30.9 30.2 31 16 15 0.93
11U 32.9 26.7 NP NP NP NP
Note: NP = non-plastic
Sample LL PL PI LI
Depth Gravel Sand Silt Clay Organics t d s USCS
(ft) (%) (%) (%) (%) (%) (pcf) (pcf) (pcf) (ASTM D2487)1U 13.9 0.0 0.2 43.4 56.5 2.2 109 74 171 Lean Clay (CL)
2U 15.9 0.0 0.5 46.4 53.1 1.7 114 81 169 Lean Clay (CL)
3U 17.9 0.0 5.5 44.2 50.3 2.2 111 76 168 Lean Clay (CL)
4U 19.9 0.0 0.9 46.5 52.6 2.1 113 80 170 Lean Clay (CL)
5U 21.9 0.0 4.9 48.1 47.0 2.7 114 82 174 Lean Clay (CL)
7U 24.9 0.0 1.4 63.2 35.5 2.0 112 78 174 Lean Clay (CL)
8U 26.9 0.4 12.8 50.3 36.4 1.6 113 85 172 Lean Clay (CL)
9U 28.9 0.0 10.7 48.4 40.8 1.5 118 88 171 Lean Clay (CL)
10U 30.9 0.0 17.0 48.7 34.3 1.5 116 86 170Lean Clay (CL) w/
Fine Sand
11U 32.9 2.7 26.4 45.3 25.6 1.1 118 91 170Silty Clay (CL) w/
Sand & Gravel
Sample

191
Figure 6.6: Plasticity data from laboratory testing of Presumpscot clay samples collected from Boring BB-RDKR-206 plotted on USCS Classification Charts at the Route 197 Bridge site.
Table 6.3: Summary of fall cone undrained shear strength and sensitivity results for tested samples of Presumpscot clay collected from Boring BB-RDKR-206 at the Route 197 Bridge site.
Clay Fraction (%, <0.002 mm)
0 10 20 30 40 50 60
Pla
stic
ity In
dex
0
10
20
30
40
50
Illite
(A =
0.9)
Kaolinite (A = 0.38)
Liquid Limit
0 10 20 30 40 50 60
10 - 20 ft20 - 30 ft30 - 40 ft CH
CL
ML
CL-ML
MLor
OL7
4
U-Line
A-Line
OH
orMH
Depth Intact su1 sur
2
(ft) (psf) (psf)1U 13.9 522 100g 30° 56 60g 60° 9.3
2U 15.9 564 100g 30° 75 60g 60° 7.5
3U 17.9 731 100g 30° 46 60g 60° 15.9
4U 19.9 668 100g 30° 88 60g 60° 7.6
5U 21.9 815 100g 30° 75 60g 60° 10.8
7U 24.9 815 100g 30° 38 60g 60° 21.7
8U 26.9 752 100g 30° 17 10g 60° 45.0
9U 28.9 940 100g 30° 102 60g 60° 9.2
10U 30.9 313 100g 30° 38 60g 60° 8.3
11U 32.9 627 400g 30° 25 60g 60° 25.0
Note: 1intact undrained shear strength; 2remolded; 3Sensitivity (su/sur)
Intact Cone
Remolded Cone
St3Sample
192
Overall index test data show the following trends for the Presumpscot clay at the Route
197 Bridge:
There is a general decrease in plastic limit, PL, liquid limit, LL, and plasticity
index, PI, with depth that correlates well with a decrease in clay content and
possibly organic content (although the latter is low and likely has little effect on
soil properties and behavior).
Sensitivity correlates loosely with water content, where low water content soils
are less sensitive. This is because the remolded undrained shear strength and
undisturbed undrained shear strength both increase with decreasing water
content.
Void ratio generally follows the trend of clay content, where soils with higher
void ratios typically have higher clay content.
The soil at the lower depths of the deposit has sand seams
6.2.2 One Dimensional Consolidation Results
Constant rate of strain (CRS) consolidation testing was performed on Presumpscot clay
specimens trimmed from the 10 Shelby tube samples at the Route 197 Bridge site in general
accordance with the procedures described in Section 3.4.3. Specimens were mainly of very good
to excellent quality with the exception of two good to fair quality specimens and two poor quality
specimens. Table 6.4 presents specimen information of each tested specimen, change in void ratio
upon recompression for sample quality designation, and results of the consolidation testing
including preconsolidation pressure (determined using the Becker et al., 1987 method),
overconsolidation ratio (OCR), coefficient of consolidation and coefficients of compressibility.
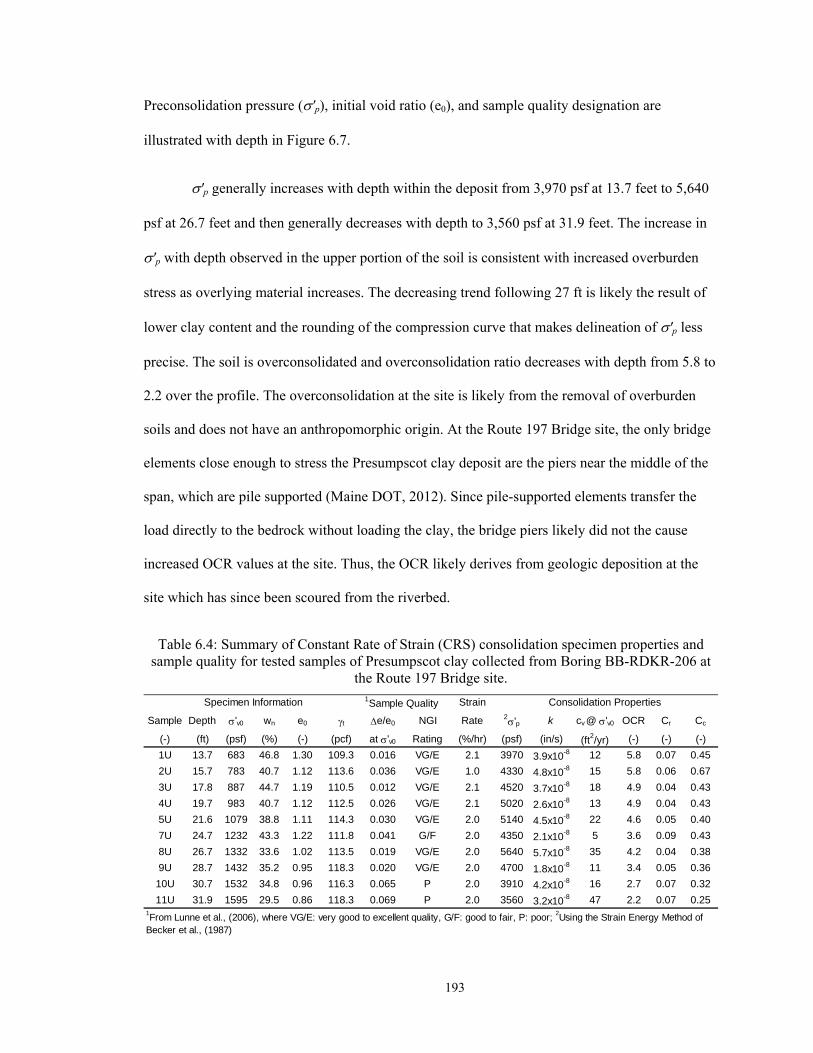
193
Preconsolidation pressure ('p), initial void ratio (e0), and sample quality designation are
illustrated with depth in Figure 6.7.
'p generally increases with depth within the deposit from 3,970 psf at 13.7 feet to 5,640
psf at 26.7 feet and then generally decreases with depth to 3,560 psf at 31.9 feet. The increase in
'p with depth observed in the upper portion of the soil is consistent with increased overburden
stress as overlying material increases. The decreasing trend following 27 ft is likely the result of
lower clay content and the rounding of the compression curve that makes delineation of 'p less
precise. The soil is overconsolidated and overconsolidation ratio decreases with depth from 5.8 to
2.2 over the profile. The overconsolidation at the site is likely from the removal of overburden
soils and does not have an anthropomorphic origin. At the Route 197 Bridge site, the only bridge
elements close enough to stress the Presumpscot clay deposit are the piers near the middle of the
span, which are pile supported (Maine DOT, 2012). Since pile-supported elements transfer the
load directly to the bedrock without loading the clay, the bridge piers likely did not the cause
increased OCR values at the site. Thus, the OCR likely derives from geologic deposition at the
site which has since been scoured from the riverbed.
Table 6.4: Summary of Constant Rate of Strain (CRS) consolidation specimen properties and sample quality for tested samples of Presumpscot clay collected from Boring BB-RDKR-206 at
the Route 197 Bridge site.
1Sample Quality Strain
Sample Depth 'v0 wn e0 t e/e0 NGI Rate 2'p k cv @ 'v0 OCR Cr Cc
(-) (ft) (psf) (%) (-) (pcf) at 'v0 Rating (%/hr) (psf) (in/s) (ft2/yr) (-) (-) (-)
1U 13.7 683 46.8 1.30 109.3 0.016 VG/E 2.1 3970 3.9x10⁻⁸ 12 5.8 0.07 0.45
2U 15.7 783 40.7 1.12 113.6 0.036 VG/E 1.0 4330 4.8x10⁻⁸ 15 5.8 0.06 0.67
3U 17.8 887 44.7 1.19 110.5 0.012 VG/E 2.1 4520 3.7x10⁻⁸ 18 4.9 0.04 0.43
4U 19.7 983 40.7 1.12 112.5 0.026 VG/E 2.1 5020 2.6x10⁻⁸ 13 4.9 0.04 0.43
5U 21.6 1079 38.8 1.11 114.3 0.030 VG/E 2.0 5140 4.5x10⁻⁸ 22 4.6 0.05 0.40
7U 24.7 1232 43.3 1.22 111.8 0.041 G/F 2.0 4350 2.1x10⁻⁸ 5 3.6 0.09 0.43
8U 26.7 1332 33.6 1.02 113.5 0.019 VG/E 2.0 5640 5.7x10⁻⁸ 35 4.2 0.04 0.38
9U 28.7 1432 35.2 0.95 118.3 0.020 VG/E 2.0 4700 1.8x10⁻⁸ 11 3.4 0.05 0.36
10U 30.7 1532 34.8 0.96 116.3 0.065 P 2.0 3910 4.2x10⁻⁸ 16 2.7 0.07 0.32
11U 31.9 1595 29.5 0.86 118.3 0.069 P 2.0 3560 3.2x10⁻⁸ 47 2.2 0.07 0.251From Lunne et al., (2006), where VG/E: very good to excellent quality, G/F: good to fair, P: poor; 2Using the Strain Energy Method of Becker et al., (1987)
Specimen Information Consolidation Properties
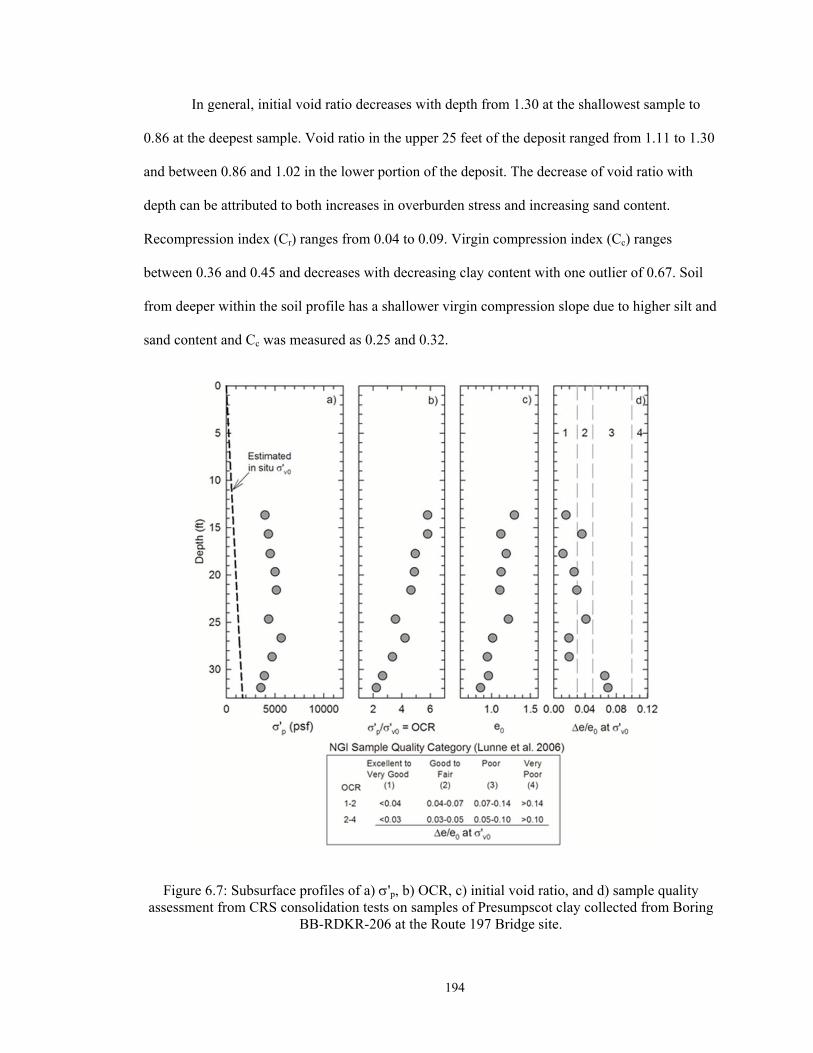
194
In general, initial void ratio decreases with depth from 1.30 at the shallowest sample to
0.86 at the deepest sample. Void ratio in the upper 25 feet of the deposit ranged from 1.11 to 1.30
and between 0.86 and 1.02 in the lower portion of the deposit. The decrease of void ratio with
depth can be attributed to both increases in overburden stress and increasing sand content.
Recompression index (Cr) ranges from 0.04 to 0.09. Virgin compression index (Cc) ranges
between 0.36 and 0.45 and decreases with decreasing clay content with one outlier of 0.67. Soil
from deeper within the soil profile has a shallower virgin compression slope due to higher silt and
sand content and Cc was measured as 0.25 and 0.32.
Figure 6.7: Subsurface profiles of a) 'p, b) OCR, c) initial void ratio, and d) sample quality assessment from CRS consolidation tests on samples of Presumpscot clay collected from Boring
BB-RDKR-206 at the Route 197 Bridge site.
195
Lastly, coefficient of consolidation determined at the 'v0 for the Presumpscot clay
(Section 3.4.3) ranged from 5 ft2/year to 47 ft2/year, however the most common values measured
are between 11 and 22 ft2/year. Increased coefficient of consolidation values nearer to the bottom
of the deposit are likely due to increased sand and silt content. Permeability values ranged from
1.8 x 10⁻⁸ in/s to 5.7 x 10⁻⁸ in/s with no trend in depth. Considering the increase in sand content
with depth, permeability should theoretically increase with depth, but this did not occur in the
tested specimens.
Review of Figure 6.7 confirms the expected trends of decreasing OCR and void ratio
with depth (as discussed above). Sample quality had a general decrease in quality with depth,
indicating that the 'p and OCR estimates in the upper portion of the deposit are more reliable
than the lower specimens. Lower sample quality represents more disturbance of the natural soil
structure, in turn flattening the consolidation curve from the CRS test and a generally lower 'p
estimate.
6.2.3 Recompression Undrained Triaxial Shear
Anisotropically consolidated undrained compression (CAUC) triaxial shear testing was
performed on Presumpscot clay specimens from the 10 collected Shelby tube samples from the
Route 197 Bridge site in general accordance with the procedures described in Section 3.4.4. Table
6.5 presents specimen properties, conditions following recompression to the estimated 'v0,
sample quality, and pre-shear parameters for the triaxial specimens. Table 6.6 presents results
from the shear phase of the testing, including peak shear stress, strain at failure, pore pressure at
failure, and shear stress normalized to vertical effective compressive stress. Specimens were
mainly of very good to excellent quality, with the exception of one good to fair quality specimen.
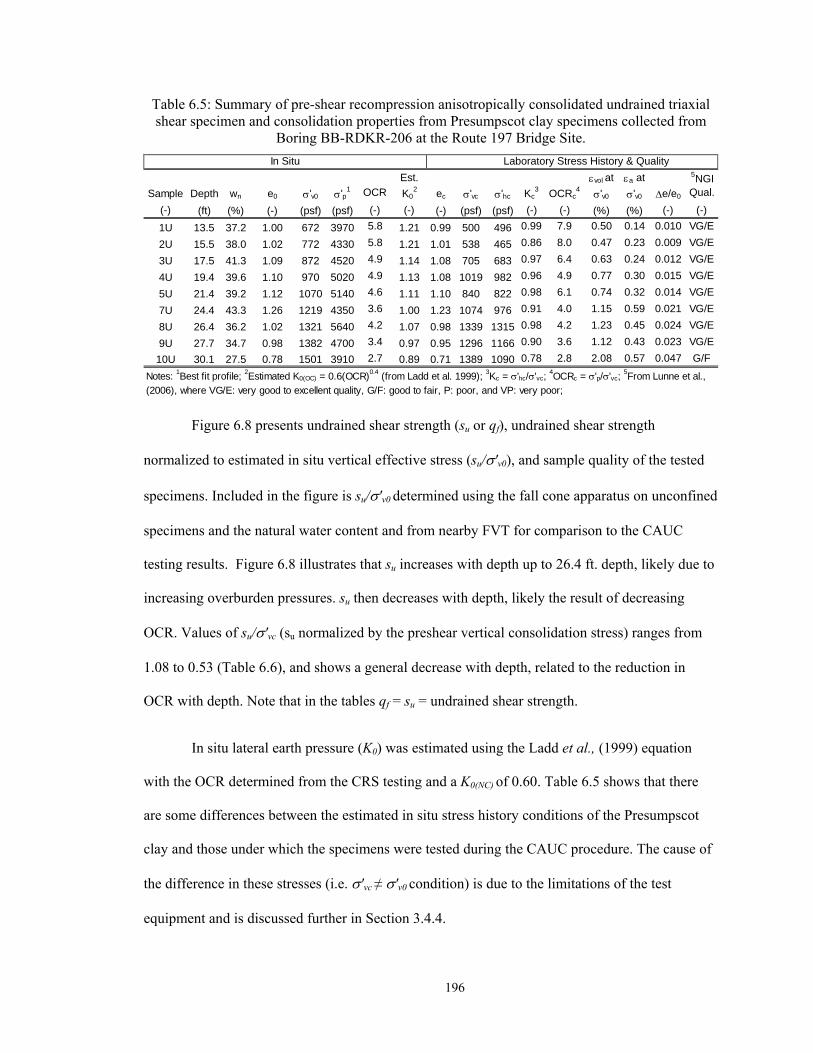
196
Table 6.5: Summary of pre-shear recompression anisotropically consolidated undrained triaxial shear specimen and consolidation properties from Presumpscot clay specimens collected from
Boring BB-RDKR-206 at the Route 197 Bridge Site.
Figure 6.8 presents undrained shear strength (su or qf), undrained shear strength
normalized to estimated in situ vertical effective stress (su/'v0), and sample quality of the tested
specimens. Included in the figure is su/'v0 determined using the fall cone apparatus on unconfined
specimens and the natural water content and from nearby FVT for comparison to the CAUC
testing results. Figure 6.8 illustrates that su increases with depth up to 26.4 ft. depth, likely due to
increasing overburden pressures. su then decreases with depth, likely the result of decreasing
OCR. Values of su/'vc (su normalized by the preshear vertical consolidation stress) ranges from
1.08 to 0.53 (Table 6.6), and shows a general decrease with depth, related to the reduction in
OCR with depth. Note that in the tables qf = su = undrained shear strength.
In situ lateral earth pressure (K0) was estimated using the Ladd et al., (1999) equation
with the OCR determined from the CRS testing and a K0(NC) of 0.60. Table 6.5 shows that there
are some differences between the estimated in situ stress history conditions of the Presumpscot
clay and those under which the specimens were tested during the CAUC procedure. The cause of
the difference in these stresses (i.e. 'vc ≠ 'v0 condition) is due to the limitations of the test
equipment and is discussed further in Section 3.4.4.
Sample Depth wn e0 'v0 'p1 OCR
Est.
K02 ec 'vc 'hc Kc
3 OCRc4
vol at
'v0
a at
'v0 e/e0
5NGI Qual.
(-) (ft) (%) (-) (psf) (psf) (-) (-) (-) (psf) (psf) (-) (-) (%) (%) (-) (-)
1U 13.5 37.2 1.00 672 3970 5.8 1.21 0.99 500 496 0.99 7.9 0.50 0.14 0.010 VG/E
2U 15.5 38.0 1.02 772 4330 5.8 1.21 1.01 538 465 0.86 8.0 0.47 0.23 0.009 VG/E
3U 17.5 41.3 1.09 872 4520 4.9 1.14 1.08 705 683 0.97 6.4 0.63 0.24 0.012 VG/E
4U 19.4 39.6 1.10 970 5020 4.9 1.13 1.08 1019 982 0.96 4.9 0.77 0.30 0.015 VG/E
5U 21.4 39.2 1.12 1070 5140 4.6 1.11 1.10 840 822 0.98 6.1 0.74 0.32 0.014 VG/E
7U 24.4 43.3 1.26 1219 4350 3.6 1.00 1.23 1074 976 0.91 4.0 1.15 0.59 0.021 VG/E
8U 26.4 36.2 1.02 1321 5640 4.2 1.07 0.98 1339 1315 0.98 4.2 1.23 0.45 0.024 VG/E
9U 27.7 34.7 0.98 1382 4700 3.4 0.97 0.95 1296 1166 0.90 3.6 1.12 0.43 0.023 VG/E
10U 30.1 27.5 0.78 1501 3910 2.7 0.89 0.71 1389 1090 0.78 2.8 2.08 0.57 0.047 G/F
Notes: 1Best fit profile; 2Estimated K0(OC) = 0.6(OCR)0.4 (from Ladd et al. 1999); 3Kc = 'hc/'vc; 4OCRc = 'p/'vc;
5From Lunne et al.,
(2006), where VG/E: very good to excellent quality, G/F: good to fair, P: poor, and VP: very poor;
Laboratory Stress History & QualityIn Situ
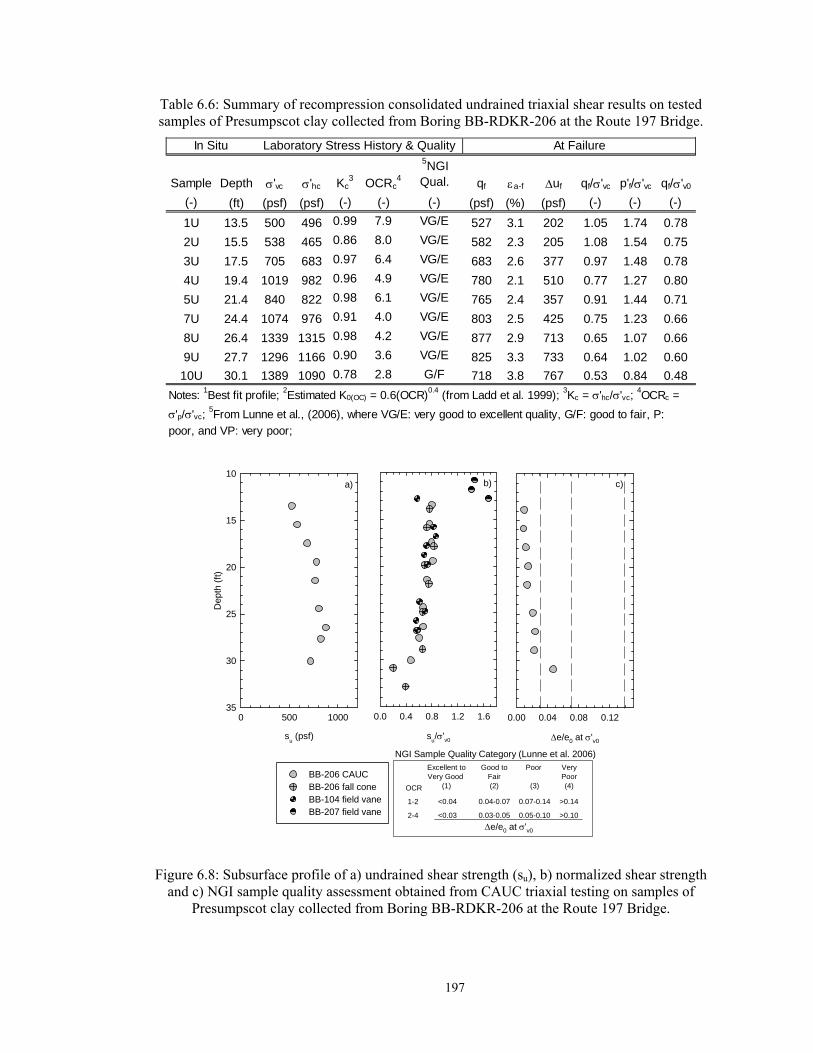
197
Table 6.6: Summary of recompression consolidated undrained triaxial shear results on tested samples of Presumpscot clay collected from Boring BB-RDKR-206 at the Route 197 Bridge.
Figure 6.8: Subsurface profile of a) undrained shear strength (su), b) normalized shear strength
and c) NGI sample quality assessment obtained from CAUC triaxial testing on samples of Presumpscot clay collected from Boring BB-RDKR-206 at the Route 197 Bridge.
Sample Depth 'vc 'hc Kc3 OCRc
4
5NGI Qual. qf a-f uf qf/'vc p'f/'vc qf/'v0
(-) (ft) (psf) (psf) (-) (-) (-) (psf) (%) (psf) (-) (-) (-)
1U 13.5 500 496 0.99 7.9 VG/E 527 3.1 202 1.05 1.74 0.78
2U 15.5 538 465 0.86 8.0 VG/E 582 2.3 205 1.08 1.54 0.75
3U 17.5 705 683 0.97 6.4 VG/E 683 2.6 377 0.97 1.48 0.78
4U 19.4 1019 982 0.96 4.9 VG/E 780 2.1 510 0.77 1.27 0.80
5U 21.4 840 822 0.98 6.1 VG/E 765 2.4 357 0.91 1.44 0.71
7U 24.4 1074 976 0.91 4.0 VG/E 803 2.5 425 0.75 1.23 0.66
8U 26.4 1339 1315 0.98 4.2 VG/E 877 2.9 713 0.65 1.07 0.66
9U 27.7 1296 1166 0.90 3.6 VG/E 825 3.3 733 0.64 1.02 0.60
10U 30.1 1389 1090 0.78 2.8 G/F 718 3.8 767 0.53 0.84 0.48
At FailureLaboratory Stress History & QualityIn Situ
Notes: 1Best fit profile;
2Estimated K0(OC) = 0.6(OCR)
0.4 (from Ladd et al. 1999);
3Kc = 'hc/'vc;
4OCRc =
'p/'vc; 5From Lunne et al., (2006), where VG/E: very good to excellent quality, G/F: good to fair, P:
poor, and VP: very poor;
e/e0 at 'v0
0.00 0.04 0.08 0.12
su
(psf)
0 500 1000
Dep
th (
ft)
10
15
20
25
30
35
su/'v0
0.0 0.4 0.8 1.2 1.6
BB-206 CAUCBB-206 fall coneBB-104 field vaneBB-207 field vane
c)
NGI Sample Quality Category (Lunne et al. 2006)Excellent toVery Good
(1)
Poor
(3)OCR
1-2
2-4
<0.04 0.04-0.07 0.07-0.14 >0.14
<0.03 0.03-0.05 0.05-0.10 >0.10
e/e0 at 'v0
Good toFair(2)
VeryPoor(4)
a) b)
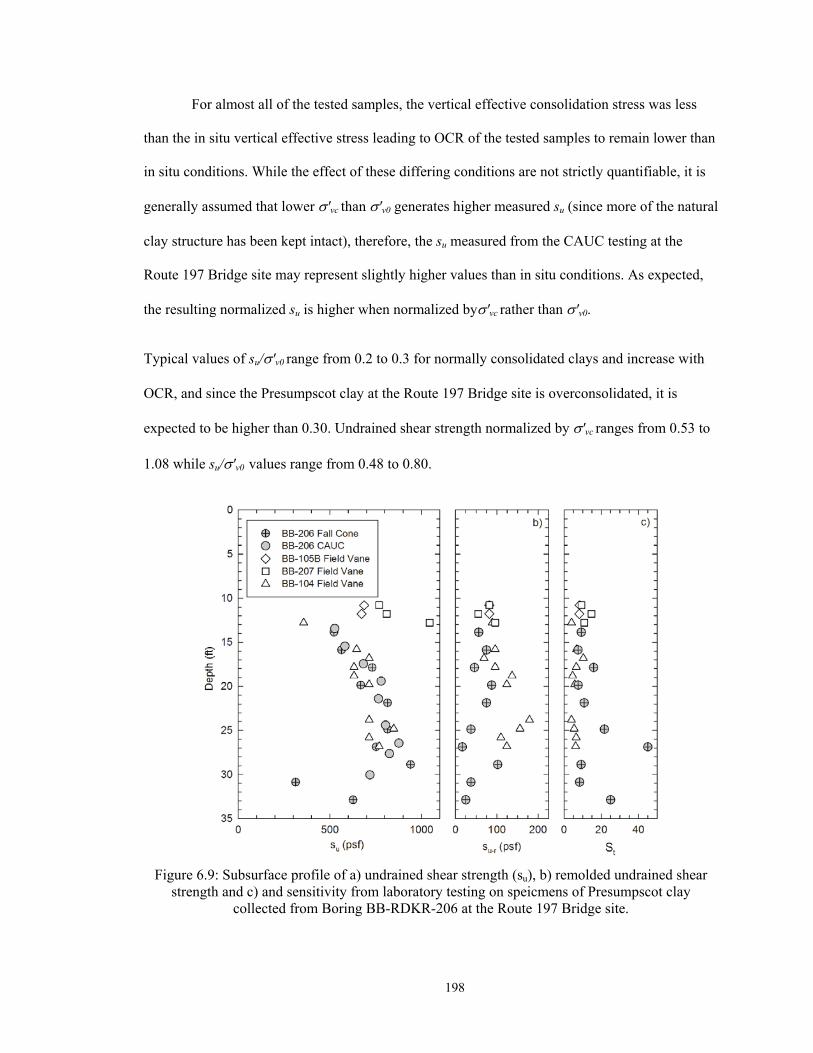
198
For almost all of the tested samples, the vertical effective consolidation stress was less
than the in situ vertical effective stress leading to OCR of the tested samples to remain lower than
in situ conditions. While the effect of these differing conditions are not strictly quantifiable, it is
generally assumed that lower 'vc than 'v0 generates higher measured su (since more of the natural
clay structure has been kept intact), therefore, the su measured from the CAUC testing at the
Route 197 Bridge site may represent slightly higher values than in situ conditions. As expected,
the resulting normalized su is higher when normalized by'vc rather than 'v0.
Typical values of su/'v0 range from 0.2 to 0.3 for normally consolidated clays and increase with
OCR, and since the Presumpscot clay at the Route 197 Bridge site is overconsolidated, it is
expected to be higher than 0.30. Undrained shear strength normalized by 'vc ranges from 0.53 to
1.08 while su/'v0 values range from 0.48 to 0.80.
Figure 6.9: Subsurface profile of a) undrained shear strength (su), b) remolded undrained shear strength and c) and sensitivity from laboratory testing on speicmens of Presumpscot clay
collected from Boring BB-RDKR-206 at the Route 197 Bridge site.
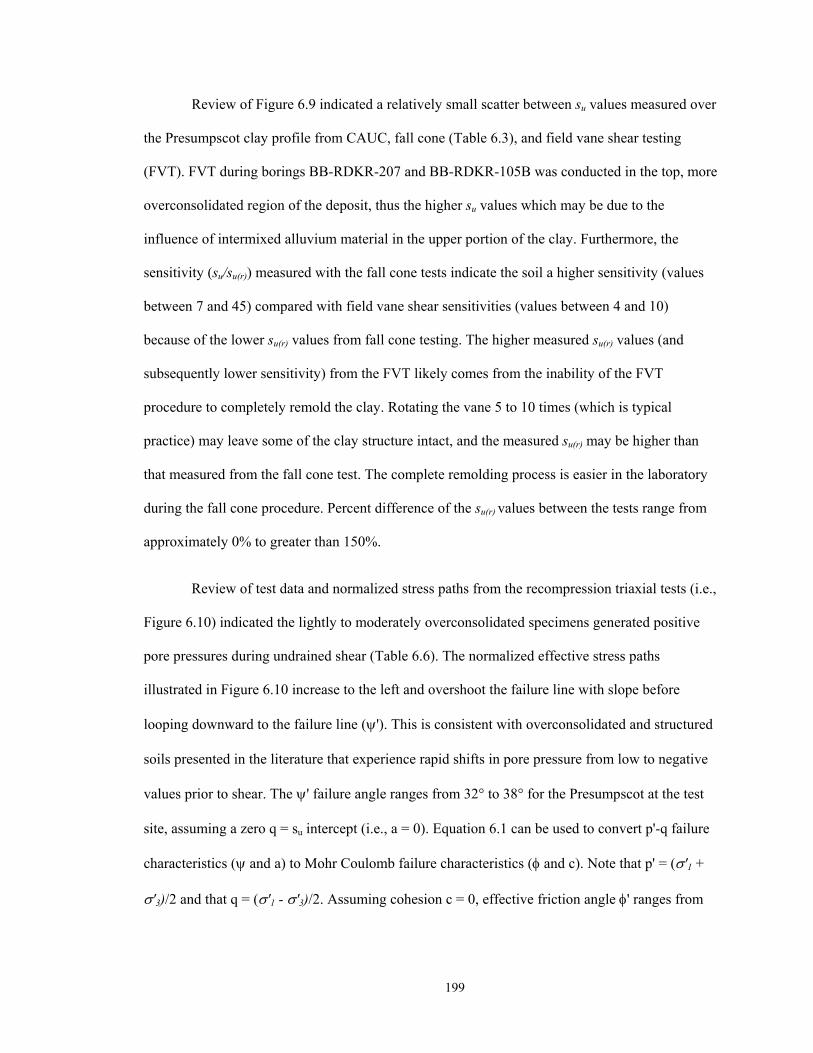
199
Review of Figure 6.9 indicated a relatively small scatter between su values measured over
the Presumpscot clay profile from CAUC, fall cone (Table 6.3), and field vane shear testing
(FVT). FVT during borings BB-RDKR-207 and BB-RDKR-105B was conducted in the top, more
overconsolidated region of the deposit, thus the higher su values which may be due to the
influence of intermixed alluvium material in the upper portion of the clay. Furthermore, the
sensitivity (su/su(r)) measured with the fall cone tests indicate the soil a higher sensitivity (values
between 7 and 45) compared with field vane shear sensitivities (values between 4 and 10)
because of the lower su(r) values from fall cone testing. The higher measured su(r) values (and
subsequently lower sensitivity) from the FVT likely comes from the inability of the FVT
procedure to completely remold the clay. Rotating the vane 5 to 10 times (which is typical
practice) may leave some of the clay structure intact, and the measured su(r) may be higher than
that measured from the fall cone test. The complete remolding process is easier in the laboratory
during the fall cone procedure. Percent difference of the su(r) values between the tests range from
approximately 0% to greater than 150%.
Review of test data and normalized stress paths from the recompression triaxial tests (i.e.,
Figure 6.10) indicated the lightly to moderately overconsolidated specimens generated positive
pore pressures during undrained shear (Table 6.6). The normalized effective stress paths
illustrated in Figure 6.10 increase to the left and overshoot the failure line with slope before
looping downward to the failure line ('). This is consistent with overconsolidated and structured
soils presented in the literature that experience rapid shifts in pore pressure from low to negative
values prior to shear. The ' failure angle ranges from 32° to 38° for the Presumpscot at the test
site, assuming a zero q = su intercept (i.e., a = 0). Equation 6.1 can be used to convert p'-q failure
characteristics ( and a) to Mohr Coulomb failure characteristics ( and c). Note that p' = ('1 +
'3)/2 and that q = ('1 - '3)/2. Assuming cohesion c = 0, effective friction angle ' ranges from

200
38.6° to 51.5°. These values are high compared to many clay soils, but the combination of silt
content and overconsolidation likely explains this.
sin = tan 6.1
(where c = 0 and a = 0)
Figure 6.10: Recompression Consolidated Undrained Triaxial (CAUC) Normalized Effective Stress Paths for specimens from BB-RDKR-206 at the Route 197 Bride site.

201
6.2.4 SHANSEP Consolidated Undrained Triaxial Shear
SHANSEP (Stress History and Normalized Engineering Parameters) testing was
conducted on Presumpscot clay specimens collected at the Route 197 Bridge site to determine if
this type of testing is appropriate for the overconsolidated clay. The testing was performed in
accordance with procedures described in Section 3.4.6. SHANSEP testing results provide two
empirical coefficients which can then estimate the su at varying values of OCR and 'v0 using
Equation 2.1. Table 6.7 presents specimen information and stresses applied to the tested
specimens during the consolidation phase, and measurements of pore pressure, shear strength,
and normalized shear strength collected at failure during shear. The resulting S and m parameters
of the OCR su/'v0 analyses are included in the table.
Table 6.7: Summary of Specimen and consolidation properties for SHANSEP undrained triaxial tests conducted on specimens from BB-RDKR-206 Sample 8U at the Route 197 Bridge site.
Figure 6.11 illustrates the normalized effective stress paths for the BB-206 8U
SHANSEP specimens. Using the su at failure (defined as the peak) normalized by the
consolidation OCR from the tests, a best-fit trend-line was applied to the resulting normalized
shear strength and overconsolidation ratios to determine the two SHANSEP coefficients, S and m
for Equation 2.1. The specimens were tested as OCRs of 1.02 and 2.03 and resulted in su(OC)/'vc
values of 0.28 and 0.47, respectively. The resulting normalized su for the normally consolidated
soil (S; su(OC)/'v0 at OCR=1) is 0.27 and the resulting OCR exponent (m) is 0.77. The resulting
SHANSEP relationship is illustrated in Equation 6.2.
su(OC)/'v0 = 0.27∙OCR0.77 6.2
Depth e0 'v 0 'v max 'v c ec qf a uf qf /'v c p'f /'v c
(ft) (-) (psf) (psf) (psf) (-) (psf) (%) (psf) (-) (-)
26.1 0.93 1303 10286 10070 1.02 0.59 0.75 2785.1 0.003 1114.2 0.28 0.76
25.9 1.08 1291 10044 4936 2.03 0.63 0.85 2416.9 0.01 355.2 0.47 1.00
OCR
('p/'v c)
K
('3/'1)
Laboratory Stress History
S m
0.27 0.77
In Situ At Failure Prediction
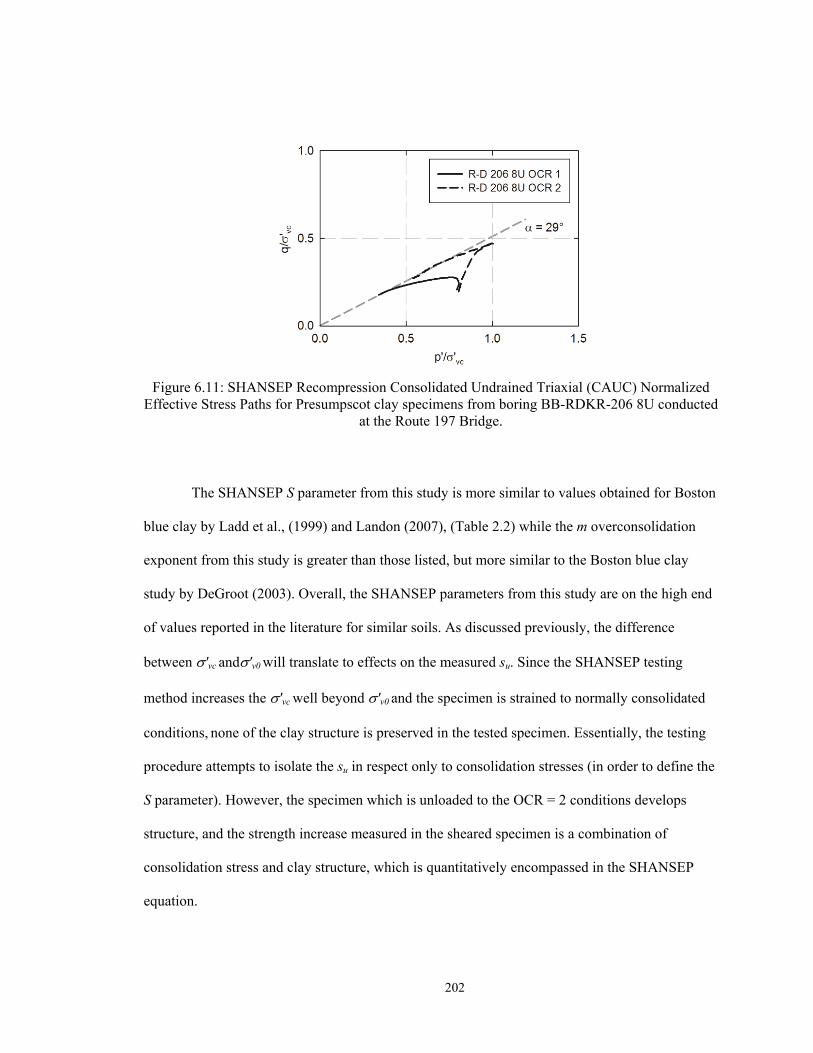
202
Figure 6.11: SHANSEP Recompression Consolidated Undrained Triaxial (CAUC) Normalized Effective Stress Paths for Presumpscot clay specimens from boring BB-RDKR-206 8U conducted
at the Route 197 Bridge.
The SHANSEP S parameter from this study is more similar to values obtained for Boston
blue clay by Ladd et al., (1999) and Landon (2007), (Table 2.2) while the m overconsolidation
exponent from this study is greater than those listed, but more similar to the Boston blue clay
study by DeGroot (2003). Overall, the SHANSEP parameters from this study are on the high end
of values reported in the literature for similar soils. As discussed previously, the difference
between 'vc and'v0 will translate to effects on the measured su. Since the SHANSEP testing
method increases the 'vc well beyond 'v0 and the specimen is strained to normally consolidated
conditions, none of the clay structure is preserved in the tested specimen. Essentially, the testing
procedure attempts to isolate the su in respect only to consolidation stresses (in order to define the
S parameter). However, the specimen which is unloaded to the OCR = 2 conditions develops
structure, and the strength increase measured in the sheared specimen is a combination of
consolidation stress and clay structure, which is quantitatively encompassed in the SHANSEP
equation.
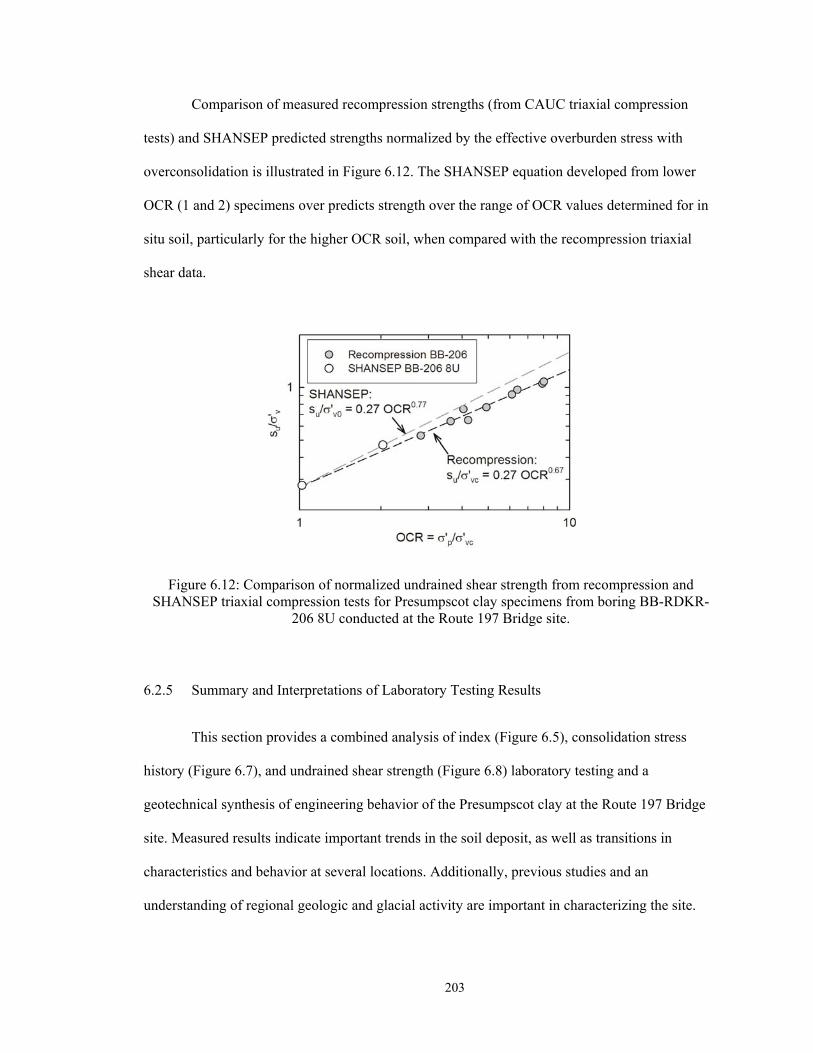
203
Comparison of measured recompression strengths (from CAUC triaxial compression
tests) and SHANSEP predicted strengths normalized by the effective overburden stress with
overconsolidation is illustrated in Figure 6.12. The SHANSEP equation developed from lower
OCR (1 and 2) specimens over predicts strength over the range of OCR values determined for in
situ soil, particularly for the higher OCR soil, when compared with the recompression triaxial
shear data.
Figure 6.12: Comparison of normalized undrained shear strength from recompression and SHANSEP triaxial compression tests for Presumpscot clay specimens from boring BB-RDKR-
206 8U conducted at the Route 197 Bridge site.
6.2.5 Summary and Interpretations of Laboratory Testing Results
This section provides a combined analysis of index (Figure 6.5), consolidation stress
history (Figure 6.7), and undrained shear strength (Figure 6.8) laboratory testing and a
geotechnical synthesis of engineering behavior of the Presumpscot clay at the Route 197 Bridge
site. Measured results indicate important trends in the soil deposit, as well as transitions in
characteristics and behavior at several locations. Additionally, previous studies and an
understanding of regional geologic and glacial activity are important in characterizing the site.
204
Overall index test data show the following trends for the Presumpscot clay at the Route
197 Bridge:
There is a general decrease in plastic limit, PL, liquid limit, LL, and plasticity
index, PI, with depth that correlates well with a decrease in clay content and
possibly organic content (although the latter is low and likely has little effect on
soil properties and behavior).
Sensitivity correlates loosely with water content, where low water content soils
are less sensitive. This is because the remolded undrained shear strength and
undisturbed undrained shear strength both increase with decreasing water
content.
Void ratio generally follows the trend of clay content, where soils with higher
void ratios typically have higher clay content.
The soil at the deeper depths of the deposit has sand seams
1D CRS consolidation testing yielded the following compressibility parameters:
Recompression ratio values range from 0.04 to 0.09, and normally consolidated
virgin compression ratios range from 0.25 to 0.67, with more typical values
ranging from 0.32 to 0.45.
Coefficient of consolidation, cv, values ranging from 5 to 47 ft2/year, with most
values ranging from 11 to 22 ft2/year. Permeability values ranged from 1.8 x 10⁻⁸
in/s to 5.7 x 10⁻⁸ in/s with no trend in depth.
Overall stress history and undrained shear strength ('p, OCR, and su) show the following
trends for the Presumpscot clay at the Richmond-Dresden Bridge site:

205
'p generally increases with depth to 27 ft. and then decreases to 33 ft. The
decrease in 'p within the deeper portion of the layer is likely the result of
increasing sand and decreasing clay content and a flattening of stress-strain
curves that obscures determination of 'p.
OCR decreases from about 5.8 to 2.2 over the deposit as 'v0 increases with depth
and 'p changes. This soil can be classified as low or moderately
overconsolidated.
Overconsolidation is likely caused by mechanical unloading (e.g., removal of
previously deposited sediment or ice), aging, secondary compression, and/or
other biogeochemical processes.
su increases with depth from 527 to 877 psf from 13.5 feet to 27.7 feet
respectively, before decreasing to 767 psf at 30.1 feet.
Most specimens were sheared at a lower 'v0 state than estimated in situ, and it is
anticipated that measured su under predicts in situ su to an unknown degree.
Normalized su decreases consistently with depth. su normalized by the preshear
stress state, su/'vc, decreases from 1.05 to 0.53 with depth within the profile,
while su normalized by the in situ estimated stress state, su/'v0, decreases from
0.78 to 0.48, which is similar to expected values using the SHANSEP S and m
parameters of testing on similar Presumpscot clay deposits (Table 2.2). Higher
OCR soil has greater normalized su, as expected.
6.3 Seismic Cone Penetration Results
One seismic cone penetration test SCPTu 109 was performed in the Presumpscot clay at
the Route 197 Bridge site. The test was conducted on June 28, 2012 in general accordance ASTM
D-5778-95 Standard Test Method for Electronic Friction Cone and Piezocone Penetration
Testing of Soils and the methods outline in Section 3.1 (ConeTec, 2012). Pseudo-interval seismic
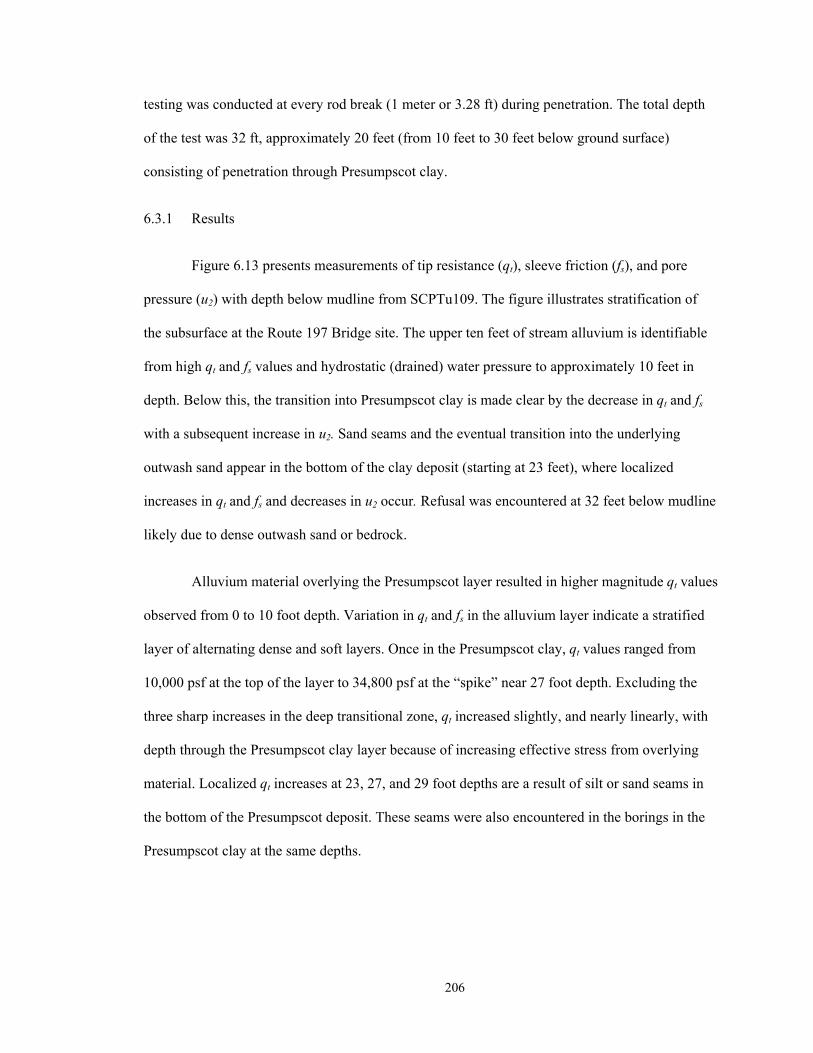
206
testing was conducted at every rod break (1 meter or 3.28 ft) during penetration. The total depth
of the test was 32 ft, approximately 20 feet (from 10 feet to 30 feet below ground surface)
consisting of penetration through Presumpscot clay.
6.3.1 Results
Figure 6.13 presents measurements of tip resistance (qt), sleeve friction (fs), and pore
pressure (u2) with depth below mudline from SCPTu109. The figure illustrates stratification of
the subsurface at the Route 197 Bridge site. The upper ten feet of stream alluvium is identifiable
from high qt and fs values and hydrostatic (drained) water pressure to approximately 10 feet in
depth. Below this, the transition into Presumpscot clay is made clear by the decrease in qt and fs
with a subsequent increase in u2. Sand seams and the eventual transition into the underlying
outwash sand appear in the bottom of the clay deposit (starting at 23 feet), where localized
increases in qt and fs and decreases in u2 occur. Refusal was encountered at 32 feet below mudline
likely due to dense outwash sand or bedrock.
Alluvium material overlying the Presumpscot layer resulted in higher magnitude qt values
observed from 0 to 10 foot depth. Variation in qt and fs in the alluvium layer indicate a stratified
layer of alternating dense and soft layers. Once in the Presumpscot clay, qt values ranged from
10,000 psf at the top of the layer to 34,800 psf at the “spike” near 27 foot depth. Excluding the
three sharp increases in the deep transitional zone, qt increased slightly, and nearly linearly, with
depth through the Presumpscot clay layer because of increasing effective stress from overlying
material. Localized qt increases at 23, 27, and 29 foot depths are a result of silt or sand seams in
the bottom of the Presumpscot deposit. These seams were also encountered in the borings in the
Presumpscot clay at the same depths.

207
Figure 6.13: Depth profile of (a) corrected tip resistance, (b) sleeve friction, (c) and pore pressure showing hydrostatic pore pressure from SCPTu 109 conducted at the Route 197 Bridge.
fs values essentially follow the trend of tip resistance. High and variable fs values occur in
the overlying 10 feet of layered stream alluvium, low values in the Presumpscot clay, and high
values in the silt/sand seams and transition into the underlying outwash sand. Excluding the
seams at the bottom of the clay deposit, values in the Presumpscot clay range from 32 psf at 20
feet to 142 psf at 21.5 feet with a general decrease with depth. Values spike as high as 749 psf at
the location of the seams. Since the fs measurement is suggested to estimate remolded undrained
u0
a) b) c)
qt (psf)
0 50000 100000
Dep
th b
elow
mud
line
(ft)
0
5
10
15
20
25
30
fs (psf)
0 500 1000
u2 (psf)
0 10000
0 20000
10
15
20
25
300 400
10
15
20
25
30
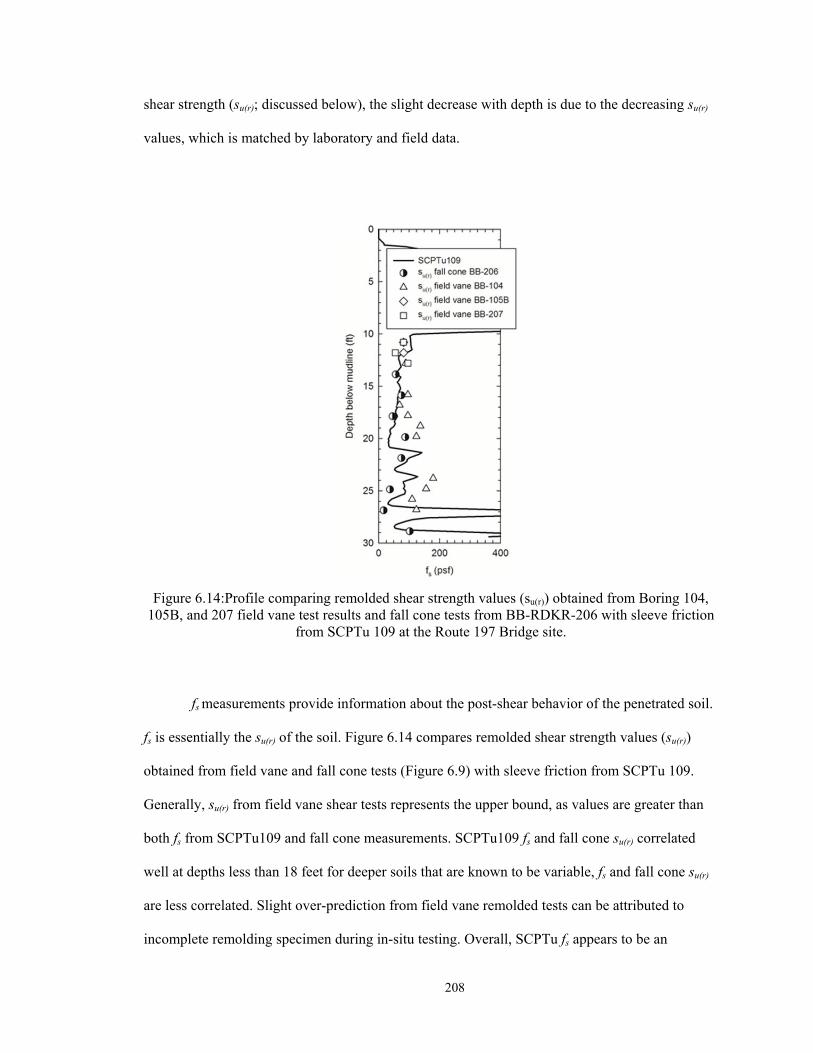
208
shear strength (su(r); discussed below), the slight decrease with depth is due to the decreasing su(r)
values, which is matched by laboratory and field data.
Figure 6.14:Profile comparing remolded shear strength values (su(r)) obtained from Boring 104, 105B, and 207 field vane test results and fall cone tests from BB-RDKR-206 with sleeve friction
from SCPTu 109 at the Route 197 Bridge site.
fs measurements provide information about the post-shear behavior of the penetrated soil.
fs is essentially the su(r) of the soil. Figure 6.14 compares remolded shear strength values (su(r))
obtained from field vane and fall cone tests (Figure 6.9) with sleeve friction from SCPTu 109.
Generally, su(r) from field vane shear tests represents the upper bound, as values are greater than
both fs from SCPTu109 and fall cone measurements. SCPTu109 fs and fall cone su(r) correlated
well at depths less than 18 feet for deeper soils that are known to be variable, fs and fall cone su(r)
are less correlated. Slight over-prediction from field vane remolded tests can be attributed to
incomplete remolding specimen during in-situ testing. Overall, SCPTu fs appears to be an

209
effective method for estimating su(r) within the Presumpscot deposit, however where layering and
variability exist in the soil, caution should be taken.
Pore pressure u2 measurements in the upper 10 feet of stream alluvium were at the
hydrostatic level, indicating free-draining material. Once the Presumpscot clay deposit was
penetrated, pore pressure jumped to 8,400 psf and increased approximately linearly with depth to
the bottom of the deposit. From depth 10 feet to 20 feet, the u2 profile indicates some sub-
layering that is not highlighted by qt and fs measurements. The small, localized increases in u2
within these depths suggest small decreases in permeability and coefficient of consolidation.
Localized decreases in pore pressure can be seen at the sand/silt seams at 23, 27, and 29 foot
depths. The sudden increase to 8,400 psf at the start of the Presumpscot clay deposit is consistent
with the high sensitivity clay. In a study of glaciated clays (Landon, 2007), similar trends
appeared during cone penetration testing where sensitive clay resulted in much larger pore
pressures occurring at the start of penetration through the layer.
Shear wave velocity, Vs, measurements from SCPTu 109 is illustrated in Figure 6.15. Vs
values are represented at the mid-point between the tests (Section 3.1.1). Vs values are consistent
with depth with some variation between 550 and 650 ft/s. Figure 6.15 additionally shows small-
strain (e.g., elastic) shear modulus (G0) over the range where undisturbed samples were available
and measures of in situ bulk density (t) were available from BB-RDKR-206. G0 is calculated
using Equation 2.10 and ranges from approximately 7.5 to 9.5 ksi over the depth range shown,
without a strong trend. Lastly, the rigidity index, Ir, often used for foundation design applications,
was determined using interpreted G0 and su determined from CAUC triaxial compression tests on
undisturbed samples from BB-RDKR-206. Landon (2007) conducted SCPTu testing on Boston
Blue clay (BBC), a silty clay deposit in Massachusetts which has similar silt content to the
Presumpscot clay and was deposited from the same geologic process and period as the
Presumpscot clay. At the Newbury, Massachusetts site Landon (2007) measured the Vs of the

210
BBC to range from 410 ft/s to 525 ft/s which ranges in OCR from 4.6 to 2.1 (similar to the
Presumpscot clay at the Route 197 Bridge site). Thus, Vs measurements are relatively similar
between the BBC and the Presumpscot clay at the Route 197 Bridge site. Long and Donohue
(2008) suggest that G0 is related to both the OCR and void ratio of clay samples. Section 8.6
presents an analysis of OCR, void ratio and G0 from all four sites and found the relationship to be
inconclusive.
Figure 6.15: Profile of a) shear wave velocity (Vs), b) small strain shear modulus (G0), and c) rigidity index (Ir) for SCPTu 109 at the Route 197 Bridge site.
6.3.2 Correlations to Classification
Empirical charts have been proposed by Robertson (1990), Schneider et al. (2008), and
Robertson (2009) to classify soils based on CPTu measurements (Section 2.3.1). The proposed
charts plot normalized tip resistance (Qt) versus sleeve friction ratio (Fr) or normalized pore
pressure (Bq) and place the resulting data point into a region which has a corresponding soil type
deemed the “Soil Behavior Type” or SBT. The SBT regions were developed based on observed
211
Qt, Fr, and Bq measurements taken in specific types of soils. Normalized values are used to
eliminate the influence of depth on measurements. Figure 6.16 displays the profiles of the three
normalized parameters Qt, Fr, and Bq collected from SCPTu 109.
Each of the four classification charts were evaluated for their applicability to the
Presumpscot clay at the Route 197 Bridge site using Unified Soil Classification System (USCS)
results from laboratory analyses of collected soil samples and values of Qt, Fr, and Bq collected
from SCPTu 109 at corresponding depths. For three of the charts (Robertson 1990 and Robertson
2009; Figure 6.17a, b, and c), there are 9 regions corresponding to Soil Behavior Types (SBT).
SBT 1 “sensitive fine grained,” SBT 3 “clay to silty clay,” and SBT 4 “clayey silt to silty clay”
were considered correct classifications of the Presumpscot clay at this site based on lab data. For
the fourth chart (Schneider et al., 2008; Figure 6.17d), a different classification system is used, of
which the “clays” and “sensitive clays” regions were considered to be correct classifications of
the Presumpscot clay. Table 6.8 presents a summary of this analysis including the number of
samples laboratory samples tested, number of USCS classifications matching the SBT
classification, and the resulting percent effectiveness (USCS-SBT matches divided by the number
of samples). It should be noted that the vertical dotted line in Figure 6.17d is used as a match line
to compare to another classification plot not used in this study, and that the “sensitive clay”
region still applies to data plotted on the right side of the line.
Normalizing by overburden stresses also allows for the plotted CPTu data to be classified
based on other soil properties. By doing this for the Presumpscot clay at the Route 197 Bridge
(Figure 6.16), layering within the deposit becomes more pronounced than the raw measurements
alone. One noticeable trend on Figure 6.16 is the steadily decreasing Qt with depth from 10 feet
down to the bottom of the deposit. This is an example of the normalization process highlighting
soil behavior, and in this case, it is OCR. The Qt has been found to relate to the overconsolidation
of the clay, and the values will be used to estimate OCR in Section 6.3.3. Another noticeable

212
trend in Figure 6.16 is the consistency of Bq when normalized by overburden stress. Except for
the confined layers within the deposit, Bq values are practically constant with depth suggesting
that the Bq parameter may be an effective method for soil classification (since in terms of material
classification based on USCS, the Presumpscot clay at the site is relatively uniform).
Figure 6.16: Profile of a) normalized tip resistance (Qt), b) sleeve friction ratio (Fr), and c) Normalized Pore Pressure (Bq) from SCPTu 109 conducted in Presumpscot clay at the Route 197
Bridge.
Bq
0.0 0.4 0.8 1.2Qt
0 200 400 600 800
Dep
th (
ft)
0
5
10
15
20
25
30
Fr
0 1 2 3
a) b) c)
0 10 20 30
10
15
20
25
30
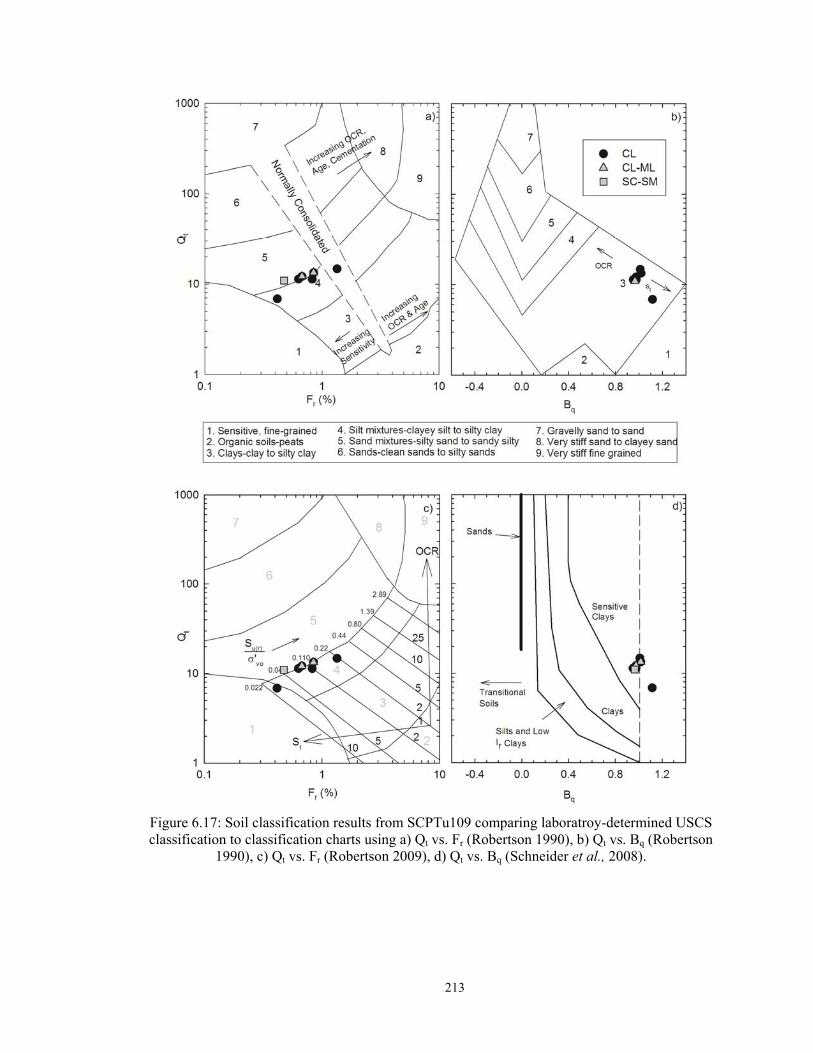
213
Figure 6.17: Soil classification results from SCPTu109 comparing laboratroy-determined USCS classification to classification charts using a) Qt vs. Fr (Robertson 1990), b) Qt vs. Bq (Robertson
1990), c) Qt vs. Fr (Robertson 2009), d) Qt vs. Bq (Schneider et al., 2008).
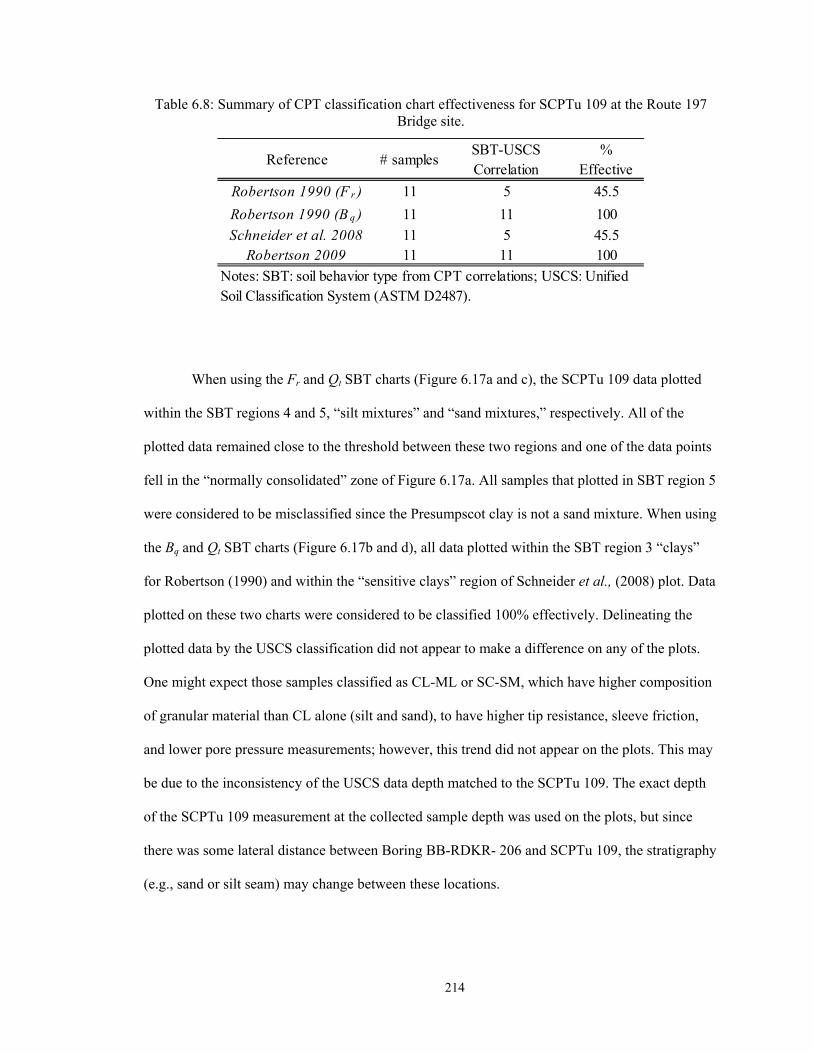
214
Table 6.8: Summary of CPT classification chart effectiveness for SCPTu 109 at the Route 197 Bridge site.
When using the Fr and Qt SBT charts (Figure 6.17a and c), the SCPTu 109 data plotted
within the SBT regions 4 and 5, “silt mixtures” and “sand mixtures,” respectively. All of the
plotted data remained close to the threshold between these two regions and one of the data points
fell in the “normally consolidated” zone of Figure 6.17a. All samples that plotted in SBT region 5
were considered to be misclassified since the Presumpscot clay is not a sand mixture. When using
the Bq and Qt SBT charts (Figure 6.17b and d), all data plotted within the SBT region 3 “clays”
for Robertson (1990) and within the “sensitive clays” region of Schneider et al., (2008) plot. Data
plotted on these two charts were considered to be classified 100% effectively. Delineating the
plotted data by the USCS classification did not appear to make a difference on any of the plots.
One might expect those samples classified as CL-ML or SC-SM, which have higher composition
of granular material than CL alone (silt and sand), to have higher tip resistance, sleeve friction,
and lower pore pressure measurements; however, this trend did not appear on the plots. This may
be due to the inconsistency of the USCS data depth matched to the SCPTu 109. The exact depth
of the SCPTu 109 measurement at the collected sample depth was used on the plots, but since
there was some lateral distance between Boring BB-RDKR- 206 and SCPTu 109, the stratigraphy
(e.g., sand or silt seam) may change between these locations.
Reference # samplesSBT-USCS Correlation
% Effective
Robertson 1990 (F r ) 11 5 45.5
Robertson 1990 (B q ) 11 11 100
Schneider et al. 2008 11 5 45.5Robertson 2009 11 11 100
Notes: SBT: soil behavior type from CPT correlations; USCS: Unified Soil Classification System (ASTM D2487).
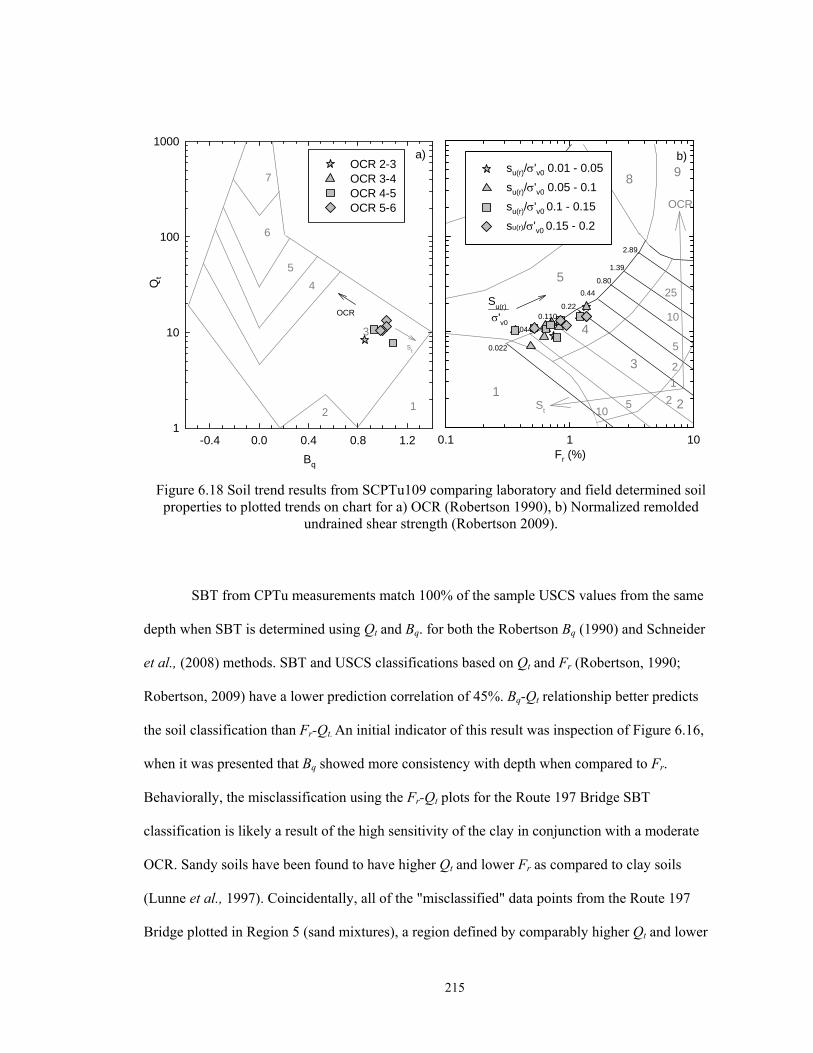
215
Figure 6.18 Soil trend results from SCPTu109 comparing laboratory and field determined soil properties to plotted trends on chart for a) OCR (Robertson 1990), b) Normalized remolded
undrained shear strength (Robertson 2009).
SBT from CPTu measurements match 100% of the sample USCS values from the same
depth when SBT is determined using Qt and Bq. for both the Robertson Bq (1990) and Schneider
et al., (2008) methods. SBT and USCS classifications based on Qt and Fr (Robertson, 1990;
Robertson, 2009) have a lower prediction correlation of 45%. Bq-Qt relationship better predicts
the soil classification than Fr-Qt. An initial indicator of this result was inspection of Figure 6.16,
when it was presented that Bq showed more consistency with depth when compared to Fr.
Behaviorally, the misclassification using the Fr-Qt plots for the Route 197 Bridge SBT
classification is likely a result of the high sensitivity of the clay in conjunction with a moderate
OCR. Sandy soils have been found to have higher Qt and lower Fr as compared to clay soils
(Lunne et al., 1997). Coincidentally, all of the "misclassified" data points from the Route 197
Bridge plotted in Region 5 (sand mixtures), a region defined by comparably higher Qt and lower
Bq
-0.4 0.0 0.4 0.8 1.2
Qt
1
10
100
1000
OCR 2-3OCR 3-4OCR 4-5OCR 5-6
7
6
5
4
3
2 1
OCR
st
a)
0.22
7
6
5
8 9
4
3
21
St
OCR
0.022
0.044
0.44
0.80
2.89
0.110
1.39
Su(r)
'v0
105 2
2
5
10
25
1
b)
Fr (%)0.1 1 10
su(r)/'v0 0.01 - 0.05
su(r)/'v0 0.05 - 0.1
su(r)/'v0 0.1 - 0.15
su(r)/'v0 0.15 - 0.2

216
Fr (Figure 8.8). Higher OCR will cause tip resistance (and hence Qt) to increase, while high
sensitivity will cause sleeve friction (and hence Fr) to decrease. The combination of these two
behaviors imitates the behavior of a weak sand, which is exactly where the "misclassified" data
points plot (i.e., in the sand mixture region, but close to the border of silt mixtures).
SBT charts in Figure 6.18 additionally provide information for using Qt, Fr, and Bq to
predict changes in OCR, values of su(r) normalized by 'v0 (su(r)/'v0), and sensitivity, St. Figure
6.18a illustrates that Qt vs. Bq is not useful in estimating the relative OCR difference for soil over
the depth of the deposit at the site. The data are clustered even though OCR ranges between 2 and
6 at the site. Figure 6.18a does not appear to be particularly useful for estimating changes in
sensitivity. Sensitivity values were found to vary significantly with depth between 7.5 and 45.0
using the fall cone test (Table 6.3), and on Figure 6.18a the plotted data remained clustered within
a small portion of the plot, suggesting a constant sensitivity. Figure 6.18b illustrates Qt vs. Fr data
for SCPTu 109 categorically separated by a range of su(r)/'v0 measured from field vane shear tests
and laboratory fall cone index tests on samples from BB-RDKR-206. In situ and laboratory
measured su(r)/'v0 values are less than 0.2, and generally plot within the appropriate range shown
in Figure 6.18b, however the data are clustered and interspersed and show no real trend of
increasing su(r)/'v0 up and to the right. Also, a few data plot in regions that predict su(r)/'v0 values
greater than have been measured. Overall, Figure 6.18b does not significantly over predict the
range of su(r)/'v0 within the deposit and may only be useful for preliminary site assessment before
FVT or other testing can be completed.
6.3.3 Correlations to Stress History
CPTu soundings data were correlated to measured stress history of the site using the k-
value correlation method outlined in Section 2.3.2. Using Equation 2.7, k-values were back-
calculated using preconsolidation pressure (’p) determined from CRS testing of laboratory
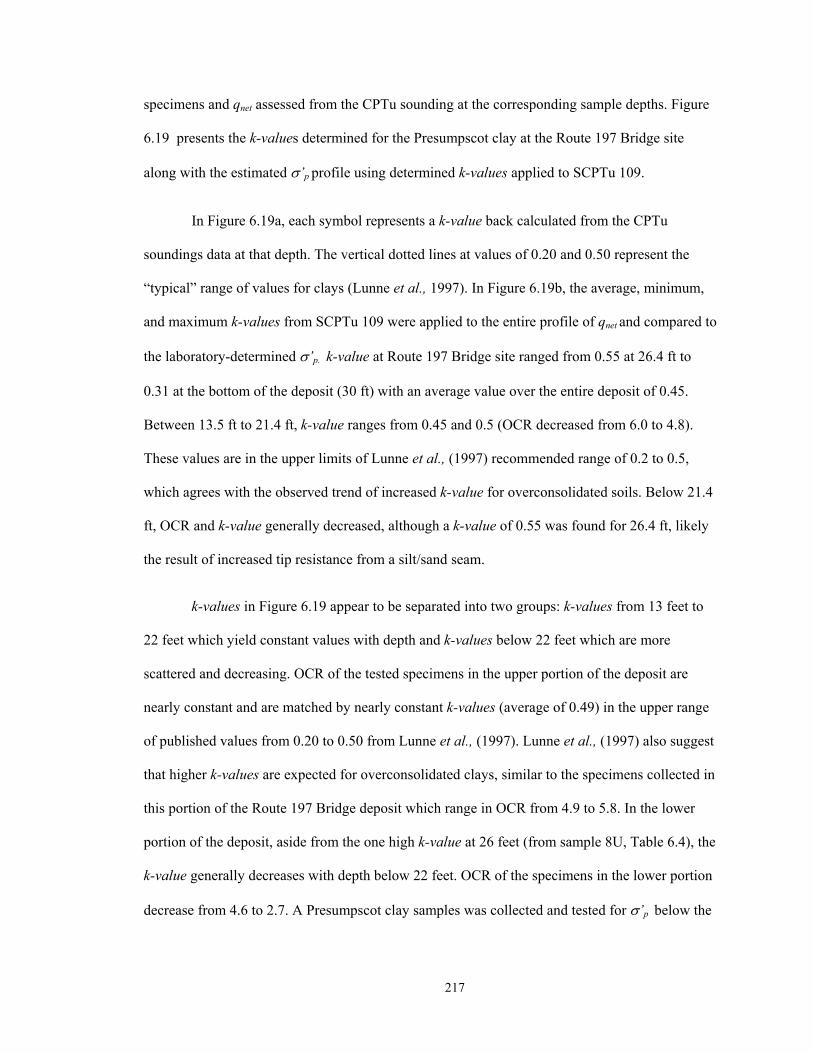
217
specimens and qnet assessed from the CPTu sounding at the corresponding sample depths. Figure
6.19 presents the k-values determined for the Presumpscot clay at the Route 197 Bridge site
along with the estimated ’p profile using determined k-values applied to SCPTu 109.
In Figure 6.19a, each symbol represents a k-value back calculated from the CPTu
soundings data at that depth. The vertical dotted lines at values of 0.20 and 0.50 represent the
“typical” range of values for clays (Lunne et al., 1997). In Figure 6.19b, the average, minimum,
and maximum k-values from SCPTu 109 were applied to the entire profile of qnet and compared to
the laboratory-determined ’p. k-value at Route 197 Bridge site ranged from 0.55 at 26.4 ft to
0.31 at the bottom of the deposit (30 ft) with an average value over the entire deposit of 0.45.
Between 13.5 ft to 21.4 ft, k-value ranges from 0.45 and 0.5 (OCR decreased from 6.0 to 4.8).
These values are in the upper limits of Lunne et al., (1997) recommended range of 0.2 to 0.5,
which agrees with the observed trend of increased k-value for overconsolidated soils. Below 21.4
ft, OCR and k-value generally decreased, although a k-value of 0.55 was found for 26.4 ft, likely
the result of increased tip resistance from a silt/sand seam.
k-values in Figure 6.19 appear to be separated into two groups: k-values from 13 feet to
22 feet which yield constant values with depth and k-values below 22 feet which are more
scattered and decreasing. OCR of the tested specimens in the upper portion of the deposit are
nearly constant and are matched by nearly constant k-values (average of 0.49) in the upper range
of published values from 0.20 to 0.50 from Lunne et al., (1997). Lunne et al., (1997) also suggest
that higher k-values are expected for overconsolidated clays, similar to the specimens collected in
this portion of the Route 197 Bridge deposit which range in OCR from 4.9 to 5.8. In the lower
portion of the deposit, aside from the one high k-value at 26 feet (from sample 8U, Table 6.4), the
k-value generally decreases with depth below 22 feet. OCR of the specimens in the lower portion
decrease from 4.6 to 2.7. A Presumpscot clay samples was collected and tested for ’p below the
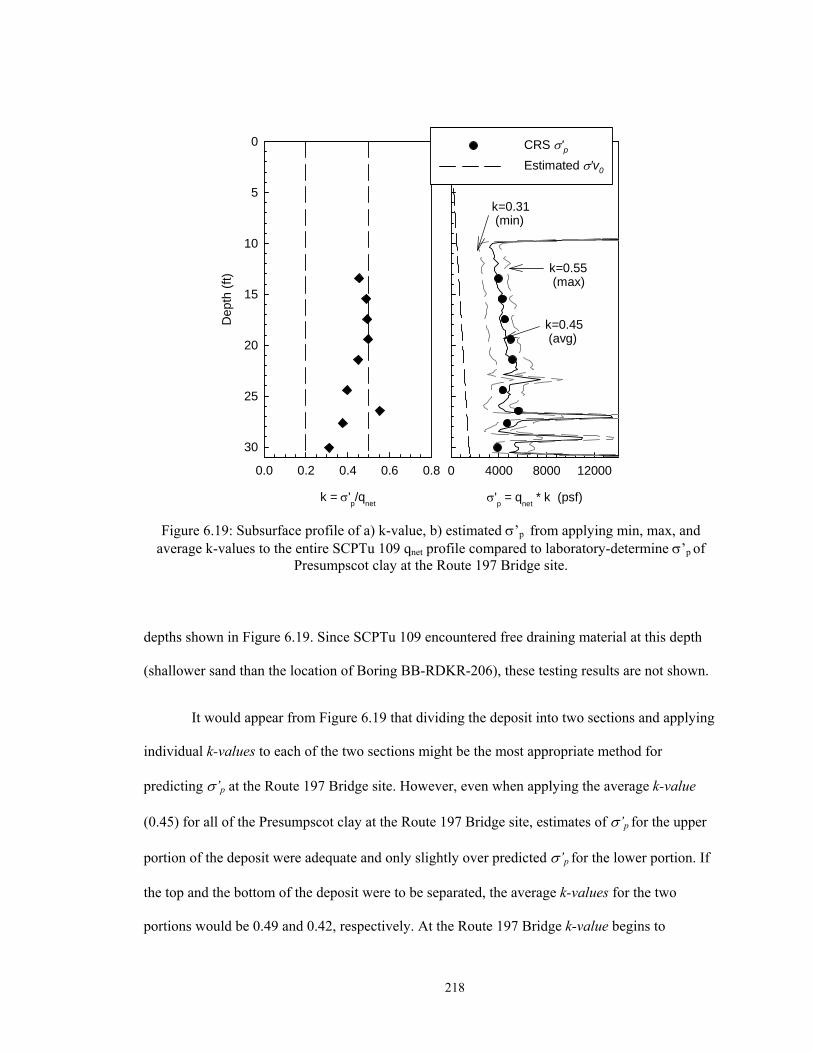
218
Figure 6.19: Subsurface profile of a) k-value, b) estimated ’p from applying min, max, and average k-values to the entire SCPTu 109 qnet profile compared to laboratory-determine ’p of
Presumpscot clay at the Route 197 Bridge site.
depths shown in Figure 6.19. Since SCPTu 109 encountered free draining material at this depth
(shallower sand than the location of Boring BB-RDKR-206), these testing results are not shown.
It would appear from Figure 6.19 that dividing the deposit into two sections and applying
individual k-values to each of the two sections might be the most appropriate method for
predicting ’p at the Route 197 Bridge site. However, even when applying the average k-value
(0.45) for all of the Presumpscot clay at the Route 197 Bridge site, estimates of ’p for the upper
portion of the deposit were adequate and only slightly over predicted ’p for the lower portion. If
the top and the bottom of the deposit were to be separated, the average k-values for the two
portions would be 0.49 and 0.42, respectively. At the Route 197 Bridge k-value begins to
k = 'p/q
net
0.0 0.2 0.4 0.6 0.8
Dep
th (
ft)
0
5
10
15
20
25
30
'p = qnet
* k (psf)
0 4000 8000 12000
CRS 'pEstimated 'v0
k=0.31 (min)
k=0.45 (avg)
k=0.55 (max)
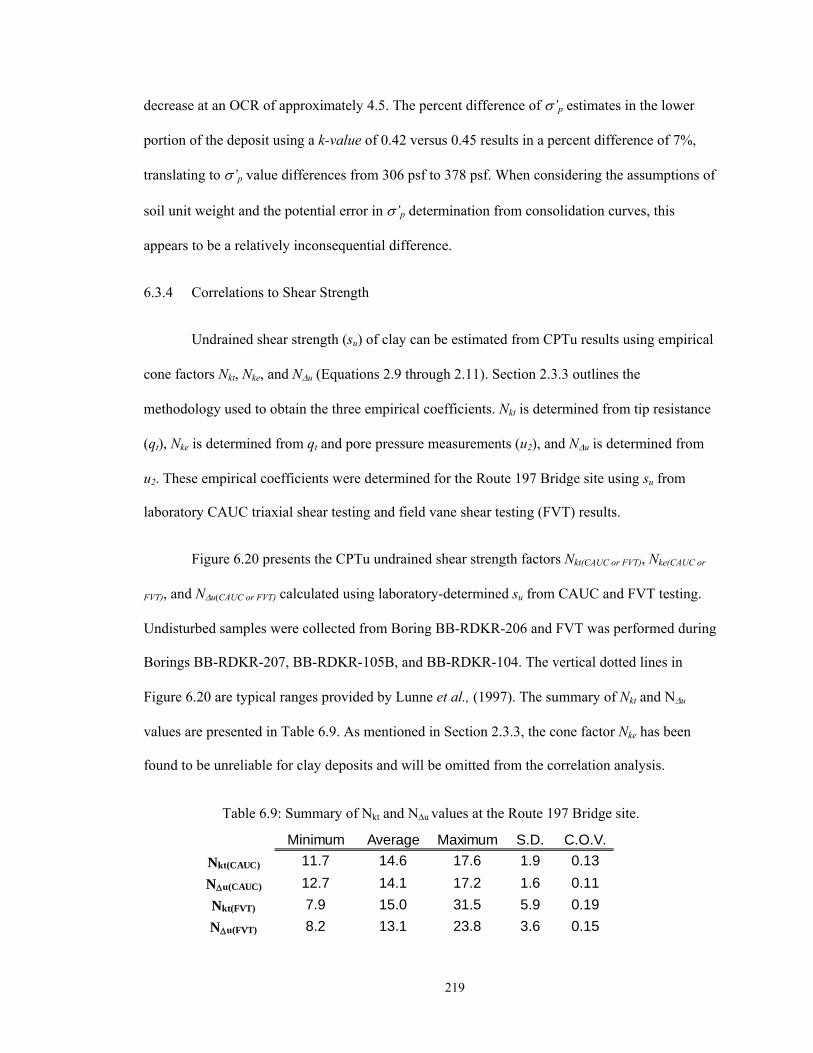
219
decrease at an OCR of approximately 4.5. The percent difference of ’p estimates in the lower
portion of the deposit using a k-value of 0.42 versus 0.45 results in a percent difference of 7%,
translating to ’p value differences from 306 psf to 378 psf. When considering the assumptions of
soil unit weight and the potential error in ’p determination from consolidation curves, this
appears to be a relatively inconsequential difference.
6.3.4 Correlations to Shear Strength
Undrained shear strength (su) of clay can be estimated from CPTu results using empirical
cone factors Nkt, Nke, and Nu (Equations 2.9 through 2.11). Section 2.3.3 outlines the
methodology used to obtain the three empirical coefficients. Nkt is determined from tip resistance
(qt), Nke is determined from qt and pore pressure measurements (u2), and Nu is determined from
u2. These empirical coefficients were determined for the Route 197 Bridge site using su from
laboratory CAUC triaxial shear testing and field vane shear testing (FVT) results.
Figure 6.20 presents the CPTu undrained shear strength factors Nkt(CAUC or FVT), Nke(CAUC or
FVT), and Nu(CAUC or FVT) calculated using laboratory-determined su from CAUC and FVT testing.
Undisturbed samples were collected from Boring BB-RDKR-206 and FVT was performed during
Borings BB-RDKR-207, BB-RDKR-105B, and BB-RDKR-104. The vertical dotted lines in
Figure 6.20 are typical ranges provided by Lunne et al., (1997). The summary of Nkt and Nu
values are presented in Table 6.9. As mentioned in Section 2.3.3, the cone factor Nke has been
found to be unreliable for clay deposits and will be omitted from the correlation analysis.
Table 6.9: Summary of Nkt and Nu values at the Route 197 Bridge site.
Minimum Average Maximum S.D. C.O.V.
Nkt(CAUC) 11.7 14.6 17.6 1.9 0.13
Nu(CAUC) 12.7 14.1 17.2 1.6 0.11
Nkt(FVT) 7.9 15.0 31.5 5.9 0.19
Nu(FVT) 8.2 13.1 23.8 3.6 0.15

220
Figure 6.20 : Subsurface profiles of Nkt, Nu, and Nke correlated from SCPTu109 with su from CAUC triaxial and field vane testing of Presumpscot clay at the Route 197 Bridge site.
Correlating to tip resistance, Nkt(CAUC) at the Route 197 Bridge site ranged from 11.7 to
17.6, with an average value 14.6. Nkt(CAUC) decreases from 16.7 to 13.0 from depth 13.5 feet to
19.4 feet. Below 19.4 feet, Nkt(CAUC) values become more variable with depth, ranging between
11.7 and 17.6 without an apparent trend with ’v0 increase or clay properties. The coefficient of
variation for Nkt(CAUC) at the Route 197 Bridge site is 0.13. Nkt(FVT) at the site showed good
agreement with Nkt(CAUC), indicating consistent undrained shear strength (su) from both the CAUC
and FVT throughout the Presumpscot clay. Nkt(FVT) at the site ranged from 7.9 to 31.5 with an
average of 15.0 and a coefficient of variation of 0.19.
Calibrating to pore pressure and tip resistance, Nu(CAUC) ranged from 12.7 to 17.2 with an
average of 14.1 and a coefficient of variation of 0.11 at the Route 197 Bridge site. Similarly with
Nkt(CAUC), Nu(CAUC) values decreased in magnitude from depth 13.5 feet to 19.4 feet. However,
Nu(CAUC and FVT) = (u2-u0)/su
0 5 10 15 20 25
Nkt(CAUC and FVT) = (qt-v0)/su
0 5 10 15 20 25
Dep
th (
ft)
0
5
10
15
20
25
30
BB-207 field vaneBB-105B field vaneBB-104 field vaneBB-206 CAUC
Nke(CAUC and FVT)= (qt-u2)/su
0 5 10 15 20 25
0 2 4 6
10
15
20
25
30
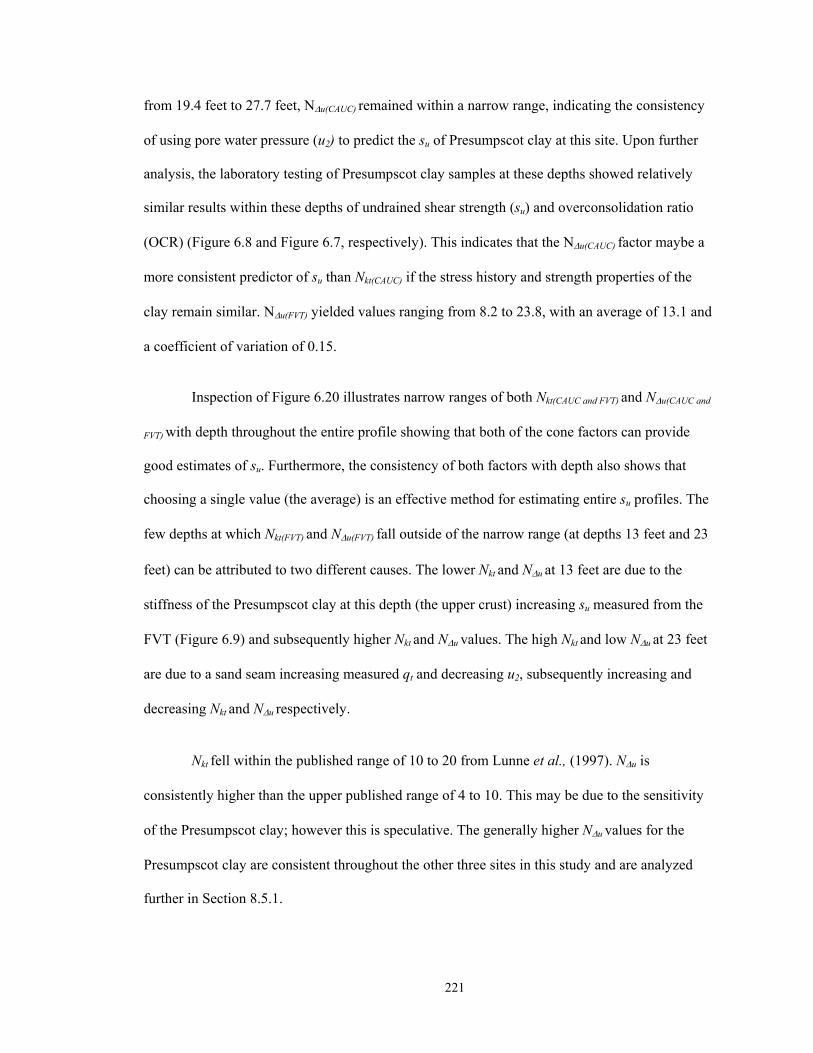
221
from 19.4 feet to 27.7 feet, Nu(CAUC) remained within a narrow range, indicating the consistency
of using pore water pressure (u2) to predict the su of Presumpscot clay at this site. Upon further
analysis, the laboratory testing of Presumpscot clay samples at these depths showed relatively
similar results within these depths of undrained shear strength (su) and overconsolidation ratio
(OCR) (Figure 6.8 and Figure 6.7, respectively). This indicates that the Nu(CAUC) factor maybe a
more consistent predictor of su than Nkt(CAUC) if the stress history and strength properties of the
clay remain similar. Nu(FVT) yielded values ranging from 8.2 to 23.8, with an average of 13.1 and
a coefficient of variation of 0.15.
Inspection of Figure 6.20 illustrates narrow ranges of both Nkt(CAUC and FVT) and Nu(CAUC and
FVT) with depth throughout the entire profile showing that both of the cone factors can provide
good estimates of su. Furthermore, the consistency of both factors with depth also shows that
choosing a single value (the average) is an effective method for estimating entire su profiles. The
few depths at which Nkt(FVT) and Nu(FVT) fall outside of the narrow range (at depths 13 feet and 23
feet) can be attributed to two different causes. The lower Nkt and Nu at 13 feet are due to the
stiffness of the Presumpscot clay at this depth (the upper crust) increasing su measured from the
FVT (Figure 6.9) and subsequently higher Nkt and Nu values. The high Nkt and low Nu at 23 feet
are due to a sand seam increasing measured qt and decreasing u2, subsequently increasing and
decreasing Nkt and Nu respectively.
Nkt fell within the published range of 10 to 20 from Lunne et al., (1997). Nu is
consistently higher than the upper published range of 4 to 10. This may be due to the sensitivity
of the Presumpscot clay; however this is speculative. The generally higher Nu values for the
Presumpscot clay are consistent throughout the other three sites in this study and are analyzed
further in Section 8.5.1.
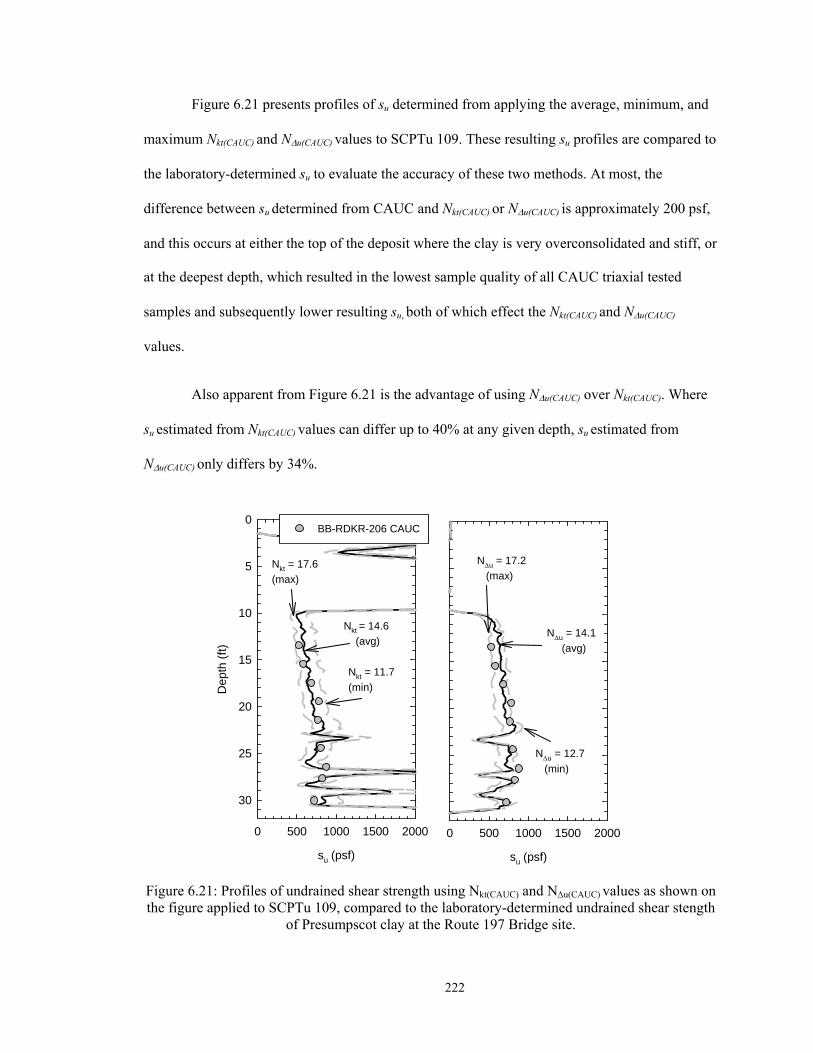
222
Figure 6.21 presents profiles of su determined from applying the average, minimum, and
maximum Nkt(CAUC) and Nu(CAUC) values to SCPTu 109. These resulting su profiles are compared to
the laboratory-determined su to evaluate the accuracy of these two methods. At most, the
difference between su determined from CAUC and Nkt(CAUC) or Nu(CAUC) is approximately 200 psf,
and this occurs at either the top of the deposit where the clay is very overconsolidated and stiff, or
at the deepest depth, which resulted in the lowest sample quality of all CAUC triaxial tested
samples and subsequently lower resulting su, both of which effect the Nkt(CAUC) and Nu(CAUC)
values.
Also apparent from Figure 6.21 is the advantage of using Nu(CAUC) over Nkt(CAUC). Where
su estimated from Nkt(CAUC) values can differ up to 40% at any given depth, su estimated from
Nu(CAUC) only differs by 34%.
Figure 6.21: Profiles of undrained shear strength using Nkt(CAUC) and Nu(CAUC) values as shown on the figure applied to SCPTu 109, compared to the laboratory-determined undrained shear stength
of Presumpscot clay at the Route 197 Bridge site.
su (psf)
0 500 1000 1500 2000
Dep
th (
ft)
0
5
10
15
20
25
30
BB-RDKR-206 CAUC
Nkt = 14.6
(avg)
Nkt = 11.7
(min)
Nkt = 17.6
(max)
su (psf)
0 500 1000 1500 2000
Nu = 17.2
(max)
Nu = 14.1
(avg)
Nu = 12.7
(min)

223
When classifying the Presumpscot clay at the Route 197 Bridge site, SBT charts based on
Bq-Qt relationship should be used. Due to the slight overconsolidation of the clay combined with
its sensitivity, the Fr-Qt relationship resulted in the clay classifying as a silt or sand mixture.
When using the Robertson (199) Bq-Qt chart, the sensitivity of the clay was not identified,
however; the Schneider et al., (2008) plot did correctly classify the deposit as sensitive clay.
Stress history of the Presumpscot clay at the site can be reasonably predicted using a k-value of
0.45 applied to the entire deposit. If desired, using a k-value of 0.42 for the deposit where OCR
falls below 4.5 provided a 7% increase in ’p estimates.
The su profile of the Presumpscot clay at the Route 197 Bridge was most effectively
estimated from CPTu results using an Nu of 14.1 applied to the entire profile. Using an Nkt(CAUC)
value of 14.6 also provided good estimates. Overall, Nkt and Nu values ranged from 11.7 to 17.6
and 12.7 to 17.2, respectively and remained relatively constant with depth. While Nkt values agree
well with published ranges, Nu is higher than similar CPTu studies in other clays. As expected,
Nkt(FVT) and Nu(FVT) values were a little more scattered, however, in general they followed the
laboratory correlated values well.
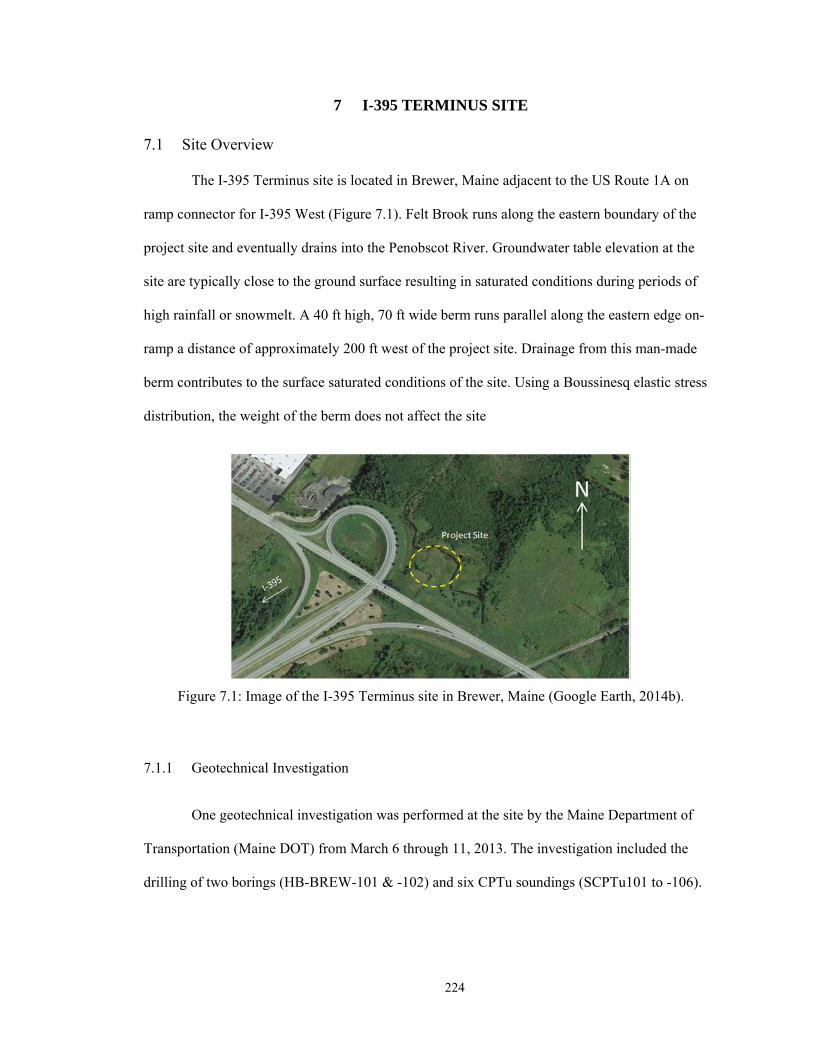
224
7 I-395 TERMINUS SITE
7.1 Site Overview
The I-395 Terminus site is located in Brewer, Maine adjacent to the US Route 1A on
ramp connector for I-395 West (Figure 7.1). Felt Brook runs along the eastern boundary of the
project site and eventually drains into the Penobscot River. Groundwater table elevation at the
site are typically close to the ground surface resulting in saturated conditions during periods of
high rainfall or snowmelt. A 40 ft high, 70 ft wide berm runs parallel along the eastern edge on-
ramp a distance of approximately 200 ft west of the project site. Drainage from this man-made
berm contributes to the surface saturated conditions of the site. Using a Boussinesq elastic stress
distribution, the weight of the berm does not affect the site
Figure 7.1: Image of the I-395 Terminus site in Brewer, Maine (Google Earth, 2014b).
7.1.1 Geotechnical Investigation
One geotechnical investigation was performed at the site by the Maine Department of
Transportation (Maine DOT) from March 6 through 11, 2013. The investigation included the
drilling of two borings (HB-BREW-101 & -102) and six CPTu soundings (SCPTu101 to -106).
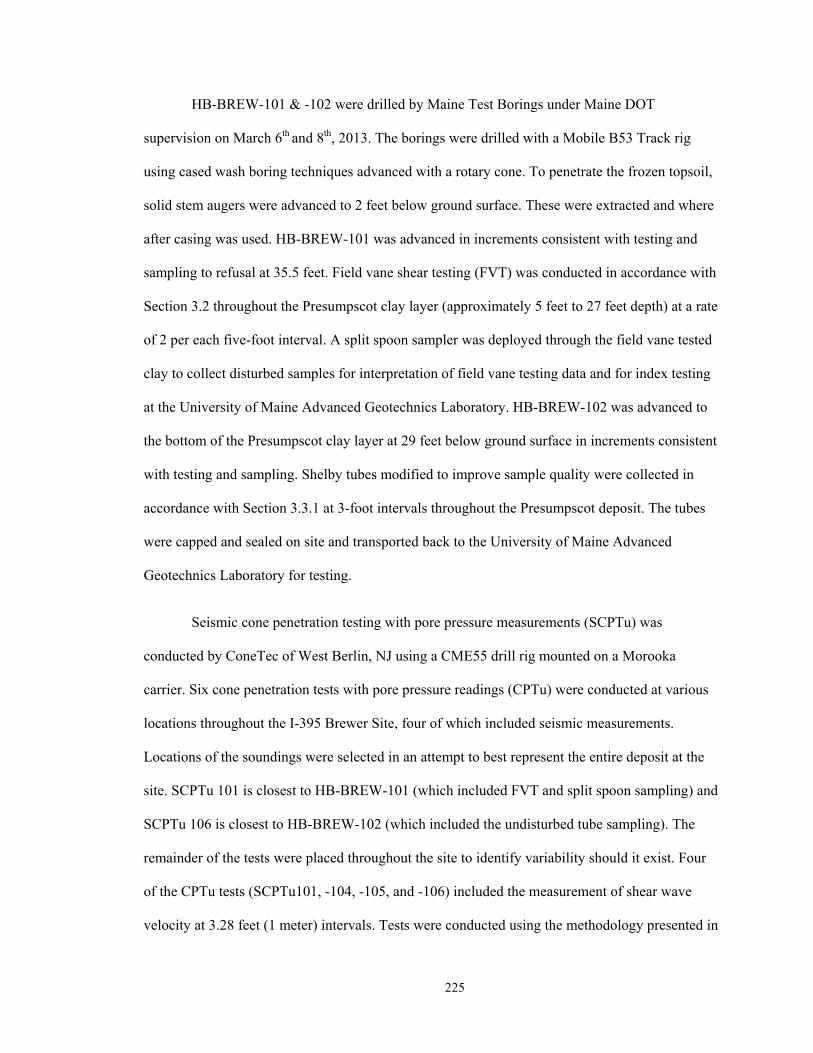
225
HB-BREW-101 & -102 were drilled by Maine Test Borings under Maine DOT
supervision on March 6th and 8th, 2013. The borings were drilled with a Mobile B53 Track rig
using cased wash boring techniques advanced with a rotary cone. To penetrate the frozen topsoil,
solid stem augers were advanced to 2 feet below ground surface. These were extracted and where
after casing was used. HB-BREW-101 was advanced in increments consistent with testing and
sampling to refusal at 35.5 feet. Field vane shear testing (FVT) was conducted in accordance with
Section 3.2 throughout the Presumpscot clay layer (approximately 5 feet to 27 feet depth) at a rate
of 2 per each five-foot interval. A split spoon sampler was deployed through the field vane tested
clay to collect disturbed samples for interpretation of field vane testing data and for index testing
at the University of Maine Advanced Geotechnics Laboratory. HB-BREW-102 was advanced to
the bottom of the Presumpscot clay layer at 29 feet below ground surface in increments consistent
with testing and sampling. Shelby tubes modified to improve sample quality were collected in
accordance with Section 3.3.1 at 3-foot intervals throughout the Presumpscot deposit. The tubes
were capped and sealed on site and transported back to the University of Maine Advanced
Geotechnics Laboratory for testing.
Seismic cone penetration testing with pore pressure measurements (SCPTu) was
conducted by ConeTec of West Berlin, NJ using a CME55 drill rig mounted on a Morooka
carrier. Six cone penetration tests with pore pressure readings (CPTu) were conducted at various
locations throughout the I-395 Brewer Site, four of which included seismic measurements.
Locations of the soundings were selected in an attempt to best represent the entire deposit at the
site. SCPTu 101 is closest to HB-BREW-101 (which included FVT and split spoon sampling) and
SCPTu 106 is closest to HB-BREW-102 (which included the undisturbed tube sampling). The
remainder of the tests were placed throughout the site to identify variability should it exist. Four
of the CPTu tests (SCPTu101, -104, -105, and -106) included the measurement of shear wave
velocity at 3.28 feet (1 meter) intervals. Tests were conducted using the methodology presented in
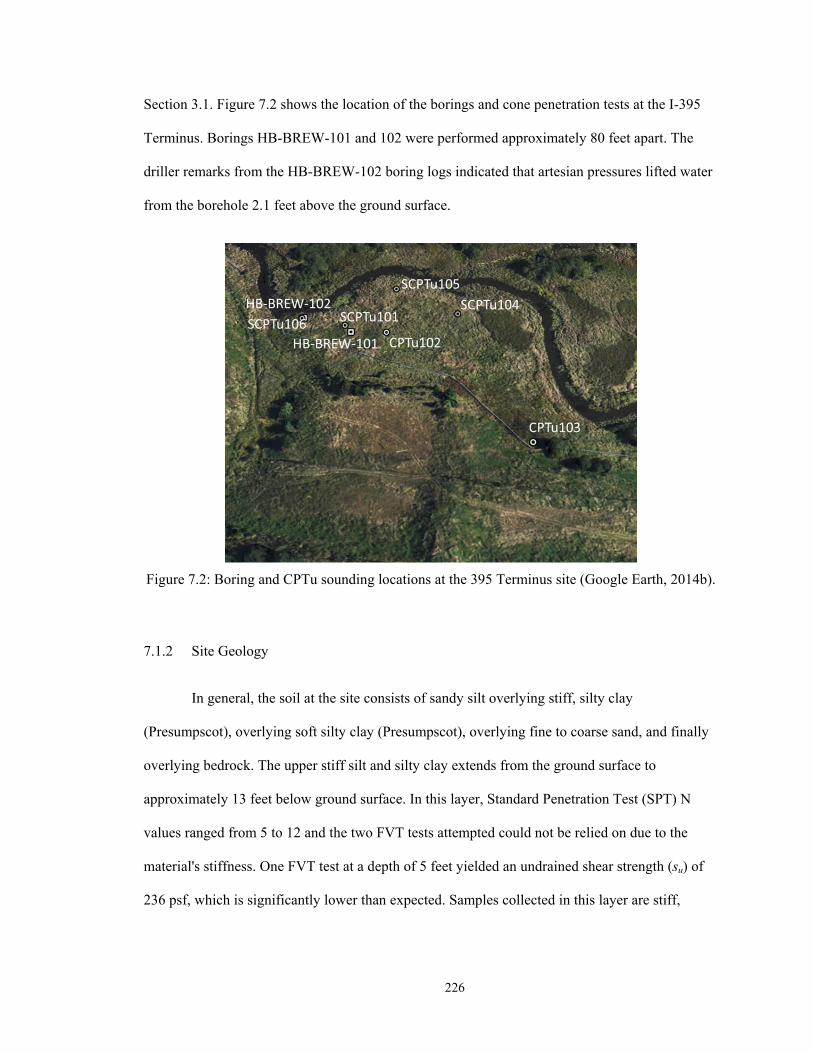
226
Section 3.1. Figure 7.2 shows the location of the borings and cone penetration tests at the I-395
Terminus. Borings HB-BREW-101 and 102 were performed approximately 80 feet apart. The
driller remarks from the HB-BREW-102 boring logs indicated that artesian pressures lifted water
from the borehole 2.1 feet above the ground surface.
Figure 7.2: Boring and CPTu sounding locations at the 395 Terminus site (Google Earth, 2014b).
7.1.2 Site Geology
In general, the soil at the site consists of sandy silt overlying stiff, silty clay
(Presumpscot), overlying soft silty clay (Presumpscot), overlying fine to coarse sand, and finally
overlying bedrock. The upper stiff silt and silty clay extends from the ground surface to
approximately 13 feet below ground surface. In this layer, Standard Penetration Test (SPT) N
values ranged from 5 to 12 and the two FVT tests attempted could not be relied on due to the
material's stiffness. One FVT test at a depth of 5 feet yielded an undrained shear strength (su) of
236 psf, which is significantly lower than expected. Samples collected in this layer are stiff,
227
blocky and mottled, indicating significant overconsolidation possible due to groundwater table
fluctuations through this layer.
The soft, silty clay extends from 13 feet below ground surface to approximately 28 feet
below ground surface. A total of six field vanes were performed in this layer, resulting in su
values ranging from 228 psf to 446 psf. The material below the Presumpscot clay is a gray, wet
fine to coarse sand with some gravel and trace silt. This layer extends from approximately 28 feet
below ground surface to bedrock at 35.5 feet.
The deposition of the Presumpscot clay at the I-395 Terminus site differs from the coastal
settings of the deposits investigated at the other three research sites in this study. The site is
located at an approximate elevation of 83 feet above current mean sea level (MSL). Therefore sea
level rise during deglaciation, which caused the deposition of the Presumpscot, did not reach
much higher than this site. In fact, the site is approaching the inland boundary of the Presumpscot
clay illustrated in Figure 1.1. Beyond this boundary, the topography was too high to be
submerged by the rising sea level therefore resulting in no marine water, and no Presumpscot
clay. Refer back to Section 2.1 for further discussion of the Presumpscot clay’s geologic
deposition.
The shallow marine environment of the I-395 Terminus site at the time of the
Presumpscot clay deposition effected the composition of the clay. Shallow waters create a higher
energy environment as compared to deep marine waters. Inflow of glacial meltwater streams or
tidal changes likely encouraged the finer-grained particles (clay) to be washed out further to sea
to a lower energy environment where they could settle to the seabed. The coarser grained (silt)
particles remained within the shallow marine environment since they are more resistant to the
turbulence, creating sediment which would be higher in silt content than clay content.

228
7.2 Laboratory Characterization
Nine modified Shelby tube samples of Presumpscot clay were collected from Boring HB-
BREW-102 at the I-395 Terminus site for laboratory testing of index, consolidation, and shear
strength properties at the University of Maine Advanced Geotechnics Laboratory. All testing
methods were performed in general accordance with applicable ASTM standards and methods
outlined in Chapter 3. Figure 7.3 illustrates the portion of each tube sample used for testing. The
clay in sample tube 3U contained a large lateral crack running continuously through the entire
sample, so undisturbed consolidation and triaxial testing was not possible. This may be attributed
to the artesian pressures present at this depth (Section 7.3.1).
7.2.1 Index Test Results
Figure 7.4 illustrates the results of natural water content, Atterberg limits, grain size
distribution, index undrained shear strength (su) and index remolded undrained shear strength
(su(r)) measured using the fall cone apparatus, organic content, and unit weight (total, dry, and
solids) of Presumpscot clay from the tube samples. Table 7.1 and 7.2 summarize these results.
Water content of the clay ranged from 22.6% to 40.2% over the entire deposit. In the top
13 feet, water content increased gradually with depth from 22.6% to 28.4%, generally following
the increase of clay content. Within this upper zone, samples in the laboratory were visibly
mottled and stiffer, indicating groundwater fluctuations through the clay played a role in the
decreasing the water content. Below 13 feet, water content increased from 28.4% to 40.2% at
19.8 feet (where clay content was the highest), and subsequently decreased with depth to 28.7%
at 28.5 feet. Plastic limit remained within a narrow range of 19 to 22 for the entire deposit and
liquid limit showed a similar increase to approximately 20 feet, then decreases with depth,
ranging from 31 to 37. Similar to water content, liquid limit trends also appeared to be directly
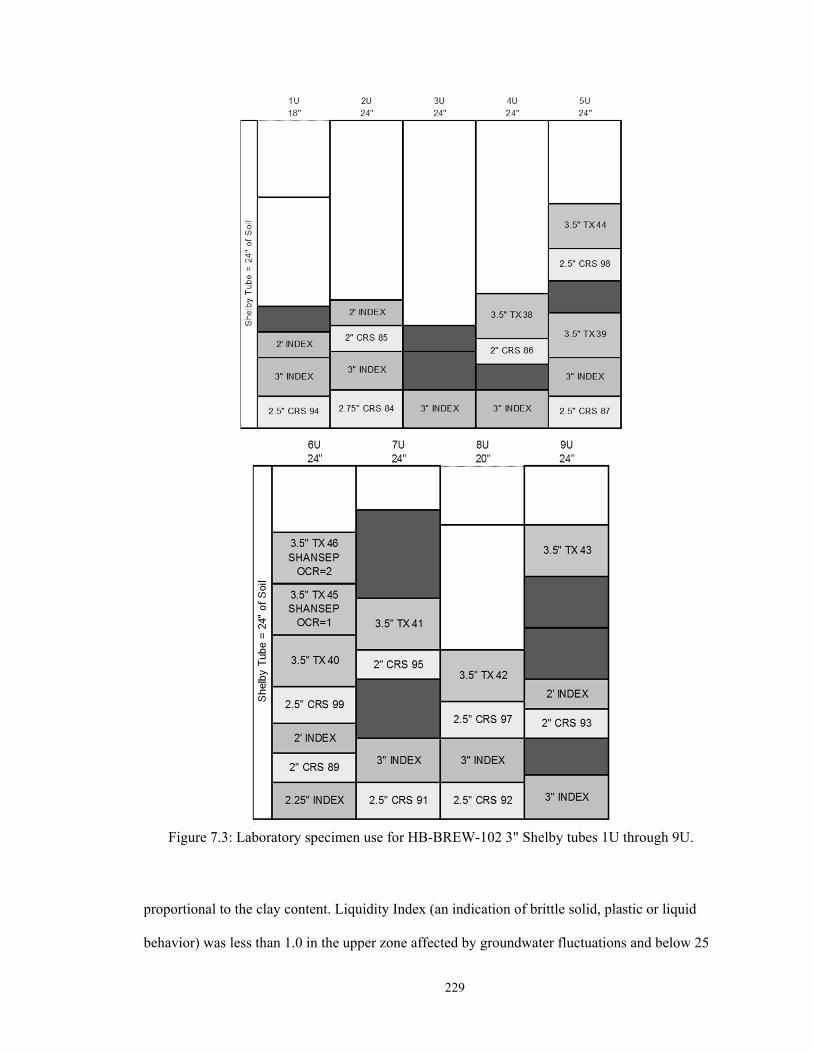
229
Figure 7.3: Laboratory specimen use for HB-BREW-102 3" Shelby tubes 1U through 9U.
proportional to the clay content. Liquidity Index (an indication of brittle solid, plastic or liquid
behavior) was less than 1.0 in the upper zone affected by groundwater fluctuations and below 25
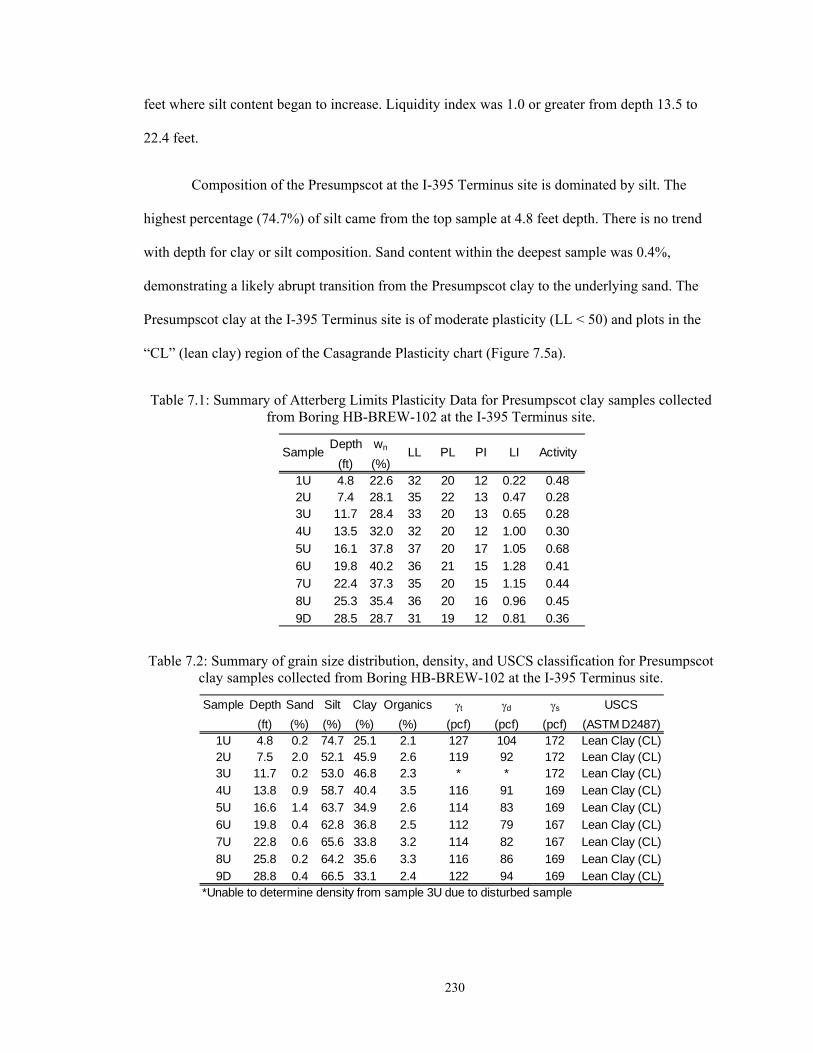
230
feet where silt content began to increase. Liquidity index was 1.0 or greater from depth 13.5 to
22.4 feet.
Composition of the Presumpscot at the I-395 Terminus site is dominated by silt. The
highest percentage (74.7%) of silt came from the top sample at 4.8 feet depth. There is no trend
with depth for clay or silt composition. Sand content within the deepest sample was 0.4%,
demonstrating a likely abrupt transition from the Presumpscot clay to the underlying sand. The
Presumpscot clay at the I-395 Terminus site is of moderate plasticity (LL < 50) and plots in the
“CL” (lean clay) region of the Casagrande Plasticity chart (Figure 7.5a).
Table 7.1: Summary of Atterberg Limits Plasticity Data for Presumpscot clay samples collected from Boring HB-BREW-102 at the I-395 Terminus site.
Table 7.2: Summary of grain size distribution, density, and USCS classification for Presumpscot clay samples collected from Boring HB-BREW-102 at the I-395 Terminus site.
Depth wn
(ft) (%)1U 4.8 22.6 32 20 12 0.22 0.482U 7.4 28.1 35 22 13 0.47 0.283U 11.7 28.4 33 20 13 0.65 0.28
4U 13.5 32.0 32 20 12 1.00 0.30
5U 16.1 37.8 37 20 17 1.05 0.68
6U 19.8 40.2 36 21 15 1.28 0.41
7U 22.4 37.3 35 20 15 1.15 0.44
8U 25.3 35.4 36 20 16 0.96 0.45
9D 28.5 28.7 31 19 12 0.81 0.36
ActivityLL PL PI LISample
Sample Depth Sand Silt Clay Organics t d s USCS
(ft) (%) (%) (%) (%) (pcf) (pcf) (pcf) (ASTM D2487)1U 4.8 0.2 74.7 25.1 2.1 127 104 172 Lean Clay (CL)2U 7.5 2.0 52.1 45.9 2.6 119 92 172 Lean Clay (CL)3U 11.7 0.2 53.0 46.8 2.3 * * 172 Lean Clay (CL)4U 13.8 0.9 58.7 40.4 3.5 116 91 169 Lean Clay (CL)
5U 16.6 1.4 63.7 34.9 2.6 114 83 169 Lean Clay (CL)
6U 19.8 0.4 62.8 36.8 2.5 112 79 167 Lean Clay (CL)
7U 22.8 0.6 65.6 33.8 3.2 114 82 167 Lean Clay (CL)
8U 25.8 0.2 64.2 35.6 3.3 116 86 169 Lean Clay (CL)
9D 28.8 0.4 66.5 33.1 2.4 122 94 169 Lean Clay (CL)*Unable to determine density from sample 3U due to disturbed sample
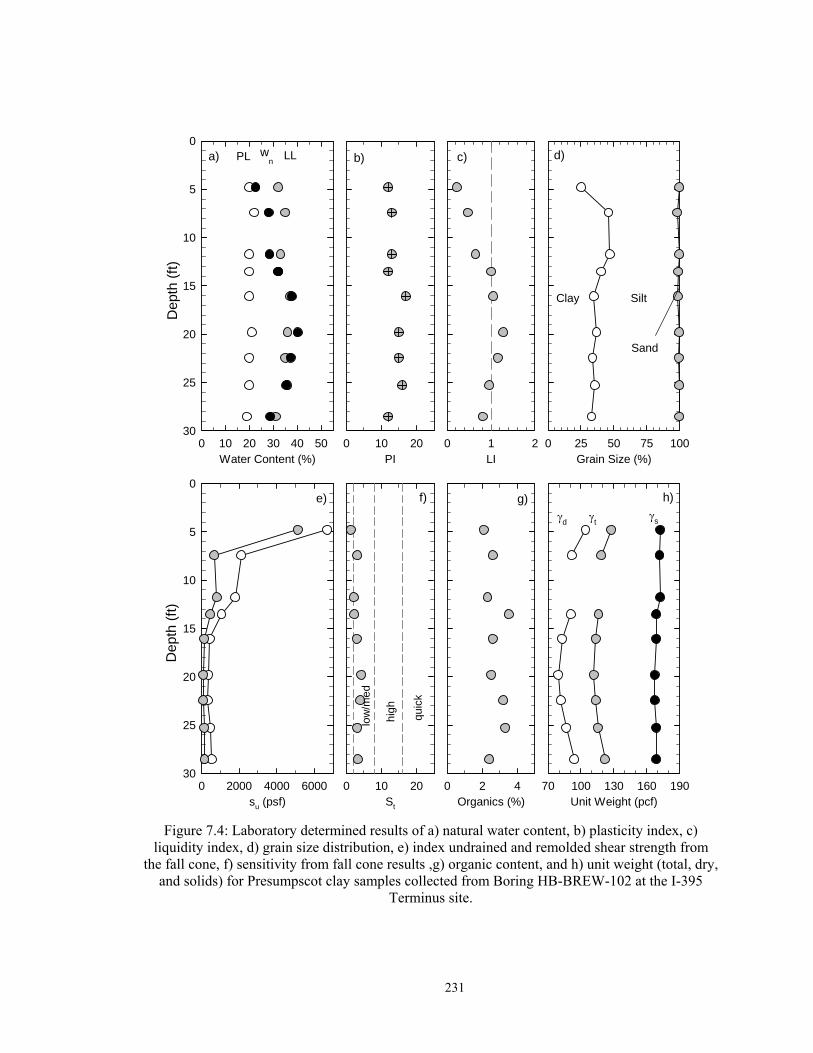
231
Figure 7.4: Laboratory determined results of a) natural water content, b) plasticity index, c) liquidity index, d) grain size distribution, e) index undrained and remolded shear strength from
the fall cone, f) sensitivity from fall cone results ,g) organic content, and h) unit weight (total, dry, and solids) for Presumpscot clay samples collected from Boring HB-BREW-102 at the I-395
Terminus site.
LI0 1 2
Unit Weight (pcf)70 100 130 160 190
su (psf)0 2000 4000 6000
Dep
th (
ft)
0
5
10
15
20
25
30
Organics (%)0 2 4
St
0 10 20
Grain Size (%)0 25 50 75 100
PI0 10 20
Water Content (%)0 10 20 30 40 50
Dep
th (
ft)
0
5
10
15
20
25
30
PL
SiltClay
Sand
std
wna) b) c) d)
e) f) g) h)
LL
low
/me
d
hig
h
qu
ick

232
Sand content ranged from 0.2 to 2.0%. Some fine to coarse sand and gravel was removed
from the bottom of tube sample 9U before index tests were completed. Organic content of the
clay ranged from 2.1% to 3.5%, which is below the range that affects index behavior (Mitchell &
Soga, 2005). Activity, defined at the ratio of plastic limit to clay fraction (Figure 7.5b) ranged
from 0.28 to 0.68 and plots near the “Kaolinite” mineralogy line. As discussed in Section 2.1.2,
the clay fraction is likely overestimated from the hydrometer test due to the presence of rock flour
and the actual mineralogy of the samples is dominated by illite (although no X-ray diffraction
tests were performed to determine this).
Figure 7.5: USCS Classification Charts using Atterberg Limits for Presumpscot clay samples collected from Boring HB-BREW-102 at the I-395 Terminus site.
Sensitivity, defined as the ratio of undrained shear strength (su) to remolded shear
strength (su(r)), was performed in the laboratory on unconfined portions of tube samples at the
natural water content using the fall cone apparatus. Remolded state of the soil was obtained by
removing the clay from the tube and mechanically mixing until complete structure breakdown.
Sensitivity of a material provides insight of the structuring of the clay platelets and post-shear
behavior. Sensitivity from fall cone measurements ranged from 1.3 to 4.3, characterizing the soil
as “low to medium” sensitivity (Holtz et al., 2011; Table 2.1). FVT sensitivity measured in
Clay Fraction (%, <0.002 mm)
0 10 20 30 40 50 60
Illite
(A =
0.9
)
Kaolinite (A = 0.38)Plasticity Chart Here!
Liquid Limit
0 10 20 30 40 50 60
Pla
stic
ity In
dex
0
10
20
30
40
50
05 - 13 ft13 - 20 ft22 - 30 ft
U-Line
A-Line
CH
CL
ML
CL-ML
MLor
OLOH
orMH7
4
a) b)
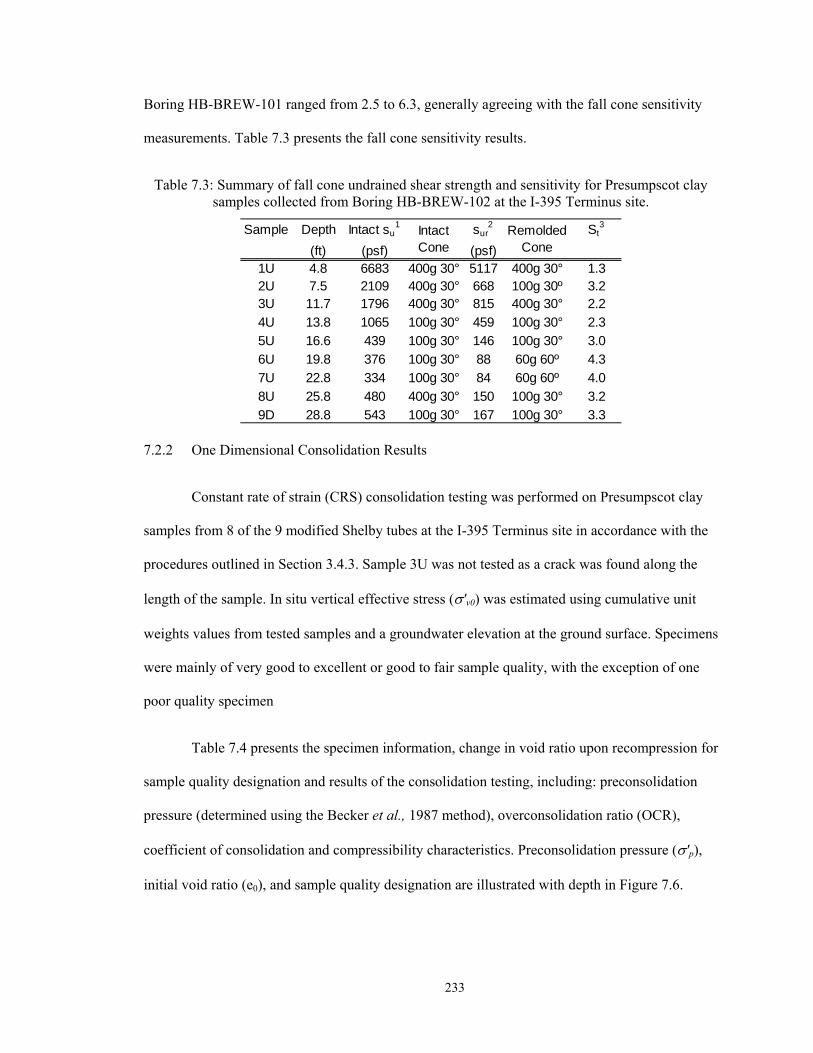
233
Boring HB-BREW-101 ranged from 2.5 to 6.3, generally agreeing with the fall cone sensitivity
measurements. Table 7.3 presents the fall cone sensitivity results.
Table 7.3: Summary of fall cone undrained shear strength and sensitivity for Presumpscot clay samples collected from Boring HB-BREW-102 at the I-395 Terminus site.
7.2.2 One Dimensional Consolidation Results
Constant rate of strain (CRS) consolidation testing was performed on Presumpscot clay
samples from 8 of the 9 modified Shelby tubes at the I-395 Terminus site in accordance with the
procedures outlined in Section 3.4.3. Sample 3U was not tested as a crack was found along the
length of the sample. In situ vertical effective stress ('v0) was estimated using cumulative unit
weights values from tested samples and a groundwater elevation at the ground surface. Specimens
were mainly of very good to excellent or good to fair sample quality, with the exception of one
poor quality specimen
Table 7.4 presents the specimen information, change in void ratio upon recompression for
sample quality designation and results of the consolidation testing, including: preconsolidation
pressure (determined using the Becker et al., 1987 method), overconsolidation ratio (OCR),
coefficient of consolidation and compressibility characteristics. Preconsolidation pressure ('p),
initial void ratio (e0), and sample quality designation are illustrated with depth in Figure 7.6.
Sample Depth Intact su1 sur
2 St3
(ft) (psf) (psf)1U 4.8 6683 400g 30° 5117 400g 30° 1.32U 7.5 2109 400g 30° 668 100g 30º 3.23U 11.7 1796 400g 30° 815 400g 30° 2.2
4U 13.8 1065 100g 30° 459 100g 30° 2.3
5U 16.6 439 100g 30° 146 100g 30° 3.0
6U 19.8 376 100g 30° 88 60g 60º 4.3
7U 22.8 334 100g 30° 84 60g 60º 4.0
8U 25.8 480 400g 30° 150 100g 30° 3.2
9D 28.8 543 100g 30° 167 100g 30° 3.3
Intact Cone
Remolded Cone
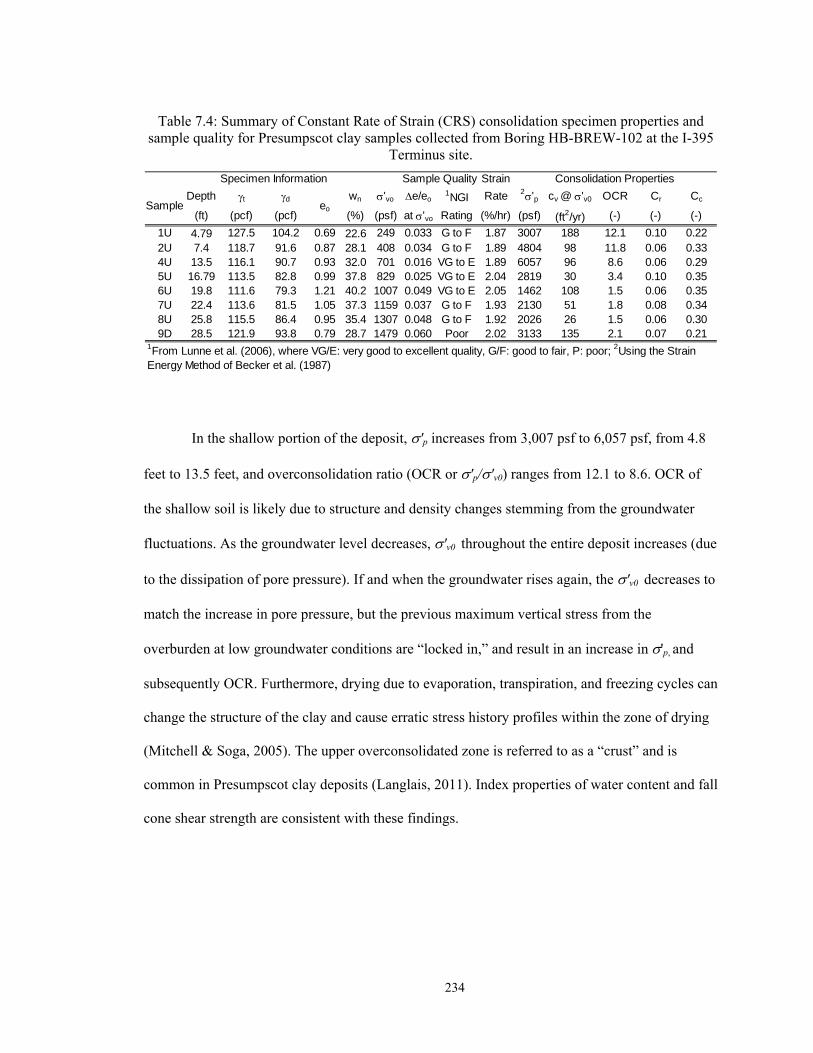
234
Table 7.4: Summary of Constant Rate of Strain (CRS) consolidation specimen properties and
sample quality for Presumpscot clay samples collected from Boring HB-BREW-102 at the I-395 Terminus site.
In the shallow portion of the deposit,'p increases from 3,007 psf to 6,057 psf, from 4.8
feet to 13.5 feet, and overconsolidation ratio (OCR or 'p/'v0) ranges from 12.1 to 8.6. OCR of
the shallow soil is likely due to structure and density changes stemming from the groundwater
fluctuations. As the groundwater level decreases, 'v0 throughout the entire deposit increases (due
to the dissipation of pore pressure). If and when the groundwater rises again, the 'v0 decreases to
match the increase in pore pressure, but the previous maximum vertical stress from the
overburden at low groundwater conditions are “locked in,” and result in an increase in 'p, and
subsequently OCR. Furthermore, drying due to evaporation, transpiration, and freezing cycles can
change the structure of the clay and cause erratic stress history profiles within the zone of drying
(Mitchell & Soga, 2005). The upper overconsolidated zone is referred to as a “crust” and is
common in Presumpscot clay deposits (Langlais, 2011). Index properties of water content and fall
cone shear strength are consistent with these findings.
Strain
Depth t d wn 'vo e/eo1NGI Rate 2'p cv @ 'v0 OCR Cr Cc
(ft) (pcf) (pcf) (%) (psf) at 'vo Rating (%/hr) (psf) (ft2/yr) (-) (-) (-)
1U 4.79 127.5 104.2 0.69 22.6 249 0.033 G to F 1.87 3007 188 12.1 0.10 0.222U 7.4 118.7 91.6 0.87 28.1 408 0.034 G to F 1.89 4804 98 11.8 0.06 0.334U 13.5 116.1 90.7 0.93 32.0 701 0.016 VG to E 1.89 6057 96 8.6 0.06 0.295U 16.79 113.5 82.8 0.99 37.8 829 0.025 VG to E 2.04 2819 30 3.4 0.10 0.356U 19.8 111.6 79.3 1.21 40.2 1007 0.049 VG to E 2.05 1462 108 1.5 0.06 0.357U 22.4 113.6 81.5 1.05 37.3 1159 0.037 G to F 1.93 2130 51 1.8 0.08 0.348U 25.8 115.5 86.4 0.95 35.4 1307 0.048 G to F 1.92 2026 26 1.5 0.06 0.309D 28.5 121.9 93.8 0.79 28.7 1479 0.060 Poor 2.02 3133 135 2.1 0.07 0.21
eo
1From Lunne et al. (2006), where VG/E: very good to excellent quality, G/F: good to fair, P: poor; 2Using the Strain Energy Method of Becker et al. (1987)
Sample
Specimen Information Sample Quality Consolidation Properties

235
Figure 7.6: Subsurface profiles of a) 'p, b) OCR, c) sample quality assessment from CRS consolidation testing for Presumpscot clay samples collected from Boring HB-BREW-102 at the
I-395 Terminus site.
Below 13.5 feet, 'p decreases and approaches the estimated 'v0. Laboratory testing of
index properties and observations made from split spoon samples recovered from Boring BB-
BREW-101 align with the consolidation testing results. There is a distinct boundary at 14 feet
between overlying, stiffer material and underlying soft clayey soil which may demonstrate the
extent of groundwater fluctuations at the site.
Coefficient of consolidation at 'v0 ranges from 30 ft2/year to 188 ft2/year without an
apparent trend with depth or other soil properties. Recompression index (Cr) and virgin
'p (psf)
0 4000 8000 12000
De
pth
(ft)
0
5
10
15
20
25
30
Estimatedin situ'v0
'p/'v0 = OCR
0 2 4 6 8 10 12
e/e0 at 'v0
0.00 0.04 0.08 0.12 0.16
NGI Sample Quality Category (Lunne et al. 2006)
Excellent toVery Good
(1)
Poor
(3)OCR
1-2
2-4
<0.04 0.04-0.07 0.07-0.14 >0.14
<0.03 0.03-0.05 0.05-0.10 >0.10
e/e0 at 'v0
Good toFair(2)
VeryPoor(4)
1 2 3 4
1 2 3 4
236
compression index (Cc) ranged from 0.06 to 0.10 and 0.21 to 0.35, respectively. In general, Cr
values are assumed to be approximately 10% of the Cc values which appears to overestimate Cr at
the I-395 Terminus site. Andrews (1987) presents a typical range of values for Cc of Presumpscot
clay in Maine to range from approximately 0.33 to 0.60 showing that Cc values from the site are
in and below the lower portion of this presented range. The lowest values of Cc came from both
the shallowest and deepest specimens, both of which correspond to a lower composition of clay
as compared to the middle of the deposit.
In terms of stress history, the deposit can be divided into two sections. The upper portion,
which is subject to groundwater fluctuations, frost action, drainage, and drying ranges in OCR
from 3.4 to 12.1. Within this portion, the higher OCR is due to a combination of the
aforementioned factors and decreases abruptly with depth. Secondary compression and sample
quality likely has little effect on the OCR determined from specimen in this portion. In the lower
portion of the deposit (below 15 feet), OCR ranges from 1.5 to 2.1 and has minor fluctuations
with depth. The overconsolidation of the clay at these depths is likely due to two independent
sources; secondary compression and sample disturbance. The clay particles have re-arranged
under constant 'v0 once primary consolidation is complete. Over time, this results in stiffening,
which appears as an increase in 'p on the consolidation curve. Secondly, the OCR values within
these depths are likely affected by decreasing sample quality with depth. A decrease in sample
quality results as an increase in estimated 'p from the flattening of the “break” in the
consolidation curve. Furthermore, a decrease in sample quality also indicates that part of the
structure of the clay has been destroyed and leads to more deformations prior to 'p (higher Cr
values).
237
7.2.3 Recompression Undrained Triaxial Shear
Anisotropically consolidated undrained compression (CAUC) triaxial shear testing was
performed on 5 of the 9 tube samples of Presumpscot clay for the I-395 Terminus site in
accordance with the procedures outlined in Section 3.4.4. Table 7.5 presents specimen properties,
conditions following recompression to the estimated 'v0, sample quality, and pre-shear
parameters for the triaxial specimens. Table 7.6 presents results from the shear phase of the
triaxial tests, including peak shear stress, strain at failure, pore pressure at failure, and shear stress
normalized to vertical effective compressive stress. All tested specimens were of very good to
excellent quality. Note that su = qf = undrained shear strength.
Shallow samples 1U and 2U were not tested because they were highly overconsolidated
and could hardly be trimmed with a wire saw during specimen preparation. Since these samples
were so heavily overconsolidated, undrained shear testing does not properly characterize the
critical shear strength properties of the clay, which in this case would be drained shear strength.
Samples 3U and 7U were not tested due to disturbance of the extracted samples. Resulting
profiles of su and Resulting profiles of su and su normalized by 'v0 (su/'v0) are presented in Figure
7.7.
su of the tested specimens ranged from 1,196 psf at 13.2 feet depth to 404 psf at 19.3 feet
depth. Aside from the specimen from 13.2 feet, which was collected in the upper,
overconsolidated portion of the deposit, all of the su values fell within ±80psf of 464 psf showing
strong consistency with depth. Within these same depths of the deposit, su from the field vane
shear testing (FVT) agreed well with these CAUC values.
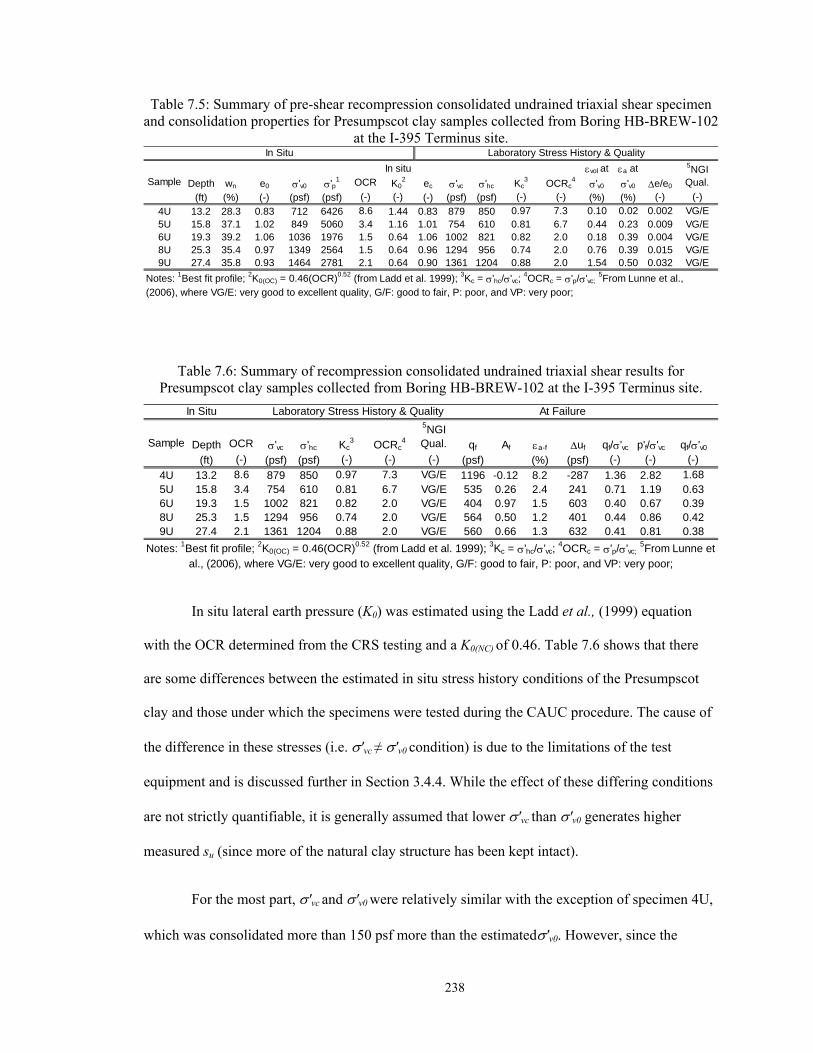
238
Table 7.5: Summary of pre-shear recompression consolidated undrained triaxial shear specimen and consolidation properties for Presumpscot clay samples collected from Boring HB-BREW-102
at the I-395 Terminus site.
Table 7.6: Summary of recompression consolidated undrained triaxial shear results for Presumpscot clay samples collected from Boring HB-BREW-102 at the I-395 Terminus site.
In situ lateral earth pressure (K0) was estimated using the Ladd et al., (1999) equation
with the OCR determined from the CRS testing and a K0(NC) of 0.46. Table 7.6 shows that there
are some differences between the estimated in situ stress history conditions of the Presumpscot
clay and those under which the specimens were tested during the CAUC procedure. The cause of
the difference in these stresses (i.e. 'vc ≠ 'v0 condition) is due to the limitations of the test
equipment and is discussed further in Section 3.4.4. While the effect of these differing conditions
are not strictly quantifiable, it is generally assumed that lower 'vc than 'v0 generates higher
measured su (since more of the natural clay structure has been kept intact).
For the most part, 'vc and 'v0 were relatively similar with the exception of specimen 4U,
which was consolidated more than 150 psf more than the estimated'v0. However, since the
Depth wn e0 'v0 'p1 OCR
In situ
K02 ec 'vc 'hc Kc
3 OCRc4
vol at
'v0
a at
'v0 e/e0
5NGI Qual.
(ft) (%) (-) (psf) (psf) (-) (-) (-) (psf) (psf) (-) (-) (%) (%) (-) (-)
4U 13.2 28.3 0.83 712 6426 8.6 1.44 0.83 879 850 0.97 7.3 0.10 0.02 0.002 VG/E5U 15.8 37.1 1.02 849 5060 3.4 1.16 1.01 754 610 0.81 6.7 0.44 0.23 0.009 VG/E6U 19.3 39.2 1.06 1036 1976 1.5 0.64 1.06 1002 821 0.82 2.0 0.18 0.39 0.004 VG/E8U 25.3 35.4 0.97 1349 2564 1.5 0.64 0.96 1294 956 0.74 2.0 0.76 0.39 0.015 VG/E9U 27.4 35.8 0.93 1464 2781 2.1 0.64 0.90 1361 1204 0.88 2.0 1.54 0.50 0.032 VG/E
Notes: 1Best fit profile; 2K0(OC) = 0.46(OCR)0.52 (from Ladd et al. 1999); 3Kc = 'hc/'vc; 4OCRc = 'p/'vc;
5From Lunne et al., (2006), where VG/E: very good to excellent quality, G/F: good to fair, P: poor, and VP: very poor;
Sample
Laboratory Stress History & QualityIn Situ
Depth OCR 'vc 'hc Kc3 OCRc
4
5NGI Qual. qf Af a-f uf qf/'vc p'f/'vc qf/'v0
(ft) (-) (psf) (psf) (-) (-) (-) (psf) (%) (psf) (-) (-) (-)
4U 13.2 8.6 879 850 0.97 7.3 VG/E 1196 -0.12 8.2 -287 1.36 2.82 1.685U 15.8 3.4 754 610 0.81 6.7 VG/E 535 0.26 2.4 241 0.71 1.19 0.636U 19.3 1.5 1002 821 0.82 2.0 VG/E 404 0.97 1.5 603 0.40 0.67 0.398U 25.3 1.5 1294 956 0.74 2.0 VG/E 564 0.50 1.2 401 0.44 0.86 0.429U 27.4 2.1 1361 1204 0.88 2.0 VG/E 560 0.66 1.3 632 0.41 0.81 0.38
Notes: 1Best fit profile; 2K0(OC) = 0.46(OCR)0.52 (from Ladd et al. 1999); 3Kc = 'hc/'vc; 4OCRc = 'p/'vc;
5From Lunne et al., (2006), where VG/E: very good to excellent quality, G/F: good to fair, P: poor, and VP: very poor;
Sample
Laboratory Stress History & QualityIn Situ At Failure

239
specimen was highly overconsolidated, this likely did not have a large effect on the resulting su.
From the remaining samples, percent difference in the OCR preshear versus in situ values ranged
from 5% to 65%. Also presented in Figure 7.7 are su measurements from FVT from Boring HB-
BREW-101. su values from FVT are generally slightly lower than su testing CAUC but agree
reasonably well. su determined from the FVT at 5 feet resulted in a low value, likely from the use
of a very small vane and a resulting small shear plane.
Figure 7.7: Subsurface profile of a) undrained shear strength (su), b) normalized shear strength
and c) NGI sample quality assessment obtained from CAUC triaxial testing for Presumpscot clay samples collected from Boring HB-BREW-102 at the I-395 Terminus site.
su/'v0 (psf)
0.0 0.5 1.0 1.5 2.0
su (psf)
0 500 1000 1500 2000
Dep
th (
ft)
0
5
10
15
20
25
30
HB-BREW-102 CAUCHB-BREW-101 FVT b)a)
NGI Sample Quality Category (Lunne et al. 2006)
Excellent toVery Good
(1)
Poor
(3)OCR
1-2
2-4
<0.04 0.04-0.07 0.07-0.14 >0.14
<0.03 0.03-0.05 0.05-0.10 >0.10
e/e0 at 'v0
Good toFair(2)
VeryPoor(4)
e/e0 at 'v0
0.00 0.04 0.08 0.12 0.16
1 2 3 4
1 2 3 4
c)
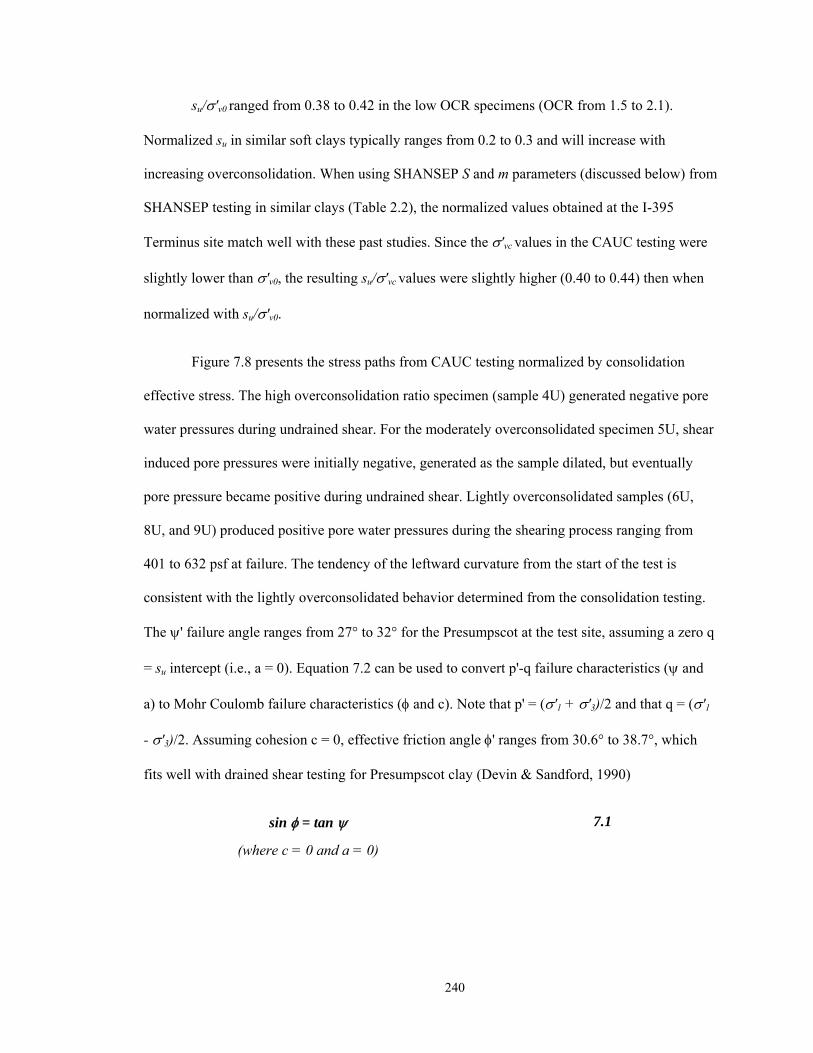
240
su/'v0 ranged from 0.38 to 0.42 in the low OCR specimens (OCR from 1.5 to 2.1).
Normalized su in similar soft clays typically ranges from 0.2 to 0.3 and will increase with
increasing overconsolidation. When using SHANSEP S and m parameters (discussed below) from
SHANSEP testing in similar clays (Table 2.2), the normalized values obtained at the I-395
Terminus site match well with these past studies. Since the 'vc values in the CAUC testing were
slightly lower than 'v0, the resulting su/'vc values were slightly higher (0.40 to 0.44) then when
normalized with su/'v0.
Figure 7.8 presents the stress paths from CAUC testing normalized by consolidation
effective stress. The high overconsolidation ratio specimen (sample 4U) generated negative pore
water pressures during undrained shear. For the moderately overconsolidated specimen 5U, shear
induced pore pressures were initially negative, generated as the sample dilated, but eventually
pore pressure became positive during undrained shear. Lightly overconsolidated samples (6U,
8U, and 9U) produced positive pore water pressures during the shearing process ranging from
401 to 632 psf at failure. The tendency of the leftward curvature from the start of the test is
consistent with the lightly overconsolidated behavior determined from the consolidation testing.
The ' failure angle ranges from 27° to 32° for the Presumpscot at the test site, assuming a zero q
= su intercept (i.e., a = 0). Equation 7.2 can be used to convert p'-q failure characteristics ( and
a) to Mohr Coulomb failure characteristics ( and c). Note that p' = ('1 + '3)/2 and that q = ('1
- '3)/2. Assuming cohesion c = 0, effective friction angle ' ranges from 30.6° to 38.7°, which
fits well with drained shear testing for Presumpscot clay (Devin & Sandford, 1990)
sin = tan 7.1
(where c = 0 and a = 0)

241
Figure 7.8: Recompression consolidated undrained triaxial (CAUC) normalized effective stress paths for Presumpscot clay samples collected from Boring HB-BREW-102 at the I-395 Terminus
site.
7.2.4 SHANSEP Consolidated Undrained Triaxial Shear Results
SHANSEP testing (Section 2.1.4) was conducted on the Presumpscot clay at the I-395
Terminus site to determine if this type of testing is appropriate for the silty clay. Table 7.7
presents specimen properties, reconsolidation conditions, sample quality, and pre-shear
parameters for SHANSEP triaxial tests conducted on two specimens from sample 6U. Table 7.8
presents results from the shear phase of the same SHANSEP triaxial tests including peak shear
stress, strain at failure, pore pressure at failure, and shear stress normalized to vertical effective
compressive stress and the predicted relationship between overconsolidation and normalized
shear strength. SHANSEP undrained triaxial tests conducted on two specimens from sample 6U.
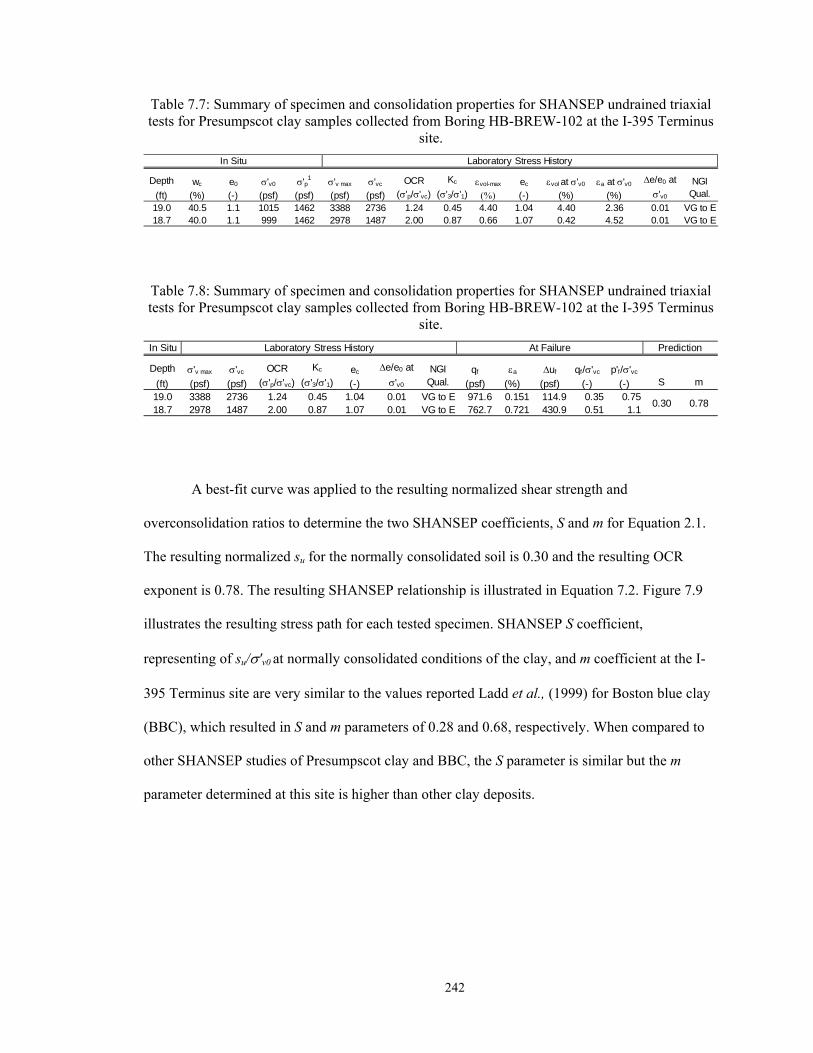
242
Table 7.7: Summary of specimen and consolidation properties for SHANSEP undrained triaxial tests for Presumpscot clay samples collected from Boring HB-BREW-102 at the I-395 Terminus
site.
Table 7.8: Summary of specimen and consolidation properties for SHANSEP undrained triaxial tests for Presumpscot clay samples collected from Boring HB-BREW-102 at the I-395 Terminus
site.
A best-fit curve was applied to the resulting normalized shear strength and
overconsolidation ratios to determine the two SHANSEP coefficients, S and m for Equation 2.1.
The resulting normalized su for the normally consolidated soil is 0.30 and the resulting OCR
exponent is 0.78. The resulting SHANSEP relationship is illustrated in Equation 7.2. Figure 7.9
illustrates the resulting stress path for each tested specimen. SHANSEP S coefficient,
representing of su/'v0 at normally consolidated conditions of the clay, and m coefficient at the I-
395 Terminus site are very similar to the values reported Ladd et al., (1999) for Boston blue clay
(BBC), which resulted in S and m parameters of 0.28 and 0.68, respectively. When compared to
other SHANSEP studies of Presumpscot clay and BBC, the S parameter is similar but the m
parameter determined at this site is higher than other clay deposits.
Depth wc e0 'v0 'p1 'v max 'vc vol-max ec vol at 'v0 a at 'v0
(ft) (%) (-) (psf) (psf) (psf) (psf) (-) (%) (%)19.0 40.5 1.1 1015 1462 3388 2736 1.24 0.45 4.40 1.04 4.40 2.36 0.01 VG to E18.7 40.0 1.1 999 1462 2978 1487 2.00 0.87 0.66 1.07 0.42 4.52 0.01 VG to E
In Situ Laboratory Stress History
NGI Qual.
OCR
('p/'vc)
Kc
('3/'1)
e/e0 at
'v0
Depth 'v max 'vc ec qf a uf qf/'vc p'f/'vc
(ft) (psf) (psf) (-) (psf) (%) (psf) (-) (-)19.0 3388 2736 1.24 0.45 1.04 0.01 VG to E 971.6 0.151 114.9 0.35 0.7518.7 2978 1487 2.00 0.87 1.07 0.01 VG to E 762.7 0.721 430.9 0.51 1.1
S m
0.30 0.78
In Situ Laboratory Stress History At Failure Prediction
NGI Qual.
OCR
('p/'vc)
Kc
('3/'1)
e/e0 at
'v0
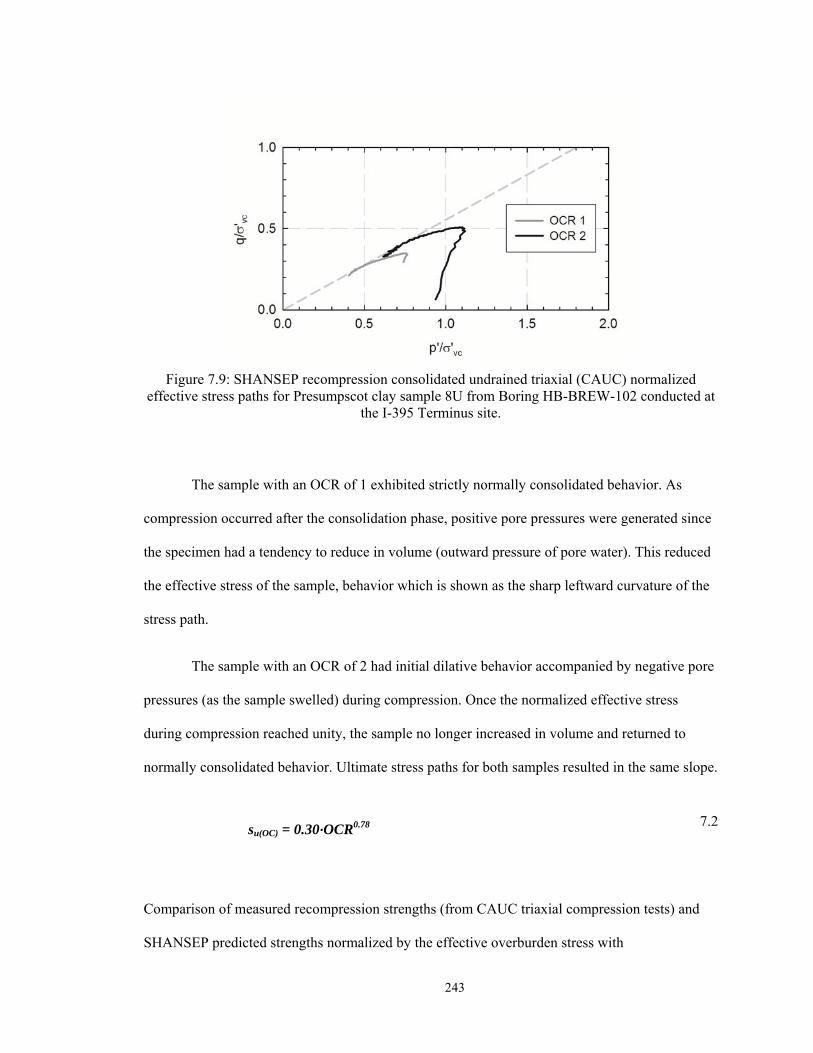
243
Figure 7.9: SHANSEP recompression consolidated undrained triaxial (CAUC) normalized effective stress paths for Presumpscot clay sample 8U from Boring HB-BREW-102 conducted at
the I-395 Terminus site.
The sample with an OCR of 1 exhibited strictly normally consolidated behavior. As
compression occurred after the consolidation phase, positive pore pressures were generated since
the specimen had a tendency to reduce in volume (outward pressure of pore water). This reduced
the effective stress of the sample, behavior which is shown as the sharp leftward curvature of the
stress path.
The sample with an OCR of 2 had initial dilative behavior accompanied by negative pore
pressures (as the sample swelled) during compression. Once the normalized effective stress
during compression reached unity, the sample no longer increased in volume and returned to
normally consolidated behavior. Ultimate stress paths for both samples resulted in the same slope.
su(OC) = 0.30∙OCR0.78 7.2
Comparison of measured recompression strengths (from CAUC triaxial compression tests) and
SHANSEP predicted strengths normalized by the effective overburden stress with

244
overconsolidation is illustrated in Figure 7.10. The SHANSEP equation developed from lower
OCR (1 and 2) specimens over predicts strength over the range of OCR values determined for in
situ soil, particularly for the higher OCR soil, when compared with the recompression triaxial
shear data. For the lightly overconsolidated soil, the SHANSEP equation is similar to the CAUC
undrained shear strength results, but as OCR of the tested specimens increases, the scatter of
normalized su becomes too scattered to evaluate if the SHANSEP properly matches in situ data.
Figure 7.10: Comparison of normalized undrained shear strength from recompression and SHANSEP triaxial compression tests for Presumpscot clay specimens from boring HB-BREW-
102 6U conducted at the I-395 Terminus site.
7.2.5 Summary and Interpretations of Laboratory Testing Results
This section provides a synthesis of the laboratory testing results in order to characterize
the deposit of the Presumpscot clay at the I-395 Terminus site using the index results,
consolidation properties, and shear strength properties. The following trends can be established
from the laboratory results of index, consolidation, and shear strength testing of the Presumpscot
clay samples tested from the site:
245
Water content in the overconsolidated crust ranged from 22% to 28% and ranged
from 29% to 40% in the softer, mildly overconsolidated soil at depth 15 feet to
28 feet.
Atterberg Limits are consistent throughout the entire deposit. Plastic limit ranged
from 19 to 22 while liquid limit ranged from 31 to 37. Liquidity index is well
below 1.0 in the overconsolidated crust, but ranges from 0.81 to 1.28 in the
deeper soil.
The sensitivity of the Presumpscot at the site is low. It is likely that this derives
from two factors: a high remolded shear strength from the silt content since the
granular particles can still actively resist shearing forces after remolding, and a
low concentration of salt ions within the marine environment in which the clay
was deposited. Lower salt ion concentration reduces the amount of potential ion
leaching, which leads to higher sensitivity.
OCR in the crust ranged from 12.1 to 8.6, and generally decreased with depth.
The preconsolidation pressure ('p) determined from one dimensional
consolidation testing within this layer is an “apparent” preconsolidation, which is
caused by 'v0 changes due to groundwater fluctuations. Shallow, crustal samples
were mottled, blocky, and relatively dry compared to the deeper, less
overconsolidated samples.
OCR in the deeper, softer portion of the deposit ranged from 3.4 to 1.5. The
source of the mild overconsolidation of clay within this depth is due to a
combination of secondary compression and frost penetration.
Recompression Index (Cr) ranged from 0.06 to 0.10 and virgin compression
index (Cc) ranged from 0.21 to 0.35. Often, Cr is assumed to be about 0.05- 0.10
of Cc (Holtz et al., 2011), however, Cr ranges from 0.17- 0.43 of Cc for this site.
246
su measured in the laboratory is likely similar to in situ value because OCR and
K0 values were similar to test conditions. su of the overconsolidated sample 4U
(OCR = 8.6) resulted in 1,196 psf. All tested specimens at a depth of 15 feet and
fell within ±80psf of 464 psf. su/'v0 ranged from 0.38 to 0.42 in the low OCR
specimens.
SHANSEP S and m values are 0.30 and 0.78, respectively and are similar to the
recompression S and m values of 0.26 and 0.70. However, the similarity may be
somewhat fortuitous since most of the CAUC tested samples were lightly
overconsolidated and the other two plotted well off of the best-fit recompression
trend line.
7.3 Seismic Cone Penetration Testing Results
Six piezocone penetrometer tests were performed at the I-395 Brewer site on March 7th,
2013 by ConeTec of West Berlin, New Jersey in general accordance ASTM D-5778 Standard
Test Method for Electronic Friction Cone and Piezocone Penetration Testing of Soils. These
included two piezocone penetrometer tests, CPTu 102 and CPTu 103, and four seismic piezocone
penetrometer tests where seismic testing was conducted at 1 m or 3.28 feet intervals, SCPTu101,
104, 105, and 106. Figure 7.2 illustrates the locations of these profiles. Table 7.9 summarizes the
depths of each sounding and the lateral distance between the soundings and the two drilled
borings HB-BREW-101 and -102, which included field vane shear testing (FVT) and undisturbed
Shelby tube sampling, respectively. All six soundings were advanced to refusal using a 1.7 inch
diameter cone advanced with a CME 55 rig mounted on a Morooka carrier. The seismic source
was a steel I-Beam placed directly on the ground struck with a hammer. Normal force was
applied to the beam via the dead weight of the rig.
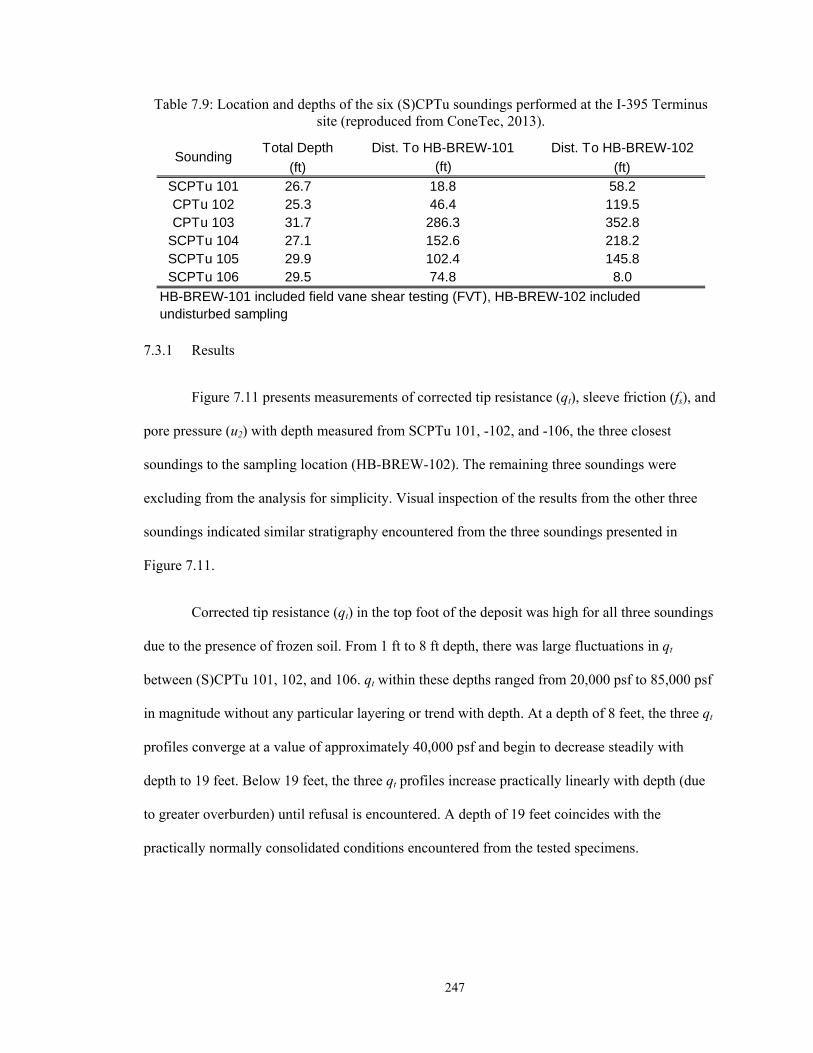
247
Table 7.9: Location and depths of the six (S)CPTu soundings performed at the I-395 Terminus site (reproduced from ConeTec, 2013).
7.3.1 Results
Figure 7.11 presents measurements of corrected tip resistance (qt), sleeve friction (fs), and
pore pressure (u2) with depth measured from SCPTu 101, -102, and -106, the three closest
soundings to the sampling location (HB-BREW-102). The remaining three soundings were
excluding from the analysis for simplicity. Visual inspection of the results from the other three
soundings indicated similar stratigraphy encountered from the three soundings presented in
Figure 7.11.
Corrected tip resistance (qt) in the top foot of the deposit was high for all three soundings
due to the presence of frozen soil. From 1 ft to 8 ft depth, there was large fluctuations in qt
between (S)CPTu 101, 102, and 106. qt within these depths ranged from 20,000 psf to 85,000 psf
in magnitude without any particular layering or trend with depth. At a depth of 8 feet, the three qt
profiles converge at a value of approximately 40,000 psf and begin to decrease steadily with
depth to 19 feet. Below 19 feet, the three qt profiles increase practically linearly with depth (due
to greater overburden) until refusal is encountered. A depth of 19 feet coincides with the
practically normally consolidated conditions encountered from the tested specimens.
Total Depth Dist. To HB-BREW-101 Dist. To HB-BREW-102
(ft) (ft) (ft)SCPTu 101 26.7 18.8 58.2CPTu 102 25.3 46.4 119.5CPTu 103 31.7 286.3 352.8
SCPTu 104 27.1 152.6 218.2SCPTu 105 29.9 102.4 145.8SCPTu 106 29.5 74.8 8.0
Sounding
HB-BREW-101 included field vane shear testing (FVT), HB-BREW-102 included undisturbed sampling
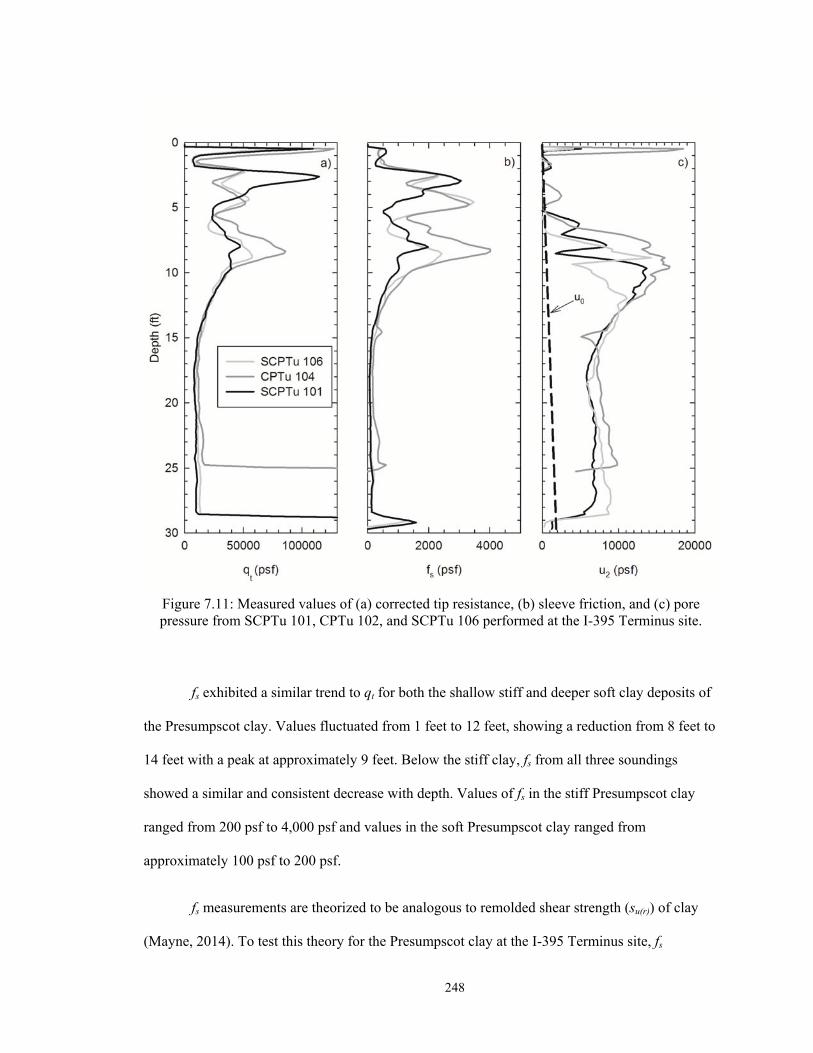
248
Figure 7.11: Measured values of (a) corrected tip resistance, (b) sleeve friction, and (c) pore pressure from SCPTu 101, CPTu 102, and SCPTu 106 performed at the I-395 Terminus site.
fs exhibited a similar trend to qt for both the shallow stiff and deeper soft clay deposits of
the Presumpscot clay. Values fluctuated from 1 feet to 12 feet, showing a reduction from 8 feet to
14 feet with a peak at approximately 9 feet. Below the stiff clay, fs from all three soundings
showed a similar and consistent decrease with depth. Values of fs in the stiff Presumpscot clay
ranged from 200 psf to 4,000 psf and values in the soft Presumpscot clay ranged from
approximately 100 psf to 200 psf.
fs measurements are theorized to be analogous to remolded shear strength (su(r)) of clay
(Mayne, 2014). To test this theory for the Presumpscot clay at the I-395 Terminus site, fs
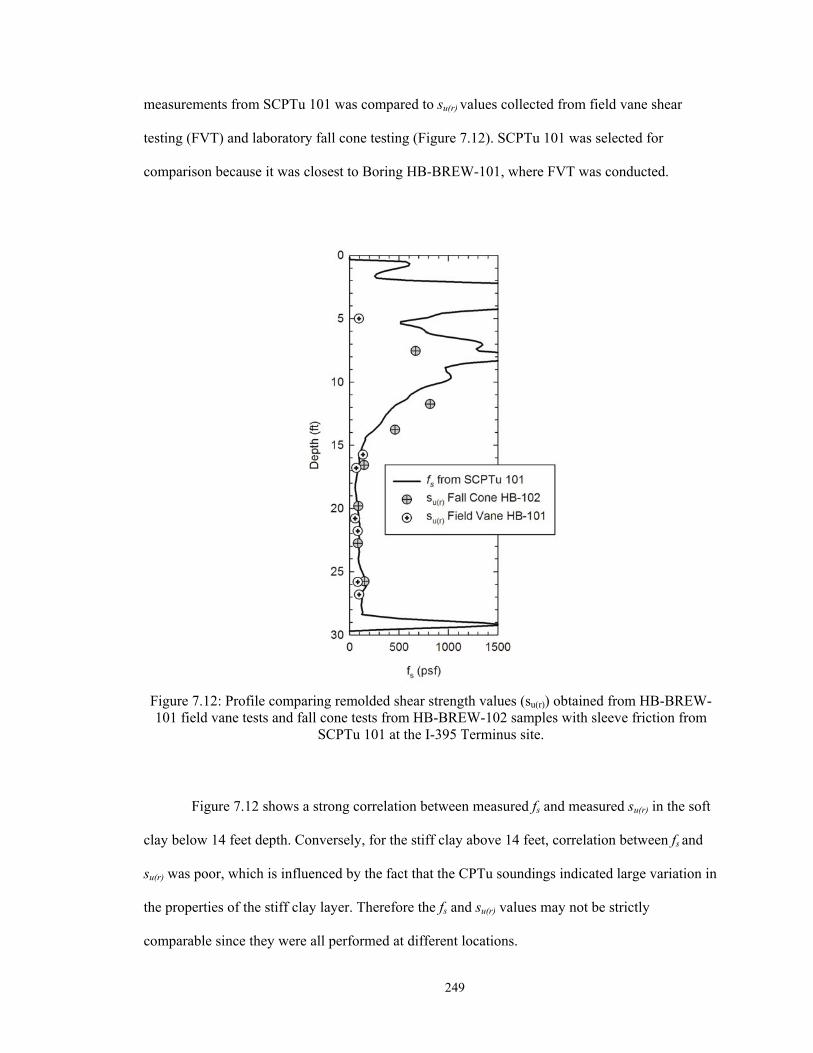
249
measurements from SCPTu 101 was compared to su(r) values collected from field vane shear
testing (FVT) and laboratory fall cone testing (Figure 7.12). SCPTu 101 was selected for
comparison because it was closest to Boring HB-BREW-101, where FVT was conducted.
Figure 7.12: Profile comparing remolded shear strength values (su(r)) obtained from HB-BREW-101 field vane tests and fall cone tests from HB-BREW-102 samples with sleeve friction from
SCPTu 101 at the I-395 Terminus site.
Figure 7.12 shows a strong correlation between measured fs and measured su(r) in the soft
clay below 14 feet depth. Conversely, for the stiff clay above 14 feet, correlation between fs and
su(r) was poor, which is influenced by the fact that the CPTu soundings indicated large variation in
the properties of the stiff clay layer. Therefore the fs and su(r) values may not be strictly
comparable since they were all performed at different locations.
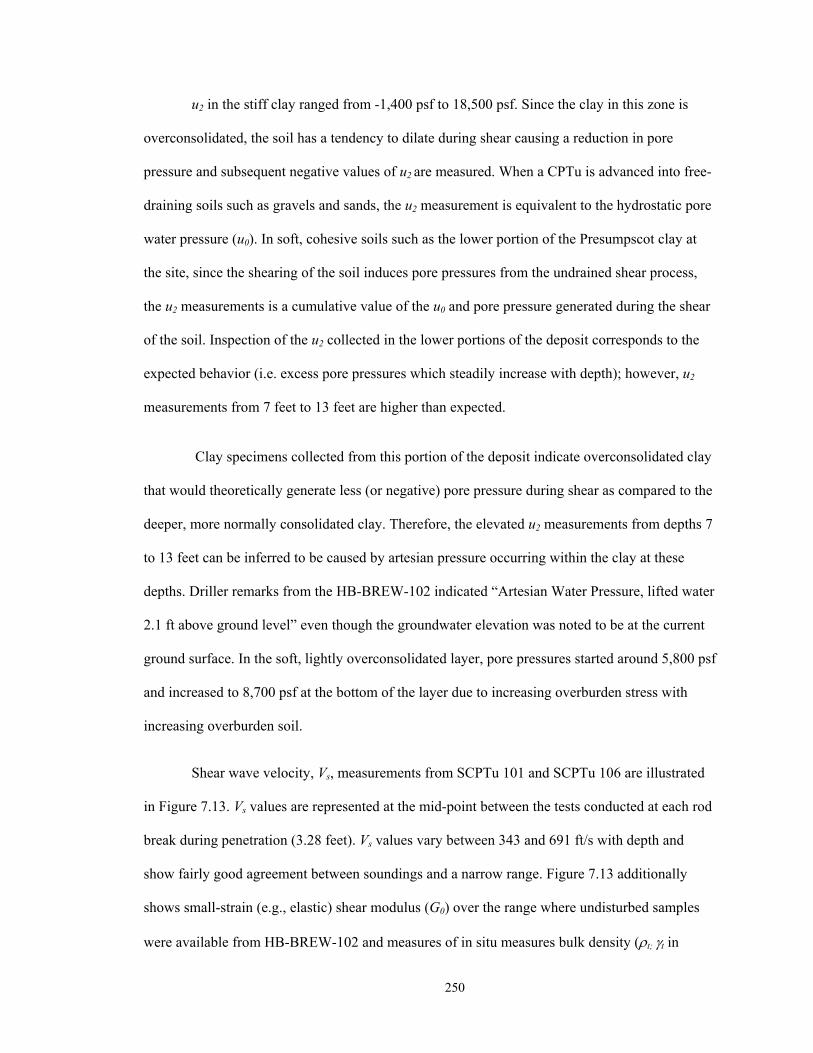
250
u2 in the stiff clay ranged from -1,400 psf to 18,500 psf. Since the clay in this zone is
overconsolidated, the soil has a tendency to dilate during shear causing a reduction in pore
pressure and subsequent negative values of u2 are measured. When a CPTu is advanced into free-
draining soils such as gravels and sands, the u2 measurement is equivalent to the hydrostatic pore
water pressure (u0). In soft, cohesive soils such as the lower portion of the Presumpscot clay at
the site, since the shearing of the soil induces pore pressures from the undrained shear process,
the u2 measurements is a cumulative value of the u0 and pore pressure generated during the shear
of the soil. Inspection of the u2 collected in the lower portions of the deposit corresponds to the
expected behavior (i.e. excess pore pressures which steadily increase with depth); however, u2
measurements from 7 feet to 13 feet are higher than expected.
Clay specimens collected from this portion of the deposit indicate overconsolidated clay
that would theoretically generate less (or negative) pore pressure during shear as compared to the
deeper, more normally consolidated clay. Therefore, the elevated u2 measurements from depths 7
to 13 feet can be inferred to be caused by artesian pressure occurring within the clay at these
depths. Driller remarks from the HB-BREW-102 indicated “Artesian Water Pressure, lifted water
2.1 ft above ground level” even though the groundwater elevation was noted to be at the current
ground surface. In the soft, lightly overconsolidated layer, pore pressures started around 5,800 psf
and increased to 8,700 psf at the bottom of the layer due to increasing overburden stress with
increasing overburden soil.
Shear wave velocity, Vs, measurements from SCPTu 101 and SCPTu 106 are illustrated
in Figure 7.13. Vs values are represented at the mid-point between the tests conducted at each rod
break during penetration (3.28 feet). Vs values vary between 343 and 691 ft/s with depth and
show fairly good agreement between soundings and a narrow range. Figure 7.13 additionally
shows small-strain (e.g., elastic) shear modulus (G0) over the range where undisturbed samples
were available from HB-BREW-102 and measures of in situ measures bulk density (t; t in
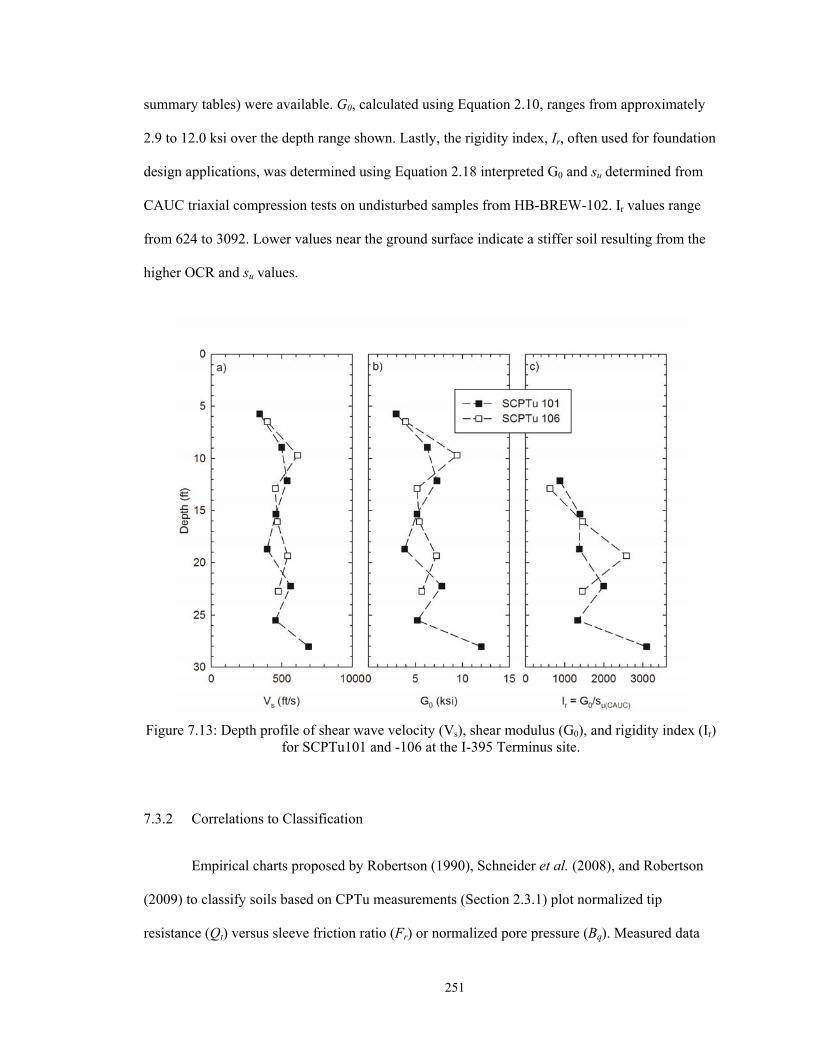
251
summary tables) were available. G0, calculated using Equation 2.10, ranges from approximately
2.9 to 12.0 ksi over the depth range shown. Lastly, the rigidity index, Ir, often used for foundation
design applications, was determined using Equation 2.18 interpreted G0 and su determined from
CAUC triaxial compression tests on undisturbed samples from HB-BREW-102. Ir values range
from 624 to 3092. Lower values near the ground surface indicate a stiffer soil resulting from the
higher OCR and su values.
Figure 7.13: Depth profile of shear wave velocity (Vs), shear modulus (G0), and rigidity index (Ir) for SCPTu101 and -106 at the I-395 Terminus site.
7.3.2 Correlations to Classification
Empirical charts proposed by Robertson (1990), Schneider et al. (2008), and Robertson
(2009) to classify soils based on CPTu measurements (Section 2.3.1) plot normalized tip
resistance (Qt) versus sleeve friction ratio (Fr) or normalized pore pressure (Bq). Measured data
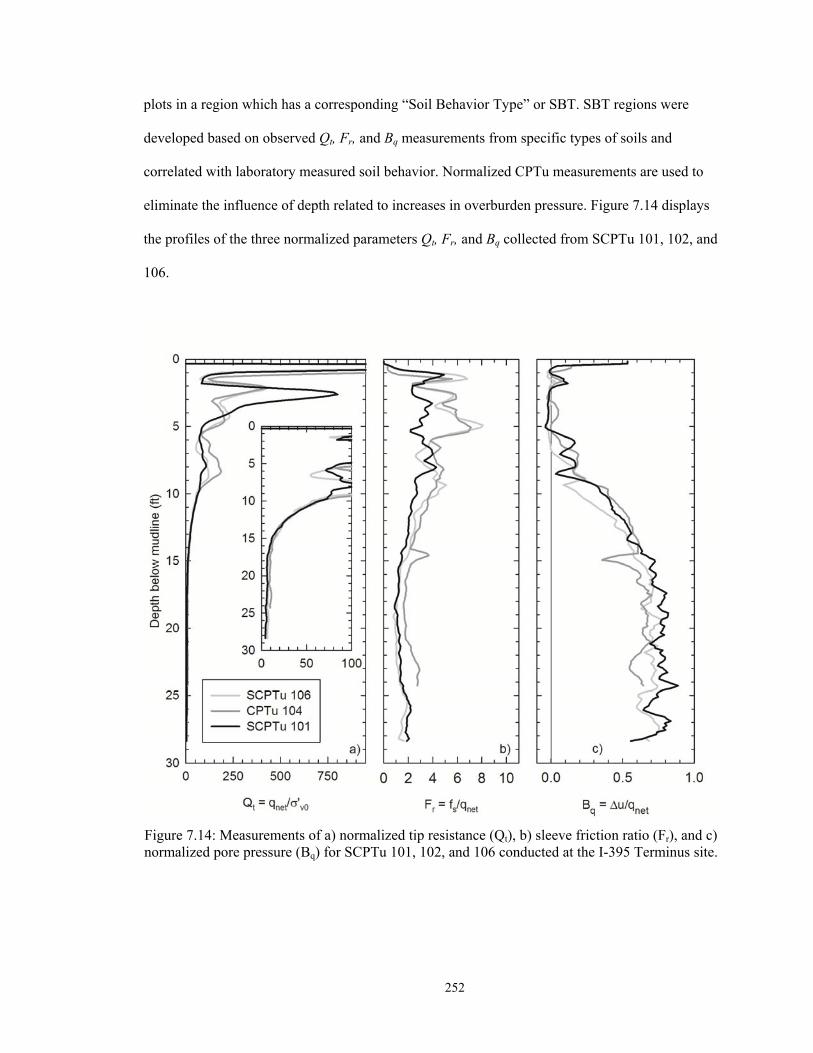
252
plots in a region which has a corresponding “Soil Behavior Type” or SBT. SBT regions were
developed based on observed Qt, Fr, and Bq measurements from specific types of soils and
correlated with laboratory measured soil behavior. Normalized CPTu measurements are used to
eliminate the influence of depth related to increases in overburden pressure. Figure 7.14 displays
the profiles of the three normalized parameters Qt, Fr, and Bq collected from SCPTu 101, 102, and
106.
Figure 7.14: Measurements of a) normalized tip resistance (Qt), b) sleeve friction ratio (Fr), and c) normalized pore pressure (Bq) for SCPTu 101, 102, and 106 conducted at the I-395 Terminus site.
253
Each of the four classification charts were evaluated for their applicability to the
Presumpscot clay at the I-395 Terminus site using Unified Soil Classification System (USCS)
results from laboratory analysis of Boring HB-BREW-102 soil samples and values of Qt, Fr, and
Bq collected from SCPTu 101 and CPTu 106 at corresponding depths. SCPTu 102 was not used
because it was the furthest away from HB-BREW-102. For three of the charts (Robertson 1990
and Robertson 2009; Figure 7.15a, b and c), there are 9 regions corresponding to SBT. SBT 3
“clay to silty clay” and SBT 4 “clayey silt to silty clay” were considered correct classifications of
the Presumpscot clay based on laboratory data. SBT 9 “very stiff fine grained” was also
considered an adequate classification of the stiff clay in the upper portion of the deposit. For the
fourth chart (Schneider et al. 2008; Figure 7.15d), a different classification system is used, of
which the “clays” region was considered to be correct classification of the Presumpscot clay.
Plotted data points from SCPTu 101 and 106 are presented in Figure 7.15 and Figure 7.16,
respectively. CPTu data for the Presumpscot clay at the site plotted in SBT 3 “clays,” SBT 4 “silt
mixtures,” SBT 5 “sand mixtures”, SBT 6 “sands,” and SBT 9 “very stiff fine grained”
classifications from the Robertson (1990 and 2009) plots and “clays,” “silts and low rigidity
index clays,” and “sand” for the Schneider et al., (2008) plot. All of the tested specimens
classified as CL, lean clay in accordance with USCS. Clearly, the SBT-based classification results
in a variety of classes as opposed to the USCS method.
In general, the upper, highly overconsolidated portion of the deposit (from 1 ft to
approximately 10 ft) resulted in SBT 5, 6, and 9 and the lower, softer portion of the deposit
classified in SBT 3 and 4. Similarly, all of the data points classified as non-clay come from the
upper part of the deposit. Table 7.10 presents the results of this analysis including the number of
samples laboratory samples tested, number of USCS classifications matching the SBT
classification, and the resulting percent effectiveness (USCS-SBT matches divided by the number
of samples). The Fr and Bq shown in front of the Robertson (1990) in Table 7.10 is notation for
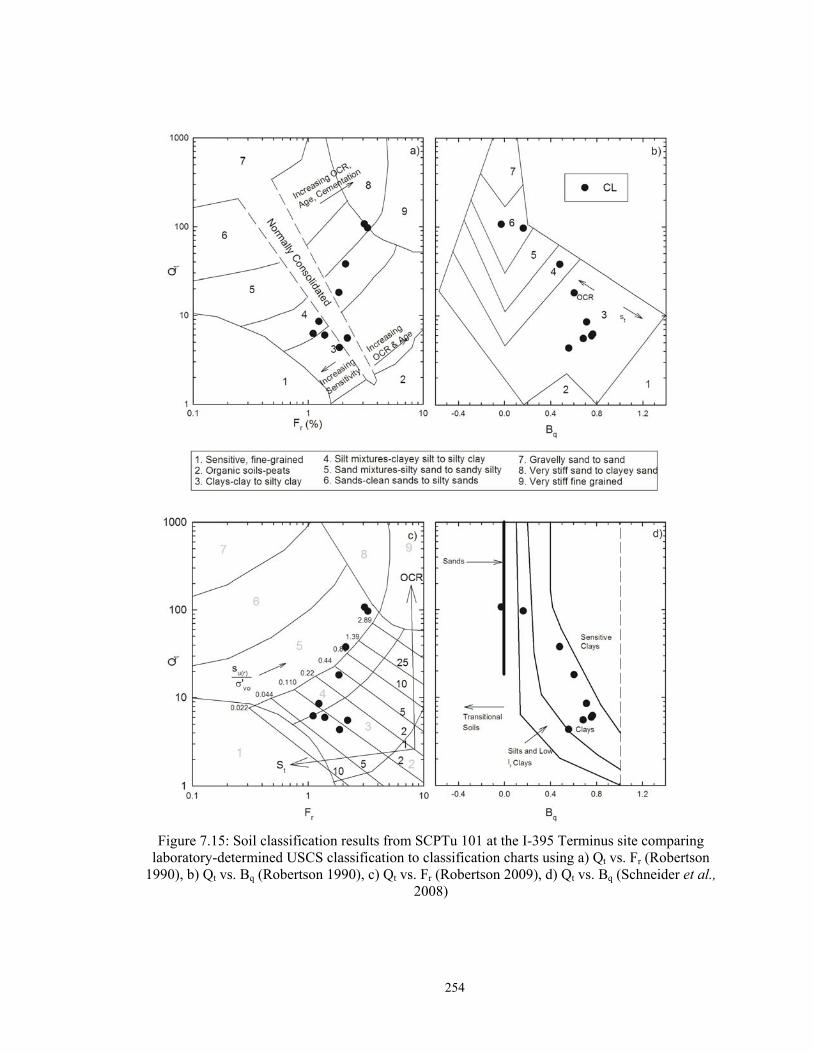
254
Figure 7.15: Soil classification results from SCPTu 101 at the I-395 Terminus site comparing laboratory-determined USCS classification to classification charts using a) Qt vs. Fr (Robertson
1990), b) Qt vs. Bq (Robertson 1990), c) Qt vs. Fr (Robertson 2009), d) Qt vs. Bq (Schneider et al., 2008)
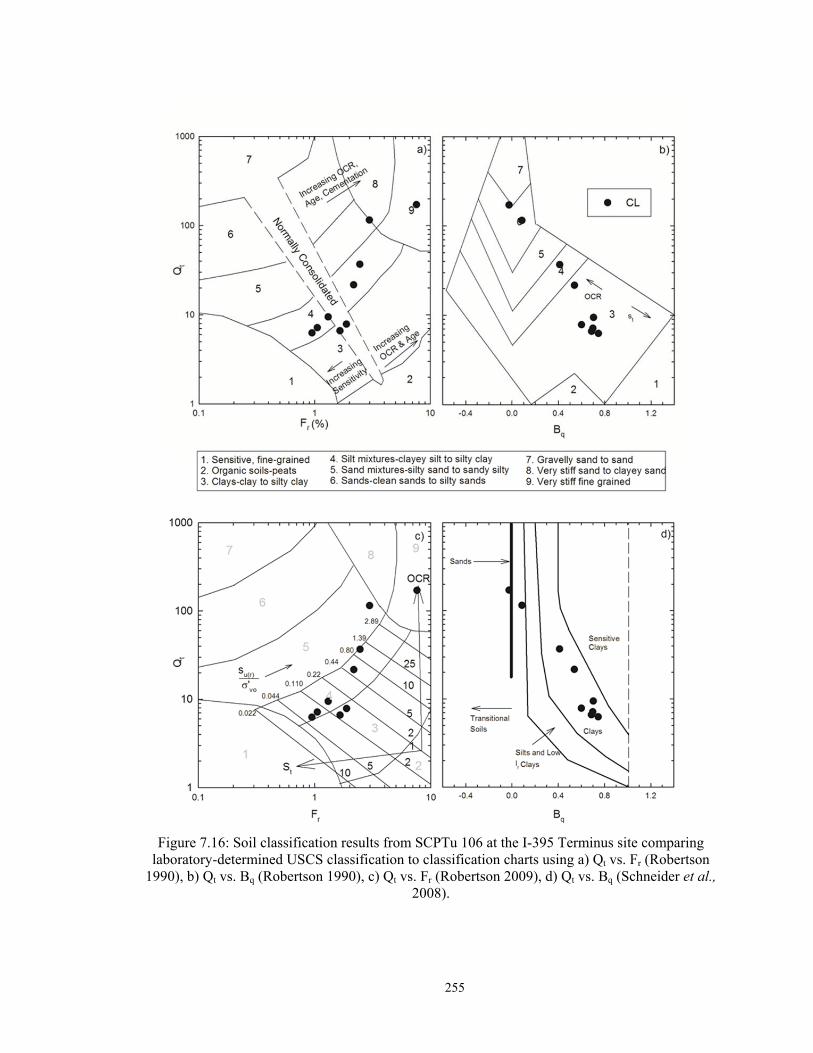
255
Figure 7.16: Soil classification results from SCPTu 106 at the I-395 Terminus site comparing laboratory-determined USCS classification to classification charts using a) Qt vs. Fr (Robertson
1990), b) Qt vs. Bq (Robertson 1990), c) Qt vs. Fr (Robertson 2009), d) Qt vs. Bq (Schneider et al., 2008).
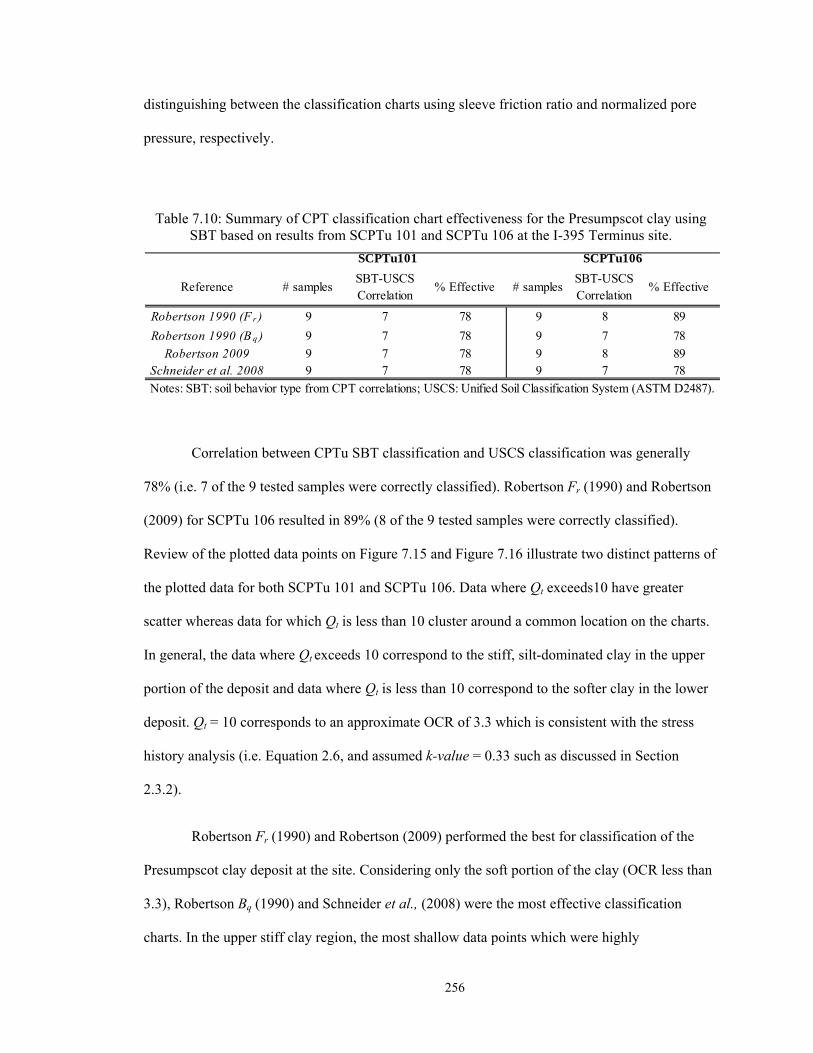
256
distinguishing between the classification charts using sleeve friction ratio and normalized pore
pressure, respectively.
Table 7.10: Summary of CPT classification chart effectiveness for the Presumpscot clay using SBT based on results from SCPTu 101 and SCPTu 106 at the I-395 Terminus site.
Correlation between CPTu SBT classification and USCS classification was generally
78% (i.e. 7 of the 9 tested samples were correctly classified). Robertson Fr (1990) and Robertson
(2009) for SCPTu 106 resulted in 89% (8 of the 9 tested samples were correctly classified).
Review of the plotted data points on Figure 7.15 and Figure 7.16 illustrate two distinct patterns of
the plotted data for both SCPTu 101 and SCPTu 106. Data where Qt exceeds10 have greater
scatter whereas data for which Qt is less than 10 cluster around a common location on the charts.
In general, the data where Qt exceeds 10 correspond to the stiff, silt-dominated clay in the upper
portion of the deposit and data where Qt is less than 10 correspond to the softer clay in the lower
deposit. Qt = 10 corresponds to an approximate OCR of 3.3 which is consistent with the stress
history analysis (i.e. Equation 2.6, and assumed k-value = 0.33 such as discussed in Section
2.3.2).
Robertson Fr (1990) and Robertson (2009) performed the best for classification of the
Presumpscot clay deposit at the site. Considering only the soft portion of the clay (OCR less than
3.3), Robertson Bq (1990) and Schneider et al., (2008) were the most effective classification
charts. In the upper stiff clay region, the most shallow data points which were highly
Reference # samplesSBT-USCS Correlation
% Effective # samplesSBT-USCS Correlation
% Effective
Robertson 1990 (F r ) 9 7 78 9 8 89
Robertson 1990 (B q ) 9 7 78 9 7 78
Robertson 2009 9 7 78 9 8 89Schneider et al. 2008 9 7 78 9 7 78
SCPTu101 SCPTu106
Notes: SBT: soil behavior type from CPT correlations; USCS: Unified Soil Classification System (ASTM D2487).
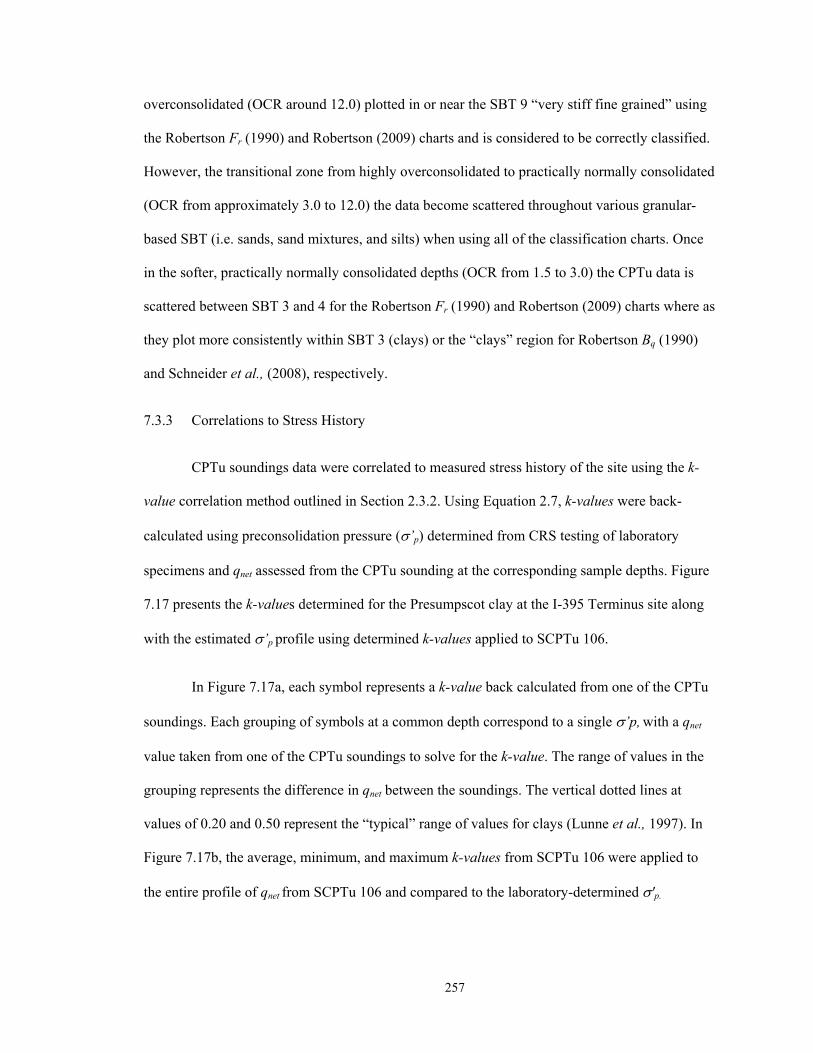
257
overconsolidated (OCR around 12.0) plotted in or near the SBT 9 “very stiff fine grained” using
the Robertson Fr (1990) and Robertson (2009) charts and is considered to be correctly classified.
However, the transitional zone from highly overconsolidated to practically normally consolidated
(OCR from approximately 3.0 to 12.0) the data become scattered throughout various granular-
based SBT (i.e. sands, sand mixtures, and silts) when using all of the classification charts. Once
in the softer, practically normally consolidated depths (OCR from 1.5 to 3.0) the CPTu data is
scattered between SBT 3 and 4 for the Robertson Fr (1990) and Robertson (2009) charts where as
they plot more consistently within SBT 3 (clays) or the “clays” region for Robertson Bq (1990)
and Schneider et al., (2008), respectively.
7.3.3 Correlations to Stress History
CPTu soundings data were correlated to measured stress history of the site using the k-
value correlation method outlined in Section 2.3.2. Using Equation 2.7, k-values were back-
calculated using preconsolidation pressure (’p) determined from CRS testing of laboratory
specimens and qnet assessed from the CPTu sounding at the corresponding sample depths. Figure
7.17 presents the k-values determined for the Presumpscot clay at the I-395 Terminus site along
with the estimated ’p profile using determined k-values applied to SCPTu 106.
In Figure 7.17a, each symbol represents a k-value back calculated from one of the CPTu
soundings. Each grouping of symbols at a common depth correspond to a single ’p, with a qnet
value taken from one of the CPTu soundings to solve for the k-value. The range of values in the
grouping represents the difference in qnet between the soundings. The vertical dotted lines at
values of 0.20 and 0.50 represent the “typical” range of values for clays (Lunne et al., 1997). In
Figure 7.17b, the average, minimum, and maximum k-values from SCPTu 106 were applied to
the entire profile of qnet from SCPTu 106 and compared to the laboratory-determined 'p.
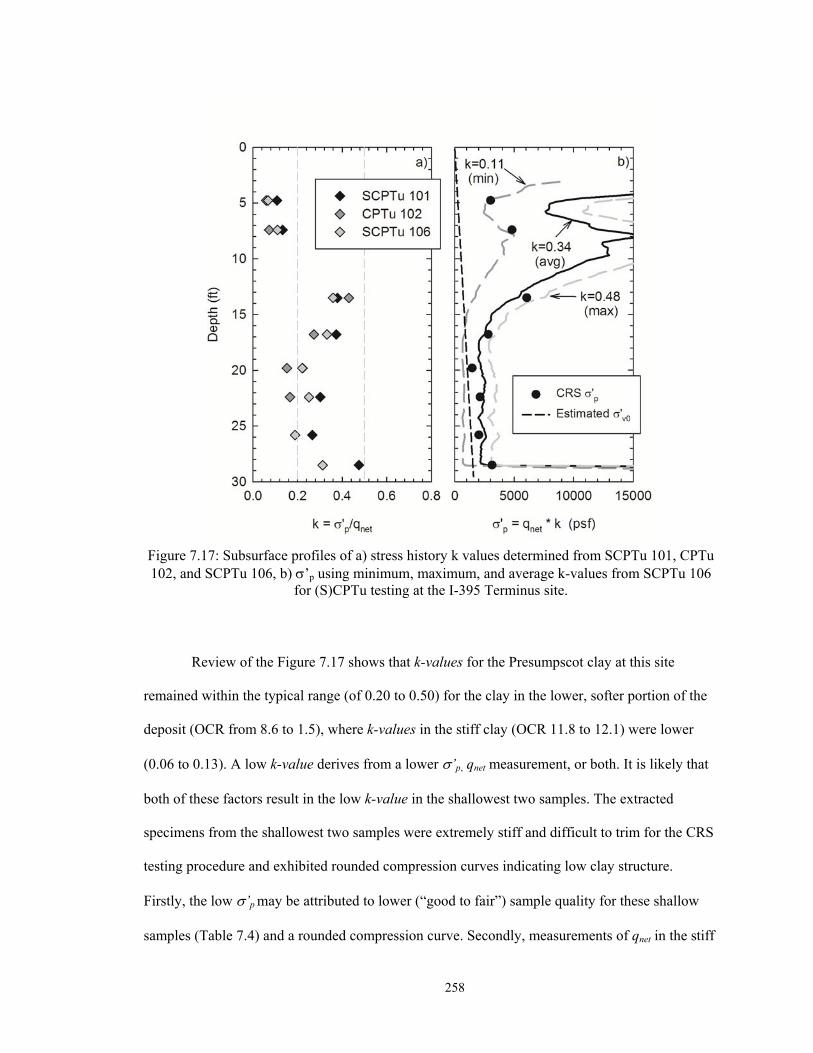
258
Figure 7.17: Subsurface profiles of a) stress history k values determined from SCPTu 101, CPTu 102, and SCPTu 106, b) ’p using minimum, maximum, and average k-values from SCPTu 106
for (S)CPTu testing at the I-395 Terminus site.
Review of the Figure 7.17 shows that k-values for the Presumpscot clay at this site
remained within the typical range (of 0.20 to 0.50) for the clay in the lower, softer portion of the
deposit (OCR from 8.6 to 1.5), where k-values in the stiff clay (OCR 11.8 to 12.1) were lower
(0.06 to 0.13). A low k-value derives from a lower ’p, qnet measurement, or both. It is likely that
both of these factors result in the low k-value in the shallowest two samples. The extracted
specimens from the shallowest two samples were extremely stiff and difficult to trim for the CRS
testing procedure and exhibited rounded compression curves indicating low clay structure.
Firstly, the low ’p may be attributed to lower (“good to fair”) sample quality for these shallow
samples (Table 7.4) and a rounded compression curve. Secondly, measurements of qnet in the stiff
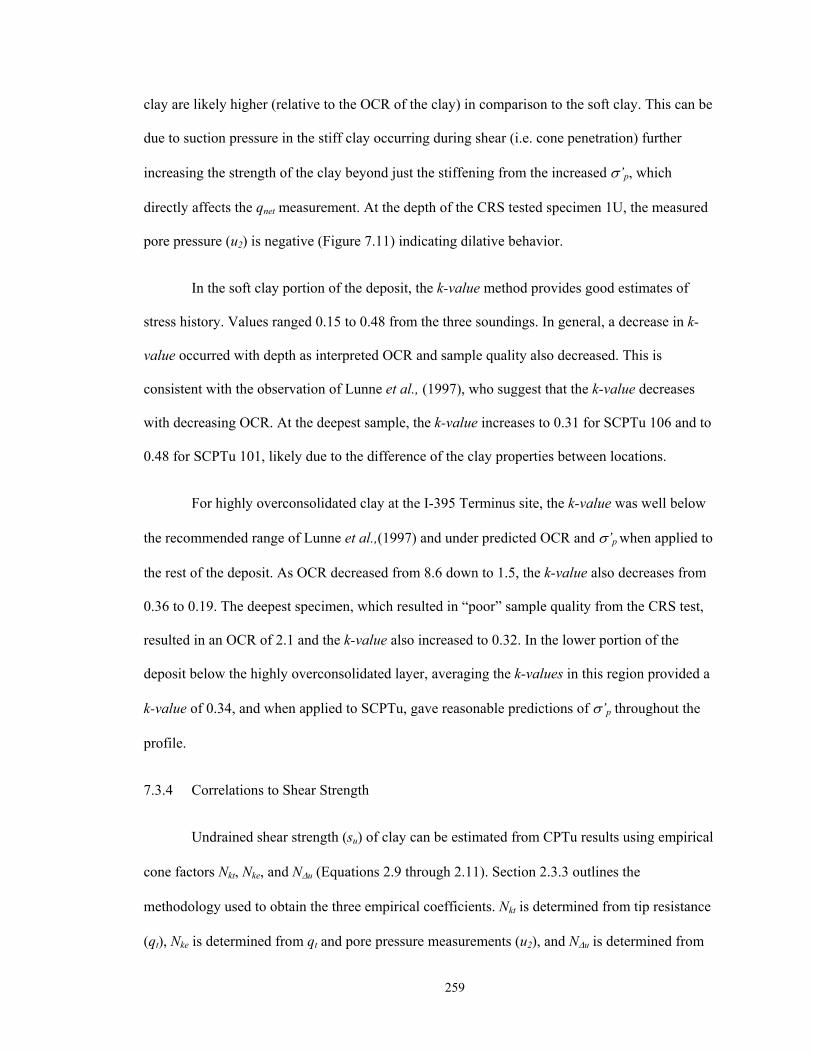
259
clay are likely higher (relative to the OCR of the clay) in comparison to the soft clay. This can be
due to suction pressure in the stiff clay occurring during shear (i.e. cone penetration) further
increasing the strength of the clay beyond just the stiffening from the increased ’p, which
directly affects the qnet measurement. At the depth of the CRS tested specimen 1U, the measured
pore pressure (u2) is negative (Figure 7.11) indicating dilative behavior.
In the soft clay portion of the deposit, the k-value method provides good estimates of
stress history. Values ranged 0.15 to 0.48 from the three soundings. In general, a decrease in k-
value occurred with depth as interpreted OCR and sample quality also decreased. This is
consistent with the observation of Lunne et al., (1997), who suggest that the k-value decreases
with decreasing OCR. At the deepest sample, the k-value increases to 0.31 for SCPTu 106 and to
0.48 for SCPTu 101, likely due to the difference of the clay properties between locations.
For highly overconsolidated clay at the I-395 Terminus site, the k-value was well below
the recommended range of Lunne et al.,(1997) and under predicted OCR and ’p when applied to
the rest of the deposit. As OCR decreased from 8.6 down to 1.5, the k-value also decreases from
0.36 to 0.19. The deepest specimen, which resulted in “poor” sample quality from the CRS test,
resulted in an OCR of 2.1 and the k-value also increased to 0.32. In the lower portion of the
deposit below the highly overconsolidated layer, averaging the k-values in this region provided a
k-value of 0.34, and when applied to SCPTu, gave reasonable predictions of ’p throughout the
profile.
7.3.4 Correlations to Shear Strength
Undrained shear strength (su) of clay can be estimated from CPTu results using empirical
cone factors Nkt, Nke, and Nu (Equations 2.9 through 2.11). Section 2.3.3 outlines the
methodology used to obtain the three empirical coefficients. Nkt is determined from tip resistance
(qt), Nke is determined from qt and pore pressure measurements (u2), and Nu is determined from

260
u2. These empirical coefficients were determined at the I-395 Terminus site using su from
laboratory CAUC triaxial shear testing and field vane shear testing (FVT) results.
Figure 7.18 presents the CPTu shear strength factors Nkt, Nke, and Nu calculated from
SCPTu 101, 102, and 106 using laboratory-determined su from CAUC testing and field vane
shear testing (FVT) on Presumpscot clay samples. A subscript of CAUC or FVT indicates the
testing method from which the su was measured. Nkt(CAUC), Nke(CAUC), or Nu(CAUC) values were back-
calculated from each of the CPTu soundings using the su measured from CAUC test results from
HB-BREW-102 at the corresponding depth. Nkt(FVT), Nke(FVT), or Nu(FVT) values were back-
calculated from SCPTu 101 (as it was the closest sounding to FVT from Boring HB-BREW-101).
SCPTu 101 and CPTu 102 were conducted 58.2 feet and 119.5 feet away from Boring HB-
BREW-102, respectively. CPTu encountered refusal at 25 feet, so values were not obtained below
this depth. The summary of Nkt and Nu values are presented in Table 7.11. As mentioned in
Section 2.3.3, the cone factor Nke has been found to be unreliable for clay deposits and will be
omitted from the correlation analysis.
Table 7.11: Summary of Nkt and Nu values at the I-395 Terminus site.
Minimum Average Maximum S.D. C.O.V.
Nkt(CAUC) 11.9 13.9 16.3 1.6 0.11
Nu(CAUC) 6.6 9.1 12.5 2.4 0.26
Nkt(CAUC) 11.8 18.4 23.9 6.1 0.33
Nu(CAUC) 7.2 11.7 15.9 4.4 0.37
Nkt(CAUC) 14.1 16.7 19.2 2.0 0.12
Nu(CAUC) 7.5 10.9 12.4 2.0 0.18
Nkt(FVT) 17.9 22 25.4 6.4 0.12
Nu(FVT) 12.6 16.3 19.1 4.4 0.13
SCPTu 101
CPTu 102
SCPTu 106
SCPTu 101
Note: S.D. = standard deviation; C.O.V. = coefficient of variation
261
Figure 7.18: Subsurface profiles of Nkt(CAUC and FVT), Nke(CAUC and FVT), and Nu(CAUC and FVT) correlated from (S)CPTu 101,102, and 106 with su from triaxial CAUC testing and field vane shear testing
(FVT) of Presumpscot clay at the I-395 Terminus site.
Nkt(CAUC) correlated from SCPTu 106 (the closest sounding to HB-BREW-102) varied
within a relatively narrow range from 14.1 to 19.2 over the entire profile, remaining within the
suggested range of 10 to 20 from Lunne et al., (1997). Nkt(CAUC) correlated from SCPTu 106
increased with increasing depth. Nkt(CAUC) correlated from the other two soundings illustrated more
scatter and variability with depth. Nu(CAUC) correlated from SCPTu 106 also showed a decrease
with depth until reaching approximately 20 feet, where OCR and su remained practically constant,
and Nu(CAUC) matched this. Nu(CAUC) showed less scatter between the three soundings. Most
Nu(CAUC) and all Nu(FVT)values plotted above the recommended range of 4 to 10 from Lunne et al.,
(1997).
262
In general, Nkt(CAUC) is less than Nkt(FVT) throughout the profile. This is due to the fact that
su from FVT is consistently less that su from CAUC, leading to differences in correlated Nkt
values. The difference in measured su comes from differences in mode of shear between the two
test methods, sample quality (there is no way of determining sample quality from the FVT), and
other testing procedures which effect the su measurement. These are discussed further in Sections
3.2 and 3.4.4 for the FVT and CAUC methods, respectively. Similarly, Nu(CAUC) resulted in lower
values than Nu(FVT) from the aforementioned factors.
There is variation in Nkt(CAUC) and Nu(CAUC) between the CPTu profiles. In the upper
portion of the deposit, the variation is less whereas the softer, lower portion of the deposit causes
more variation in the correlated cone factors. CPTu measurements in the soft clay are smaller
compared to the stiffer clay, therefore even small changes in tip resistance or pore pressure
measurements have large effects on the correlations.
Figure 7.19 presents su profile estimates using minimum, average, and maximum Nkt(CAUC)
and Nu(CAUC) values from SCPTu 106. Inspection of Figure 7.19 shows that the Nkt(CAUC) average
value of 16.7 follows the laboratory su closely throughout the entire profile and Nu(CAUC) predicts
laboratory su more effectively in the softer portion of the deposit and does a poor job in the more
overconsolidated portion. For Nkt(CAUC) average, the percent difference between CPTu estimated su
and laboratory su ranged from -17% to 14% (188 psf and 83 psf, respectively). Percent difference
between CPTu estimated su and laboratory su from Nu(CAUC) ranges from -37% to 12% (370 psf
and 70 psf, respectively).
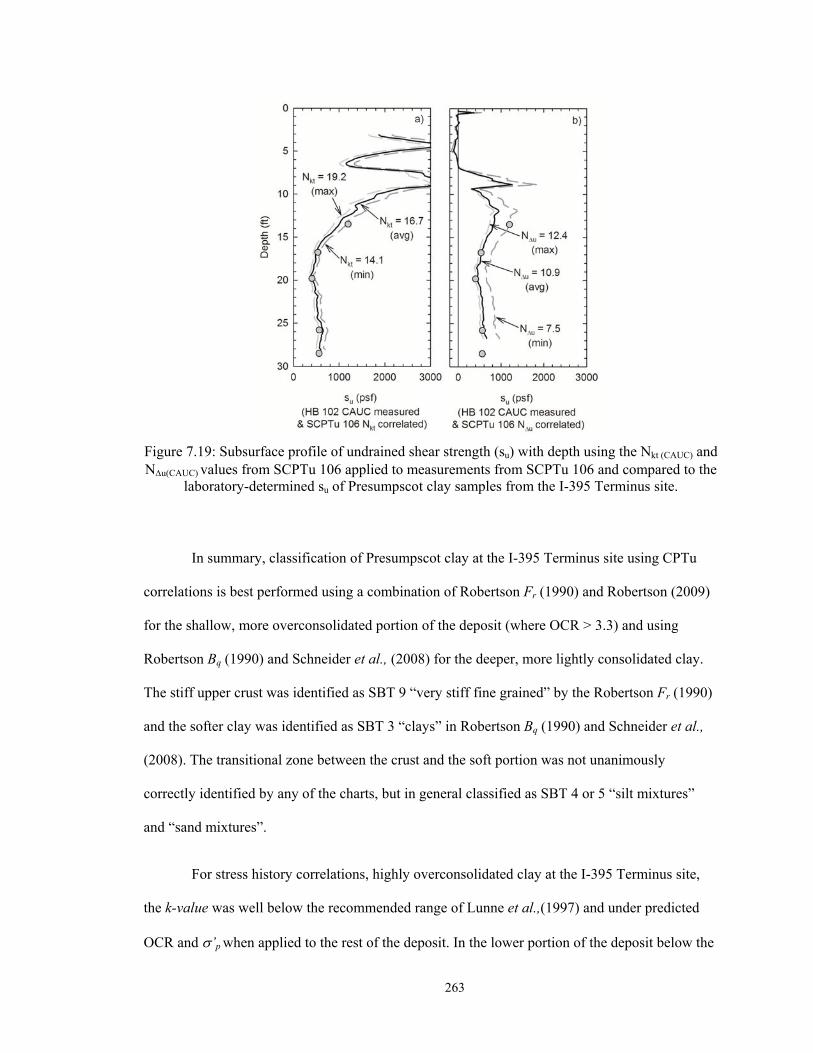
263
Figure 7.19: Subsurface profile of undrained shear strength (su) with depth using the Nkt (CAUC) and Nu(CAUC) values from SCPTu 106 applied to measurements from SCPTu 106 and compared to the
laboratory-determined su of Presumpscot clay samples from the I-395 Terminus site.
In summary, classification of Presumpscot clay at the I-395 Terminus site using CPTu
correlations is best performed using a combination of Robertson Fr (1990) and Robertson (2009)
for the shallow, more overconsolidated portion of the deposit (where OCR > 3.3) and using
Robertson Bq (1990) and Schneider et al., (2008) for the deeper, more lightly consolidated clay.
The stiff upper crust was identified as SBT 9 “very stiff fine grained” by the Robertson Fr (1990)
and the softer clay was identified as SBT 3 “clays” in Robertson Bq (1990) and Schneider et al.,
(2008). The transitional zone between the crust and the soft portion was not unanimously
correctly identified by any of the charts, but in general classified as SBT 4 or 5 “silt mixtures”
and “sand mixtures”.
For stress history correlations, highly overconsolidated clay at the I-395 Terminus site,
the k-value was well below the recommended range of Lunne et al.,(1997) and under predicted
OCR and ’p when applied to the rest of the deposit. In the lower portion of the deposit below the
264
highly overconsolidated layer, averaging the k-values in this region provided a k-value of 0.34,
and when applied to SCPTu, gave reasonable predictions of ’p throughout the profile. Undrained
shear strength at the site was best estimated throughout the entire profile using an average
Nkt(CAUC) of 16.7 and was reasonably estimated using a Nu(CAUC) average of 10.9. su in the
overconsolidated portion was not well predicted using the Nu(CAUC) average.
265
8 COMPREHENSIVE COMPARATVE ANALYSIS
8.1 Chapter Overview
This chapter presents the analysis of the methods used to correlate cone penetration
testing with pore pressure measurements (CPTu) results with classification, stress history ('p),
and undrained shear strength (su) as measured from laboratory testing of high quality samples of
the Presumpscot clay for each of the four research sites. The methods were selected based on
their prevalence in geotechnical practice and applicability to the Presumpscot clay based on
suggestions from published literature. Detailed results of classification, 'p, and su estimated from
CPTu measurements at each site are available in Chapters 4 through 7.
In this chapter, a brief description of the Presumpscot clay deposits at each site and
resulting CPTu classifications and correlations are presented. It should be noted that all four
research sites had existing superstructures and/or foundation elements existing at the site and
hence the resulting stress history may be affected by this previous loading. At the end of the
following site summaries, Figure 8.1 through Figure 8.4 illustrates the range of CPTu
measurements encountered at each site and the 'p and su profiles obtained from laboratory testing
on samples collected at each site for comparison. For simplicity, only one CPTu profile from each
site is plotted (even though multiple CPTu soundings were performed at three of the sites) and
analyzed throughout this chapter. The selected CPTu from each site was the sounding performed
closest to the boring where high quality samples were collected for advanced laboratory testing
and analysis. The variation in correlated properties and classification from the different CPTu
soundings at each site is addressed in the site specific chapters.
8.1.1 The Route 26/100 Falmouth Bridge Site
The Falmouth Bridge is located along Route 26/100 across the Presumpscot River in
Falmouth, ME. Presumpscot clay at this site was approximately 63 feet thick. Natural water
266
content of the clay varies from 37% to 54%, Plastic Limit (PL) ranges from 19 to 29, Liquid
Limit (LL) ranges from 29 to 54, and Liquidity Index (LI) ranges from 0.9 to 2.2. The sensitivity
of the clay ranges from 9 to greater than 100, indicating a "quick" deposit. Overconsolidation
ratio (OCR) of the clay begins at 3.4 near the top of the deposit, decreasing to 1.8 at
approximately 25 feet below ground surface (the extent of groundwater fluctuation), where the
stress history reaches nearly normally consolidated conditions. su from direct simple shear (DSS)
testing ranges from 305 psf to 766 psf, generally increasing uniformly with depth. Based on the
work of Karlsrud and Hernandez-Martinez (2013), su from DSS is in the order of 0.74 times the
anisotropically consolidated undrained compression (CAUC) strength for high quality samples.
Based on this, the equivalent triaxial compression su of the Presumpscot clay at the Route 26/100
Bridge is estimated to range from 411 psf to 969 psf. Throughout this chapter, the resulting DSS
and CAUC su will be presented to allow for comparison to the other sites, which were
characterized using CAUC su.
The Stress History and Normalized Engineering Parameter (SHANSEP) testing was not
performed on the laboratory samples because of equipment limitations. However, a best-fit
recompression line can be fit to the recompression triaxial CAUC data (as shown in Section
4.2.4), and the resulting su-OCR relationship for the Presumpscot clay based on DSS and the
CAUC equivalent su is shown in Equation 8.1 and 8.2, respectively.
suDSS(OC) = 0.21∙OCR0.50 8.1
suCAUC-DSS(OC) = 0.28∙OCR0.51 8.2
8.1.2 Martin's Point Bridge Site
Martin's Point Bridge (MPB) spans from the southern tip of Falmouth Foreside along
Route 1 to Martin's Point in Portland, Maine. The Presumpscot clay deposit at the site is located

267
in a tidally influenced location. The depth of the clay at the site is approximately 40 feet and is
submerged below sea level. Natural water content ranges from 31% to 44%, PL ranges from 17 to
26, LL ranges from 24 to 47, and LI ranges from 0.66 to 1.72. Sensitivity ranges from 2.2 to 8.7
(with some higher outliers), indicating a deposit of moderate sensitivity. OCR decreases
uniformly with depth from 6.8 near the top of the deposit to 3.1 at the bottom, thus the entire
deposit is overconsolidated. su determined from CAUC testing on undisturbed samples ranges
from 661 psf to 1,557 psf, with a general uniform increase with depth. The resulting SHANSEP
su-OCR relationship based on the recompression analysis and the true SHANSEP analysis for the
Presumpscot clay at the site is shown in Equation 8.3 and 8.4, respectively:
suCAUC(OC) = 0.12·OCR1.12 8.3
suCAUC(OC) = 0.28·OCR0.83 8.4
The resulting SHANSEP equation at this site provided a poor prediction of the su profile.
8.1.3 The Route 197 Richmond-Dresden Bridge Site
The Route 197 Bridge connects the Town of Richmond, ME and the Town of Dresden,
ME over the Kennebec River along Route 197. The Presumpscot clay deposit at the site is
approximately 23 feet thick at its deepest in the middle of the riverbed and submerged in
freshwater conditions. Natural water content ranges from 27% to 42%, PL ranges from 17 to 22,
LL ranges from 33 to 40, and LI ranges from 0.57 to 1.14. Sensitivity of the clay ranges from 8 to
45, indicating moderate to quick conditions. OCR decreases uniformly with depth from 5.8 at the
top of the deposit to 2.2 at the bottom, thus the entire deposit is overconsolidated. It is
hypothesized that part of the alluvium deposit has been scoured away, resulting in
overconsolidation. su determined from CAUC testing on undisturbed samples ranges from 527 psf
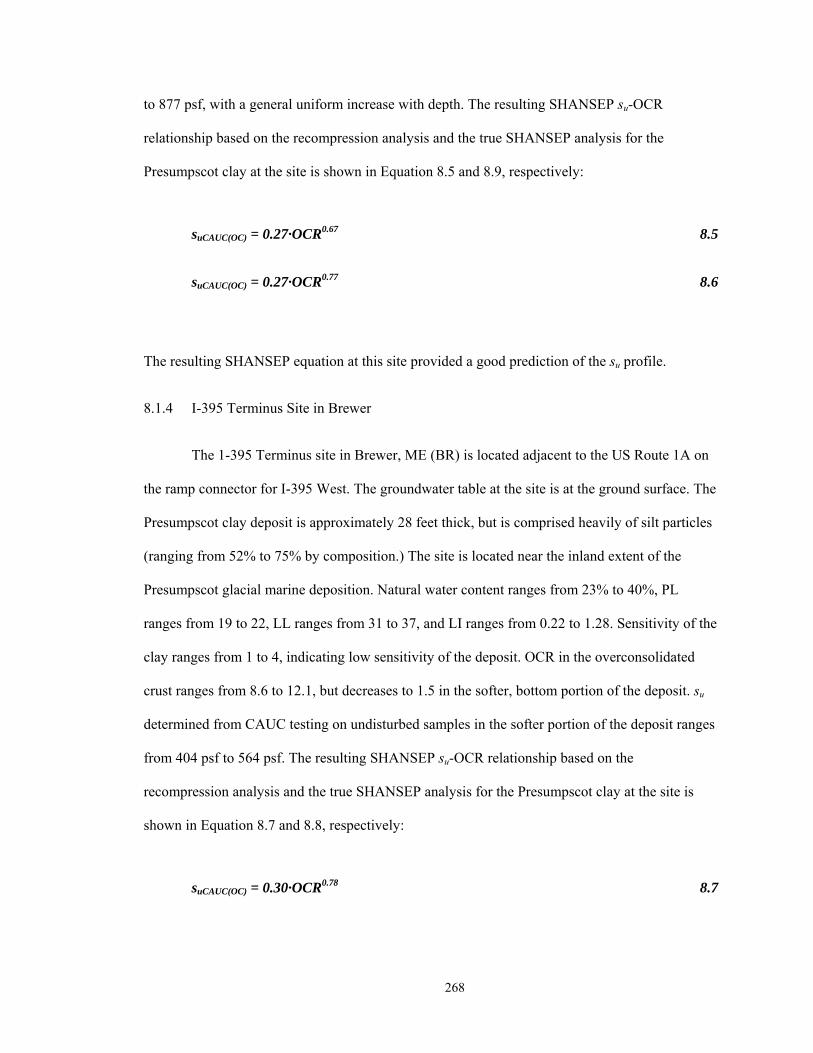
268
to 877 psf, with a general uniform increase with depth. The resulting SHANSEP su-OCR
relationship based on the recompression analysis and the true SHANSEP analysis for the
Presumpscot clay at the site is shown in Equation 8.5 and 8.9, respectively:
suCAUC(OC) = 0.27·OCR0.67 8.5
suCAUC(OC) = 0.27·OCR0.77 8.6
The resulting SHANSEP equation at this site provided a good prediction of the su profile.
8.1.4 I-395 Terminus Site in Brewer
The 1-395 Terminus site in Brewer, ME (BR) is located adjacent to the US Route 1A on
the ramp connector for I-395 West. The groundwater table at the site is at the ground surface. The
Presumpscot clay deposit is approximately 28 feet thick, but is comprised heavily of silt particles
(ranging from 52% to 75% by composition.) The site is located near the inland extent of the
Presumpscot glacial marine deposition. Natural water content ranges from 23% to 40%, PL
ranges from 19 to 22, LL ranges from 31 to 37, and LI ranges from 0.22 to 1.28. Sensitivity of the
clay ranges from 1 to 4, indicating low sensitivity of the deposit. OCR in the overconsolidated
crust ranges from 8.6 to 12.1, but decreases to 1.5 in the softer, bottom portion of the deposit. su
determined from CAUC testing on undisturbed samples in the softer portion of the deposit ranges
from 404 psf to 564 psf. The resulting SHANSEP su-OCR relationship based on the
recompression analysis and the true SHANSEP analysis for the Presumpscot clay at the site is
shown in Equation 8.7 and 8.8, respectively:
suCAUC(OC) = 0.30·OCR0.78 8.7

269
suCAUC(OC) = 0.26·OCR0.70 8.8
The resulting SHANSEP equation at this site provided a poor prediction of the su profile.
8.1.5 Comparison of the Measured Soil Properties
This section summarizes the soil properties determined from the laboratory testing and
the CPTu measurements at each site and draws conclusions from the comparison of this data. The
purpose is to give the reader an understanding of ranges of values from the CPTu measurements
for corresponding stress history and/or undrained shear strength profiles of Presumpscot clay. The
Presumpscot clay deposits at each of the site will be compared and contrasted to highlight the
difference in the soil properties via differences in geologic history and anthropomorphic effects.
Figure 8.1 presents 'p, su, and sensitivity (St) of the Presumpscot clay at each site. Figure
8.2 presents the su results at all four sites from both the laboratory testing and field vane shear
testing (FVT). Figure 8.3 presents corrected tip resistance (qt), sleeve friction (fs), and pore
pressure measurements (u2) collected from the CPTu sounding closest to the samples borings at
each site. Figure 8.4 presents the three normalized CPTu measurements of tip resistance (Qt),
sleeve friction ratio (Fr), and normalized pore pressure (Bq) for the same soundings at each site.
Table 8.1 presents the SCPTu sounding and the boring at each site used for the correlations
presented in this chapter. Note that modified Shelby tube sampling was performed at all four sites
and Sherbrook block sampling was performed at the Route 26/100 Bridge site.
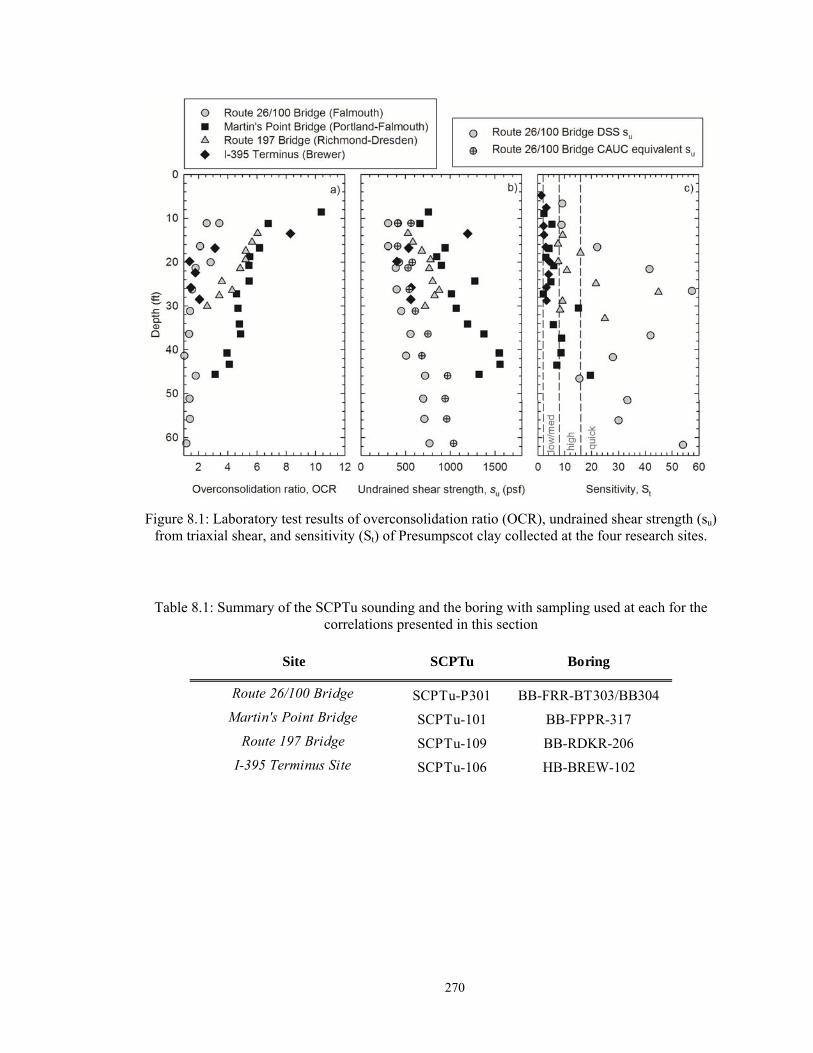
270
Figure 8.1: Laboratory test results of overconsolidation ratio (OCR), undrained shear strength (su) from triaxial shear, and sensitivity (St) of Presumpscot clay collected at the four research sites.
Table 8.1: Summary of the SCPTu sounding and the boring with sampling used at each for the correlations presented in this section
Route 26/100 Bridge SCPTu-P301 BB-FRR-BT303/BB304
Martin's Point Bridge SCPTu-101 BB-FPPR-317
Route 197 Bridge SCPTu-109 BB-RDKR-206
I-395 Terminus Site SCPTu-106 HB-BREW-102
SCPTu BoringSite
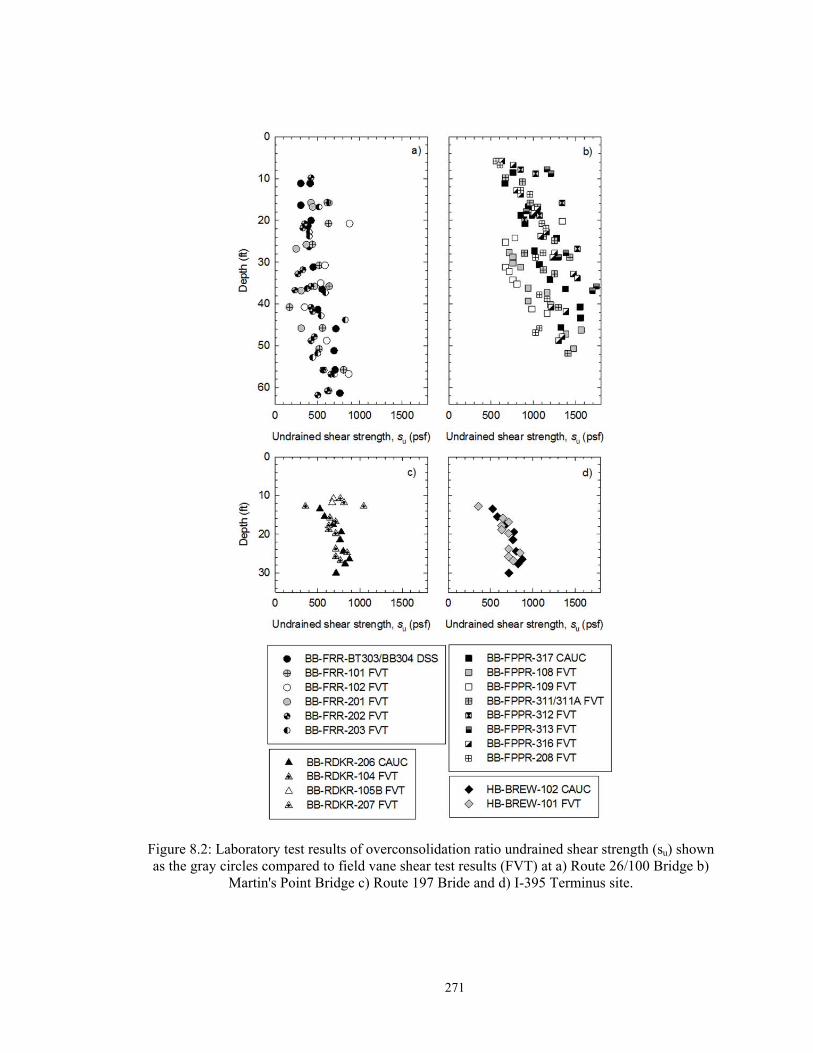
271
Figure 8.2: Laboratory test results of overconsolidation ratio undrained shear strength (su) shown as the gray circles compared to field vane shear test results (FVT) at a) Route 26/100 Bridge b)
Martin's Point Bridge c) Route 197 Bride and d) I-395 Terminus site.
272
The overconsolidation ratio (OCR) of the Presumpscot clay at the four research sites
ranged from 12.1 to 1.0. At each site, the OCR values reached their highest magnitude at the top
of the deposit and generally decreased with depth. Practically normally consolidation conditions
(i.e. OCR=1) were reached at the lower portion of the deposits at the Route 26/100 Bridge and the
I-395 Terminus site. Between these two sites, the low OCR soil in the bottom portion of each
deposit has similar su values within these depths. su of the Presumpscot clay from these sites from
approximately 15 feet to 30 feet depth remain with a narrow range of 400 psf to 600 psf, matched
by similar OCR values of 1.0 to 2.1. However, the upper portion of the I-395 Terminus site is
more desiccated and silty than the upper portion of the Route 26/100 Bridge deposit resulting in
higher OCR and su values at the I-395 Terminus site within the shallow portion of the deposit.
Normalized su values to in situ vertical effective stress for normally consolidated deposits
generally range from 0.20 to 0.30, and within the shallow portion of the I-395 Terminus site,
su/'v0 was as high as 1.68 whereas su/'v0 at the Route 26/100 Falmouth Bridge site reached a
maximum value of 0.33.
At Route 197 Bridge and Martin's Point Bridge, OCR approached 2.2 and 3.1 at the
bottom of the deposits, respectively. By definition, the Presumpscot clay at these depths has been
stressed to 2.2 and 3.1 times their in situ state, respectively. From this, we can hypothesize
geologic and anthropomorphic loading conditions which may have caused the observed increase
in OCR. Anthropomorphic loading which would increase the stress levels (and hence the 'p)
throughout the entire clay deposits would be surface loading from bridge structures which have
existed at each site for decades. This includes bridge abutments, piers, approach fill, or any other
elements which will load the ground surface and dissipate with depth. At the Route 197 Bridge,
the only bridge elements close enough to stress the Presumpscot clay deposit are the piers near
the middle of the span, which are pile supported (Maine DOT, 2012). Since pile-supported
elements transfer the load directly to the bedrock without loading the clay, the bridge piers likely

273
did not the cause increased OCR values at the site. Thus, the OCR likely derives from geologic
deposition at the site which has since been scoured from the riverbed.
On the other hand, the Presumpscot clay deposit at Martin's Point Bridge may have been
affected by anthropomorphic conditions. The north bridge approach (Falmouth side) includes an
approximately 500 foot long earth embankment on the Falmouth shoreline (Golder Associates,
2011). According to the coordinates for the CPTu testing and the corresponding location plotted
on Google Earth (2015), the distance between CPTu 101 and CPTu 104 from the edge of old
earth embankment is 60 feet and 35 feet, respectively. Depending on the conditions at the bottom
of the earth embankment (i.e. elevation of bottom of embankment, total unit weight of the fill
used, lateral extent of fill slope below water elevation) the placed fill may have overconsolidated
the Presumpscot clay deposit. Without more detailed information on the embankment, it is
difficult to determine if (and how much) it effects the Presumpscot clay deposit, however one
observation from the CPTu data reinforces this hypothesis. CPTu 103, which was performed
further out away from the embankment resulted in lower qt values compared to the other two
soundings (Figure 5.16). Since qt is directly related to the stiffness of the clay, it is intuitive that
the Presumpscot clay at the location of CPTu 101 and CPTu 104 which has been (potentially)
stiffened by the fill embankment would cause a higher tip resistance compared to the more
"virgin" Presumpscot clay at the region of CPTu 103.
As expected, su of the Route 26/100 Bridge and the I-395 Terminus site is lower as
compared to su of the other two deposits at similar depths. This is due directly to the degree of
overconsolidation of the clay. A higher OCR results in stiffer clay which increases su. For
comparison, the su determined from DSS testing at the Route 26/100 Bridge is plotted alongside
the CAUC equivalent of those same samples using the conversion of su(DSS) = su(CAUC) * 0.74.
Throughout this chapter, both su values from the Route 26/100 Bridge are used in the presentation
of CPTu correlations. Conversely, OCR at the other two sites range from 2.6 to 6.7 at these same

274
depths which results in a larger range (and higher magnitude) of su. St, ratio of intact to disturbed
su values, results show that the majority of samples at the Route 26/100 Bridge and the Route 197
Bridge classify as "high" or "quick" sensitivity, whereas samples at Martin's Point Bridge and the
I-396 Terminus classify mostly as "low/medium" sensitivity.
Figure 8.5 illustrates graphically the relationship between measured soil properties and
CPTu results. Intuitively, the tip resistance to an advancing cone will increase in stiffer clay (i.e.
clay with higher su) which is illustrated in Figure 8.5a. su in the figure is based on the x-axis on
the top of the plot where the qt is based on the x-axis at the bottom of the plot. The ratio of qt to su
in this plot is 18, is equivalent to an Nkt of 18. In Figure 8.5b, the OCR of undisturbed soil
samples is compared to the Qt of CPTu soundings. The ratio of Qt to OCR in Figure 8.5b is 2.94,
equivalent to a k-value of 0.34. The effectiveness of these correlations will be discussed
subsequently. The purpose of Figure 8.5 is to illustrate that a relationship exists between
measured soil properties in the laboratory and the CPTu measurements.
Figure 8.3 shows that a clear trend exists for the corrected tip resistance (qt) and pore
pressure (u2) measurements. Route 26/100 Bridge and the I-395 Terminus site, which contain the
normally consolidated "soft" zones of Presumpscot clay, exhibit lower qt and u2 values of these
measurements throughout the soft zone. This does not include the highly desiccated upper portion
of the I-395 Terminus site, which provided very high tip resistance values and low/negative pore
pressure measurements. The consistency of the lower measured qt and u2 values for the two sites
with "soft" Presumpscot clay as compared to the other two with stiffer clay signifies the ability of
the CPTu to identify behavior of the clay deposit. Even without specific correlations to OCR or
su, a geotechnical engineer can immediately identify at the least the relative in situ state of the
clay. For instance, at Martin's Point Bridge, the (relative) high values of qt (Figure 8.3a) and
(relative) high values of fs (Figure 8.3b) would suggest a deposit of stiff clay with a low
sensitivity, which is exactly what is occurring at the site. Martin's Point Bridge exhibits the
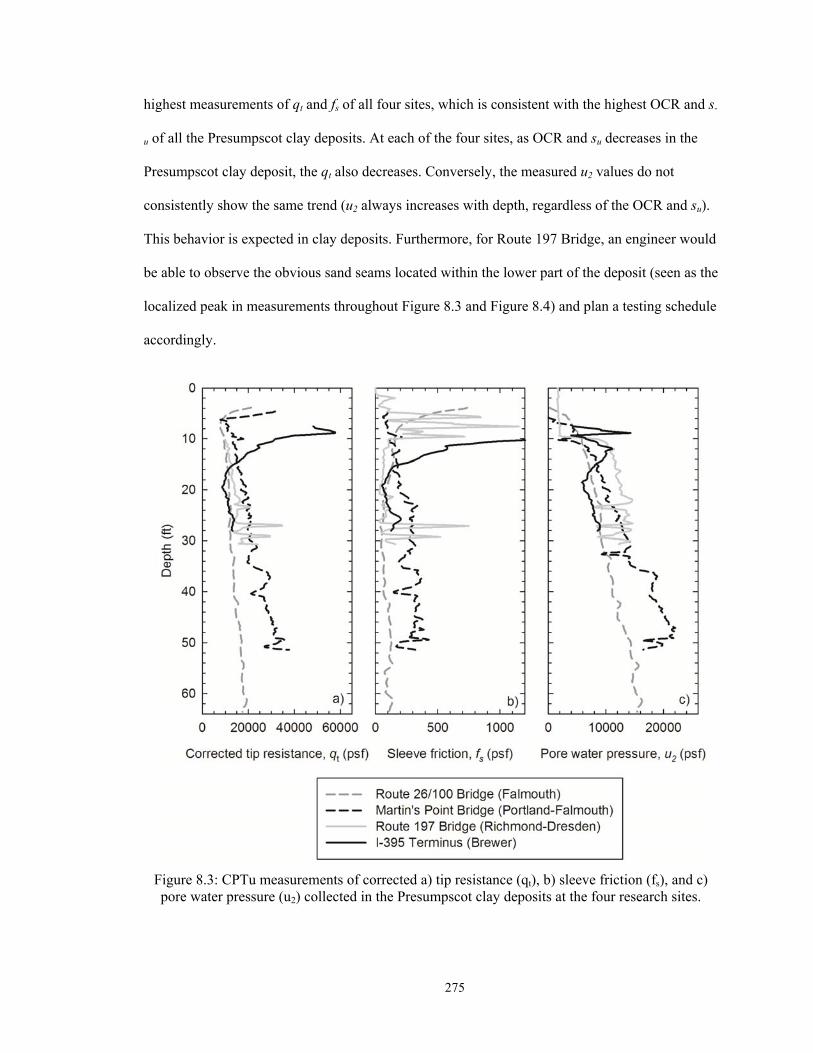
275
highest measurements of qt and fs of all four sites, which is consistent with the highest OCR and s-
u of all the Presumpscot clay deposits. At each of the four sites, as OCR and su decreases in the
Presumpscot clay deposit, the qt also decreases. Conversely, the measured u2 values do not
consistently show the same trend (u2 always increases with depth, regardless of the OCR and su).
This behavior is expected in clay deposits. Furthermore, for Route 197 Bridge, an engineer would
be able to observe the obvious sand seams located within the lower part of the deposit (seen as the
localized peak in measurements throughout Figure 8.3 and Figure 8.4) and plan a testing schedule
accordingly.
Figure 8.3: CPTu measurements of corrected a) tip resistance (qt), b) sleeve friction (fs), and c) pore water pressure (u2) collected in the Presumpscot clay deposits at the four research sites.
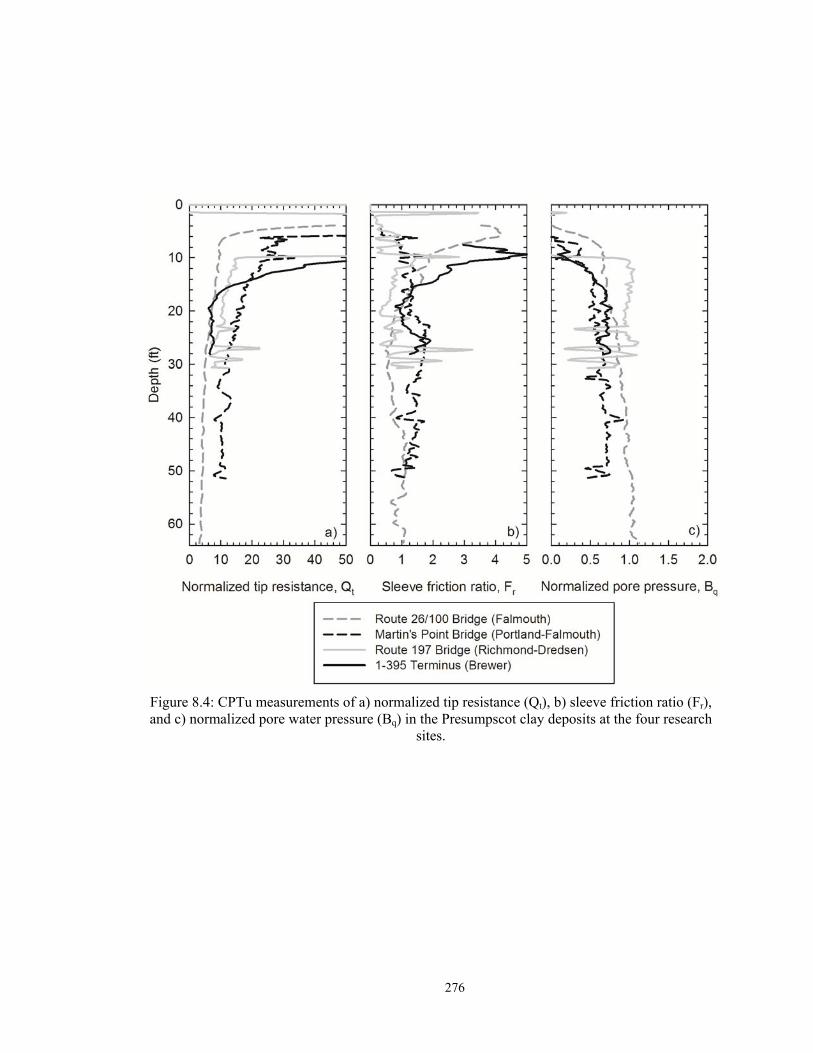
276
Figure 8.4: CPTu measurements of a) normalized tip resistance (Qt), b) sleeve friction ratio (Fr), and c) normalized pore water pressure (Bq) in the Presumpscot clay deposits at the four research
sites.

277
Figure 8.5: CPTu measurements compared to measured values of undrained shear strength and OCR of Presumpscot clay.
If the reader is curious for more details about each of the CPTu profiles shown in these
figures and what it conveys about the deposit, each of the CPTu profiles are dissected in the site-
specific chapters.
8.2 Benefits of Continuous Profiling
Many researchers and practitioners highlight the benefit of the continuous measurements
of the CPTu technique, even the non-parameter data obtained from the test. For instance, CPTu
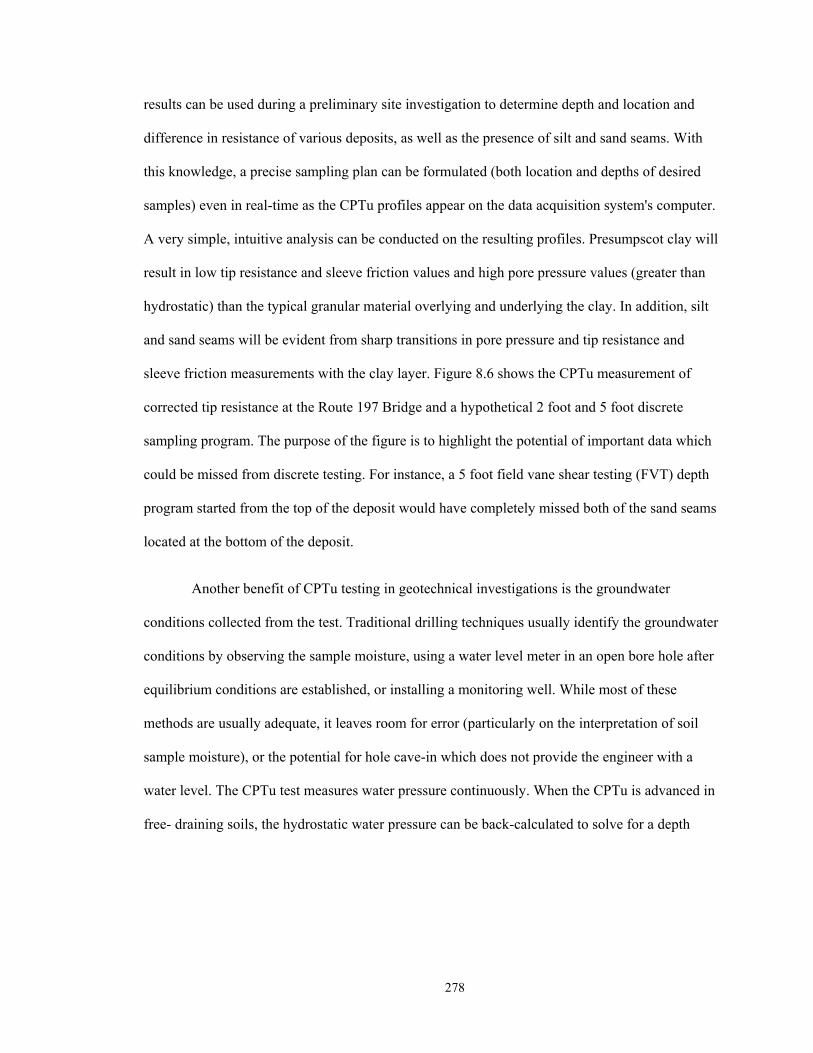
278
results can be used during a preliminary site investigation to determine depth and location and
difference in resistance of various deposits, as well as the presence of silt and sand seams. With
this knowledge, a precise sampling plan can be formulated (both location and depths of desired
samples) even in real-time as the CPTu profiles appear on the data acquisition system's computer.
A very simple, intuitive analysis can be conducted on the resulting profiles. Presumpscot clay will
result in low tip resistance and sleeve friction values and high pore pressure values (greater than
hydrostatic) than the typical granular material overlying and underlying the clay. In addition, silt
and sand seams will be evident from sharp transitions in pore pressure and tip resistance and
sleeve friction measurements with the clay layer. Figure 8.6 shows the CPTu measurement of
corrected tip resistance at the Route 197 Bridge and a hypothetical 2 foot and 5 foot discrete
sampling program. The purpose of the figure is to highlight the potential of important data which
could be missed from discrete testing. For instance, a 5 foot field vane shear testing (FVT) depth
program started from the top of the deposit would have completely missed both of the sand seams
located at the bottom of the deposit.
Another benefit of CPTu testing in geotechnical investigations is the groundwater
conditions collected from the test. Traditional drilling techniques usually identify the groundwater
conditions by observing the sample moisture, using a water level meter in an open bore hole after
equilibrium conditions are established, or installing a monitoring well. While most of these
methods are usually adequate, it leaves room for error (particularly on the interpretation of soil
sample moisture), or the potential for hole cave-in which does not provide the engineer with a
water level. The CPTu test measures water pressure continuously. When the CPTu is advanced in
free- draining soils, the hydrostatic water pressure can be back-calculated to solve for a depth
279
Figure 8.6: Schematic illustrating discrete sampling locations at 2 foot and 5 foot intervals within the subsurface of the Route 197 Bridge alongside the CPTu profile of corrected tip resistance.
of the groundwater table surface, provided u2 measurements are accurate. CPTu tests in clay soils
result in excess water pressure from the undrained shear of the soil and do not provide accurate
groundwater levels unless the penetrometer is left stagnant for long enough in the hole to allow
complete pore pressure dissipation. However, the water pressure measurements in clay can
provide useful data to the geotechnical engineer (beyond the engineer parameter correlations
discussed in Section 8.5) if artesian pressures are occurring. At the I-395 Terminus site, artesian
qt (psf)
0 50000 100000
Dep
th b
elow
mud
line
(ft)
0
5
10
15
20
25
30SAND
2' Sampling/Testing Interval5' Sampling/Testing Interval
SAND
SAND
*=Sand Seam*
*
*
280
water pressures were present in the Presumpscot clay layer and were identified by the CPTu
sounding (Figure 7.11).
8.3 CPTu Classification Correlations
Classification of the Presumpscot clay was performed on Presumpscot clay using four
empirical CPTu soil behavior charts (Figure 2.9). Samples of the clay were also collected at
discrete depths and classified using the Unified Soil Classification System (USCS). The
classification charts are based on behavioral characteristics of the soil and are empirically fit to
Unified Soil Classification System (USCS, ASTM D2435) or other classification systems. Unlike
USCS classification, which is based on disturbed samples, CPTu results as presented in the
classification charts are affected by stress history, in-situ stresses, stiffness, macrofabric, and void
ratio (Robertson, 1990). Equation 8.9 through 8.11 shows the equations used in the CPTu
classification charts.
Qt = (qt – v0) / 'v0 = qnet / 'v0 8.9
Fr = fs / (qt – v0) = fs / qnet 8.10
Bq = (u2 – u0) / (qt – v0) = u / qnet 8.11
where qt = measured corrected tip resistance (psf), v0 = estimated in situ total vertical effective
stress (psf), 'v0 = estimated in situ vertical effective stress (psf), fs = measured sleeve friction
(psf), u2 = measured pore pressure (psf), and u0 = hydrostatic water pressure (psf)
Robertson (1990) (Qt-Fr), Robertson (1990) (Qt-Bq), Robertson (2009) (Qt-Fr), and
Schneider et al., (2008) (Qt-Bq) are the four CPTu classification charts which use normalized tip
resistance (Qt) versus sleeve friction ratio (Fr) or normalized pore pressure (Bq). Robertson (2009)
is a replica of Robertson (1990) with additional soil behavioral trends included in the chart so the
classification of the soil will not differ between the two. Schneider et al., (2008) uses Qt and Bq.

281
Table 8.2 summarizes the effectiveness of the classification charts for classifying the
Presumpscot clay at each of the four research sites as compared to the USCS classification. The
criteria for "correct" classification are based on a match between the USCS classification and the
classification predicted by the CPTu chart. In general, the soil behavior type Regions 3 and 4 (i.e.
clays and silt mixtures) were considered acceptable for Robertson 1990 (Fr), Robertson (1990)
(Bq), Robertson (2009). Schneider et al., (2008) uses a different classification system, and for this
the "clays" and "sensitive clays" regions were considered acceptable. Each percentage in Table
8.2 represents the fraction of Presumpscot clay samples classified in accordance with USCS
which correlated with the soil behavior type on the CPTu classification charts. For instance, at the
I-395 Terminus site, a total of 9 Presumpscot clay samples were collected and classified in the
laboratory. CPTu data from the same depth of the undisturbed soil samples was plotted on the
four classification charts (Figure 8.8), and USCS classification for 7 of the 9 tested samples
matched with the plotted data on all of the classification charts, resulting in 78% effectiveness.
Table 8.2: Summary of SCPTu classfication chart effectiveness for each Presumpscot clay site based on comparison to Unified Soil Classification System determined classification.
Classification of Presumpscot clay using the Qt-Bq relationship Robertson (1990) and
Schneider et al., (2008) resulted in a cumulative 92% effectiveness (46 of the 50 samples) of all
collected Presumpscot clay samples from the Shelby tube and Sherbrook block samples. There
Robertson (1990)
Q t - F r
Robertson (1990)
Q t - B q
Robertson (2009)
Q t - F r
Schenider et al. , (2008)
Q t - B q
Route 26/100 Bridge (n = 19)100% 95% 100% 95%
Martin's Point Bridge (n = 13)92% 100% 92% 100%
Route 197 Bridge (n = 9)44% 89% 44% 89%
I-395 Terminus (n = 9)78% 78% 78% 78%
84% (42/50) 92% (46/50) 84% (42/50) 92% (46/50)
Site
CPTu Classification ChartPercent effectiveness of:

282
doesn't appear to be a major difference for classification of the Presumpscot clay between the
Robertson (1990) and Schneider et al., (2008) Bq-Qt analyses effectiveness when comparing SBT
to USCS classification. However, as discussed later in the chapter, the "sensitive clay" region of
Schneider et al., (2008) appears to be more effective in identifying Presumpscot clay deposits
which are sensitive. Qt-Bq analyses was good for three out of the four sites and the Qt-Fr analyses
was good for two out of the four sites but showed exceedingly poor performance for the Route
197 Bridge site (this will be discussed later in the section).
The distribution of classification data points on the charts can be a tool in identifying
transitional zones to other materials, transitional zones within the Presumpscot deposit (e.g.
between dry, crustal zones and soft, normally consolidated zones), and sand seams. An example
of this stratification identified by the classification charts is shown in Figure 8.7. Figure 8.7
shows the soil profile at the Route 197 Bridge site, which can be split into three distinct layers:
the overlying alluvial sand (light gray), the Presumpscot clay (black), and the underlying marine
sand (dark gray). It is evident from inspection of Figure 8.7 that the sand layers above and below
the Presumpscot clay exhibit different behavior during penetration of the CPTu through these
layers. Tip resistance (qt) and sleeve friction (fs) measurements are higher, and variable, while
pore pressure (u2) measurements are lower and hydrostatic (since the soil is free-draining).
Conversely, the Presumpscot clay has low values of qt and fs while u2 increases dramatically
compared to the sand layers. Stratification of the soil layers at the Route 197 Bridge site is
relatively obvious from an initial inspection of the CPTu profiles; however, it is instructive to
display the corresponding normalized measurements of these values (i.e. Qt, Fr, and Bq) on the
SBT charts to verify the stratification identified by the charts. As expected, data points collected
in the sand layers resulted in higher Qt and Fr values therefore plotting in the upper-left portion of
Figure 8.7a and Figure 8.7c.

283
Figure 8.7: Comparison of CPTu profile collected at the Route 197 Bridge (modification of Figure 6.13, showing the soil layers by color) to the corresponding normalized measurement
plotted on SBT classification charts.
A few of the data points from the sand plotted in the same cluster as the clay data and
were scattered throughout the middle of the charts. This is a result of transitional soils as the
deposit transitions from sand to clay or vice versa. In these soils, the CPTu results are a "hybrid"
reading from both the sand (granular, drained soils) and the clay (cohesive, non-drained soils).
For Figure 8.7b, the data points collected in the sand layers plotted almost entirely on the Bq = 0
1. Sensitive, fine-grained 2. Organic soils-peats 3. Clays-clay to silty clay
4. Silt mixtures-clayey silt to silty clay5. Sand mixtures-silty sand to sandy silty6. Sands-clean sands to silty sands
7. Gravelly sand to sand8. Very stiff sand to clayey sand9. Very stiff fine grained
Bq
-0.4 0.0 0.4 0.8 1.2
7
6
5
4
3
2 1
OCR
st
b)
1
3
4
5
6
7
8
9
2Norm
ally Consolidated
Increasing
Sensitivity
Increasing
OCR & Age
Increasing OCR,
Age, Cementation
a)
Fr (%)
0.1 1 10
Qt
1
10
100
1000
0
Bq
-0.4 0.0 0.4 0.8 1.2
Sands
Transitional
Soils
Silts and Low
Ir Clays
Clays
Sensitive Clays
d)
qt (psf)
0 40000 80000
Dep
th b
elow
mud
line
(ft)
0
5
10
15
20
25
30
fs (psf)
0 200 400 600 800 1000
u2 (psf)
0 15000 30000 45000
u0
a) b) c)
284
line (i.e. no excess pore pressure during cone penetration), which is expected. Similar to the
outlier data for the other two charts, the sand data which does not plot on the Bq = 0 line is due to
transitional soil. The SBT classification charts examined in this study properly delineated the
stratification of the soil observed directly from the CPTu results.
The percent effectiveness values given in Table 8.2 compare USCS and SBT. Since the
SBT classification is based solely on behavioral characteristics and not grain size and plasticity as
is USCS classification, some differences are expected. The classification of the Presumpscot clay
from the SBT charts may not be a mis-classification of the clay but rather a behavior to shear
identified by the CPTu which the USCS classification method cannot indicate with grain size
alone. Robertson (1990) states that the classification of soils via CPTu SBT charts cannot be
expected to distinguish between grain sizes of material, but rather classify soils based on
behavioral differences. Traditionally, cohesive soils are classified by the USCS in terms of the
particle grain size of the soil and the resulting plasticity from Atterberg Limit testing (if the soil is
cohesive, such as the Presumpscot clay). In almost all cases, the Presumpscot clay will classify as
"CL" or "lean clay" in accordance with USCS, which is consistent with the results from the four
research sites. Therefore, if the USCS classification provides no delineation of classification
between Presumpscot clay which we know has varying properties on a site-specific, and even
boring-specific, scale, classifying it as "CL" provides limited information. In the best case
scenario, Atterberg Limit results can be loosely correlated to expected engineering properties
(Terzaghi et al., 1996). Therefore, the following classification analyses aim to provide guidance
on the interpretation of SBT classification charts in Presumpscot clay in order to gain more
insight into a comprehensive classification that directly provides information on the engineering
properties of the soil.
285
Classification of Presumpscot clay using the Fr-Qt relationship (Robertson 1990;
Robertson 2009) resulted in a cumulative 84% effectiveness (42 of the 50 samples) when
compared to USCS classification. Both charts use the relationship between Qt and Fr and contain
identical classification regions, but Robertson (2009) includes predictions of soil properties such
as OCR and sensitivity which go beyond classification. The purpose of analyzing the Robertson
(2009) chart was to evaluate the accuracy of these predicted normalized soil property trends. A
similar study in silty soft clay by Long (2008) experienced similar issues with difference in
classification using the Fr-Qt relationship. This is thought to be potentially due to the sleeve
friction measurement during CPTu testing being notoriously of low accuracy, as it is highly
subject to rate of advance and calibration issues (Rogers 2006; NCHRP 2007).
The low effectiveness of the Fr-Qt relationship for the Route 197 Bridge SBT
classification is likely a result of the high sensitivity of the clay in conjunction with a moderate
OCR. Sandy soils have been found to have higher Qt and lower Fr as compared to clay soils.
Coincidentally, all of the "mis-classified" data points from the Route 197 Bridge plotted in
Region 5 (sand mixtures), a region defined by comparably higher Qt and lower Fr (Figure 8.8).
Higher OCR will cause tip resistance (and hence Qt) to increase, while high sensitivity will cause
sleeve friction (and hence Fr) to decrease. The combination of these two behaviors imitates the
behavior of a weak sand, which is exactly where the "mis-classified" data points plot (i.e., in the
sand mixture region, but close to the border of silt mixtures).
Figure 8.8 presents the CPTu data from all four sites plotted on the SBT classification charts.
Each symbol represents a USCS classification data point from a discrete undisturbed sample and
the corresponding Fr-Qt-Bq measurement from the SCPTu profile from the adjacent boring at the
same depth. It should be noted that CH is "fat clay," CL is "lean clay," CL-ML is "silty clay," and
ML is "silt" in accordance with USCS. Figure 8.8 reveals that a large majority of the collected
Presumpscot clay samples classified as CL, which is expected. Other classifications included
286
three samples of CH at Route 26/100 Falmouth Bridge, one CL-ML (with sand) at Martin's Point
Bridge, and three ML samples at Route 26/100 Falmouth Bridge. The difference between CL,
CL-ML, and CH is due to the different in Atterberg Limit results which is directly related to the
mechanical behavior of the clay under different moisture contents (Mitchell and Soga, 2005). The
threshold between CL and CH is a Liquid Limit (LL) of 50, and the three CH samples had LL
values of 54, 52, and51. The three ML samples had low enough Plasticity Index values (9, 11, 17)
with respect to their LL values to classify as ML. Plotted data points which include the "with
sand" descriptor indicate samples with greater than 15% of material by weight which was
retained on the number 40 sieve (the "sand" grain size). Accordingly, since differences in the
grain size composition and plasticity measurements of Presumpscot clay signify a difference in
mechanical behavior of the soil, one may expect different CPTu measurements between the
samples. For instance, it has been shown that clays with higher LL have correspondingly higher
compressibility (Mitchell and Soga, 2005), so one may expect that the tip resistance of CH
Presumpscot clay to be lower than CL soils. However, analysis of Figure 8.8 does not agree with
some of the expected behavioral differences predicted from USCS such as this. Presumpscot clay
samples which included sand grains or a higher percentage of silt would intuitively cause tip
resistance and sleeve friction measurements to increase and pore pressure to decrease,
representing CPTu data behavior that is typical of granular soils. However, none of these patterns
were consistently observed from the CPTu results at any of the four sites. "CL with sand, "CL-
ML with sand,", and "ML" samples resulted in Qt and Fr values which are comparable, and in
some cases lower, than the corresponding values for CL samples. Based on the four research
sites, the published SBT charts do not appear to have the ability differentiate between
Presumpscot clay samples which classify as ML versus CL or CL with sand versus just CL.
One observation that can be made from Figure 8.8 is the consistency of the data to plot
within Region 3 "clay to silty clay" in the Robertson (1990) and "clay" or "sensitive clay" in the

287
Figure 8.8: CPTu normalized data from all four Presumpscot clay research sites plotted with corresponding USCS classification of undisturbed soil samples. Note: CH = fat clay, CL = lean
clay, CL-ML = silty clay, and ML = silt.
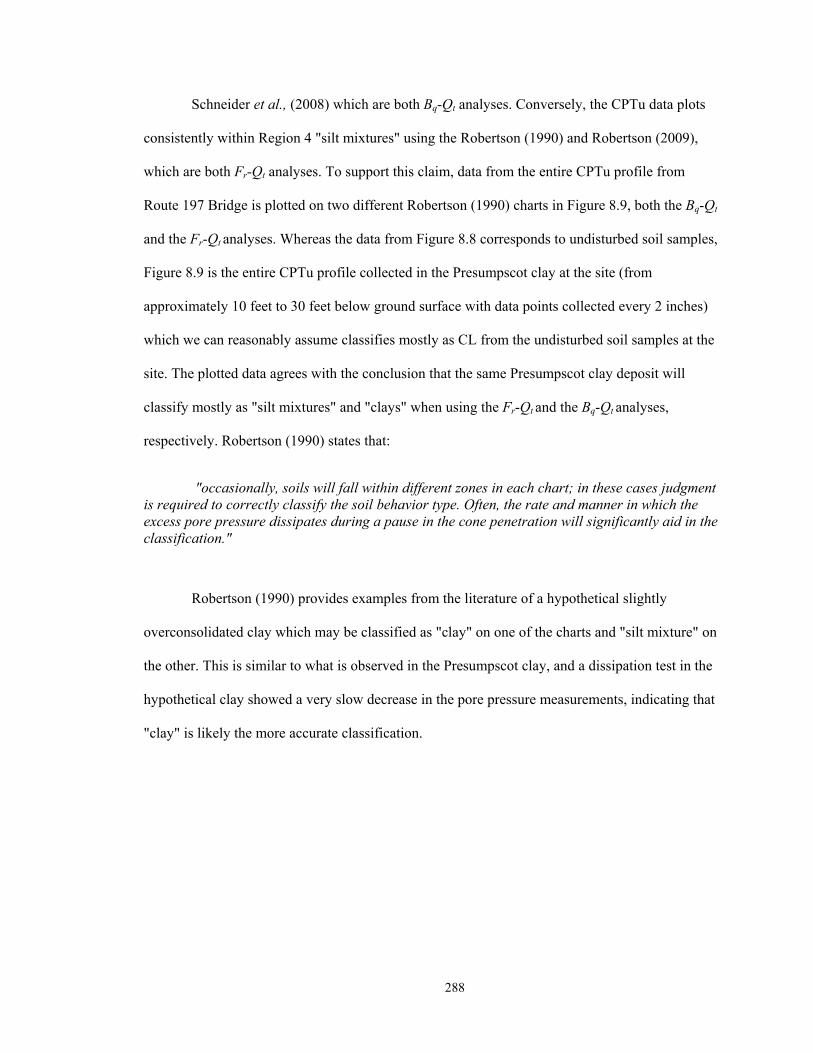
288
Schneider et al., (2008) which are both Bq-Qt analyses. Conversely, the CPTu data plots
consistently within Region 4 "silt mixtures" using the Robertson (1990) and Robertson (2009),
which are both Fr-Qt analyses. To support this claim, data from the entire CPTu profile from
Route 197 Bridge is plotted on two different Robertson (1990) charts in Figure 8.9, both the Bq-Qt
and the Fr-Qt analyses. Whereas the data from Figure 8.8 corresponds to undisturbed soil samples,
Figure 8.9 is the entire CPTu profile collected in the Presumpscot clay at the site (from
approximately 10 feet to 30 feet below ground surface with data points collected every 2 inches)
which we can reasonably assume classifies mostly as CL from the undisturbed soil samples at the
site. The plotted data agrees with the conclusion that the same Presumpscot clay deposit will
classify mostly as "silt mixtures" and "clays" when using the Fr-Qt and the Bq-Qt analyses,
respectively. Robertson (1990) states that:
"occasionally, soils will fall within different zones in each chart; in these cases judgment is required to correctly classify the soil behavior type. Often, the rate and manner in which the excess pore pressure dissipates during a pause in the cone penetration will significantly aid in the classification."
Robertson (1990) provides examples from the literature of a hypothetical slightly
overconsolidated clay which may be classified as "clay" on one of the charts and "silt mixture" on
the other. This is similar to what is observed in the Presumpscot clay, and a dissipation test in the
hypothetical clay showed a very slow decrease in the pore pressure measurements, indicating that
"clay" is likely the more accurate classification.
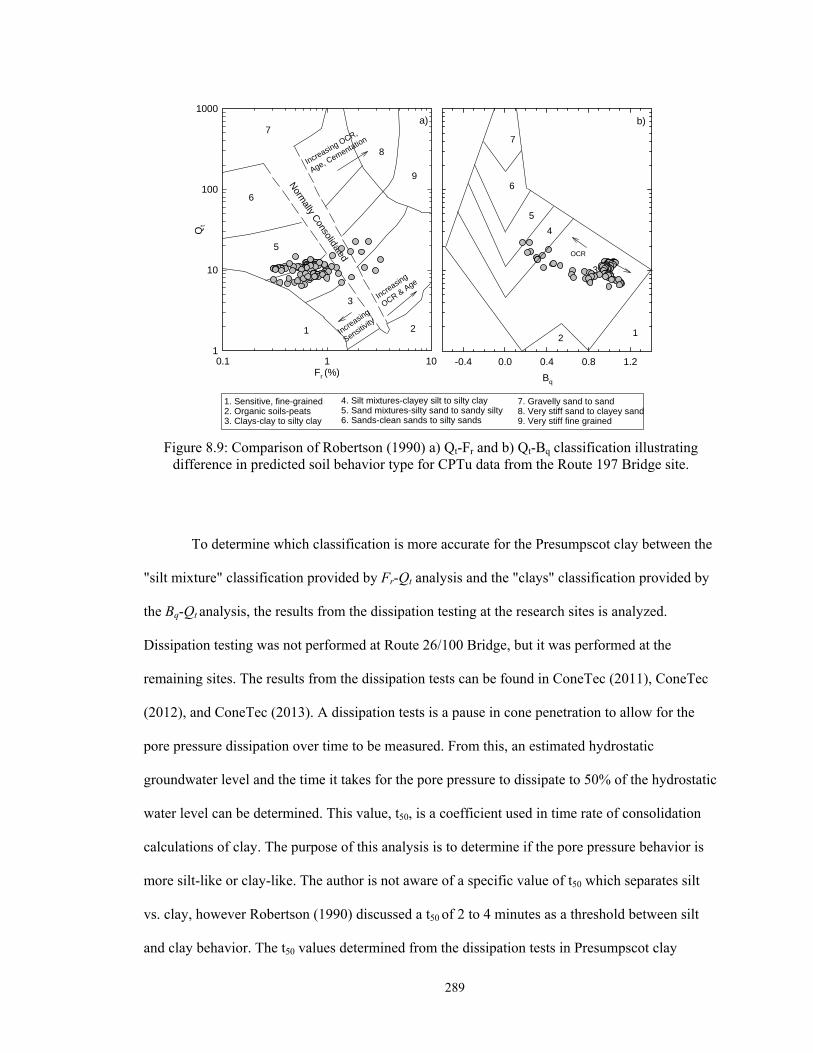
289
Figure 8.9: Comparison of Robertson (1990) a) Qt-Fr and b) Qt-Bq classification illustrating difference in predicted soil behavior type for CPTu data from the Route 197 Bridge site.
To determine which classification is more accurate for the Presumpscot clay between the
"silt mixture" classification provided by Fr-Qt analysis and the "clays" classification provided by
the Bq-Qt analysis, the results from the dissipation testing at the research sites is analyzed.
Dissipation testing was not performed at Route 26/100 Bridge, but it was performed at the
remaining sites. The results from the dissipation tests can be found in ConeTec (2011), ConeTec
(2012), and ConeTec (2013). A dissipation tests is a pause in cone penetration to allow for the
pore pressure dissipation over time to be measured. From this, an estimated hydrostatic
groundwater level and the time it takes for the pore pressure to dissipate to 50% of the hydrostatic
water level can be determined. This value, t50, is a coefficient used in time rate of consolidation
calculations of clay. The purpose of this analysis is to determine if the pore pressure behavior is
more silt-like or clay-like. The author is not aware of a specific value of t50 which separates silt
vs. clay, however Robertson (1990) discussed a t50 of 2 to 4 minutes as a threshold between silt
and clay behavior. The t50 values determined from the dissipation tests in Presumpscot clay
1. Sensitive, fine-grained 2. Organic soils-peats 3. Clays-clay to silty clay
4. Silt mixtures-clayey silt to silty clay5. Sand mixtures-silty sand to sandy silty6. Sands-clean sands to silty sands
7. Gravelly sand to sand8. Very stiff sand to clayey sand9. Very stiff fine grained
Bq
-0.4 0.0 0.4 0.8 1.2
7
6
5
4
3
2 1
OCR
st
1
3
4
5
6
7
8
9
2
Norm
ally Consolidated
Increasing
Sensitivit
y
Increasing
OCR & Age
Increasing OCR,
Age, Cementation
a)
Fr (%)0.1 1 10
Qt
1
10
100
1000b)
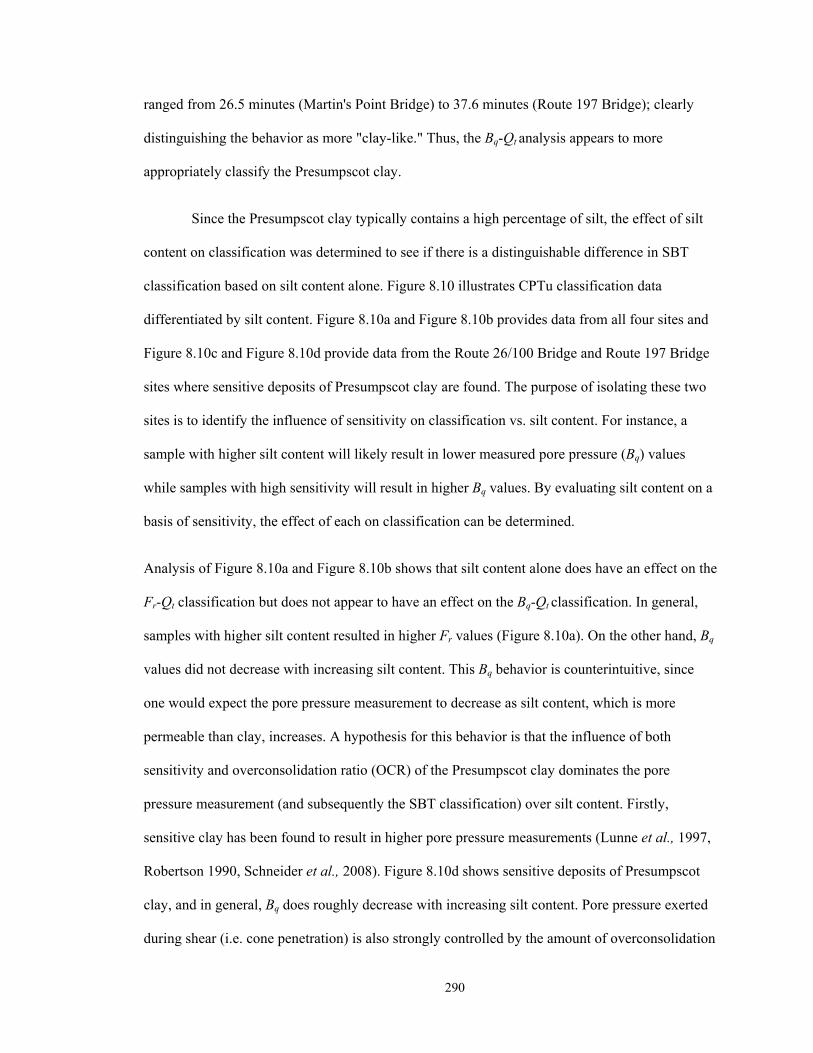
290
ranged from 26.5 minutes (Martin's Point Bridge) to 37.6 minutes (Route 197 Bridge); clearly
distinguishing the behavior as more "clay-like." Thus, the Bq-Qt analysis appears to more
appropriately classify the Presumpscot clay.
Since the Presumpscot clay typically contains a high percentage of silt, the effect of silt
content on classification was determined to see if there is a distinguishable difference in SBT
classification based on silt content alone. Figure 8.10 illustrates CPTu classification data
differentiated by silt content. Figure 8.10a and Figure 8.10b provides data from all four sites and
Figure 8.10c and Figure 8.10d provide data from the Route 26/100 Bridge and Route 197 Bridge
sites where sensitive deposits of Presumpscot clay are found. The purpose of isolating these two
sites is to identify the influence of sensitivity on classification vs. silt content. For instance, a
sample with higher silt content will likely result in lower measured pore pressure (Bq) values
while samples with high sensitivity will result in higher Bq values. By evaluating silt content on a
basis of sensitivity, the effect of each on classification can be determined.
Analysis of Figure 8.10a and Figure 8.10b shows that silt content alone does have an effect on the
Fr-Qt classification but does not appear to have an effect on the Bq-Qt classification. In general,
samples with higher silt content resulted in higher Fr values (Figure 8.10a). On the other hand, Bq
values did not decrease with increasing silt content. This Bq behavior is counterintuitive, since
one would expect the pore pressure measurement to decrease as silt content, which is more
permeable than clay, increases. A hypothesis for this behavior is that the influence of both
sensitivity and overconsolidation ratio (OCR) of the Presumpscot clay dominates the pore
pressure measurement (and subsequently the SBT classification) over silt content. Firstly,
sensitive clay has been found to result in higher pore pressure measurements (Lunne et al., 1997,
Robertson 1990, Schneider et al., 2008). Figure 8.10d shows sensitive deposits of Presumpscot
clay, and in general, Bq does roughly decrease with increasing silt content. Pore pressure exerted
during shear (i.e. cone penetration) is also strongly controlled by the amount of overconsolidation
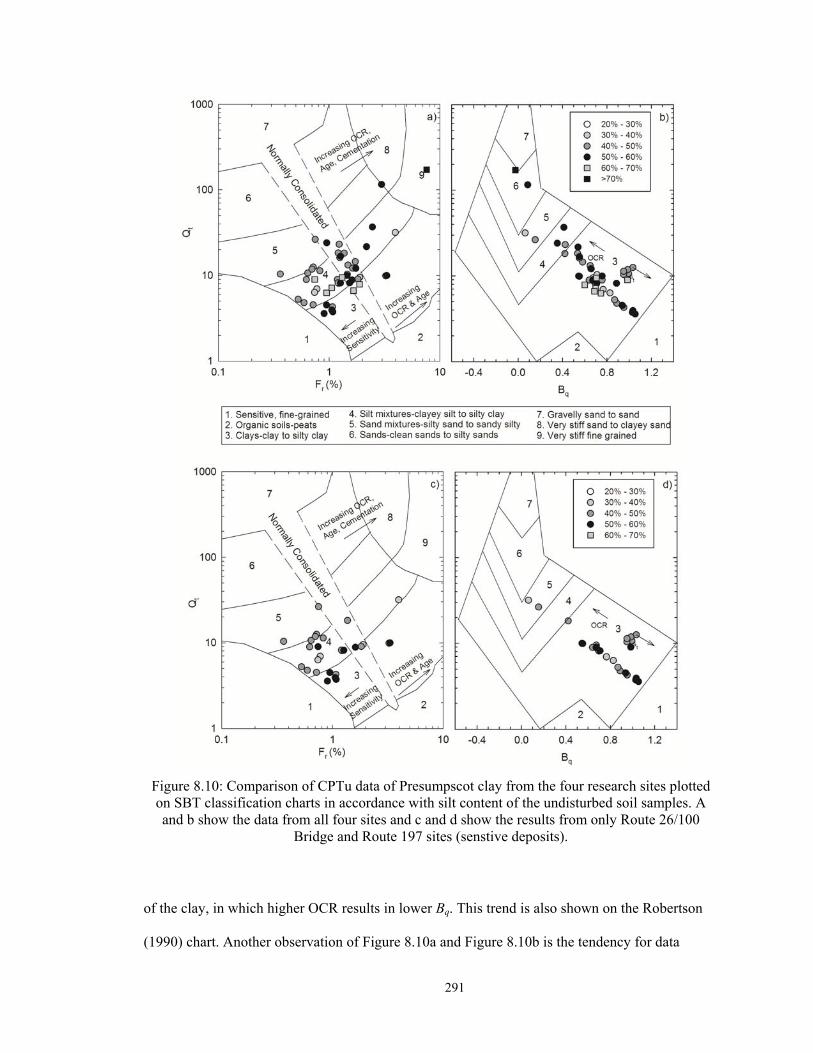
291
Figure 8.10: Comparison of CPTu data of Presumpscot clay from the four research sites plotted on SBT classification charts in accordance with silt content of the undisturbed soil samples. A and b show the data from all four sites and c and d show the results from only Route 26/100
Bridge and Route 197 sites (senstive deposits).
of the clay, in which higher OCR results in lower Bq. This trend is also shown on the Robertson
(1990) chart. Another observation of Figure 8.10a and Figure 8.10b is the tendency for data
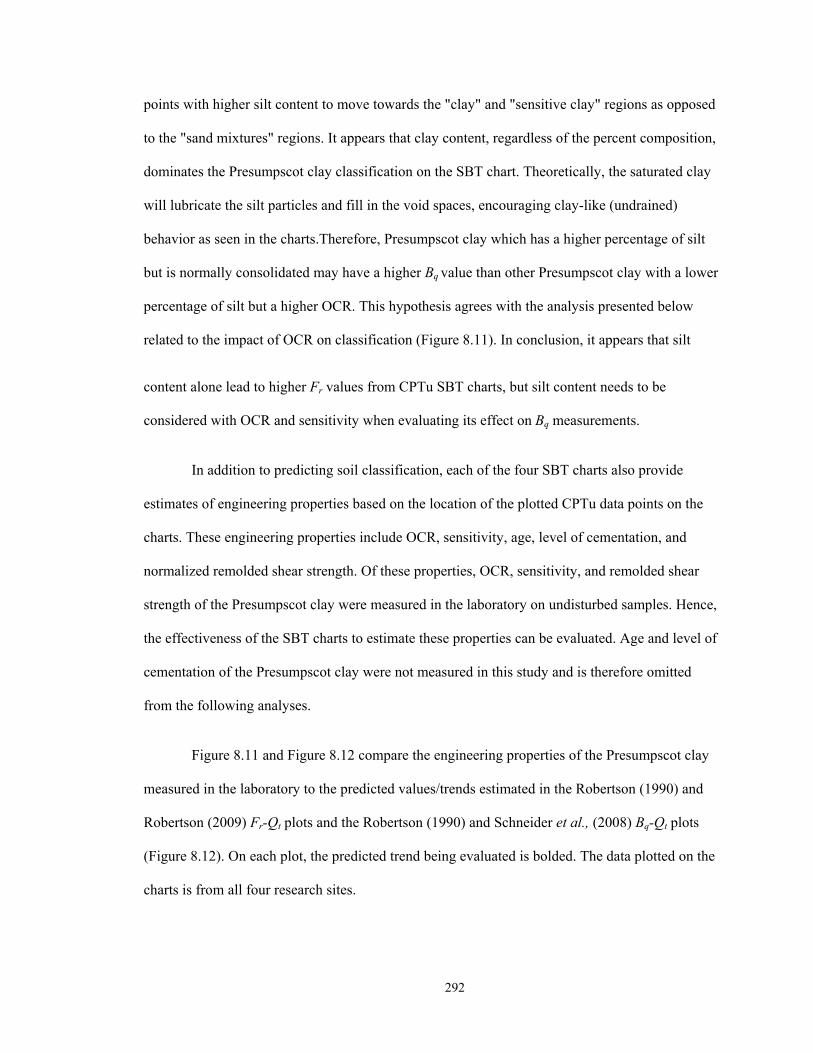
292
points with higher silt content to move towards the "clay" and "sensitive clay" regions as opposed
to the "sand mixtures" regions. It appears that clay content, regardless of the percent composition,
dominates the Presumpscot clay classification on the SBT chart. Theoretically, the saturated clay
will lubricate the silt particles and fill in the void spaces, encouraging clay-like (undrained)
behavior as seen in the charts.Therefore, Presumpscot clay which has a higher percentage of silt
but is normally consolidated may have a higher Bq value than other Presumpscot clay with a lower
percentage of silt but a higher OCR. This hypothesis agrees with the analysis presented below
related to the impact of OCR on classification (Figure 8.11). In conclusion, it appears that silt
content alone lead to higher Fr values from CPTu SBT charts, but silt content needs to be
considered with OCR and sensitivity when evaluating its effect on Bq measurements.
In addition to predicting soil classification, each of the four SBT charts also provide
estimates of engineering properties based on the location of the plotted CPTu data points on the
charts. These engineering properties include OCR, sensitivity, age, level of cementation, and
normalized remolded shear strength. Of these properties, OCR, sensitivity, and remolded shear
strength of the Presumpscot clay were measured in the laboratory on undisturbed samples. Hence,
the effectiveness of the SBT charts to estimate these properties can be evaluated. Age and level of
cementation of the Presumpscot clay were not measured in this study and is therefore omitted
from the following analyses.
Figure 8.11 and Figure 8.12 compare the engineering properties of the Presumpscot clay
measured in the laboratory to the predicted values/trends estimated in the Robertson (1990) and
Robertson (2009) Fr-Qt plots and the Robertson (1990) and Schneider et al., (2008) Bq-Qt plots
(Figure 8.12). On each plot, the predicted trend being evaluated is bolded. The data plotted on the
charts is from all four research sites.

293
Figure 8.11a and Figure 8.11c show CPTu data points from respective sample depths for
each site plotted together with respect to the corresponding OCR values from laboratory testing.
The predicted "Increasing OCR" trend from Figure 8.11a is upwards and to the right on the plot.
In general, the data plot higher Qt values as OCR increases. The upward direction of the predicted
increasing OCR trend agrees well with the Presumpscot clay results. However, the rightward
direction (i.e. increasing Fr) does not appear to effectively delineate an increase in OCR for high
OCR (i.e. OCR > 4 spans a broad Fr for a given Qt). Perhaps this observation led to the
refinement of the OCR trends observed in Figure 8.11c, in which predicted OCR increases
directly upwards, which is consistent with the plotted Presumpscot clay data. However, the
predicted values of OCR at the right in the plot do not correlate well with the laboratory results.
The k-value method discussed subsequently provided a better estimate of OCR values from CPTu
results.
Furthermore, the "Normally consolidated" region in Figure 8.11a exhibited poor
performance in predicting actual normally consolidated conditions of the Presumpscot clay. Only
one of the 16 data points which plotted in this region had stress history conditions which could be
considered approximately normally consolidated (i.e. OCR <= 1.5). Robertson (1990) does not
discuss how the "normally consolidated" region was created other than stating that it "represents
approximately normally consolidated conditions." From inspection of the region, it extends from
Region 7 (Gravelly sand) to Region 3 (clays), so it appears to be a very rough estimate of
normally consolidated conditions for all types of granular and cohesive soil. This may explain
why it does not apply well to the Presumpscot clay.
Figure 8.11b and Figure 8.11d plot the CPTu data from each site by the samples'
sensitivity (St) and normalized remolded shear strength (su(r)/'v0), respectively. Inspection of
Figure 8.11b shows that the plot is generally effective in predicting an increase of St with a
leftward trend in plotted data points (i.e. a decrease in Fr). Conversely, Figure 8.11d does not
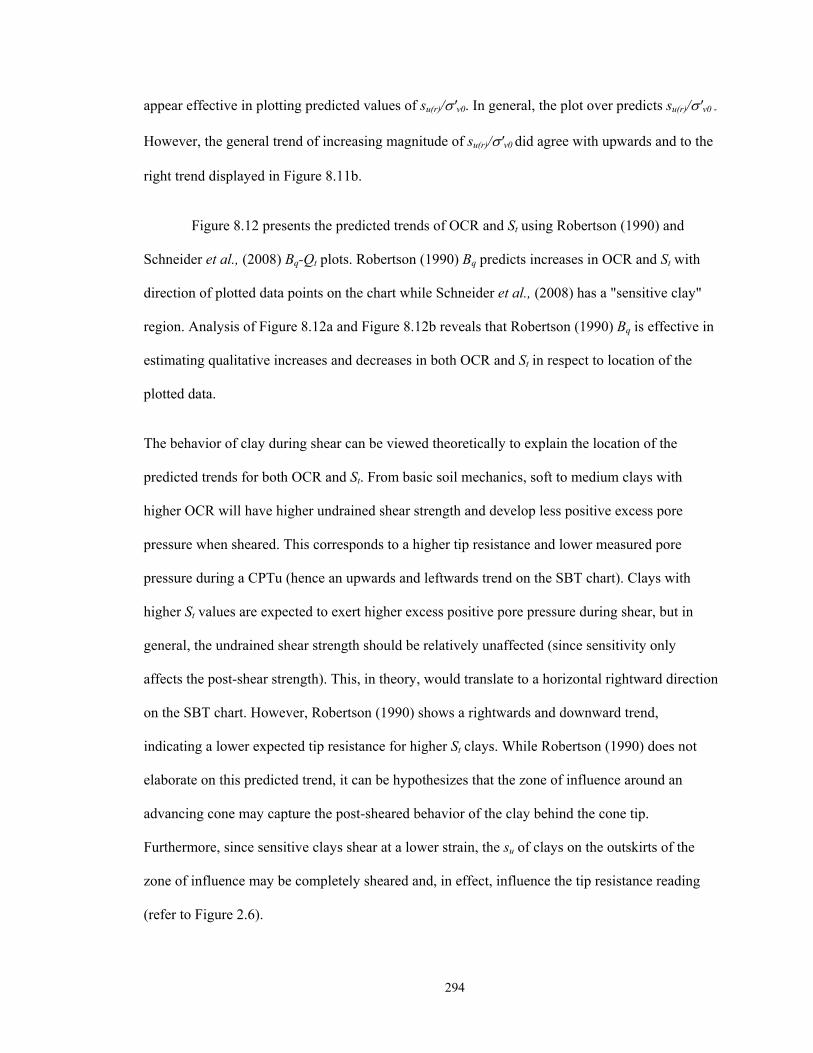
294
appear effective in plotting predicted values of su(r)/'v0. In general, the plot over predicts su(r)/'v0 -
However, the general trend of increasing magnitude of su(r)/'v0 did agree with upwards and to the
right trend displayed in Figure 8.11b.
Figure 8.12 presents the predicted trends of OCR and St using Robertson (1990) and
Schneider et al., (2008) Bq-Qt plots. Robertson (1990) Bq predicts increases in OCR and St with
direction of plotted data points on the chart while Schneider et al., (2008) has a "sensitive clay"
region. Analysis of Figure 8.12a and Figure 8.12b reveals that Robertson (1990) Bq is effective in
estimating qualitative increases and decreases in both OCR and St in respect to location of the
plotted data.
The behavior of clay during shear can be viewed theoretically to explain the location of the
predicted trends for both OCR and St. From basic soil mechanics, soft to medium clays with
higher OCR will have higher undrained shear strength and develop less positive excess pore
pressure when sheared. This corresponds to a higher tip resistance and lower measured pore
pressure during a CPTu (hence an upwards and leftwards trend on the SBT chart). Clays with
higher St values are expected to exert higher excess positive pore pressure during shear, but in
general, the undrained shear strength should be relatively unaffected (since sensitivity only
affects the post-shear strength). This, in theory, would translate to a horizontal rightward direction
on the SBT chart. However, Robertson (1990) shows a rightwards and downward trend,
indicating a lower expected tip resistance for higher St clays. While Robertson (1990) does not
elaborate on this predicted trend, it can be hypothesizes that the zone of influence around an
advancing cone may capture the post-sheared behavior of the clay behind the cone tip.
Furthermore, since sensitive clays shear at a lower strain, the su of clays on the outskirts of the
zone of influence may be completely sheared and, in effect, influence the tip resistance reading
(refer to Figure 2.6).
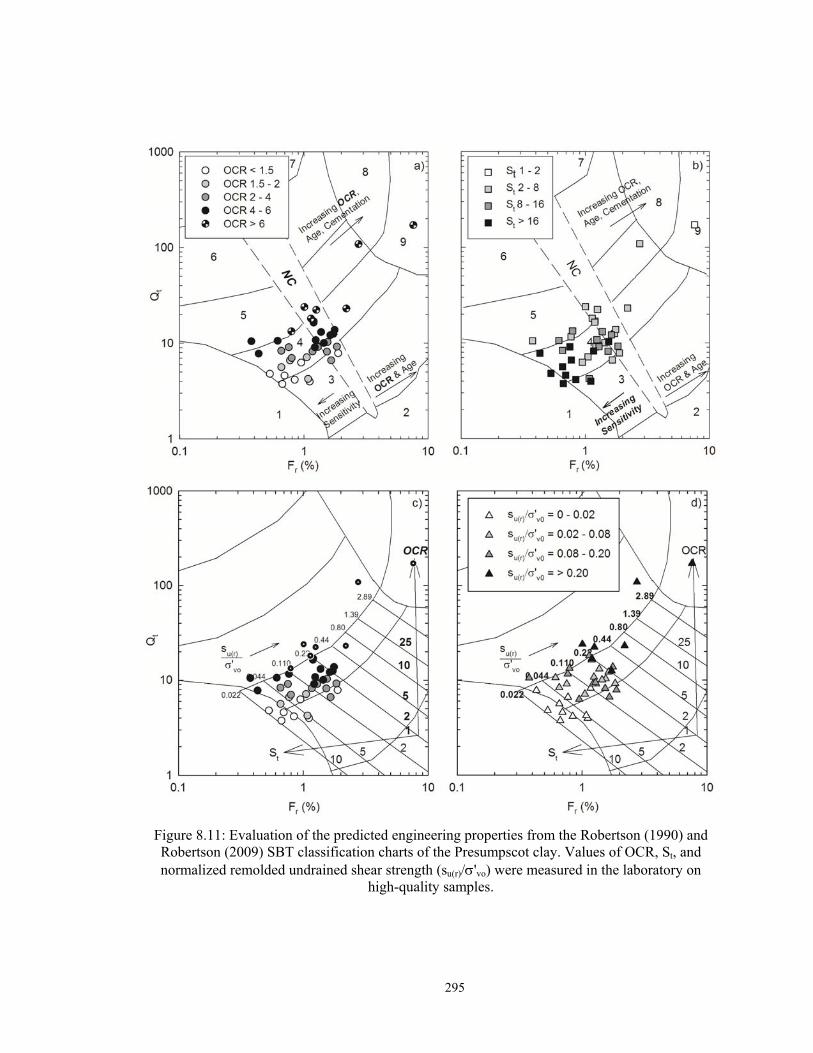
295
Figure 8.11: Evaluation of the predicted engineering properties from the Robertson (1990) and Robertson (2009) SBT classification charts of the Presumpscot clay. Values of OCR, St, and normalized remolded undrained shear strength (su(r)/'vo) were measured in the laboratory on
high-quality samples.
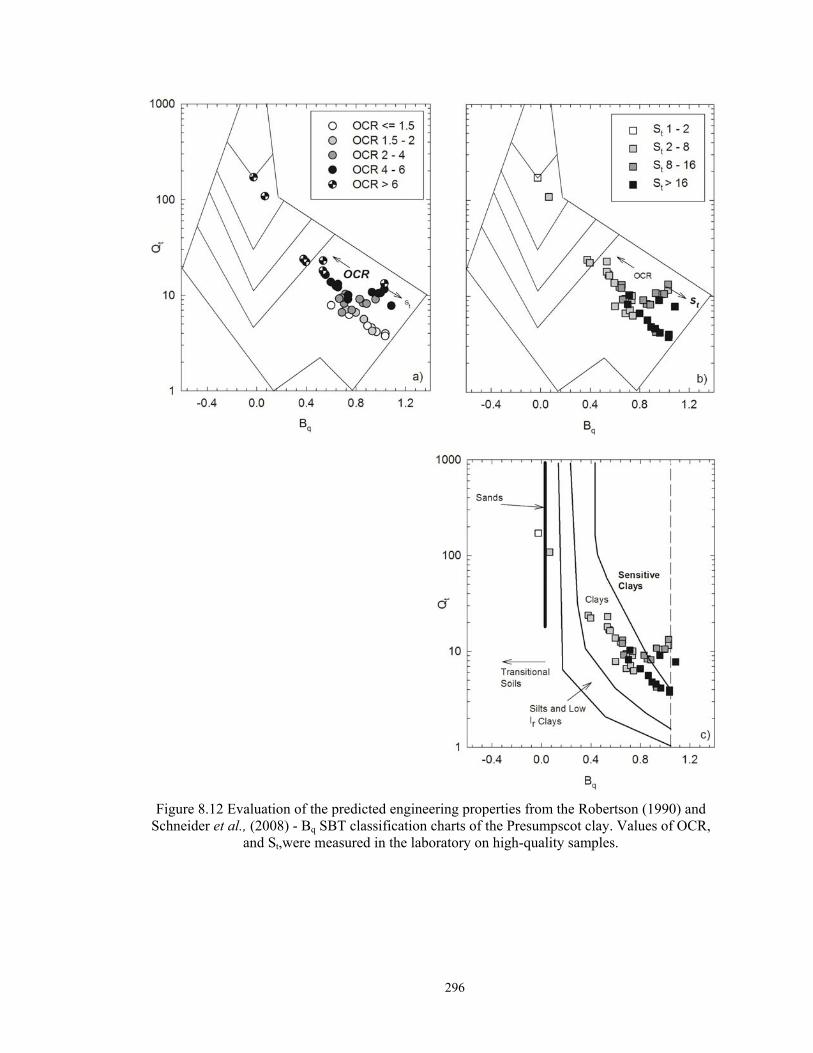
296
Figure 8.12 Evaluation of the predicted engineering properties from the Robertson (1990) and Schneider et al., (2008) - Bq SBT classification charts of the Presumpscot clay. Values of OCR,
and St,were measured in the laboratory on high-quality samples.
297
This downwards and rightward trend of increasing clay sensitivity matches the "sensitive
clay" versus "clay" regions of the Schneider et al., (2008) Bq-Qt plot. Review of the sensitive clay
zone in Figure 8.12c versus the plotted sensitivity of the Presumpscot clay shows good
agreement. Schneider et al., (2008) states that "[the sensitive clay region] is not intended to
exclude clay as sensitive, but rather highlight soils which may have highly collapsible structure."
Results plotted on Figure 8.12c agree with this statement; where not all of the sensitive clay (i.e.
clay with St > 8) plotted in the region, all of the data which plotted in the region were sensitive.
In summary, the SBT classification charts provided 92% effectiveness for Bq-Qt analyses
and 84% effectiveness for Fr-Qt analyses when compared to USCS classification. Subsurface
layering (i.e. transitional zones, silt/sand seams) within the Presumpscot clay was identified well
when plotting all data from a particular profile on the SBT charts (e.g. Figure 8.7). When
comparing Bq-Qt and Fr-Qt SBT charts from Robertson (1990), Presumpscot clay plotted
predominantly in Region 3 "clays" and Region 4 "silt mixtures" for the two charts, respectively.
Analysis of the dissipation during the CPT showed more clay-like behavior (Region 3), so it
appears that Bq-Qt charts are more effective in classifying the Presumpscot clay behaviorally. Silt
content of the Presumpscot clay only appeared to affect the location that the CPTu data plotted on
Fr-Qt charts, whereas OCR and sensitivity dominated Bq-Qt SBT charts over the silt content.
Between the two types of Bq-Qt SBT (Robertson (1990) and Schneider et al., (2008), the latter
appears to be more appropriate for the determination of sensitivity. Classification between the
two Bq-Qt charts did not differ between the sites in this study. The OCR and sensitivity trends on
the Bq-Qt charts are good for relative estimates of trends, but values do not correlate with those
given on the chart.
8.4 Stress History
Stress history of clay refers to the preconsolidation pressure ('p) profile of the deposit
and the corresponding ratio of 'p to the in situ vertical effective stress (i.e. OCR, or 'p/'v0).

298
Measurements of tip resistance (qt) have been found to relate directly to the 'p, and. if
appropriate correlations are used in the processing of CPTu data, values of 'p and OCR can be
directly obtained over the entire soil profile. This has a powerful implication for geotechnical
investigations in Presumpscot clay if complete stress history profiles can be accurately
determined for settlement, slope stability, and other geotechnical analyses. This section will
provide a summary of the CPTu stress history results for the four Presumpscot clay research sites,
including the variation in the calculated k-values at each deposit and between sites. Variation in k-
values are expected, "[CPTu estimated] OCR is influenced by sensitivity, preconsolidation
mechanism, soil type, and local heterogeneity" (Lunne et al., 1997).
It has been observed from past studies, and corroborated with the results of this thesis,
that CPTu stress history coefficients are unique to specific sites and even specific depths within a
deposit. However, the differences between sites or over depths may be predictable based on other
soil properties or CPTu measurements. Relationships between k-values (Equation 8.12) and OCR,
Liquid Limit, and Plastic Limit have been proposed (Lunne et al., 1997, Saye et al., 2013).
Relationships between the k-values and clay properties are investigated herein in effort to identify
correlations so that future CPTu stress history interpretations can be performed more effectively
in Presumpscot clay.
Undisturbed Sherbrook block samples and modified Shelby tube samples of Presumpscot
clay collected at all four research sites were tested for consolidation properties using the constant
rate of strain (CRS) test (Section 3.4.3). The strain energy method from Becker et al., (1987) was
used to determine the preconsolidation pressure ('p) from the resulting consolidation curves.
CPTu soundings were conducted adjacent to the borings from which the samples were collected
in order to correlate the CPTu measurements to the laboratory results of 'p. Overconsolidation
ratio (OCR, or 'p/'v0) estimates were made using 'p and 'v0 calculated from averaged unit
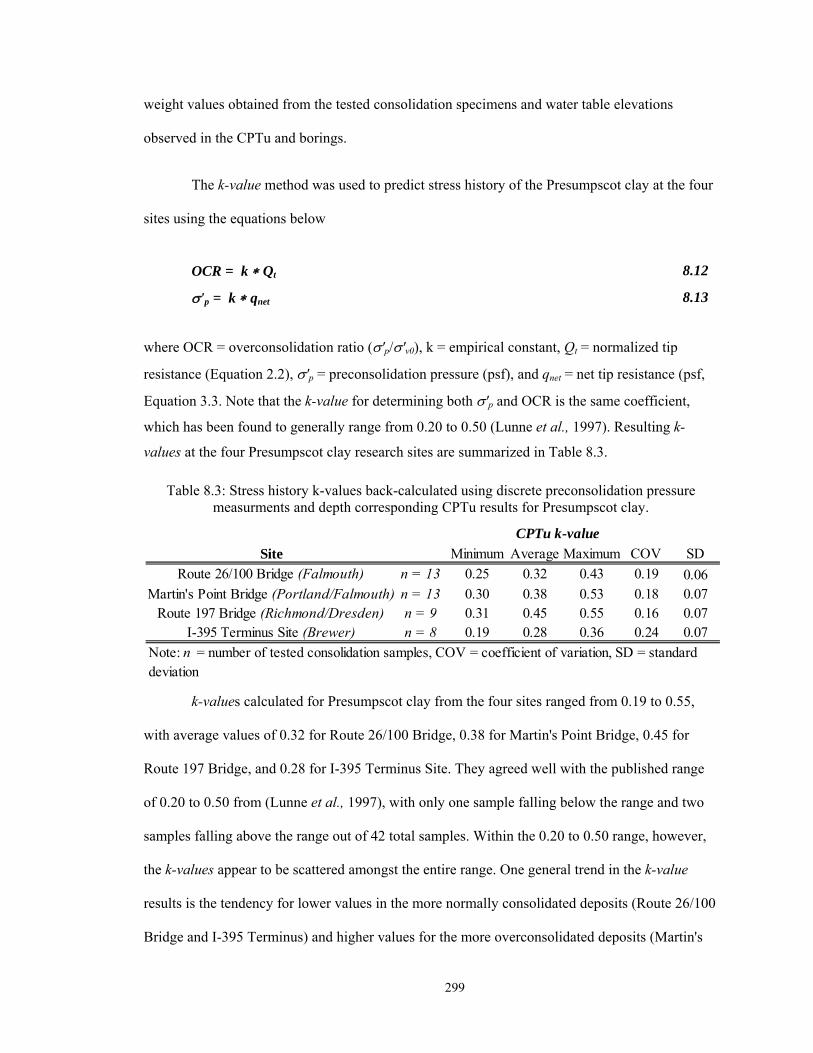
299
weight values obtained from the tested consolidation specimens and water table elevations
observed in the CPTu and borings.
The k-value method was used to predict stress history of the Presumpscot clay at the four
sites using the equations below
OCR = kQt 8.12
'p = kqnet 8.13
where OCR = overconsolidation ratio ('p/'v0), k = empirical constant, Qt = normalized tip
resistance (Equation 2.2), 'p = preconsolidation pressure (psf), and qnet = net tip resistance (psf,
Equation 3.3. Note that the k-value for determining both 'p and OCR is the same coefficient,
which has been found to generally range from 0.20 to 0.50 (Lunne et al., 1997). Resulting k-
values at the four Presumpscot clay research sites are summarized in Table 8.3.
Table 8.3: Stress history k-values back-calculated using discrete preconsolidation pressure measurments and depth corresponding CPTu results for Presumpscot clay.
k-values calculated for Presumpscot clay from the four sites ranged from 0.19 to 0.55,
with average values of 0.32 for Route 26/100 Bridge, 0.38 for Martin's Point Bridge, 0.45 for
Route 197 Bridge, and 0.28 for I-395 Terminus Site. They agreed well with the published range
of 0.20 to 0.50 from (Lunne et al., 1997), with only one sample falling below the range and two
samples falling above the range out of 42 total samples. Within the 0.20 to 0.50 range, however,
the k-values appear to be scattered amongst the entire range. One general trend in the k-value
results is the tendency for lower values in the more normally consolidated deposits (Route 26/100
Bridge and I-395 Terminus) and higher values for the more overconsolidated deposits (Martin's
Site Minimum Average Maximum COV SD
Route 26/100 Bridge (Falmouth) n = 13 0.25 0.32 0.43 0.19 0.06Martin's Point Bridge (Portland/Falmouth) n = 13 0.30 0.38 0.53 0.18 0.07
Route 197 Bridge (Richmond/Dresden) n = 9 0.31 0.45 0.55 0.16 0.07I-395 Terminus Site (Brewer) n = 8 0.19 0.28 0.36 0.24 0.07
CPTu k-value
Note: n = number of tested consolidation samples, COV = coefficient of variation, SD = standard deviation
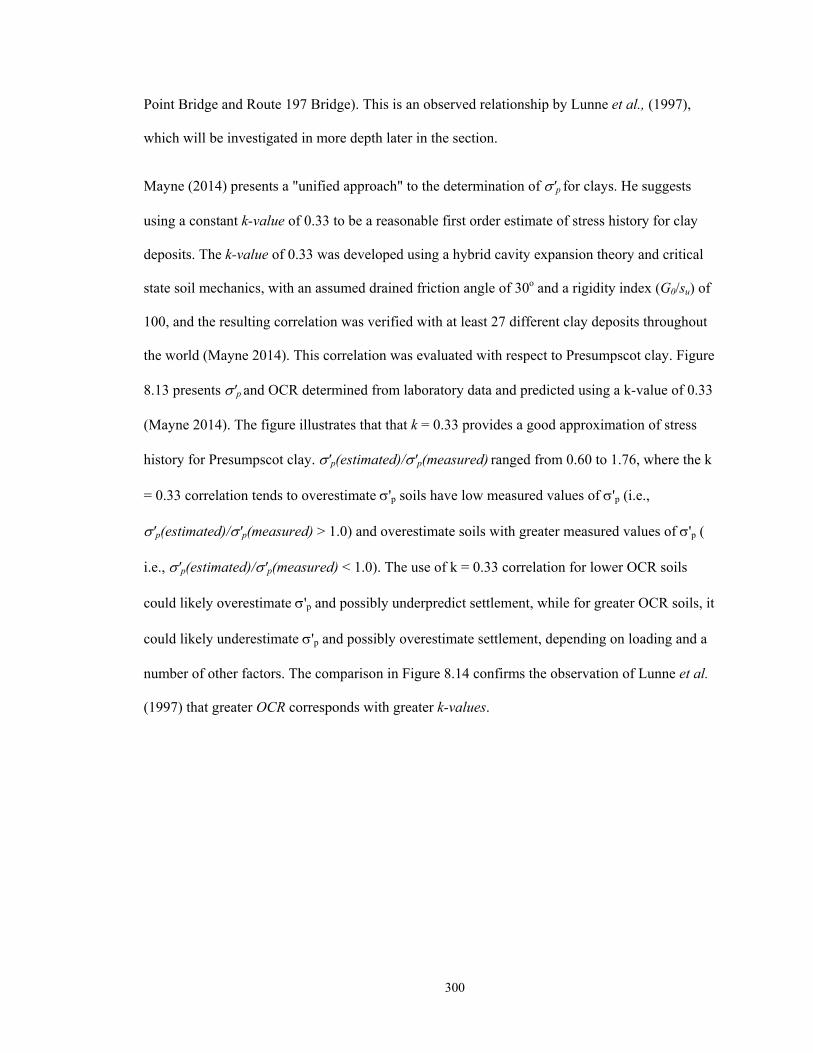
300
Point Bridge and Route 197 Bridge). This is an observed relationship by Lunne et al., (1997),
which will be investigated in more depth later in the section.
Mayne (2014) presents a "unified approach" to the determination of 'p for clays. He suggests
using a constant k-value of 0.33 to be a reasonable first order estimate of stress history for clay
deposits. The k-value of 0.33 was developed using a hybrid cavity expansion theory and critical
state soil mechanics, with an assumed drained friction angle of 30o and a rigidity index (G0/su) of
100, and the resulting correlation was verified with at least 27 different clay deposits throughout
the world (Mayne 2014). This correlation was evaluated with respect to Presumpscot clay. Figure
8.13 presents 'p and OCR determined from laboratory data and predicted using a k-value of 0.33
(Mayne 2014). The figure illustrates that that k = 0.33 provides a good approximation of stress
history for Presumpscot clay. 'p(estimated)/'p(measured) ranged from 0.60 to 1.76, where the k
= 0.33 correlation tends to overestimate 'p soils have low measured values of 'p (i.e.,
'p(estimated)/'p(measured) > 1.0) and overestimate soils with greater measured values of 'p (
i.e., 'p(estimated)/'p(measured) < 1.0). The use of k = 0.33 correlation for lower OCR soils
could likely overestimate 'p and possibly underpredict settlement, while for greater OCR soils, it
could likely underestimate 'p and possibly overestimate settlement, depending on loading and a
number of other factors. The comparison in Figure 8.14 confirms the observation of Lunne et al.
(1997) that greater OCR corresponds with greater k-values.
301
Figure 8.13: Overconsolidation ratio (OCR) and preconsolidation pressure estimated using a k-value of 0.33 as suggested by Mayne (2014).
Anaylsis of Figure 8.14 yields the tendency for Presumpscot clay samples from OCR of 4
to 6 to be consistently underestimated using the Mayne (2014) method (e.g. Route 197 Bridge
and the Martin's Point Bridge). There are two possibilities to explain this deviation from the
trend. Either Presumpscot clay with OCR from 4 to 6 tend to yield higher k-values or there is a
specific clay property occuring at these two sites. When comparing the laboratory tests results of
the undisturbed soil samples from the sites (e.g. content, grain sizes, activity, sensitivity,
plasticity, and organic content), there doesn't appear to be a distinguishable property which
seperates the high OCR sites from the low OCR sites. This includes water. In fact, the Route
26/100 Bridge and the I-395 Terminus (the two sites which matched the trend) are the most
dissimilar when it comes to plasticity and silt and clay content.
Figure 8.14 presents the k-values calculated at each site with corresponding values of
OCR in order to evaluate the relationship proposed by Lunne et al. (1997) along with the 0.20 to
0.50 range of typical values. Figure 8.14 indicates a potential relationship of larger k-values being
associated with greater OCR values when OCR ranges from 1.0 and 4.0. The three data points
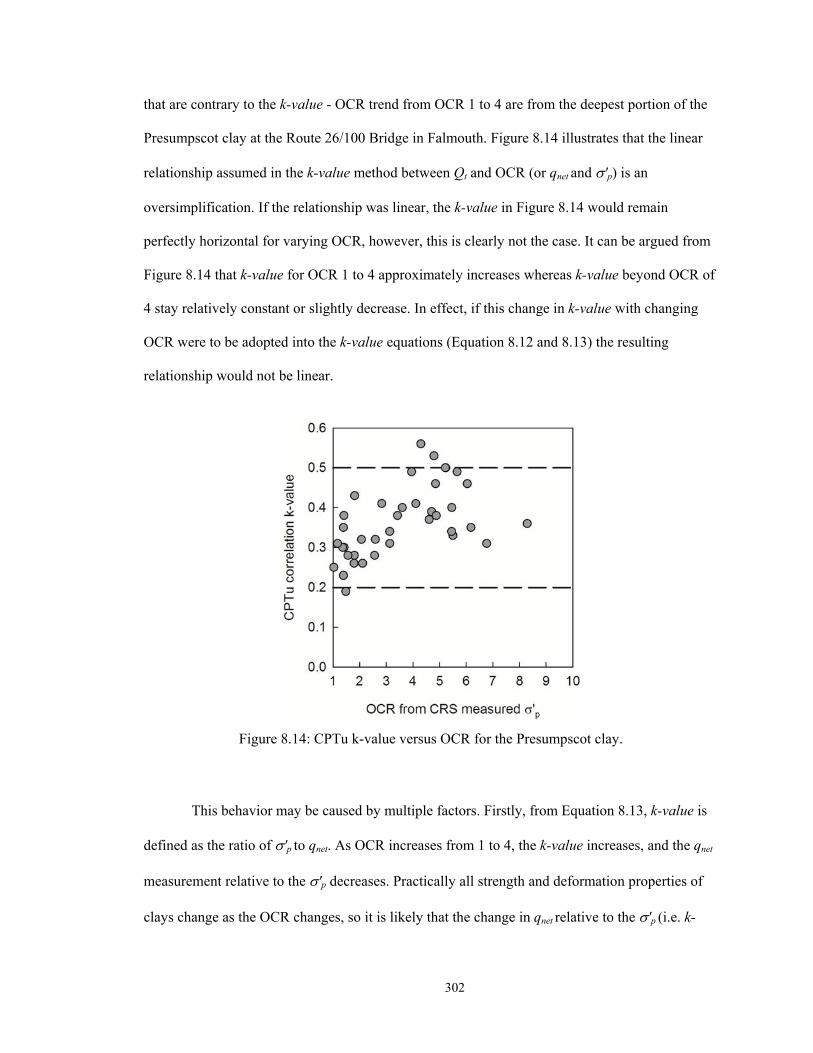
302
that are contrary to the k-value - OCR trend from OCR 1 to 4 are from the deepest portion of the
Presumpscot clay at the Route 26/100 Bridge in Falmouth. Figure 8.14 illustrates that the linear
relationship assumed in the k-value method between Qt and OCR (or qnet and 'p) is an
oversimplification. If the relationship was linear, the k-value in Figure 8.14 would remain
perfectly horizontal for varying OCR, however, this is clearly not the case. It can be argued from
Figure 8.14 that k-value for OCR 1 to 4 approximately increases whereas k-value beyond OCR of
4 stay relatively constant or slightly decrease. In effect, if this change in k-value with changing
OCR were to be adopted into the k-value equations (Equation 8.12 and 8.13) the resulting
relationship would not be linear.
Figure 8.14: CPTu k-value versus OCR for the Presumpscot clay.
This behavior may be caused by multiple factors. Firstly, from Equation 8.13, k-value is
defined as the ratio of 'p to qnet. As OCR increases from 1 to 4, the k-value increases, and the qnet
measurement relative to the 'p decreases. Practically all strength and deformation properties of
clays change as the OCR changes, so it is likely that the change in qnet relative to the 'p (i.e. k-
303
value) is due to complex changes in the stress state, stiffness, and void ratio of the clay which is
being measured by the cone penetrometer. This may include the ratio of horizontal to vertical
stress, a change in the "radius of influence" of the cone from increased stiffness, pore pressure
measurements affecting the measured tip resistance. A similarly complex phenomenon may be
occurring from OCR of 4 to 6 (or greater), in effect increasing the measurements on qnet relative
to 'p. When using the traditional coefficient of lateral earth pressure (Ko, or ratio of horizontal
effective stress to vertical effective stress) equation developed by Mayne and Kulhawy (1982),
with an OCR of 4.0 and a drained friction angle of 30o to 35o (typical for clays with plasticity
similar to the Presumpscot clay), the Ko ranges from 0.94 to 1.0, indicating that any further
increase in OCR will cause the horizontal effective stress to be greater than the vertical effective
stress, which may account for the more significant scatter in k-value beyond an OCR of 4.
However, it appears that the simplification of the k-value equation gives reasonable
estimates of 'p for the research sites in this thesis. Figure 8.15 displays the 'p profiles at all of
the research sites using the site-specific average k-value along with ± 1 standard deviation. For
comparison, 'p determined from the laboratory consolidation testing is plotted with the profiles.
At all of the sites, the ± 1 standard deviation values provided a reasonable expected range of 'p
values whereas the average values provided good predictions of 'p for the entire profile. Stress
history at each of the sites was unique and the CPTu was able to capture and reasonable predict
the 'p profile at each of the sites. For instance, at the I-395 Terminus site, the top layer of
Presumpscot clay is highly overconsolidated and the bottom is nearly normally consolidated, and
the average k-value of 0.28 at the site was applied to the qnet profile, and the resulting profile
followed this trend.

304
Figure 8.15: Esitmates of 'p versus depth for a) Route 26/100 Bridge b) Martin's Point Bridge c) Route 197 Bridge and d) I-395 Terminus using average and ±1 standard deviation for each site.
Correlations between clay properties and k-values for the Presumpscot clay were
analyzed. These properties included OCR (Figure 8.14), undrained shear strength (su), liquidity
index (LI), water content, sensitivity, and silt and clay content. Aside from the relationship to
305
OCR, statistical analysis of these relationships provided linear R2 values of no greater than 0.20,
even when the correlations were conducted on a site-specific basis. Exponential, power, and other
trend line functions were also checked without success. The lack of relationship between k-value
and measured Presumpscot clay properties is consistent with published literature. Lunne et al.,
(1997), DeGroot and Ladd (2010), Been et al. (2010), Abu-Farsakh, (2007) all state that the k-
value is a site specific value, and most also agree that there doesn't appear to be a correlation to
any clay property beyond a generalized trend of larger k-values with higher OCR soils.
Figure 8.16 illustrates the analysis of measured parameter Bq with OCR at the four sites
and the corresponding trend line. There is a general decreasing trend observed between Bq and
OCR measured at three of the four sites, however at Route 197 Bridge, there is an increasing
trend. This observation is analogous to the discussion in Section 8.3. At the Route 26/100 Bridge,
Martin's Point Bridge, and I-395 Terminus, the pore pressure measured during the shearing of
higher overconsolidated clays is less (from basic soil mechanics), and therefore a decreasing trend
between Bq and OCR is displayed. However, increasing sensitivity of clay will also increase Bq
measurements. The clay at Route 197 Bridge is overconsolidated and sensitive, so the influence
of sensitivity on the Bq "overpowers" the influence from the rate of overconsolidation of the clay.
At the Route 26/100 Bridge, the clay is practically normally consolidated and sensitive, hence a
decreasing trend (since the effects are compounding instead of counteracting). Essentially, Figure
8.16 shows that the relationship between OCR and Bq is complex and site-specific, and does not
provide a straightforward method in helping to select a k-value. While there is a decreasing power
trend at the Route 26/100 Bridge, Martin's Point Bridge, and I-395 Terminus between the two
parameters, there is an increasing power trend at the Route 197 Bridge. R2 values range from 0.51
to 0.78.
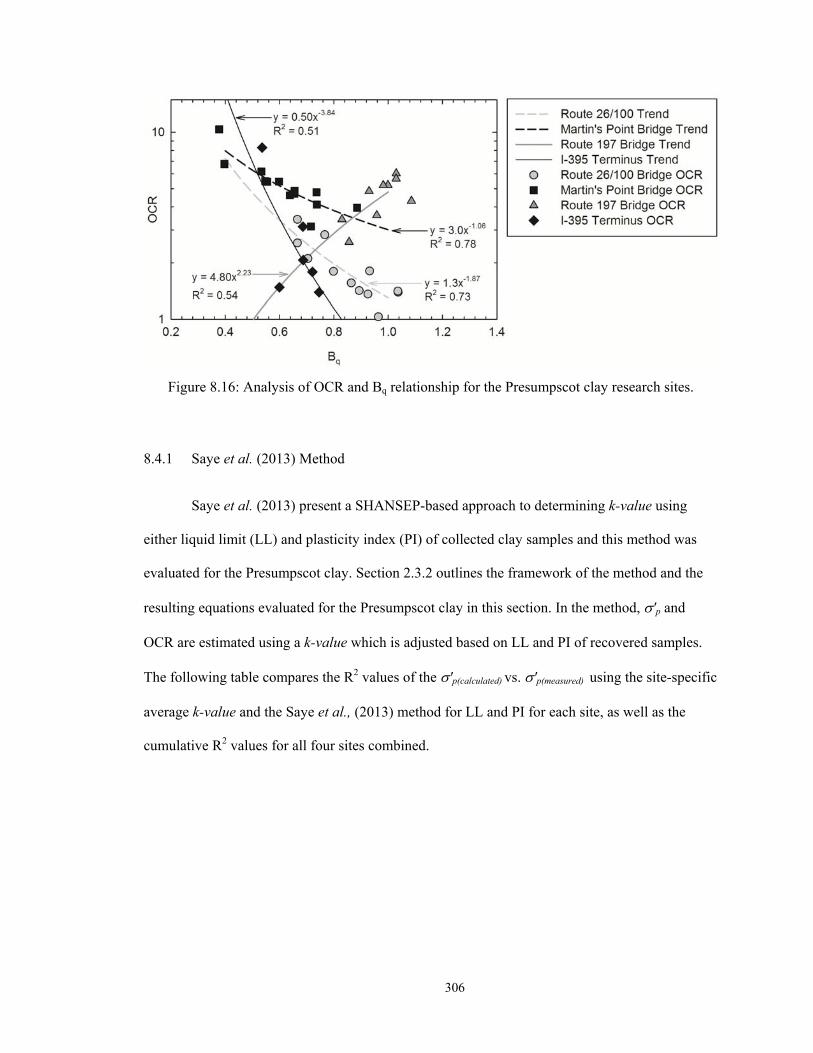
306
Figure 8.16: Analysis of OCR and Bq relationship for the Presumpscot clay research sites.
8.4.1 Saye et al. (2013) Method
Saye et al. (2013) present a SHANSEP-based approach to determining k-value using
either liquid limit (LL) and plasticity index (PI) of collected clay samples and this method was
evaluated for the Presumpscot clay. Section 2.3.2 outlines the framework of the method and the
resulting equations evaluated for the Presumpscot clay in this section. In the method,'p and
OCR are estimated using a k-value which is adjusted based on LL and PI of recovered samples.
The following table compares the R2 values of the 'p(calculated) vs. 'p(measured) using the site-specific
average k-value and the Saye et al., (2013) method for LL and PI for each site, as well as the
cumulative R2 values for all four sites combined.
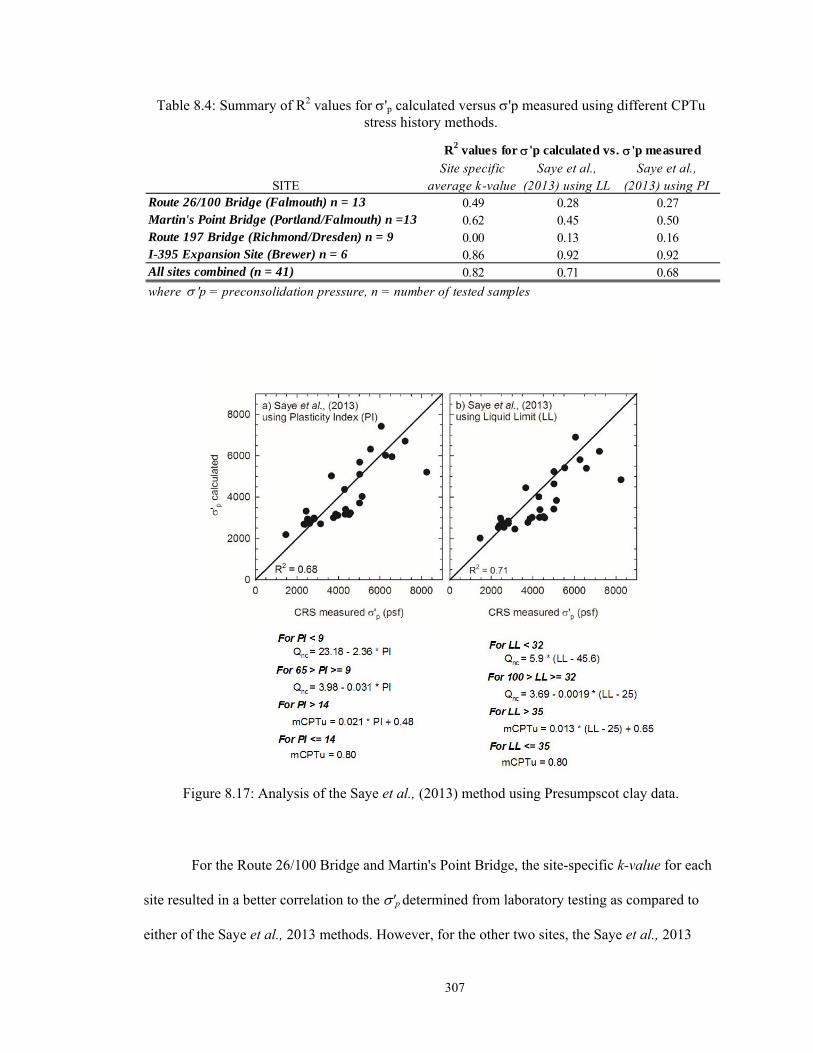
307
Table 8.4: Summary of R2 values for 'p calculated versus 'p measured using different CPTu stress history methods.
Figure 8.17: Analysis of the Saye et al., (2013) method using Presumpscot clay data.
For the Route 26/100 Bridge and Martin's Point Bridge, the site-specific k-value for each
site resulted in a better correlation to the 'p determined from laboratory testing as compared to
either of the Saye et al., 2013 methods. However, for the other two sites, the Saye et al., 2013
SITERoute 26/100 Bridge (Falmouth) n = 13 0.49 0.28 0.27Martin's Point Bridge (Portland/Falmouth) n =13 0.62 0.45 0.50Route 197 Bridge (Richmond/Dresden) n = 9 0.00 0.13 0.16I-395 Expansion Site (Brewer) n = 6 0.86 0.92 0.92All sites combined (n = 41) 0.82 0.71 0.68
where 'p = preconsolidation pressure, n = number of tested samples
Site specific average k-value
Saye et al., (2013) using LL
Saye et al., (2013) using PI
R2 values for 'p calculated vs. 'p measured

308
method resulted in slightly higher R2 values. The latter two sites had less data points for
comparison and a smaller spread of 'p values, and since the LL and PI at each of these sites does
not vary greatly throughout the deposit (Table 6.1 and Table 7.1), it is likely fortuitous that the
Saye et al., (2013) resulted in higher R2 values. The reason the R2 values for the Route 197
Bridge are so low is because the 'p values at the site are relatively constant with depth, therefore
a linear trend line applied to the 'p(calculated) vs. 'p(measured) plot is being fitted to a small
concentration of data points, and hence a lower R2.
The Saye et al. (2013) Atterberg Limits correlation was created using a variety of clay
deposits all over the world which have variable and different plasticity (i.e. LL and PI) values,
whereas the Presumpscot clay has much more consistent LL and PI values. The results from this
analysis are presented in.'p and OCR estimated using the k-values from the Saye et al. (2013)
method correlated less than when using the Mayne (2014) recommendation of k = 0.33.
8.4.2 Stress History Sensitivity Analysis
A sensitivity analysis was performed to predict settlement of a hypothetical load applied
to the Presumpscot clay deposit at the I-395 Terminus site using 'p and OCR predicted from both
the laboratory results and the CPTu results. The purpose of the analysis was to evaluate the effect
of varying k-values on predicted settlement and how those predicted settlement magnitudes
compare to the magnitudes predicted from the laboratory testing results of high quality
specimens. The model was created by separating the Presumpscot clay deposit at the site
(approximately 28 feet in thickness) into 8 sub-layers, each sub-layer represented by an
undisturbed sample which was tested in the laboratory for index and consolidation properties.
Total settlement of the deposit was obtained by summation of the settlement determined for each
sub-layer. Settlement values were estimated using the traditional consolidation settlement
calculation of clay (Equation 88.14).
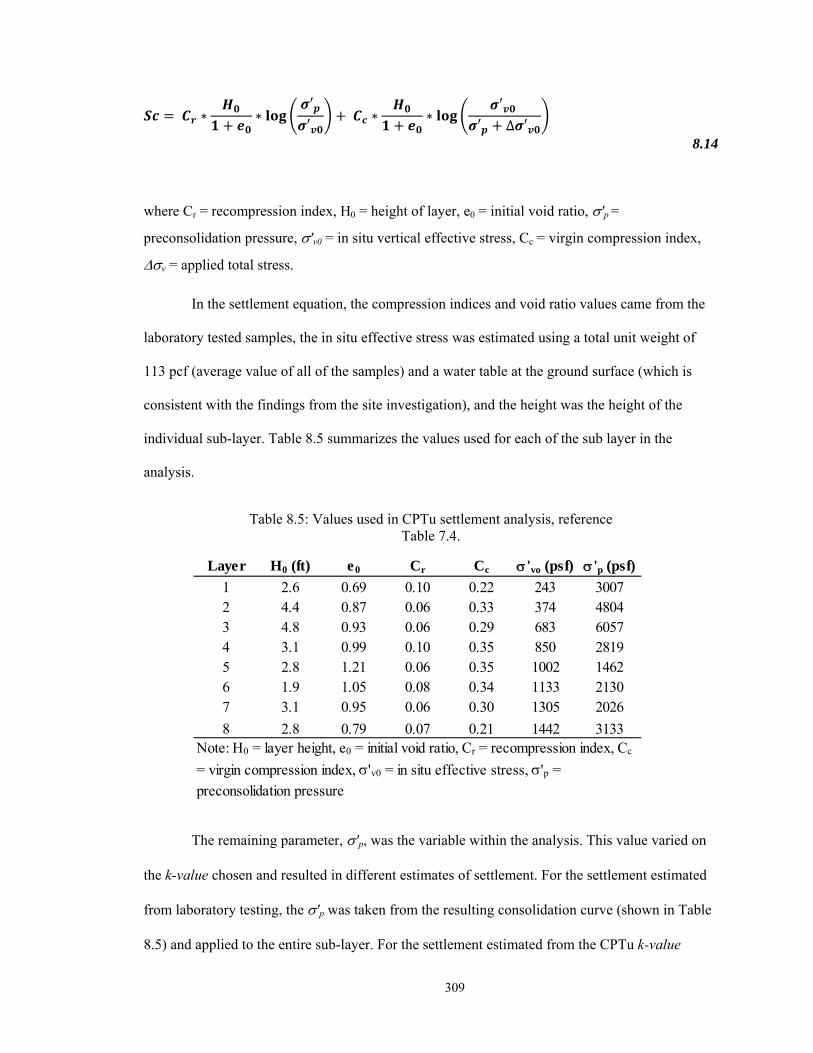
309
∗ ∗′
′∗ ∗
′′ ∆ ′
8.14
where Cr = recompression index, H0 = height of layer, e0 = initial void ratio, 'p =
preconsolidation pressure, 'v0 = in situ vertical effective stress, Cc = virgin compression index,
v = applied total stress.
In the settlement equation, the compression indices and void ratio values came from the
laboratory tested samples, the in situ effective stress was estimated using a total unit weight of
113 pcf (average value of all of the samples) and a water table at the ground surface (which is
consistent with the findings from the site investigation), and the height was the height of the
individual sub-layer. Table 8.5 summarizes the values used for each of the sub layer in the
analysis.
Table 8.5: Values used in CPTu settlement analysis, reference Table 7.4.
The remaining parameter, 'p, was the variable within the analysis. This value varied on
the k-value chosen and resulted in different estimates of settlement. For the settlement estimated
from laboratory testing, the 'p was taken from the resulting consolidation curve (shown in Table
8.5) and applied to the entire sub-layer. For the settlement estimated from the CPTu k-value
Layer H0 (ft) e0 Cr Cc 'vo (psf) 'p (psf)
1 2.6 0.69 0.10 0.22 243 30072 4.4 0.87 0.06 0.33 374 48043 4.8 0.93 0.06 0.29 683 60574 3.1 0.99 0.10 0.35 850 28195 2.8 1.21 0.06 0.35 1002 14626 1.9 1.05 0.08 0.34 1133 21307 3.1 0.95 0.06 0.30 1305 2026
8 2.8 0.79 0.07 0.21 1442 3133Note: H0 = layer height, e0 = initial void ratio, Cr = recompression index, Cc
= virgin compression index, 'v0 = in situ effective stress, 'p =
preconsolidation pressure
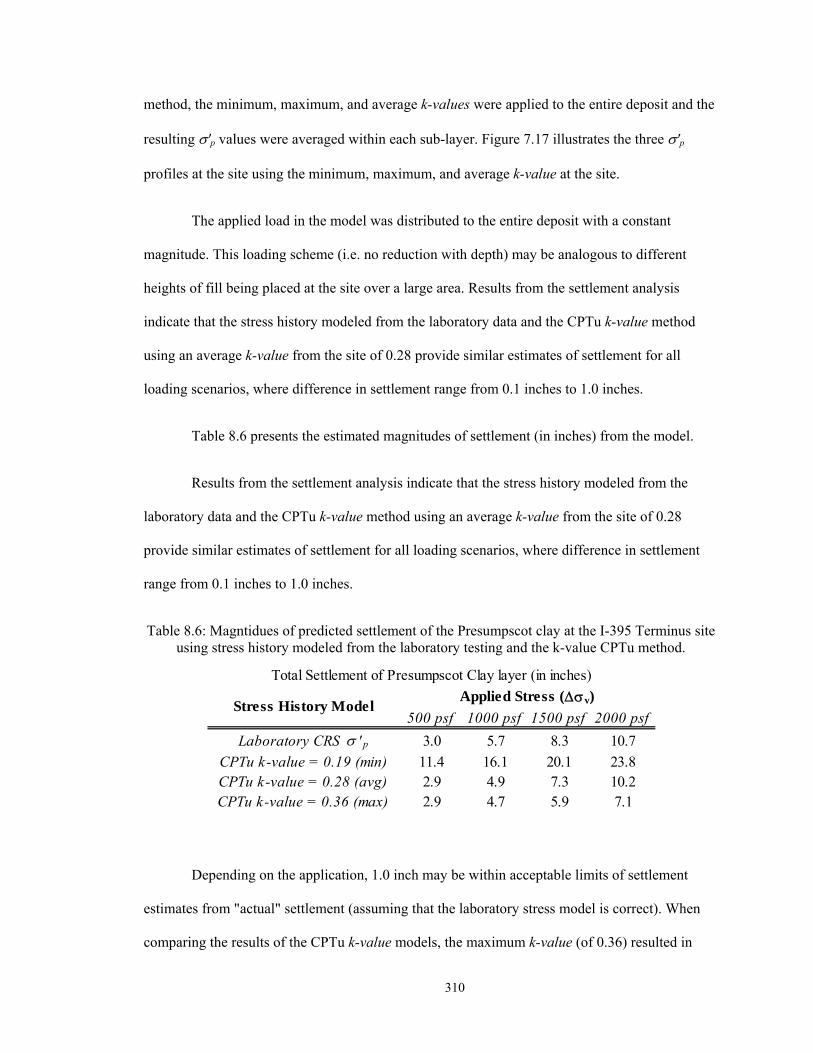
310
method, the minimum, maximum, and average k-values were applied to the entire deposit and the
resulting 'p values were averaged within each sub-layer. Figure 7.17 illustrates the three 'p
profiles at the site using the minimum, maximum, and average k-value at the site.
The applied load in the model was distributed to the entire deposit with a constant
magnitude. This loading scheme (i.e. no reduction with depth) may be analogous to different
heights of fill being placed at the site over a large area. Results from the settlement analysis
indicate that the stress history modeled from the laboratory data and the CPTu k-value method
using an average k-value from the site of 0.28 provide similar estimates of settlement for all
loading scenarios, where difference in settlement range from 0.1 inches to 1.0 inches.
Table 8.6 presents the estimated magnitudes of settlement (in inches) from the model.
Results from the settlement analysis indicate that the stress history modeled from the
laboratory data and the CPTu k-value method using an average k-value from the site of 0.28
provide similar estimates of settlement for all loading scenarios, where difference in settlement
range from 0.1 inches to 1.0 inches.
Table 8.6: Magntidues of predicted settlement of the Presumpscot clay at the I-395 Terminus site using stress history modeled from the laboratory testing and the k-value CPTu method.
Depending on the application, 1.0 inch may be within acceptable limits of settlement
estimates from "actual" settlement (assuming that the laboratory stress model is correct). When
comparing the results of the CPTu k-value models, the maximum k-value (of 0.36) resulted in
500 psf 1000 psf 1500 psf 2000 psf
Laboratory CRS ' p 3.0 5.7 8.3 10.7
CPTu k-value = 0.19 (min) 11.4 16.1 20.1 23.8CPTu k-value = 0.28 (avg) 2.9 4.9 7.3 10.2CPTu k-value = 0.36 (max) 2.9 4.7 5.9 7.1
Stress History ModelApplied Stress (v)
Total Settlement of Presumpscot Clay layer (in inches)
311
similar magnitudes of settlement as the average k-value for the 500 psf and 1,000 psf loading
conditions. As the applied stress increased, the difference in estimated settlement between the two
methods increased. Settlement calculated from the CPTu k-value method using the minimum
value of 0.19 overestimated for all loading conditions, reaching as high as 13 inches greater than
the laboratory stress history model. Thus, using the minimum CPTu k-value at the site does not
provide reasonable estimates of settlement for any loading conditions.
The similarity of predicted settlement between the laboratory data, average CPTu k-
value, and maximum CPTu k-value for the 500 psf and 1,000 psf loading conditions is due to the
overconsolidation of the clay at the site. When the sum of the applied stress to the clay does not
surpass 'p, consolidation of each layer is due only to recompression only. The stress history
profile of these three models indicated that the 500 psf and 1,000 psf loading conditions remained
below the 'p for almost all of the sub-layers in the three models. However, the stress history from
the minimum CPTu k-value of 0.19 estimated that the bottom 5 sub-layers exceeded 'p in both
the 500 psf and 1,000 psf loading conditions, causing settlement estimates to increase
dramatically. As the selected k-value increases, than predicted 'p become overestimated and
resulting settlement magnitudes decrease, and conversely, as the selected k-value decreases, than
predicted 'p become underestimated and resulting settlement magnitudes increase.
Review of the results from this analysis suggests that the degree of accuracy expected for
settlement estimates from the selected CPTu k-value depends on the stress history of the
Presumpscot clay deposit and the loading conditions. If the in situ OCR of the deposit is high and
the 'p is not surpassed by the loading conditions, it appears that the average k-value and
maximum k-value provide reasonable estimates of settlement. If the OCR of the deposit is low
and the stress conditions will be greater than the 'p, than settlement magnitudes become more
sensitive to the selection of the k-value. In essence, the average k-value appeared to provide

312
similar estimates to the laboratory data, whereas minimum and maximum values only match the
laboratory data well for overconsolidated deposits. If CPTu measurements are available for a
deposit and the engineer is attempting to determine settlement based on a selected k-value, it may
be advantageous to create a sensitivity analysis for different k-values and determine if acceptable
settlements are predicted from reasonable k-values. If small changes in k-values result in large
changes in estimated settlement than the risk involved with using the k-value method may be too
high.
8.4.3 Summary
In summary, the k-value method appears to provide a reasonable estimate of 'p and OCR
profiles in the Presumpscot clay. The most preferable method to determine an accurate k-value is
to perform as many consolidation tests on high quality samples as possible and back-calculate the
k-value based on the resulting 'p value(s). A k-value of 0.33 suggested by Mayne (2014)
provides a practical, first order estimate of k-value that can be applied to CPTu results in
Presumpscot. k-value averages at the four sites ranged from 0.28 to 0.45. k-value appears to
increase from OCR values of 1 to 4, and subsequently maintain or slightly decrease from OCR 4
to 6, all the while remaining within the suggested ranges (from Lunne et al., 1997) of 0.20 to
0.50. There was not enough data for samples with an OCR greater than 6 to come to a definite
conclusion for k-value trends beyond this value.
The level of acceptability for using the k-value to perform geotechnical analysis such as
settlement calculations is a site-specific task. If the k-value method is used at a Presumpscot clay
site, that a high quality sample be obtained within the more normally consolidated portion of the
deposit, and tested in the laboratory for 'p, from which a k-value can be back calculated (the
more samples the better). This k-value (or values) should be compared to the ones determined in
this study to ensure it remains within a reasonable range. Thereafter, a sensitivity analysis should
313
be formulated and the resulting change in settlement estimates (or whatever is being analyzed) be
quantified by a changing k-value. From this, a decision can be made whether to proceed with the
analysis using the determined collect more samples to increase the confidence in the selected k-
value.
8.5 Undrained Shear Strength
Undrained shear strength (su) of the Presumpscot clay was measured at the four research
sites using laboratory and in situ methods. Laboratory methods included direct simple shear
(DSS) testing on Sherbrook block and modified Shelby tube samples collected from the Route
26/100 Bridge site and anisotropically consolidated undrained compression (CAUC) triaxial
testing on the tube samples collected from the other three sites. Additionally, field vane shear
testing (FVT) was performed at all four sites. A comparison between the su measured from the
different testing methods is presented in Section 3.4.8. In summary, su from laboratory methods is
preferred over the FVT because sample quality is measureable, boundary conditions are well
controlled, and there is more consistency in results with the DSS and CAUC methods over the
FVT. Accordingly, the CPTu correlations to su estimated from laboratory methods are separated
from su determined from FVT.
This section summarizes the CPTu cone factors Nkt and Nu determined at each of the
four Presumpscot clay deposit research sites. The resulting cone factors will be compared to
measured soil properties (such as stress history or index properties) to evaluate potential
correlations. As discussed in Section 2.3.3, these types of correlations have been developed for
other clays, and the effectiveness of these correlations will be compared and assessed for their
applicability to the Presumpscot clay. Equations 8.15 through 8.16 show the three CPTu cone
factors.
Nkt = qnet/su 8.15
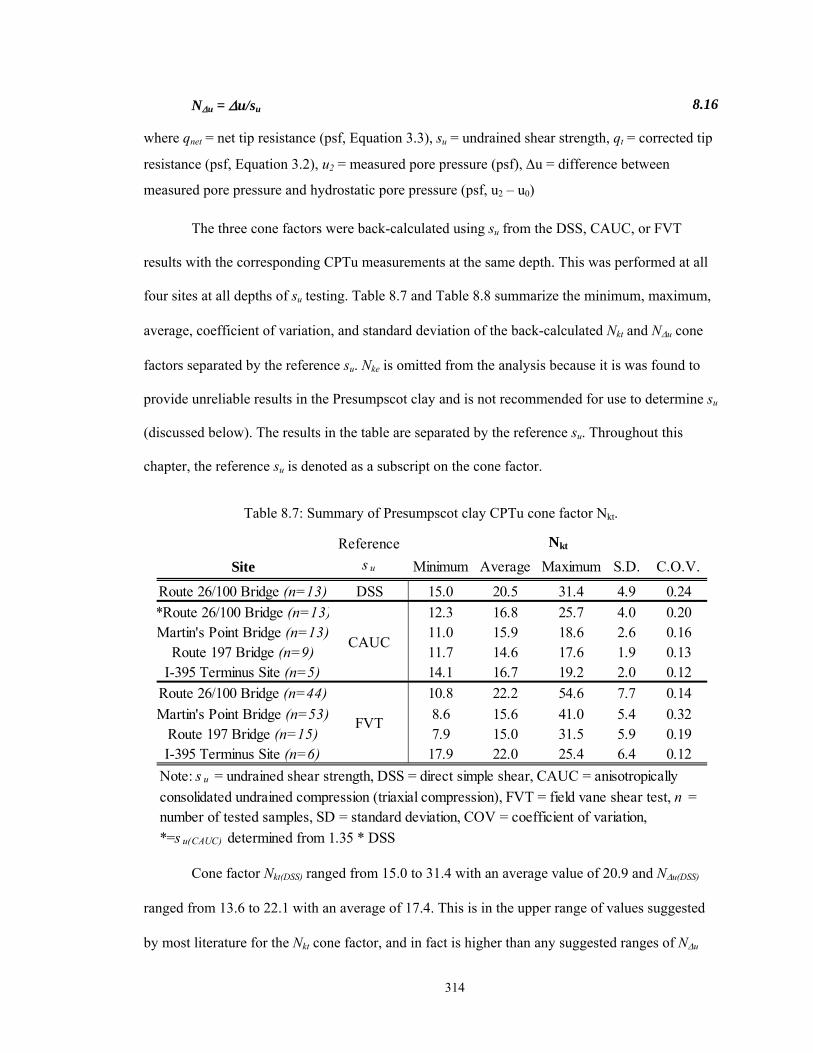
314
Nu = u/su 8.16
where qnet = net tip resistance (psf, Equation 3.3), su = undrained shear strength, qt = corrected tip
resistance (psf, Equation 3.2), u2 = measured pore pressure (psf), u = difference between
measured pore pressure and hydrostatic pore pressure (psf, u2 – u0)
The three cone factors were back-calculated using su from the DSS, CAUC, or FVT
results with the corresponding CPTu measurements at the same depth. This was performed at all
four sites at all depths of su testing. Table 8.7 and Table 8.8 summarize the minimum, maximum,
average, coefficient of variation, and standard deviation of the back-calculated Nkt and Nu cone
factors separated by the reference su. Nke is omitted from the analysis because it is was found to
provide unreliable results in the Presumpscot clay and is not recommended for use to determine su
(discussed below). The results in the table are separated by the reference su. Throughout this
chapter, the reference su is denoted as a subscript on the cone factor.
Table 8.7: Summary of Presumpscot clay CPTu cone factor Nkt.
Cone factor Nkt(DSS) ranged from 15.0 to 31.4 with an average value of 20.9 and Nu(DSS)
ranged from 13.6 to 22.1 with an average of 17.4. This is in the upper range of values suggested
by most literature for the Nkt cone factor, and in fact is higher than any suggested ranges of Nu
Site Minimum Average Maximum S.D. C.O.V.
Route 26/100 Bridge (n=13) DSS 15.0 20.5 31.4 4.9 0.24
*Route 26/100 Bridge (n=13) 12.3 16.8 25.7 4.0 0.20Martin's Point Bridge (n=13) 11.0 15.9 18.6 2.6 0.16
Route 197 Bridge (n=9) 11.7 14.6 17.6 1.9 0.13I-395 Terminus Site (n=5) 14.1 16.7 19.2 2.0 0.12
Route 26/100 Bridge (n=44) 10.8 22.2 54.6 7.7 0.14
Martin's Point Bridge (n=53) 8.6 15.6 41.0 5.4 0.32Route 197 Bridge (n=15) 7.9 15.0 31.5 5.9 0.19I-395 Terminus Site (n=6) 17.9 22.0 25.4 6.4 0.12
Note: s u = undrained shear strength, DSS = direct simple shear, CAUC = anisotropically
consolidated undrained compression (triaxial compression), FVT = field vane shear test, n = number of tested samples, SD = standard deviation, COV = coefficient of variation,
*=s u(CAUC) determined from 1.35 * DSS
CAUC
FVT
Reference
s u
Nkt

315
that the author could find. Cone factors from the literature (Section 2.3.3) were developed mostly
using a reference su of triaxial compression (TC, i.e., CAUC), so it is expected for the cone
factors back-calculated from DSS testing to be higher since su from DSS testing is lower than su
from CAUC. As discussed previously in this chapter, su determined from DSS can be converted
into a CAUC strength using a conversion of su(DSS) = su(CAUC) * 0.74. In doing this, Nkt(CAUC) and
Nu(CAUC) factors can be calculated for the Route 26/100 Bridge. The resulting Nkt(CAUC) ranged
from 12.3 to 25.7 with an average of 16.8 and the Nu(CAUC) ranged from 11.1 to 18.1 with an
average of 14.1.
Table 8.8: Summary of Presumpscot clay CPTu cone factor Nu.
Cone factor Nkt(CAUC) ranged from 11.0 to 19.2 with average values of 15.9 for Martin's
Point Bridge, 14.6 for Route 197 Bridge, 16.7 for I-395 Expansion site, and 16.8 for Route
26/100 Bridge. Nu(CAUC) ranged from 5.0 to 17.2 with an average value of 9.7 for Martin's Point
Bridge, 14.1 for Route 197 Bridge, 10.9 for I-395 Terminus site, and 14.1 for Route 26/100
Bridge. Nkt has been found to generally range from 10 to 20 with an average of 15 for clays
Site Minimum Average Maximum S.D. COV
Route 26/100 Bridge (n=13) DSS 13.6 17.3 22.1 2.3 0.13
*Route 26/100 Bridge (n=13) 11.1 14.1 18.1 1.9 0.11Martin's Point Bridge (n=13) 5.0 9.7 13.3 2.1 0.22
Route 197 Bridge (n=9) 12.7 14.1 17.2 1.6 0.11
I-395 Terminus Site (n=5) 7.5 10.9 12.4 2.0 0.18Route 26/100 Bridge (n=44) 8.4 19.9 52.8 7.7 0.14Martin's Point Bridge (n=53) 0.4 8.6 18.0 4.1 0.41
Route 197 Bridge (n=15) 8.2 13.1 23.8 3.6 0.15
I-395 Terminus Site (n=6) 12.6 16.3 19.1 4.4 0.13
Reference
s u
Nu
CAUC
FVT
Note: s u = undrained shear strength, DSS = direct simple shear, CAUC = anisotropically
consolidated undrained compression (triaxial compression), FVT = field vane shear test, n = number of tested samples, SD = standard deviation, COV = coefficient of variation, * =
s u(CAUC) determined from 1.35 * s u(DSS)

316
(Lunne et al., 1997). Nkt(CAUC) for Presumpscot fits within this range at the upper end. Nu(CAUC)
values from this study fall well above suggested ranges of values of 4 to 10 for similar clays. The
average values for each of the four Presumpscot research sites were close to 10 or higher (with
maximum values as high as 18.1).
Coefficient of variation (COV) for Nkt(CAUC) ranged from 0.12 to 0.20 and for Nu(CAUC)
ranged from 0.11 to 0.22. Standard deviation for Nkt(CAUC) ranged from 1.9 to 4.9 and for Nu(CAUC)
ranged from 1.6 to 2.3. Using the COV as an evaluation of effectiveness; both of the cone factors
resulted in similar effectiveness (i.e. comparable ranges of COV). Thus, in general, neither one of
the two factors appeared to be consistently more effective than the other in the Presumpscot clay.
However, an interesting trend did appear between the COV, cone factor, and clay sensitivity of
the Presumpscot clay. Nu(DSS or CAUC) from the two sensitive clay sites (Route 26/100 Bridge and
Route 197 Bridge) resulted in COVs which were less than or equal to the COVs for the Nkt(DSS or
CAUC) at the sites. Conversely, the Nkt(DSS or CAUC) COV at the non-sensitive clay sites (Martin's Point
Bridge and I-395 Terminus) was lower than the Nu(DSS or CAUC) at those same sites. This suggests
the possibility of superior performance of Nkt for non-sensitive deposits and Nu at sensitive
deposits of Presumpscot clay.
The average Nkt(CAUC) at the four sites remained within a small range of values between
14.6 and 16.8. There did not appear to be a trend between specific sites and values of Nkt(CAUC).
Nkt(FVT) averages from the sites fell within a broader and higher range of values between 15.0 and
22.2. Higher Nkt(FVT) than Nkt(CAUC) values are expected because su(CAUC) is higher than su(FVT).
Nu(CAUC) ranged between 9.7 and 14.1 and Nu(FVT) ranged from 8.6 to 19.9. Nu(CAUC) at Route
26/100 Bridge and Route 197 Bridge resulted in identical values of 14.1 whereas the values at
Martin's Point Bridge and I-395 Terminus site are 9.7 and 10.9, respectively. Route 26/100
Bridge and Route 197 Bridge both contain sensitive deposits of Presumpscot clay, and as
317
discussed later in the section, the similarity between the Nu(CAUC) values at each pair of sites
suggests a potential correlation between sensitivity and Nu(CAUC).
As expected, the Nkt(FVT) and Nu(FVT) had a wider range of values. The greater spread
resulting from the FVT results is expected both because there were more FVT test results than
DSS/CAUC test results at each site and su from FVT is almost always more variable than
laboratory testing because of natural soil variability and operator/equipment dependence. Nkt(FVT) -
ranged from 7.9 to 54.6 with average values of 22.2 for Route 26/100 Bridge, 15.6 for Martin's
Point Bridge, 15.0 for Route 197 Bridge, and 22.0 for I-395 Terminus. Nu(FVT) ranged from 0.4 to
52.8 with average values of 19.9 for Route 26/100 Bridge, 18.0 for Martin's Point Bridge, 23.8
for Route 197 Bridge, and 16.3 for I-395 Expansion terminus. Figure 8.18 illustrates Nkt(FVT) and
Nu(FVT) compared to Nkt(DSS or CAUC) and Nu(DSS or CAUC) determined at each of the four research sites.
It is also important to note that some of the variation in FVT correlation to the cone factors comes
from the fact that the FVT were performed at various locations throughout the site, sometimes up
to 200 feet away from the CPTu sounding, whereas all the laboratory results were from the same
boring and correlated to a CPTu within 30 feet next to that boring. Also shown as the black dotted
vertical lines on Figure 8.18 are "typical" ranges of Nkt and Nu found in similar studies of other
clays to illustrate how the Presumpscot clay compares to these. While these published ranges are
not limiting values (i.e. the absolute minimum and maximum values from all of the literature),
they do encompass the majority of resulting values for Nkt.
Inspection of Figure 8.18 reveals the trend that both Nkt and Nu data to mostly plot within
or above the published ranges of values. For Nkt(CAUC or DSS), all but six data points plotted within
the range of 10 to 20, illustrating good agreement between the CPTu strength correlation in
Presumpscot clay and other clay soils. The six points above the published range are all Nkt(DSS)
values from Route 26/100 Bridge, and since DSS testing results in lower su estimates, higher

318
values of Nkt would be expected. The CAUC correlated su for those same data shifted four out of
six of the resulting values into the range, leaving only two of the data points above 20. Only
seven out of the 40 Nu(CAUC or DSS) values remained within the published range of 4 to 10, while
the other 33 were above the range. The maximum value from the researched literature in other
soft clays was 13.1 (Remai, 2013), and from the geotechnical design recommendations of Lunne
et al., (1997) was an Nu(CAUC or DSS) value of 10. The average values from each of the Presumpscot
clay sites ranged from 9.7 to 17.3.
Figure 8.18: Nkt and Nu factors determined from laboratory testing and field vane shear testing (FVT) at all four Presumpscot clay research sites.
319
Clearly, there is a tendency for Nu values in Presumpscot clay to be higher than other clay soils.
It is not immediately clear why the Presumpscot clay deviates from the Nu trend of most other
clay soils, but the source stems from the increased ratio of pore pressure to undrained shear
strength (i.e. Equation 8.16).
Nkt(FVT) ranged from 7.9 to 54.6 and Nu(FVT) ranged from 8.4 to 52.8 with averages from
each of the four sites summarized in Table 8.7 and Table 8.8. Overall, the Nkt(FVT) and Nu(FVT)
factors varied more widely than the factors correlated to laboratory testing, which is expected.
The FVT is a different mode of shear than CAUC, and relates more closely to DSS, however the
rate is faster and the boundary conditions are less controllable. The accuracy of FVT results are
highly dependent on the operator and typically result in a scatter of su values. Subsequently, the
correlated Nkt(FVT) and Nu(FVT) factors showed this. One observation made from the data collected
at the four sites indicated a better averaged Nkt(FVT) and Nu(FVT) factor with increased number of
FVT tests.
8.5.1 Correlations to Nkt and Nu
Researchers have proposed relationships between clay properties and the CPTu cone
factors Nkt and Nu. Plasticity index (PI), overconsolidation ratio (OCR), and su has been found to
correlate with the cone factors in some studies, which included clay deposits in Norway, Canada,
the North Sea, and Denmark using su from CAUC, DSS, triaxial extension, and FVT (Aas et al.,
1986, Karlsrud et al., 1996, Lunne et al., 1985, Rad and Lunne, 1988). Other studies have shown
no correlation between these factors (La Rochelle et al., 1988, Powell and Quarterman 1988,
Hong et al., 2010, Almeida et al., 2010, and Wei et al., 2013). In addition, a correlation between
CPTu measurement of normalized pore pressure (Bq) and Nu has been suggested. If these
correlations do exist for the Presumpscot clay, they could provide an improved approach to the
selection of the Nkt and Nu cone factor for specific sites. All of the aforementioned relationships

320
were evaluated for Nkt(CAUC or DSS) and Nu(CAUC or DSS) determined from the four research sites.
Nkt(FVT) and Nu(FVT) were not correlated to other properties because clay properties at the FVT
depths are not known since samples were not collected at the depths of the tests. Figure 8.19
presents cone factor Nkt(CAUC or DSS) versus PI, OCR, su, and Bq. Figure 8.20 presents Nu(CAUC or DSS)
versus the same measurements.
Figure 8.19 and Figure 8.20 confirm the variability of the glacial Presumpscot clay and
indicate no clear relationships between Nkt and Nu with the majority of comparison parameters
(e.g. Nkt and OCR, PI, and Bq and Nu and OCR and PI). Figure 8.19 illustrates Nkt compared with
measured values of OCR, PI, su and Bq. Three of the four presented correlations are inconclusive
and do not suggest relationships between Nkt and OCR, PI, and Bq. However, Nkt and su appear to
have a generally sharply decreasing trend from approximately 250 psf to approximately 400 psf,
whereafter the Nkt stays relatively constant with increasing su in between values of 10 and 20.
Correlations between the same four parameters and Nu are illustrated in Figure 8.20. Correlation
of Nu to OCR and PI was not conclusive, but there was potential when analyzing su and Bq. In
general, the su and Nu showed a relatively poor correlation, but may suggest a decreasing trend of
Nu with increasing su from approximately 250 psf to approximately 800 psf, whereafter Nu stays
relatively constant with increases in su. Literature expanding on this correlation was not located.
However, there was a correlation observed between Bq and Nu which is supported by additional
literature. The increasing Nu with increasing Bq relationship is discussed below.
There is some correlation between Nu(CAUC or DSS) and both su and Bq, where Nu(CAUC) is
generally lower for higher su soils and greater for larger Bq values. The latter agrees with findings
from similar studies in clay performed by Karlsrud et al. (1996) and Lunne et al. (1985). The
observed trends from these three studies between Nu and Bq are presented in Figure 8.20c along
with the plotted Presumpscot clay data. Both studies show a linearly increasing trend in Nuwith
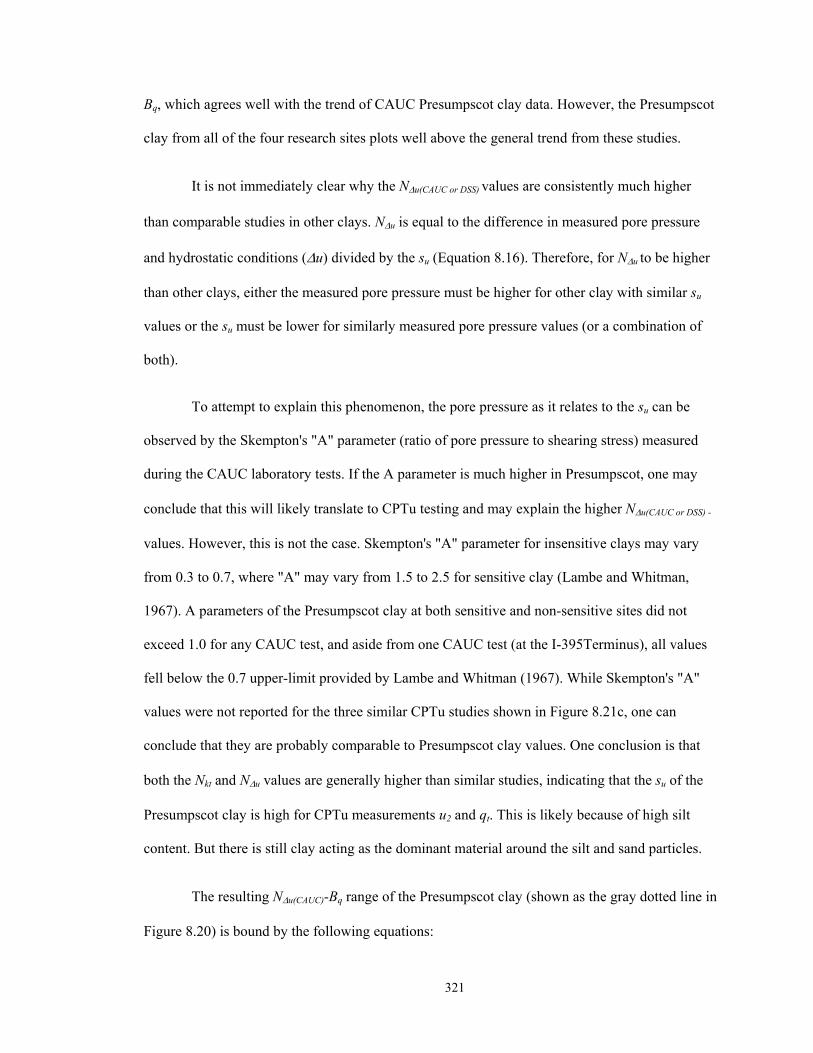
321
Bq, which agrees well with the trend of CAUC Presumpscot clay data. However, the Presumpscot
clay from all of the four research sites plots well above the general trend from these studies.
It is not immediately clear why the Nu(CAUC or DSS) values are consistently much higher
than comparable studies in other clays. Nu is equal to the difference in measured pore pressure
and hydrostatic conditions (u) divided by the su (Equation 8.16). Therefore, for Nu to be higher
than other clays, either the measured pore pressure must be higher for other clay with similar su
values or the su must be lower for similarly measured pore pressure values (or a combination of
both).
To attempt to explain this phenomenon, the pore pressure as it relates to the su can be
observed by the Skempton's "A" parameter (ratio of pore pressure to shearing stress) measured
during the CAUC laboratory tests. If the A parameter is much higher in Presumpscot, one may
conclude that this will likely translate to CPTu testing and may explain the higher Nu(CAUC or DSS) -
values. However, this is not the case. Skempton's "A" parameter for insensitive clays may vary
from 0.3 to 0.7, where "A" may vary from 1.5 to 2.5 for sensitive clay (Lambe and Whitman,
1967). A parameters of the Presumpscot clay at both sensitive and non-sensitive sites did not
exceed 1.0 for any CAUC test, and aside from one CAUC test (at the I-395Terminus), all values
fell below the 0.7 upper-limit provided by Lambe and Whitman (1967). While Skempton's "A"
values were not reported for the three similar CPTu studies shown in Figure 8.21c, one can
conclude that they are probably comparable to Presumpscot clay values. One conclusion is that
both the Nkt and Nu values are generally higher than similar studies, indicating that the su of the
Presumpscot clay is high for CPTu measurements u2 and qt. This is likely because of high silt
content. But there is still clay acting as the dominant material around the silt and sand particles.
The resulting Nu(CAUC)-Bq range of the Presumpscot clay (shown as the gray dotted line in
Figure 8.20) is bound by the following equations:
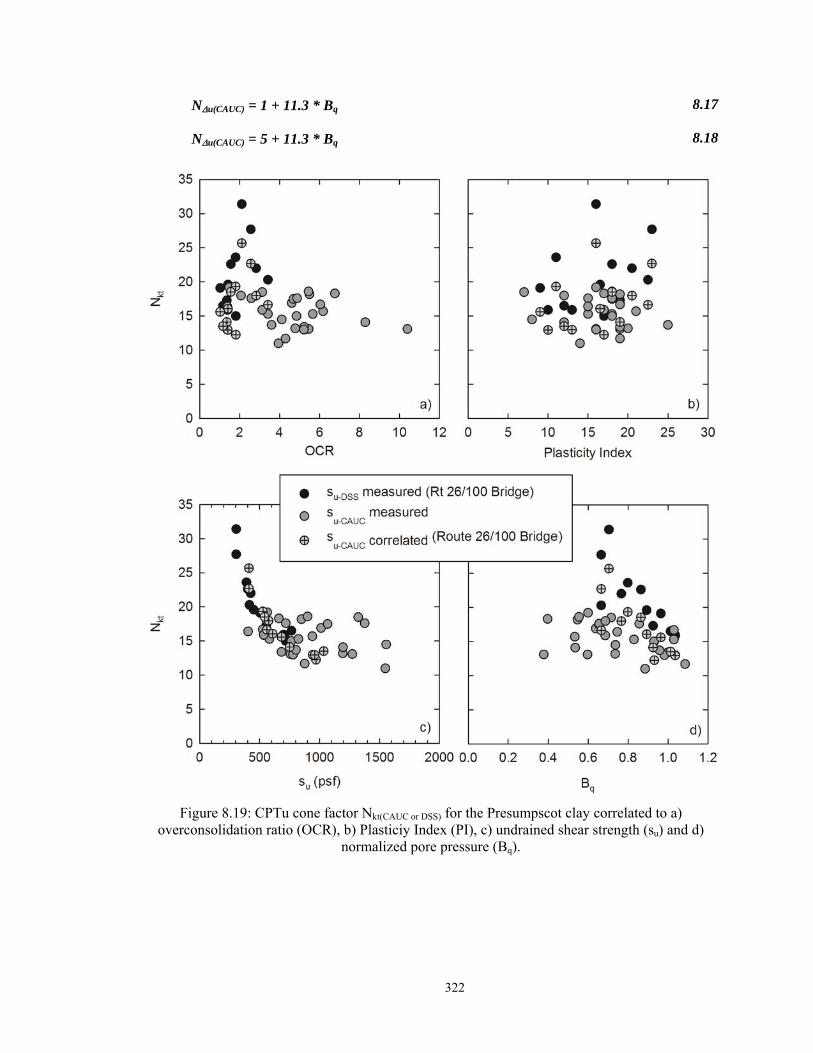
322
Nu(CAUC) = 1 + 11.3 * Bq 8.17
Nu(CAUC) = 5 + 11.3 * Bq 8.18
Figure 8.19: CPTu cone factor Nkt(CAUC or DSS) for the Presumpscot clay correlated to a) overconsolidation ratio (OCR), b) Plasticiy Index (PI), c) undrained shear strength (su) and d)
normalized pore pressure (Bq).
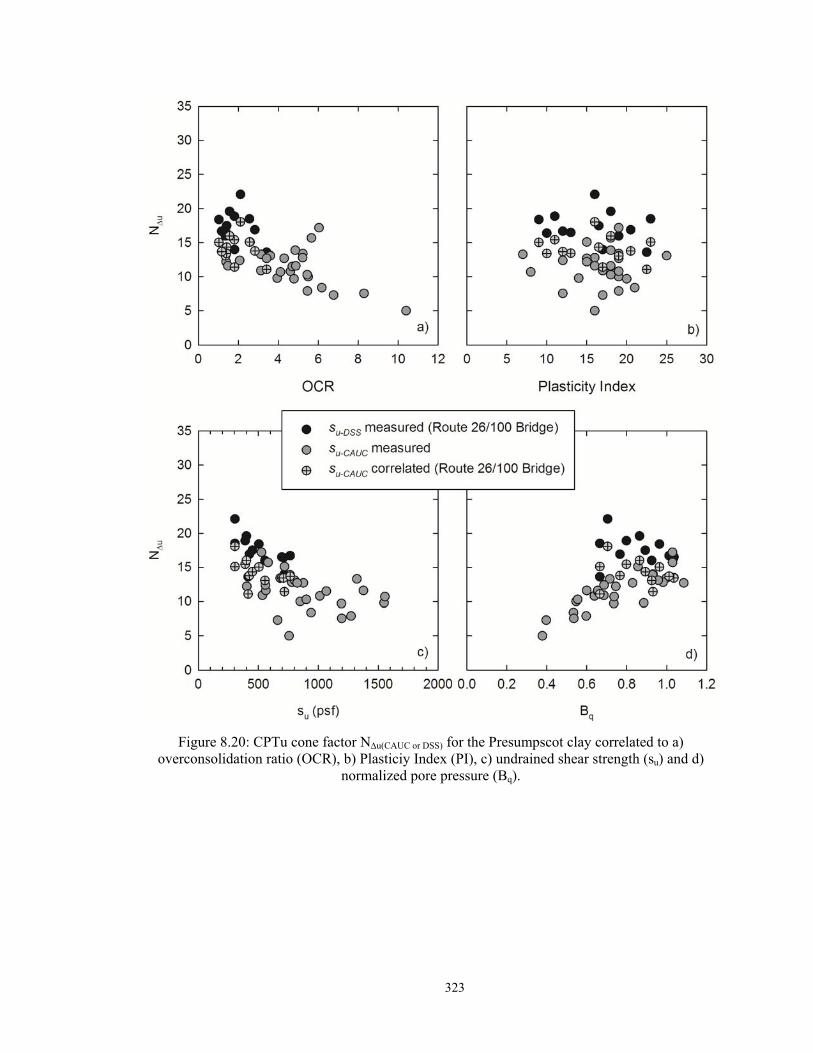
323
Figure 8.20: CPTu cone factor Nu(CAUC or DSS) for the Presumpscot clay correlated to a) overconsolidation ratio (OCR), b) Plasticiy Index (PI), c) undrained shear strength (su) and d)
normalized pore pressure (Bq).

324
Figure 8.21: Presumpscot clay CPTu data compared to ranges from a) Aas et al., (1986) b) Karlsrud et al., (1996), and c) Lunne et al., (1985) and Karlsrud (1996).
Nu values calculated at Route 26/100 Bridge and Route 197 Bridge (high sensitivity) are
consistently higher than those calculated at Martin's Point Bridge and I-395 Terminus (low
sensitivity). Figure 8.22 presents a relationship, updated from Karlsrud (2005), between

325
sensitivity, Nu, and OCR. The relationship resulted in the following equations for the
Presumpscot clay for deposits with sensitivity less than 15 and greater than 15, respectively:
Nu(CAUC) = 17 – 3.7*ln(OCR) 8.19
Nu(CAUC) = 19 – 4.0*ln(OCR) 8.20
These equations are in the same format as the SHANSEP power equation. The first
integer in the above equations represents the Nu value for normally consolidation conditions,
equivalent to the normalized shear strength "S" SHANSEP parameter. The number multiplied by
the natural log function represents the magnitude of the slope of the line, and is equivalent to the
exponential "m" SHANSEP parameter.
8.5.2 Been et al., (2010) Method
Been et al. (2010) proposed a SHANSEP-based approach for determining Nkt and k-value
(Section 2.3.3) directly from CPTu measurements. They do not propose that this method can be
used to replace laboratory or field testing to obtain su or stress history (which they explicitly state
is the most effective method and is universally supported in the literature), but they do suggest
using the method when testing data is available and reasonable estimates of SHANSEP
parameters are known. The method was developed by manipulating the SHANSEP equation
(Equation 8.21; Ladd and Foott, 1974) to accommodate CPTu measurements. Nkt (Equation 8.15)
and k-value (Equation 8.13) are substituted for su and OCR, respectively where SHANSEP S and
m parameters remain, which are assumed to be constant for an entire deposit (Ladd and Foott,
1974). The resulting relationship between stress history and strength is shown as Equation 8.22:
326
Figure 8.22: Undrained shear strength coefficient Nu vs. OCR, separating data points of high sensitivity and low sensitivity for Presumpscot clay.
(su/'v0)(OC) = S*OCRm 8.21
Nkt*S*km = [(qt – 'v0)/(v0)]^(1-m) 8.22
where su = undrained shear strength, 'v0 = in situ vertical effective stress, 'v0 = in situ total stress,
OC notates overconsolidated state, S = (su/'v0) for normally consolidated conditions, OCR =
overconsolidation ratio, m = exponential coefficient found to range from approximately 0.5 to
1.0, and qt = corrected tip resistance measured from the CPTu sounding. Table 2.2 summarizes
some S and m parameters determined from studies in Presumpscot clay and Boston Blue clay.
OCR1 10
Nu
0
5
10
15
20
25
St <= 15
St > 15
Equation 7a (Karlsrud, 2005)Equation 7b (Karlsrud, 2005)Nu = 17 - 3.7 * ln(OCR)
Nu = 19 - 4.0 * ln(OCR)
327
The Been et al. (2010) method assumes that the left side of Equation 8.22 is constant for
a deposit as a necessary simplifying assumption. The authors propose re-arranging Equation 8.22
to solve for Nkt using an assumed reasonable k-value and then identifying the trend of Nkt with
depth. The authors suggest this be performed assuming multiple, and a range of, k-values to
identify the corresponding range of Nkt. Thereafter, the authors suggest the same process to
identify an appropriate k-value using multiple reasonable estimates of Nkt.. At the end of the
process, the result is an expected range of both the k-value and Nkt, which can provide guidance
for the selection of each variable.
This method was evaluated for the Presumpscot clay at the Route 197 Bridge because it
was the only site that was found to have proper characterization of su based on the true
SHANSEP equation. Route 26/100 was not included because SHANSEP testing was not
performed on the tested samples for that site, and the resulting SHANSEP analysis gave poor
predictions of su (as compared to the CAUC laboratory results) at Martin's Point Bridge and the I-
395 Terminus site. SHANSEP S and m parameters are specified in Equation 6.2 and the k-value
and Nkt were available from the CPTu correlation to laboratory results, therefore all variables
were known for Equation 8.22. Nkt and k-value were separately solved for using Equation 8.22
and compared to the measured strength values determined from recompression CAUC triaxial
testing (Table 6.6). When Nkt was being solved for, the k-value assumed was the one solved for
the tested sample at that depth. Similarly, when k-value is being solved for, the Nkt is known from
the CAUC tested sample at that depth. Figure 8.23 presents the ratio of Nkt and k-values estimated
from the Been et al. (2010) method to the actual value.
The Been et al. (2010) method underestimated both Nkt and k-value at the Route 197
Bridge compared to the values obtained directly from the laboratory testing. Underestimates of
Nkt will lead to an over prediction of su, and underestimates of k-value will lead to under
predictions of OCR. In the case of su predictions, the Been et al. (2010) errs on the "un-
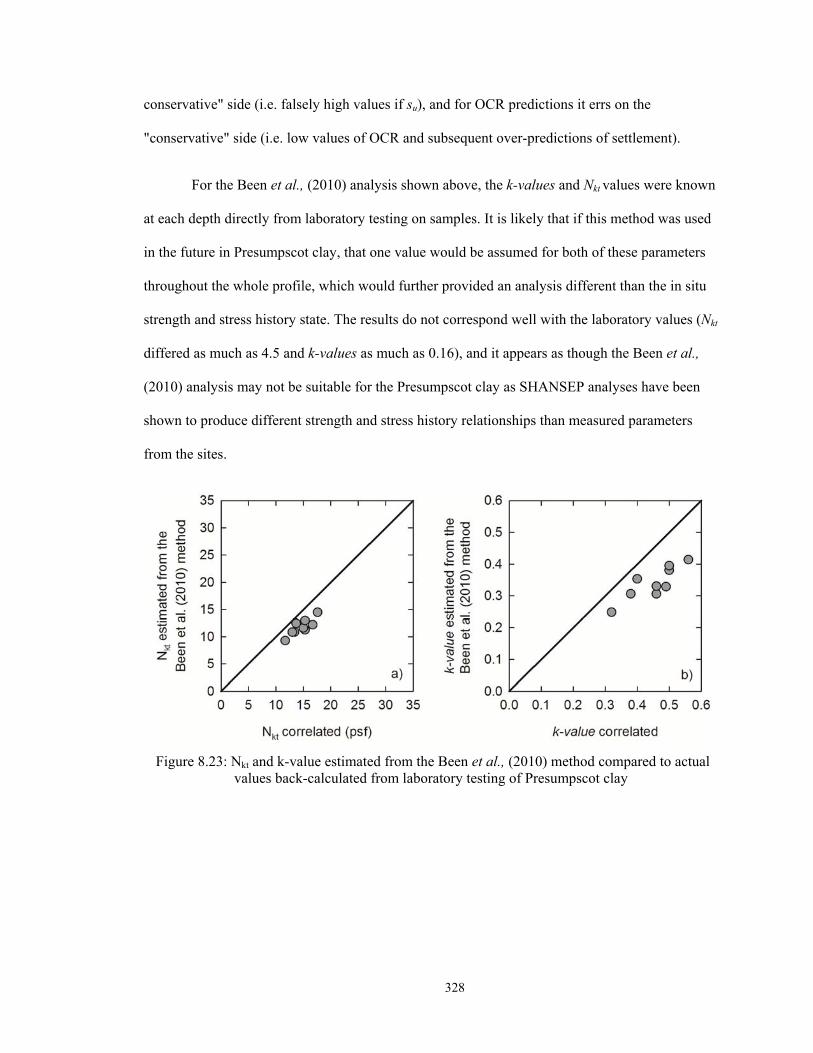
328
conservative" side (i.e. falsely high values if su), and for OCR predictions it errs on the
"conservative" side (i.e. low values of OCR and subsequent over-predictions of settlement).
For the Been et al., (2010) analysis shown above, the k-values and Nkt values were known
at each depth directly from laboratory testing on samples. It is likely that if this method was used
in the future in Presumpscot clay, that one value would be assumed for both of these parameters
throughout the whole profile, which would further provided an analysis different than the in situ
strength and stress history state. The results do not correspond well with the laboratory values (Nkt
differed as much as 4.5 and k-values as much as 0.16), and it appears as though the Been et al.,
(2010) analysis may not be suitable for the Presumpscot clay as SHANSEP analyses have been
shown to produce different strength and stress history relationships than measured parameters
from the sites.
Figure 8.23: Nkt and k-value estimated from the Been et al., (2010) method compared to actual values back-calculated from laboratory testing of Presumpscot clay

329
Table 8.9: Summary of k-values and Nkt values from Route 197 Bridge after the Been et al., (2010) method.
8.5.3 Undrained Shear Strength Sensitivity Analysis
From a geotechnical design standpoint, it is advantageous to determine the effect of a
changing Nkt and Nu on the estimated su profile from CPTu results. If (hypothetically) selecting
an Nkt of anywhere from 10 to 20 provides an adequate design su profile, than less time and effort
has to be spend in identifying an appropriate Nkt value. On the other hand, if an Nkt of 14 provides
a factor of safety of 1.3 for the stability of a hypothetical slope and an Nkt of 14.5 provides a
factor of safety of 0.90 for that hypothetical slope, there is an obvious advantage to identifying
the appropriate Nkt factor. Figure 8.24 and Figure 8.25 present the estimated su profiles at each of
the four research sites using the site-specific average, ±1 standard deviation. The resulting su
profiles are compared to the laboratory-determined su.
The general shape of the su profile predicted from both Nkt and Nu at the four sites
followed closely the trend of the laboratory data. In fact, some laboratory data were intersected by
Nkt and Nu profiles (i.e. the average Nkt and Nu at that site was equal to Nkt and Nu at that depth).
However, there is not complete correlation of su(DSS). This may be because CPTu profiles are
Percent Difference
Depth (ft) N kt k N kt k N kt k
13.5 16.7 0.46 12.2 0.31 -31% -40%15.5 15.3 0.49 11.3 0.33 -30% -39%17.5 13.4 0.50 10.9 0.38 -21% -27%19.4 13.0 0.50 10.8 0.40 -18% -23%21.4 15.0 0.46 11.6 0.33 -25% -33%24.4 13.7 0.40 12.5 0.35 -9% -12%26.4 11.7 0.56 9.3 0.41 -23% -30%27.7 15.3 0.38 13.0 0.31 -16% -21%30.1 17.6 0.32 14.5 0.25 -19% -25%
Values assumed in analysis (from lab testing)
Resulting Been et al., (2010) values
330
influenced by multiple factors including disturbance or localized changes in geology between the
CPTu location and the boring location. In general, selecting the average Nkt and Nu at each site
and applying it to the entire profile resulted in CPTu derived su profile with both the same shape
and magnitude as the su from the laboratory testing. Furthermore, the ±1 standard deviation
resulted in good lower and upper bound su profiles, respectively.
The average Nkt and Nu provides the most comparable su profile to the laboratory testing
results. The task then becomes determining whether or not the difference in su between the CPTu
and the laboratory testing (and assuming that the laboratory testing is the "correct" value) is
acceptable. Figure 8.24 and Figure 8.25 illustrate the difference between su predicted using the Nkt
and Nu average values varies in magnitude from 0 to close to an 800 psf difference. The
tolerability for differences of this magnitude in the su is a site-specific problem, which is directly
controlled by the type of geotechnical analysis being performed and its application. To illustrate
an example of this, a sensitivity analysis was performed on the su of Presumpscot clay at the
Route 26/100 Bridge using a slope stability model. The purpose of the sensitivity analysis was to
quantify the effects of selecting su from different methods as applied to a slope stability analysis,
particularly the difference in CPTu cone factors Nkt and Nu. su estimates were made using
laboratory direct simple shear (DSS) testing results, assumed su profile from H&A (2009) using
field vane shear testing (FVT) results, CPTu cone factor Nkt and CPTu cone factor Nu. The
selected Nkt and Nu values varied in order to determine the effect of changing cone factors on
slope stability.
The slope was modeled using geometry and soil profiles from "Geologic Profile A-A" (H&A
2009) of the Route 26/100 north bridge approach and using the Slide 6.0 software (RocScience,
2014). Friction angles of the fill, interbedded marine deposit, and marine sand soil layers were
assumed to be 34o, 32o, and 32o respectively. Total unit weights of the fill, interbedded marine
331
deposit, and marine sand soil layers were assumed to be 130, 125, and 120 pounds per cubic feet
(pcf) respectively. These assumed parameters are within typical ranges of properties for these
soils and have little effect of the resulting factors of safety of the slope.
The Presumpscot clay deposit was divided into twelve layers, each layer representing a
"tributary" area from the undisturbed sampling depths from borings BB-FRR-BT303/BB304. A
unit weight of 111 pcf (the average value of all DSS specimens) was used for the entire profile of
Presumpscot clay for simplicity. The slope strength was modeled using a total stress analysis
(friction angle of clay = 0), which is consistent with the controlling failure mode when using
undrained shear strength. The water table elevation was assumed to be at elevation 18.3 feet,
which was reported as the "normal water" elevation (H&A, 2009). The assumed undrained shear
strength (su) in each of the 12 layers is shown in Table 8.10.
Each of the 12 layers within the Presumpscot clay deposit in the model had a different su
value. For the DSS strength model, the su determined from DSS testing (Table 4.7) was used in
each layer. For the FVT model an assumed su profile was applied to each layer based on the FVT
test results. For the CPTu cone factor model, the resulting su profiles from the assumed cone
factors (Figure 4.15) were applied to each layer. The resulting factor of safety for each strength
model is summarized in Table 8.11.
It should be noted that the slope geometry, soil properties, and general site conditions
used in the model are hypothetical conditions used to create the sensitivity analysis based on the
authors' interpretations. Hence, the resulting factors of safety do not represent actual site
condition at the Route 26/100 Bridge and are intended for educational comparative purposes only.
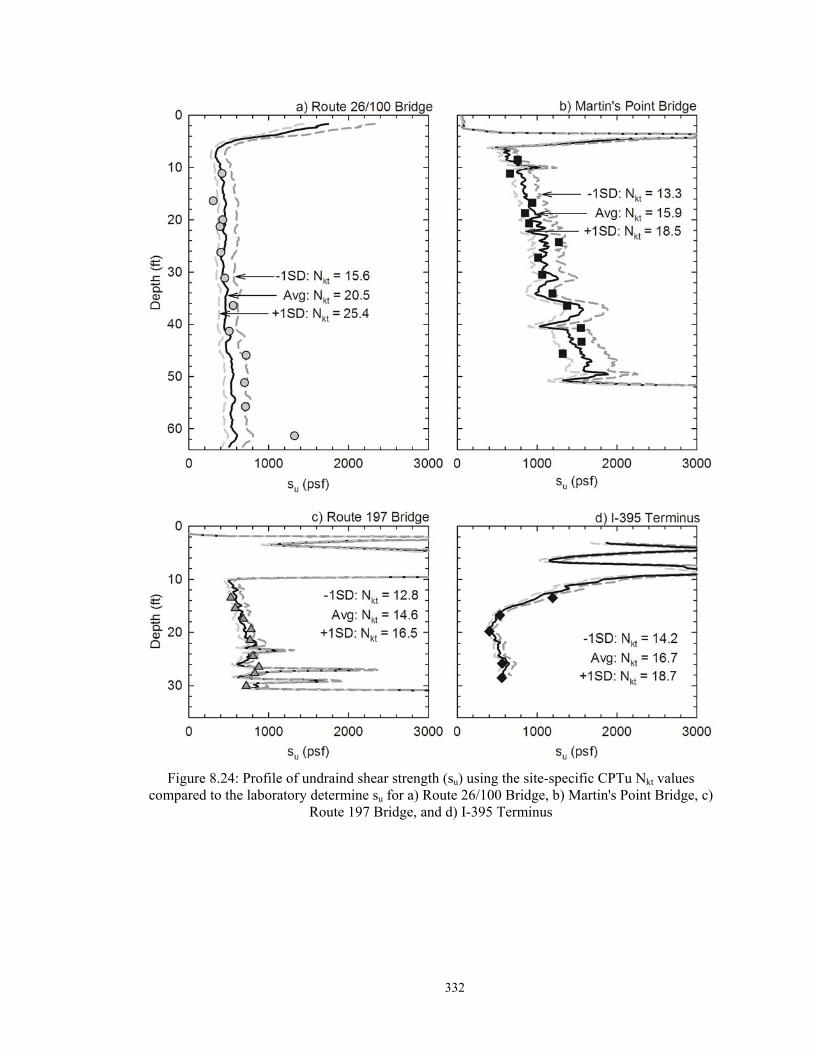
332
Figure 8.24: Profile of undraind shear strength (su) using the site-specific CPTu Nkt values compared to the laboratory determine su for a) Route 26/100 Bridge, b) Martin's Point Bridge, c)
Route 197 Bridge, and d) I-395 Terminus

333
Figure 8.25: Profile of undraind shear strength (su) using the site-specific CPTu Nu values compared to the laboratory determine su for a) Route 26/100 Bridge, b) Martin's Point Bridge, c)
Route 197 Bridge, and d) I-395 Terminus.
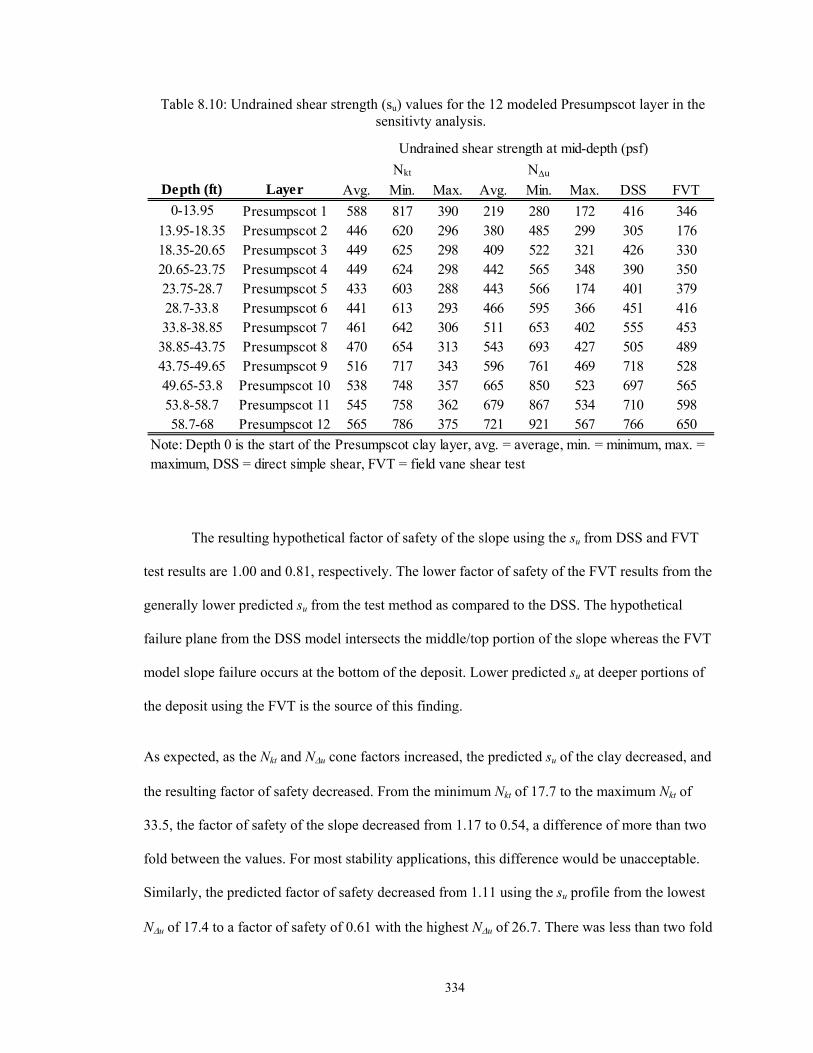
334
Table 8.10: Undrained shear strength (su) values for the 12 modeled Presumpscot layer in the sensitivty analysis.
The resulting hypothetical factor of safety of the slope using the su from DSS and FVT
test results are 1.00 and 0.81, respectively. The lower factor of safety of the FVT results from the
generally lower predicted su from the test method as compared to the DSS. The hypothetical
failure plane from the DSS model intersects the middle/top portion of the slope whereas the FVT
model slope failure occurs at the bottom of the deposit. Lower predicted su at deeper portions of
the deposit using the FVT is the source of this finding.
As expected, as the Nkt and Nu cone factors increased, the predicted su of the clay decreased, and
the resulting factor of safety decreased. From the minimum Nkt of 17.7 to the maximum Nkt of
33.5, the factor of safety of the slope decreased from 1.17 to 0.54, a difference of more than two
fold between the values. For most stability applications, this difference would be unacceptable.
Similarly, the predicted factor of safety decreased from 1.11 using the su profile from the lowest
Nu of 17.4 to a factor of safety of 0.61 with the highest Nu of 26.7. There was less than two fold
Depth (ft) Layer Avg. Min. Max. Avg. Min. Max. DSS FVT
0-13.95 Presumpscot 1 588 817 390 219 280 172 416 34613.95-18.35 Presumpscot 2 446 620 296 380 485 299 305 17618.35-20.65 Presumpscot 3 449 625 298 409 522 321 426 33020.65-23.75 Presumpscot 4 449 624 298 442 565 348 390 35023.75-28.7 Presumpscot 5 433 603 288 443 566 174 401 37928.7-33.8 Presumpscot 6 441 613 293 466 595 366 451 41633.8-38.85 Presumpscot 7 461 642 306 511 653 402 555 453
38.85-43.75 Presumpscot 8 470 654 313 543 693 427 505 48943.75-49.65 Presumpscot 9 516 717 343 596 761 469 718 52849.65-53.8 Presumpscot 10 538 748 357 665 850 523 697 56553.8-58.7 Presumpscot 11 545 758 362 679 867 534 710 59858.7-68 Presumpscot 12 565 786 375 721 921 567 766 650
Note: Depth 0 is the start of the Presumpscot clay layer, avg. = average, min. = minimum, max. = maximum, DSS = direct simple shear, FVT = field vane shear test
Nkt Nu
Undrained shear strength at mid-depth (psf)
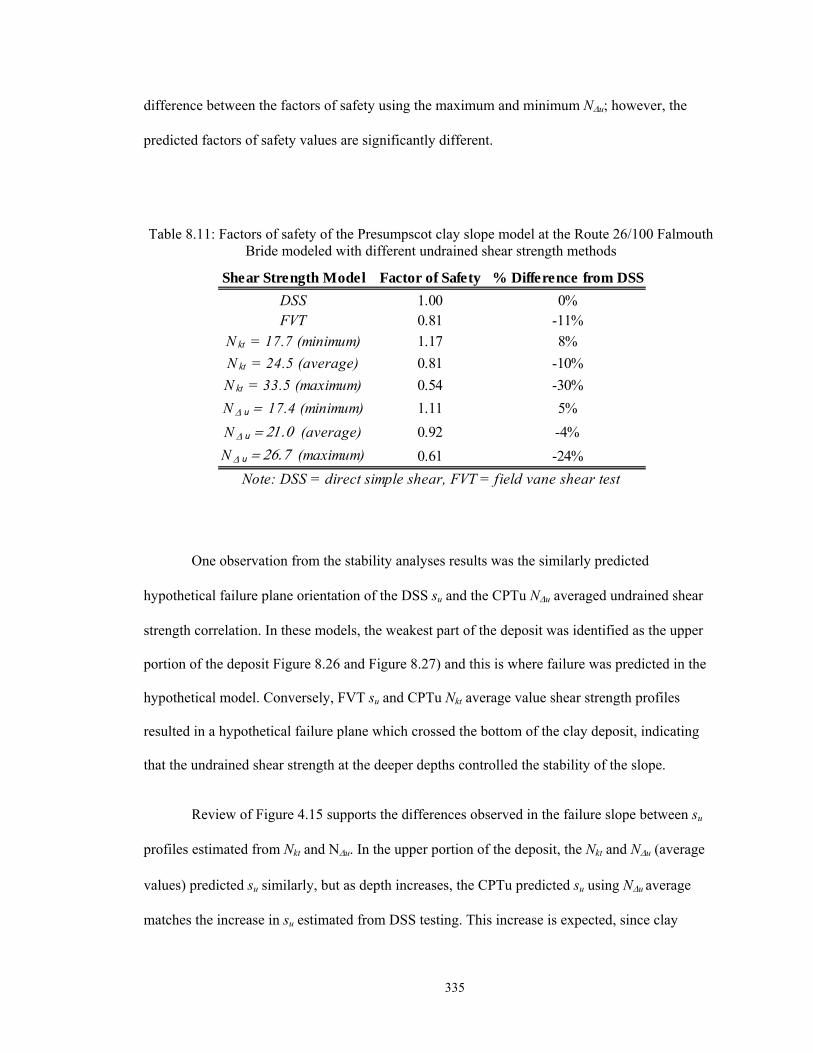
335
difference between the factors of safety using the maximum and minimum Nu; however, the
predicted factors of safety values are significantly different.
Table 8.11: Factors of safety of the Presumpscot clay slope model at the Route 26/100 Falmouth Bride modeled with different undrained shear strength methods
One observation from the stability analyses results was the similarly predicted
hypothetical failure plane orientation of the DSS su and the CPTu Nu averaged undrained shear
strength correlation. In these models, the weakest part of the deposit was identified as the upper
portion of the deposit Figure 8.26 and Figure 8.27) and this is where failure was predicted in the
hypothetical model. Conversely, FVT su and CPTu Nkt average value shear strength profiles
resulted in a hypothetical failure plane which crossed the bottom of the clay deposit, indicating
that the undrained shear strength at the deeper depths controlled the stability of the slope.
Review of Figure 4.15 supports the differences observed in the failure slope between su
profiles estimated from Nkt and Nu. In the upper portion of the deposit, the Nkt and Nu (average
values) predicted su similarly, but as depth increases, the CPTu predicted su using Nu average
matches the increase in su estimated from DSS testing. This increase is expected, since clay
Shear Strength Model Factor of Safety % Difference from DSS
DSS 1.00FVT 0.81
N kt = 17.7 (minimum) 1.17
N kt = 24.5 (average) 0.81
N kt = 33.5 (maximum) 0.54
N u 17.4 (minimum) 1.11
N u (average) 0.92
N u (maximum) 0.61
0%-11%
8%
-10%
-30%
5%
-4%
-24%
Note: DSS = direct simple shear, FVT = field vane shear test
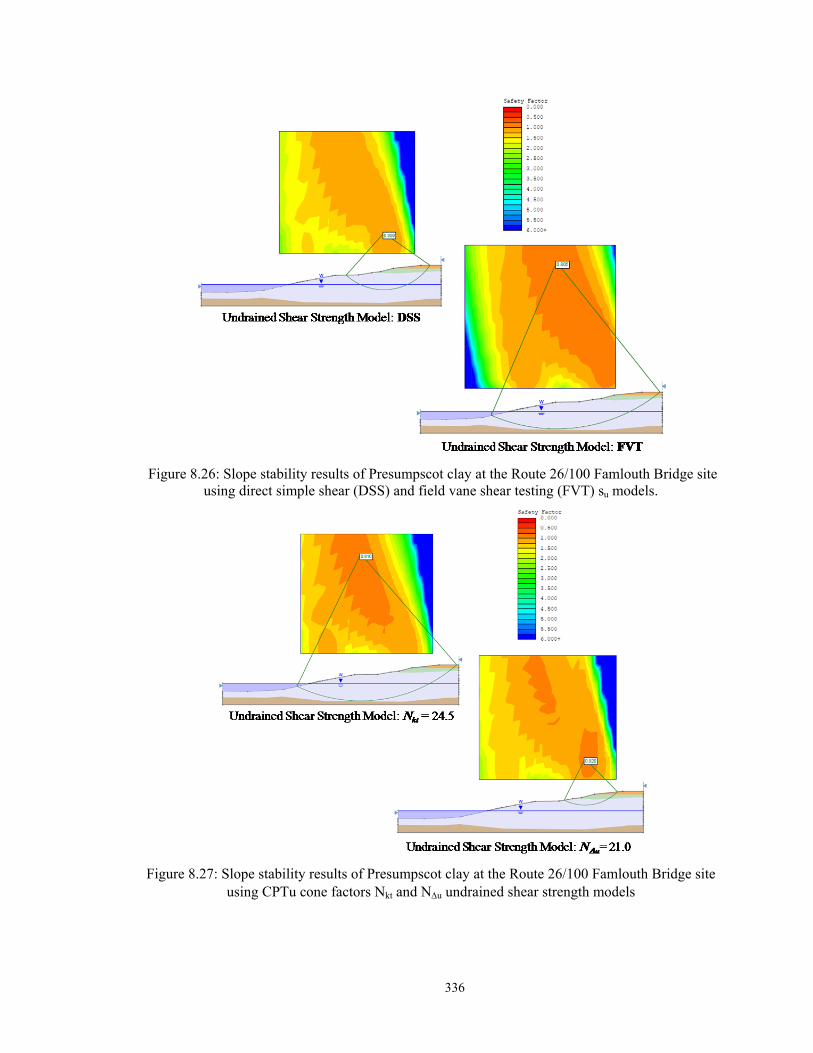
336
Figure 8.26: Slope stability results of Presumpscot clay at the Route 26/100 Famlouth Bridge site using direct simple shear (DSS) and field vane shear testing (FVT) su models.
Figure 8.27: Slope stability results of Presumpscot clay at the Route 26/100 Famlouth Bridge site using CPTu cone factors Nkt and Nu undrained shear strength models

337
deposits which are relatively normally consolidated (such as the deposit at Route 26/100
Bridge) typically increase in su with increasing overburden pressure. However, CPTu predicted su
using Nkt did not identify this increase with depth and remained relatively constant with depth.
This explains the under-prediction of su near the bottom of the deposit, and hence the failure
plane intersecting this location. The su profile estimated from FVT results had a similar effect.
In general, the CPTu predicted su using average Nkt and Nu provided lower but relatively
similar factors of safety than the su using the DSS values. From the model, the average Nu gave
only a 0.04% difference from the DSS factor of safety. Factor of safety using the FVT and
average Nkt were identical. Minimum and maximum Nkt and Nu values resulted in a large
variation in factors of safety of the hypothetical slope, ranging from as low as 0.54 to 1.17. This
indicates the risk involved with using only one su data point to correlate to CPTu results and
reinforces the importance of addition data points for improved average values.
8.5.4 Shear Strength Summary
To summarize the CPTu shear strength section, the section began by presenting the Nkt
and Nu values determined at each site and the corresponding maximum, minimum, coefficient of
variation, and standard deviation. This included the results from both the laboratory testing and
the FVT. The laboratory data showed less scatter than the FVT data. It was identified that the
average Nkt and Nu values applied to each CPTu profile provided reasonable estimates of the su
profile, but the level of acceptability is a site-specific issue. To illustrate this, a sensitivity
analysis was performed using Nkt and Nu values (compared to laboratory and FVT) of the Route
26/100 Bridge applied to a slope stability analysis of Presumpscot clay. Preference between Nkt
and Nu was not directly apparent, however, Presumpscot clay deposits with higher sensitivity
provided smaller COV values for Nu and non-sensitive sites provided smaller COV values for
Nkt. This may be fortuitous; however, and it should be explored further.
338
Since an extensive laboratory testing program such as the ones performed at the sites in
this thesis are not typically available to geotechnical engineers, the second portion of the section
presented potential methods for determining Nkt and Nu values from additional measured
properties. This included the use of the FVT, correlation to index properties, and a theoretical
analysis from Been et al., (2010) using a Nkt-k-value-SHANSEP relationship. These resulting
correlations were compared to similar studies in other clays to determine if other correlations
could be utilized in the Presumpscot clay.
For CPTu interpretation in Presumpscot clay, the following process is recommended for
collecting high quality information to develop CPTu correlations to su:
Avoid using published correlations and ranges of Nu values. In general, the
values in the Presumpscot clay were higher than most recommended ranges.
Published ranges show values to generally be between 4 and 10, whereas
resulting Nu(CAUC) values in this research ranged from 5.0 to 18.1, with average
values from each of the four sites being larger than 10. Conversely, the Nkt values
from the research fit it better with recommended ranges, which are generally
from 10 to 20. Nkt(CAUC) site averages ranged from 14.6 to 16.8.
Collect high quality undisturbed tube samples at routine intervals across the
entire depth of the Presumpscot from a single boring located in a region of the
site with typical conditions (as determined by prior CPTu testing). Measure su
using CAUC triaxial shear and back-calculate both Nkt and Nu values for use
across the entire site with other CPTu profiles, including those with non-typical
results. More than one sample should be collected and tested and the average Nkt
and Nu values respectively. If desired, the CPTu can be performed prior to the
339
borings in order to identify the Presumpscot layer thickness and any soft or
unusual zones which should be included in the sampling procedures.
Field vane tests (FVT) are a staple of investigations in the Presumpscot and
should continue to be performed across the site, particularly in areas adjacent to
the corresponding CPTu sounding (but at least 20 CPTu hole diameters away)
and undisturbed sample boring, as well as in locations identified as having
variability to obtain other direct measures of su. FVTs are less costly and provide
real-time estimates of su, although as shown in this study they are more variable
and may present both higher and lower su values than higher quality samples
tested under controlled stress and strain conditions in the laboratory. su from
FVTs can additionally be used to assess Nkt and Nu values for correlation to su
strength from nearby CPTu profiles if design using FVT strength is desired.
Utilize both the Nkt and Nu CPTu factors in su analyses. Both factors provided
similar su profiles when the average values were used, so the use of both factors
will provide redundancy.
Been et al., (2010) analysis did not provide reasonable predictions of Nkt. This is
thought to be due to the inconsistency of su and OCR predicted of the
Presumpscot clay using the SHANSEP relationship on which the Been et
al.,(2010) method is based.
Check the resulting Nu values with the following correlations which were
determined specifically for the Presumpscot clay based on results from the four
research sites:
o Nu vs. Bq (Equations 8.17 and 8.18)
o Nu vs. OCR and St (Equations 8.19 and 8.20)
340
Correlations between Nkt and Plasticity Index (PI), OCR, and Bq found in the
literature should not be used, as they have been shown in this study to be
inconsistent for Presumpscot clay.
8.6 Seismic Characteristics
Seismic measurements were made during cone penetration testing (SCPTu) at the four
research sites. Shear wave velocity (Vs) was measured at discrete, 3.28 ft intervals and is shown
for the four sites together in Figure 8.28. With values of total unit weight measured from intact
CRS consolidation samples at the natural water content and su measured from laboratory shear
strength testing (CAUC/DSS), small strain shear modulus (Go) and rigidity index (Ir) were
calculated for each depth where Vs , t, and su were measured. Vs, G0, and Ir are presented in
Figure 8.28 to provide expected ranges of the values for the Presumpscot clay.
Vs ranged from 364 ft/s to 1050 ft/s at all four of the research sites. The increases with
depth are likely due to the increase in overburden stress. G0 ranged from 450 ksf to 3748 ksf and
also increased with depth due to overburden stresses. A report by Long and Donohue (2008)
studied 11 Norwegian clay sites using both surface waves and CPTu to obtain Vs values. The
studied clay ranged from 17% to 60% clay, had OCR of 1.0 to 6.0, and sensitivities ranging from
2 to 1000. Values of Vs in the study ranged from 131 ft/s to 1,148 ft/s and G0 values ranged from
56 ksf to 5,140 ksf. In general, the ranges of both Vs and G0 for the Norwegian soils are similar to
the Presumpscot clay. Long and Donohue (2008) also suggested that G0 and OCR and G0 and
void ratio (e0) are related for clays, which is illustrated in Figure 8.28 for the Presumpscot clay.
Neither of the relationships appeared to be applicable to the Presumpscot clay.

341
Figure 8.28 Measurements of a) Shear wave velocity (Vs) b) Small strain shear modulus (G0) and c) Rigidity index (Ir) in the Presumpscot clay.
Rigidity index (Ir) is defined as the small strain shear modulus (G0) divided by the su and
provides a relative measure of shear stiffness. Ir effects primarily the rate of consolidation of
clays (Lunne et al., 1997) and is used in shallow foundation design. Ir determined with su from
CAUC triaxial testing ranged from approximately 650 to 4,670 and average of 1713. Ir exhibited
no apparent trend with depth or other soil properties.
Measurements of G0 and Ir, when compared to other published data, and verify that the
tested Presumpscot clay falls into the range of typical values for soft to medium glacially
deposited clays. One advantage to measuring Vs in Presumpscot clay, which was not evaluated in
this thesis, is the ability to use those measurements to provide a Seismic Site Classification in
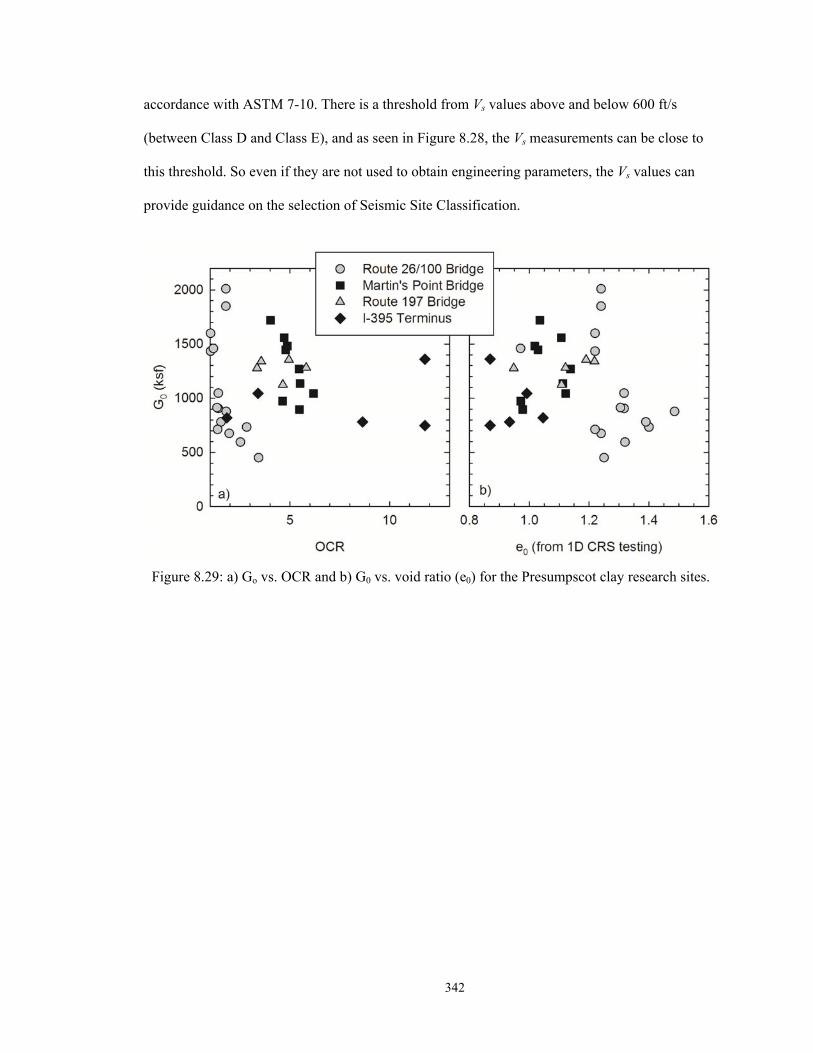
342
accordance with ASTM 7-10. There is a threshold from Vs values above and below 600 ft/s
(between Class D and Class E), and as seen in Figure 8.28, the Vs measurements can be close to
this threshold. So even if they are not used to obtain engineering parameters, the Vs values can
provide guidance on the selection of Seismic Site Classification.
Figure 8.29: a) Go vs. OCR and b) G0 vs. void ratio (e0) for the Presumpscot clay research sites.
343
9 CONCLUSIONS AND RECOMMENDATIONS
One of the greatest challenges that geotechnical engineers face in the State of Maine is
the proper characterization of the soft, silty Presumpscot clay for settlement and stability
analyses. Current practice involves measurement of soil properties at discrete locations within the
subsurface, either from field vane shear testing (FVT) or laboratory testing of disturbed and
undisturbed samples. Identification of properties at discrete locations required interpolation
between collected data, which may lead to unidentified features in a portion of the subsurface.
Additionally, the methods by which soil properties are measured rely heavily on driller and
operator procedures that are variable and thus produce information of varying quality. The cone
penetration test with pore pressure measurements (CPTu) offers quick and continuous
measurements of soil response to penetration that, with the use of correlations to engineering
properties, can assist in geotechnical design and "fill in the gaps" of discrete testing by providing
estimates of complete profiles of properties critical to design in clays such as overconsolidation
ratio (OCR) and undrained shear strength (su). The CPTu is the most robust geotechnical tool for
identifying subsurface layering, discrete low-strength and high-strength horizons (e.g. slip planes
or silt/sand seams), and groundwater conditions (hydrostatic and artesian) (DeGroot and Ladd
2010, Rogers 2006).
This chapter presents conclusions and recommendations for the use of the cone
penetration test (CPTu) for site characterization and determination of engineering properties of
the Presumpscot clay in Maine. Existing CPTu interpretation methods were evaluated by
comparing soil classification, preconsolidation pressure ('p), and undrained shear strength (su)
predicted from CPTu measurements to values obtained from laboratory testing on high quality
undisturbed samples. Recommendations for future work are presented at the end of the chapter.
Geotechnical investigations were performed at four sites containing deposits of
Presumpscot clay from coastal and inland river locations in Maine. The investigations included

344
field vane shear testing (FVT) and index and advanced laboratory testing of high quality,
undisturbed Sherbrook block or Shelby tube samples collected from each site. Specimens from all
undisturbed samples were tested for classification in accordance with the Unified Soil
Classification System (ASTM D2487), stress history (e.g., 'p and OCR) using constant rate of
strain (CRS) consolidation testing, and undrained shear strength (su) using triaxial compression
and direct simple shear (DSS) testing. Cone penetration testing with pore pressure measurements
(CPTu) was performed adjacent to borings where FVT and sampling was conducted during each
investigation in order to correlate measured properties of the clay to the CPTu results.
9.1 Non-parametric CPTu Interpretations
Continuous measurements of tip resistance, sleeve friction, and pore pressure provided
during CPTu profiling can be used to inform on the nature of Presumpscot clay deposits before
the data is interpreted and correlated to engineering parameters. Granular and cohesive (i.e., clay
and silt) soils yield different CPTu measurements (e.g. sands yield higher tip and sleeve friction,
low to no excess pore water pressure), thus transitions between Presumpscot clay and
underlying/overlying deposits is evident directly from the CPTu sounding. Groundwater
conditions can also be identified during a CPTu. If penetration is occurring in a free-draining soil,
the measured pore pressure can be extrapolated to a groundwater surface elevation. Additionally,
if artesian pressures are present, they can be identified from the measured pore pressure CPTu
profile. Furthermore, within the Presumpscot clay, overconsolidation ratio (OCR) has been found
to relate directly to the normalized tip resistance (Qt). Therefore, the transition from the upper
stiff and/or desiccated zone into the lower softer zone or any significant changes in
overconsolidation will be evident from CPTu soundings. Additionally, if any zones, layer, or
pockets within a Presumpscot clay deposit result in fluctuating CPTu measurements, this may
indicate silt/sand seams or softer pockets of Presumpscot clay. The identification of "typical"
conditions, as well as variations or discontinuous conditions through CPTu profile can be useful
345
for planning further investigations of the site using other in situ tests or sampling and laboratory
testing programs to identify typical or problematic conditions at the site.
9.2 Classification of Soil Type
Classification charts based on the relationship between CPTu measurements of
normalized tip resistance (Qt) and normalized pore pressure (Bq) best classify the Presumpscot
clay in this study. In particular, the Schneider et al. (2008) analysis performed best at classifying
and highlighting the potential for sensitivity of the Presumpscot clays studied. Current
geotechnical practice typically uses the Robertson (1990) normalized tip resistance (Qt) vs. sleeve
friction ratio (Fr), however, the findings from the study soil indicate that this analysis was less
consistent compared to classification analyses based on normalized tip resistance (Qt) vs.
normalized pore pressure (Bq). If the Robertson (1990) Qt-Fr and Qt-Bq analyses are used for
classification of the Presumpscot clay from CPTu measurements, the results from this study
suggest that data can be expected to generally plot within Region 4 "clayey silt and silty clay"
within the plot using Qt-Fr analysis and generally plot within Region 3 "clay to silty clay" within
the plot using Qt-Bq analysis. These are both consistent with the Unified Soil Classification
System characterization of the majority of the specimens tested as low plasticity clay, CL. When
classifying clay soils based on Fr, the SBT charts are relying on a measurement which may range
from 0 psf to approximately 500 psf (see Figure 8.3 for the sleeve friction measurements at the
Presumpscot clay sites in this study), whereas pore pressure measurements can exceed 20,000 psf
(or more, depending on the depth of the deposit and other characterisics, see Figure 8.3 for the
pore pressure measurements at the Presumpscot clay sites in this study). Therefore, classification
based on pore pressure as opposed to sleeve friction allows for a more specific classification
based on precise measurements. It should be additionally noted that Qt-Bq SBT classification was
found to be more reliable than Qt-Fr classification, which agrees with published literature (Long,
2008). Sleeve friction is generally a less reliable measurement than pore pressure due to the
346
following factors: pore pressure effects on the end of the sleeve; tolerance in dimensions between
the cone and the sleeve; surface roughness of the sleeve; load cell design and calibration (Lunne
et al., 1997).
Because of the limited amount of sensitive clay soils encountered in this study, additional
research should be conducted using more sensitive Presumpscot deposits before the "sensitive
clay" regions of the Schneider et al., (2008) and Robertson (1990) Bq-Qt classification analyses
are used to confidently identify sensitivity of Presumpscot clay. Two of the four sites in this study
contained sensitive clay (ranging from 9 to greater than 100), and both of these sites plotted
consistently within the sensitive clay region of the Schneider et al. (2008) Qt-Bq analysis, but did
not plot within the sensitive clay region of the Robertson (1990) Qt-Bq analysis. Moreover, some
data points from a non-sensitive deposit of Presumpscot clay plotted within the sensitive clay
region of the Schneider et al., (2008) plot. Further studies should consist of performing CPTu in
Presumpscot clay deposits with known high sensitivity and comparing their performance using
both the Schneider et al., (2008) and the Robertson (1990) Qt-Bq classification analyses to further
assess the ability of the charts to differentiate between sensitive and non-sensitive deposits of
Presumpscot clay.
9.3 CPTu Correlation to Stress History
The k-value method using normalized tip resistance, Qt, and a constant, k, provided
reasonable first-order estimates of 'p and OCR of the Presumpscot clay when compared with 'p
measured during constant rate of strain (CRS) one-dimensional consolidation testing. k-value
ranged from 0.19 to 0.55 across the profiles from the four sites, and agreed well with the typical
range of values of 0.20 to 0.50 as suggested by Lunne et al. (1997). Analyses to identify potential
relationships between changing k-values and measured index and engineering properties of the
Presumpscot did not yield any clear relationships between the k-value and index properties or su,
however, a potential relationship was established between k-value and OCR (i.e., 'p/'v0), which
347
should be explored by additional research. Results from this study suggest that the k-value may
increase in magnitude as OCR increases from 1.0 to 4.0 (where this is also an expected increase
in K0 or lateral earth pressure at rest), and a weak trend of k-value decreasing or remaining
constant with increased OCR for OCR values greater than 4.
The range in k-values, both from an individual site and between sites, from this study
illustrates the importance of developing and using site-specific correlations for more than an
initial investigation. A first order estimate of 'p and OCR using a k-value of 0.33 recommended
by Mayne (2014) provides a reasonable estimate of stress history from CPTu results. In general, a
k-value of 0.33 resulted in underestimates of 'p and OCR, which would cause overestimates of
settlement magnitudes in the Presumpscot clay.
The resulting average k-values for the Route 26/100 Bridge site is 0.32, for Martin's Point
Bridge is 0.38, for Route 197 Bridge is 0.45, and for the I-395 Terminus is 0.28. The resulting
standard deviation in k-values was 0.06 for Route 26/100 Bridge and 0.07 for the remaining three
sites. The average and standard deviation for data from all four sites is 0.36 and 0.10,
respectively. A sensitivity analysis was performed for settlement of a hypothetical load at the I-
395 Terminus site using both the measured laboratory stress history, and CPTu k-values
representing the minimum, maximum, and average k-values determined from CPTu-stress history
correlations for that site that were applied to the CPTu profile. The sensitivity analysis results
illustrated that the settlement estimated from both the average and the maximum k-values
compared well with the laboratory results for a broad range of additional total stresses, whereas
the minimum k-value severely overestimated the settlement magnitudes.
It is recommended that a k-value of 0.33 be used for preliminary estimates OCR and 'p -
profiles in Presumpscot clay. If the OCR and 'p values are used in geotechnical design/analyses,
they should be verified by laboratory consolidation testing on high quality undisturbed samples.
348
Furthermore, a site-specific sensitivity analysis should be formulated to determine the effect of a
changing k-value on resulting factors of safety in order to determine the need for sampling to
narrow the site-specific k-value. The correlations presented by Saye et al., (2013) using Liquid
Limit (LL) and Plasticity Index (PI) did not provide an appropriate method for determining OCR
and 'p profiles based on index test results in the Presumpscot clay because the LL and PI do not
differ much from site to site.
9.4 CPTu Correlation to Undrained Shear Strength
Undrained shear strength CPTu correlation factors Nkt, Nke, and NuEquations 8.15
through 8.16) were determined for the Presumpscot clay at the four research sites using reference
undrained shear strength (su) obtained from triaxial compression (TC) and direct simple shear
(DSS) laboratory testing on high quality, undisturbed samples and field vane shear testing (FVT)
performed in situ. Findings from this study suggest that Nke provides an unreliable correlation. Nke
provided poor and inconsistent estimates of su of Presumpscot clay, since the difference between
measured tip resistance and pore pressure (from which the cone factor is derived) is often very
small, especially in sensitive clay deposits.
Study findings identify that typical values recommended from the geotechnical literature
of Nkt and Nu overestimate su for Presumpscot clay, as CPTu-su correlated factors Nkt and Nu
from the four sites were within the upper range of, and above, of the range of typical values from
similar studies in soft clay, particularly for Nu. The resulting average Nkt(CAUC) for the Route
26/100 Bridge site is 16.8, for Martin's Point Bridge is 15.9, for Route 197 Bridge is 14.6, and for
the I-395 Terminus is 16.7. The resulting standard deviations are 4.0, 2.6, 1.9, and 2.0 for these
data, respectively. The resulting average Nu(CAUC) for the Route 26/100 Bridge site is 14.1, for
Martin's Point Bridge is 9.7, for Route 197 Bridge is 14.1, and for the I-395 Terminus is 10.9.
The resulting standard deviations are 1.9, 2.1, 1.6, and 2.0 for these data, respectively. The
349
resulting average and standard deviation Nk(DSS) are 20.5 and 4.9 and the resulting average and
standard deviation Nu(DSS) are 17.3 and 2.3. Coefficients of variation (COV) for Nkt was lowest
for non-sensitive site and COV for Nu was lowest for sensitive clay sites. The potential for this
reliability correlation (i.e. higher effectiveness of Nu for sensitive deposits and Nkt for non-
sensitive deposits) should be investigated further.
Reference su (TC vs. DSS vs. FVT) had a large influence on the resulting undrained shear
strength cone factors. Cone factors developed using su measured from DSS testing for the Route
26/100 site (approximately 74% of the su value from TC, Ladd and DeGroot 2003) was compared
to cone factors developed using the correlated estimated TC testing su. It was found that the
average CPTu cone factors Nkt and Nu both increased in magnitude by greater than 5. CPTu cone
factor Nkt(CAUC) from all four sites ranged from 11.0 to 25.7 and cone factor Nu(CAUC) ranged from
5.0 to 18.1. CPTu cone factor Nkt(DSS) ranged from 15.0 to 31.4 and cone factor Nu(DSS) ranged
from13.6 to 22.1.The higher Nkt and Nu from DSS testing as compared to CAUC testing derived
from the su measured in the laboratory procedure. In CAUC testing, the deviator stress is directly
vertical (0o), where the deviator stress for DSS testing is somewhere between 30o and 60o
(DeGroot and Ladd, 2010), which results in a separate measurement of su and subsequently Nkt
and Nu.
Nkt(FVT) and Nu(FVT) provided relatively similar average values compared to the Nkt(CAUC)
and Nu(CAUC) factors when enough FVT were performed, however the standard deviation and
coefficient of variation was larger (indicating larger data scatter). Laboratory determined su (i.e.
CAUC and DSS testing) is the most reliable reference shear strength because the sample quality
of the tested specimens can be determined. In addition, the boundary conditions and testing
procedures of laboratory tests can be well controlled, whereas the FVT can have some
unexpected influences of testing error or unforeseen site conditions (such as a silt or sand seam
350
within the tested sample, which can easily be observed before testing is conducted on laboratory
samples).
No correlations were found to exist between cone factor Nkt and clay properties such as
Plasticity Index (PI), OCR, or su for the Presumpscot clay. However, findings from the study
suggest that a potential relationship exists between OCR and Nu and a moderate to strong
relationship exists between normalized pore pressure Bq, sensitivity (St) and Nu (Figure 8.20,
Equations 8.17 through 8.20)
A sensitivity analysis using a range of both Nkt and Nu was performed using a slope
stability model to identify just how important choice of a CPTu cone factor to estimate the design
undrained shear strength of a deposit of Presumpscot clay. The slope was modeled using
geometry and soil profiles from "Geologic Profile A-A" (H&A 2009) of the Route 26/100 north
bridge approach and using the computer program Slide 6.0 (RocScience, 2014). The undrained
shear strength profile was modeled by dividing the Presumpscot clay into 12 layers represented
by laboratory DSS su, FVT su, and the correlated CPTu su determined using the average,
minimum and maximum Nkt and Nu cone factors. As expected, as the Nkt and Nu cone factors
increased, the predicted su of the clay decreased, and the resulting factor of safety of the slope in
the hypothetical analysis decreased. From the minimum Nkt of 17.7 to the maximum Nkt of 33.5
correlations for this site, the factor of safety of the slope decreased by 30%. For most stability
applications, this difference would be unacceptable. Similarly, the predicted Nu factor of safety
decreased by 20% when changing su from that determined using the lowest Nu value of 17.4 to
the highest Nu value of 26.7. There was not as much of a difference in these two values as
compared to the Nkt; however, the predicted factors of safety values were still significantly
different. For determining the appropriate Nkt and Nu cone factors at a Presumpscot clay deposit,
the best method is to collect high quality undisturbed samples at multiple depths within a deposit,
351
determine laboratory values of su using CAUC testing methods from these samples, and back-
calculate Nkt and Nu factors to apply to the profile for that specific deposit. Multiple su values
should be determined since Nkt and Nu was found to vary with depth, and the resulting average
values provided good correlations. Furthermore, it is ideal to corroborate the Nkt and Nu factors
with FVT results from nearby borings. FVT should be performed as closely to the CPTu as
possible (although not any closer than 20 CPTu hole diameters) and in accordance with
applicable ASTM standards to achieve reliable results. The resulting Nkt and Nu average value
from FVT should match reasonably well with the values obtained from laboratory testing. For a
conservative analysis, the higher value can be used.
Another important observation from the stability analyses results was the similarly
predicted failure plane orientation between the soil modeled using the DSS su results and the soil
modeled using the CPTu su profile estimated using Nu(DSS). In these models, the weakest part of
the deposit was identified as the upper portion of the deposit (Figure 8.26 and Figure 8.27) and
this is where the failure occurred. Conversely, the soil models based on FVT su and the CPTu su
estimated using Nkt(DSS) resulted in a failure plane that crossed the bottom of the clay deposit,
indicating from the results of these shear strength models that the undrained shear strength at the
deeper depths controls the stability of the slope. For this particular site it appears that Nu is a
more appropriate cone factor to use to represent laboratory su measurements.
For CPTu interpretation in Presumpscot clay, the following process is recommended for
collecting high quality information to develop CPTu correlations to su:
Avoid using published correlations and ranges of Nu values. In general, the
values in the Presumpscot clay were higher than most recommended ranges.
Published ranges show values to generally be between 4 and 10, whereas
resulting Nu(CAUC) values in this research ranged from 5.0 to 18.1, with average
352
values from each of the four sites being larger than 10. Conversely, the Nkt values
from the research fit in better with recommended ranges, which are generally
from 10 to 20. Nkt(CAUC) site averages ranged from 14.6 to 16.8.
Collect high quality undisturbed tube samples at routine intervals across the
entire depth of the Presumpscot from a single boring located in a region of the
site with typical conditions (as determined by prior CPTu testing). Measure su
using CAUC triaxial shear and back-calculate both Nkt and Nu values for use
across the entire site with other CPTu profiles, including those with non-typical
results. More than one sample should be collected and tested and the average Nkt
and Nu values respectively. If desired, the CPTu can be performed prior to the
borings in order to identify the Presumpscot layer thickness and any soft or
unusual zones which should be included in the sampling procedures.
Field vane tests (FVT) are a staple of investigations in the Presumpscot and
should continue to be performed across the site, particularly in areas adjacent to
the corresponding CPTu sounding (but at least 20 hole diameters away) and
undisturbed sample boring, as well as in locations identified as having variability
to obtain other direct measures of su. FVTs are less costly and provide real-time
estimates of su, although as shown in this study they are more variable and may
present both higher and lower su values than higher quality samples tested under
controlled stress and strain conditions in the laboratory. su from FVTs can
additionally be used to assess Nkt and Nu values for correlation to su strength
from nearby CPTu profiles if design using FVT strength is desired.
Utilize both the Nkt and Nu CPTu factors in su analyses. Both factors provided
similar su profiles when the average values were used, so the use of both factors
will provide redundancy and corroborate su at the site.
353
Check the resulting Nu values with the following correlations which were
determined specifically for the Presumpscot clay based on results from the four
research sites:
o Nu vs. Bq (Equations 8.17 and 8.18)
o Nu vs. OCR and St (Equations 8.19 and 8.20)
Correlations between Nkt and Plasticity Index (PI), OCR, and Bq found in the
literature should not be used, as they have been shown in this study to be
inconsistent for Presumpscot.
9.5 Shear Stiffness
Shear wave velocity, Vs, ranged from 364 ft/s to 1050 ft/s and showed a general increase
with depth for all four of the research sites. These values indicate that the Presumpscot deposits
studied are soft to stiff clay. Small strain shear modulus, G0, ranged from 450 ksf to 3748 ksf and
showed a general increase with depth and overburden stresses at each of the four sites. These
values of G0 indicate the soil is "young, uncemented clay" (Long and Donohue, 2008). The
resulting G0 values did not appear to correlate with OCR or void ratio. It is important to note that
while some correlations exist in the literature that can be used to estimate G0 from CPTu
measurements of tip resistance and void ratio, however G0 is extremely site dependent and the
recommendations of this study is that Vs measurements be made and G0 subsequently correlated
with actual measurement s of soil density determined from undisturbed tube samples. Note that
the soil classifications from the Vs and G0measurements were taken from Long and Donohue
(2010). The combination of G0 and measured su(CAUC) yields the rigidity index, Ir. Values of Ir
range from 650 to 4,670 between the four sites.
One advantage to measuring Vs in Presumpscot clay, which was not discussed in depth in
this thesis, is the ability to use those measurements to provide a Seismic Site Classification in
accordance with ASTM 7-10. There is a threshold from Vs values above and below 600 ft/s
354
(between Class D and Class E), and as seen in Figure 8.28, the Vs measurements can be close to
this threshold. Therefore, if the seismic measurements are not used to obtain engineering
parameters, Vs values can provide guidance on the selection of Seismic Site Classification.
9.6 Future Work
Correlations were made between the CPTu and engineering properties of the
Presumpscot clay as outlined in Chapter 1 of this paper. Based on the findings from this study and
the potential for increased reliability of the correlations, the following work is suggested for
future research:
1) Conduct SCPTu testing at more sites to create a larger database for which
correlations can be developed.
2) Determine if the "sensitive clay" region of the Schneider et al., (2008) plot can
consistently identify sensitive Presumpscot clay deposits using additional CPTu data
from both sensitive and non-sensitive deposits of Presumpscot clay.
3) Investigate the relationship between the stress history correlation k-value and OCR. It
appears that the two parameters may be correlated as suggested by similar research,
but further research in the Presumpscot clay is needed before a definitive conclusion
is made. Findings from this research indicate that k-value may increase with
increasing OCR for OCR < 4.
4) Confirm that the cone factors Nkt and Nu in the Presumpscot clay are consistently
higher than most published averages. A preliminary correlation between sensitivity
and cone factor emerged from the findings; however this finding may be fortuitous
since there were only four sites studied.
5) Investigate the correlations between cone factor Nu and OCR and Bq. Preliminary
findings show a potential correlation to OCR and a strong correlation to Bq. If the
correlations are further refined, the processes of selecting an appropriate Nu will

355
become more effective. Confirm Equations 8.17 through 8.20 and provide
appropriate ranges for Presumpscot clay Nu values.
356
REFERENCES
Abu-Farsakh, M. (2007). Possible Evaluation of Overconsolidation Ratio of Clayey Soils from Peizocone Penetration Tests. Geo-Denver 2007 .
Andrews, D. (1986). "The Engineering Aspects of the Presumpscot Formation," Geologic and Geotechnical Characteristics of the Presumpscot Formation Maine's Glaciomarine "Clay" Symposium, Andrews, D.W., Thompson, W.D., Sandford, T.C., and Novak, I.D., Eds. Augusta, ME, 20 March 1987, 17 pp.
American Socitety of Testing and Materials (ASTM). (2005). Soil and Rock (1): D420 - D5611. Annual Book of Standards, Volume 04.08. Philadelphia, Pennsylvania.
American Socitety of Testing and Materials (ASTM). (2007). D5778. Annual Book of Standards, Volume 04.08. Philadelphia, Pennsylvania.
Baxter, C.D.P., Bradshaw, A.S., Ochoa-Lavergne, M., and Hankour, R. (2002). "DSS Test Results Using Wire-Reinforced Membranes and Stacked Rings," GeoFlorida 2010: Advances in Analysis, Modeling, and Design (ASCE GSP 199), Orlando, Florida, February 20-24, pp. 600-607.
Becker, D. E., Crooks, J. H. A., Been, K., and Jeffries, M. G. (1987). "Work as a criterion for determining in situ and yield stresses in clays." Canadian Geotech. J., 24(4), 549-564.
Been, K., Quinonez, A., and Sancio, R. B. (2010). "Interpretation of the CPT in engineering practice." 2nd International Symposium on Cone Penetration Testing, Huntington Beach, CA. 19 p.
Belknap, D. F. (1987). "Presumpscot Formation Submerged on the Maine Inner Shelf," Geologic and Geotechnical Characteristics of the Presumpscot Formation Maine's Glaciomarine "Clay" Symposium, Andrews, D.W., Thompson, W.D., Sandford, T.C., and Novak, I.D., Eds. Augusta, ME, 20 March 1987, 18 pp.
Borns Jr., H. W., Doner, L. A., C, C., Jacobson Jr., G. L., Kaplan, M. R., Kreutz, K. J., . .Weddle, T. K. (2004). The Deglatiation of Maine, USA. Orono: Elselvier B.V. Boylan, N., Long, M., Ward, D., Barwise, A., and Georgious, B. (2007). "Full flow penetrometer testing in Bothkennar Clay." Proceedings of the 6th International Conference, Society of Underwater Technology, Offshore Site Investigations and Geotechnics (SUT-OSIG), London, September: pp. 177-186.
357
Butcher, A.P., Campanella, R.G., Kaynia, A.M. and Massarsch, K.R. (2005). "Seismic cone downhole procedure to measure shear wave velocity." Proceedings of the 10th International Conference, Society of International Society of Soil Mechanics and Geotechnical Engineering (ISSMGE), Baltic Regional Conference, Riga, Latvia, 2005 pp. 5 ConeTec. (2011). ConeTec Field Report - Martin's Point Bridge. West Berlin, NJ. Unpublished.
ConeTec. (2012). ConeTec Field Report – Route 197 Bridge Replacement Project". West Berlin, NJ. Unpublished.
ConeTec. (2013). ConeTec Field Report – Brewer Wilson. West Berlin, NJ. Unpublished.
DeGroot, D. J. (2003). "Laboratory measurement and interpretation of soft clay mechanical behavior." Soil Behavior and Soft Ground Construction; Geotech. Spec. Pub., No. 119, J.T. Germaine, T.C. Sheahan, and R.V. Whitman, Eds., ASCE, Reston, VA., 167-200.
DeGroot, D. J., & Ladd, C. C. (2010). Site Characterization of Cohesive Soil Deposits Using In Situ and Laboratory Testing. American Society of Civil Engineers , 565-607.
Devin, S.C. (1990). Flowslide potential of natural slopes in the Presumpscot Formation, M.S. Thesis, University of Maine, Orono, ME.
Devin, S. C., & Sandford, T. C. (1995, October 23-27). Landslides in Glaciomarine Clays of Coastal Maine. Landslides under static and dynamic conditions: Analysis, Monitoring and Mitigation, pp. 1-20.
Geo-Equipment, G. (2014). Instrumentation. Retrieved from Gouda Geo-Equipment: http://www.gouda- geo.com/products/instrumentation
Geonor (2010). Fall Cone Brochure:http://www.geonor.com/PDF/Fall%20Cone%20Brochure.pdf
Golder Associates Inc. (2011a). Preliminary Geotechnical Data Report – Martin's Point Bridge Replacement, Part 2. Freeport, ME.
Golder Associates Inc. (2011b). Supplemental Geotechnical Data Report – Martin's Point Bridge Replacement,. Freeport, ME.
Golder Associates Inc. (2012). Final Design Phase Geotechnical Data Report – Maine Kennebec Bridge, Richmond-Dresden, ME. Maine DOT WIN 12674.00. Freeport, ME.
Hansbo, S. (1957). "A New Approach to the Determination of the Shear Strength of Clay by the Fall-Cone Test." Proc., Royal Swedish Geotechnical Institute. 14, 1-49.
358
Haley & Aldrich (2009). "Geotechnical Design Report: Replacement Bridge over Presumpscot and Maine Central Railroad, Maine DOT PIN 15094.00, Routes 26/100 – Falmouth, Maine."
Holtz, R.D., Kovacs, W.D and Sheahan, T.C. (2011). An Introduction to Geotechnical Engineering, 2nd Ed. Pearson, Upper Saddle River, NJ.
"I-395 Terminus" 44o46'18.36" N 68o43'14.60" W. Google Earth, October, 2013. April 2014.
IGeoTest. (2014). Instrumentation. Retrieved from IGeoTest: http://igeotest.com/es/geotecnia_terrestre/instrumentacion.asp
Karlsrud, K., Lunne, T., and Brattlieu, K. (1996). Improved CPT Correlations Based on Block Samples. Reykjavik: Nordisk Geoteknikermote.
Karlsrud, K., Lunne, T., Kort, D.A. and Strandvik, S. (2005), "CPTU Correlations for Clays," Proceedings of the 16th International Conference on Soil Mechanics and Geotechnical Engineering, Osaka, September 2: pp. 693-702.
Karlsrud, K., & Hernandez-Martinez, F. (2013). Strength and Deformation Properties of Norwegian Clays from Laboratory Tests on High-Quality Block Samples. Canadian Geotechnical Journal , 50, 1273-1293.
Kelley, J., Belknap, D., Kelley, A., and Claesson, S. (2010). A Model For Drowned Terrestrial Habitats with Associated Archeological Remains in the Northwestern Gulf of Maine, USA. Elselvier.
Kim, D.S. and Stokoe II, K.H. (1995). "Deformation Characteristics of Soils of Small to Medium Strains," Proceedings of the 1st International Conference on Earthquake Geotechnical Engineering, pp. 89-94.
Ladd, C.C. (1991). "Stability evaluation during staged construction," J. Geotech. Engng. Div., ASCE, 117(4), 540-615.
Ladd, C.C. and DeGroot, D.J. (2003). "Recommended practice for soft ground site characterization: Arthur Casagrande Lecture," 12th Panamerican Conf. on Soil Mech. and Geotech. Engng., Cambridge, MA, 3-57.
Ladd, C.C., Young, G.A., Kraemer, S.R., and Burke, D.M. (1999). "Engineering properties of Boston blue clay from special testing program." Special Geotechnical Testing: Central Artery/Tunnel Project in Boston, Massachusetts. ASCE GSP 91, 1-24.
Ladd, C.C. and Foott, R. (1974). "New design procedure for stability of soft clays." J. Geotech. Engng. Div., ASCE, 100(GT7), 763-786.
359
Lambe, T., & Whitman, R. (1967). Soil Mechanics. Boston: John Wiley & Sons.
Landon, M.M. (2007). Development of a Non-Destructive Sample Quality Assessment Method for Soft Clays. Ph.D. Dissertation, University of Massachusetts Amherst, Amherst, MA.
Langlais, N.D. (2011). Site Characterization using the Seismic Piezocone in Presumpscot Clay and Development of Piezocone Correlations to Engineering Parameters, M.S. Thesis, University of Maine, Orono, ME.
Lefebvre, G. and Poulin, C. (1979). "A new method of sampling in sensitive clay." Canadian Geotech. J., 16(1), 226-233.
Long, M. (2008). Design Parameters From In Situ Tests in Soft Ground. Geotechnical and Geophysical Site Characterization – Proceeding of the 3rd International Conference of Site Characterization, 89-115.
Long, M., & Donohue, S. (2010). Characterization of Norwegian marine clays with Combined Shear Wave Velocity and Piezocone Cone Penetration Test (CPTU) Data. Canadian Geotechnical Journal , 47, 709-718.
Lunne, T., Berre, T., Andersen, K.H., Strandvik, S. and Sjursen, M. (2006). "Effects of sample disturbance and consolidation procedures on measured shear strength of soft marine Norwegian clays." Canadian Geotech. J., 43(7), 726-750.
Lunne, T., Robertson, P.K., and Powell, J. (1997). CPT and Piezocone Testing in Geotechnical Practice, Blackie Academic & Professional, London, 312 pp.
Maine DOT. (2010). Martin's Point Bridge Preliminary Geotechnical Report. Augusta, ME.
Maine Department of Transportation. (2012). Maine Kennebec Bridge Route 197 Over Kennebec River Richmond and Dresden, Maine. MaineDOT Report Fed No. AC-BH-1267(400), May 11, 2012, pp. 216
Maine Department of Transportation. (2013). Martin's Point Bridge Replacement Project. Retrieved from Maine.gov: http://www.martinspointbridge.com
"Martin's Point Bridge." 43o41'34.65" N 70o14'40.97" W. Google Earth, March 18, 2012. October 2013.
"Martin's Point Bridge." 43o41'34.65" N 70o14'40.97" W. Google Earth, September 27, 2014. March 2015.
Mayne, P.W. and Kulhawy, F.H. (1982). "K0-OCR relationships in soil." Geotech. Engng. Div. ASCE, 108(GT6), 851-872.
360
Mayne, P.W. (1991) "Determination of OCR in Clays by Piezocone Tests using Cavity Expansion and Critical State Concepts." Soils and Foundations, 31(2), pp. 65-76.
Mayne, P. (2014). Interpretation of Geotechnical Parameters from Seismic Penetrometer Tests. International Symposium on Cone Penetration Testing , (p. 27). Las Vegas.
Mitchell, J. K., & Soga, K. (2005). Fundamentals of Soil Behavior. Hoboken: John Wiley & Sons.
Morgan, M. (1987). "Highway Embankments on the Presumpcot Formation," Geologic and Geotechnical Characteristics of the Presumpscot Formation Maine's Glaciomarine "Clay" Symposium, Andrews, D.W., Thompson, W.D., Sandford, T.C., and Novak, I.D., Eds. Augusta, ME, 20 March 1987, 18 pp.
Nguyen, HQ., DeGroot, D.J. and Lunne, T. (2014). "Small Strain Shear Modulus of Marine Clays from CPT," 3rd International Symposium on Cone Penetration Testing" Symposium,. Las Vegas, NV, 12-14 May 2014, pp. 601-610
NCHRP (2007). "National Cooperative Highway Research Program (NCHRP) Synthesis 368: Cone Penetration Testing - A Synthesis of Highway Practice." Transportation Research Board,WashingtonD.C. <http://onlinepubs.trb.org/onlinepubs/nchrp/nchrp_syn_368.pdf> accessed 11/30/2011.
Remai, Z. (2013). Correlation of undrained shear strength and CPT resistance. Periodica Polytechnica, 39-44.
"Route 197 Bridge" 44o05'21.95" N 69o46'58.00" W. Google Earth, November 25, 2011. October 2013.
"Route 197 Bridge" 44o05'21.95" N 69o46'58.00" W. Google Earth, September 18, 2013. April 2014.
Robertson, P. (Director). (2012). Webinar #1: Introduction to Cone Penetration Testing (CPT) by P.K. Robertson [Motion Picture].
Roberston, P. (2009). Interpretation of Cone Penetration Tests - A Unified Approach. Canadian Geotechnical Journal, 46(1) 1337-1355.
Robertson, P. (1990). Soil Classification Using the Cone Penetration Test. Canadian Geotechnical Journal, 27(1) 151-158.
Rogers, D. (2006, May 1). Subsurface Exploration Using the Standard Penetration Test and the Cone Penetration Test. Environmental & Engineering Geoscience, XII(2), pp. 161-179.
361
Sandbǽkken, T., Berre, T., and Lacasse, S. (1985) "Oedometer testing at the Norwegian Geotechnical Institute." Consolidation of Soils: Testing and Evaluation, ASTM STP 892, 329-353.
Sandford, T.C. and Amos, J. (1987). "Engineering Analysis of Gorham Landslide," Geologic and Geotechnical Characteristics of the Presumpscot Formation Maine's Glaciomarine "Clay" Symposium, Andrews, D.W., Thompson, W.D., Sandford, T.C., and Novak, I.D., Eds. Augusta, ME, 20 March 1987, 28 pp
Saye, S. R., Lutenegger, A. J., Santos, J., & Kumm, B. P. (2013, July). Assessing Overconsolidation Ratios in Soil with Piezocone: Referencing Soil Index Properties. Journal of Geotechnical and Geoenvironmental Engineering, 139, 1075-1085.
Schneider, J.A., Randolph, M., Mayne, P., and Ramsey, N. (2008). "Analysis of Factors Influencing Soil Classification Using Normalized Piezocone Tip Resistance and Pore Pressure Parameters. Geotechnical and Geoenvironmental Engineering, 134(11) 1569-1586.
Schnitker, D.F. and Borns, H.W. (1987). "Depositional Environment and Composition of the Presumpscot Formation," Geologic and Geotechnical Characteristics of the Presumpscot Formation Maine's Glaciomarine "Clay" Symposium, Andrews, D.W., Thompson, W.D., Sandford, T.C., and Novak, I.D., Eds. Augusta, ME, 20 March 1987, 13 pp.
Terzahgi, K., Peck, R. B., & Gholamreza. (1996). Soil Mechanics in Engineering Practice. New York: John Wiley & Sons.
Thompson, W.B. (1987). "The Presumpscot Formation in Southern Maine," Geologic and Geotechnical Characteristics of the Presumpscot Formation Maine's Glaciomarine "Clay" Symposium, Andrews, D.W., Thompson, W.D., Sandford, T.C., and Novak, I.D., Eds. Augusta, ME, 20 March 1987, 22 pp.
Vertek (A division of Applied Research Associates) (2014). CPT Cones and Data Acquisition Systems. Retrieved from VertekCPT.com: http://www.vertekcpt.com/cpt-cones-and-data-acquisition- systems.
Weaver, J. (1987). "Case History: Embankment Failure at Fore River Test Section, Portland Maine," Geologic and Geotechnical Characteristics of the Presumpscot Formation Maine's Glaciomarine "Clay" Symposium, Andrews, D.W., Thompson, W.D., Sandford, T.C., and Novak, I.D., Eds. Augusta, ME, 20 March 1987, 15 pp.
Wei, L., Pant, R., Tumay, M. (2010) A Case Study of Undrained Shear Strength Evaluation from In Situ Tests in Soft Louisiana Soil. Soil Behavior and Geo-Micromechanics:. Shanghai, China, 3-5 June 2010, pp. 35-42.

362
BIOGRAPHY OF THE AUTHOR
Mathew Allen Hardison was born in Lewiston, Maine on October 21, 1990. He attended
Lisbon Elementary School, Durham Middle School, and Lisbon High School, and eventually the
University of Maine, following eerily in the steps of Stephen King. However, Mathew did not
find such a passion in writing horror novels, so he settled with geotechnical engineering.
While at the University of Maine, Mat participated in various organizations such as
ASCE Concrete Canoe Team, Chi Epsilon, Sigma Nu Fraternity, the Tutor Program, and
Graduate School Government. Throughout the first two summers of his undergraduate career,
Mat was an Engineering Technician Intern for the construction management division of Summit
Environmental Consultants performing site inspections of concrete and soils. During his third
summer between junior and senior year, Mat was a Site-Civil intern for Woodard & Curran. With
wide eyes for the "real engineering world" and the thought of a constant paycheck, Mat set his
sights on the transition from undergraduate into the civil engineering profession and brushed the
idea of graduate school under the rug. However, a mere month away from freedom, Melissa
Landon approached Mat with an enticing offer for a M.S. pursuit with research involving a new
investigation technique. Mat eventually accepted, graduated from the University of Maine in May
of 2013 and dove directly into graduate school the following month.
While in graduate school, Mat developed a passion for geotechnical engineering, which is
a relatively recently developed profession and is wide open for creative and inventive design. He
will begin work for Summit Geoengineering Services as a geotechnical engineer starting in
January of 2015. He is a candidate for Master of Science degree in Civil Engineering from the
University of Maine in August 2015.