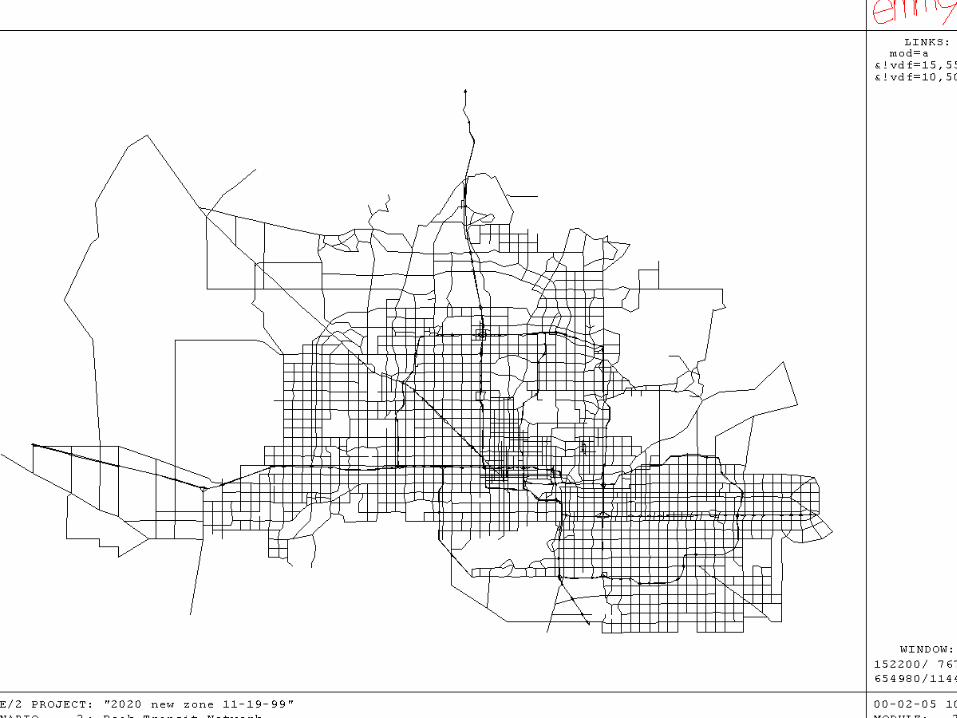
Transportation Planning Modeling with EMME/2. Interconnectedness.
61
Transportation Planning Modeling with EMME/2
-
date post
19-Dec-2015 -
Category
Documents
-
view
223 -
download
2
Transcript of Transportation Planning Modeling with EMME/2. Interconnectedness.
Transportation Planning
Modeling with EMME/2
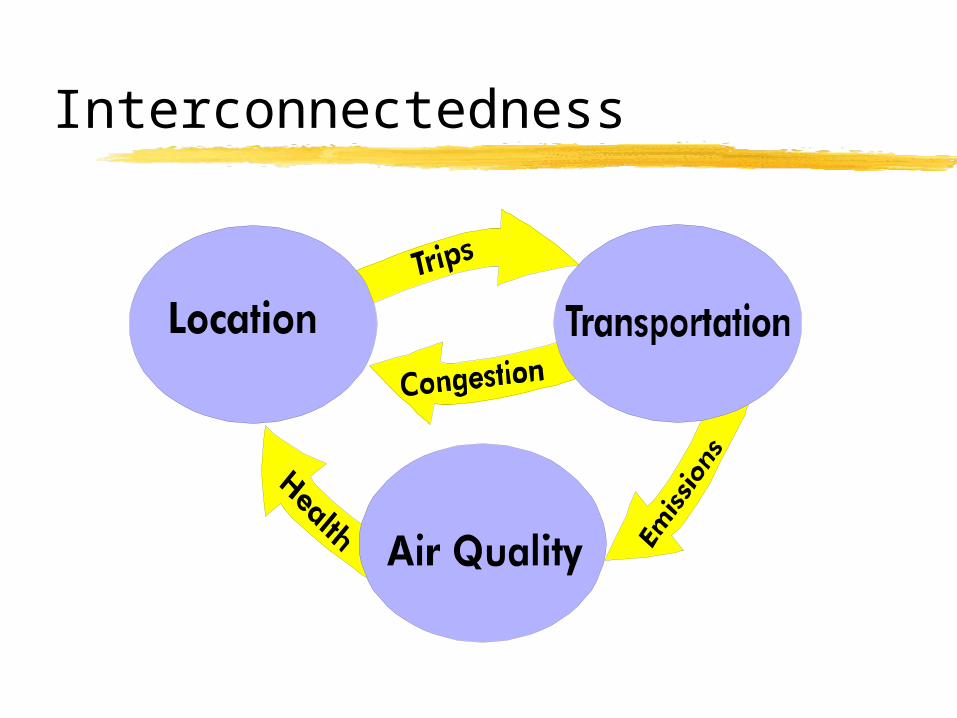
Interconnectedness
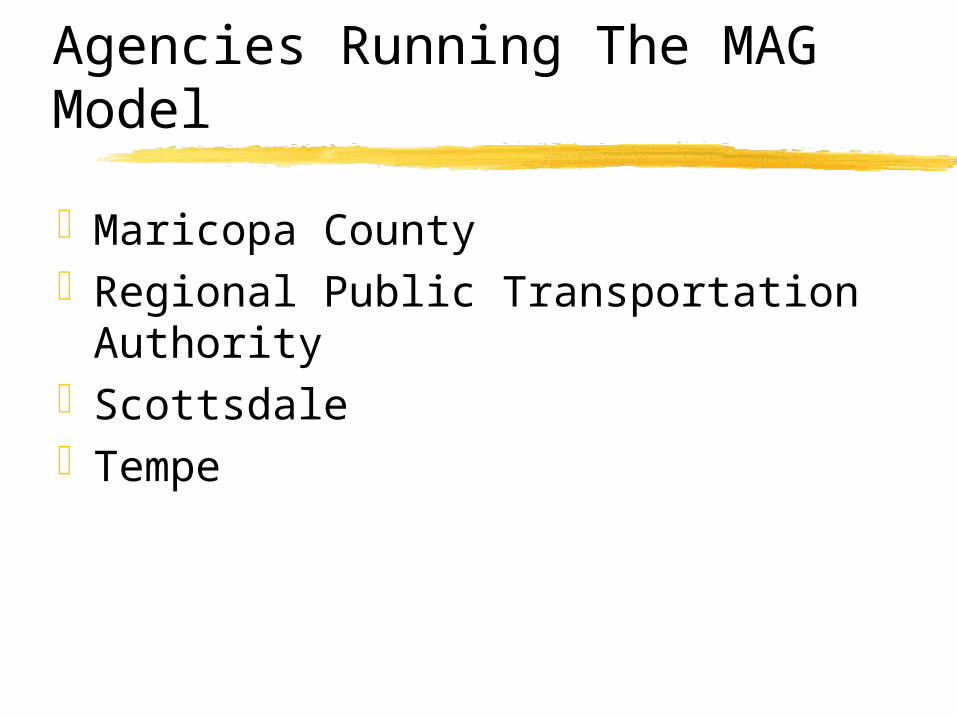
Agencies Running The MAG Model
Maricopa County Regional Public Transportation
Authority Scottsdale Tempe
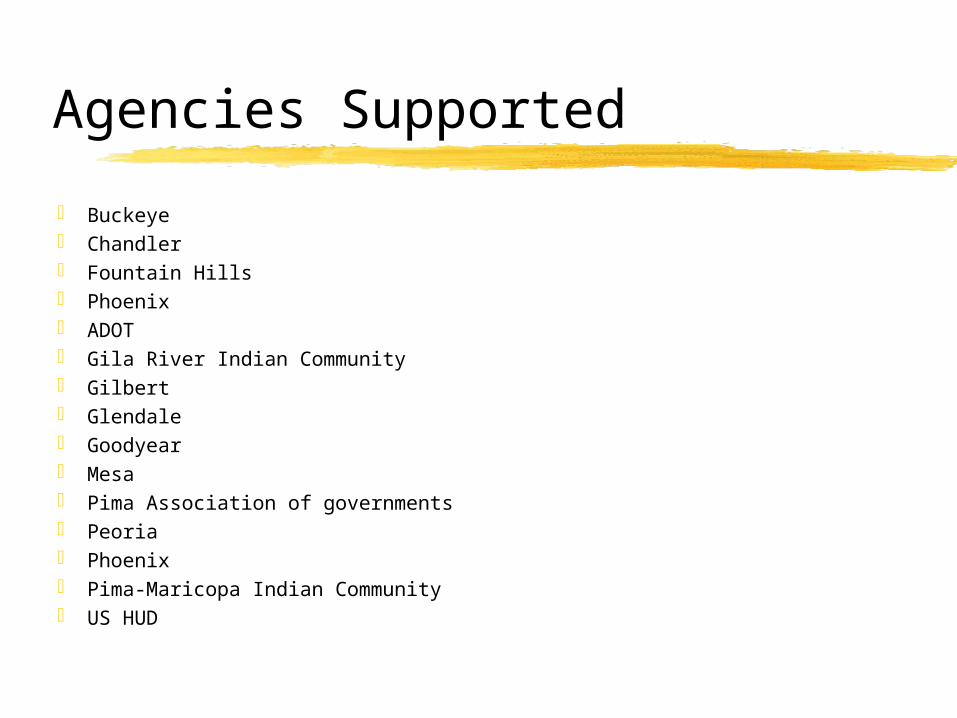
Agencies Supported
Buckeye Chandler Fountain Hills Phoenix ADOT Gila River Indian Community Gilbert Glendale Goodyear Mesa Pima Association of governments Peoria Phoenix Pima-Maricopa Indian Community US HUD
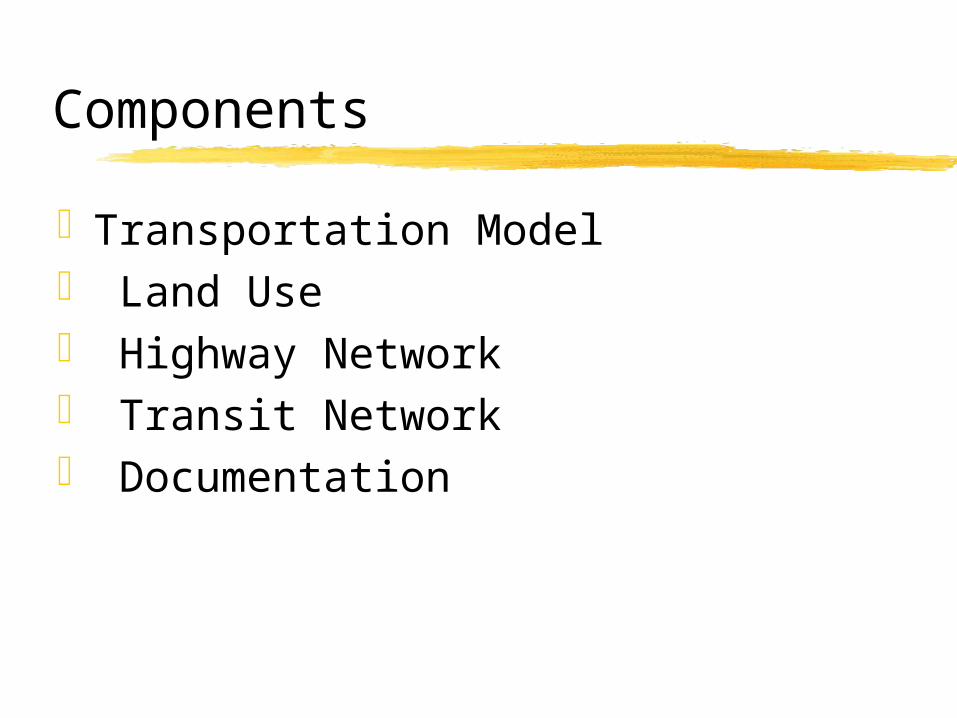
Components
Transportation Model Land Use Highway Network Transit Network Documentation
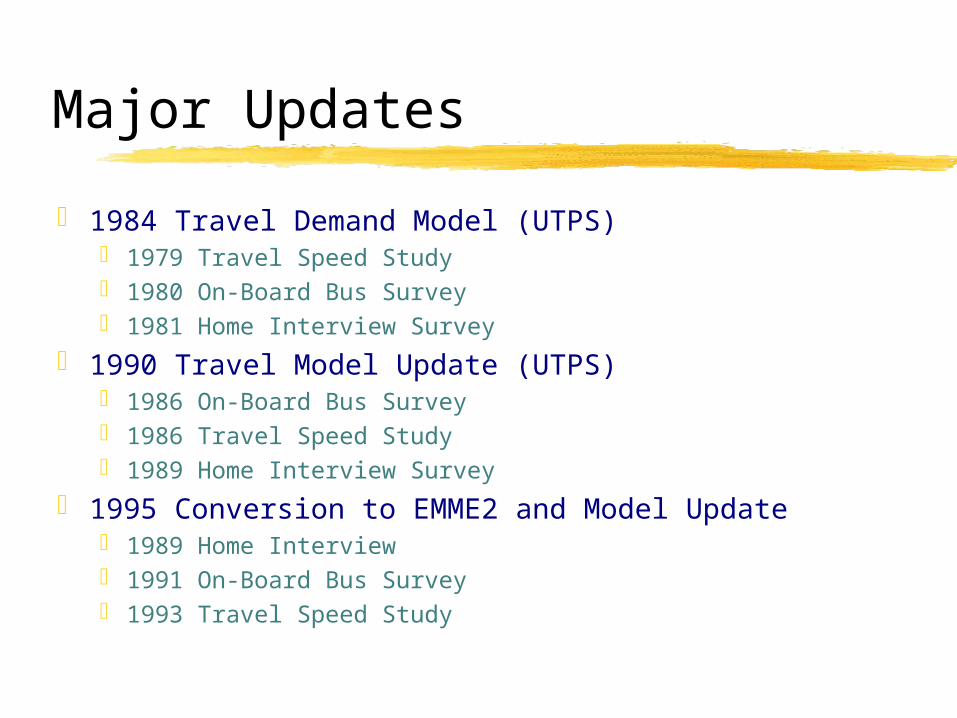
Major Updates
1984 Travel Demand Model (UTPS) 1979 Travel Speed Study 1980 On-Board Bus Survey 1981 Home Interview Survey
1990 Travel Model Update (UTPS) 1986 On-Board Bus Survey 1986 Travel Speed Study 1989 Home Interview Survey
1995 Conversion to EMME2 and Model Update 1989 Home Interview 1991 On-Board Bus Survey 1993 Travel Speed Study
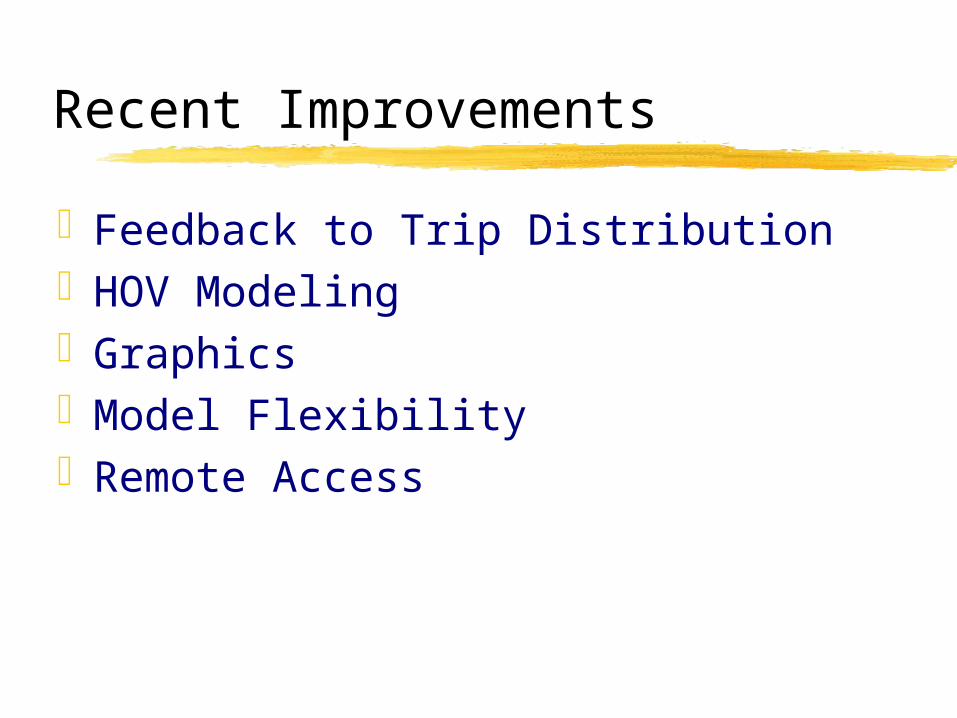
Recent Improvements
Feedback to Trip Distribution HOV Modeling Graphics Model Flexibility Remote Access
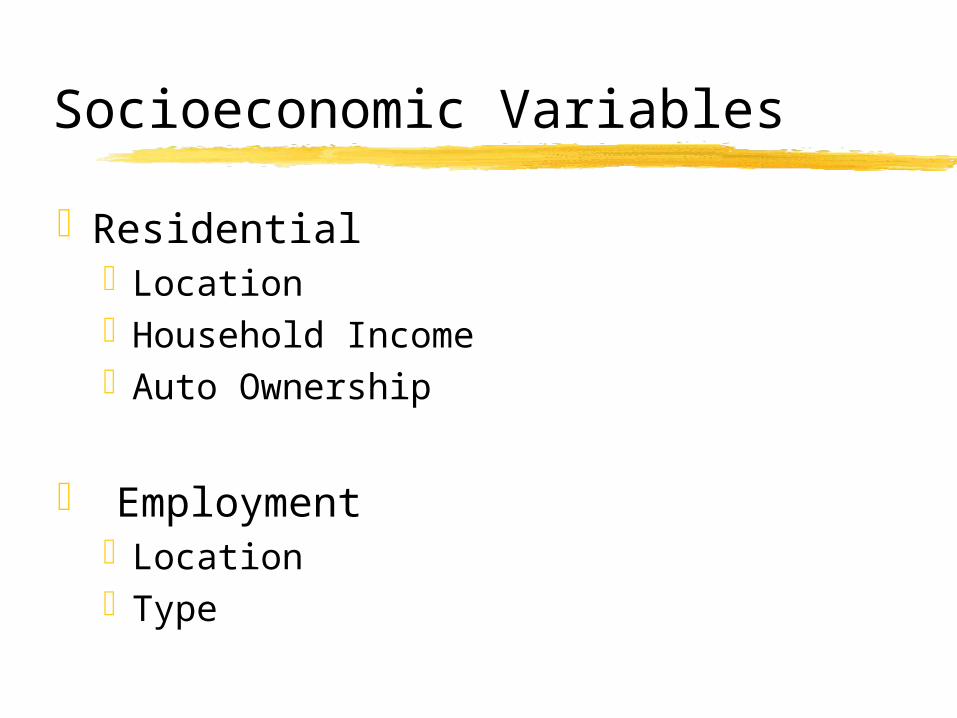
Socioeconomic Variables
Residential Location Household Income Auto Ownership
Employment Location Type
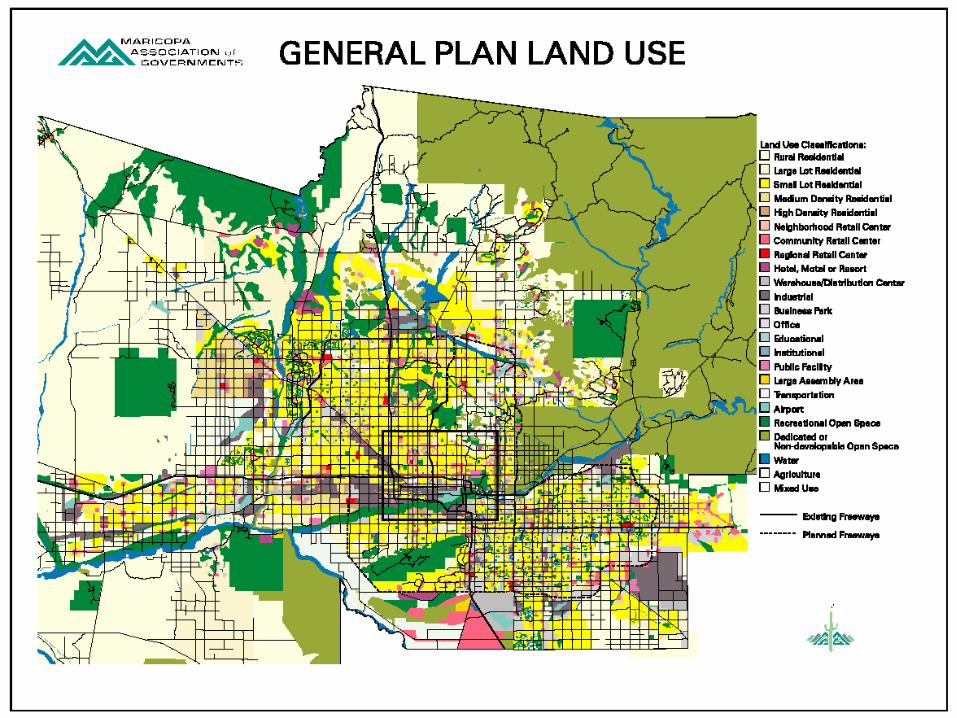

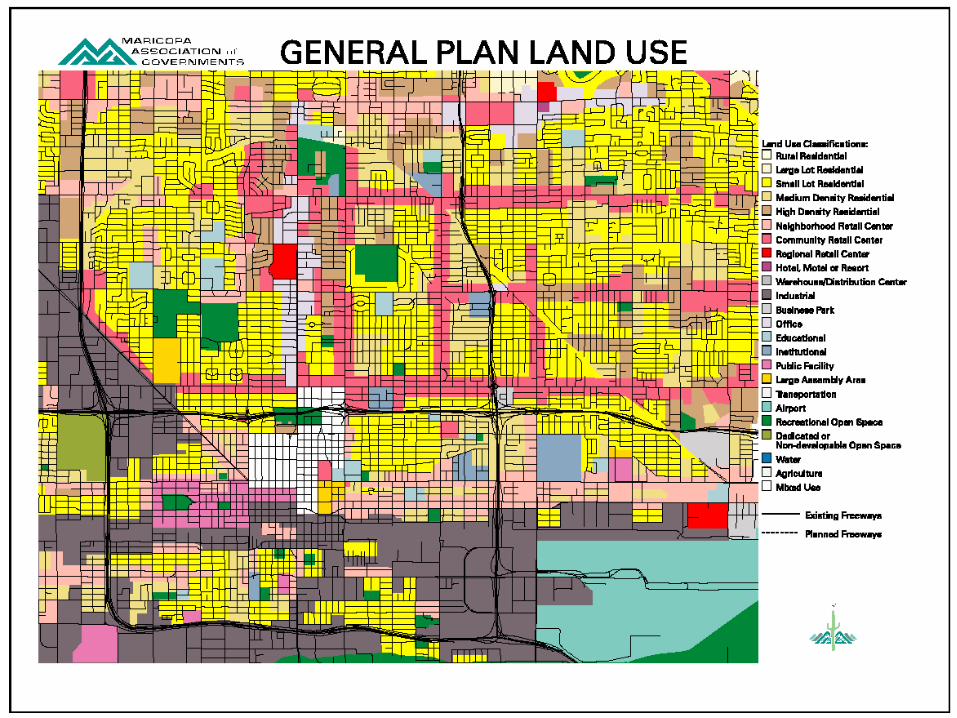
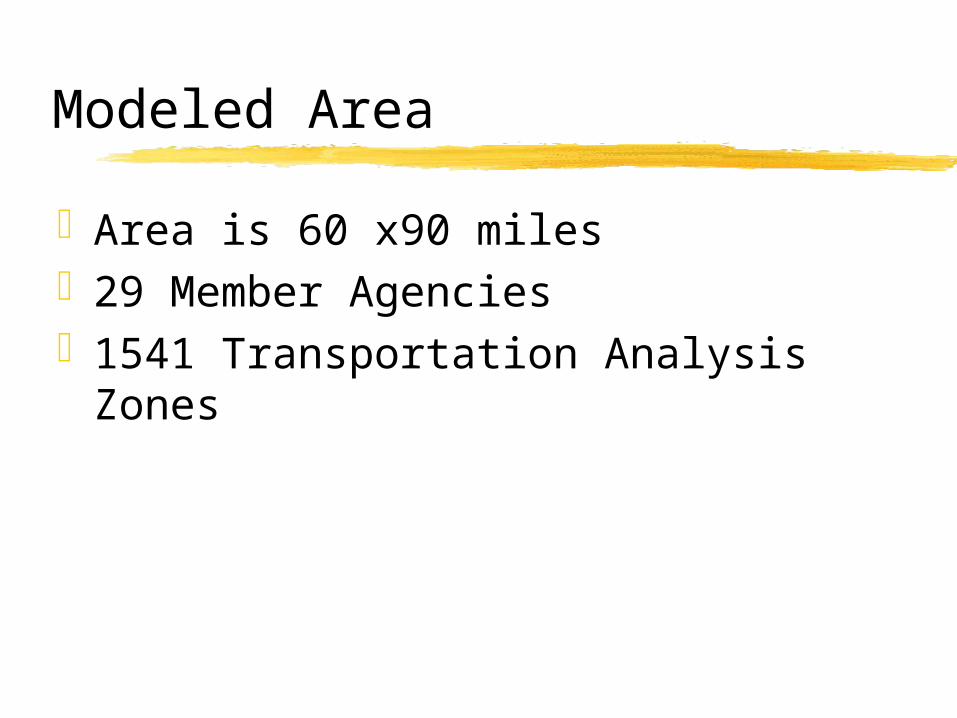
Modeled Area
Area is 60 x90 miles 29 Member Agencies 1541 Transportation Analysis Zones
Modeled Area
Area is 60 x90 miles 29 Member Agencies 1541 Transportation Analysis Zones
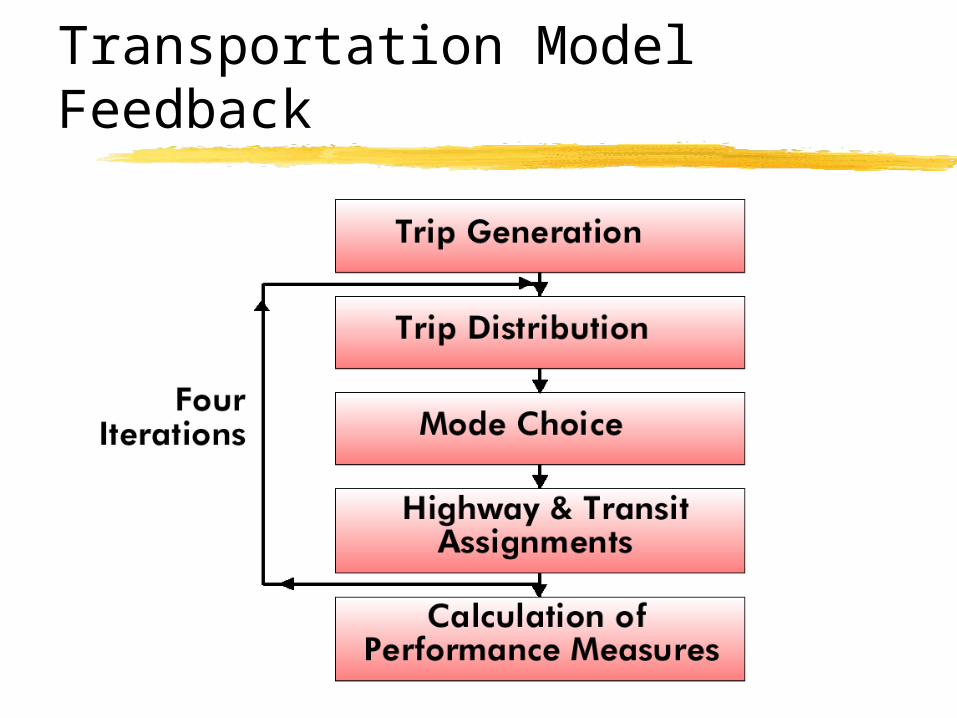
Transportation Model Feedback
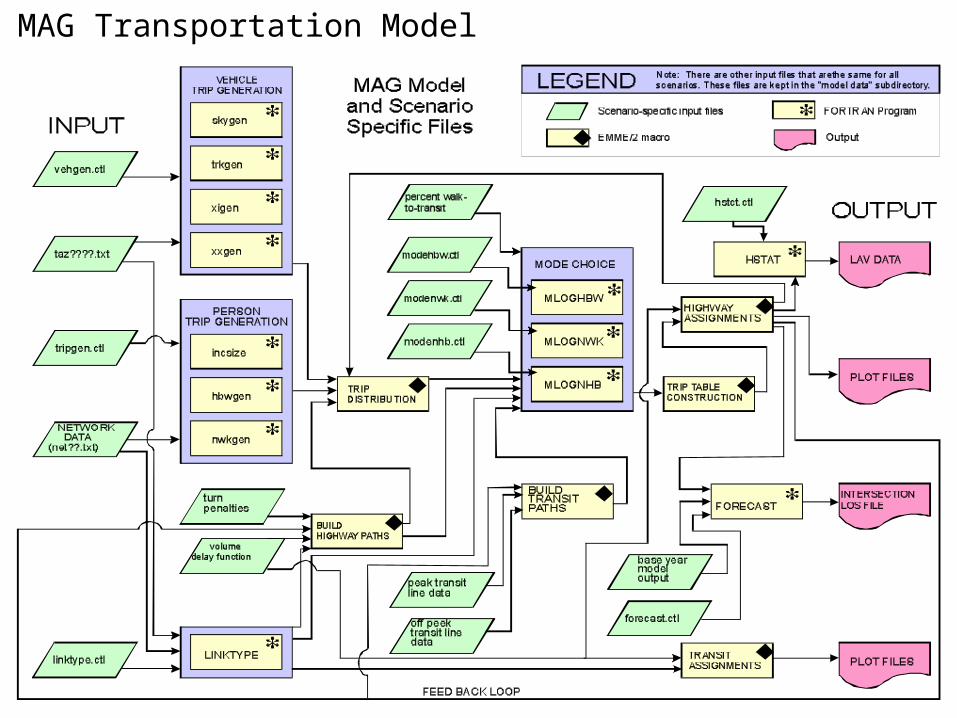
MAG Transportation Model

Trip Purpose Stratification
Home-Based Work Income Group Stratification
Home-Based Shopping Home-Based Other Home-Based School
Elementary/Secondary Arizona State University Other University
Non-Home Based Non-Home-Based Other Non-Home-Based Work
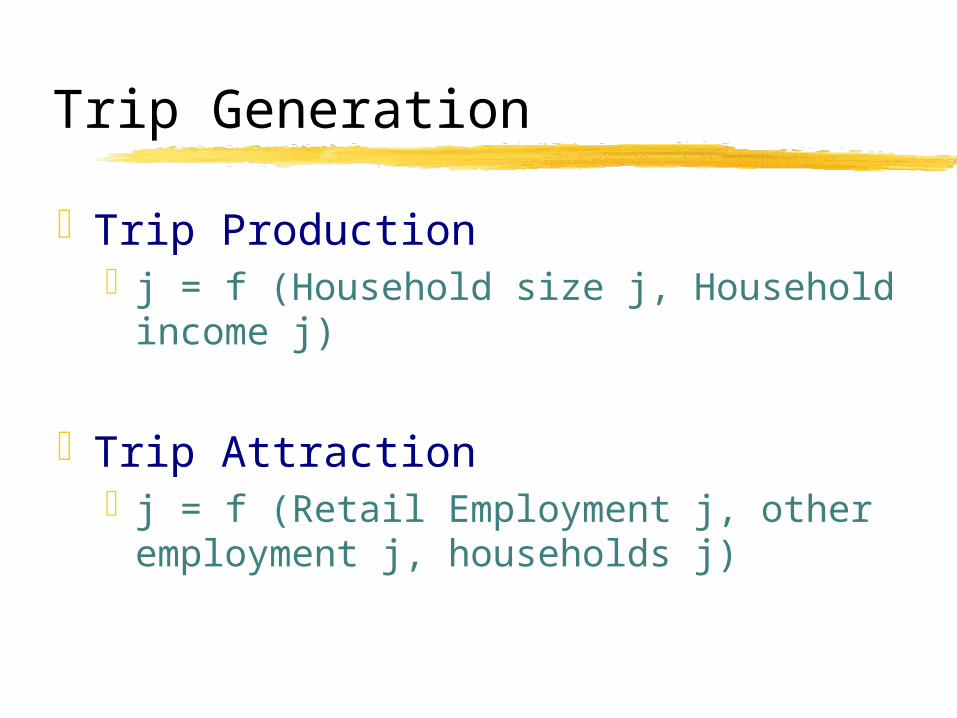
Trip Generation
Trip Production j = f (Household size j, Household
income j)
Trip Attraction j = f (Retail Employment j, other
employment j, households j)
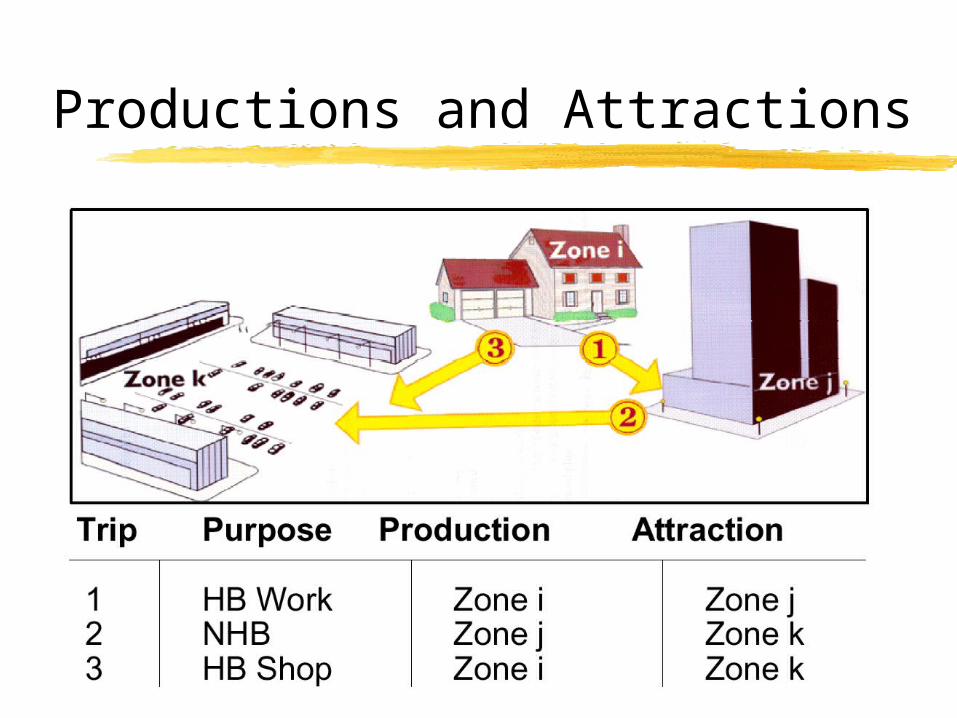
Productions and Attractions
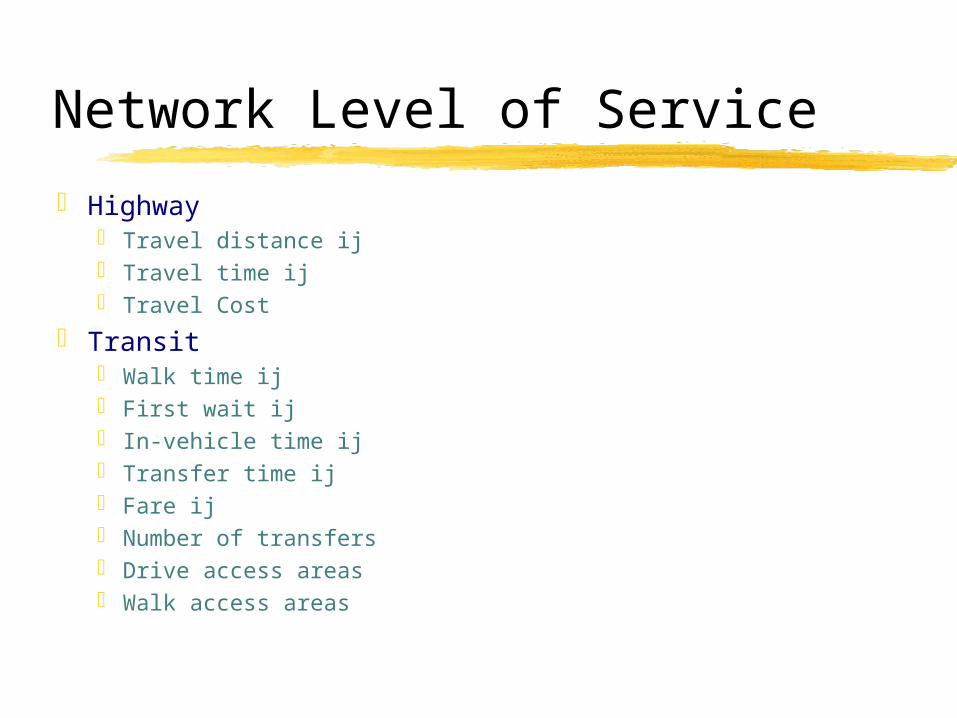
Network Level of Service
Highway Travel distance ij Travel time ij Travel Cost
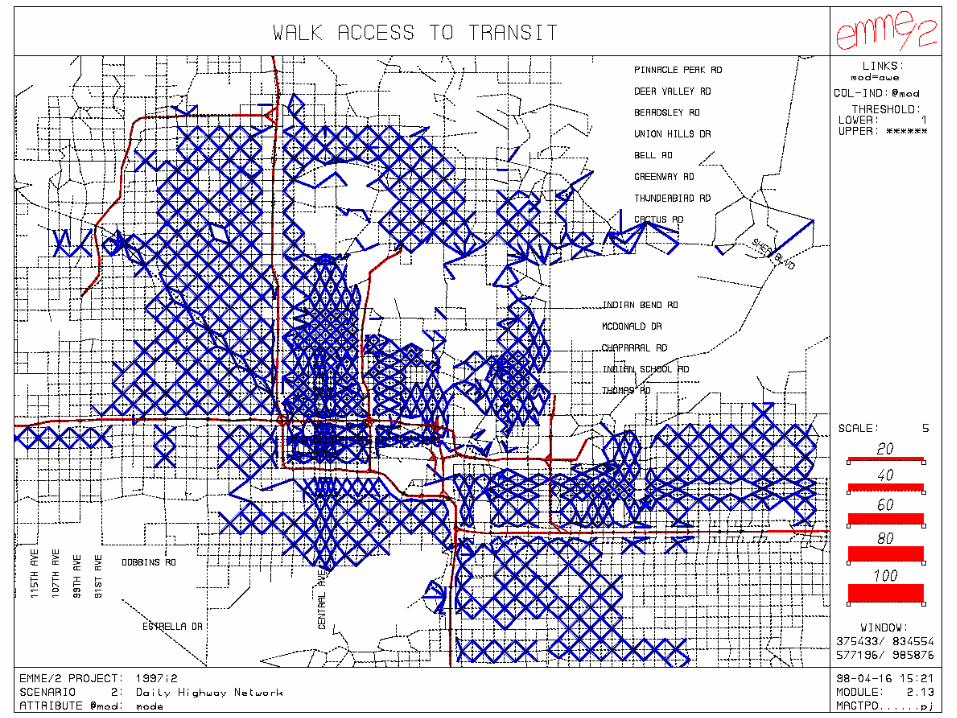
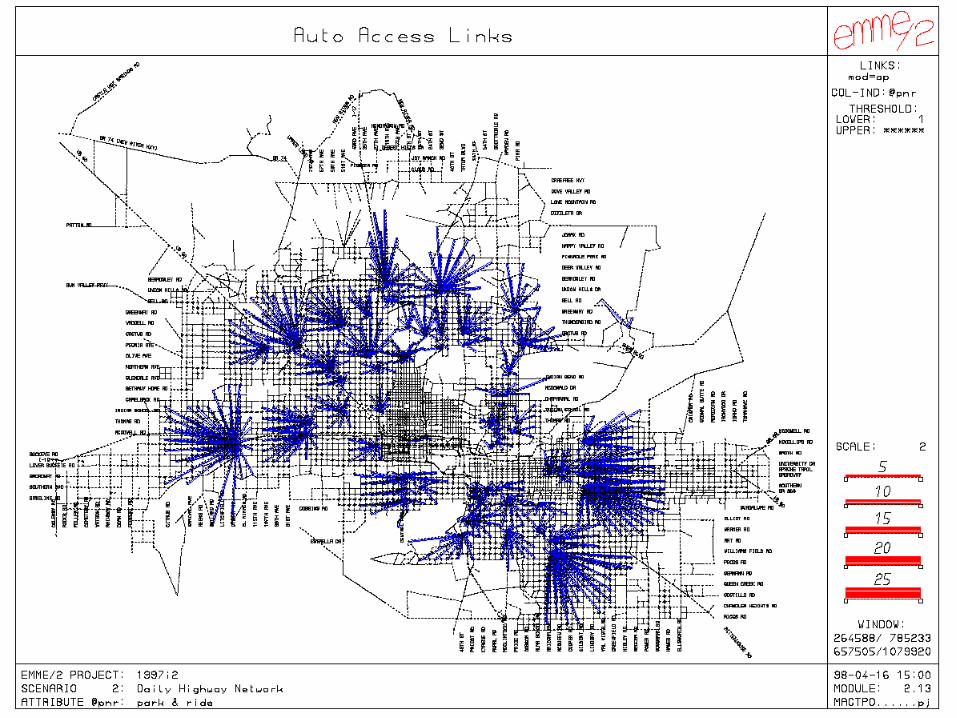
Transit Walk time ij First wait ij In-vehicle time ij Transfer time ij Fare ij Number of transfers Drive access areas Walk access areas
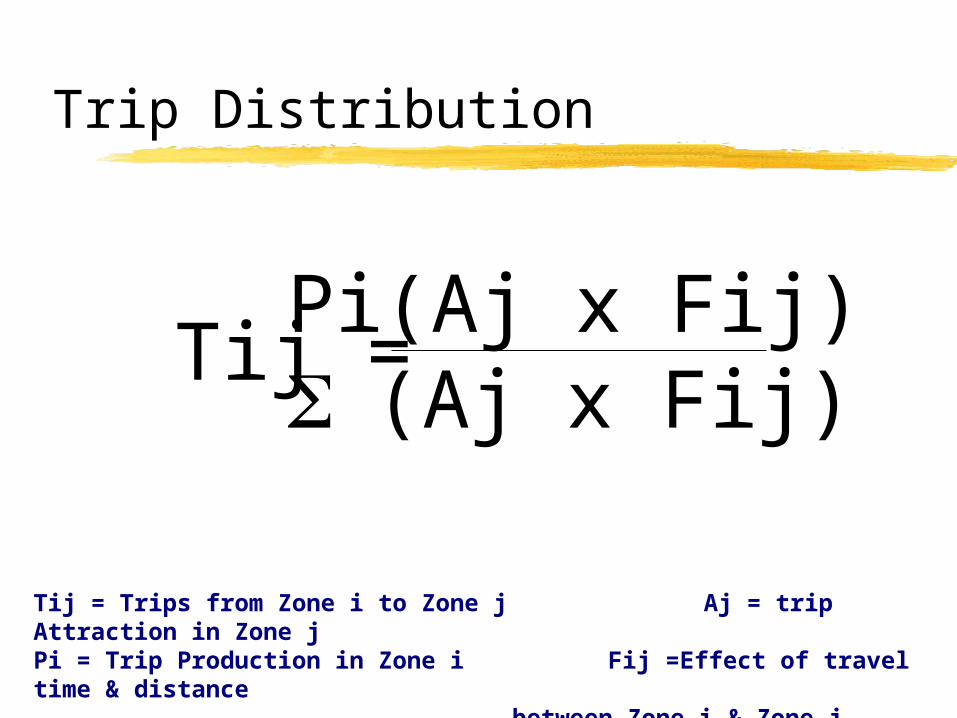
Trip Distribution
Tij = Trips from Zone i to Zone j Aj = trip Attraction in Zone jPi = Trip Production in Zone i Fij =Effect of travel time & distance
between Zone i & Zone j
Pi(Aj x Fij)(Aj x Fij)
Tij =
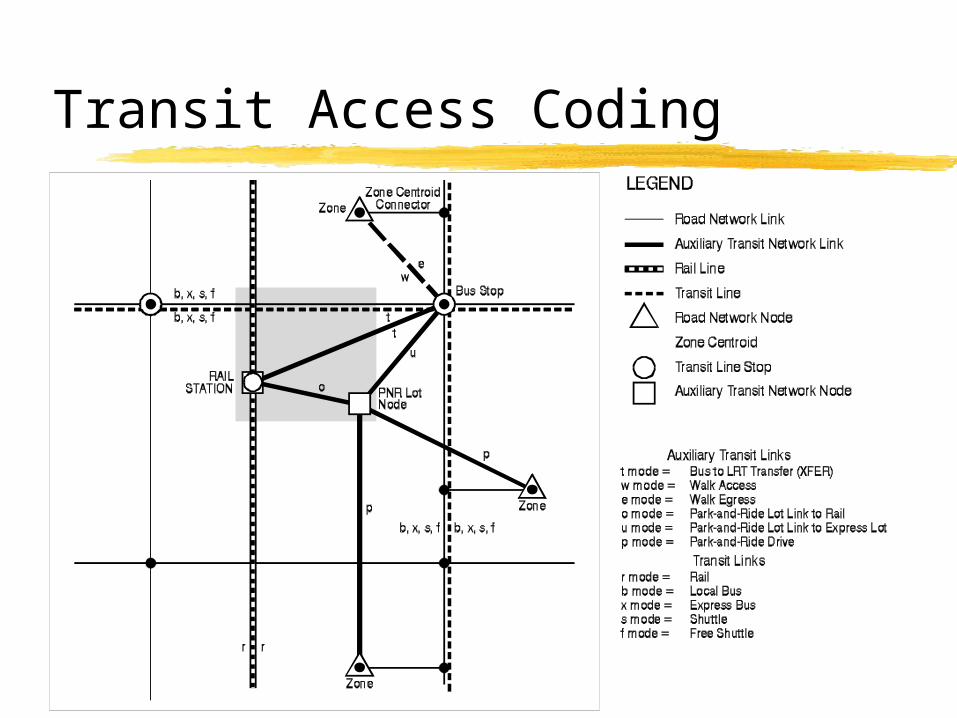
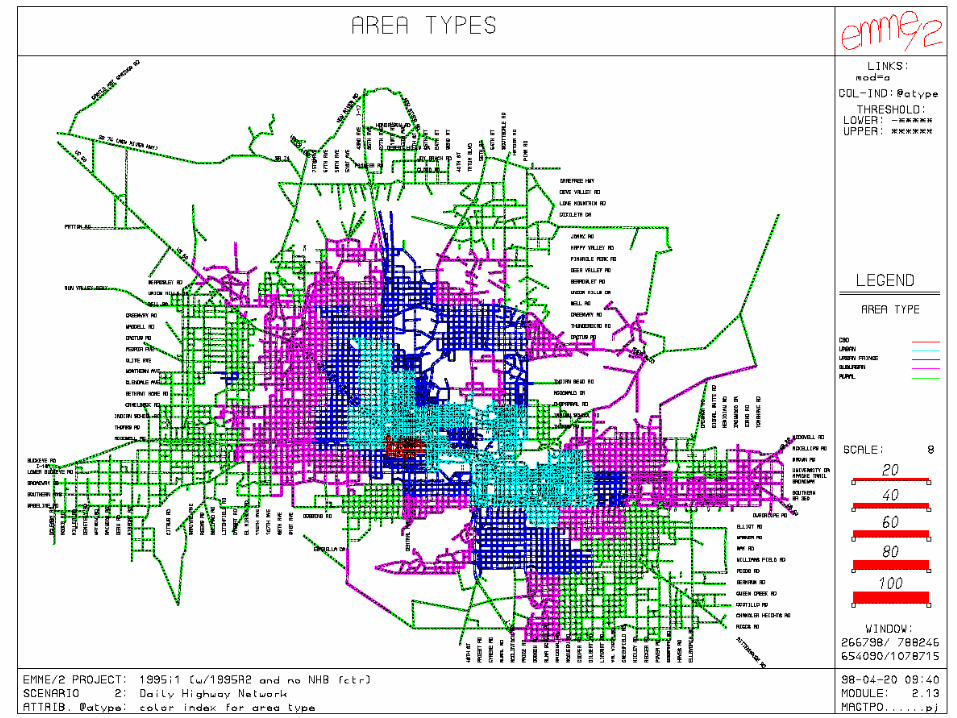
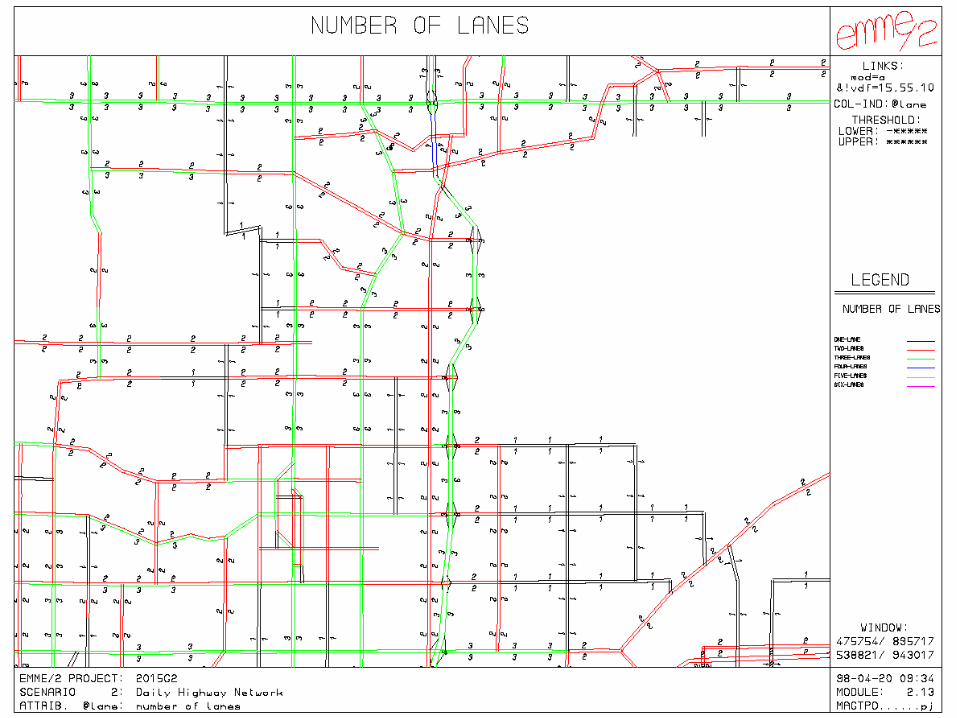
Transit Access Coding
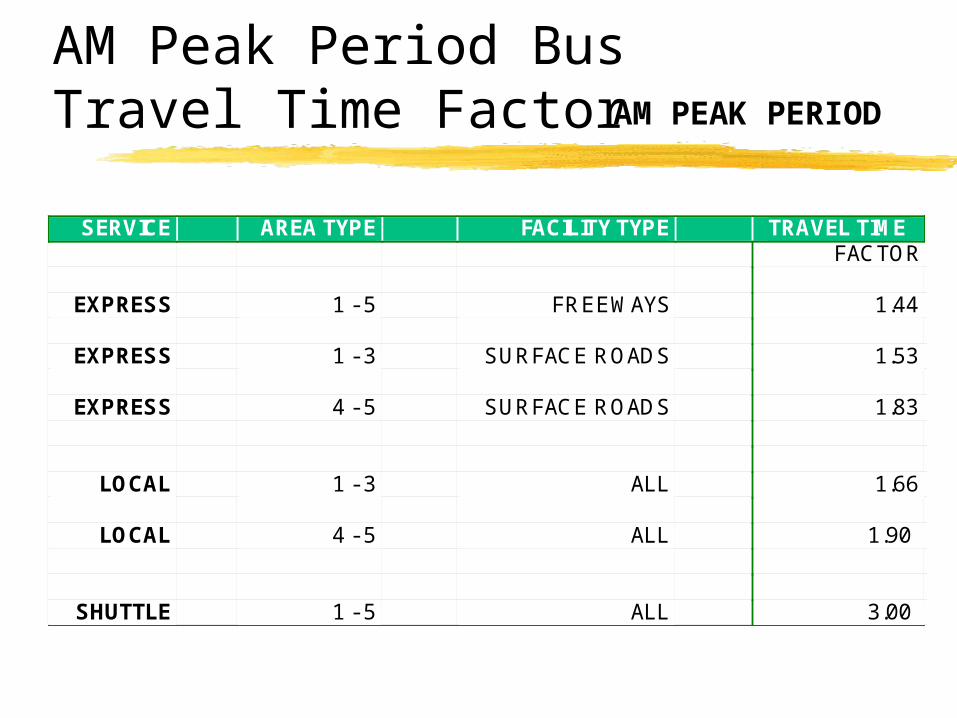
AM Peak Period Bus Travel Time Factor
TRAVEL TIME FACILITY TYPEAREA TYPESERVICEFACTOR
1.44FREEWAYS1 - 5EXPRESS
1.53SURFACE ROADS1 - 3EXPRESS
1.83SURFACE ROADS4 - 5EXPRESS
1.66ALL1 - 3LOCAL
1.90ALL4 - 5LOCAL
3.00ALL1 - 5SHUTTLE
AM PEAK PERIOD
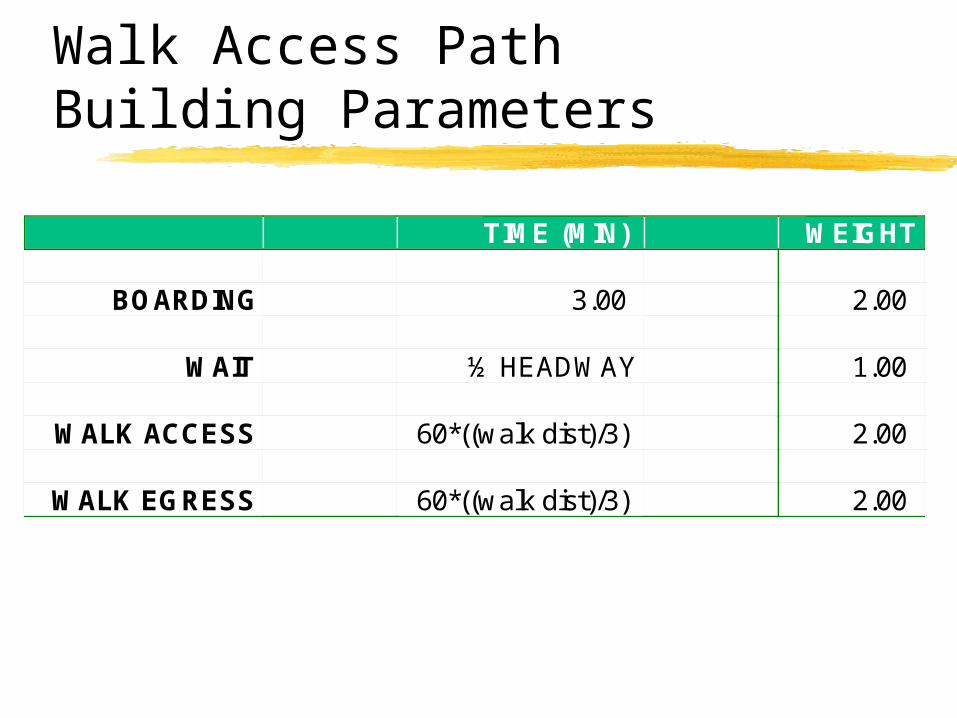
Walk Access Path Building Parameters
WEIGHTTIME (MIN)
2.003.00BOARDING
1.00½ HEADWAYWAIT
2.0060*((walk dist)/3)WALK ACCESS
2.0060*((walk dist)/3)WALK EGRESS
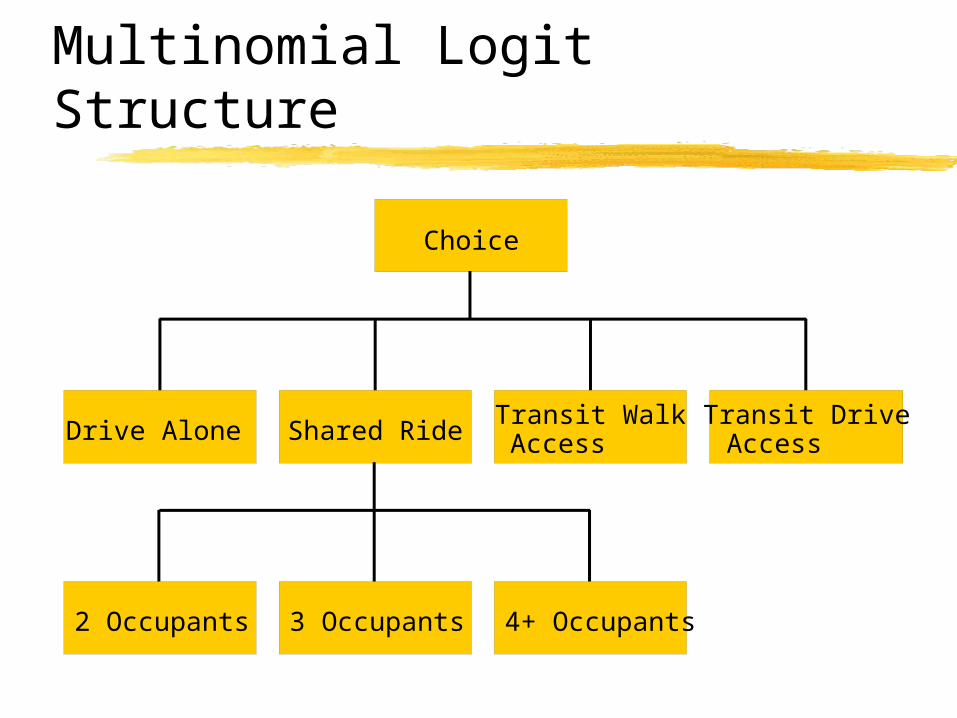
Multinomial Logit Structure
Choice
Drive Alone Shared RideTransit WalkAccess
Transit DriveAccess
2 Occupants 3 Occupants 4+ Occupants
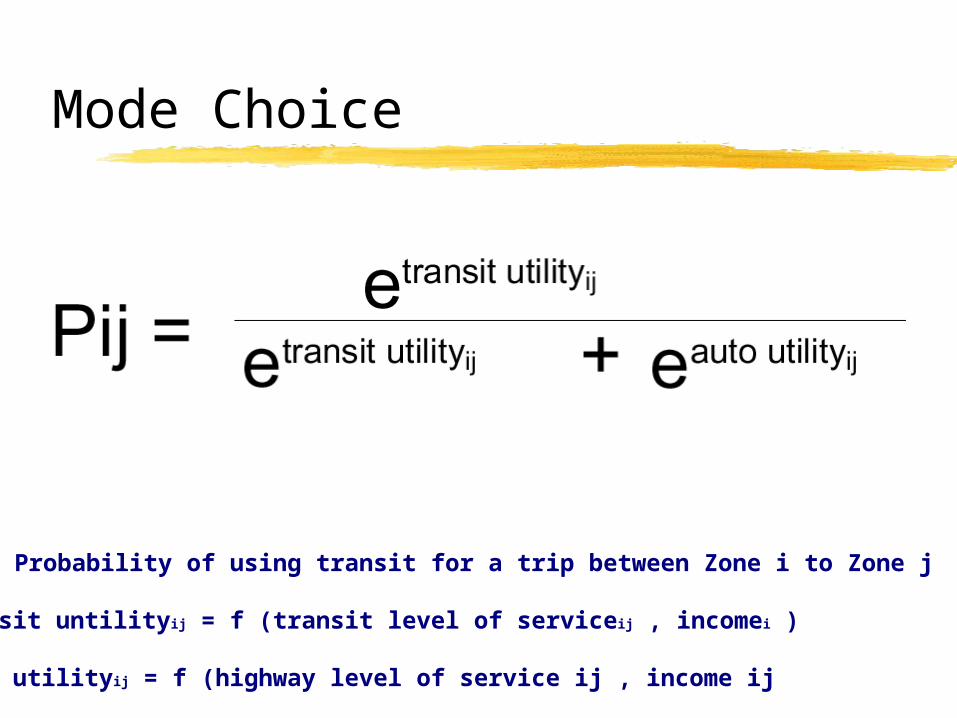
Mode Choice
Pij = Probability of using transit for a trip between Zone i to Zone j
Transit untilityij = f (transit level of serviceij , incomei )
Auto utilityij = f (highway level of service ij , income ij
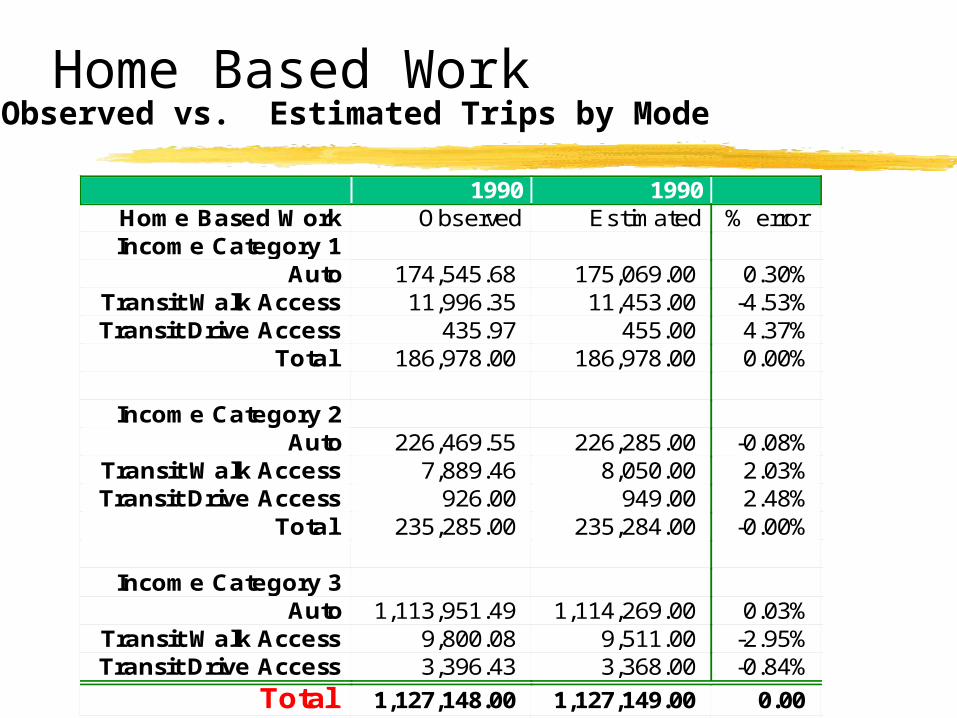
Home Based Work
19901990% errorEstimatedObservedHome Based Work
Income Category 10.30%175,069.00174,545.68Auto
-4.53%11,453.0011,996.35Transit Walk Access4.37%455.00435.97Transit Drive Access0.00%186,978.00186,978.00Total
Income Category 2-0.08%226,285.00226,469.55Auto2.03%8,050.007,889.46Transit Walk Access2.48%949.00926.00Transit Drive Access
-0.00%235,284.00235,285.00Total
Income Category 30.03%1,114,269.001,113,951.49Auto
-2.95%9,511.009,800.08Transit Walk Access-0.84%3,368.003,396.43Transit Drive Access
0.001,127,149.001,127,148.00Total
Observed vs. Estimated Trips by Mode
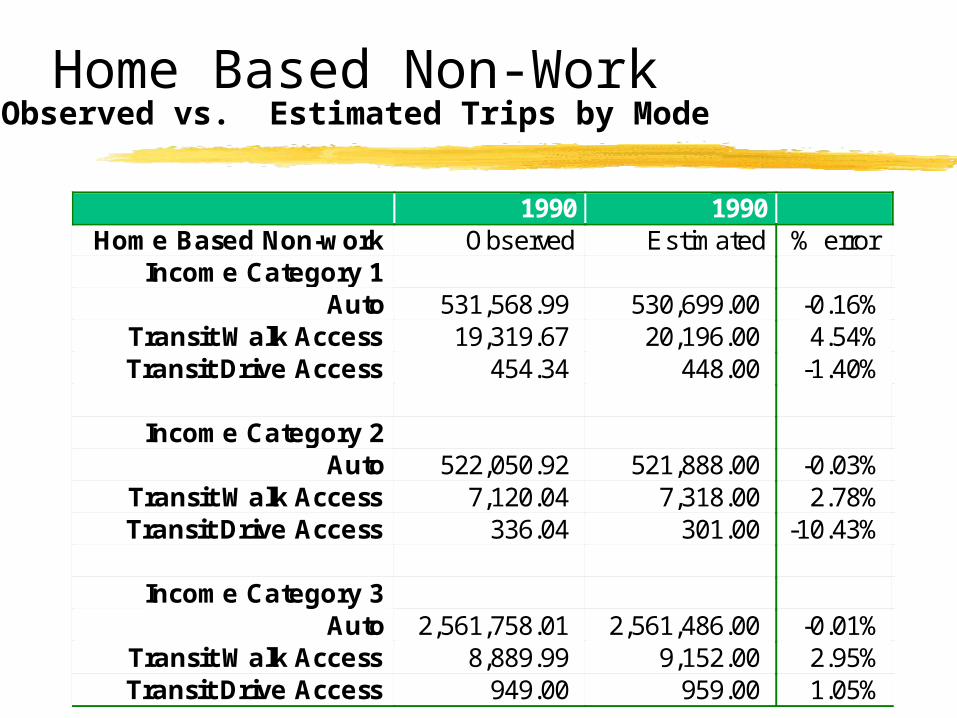
Home Based Non-WorkObserved vs. Estimated Trips by Mode
19901990% errorEstimatedObservedHome Based Non-work
Income Category 1-0.16%530,699.00531,568.99Auto4.54%20,196.0019,319.67Transit Walk Access
-1.40%448.00454.34Transit Drive Access
Income Category 2-0.03%521,888.00522,050.92Auto2.78%7,318.007,120.04Transit Walk Access
-10.43%301.00336.04Transit Drive Access
Income Category 3-0.01%2,561,486.002,561,758.01Auto2.95%9,152.008,889.99Transit Walk Access1.05%959.00949.00Transit Drive Access
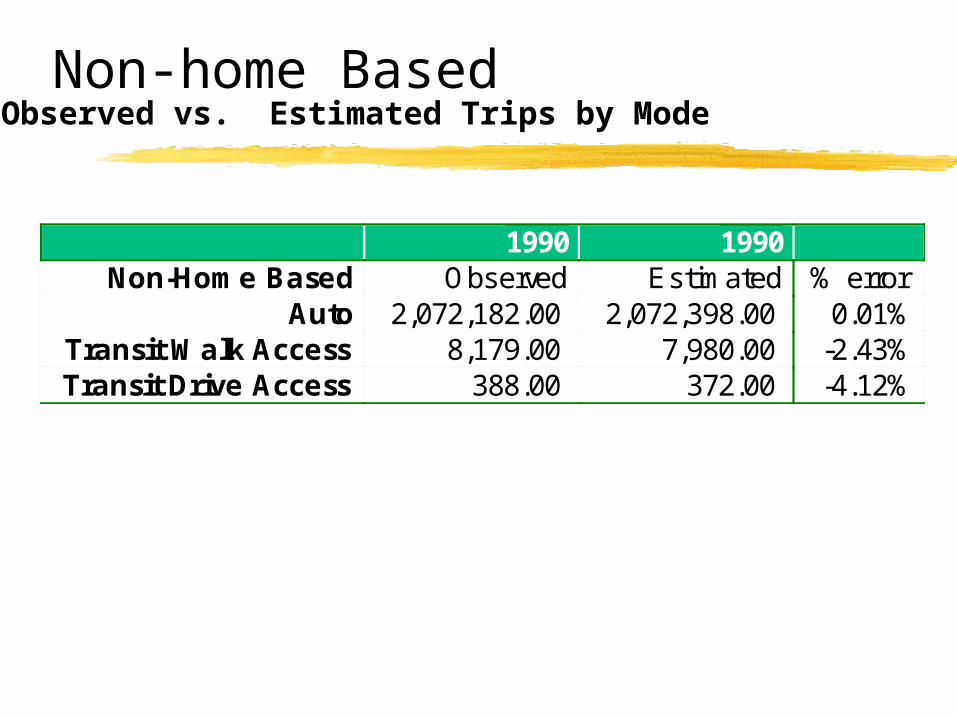
Non-home BasedObserved vs. Estimated Trips by Mode
19901990% errorEstimatedObservedNon-Home Based0.01%2,072,398.002,072,182.00Auto
-2.43%7,980.008,179.00Transit Walk Access-4.12%372.00388.00Transit Drive Access
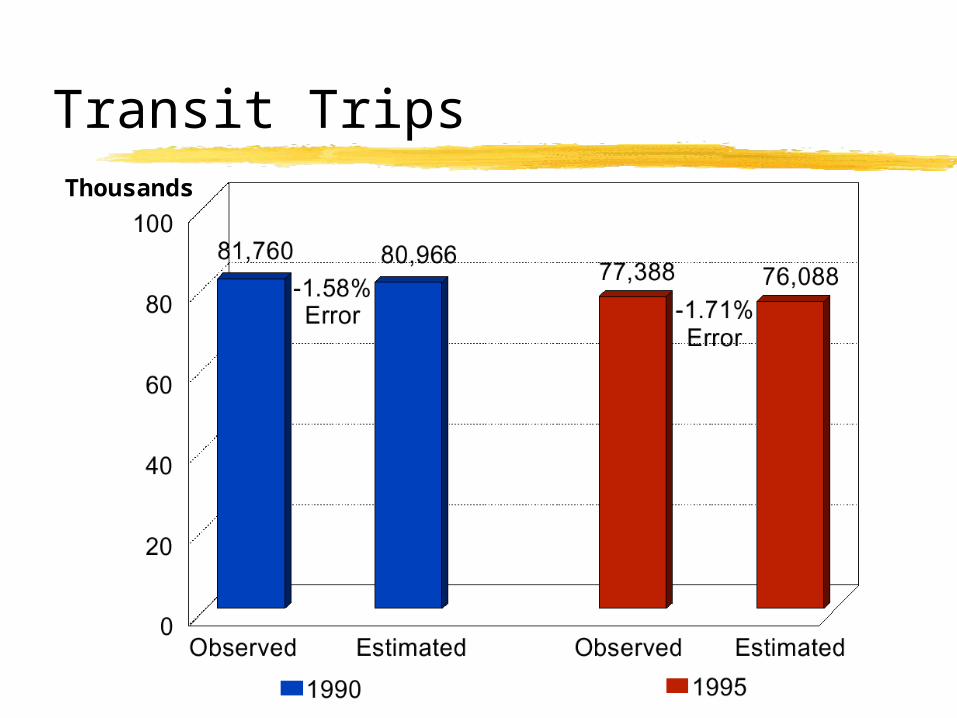
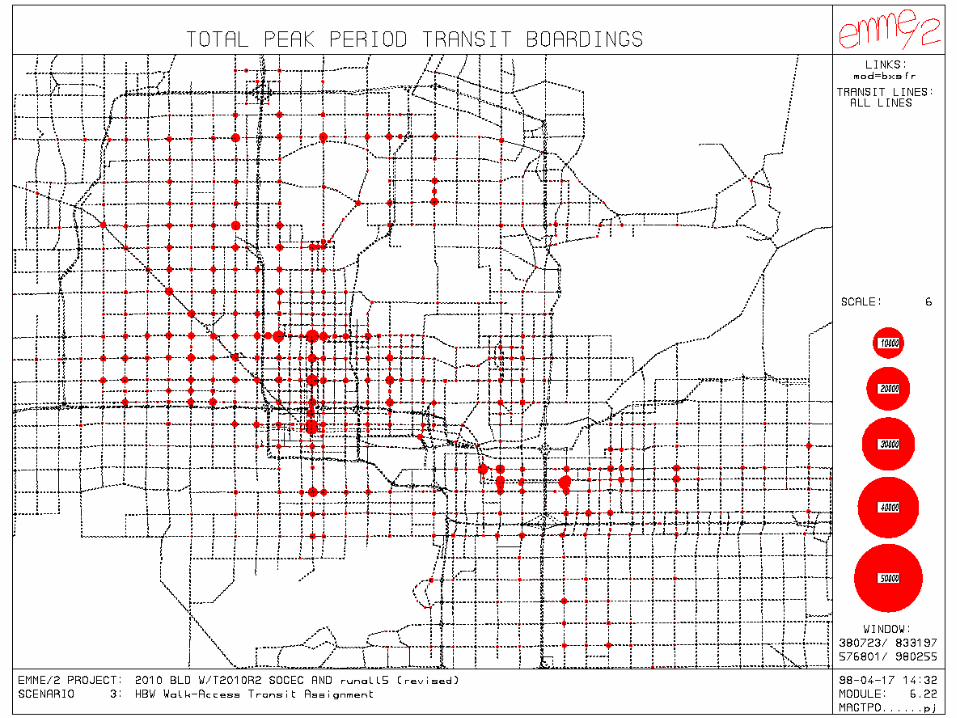
Transit TripsThousands
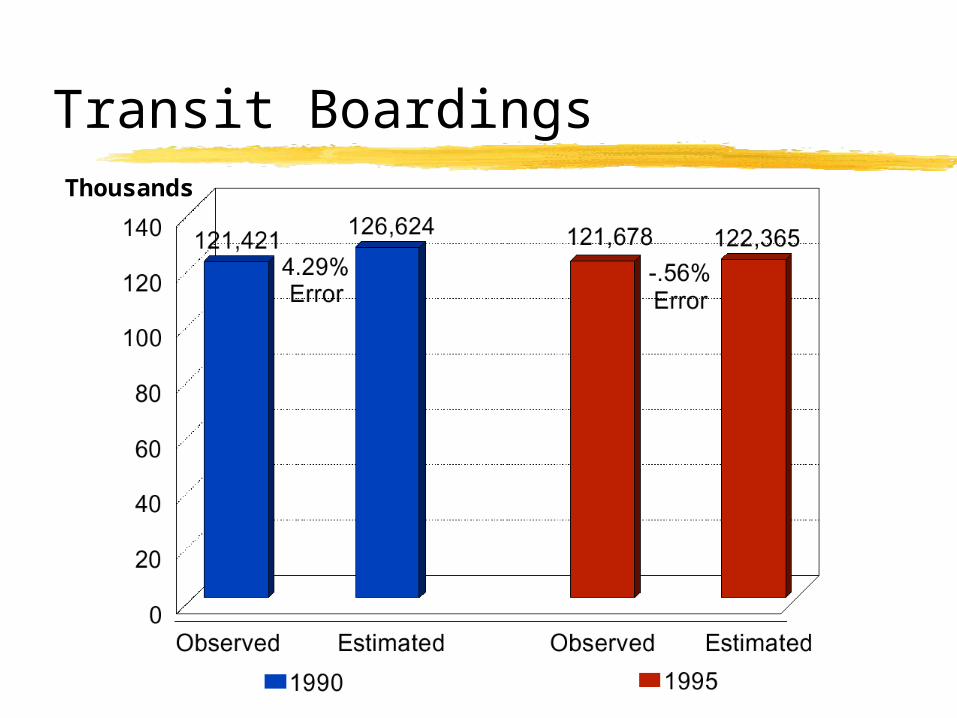
Transit BoardingsThousands
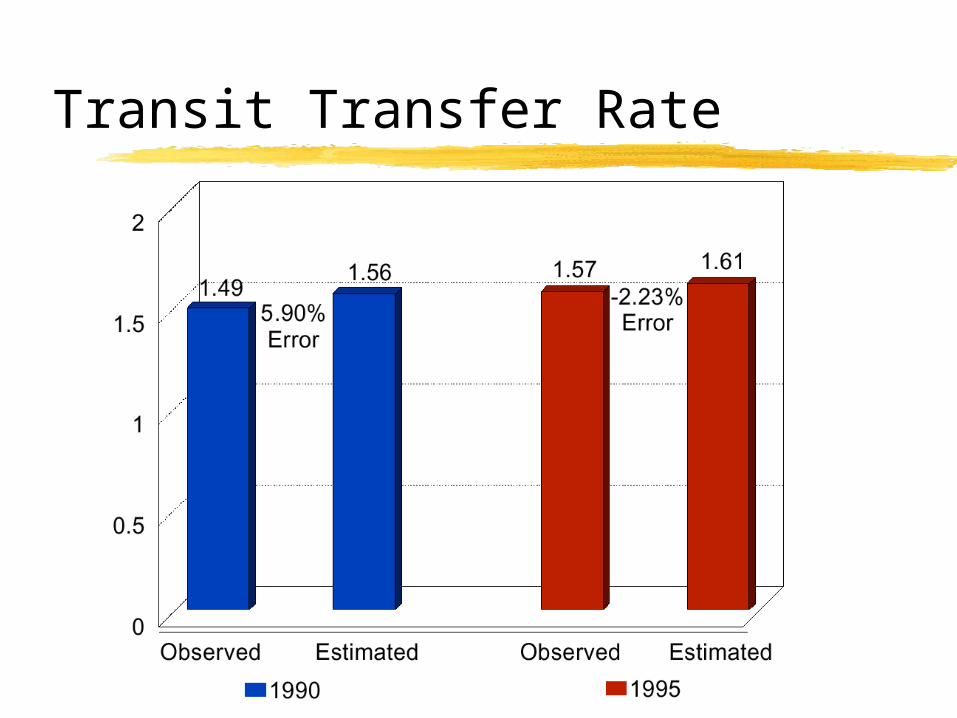
Transit Transfer Rate
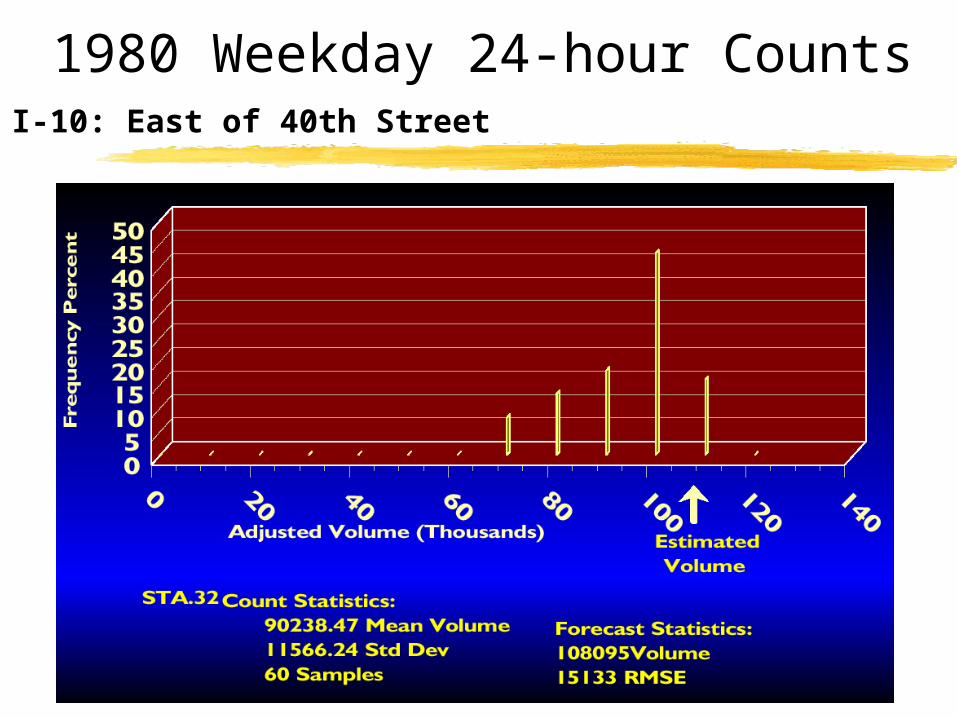
1980 Weekday 24-hour CountsI-10: East of 40th Street
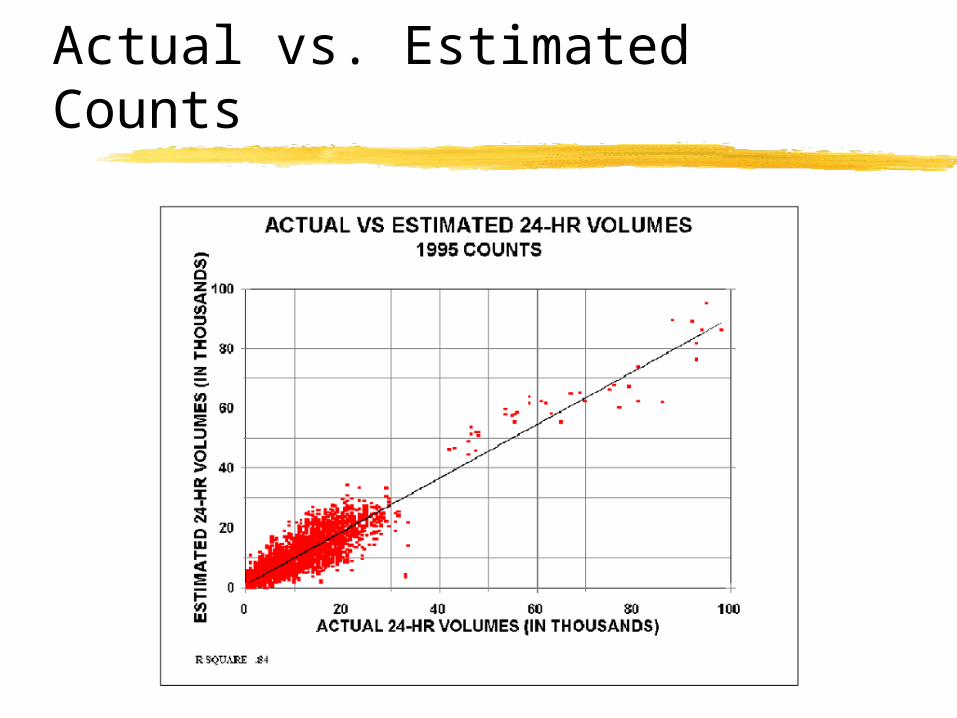
Actual vs. Estimated Counts
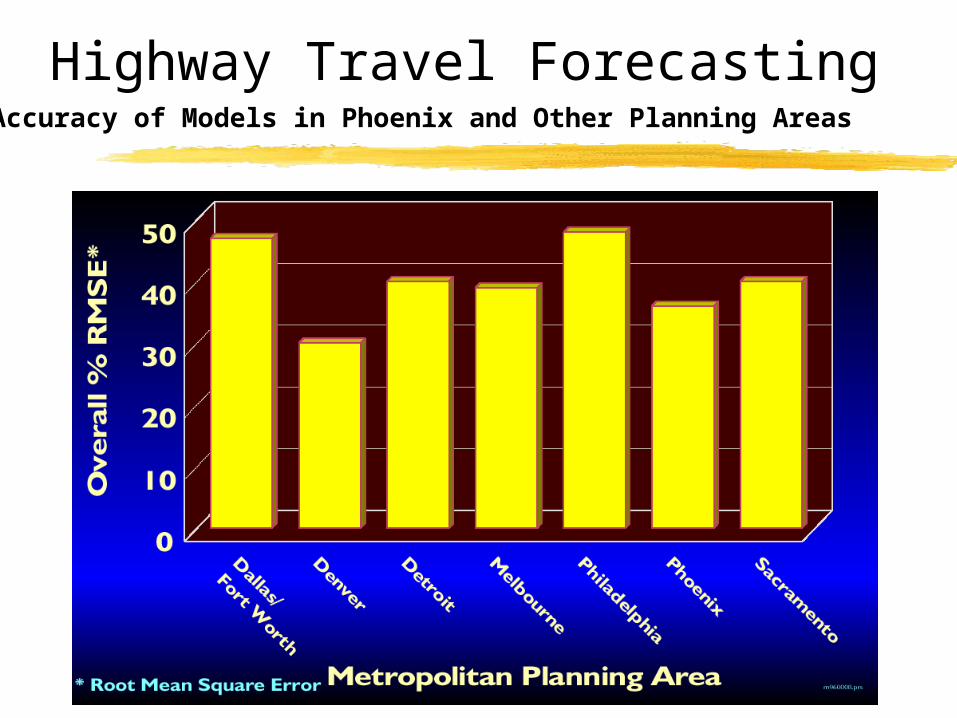
Highway Travel ForecastingAccuracy of Models in Phoenix and Other Planning Areas
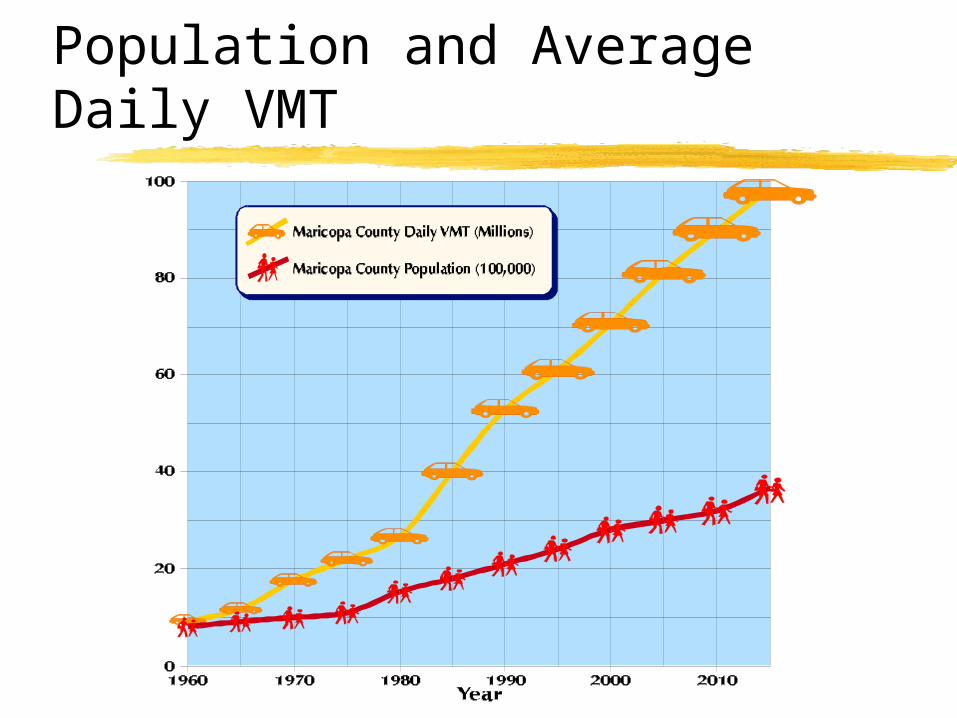
Population and Average Daily VMT
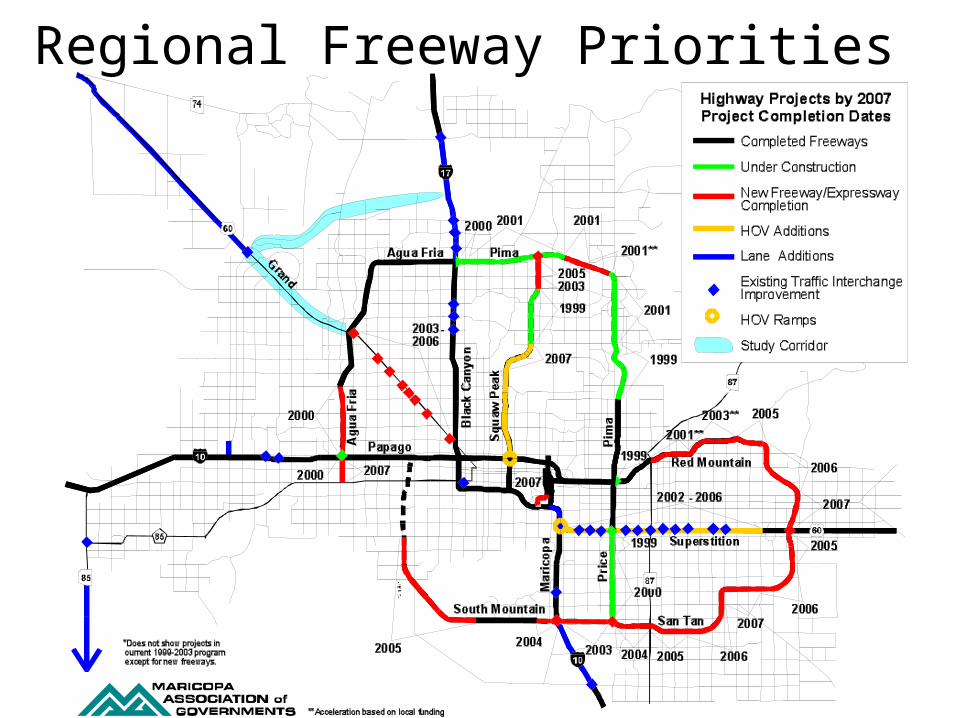
Regional Freeway Priorities
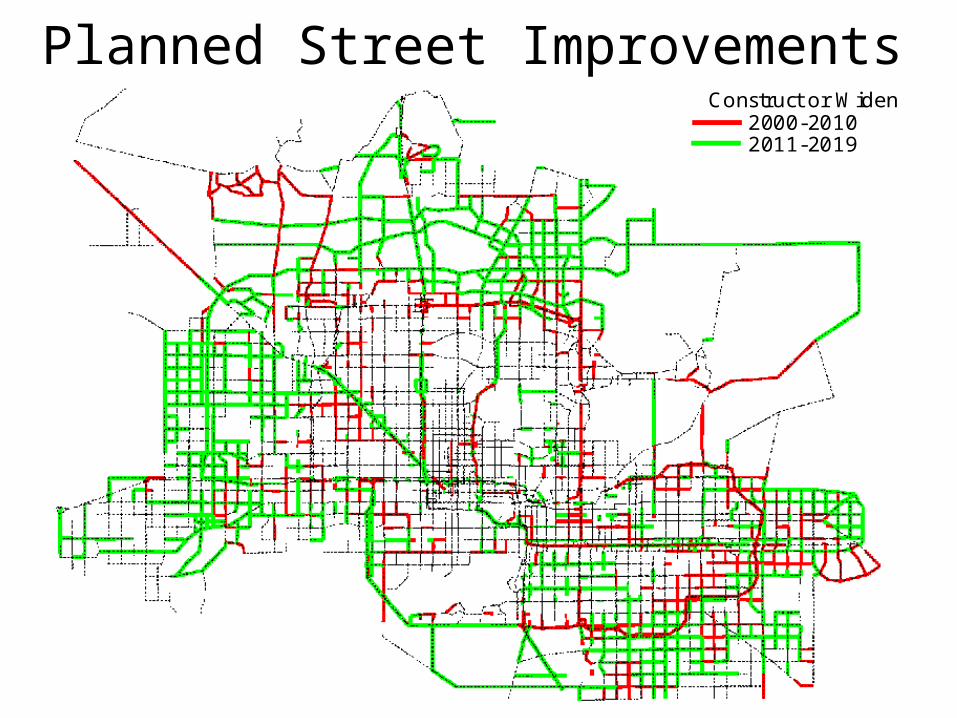
Planned Street ImprovementsConstruct or Widen
2000-20102011-2019
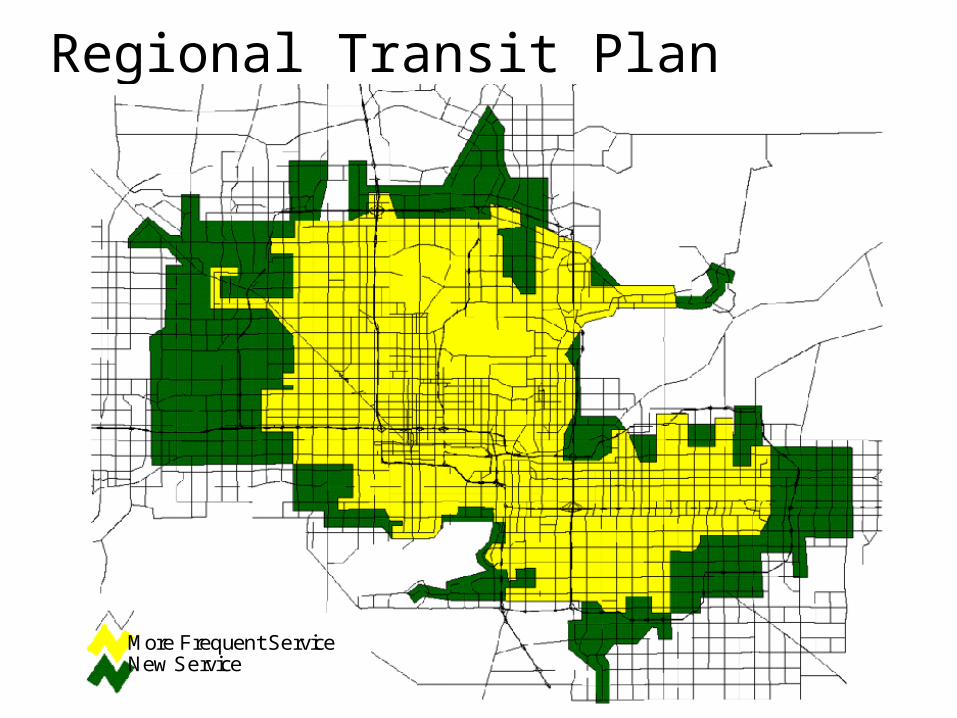
Regional Transit Plan
More Frequent ServiceNew Service

Carbon Monoxide ConcentrationsProjected for December 1995
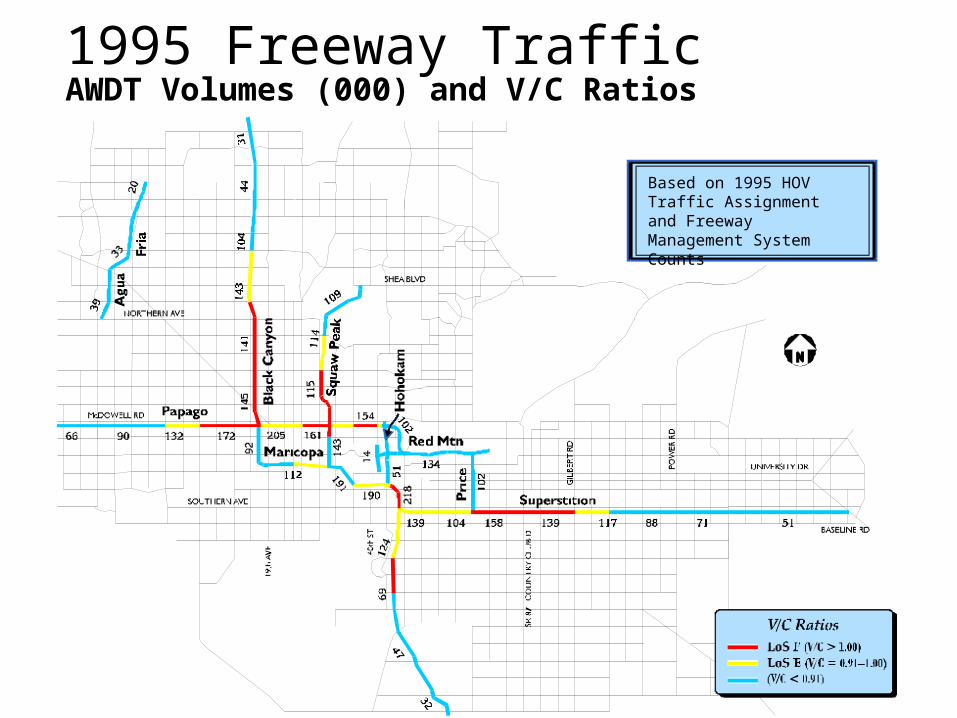
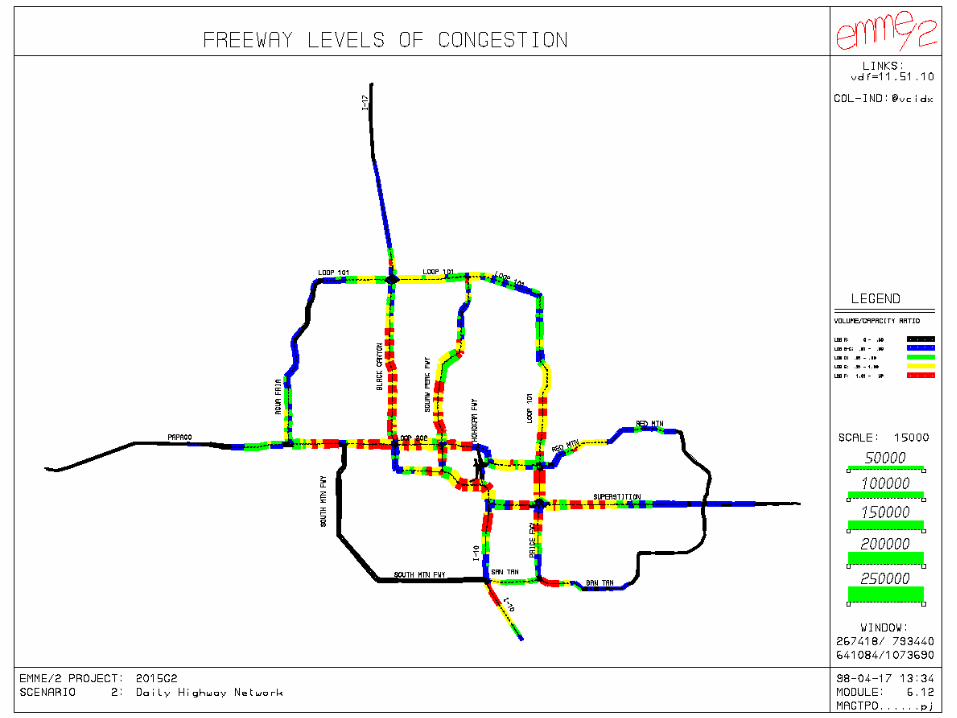
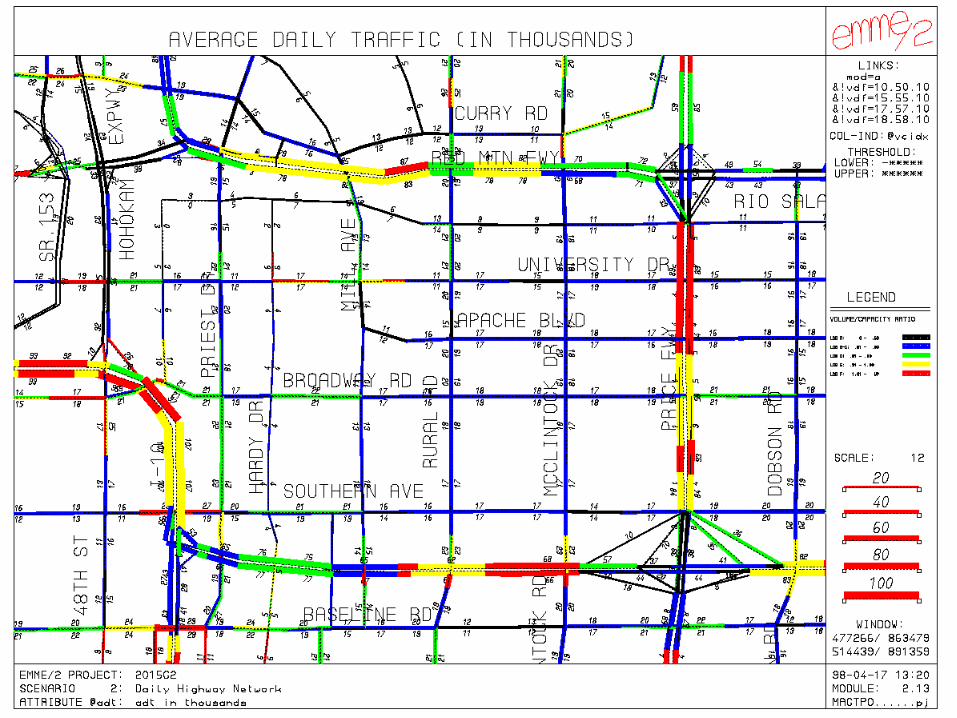
1995 Freeway TrafficAWDT Volumes (000) and V/C Ratios
Based on 1995 HOV Traffic Assignmentand Freeway Management System Counts
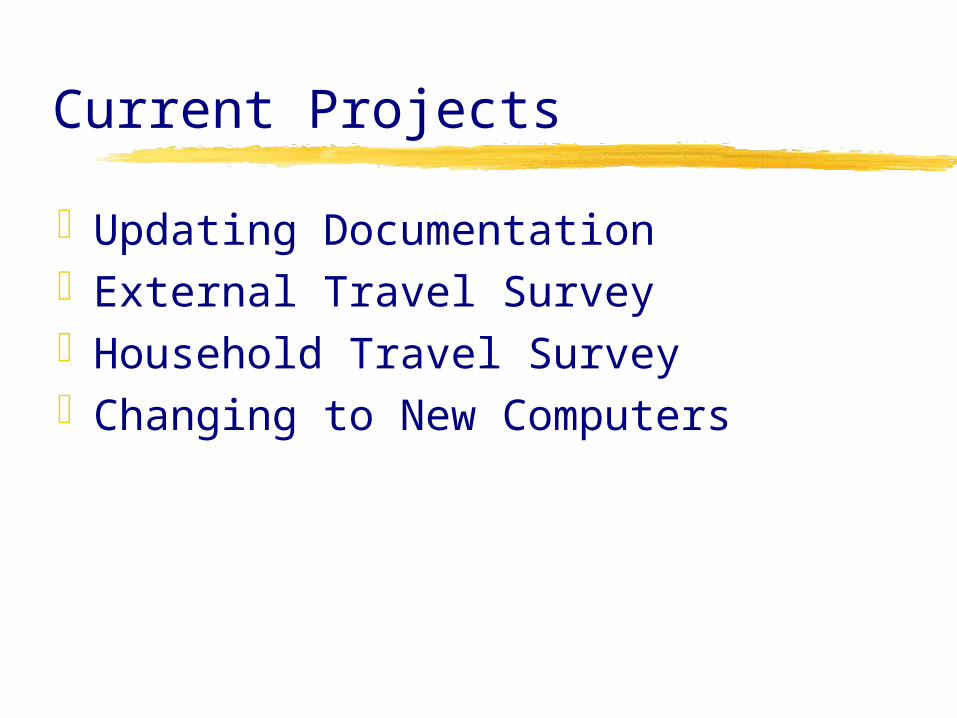
Current Projects
Updating Documentation External Travel Survey Household Travel Survey Changing to New Computers

Transportation Planning
Modeling with EMME/2