Transportation Market Update
17
Transportation Market Update August 20, 2021
Transcript of Transportation Market Update

Transportation Market Update
August 20, 2021

TRANSPORTATION MARKET UPDATE
Schneider’s goal is to provide the latest market insights to help you navigate the ongoing market volatility.
Whether moving a critical load, keeping your supply chain going or long-term planning, Schneider remains committed to
safely and securely delivering your freight.
Schneider leverages data and analytics from multiple sources to provide the most up-to-date insights available
including, but not limited to, FTR, DAT, FreightWaves SONAR, Cass Information Systems, Inc., FleetOwner, FMCSA,
The New York Times, ATRI and Transport Topics. For the latest information and updates, visit Schneider’s Trending
Topics page.

MISS OUR LATEST VIRTUAL EVENT? WATCH IT ON-DEMAND!SUPPLY DIGITIZATION TODAY AND TOMORROW
Join us for a discussion on the state of supply chain technology
today, where the value lies and how you create a roadmap to
the best strategies for your business. Some topics we
will cover are:
• Taking digitization beyond shipment level tracking and
utilizing data to optimize supply chains.
• Technology architecture ecosystems including
Transportation Management Systems (TMS), Warehousing
Management Systems (WMS), Application Program
Interfaces (API’s) and more.
• How the industry is approaching the exploration and
development of technology to meet shipper needs.
Watch now
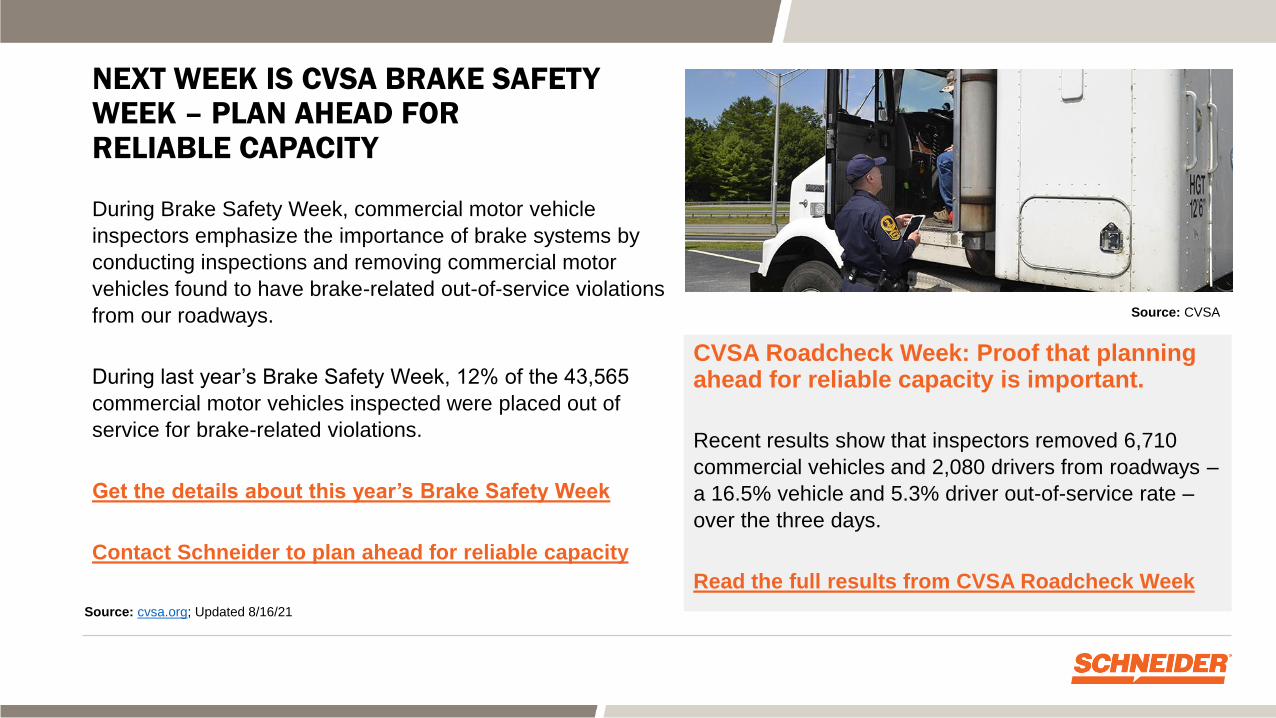
NEXT WEEK IS CVSA BRAKE SAFETY WEEK – PLAN AHEAD FOR RELIABLE CAPACITY
During Brake Safety Week, commercial motor vehicle
inspectors emphasize the importance of brake systems by
conducting inspections and removing commercial motor
vehicles found to have brake-related out-of-service violations
from our roadways.
During last year’s Brake Safety Week, 12% of the 43,565
commercial motor vehicles inspected were placed out of
service for brake-related violations.
Get the details about this year’s Brake Safety Week
Contact Schneider to plan ahead for reliable capacity
Source: CVSA
CVSA Roadcheck Week: Proof that planning ahead for reliable capacity is important.
Recent results show that inspectors removed 6,710
commercial vehicles and 2,080 drivers from roadways –
a 16.5% vehicle and 5.3% driver out-of-service rate –
over the three days.
Read the full results from CVSA Roadcheck Week
Source: cvsa.org; Updated 8/16/21

IN THE NEWS: INDUSTRY APPLAUDS SENATE PASSAGE OF $1 TRILLION BILL TO MODERNIZE U.S. TRANSPORTATION
Regarding trucking policy, the legislation would:
– Approve an apprenticeship for truckers younger than
21 to operate commercial vehicles interstate.
– Establish a truck-leasing task force.
– Direct the secretary of transportation to further
research side-underride guards for commercial
vehicles.
– Require the U.S. Department of Transportation to
analyze the effectiveness of electronic logging
devices.
– Require certain commercial motor vehicles to be
equipped with an automatic emergency braking
system.
– Reauthorize the premier federal highway law, which
expires at the end of September.
Source: ttnews.com; 8/16/21
Source: Amanda Andrade-Rhoades/Bloomberg News
Read article
On August 10, senators voted 69-30 to pass the $1 trillion Infrastructure Investment and Jobs Act. Of which $550 billion in new funds to modernize highways, bridges, tunnels and a transportation system in need of major upgrades.

IN THE NEWS: CARGO AIRLINES CANCEL HUNDREDS OF CHINA FLIGHTS AMID COVID OUTBREAK
• China is trying to contain the spread of the Delta variant,
and it's affecting global supply chains during Peak Season.
• Lockdowns have been curbing production, now the Port of
Ningbo has closed and hundreds of air cargo flights have
been cancelled.
• Logistics experts say rates are likely to skyrocket because
the service cutbacks are hitting at the same time demand
to move seasonal holiday goods increases and many
businesses turn to air because of massive backlogs in
ocean shipping. o Source: Flickr/hans-johnson CC BY 2.0
Read article
Sources: freightwaves.com; 8/16/21

IN THE NEWS: CHIP SHORTAGE SINKS MEXICAN AUTO EXPORTS IN JULY
• Automobile manufacturing in Mexico fell 27% in July compared to the same month last year, while exports fell 24% year-over-year, according to Mexico’s National Institute of Statistics and Geography (INEGI) due to the semiconductor shortage.
• More than 76% of the vehicles assembled in Mexico were exported to the U.S., followed by Canada (6.7%), Germany (5.3%), Colombia (1.5%) and the United Arab Emirates (1.4%).
Read the full article
Sources: freightwaves.com; 8/16/21
Source: Sean Gallup via Getty Images
Source: Jim Allen/FreightWaves

Source: nytimes.com; Updated 8/16/2021
COVID-19 CASES ARE AT THEIR HIGHEST RATE IN SIX MONTHS AS THE DELTA VARIANT
CONTINUES TO TEAR ACROSS THE COUNTRY – ESPECIALLY IN THE SOUTHEASTERN U.S.

AS VACCINATION RATES SLOW, MANY STATES AND COUNTIES WITH LOW VACCINATION RATES HAVE BEEN HIT HARD BY THE LATEST CASE SURGE.
Providers are administering about 713,000 doses per day on average, about an 79 percent decrease from the peak of 3.38 million reported on April 13.
Source: cdc.gov, nytimes.com, nytimes.com; Updated 8/16/21
Percent of population vaccinated (8/2/21)
VaccinatedFully
vaccinated
United
States59% 51%
Canada 73% 64%
Mexico 43% 23%
More than 4.72 billion vaccine doses have been administered worldwide, equal to 61 doses for every 100 people.

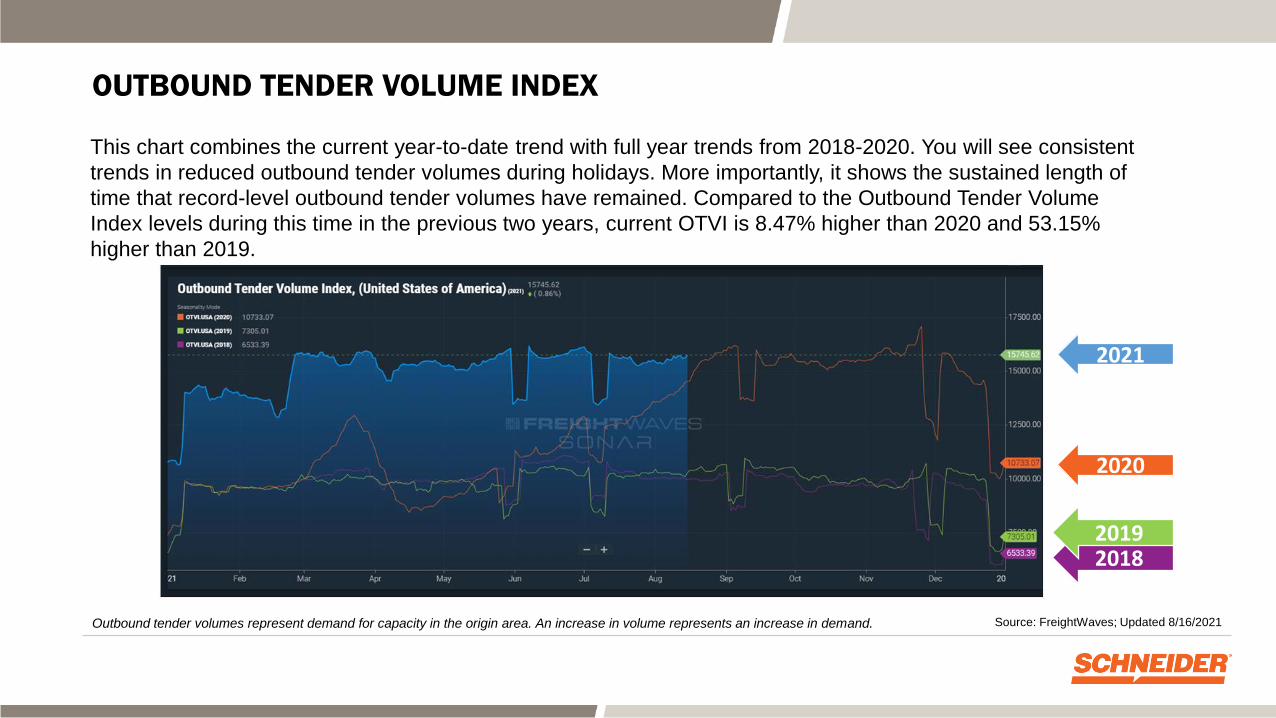
OUTBOUND TENDER VOLUME INDEX
Outbound tender volumes represent demand for capacity in the origin area. An increase in volume represents an increase in demand. Source: FreightWaves; Updated 8/16/2021
2018-2019
2021
2019-2020
Important Reminder: As you review the next slides and the related YoY data, keep in mind that it was in April of 2020 when we saw
tender volumes and rejects begin to plummet as businesses were forced to close due to lockdowns caused by the COVID-19 pandemic.
The Outbound Tender Volume Index bottomed out on April 16th at 8439.35, while Overall Outbound Tender Rejects bottomed out on April
30th at 2.57%. After this time, both volumes and rejects began their slow climb upwards to extremely elevated levels.
Compared to the Outbound
Tender Volume Index levels
during this time in the previous
two years, current OTVI is 8.47%
higher than 2020 and 53.15%
higher than 2019.
Outbound tender volumes represent demand for capacity in the origin area. An increase in volume represents an increase in demand. Source: FreightWaves; Updated 8/16/2021
20182019
This chart combines the current year-to-date trend with full year trends from 2018-2020. You will see consistent
trends in reduced outbound tender volumes during holidays. More importantly, it shows the sustained length of
time that record-level outbound tender volumes have remained. Compared to the Outbound Tender Volume
Index levels during this time in the previous two years, current OTVI is 8.47% higher than 2020 and 53.15%
higher than 2019.
OUTBOUND TENDER VOLUME INDEX
2020
2021

Outbound Tender Rejects are declining but are still sitting at 21.58% overall. Truckload rejects are at 22.46%,
Flatbed rejects are around 33.19% and Reefer rejects are highest at 25.11%.
Outbound tender rejects are an indication of available capacity in the origin market of the freight. If rejections are increasing,
capacity may be tightening in that area.
OUTBOUND TENDER REJECT INDEX
Source: FreightWaves; Updated 8/16/2021
Truckload & Flatbed
Refrigerated

The graph below details outbound tender rejects based on length of haul, regardless of mode. Since our
last report, rejects have slightly increased all lengths of haul.
City/local (< 100 miles): 8.48%
Short-haul (100-250 miles): 17.37%
Mid-haul (250-450 miles): 28.31%
Tweener (450-800 miles): 29.62%
Long-haul (800+ miles): 21.16%
Source: FreightWaves; Updated 8/16/2021
OUTBOUND TENDER REJECT INDEX BY LENGTH OF HAUL
Outbound tender rejects are an indication of available capacity in the origin market of the freight.
If rejections are increasing, capacity may be tightening in that area.

TRUCK FREIGHT RECOVERY INDEX
Seasonally adjusted freight activity increased 2.5% as a slight decline in flatbed offset stronger gains in dry van and flatbed.
Volume was about 23% lower than the weather-related peak in February peak but about double the pre-pandemic base.
Read more
Source: Truckstop.com Spot Market Insights
Analysis by FTR | Transportation Intelligence
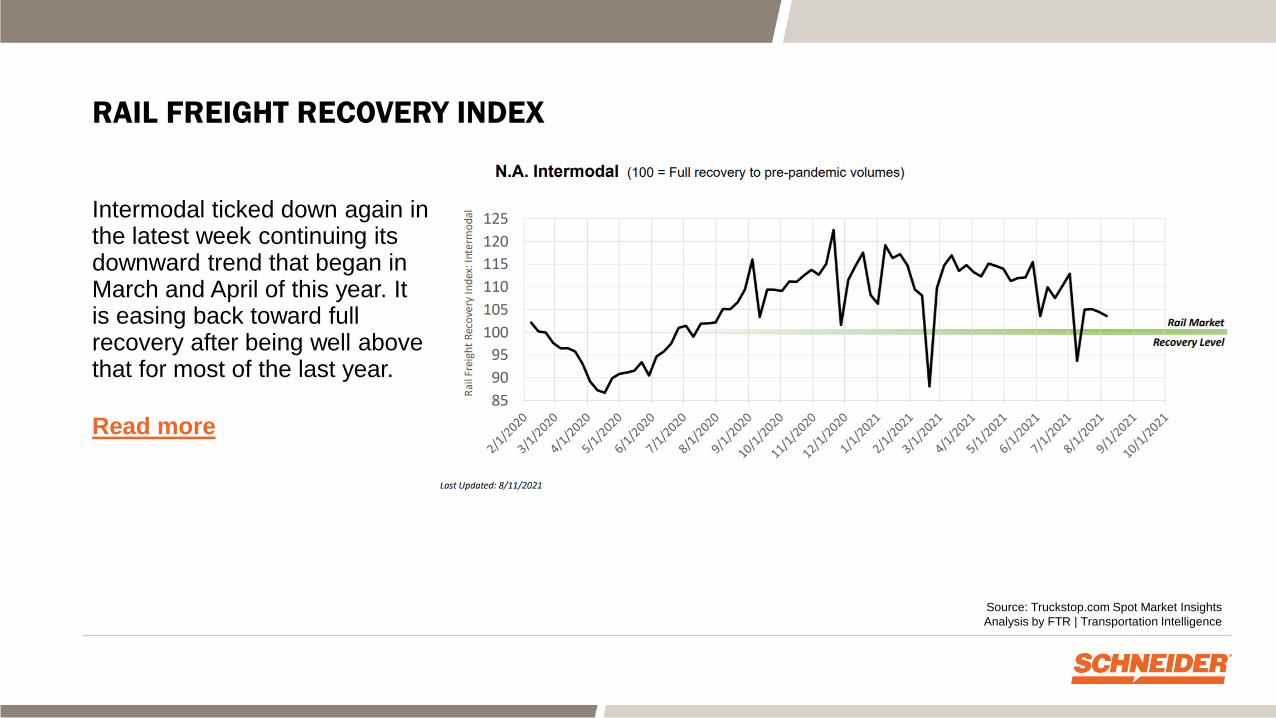
RAIL FREIGHT RECOVERY INDEX
Intermodal ticked down again in the latest week continuing its downward trend that began in March and April of this year. It is easing back toward full recovery after being well above that for most of the last year.
Read more
Source: Truckstop.com Spot Market Insights
Analysis by FTR | Transportation Intelligence

GET FULL TRACKING VISIBILITY WITH SCHNEIDER FREIGHTPOWER®
Know where freight is at all times with real-time updates for all loads (available for all Schneider service offerings except dray). You also always have the ability to track your freight right from Schneider.com/track.
• See your loads in progress and the ETA to consignee.
• Set up email notifications when a load is picked up or delivered.
• Subscribe to daily tracking reports via email.
• Registration to see all details is free and only takes a few minutes.
Track my loads | Get started