Guidelines Environmental Sustainability Policy and Guidelines

TRANSPORTATION IMPACT ANALYSIS GUIDELINES FOR ENVIRONMENTAL REVIEW
October 2002
The Planning Department City and County of San Francisco

Transportation Impact Analysis Guidelines October 2002
TABLE OF CONTENTS I. Introduction 1 II. Overview of Process and Procedures 2 III. Study Report Preparation Guidelines 5
1. Project Description 5
2. Project Setting 6
3. Travel Demand Analysis 9
4. Transportation Impact Analysis 10
A. Traffic Impacts 10 B. Transit Impacts 11 C. Parking Impacts 12 D. Pedestrian Impacts 13 E. Bicycle Impacts 14 F. Freight Loading and Service Impacts 15 G. Passenger Loading Zones 16 H. Construction Impacts 16
5. Transportation Mitigation Measures 17
6. Appendices for Inclusion in Transportation Reports 18
Appendices
A. Figures: Forms and Maps
Figure A-1; Process Memorandum A-1 Figure A-2; Approval Form A-3 Figure A-3; Map of Superdistricts A-4 Figure A-4; Map of C-3 District A-5 Figure A-5; Map of Greater Downtown Area A-6
B. Intersection LOS Analysis Methodology B-1

Transportation Impact Analysis Guidelines October 2002
C. Trip Generation Methodology C-1 Table C-1. Trip Generation and Employee Densities C-3
Table C-2. Percentage Splits between Work & Non-Work Trips C-4
D. Trip Distribution, Mode Split and Trip Assignment Methodology D-1
E. Trip Distribution, Mode Split, and Auto Occupancy Tables by Trip Type and Origin and Destination
Table E-1. Work Trips to C-3 District; Office E-1 Table E-2. Work Trips to C-3 District; All Other E-2 Table E-3. Work Trips to SD-1; All E-3 Table E-4. Work Trips to SD-2; All E-4 Table E-5. Work Trips to SD-3; All E-5 Table E-6. Work Trips to SD-4; All E-6 Table E-7. Visitor Trips to C-3 District; Office E-7 Table E-8. Visitor Trips to C-3 District; Retail E-9 Table E-9. Visitor Trips to C-3 District; All Other E-11 Table E-10. Visitor Trips to SD-1; Retail E-13 Table E-11. Visitor Trips to SD-1; All Other E-15 Table E-12. Visitor Trips to SD-2; Retail E-17 Table E-13. Visitor Trips to SD-2; All Other E-19 Table E-14. Visitor Trips to SD-3; Retail E-21 Table E-15. Visitor Trips to SD-3; All Other E-23 Table E-16. Visitor Trips to SD-4; Retail E-25 Table E-17. Visitor Trips to SD-4; All Other E-27 Table E-18. Work Trips to Van Ness District; All E-29 Table E-19. Visitor Trips to Van Ness District; All E-30 Table E-20. Residents of Van Ness Ave.; Work Trips E-31 Table E-21. Residents of Van Ness Ave.; Non-Work Trips E-32 Table E-22. Work Trips to Chinatown; All E-33
F. Transit Analysis Methodology F-1 Figure F-1. MUNI Screenlines F-8
Figure F-2. Regional Transit Screenlines F-9 Table F-1. MUNI Screenline Data F-10 Table F-2. Regional Transit Screenline Data F-11
Table F-3. Transit Operations Level of Service (TOLOS) F-12

Transportation Impact Analysis Guidelines October 2002
G. Parking Analysis Methodology G-1 Commercial Parking Demand G-1 Residential Parking Demand G-2
H. Freight Loading and Service Methodology H-1
Table H-1. Truck Trip Generation Rates H-2 Table H-2. Daily Service Vehicle Activity H-3 Hotel Guest Vehicular Loading/Unloading Space Needs H-4
I. Typical Transportation Mitigation Measures for the Downtown Area I-1
J. Required Transportation Management Programs and Brokerage Services for C-3 and SOMA Office Development J-1
Selected Sources SS-1

Transportation Impact Analysis Guidelines October 2002
0

Transportation Impact Analysis Guidelines October 2002
1
I. Introduction These guidelines replace the Transportation Impact Analysis Guidelines which were originally prepared in 1991 and updated on an interim basis in 2000 to aid consultants in preparing transportation impact analysis for environmental evaluation in San Francisco, including both Environmental Impact Reports (EIRs) and Negative Declarations. In those cases where a transportation study is required for environmental analysis, it is normally necessary that a separate transportation report be prepared, based on these guidelines, as background for the Negative Declaration or EIR. The Planning Department will make a determination whether a transportation study and report are necessary. In most cases, the department evaluates conditions in the PM peak hour of the PM peak period (4:00 to 6:00PM). This period was chosen because it is the time period when the maximum use of much the transportation system occurs. It is also the time when most of the transportation system capacity and service is at a maximum. Generally, a transportation report may be required for an environmental analysis if one or more of the following conditions apply. Not all conditions apply to all projects. 1) The project would potentially add at least 50 PM Peak Hour person trips; 2) The project would potentially increase existing traffic volumes on streets in its vicinity
by at least 5 percent; 3) The project would potentially impact nearby intersections and/or arterials which are
believed to presently operate at LOS "D" or worse; 4) The project would provide parking which would appear likely to be deficient relative to
both the anticipated project demand and code requirements by at least 20 percent; 5) The project has elements which have potential to adversely impact transit operations
or the carrying capacity of nearby transit services; 6) The project has elements which have potential to adversely affect pedestrian or
bicycle safety or the adequacy of nearby pedestrian or bicycle facilities; 7) The project would not fully satisfy truck loading demand on-site, when the anticipated
number of deliveries and service calls may exceed ten daily. Transportation reports shall be prepared by qualified consultants, working at the direction of the Planning Department staff. The purpose of the transportation study is to provide the comprehensive information necessary to identify the transportation issues and impacts of a project (including those of importance and significance), and provide potential solutions or mitigations to problems and significant impacts in the context of the overall policies and objectives of the City.
Transportation Impact Analysis Guidelines October 2002
2
II. Overview of Process and Procedures These guidelines update and revise the Guidelines for Environmental Review: Transportation Impacts (July, 1991) and Interim Transportation Impact Analysis Guidelines for Environmental Review (January 2000), and supersede all previously published transportation analysis guidelines. This document reflects the most current data available regarding San Francisco travel characteristics. A major portion of the analysis guidance is based on the findings of the Citywide Travel Behavior Survey - Employees and Employers (May, 1993), the Citywide Travel Behavior Survey - Visitor Travel Behavior (August, 1993), and updates or enhancements to those reports. In addition, the Guidelines employ certain findings and assumptions from major San Francisco study reports, including those for: Mission Bay (Case No. 1996.771E; EIR certified September 17, 1998); Transbay Terminal/Caltrain Extension (Case No. 2000.048E); and Van Ness Avenue (Case No. 1987.586; EIR certified on December 17, 1987). The data in the Citywide Travel Behavior Study (CTBS) was subsequently confirmed by the 1995 Citywide Travel Behavior Study that was sponsored by the San Francisco County Transportation Authority. It should be noted that these are only guidelines. It must not be assumed that the information provided herein constitutes a complete scope of work for any transportation analysis. The Guidelines provide a broad overview, while individual transportation study scopes of work are required to provide a level of detail tailored to fit the size and complexity of transportation issues associated with particular projects. Moreover, once a scope of work is prepared and approved under the direction of the Planning Department, the specific direction contained within that scope will provide a more precise focus than that which appears in these Guidelines. For clarification, the following represents an overview of the process involved in the preparation of a transportation impact analysis for environmental review purposes. No estimate or assumption is made or inferred regarding time lines for the various steps. (1) The project sponsor or a designated representative files an Environmental
Review (EE) application with the Planning Department following the instructions contained in that application form (available at the Department and on-line). When the application is accepted by the Department, a case number is assigned and a staff person from the Department's Major Environmental Analysis section is designated as the coordinator for environmental review. This individual will likely be different than the staff person handling the Transportation Impact Report. All Department staff assigned to the project will coordinate activities throughout the review process. Filing for environmental review generally (but not always) precedes starting the review of transportation issues.
2) Determination concerning whether a transportation impact report is required is
based on the scale, location, and/or potential level of activity of the proposed

Transportation Impact Analysis Guidelines October 2002
3
project. To make this determination and/or to prepare a transportation work scope, if one is required, the project sponsor should provide the following information to the assigned environmental coordinator or to a senior transportation planner in the Major Environmental Analysis section:
• existing and proposed specific gross square footage of space for each commercial use such as office, retail, restaurant, hotel (including number of rooms), industrial, etc;
• existing and proposed number and type of housing units (including
live/work units) including the number of single and multiple bedroom units, and senior, affordable, rental, or owner-occupied designations;
• existing and proposed amount of off-street parking and loading space,
including specification of supply relative to Planning Code requirements;
• existing and proposed location of driveways and site plan showing access to off-street parking and/or loading;
• location of bus stops, nearby curbside loading zones and designations for
all curbside space along the frontage of the property. Upon receipt of the above material, Department staff will determine whether a transportation study is required. This decision is generally based on factors such as those articulated in the introduction to these Guidelines and staff knowledge of transportation issues in the site vicinity. (3) If it is determined that preparation of a transportation report is warranted, a transportation scoping meeting will be scheduled with the transportation planner, the environmental staff coordinator (other Department staff may also be
involved), the project sponsor, and the transportation consultant and environmental consultant hired by the project sponsor. The scoping meeting will determine the specific issues to be examined in the transportation impact report and determine other parameters as defined in these guidelines.
All fees are to be paid by the project sponsor to the Planning Department for the review of the Transportation Impact Report prior to scheduling a transportation
scoping meeting for the project. The amount of these fees can be obtained from Department staff. (See Appendix A, Figure A-1 for details on this process.) (4) The transportation consultant will then prepare a draft transportation scope of work for Departmental review and revision(s), if necessary, for final approval. No work should be initiated by the transportation consultant until a written scope of work has been approved by the Department, including the

Transportation Impact Analysis Guidelines October 2002
4
assigned transportation and environmental planners, by transmittal to the consultant of the Planning Department approval form. (See Figure 2 in Appendix A)
The Department will make every reasonable effort to anticipate and include in the scope of work typical concerns of other City agencies. However, it is not possible for the Department to anticipate all issues and concerns which later may be raised by other City Departments such as the Municipal Railway (MUNI) or the Department of Parking and Traffic (DPT). Ultimately, the scope of work may need to be revised after its approval so that it adequately addresses relevant issues raised by all other City agencies and other relevant issues that may arise in the course of preparing the study report. Any contractual arrangement between the project sponsor and its consultant preparing the transportation report should reflect the flexibility to address the above issues as they are raised. (5) Based on the approved scope of work, the transportation consultant conducts the required analysis independent of the project sponsor, and submits five copies of all drafts directly to the environmental project coordinator for review, comment, and approval. Three copies will be used within the Planning Department, one copy will be provided to MUNI, and another to the Department of Parking and Traffic. It is recognized that more than one submittal of preliminary transportation findings will normally be necessary in order to achieve a satisfactory final transportation report. Under normal circumstances, two drafts of a transportation study will be required before it is accepted as final. The Planning Department staff will provide consultants with a coordinated set of comments from all City reviewers on each draft. Consultants should revise draft reports to reflect City comments as directed, and should provide a detailed written explanation if any comments are not reflected in subsequent submittals.
(6) Pertinent information from the final transportation report will be summarized for inclusion in an Environmental Impact Report (EIR) or Negative Declaration. The specific information to be extracted and summarized for inclusion in an EIR or Negative Declaration, will be determined on a case-by-case basis under the direction and guidance from the environmental staff person assigned to the project.
The selection of the transportation consultant is at the discretion of the project sponsor, contingent upon submittal of an acceptable work scope to Department staff. The consultant's work effort is, however, to be entirely under the direction of the assigned Department staff. All submittals by the consultant are to be made directly to the assigned coordinator of the overall environmental review in the Department's Major Environmental Analysis section. Any comments by the project sponsor or its representatives must be directed to Department staff rather than to the environmental and/or transportation consultants to ensure the objectivity of the analysis. The role of
Transportation Impact Analysis Guidelines October 2002
5
the project sponsor and its representatives during the preparation of the transportation report should be limited to provision of details concerning the project, response to recommended changes affecting project circulation, and indication of support or lack of support for recommended mitigation measures and other transportation improvements identified in the impact report. Transportation analysis can be a complex and lengthy process. The Department strongly advises that it begin as early as possible, to avoid unnecessary delays. The Department also recommends that the consultant follow the explicit parameters found in the scope of work. III. Study Report Preparation Guidelines Each transportation impact report is to follow a consistent format, as presented here, and include all of the elements and information presented in these Guidelines. The appropriate level of detail needed for each project’s transportation impact analysis with respect to particular issues will be specified in the transportation work scope developed at the scoping meeting. When these Guidelines are referenced in a transportation study report, we suggest using either the full title and date, or the “2002 Transportation Guidelines” so the version is properly identified. 1. Project Description All analyses must include a detailed project description. This information is to be presented as the first section of the document. The project description typically includes the following information:
• Case file number for the project, as assigned by the Department.
• Location of the project site, address, Assessor's Block and Lot number(s), cross streets, and Superdistrict or C-3 District ( Refer to Appendix A for maps showing the Superdistricts and the C-3 District).
• Figure showing the site plan.
• Existing and proposed total gross square footage for each land use type
and the number of units for residential, hotel/motel, and live/work projects including the net changes for each type of use.
• Existing and proposed estimated number of employees and/or dwelling
units by type of use, including net changes, if available.
• Existing and proposed number of off-street parking spaces and whether any on-street or off-street parking spaces will be removed as a result of
Transportation Impact Analysis Guidelines October 2002
6
the project.
• Existing and proposed number of off-street and on-street freight loading spaces as well as any proposed changes affecting on-street loading spaces.
• Description and plans for use (if any) of public rights-of-way by present or
proposed uses, either above or below grade (e.g., air rights, surface or subsurface revocable permits, etc.) including sidewalk width changes, changes in width or number of traffic lanes, function of lanes in terms of traffic channelization, and/or direction of travel.
• Detailed plans showing vehicular and pedestrian site access, including
location of curb cuts for both existing and proposed uses, and internal vehicular circulation, presented in standard architectural or engineering scale.
• Figure identifying parking spaces, the proposed egress and ingress to the
parking garage or lot, the circulation pattern within the parking facility and the number and location of parking spaces for the disabled.
• Figure showing the location, dimensions and access to the off-street
freight loading spaces as well as the on-site location for trash and garbage storage.
• Identification of all transportation-related approval actions required by any
City department including use permits, variances, encroachment permits, and changes in public rights-of-way. Describe the specific action.
• Identification of the location, number and type of bicycle parking spaces
provided.
• Information regarding the project site’s lot area, existing and proposed zoning, and a figure with the location of the lot on the Assessor’s Block.
2. Project Setting The setting information shall be presented immediately following the Project Description as a discrete chapter or report section. The goal is to provide a brief but complete description of existing transportation infrastructure and conditions in the vicinity of the project. Normally, the described vicinity is a radius between two blocks and 0.25 mile, however, a larger area may be determined in the scoping process.

Transportation Impact Analysis Guidelines October 2002
7
The specific perimeters of the study area, for both setting and project impact analysis, are to be confirmed as part of the approval for the scope of work. It should be noted that when the boundaries of a study area are determined in a scope of work, the project area should include both sides of the streets designated as the project boundaries unless otherwise specified (e.g., for on-street parking surveys). Sometimes the study area differs for different purposes, e.g., traffic vs parking vs transit. The Setting section typically includes the following text information but the level of detail to be provided should be according to specific direction in the transportation scoping meeting:
• Street designations and classifications as identified in the Transportation Element of the San Francisco General Plan. These designations can be found on the following maps in the General Plan: Vehicular Street Map; Congestion Management Network; Metropolitan Transportation System; Transit Preferential Streets; Citywide Pedestrian Network; Neighborhood Pedestrian Streets; and Bicycle Route Map.
• A description of the study area streets, including the number and width of lanes,
direction of flow, and the presence of peak period tow-away lanes affecting roadway travel capacity, the presence of bicycle lanes, and any other significant street information.
• Access to regional highways and freeways, including location of, distance from,
and routings to and from on-ramps and off-ramps.
• Description of public transit routes operating on streets within the study area, including: route character; service areas; hours of service; peak period headways; and type of vehicle (diesel coach, trolleybus, streetcar, light rail vehicle; etc.). For projects subject to Section 321 of the Planning Code (Office Development: Annual Limit), the report must specifically identify, by operator, all lines within 1/4, 1/3, and 1/2 mile radii of the site.
• Level of Service (LOS) analysis for existing conditions for the specific
intersections identified in the scope of work for the PM peak hour or other hours if specified in the scope of work. Unless otherwise specified, the operations method of the 2000 Highway Capacity Manual (HCM) shall be used in the analysis of intersections. The date on which the data was collected for the analysis must be specified in the text and on the calculation sheets. The methodology for the calculation of the LOS for various types of intersection controls is provided in the Appendix B.
• Actual and effective widths of sidewalks immediately adjacent to the project site.
For areas where the sidewalks are absent or known to be deficient, the official

Transportation Impact Analysis Guidelines October 2002
8
sidewalk width should be included. (Information on the official or legislated widths is available from Department of Public Works, Maps and Surveys.) For the streets immediately adjacent to the project site, this may include the location of fire hydrants, light poles, MUNI poles, traffic control devices, and other significant physical items between the curb and property line.
• Characteristics of parking within the study area (typically within a two-block
radius of the site, but as determined in the approved scope of work), including the number of on-street parking spaces, control of on-street parking (e.g., meters, signed for time limit, neighborhood residential permit parking, etc.) number of off-street parking facilities and spaces (public and private), and whether off-street parking is provided as independently-accessible stalls or tandem/stacked valet operation. On-street and off-street parking occupancy information should be provided for the time period(s) specified in the scope of work. The data collection periods for peak parking occupancies typically are mid-afternoon for commercial uses and early evening for residential uses. The effects of any special circumstances affecting the availability of parking in the vicinity of the proposed project (e.g., periods of peaking in parking demand, and large generators of localized parking demand, such as a major institution) should be identified.
The Setting section typically also provides graphics, including:
• Street maps of the study area showing: street names, number and direction of lanes; transit service by line number and with stop locations identified; the location and amount of parking facilities, and the location and class of bicycle lanes. For projects subject to Section 321 of the Planning Code, the transit map is to show transit lines and stops within 1/4, 1/3 and 1/2 mile radii lines.
• When appropriate, include mapping and supporting tables which show both off-
street and on-street parking conditions in study area. For off-street parking inventories, the parking supply should be based on how facilities are actually operated, i.e., the number of spaces should be based on valet parking when this is used and on striped spaces when this would be appropriate. For on-street parking only, inventories should include parking on each side of all the streets within the parking study area. On-street parking inventories should identify spaces subject to Residential Permit Parking (RPP) areas, whether the proposed project would be eligible to participate in the RPP, and what the project’s impact on area parking occupancy rates would be.
• All designated bicycle routes in the study area should be illustrated. The existing
treatments for bicycles (e.g., Class 2 or Class 3) and any proposed treatments for bicycle routes as well as general characterization of the extent of bicycle usage should be described.

Transportation Impact Analysis Guidelines October 2002
9
3. Travel Demand Analysis Travel demand analysis shall include textual information, supported by tables or figures detailing the project’s trip generation, trip distribution, trip assignment and modal split characteristics. Net new travel demand generated by the project is to be estimated, based on the difference between existing and proposed land uses. Person trip generation rates per unit of square footage for each land use, or other unit as shown in Appendix C, are to be used for estimating levels of activity for the proposed project. The rates were developed by an examination of various studies and sources, including the Citywide Travel Behavior Study, the ITE Trip Generation manual and special purpose studies, many of which are specific to San Francisco. No single source or analysis provides, by itself, an adequate means to define trip generation for all the situations encountered in San Francisco. Trip generation rates may sometimes need to be determined by other means, such as surveys of similar land uses, if so specified in the scope of work. To “net-out” existing land uses that will be replaced, the existing levels of trip activity should, in most cases, be based on actual observations rather than on estimates based on rates in these Guidelines or other sources. Each analysis should apply the trip generation rates from the Guidelines individually to the proposed uses, compare the proposed trips to existing levels of trip activity, and show the differences ("net new") by land use and in aggregate. The Travel Demand Analysis is to include the following, unless otherwise directed in the work scope (Note that different or additional analysis periods may be defined in the scope of work process.) :
• Trip Generation Information: Project trip generation information (total person trips) by land use for existing and proposed uses. The total unadjusted daily and P.M. peak hour trips by mode can be calculated. The number of daily and peak hour vehicles (autos) generated by the project should also be calculated by using the auto occupancy rates noted in the tables in Appendix E.
• Work and Non-Work Trip Generation Information: Since work and non-work trips
have different characteristics in terms of distribution and the mode of travel, the number of work and non-work (visitor) trips should be calculated separately. Appendix C provides the methodology to compute the work and non-work

Transportation Impact Analysis Guidelines October 2002
10
(visitor) trips for a specific land use.
• Trip Distribution, Assignment and Modal Split Information: Net new person trips distributed to various directions of travel and assigned to the appropriate modes of travel (auto, transit, walk, and other) should be calculated, presented in tables and a graphic diagram (for vehicle and transit trips), and discussed in the text. Modal assignments should also be calculated for daily and the P.M. Peak Hour.
The weekday P.M. Peak Period is generally 4:00-6:00, and traffic counts shall generally be conducted during this period, unless otherwise specified in the scope of work. The peak hour must be determined from the counts (normally recorded in 15 minute intervals) for the entire peak period, and should represent the single hour within the peak period with the highest counts. The Planning Department may also request data for other periods to reflect the peak period of trip generation by the land use. 4. Transportation Impact Analysis Analysis for all projects is to be conducted for project-specific impacts, and for cumulative impacts. A. Traffic Impacts Project-Specific Impacts. The project generated traffic impacts must be calculated for intersections identified in the scope of work using the methodologies explained in Appendix B. LOS levels for the specified intersections must be discussed in the text and presented in a table showing Existing, Existing plus Project and Cumulative intersection levels of service. The traffic attributable to the project is normally assumed to be included in the cumulative forecast, and should not be added to the cumulative totals. The percent contribution of the project should be shown both as a percentage of the total cumulative traffic and as a percentage of the growth in traffic (cumulative less existing) for each intersection. The specific intersections to be analyzed will be identified in the approved scope of work for the transportation analysis, and based on an initial assessment of areas that could be impacted by the project. When a wide area may be impacted, the intersections selected for analysis may only be those that would experience the greatest change or have the greatest likelihood of degrading to an unacceptable LOS with the addition of the project traffic. Cumulative (Horizon Year) Impacts. The transportation impact analysis should present and discuss the cumulative traffic impacts. The horizon year (normally 10 to 20 years in the future, depending on the location) should be used for the cumulative analysis year unless otherwise specified in the scope of work. The analysis is to assume a growth factor of one percent per year for "background" traffic, unless an areawide cumulative

Transportation Impact Analysis Guidelines October 2002
11
forecast is defined during the scoping process. Traffic generated by the project, and by nearby projects when applicable, are to be expressed as a percentage of this overall growth factor. If the localized share seems to represent an unreasonable share of the anticipated overall horizon year growth, the consultant will need to discuss the issue with Department staff who will determine the appropriate approach to determining the cumulative conditions. Figures should be included for each intersection analyzed which clearly indicate growth for each movement generated by the project and from cumulative conditions compared to existing conditions. For each analysis scenario (i.e., typically, Existing, Existing plus Project, and Cumulative), each of the critical movements at each intersection should be clearly indicated in the intersection calculation sheets and preferably in the figures which show volumes for each movement. The presence or absence of significant traffic impacts shall be determined according to direction from MEA transportation staff. B. Transit Impacts The specific methodology for analyzing transit impacts is included in Appendix F. For projects within the greater downtown area (C-3, SOMA and Mission Bay districts), the methodology for the cumulative (horizon year) condition for MUNI and the regional transit operators uses an approach based on a screenline analysis. For projects outside the greater downtown area, the level of analysis will depend on the nature of the project and the transit service within the study area. Transit trips, as determined by the travel demand analysis outlined in Section 3, need to be assigned to transit routes (aggregated or individual) based on the trip distribution data, and in accordance with the transit analysis methodology outlined in Appendix F. Trips on both MUNI and regional carriers must be accounted for. The normal evaluation requires a determination of the loading at maximum load points in relation to the available capacity for the Existing, Existing plus Project, and possibly a Cumulative condition. The frequency and load standards of the affected transit vehicles needs to be known if not contained within the aggregated data. Similar to traffic impact analyses, the focus is on conditions for the p.m. peak hour. Net new transit trips generated by the project should be cited and also expressed as a percentage of cumulative growth, by operator. Any transit analysis needs to consider the access to transit service from the project site. Normally, transit riders need to walk to a transit stop or station from the project site. This walk trip can influence the choice of a particular line, or even the mode itself, especially if the walk link is a difficult or unpleasant experience due to inadequate sidewalks, unsafe pedestrian crossings or other related circumstances. The analysis should determine whether sidewalk improvements or other pedestrian-related improvements are necessary in order to provide adequate access to transit service.
Transportation Impact Analysis Guidelines October 2002
12
Also, any potential transit conflicts or delays resulting from site-related activities need to be examined and described. C. Parking Impacts Parking supply, parking demand, and Code-required parking should be clearly distinguished. If there is already existing parking on the site, the amount of net new parking should be noted. The project’s parking supply is the amount of on-site parking spaces provided by the project that will be available for use by the project’s residents, employees or visitors. Parking demand is the amount of daily parking need generated by the proposed uses. The Code required parking is the number of parking spaces required by Section 151 of the San Francisco Planning Code for the proposed uses. Project parking demand is to be calculated for long-term demand (employees) and short-term demand (visitors) for commercial projects, and for resident parking demand for residential projects. In some situations (e.g., when overlapping work shifts of the project or adjacent uses cause an accumulation of parking demand greater than the daily average total), accumulated peak parking demand should also be quantified. Parking demand for commercial projects should be generally calculated based on the number of auto trips and auto occupancy rates from Appendix E for each superdistrict. Turn-over rates should be taken into consideration in calculating the daily short-term parking demand. Appendix G explains the methodology for parking demand calculations in more detail. In cases where more accurate information about parking demand and employee shift changes are available, this information may be used instead of derived from Appendix E, if incorporated in the scope of work. Residential parking demand should be calculated based on the information provided in Appendix G of this report. If a proposed project would displace existing parking, the report should identify: 1) the amount of parking which is required parking for the current uses on-site; 2) the amount of parking which is accessory parking to an off-site use; and 3) the amount of parking which is available to the general public (specifically
identify as: short term; long-term; independently accessible; or valet parking.) Project parking demand (including, if appropriate, demand for parking displaced) should be compared to the amount of parking provided by the project (supply), and the parking required by the Planning Code.

Transportation Impact Analysis Guidelines October 2002
13
Deficiencies or surpluses in the number of parking spaces relative to demand and/or Code requirements should be quantified. The manner in which any parking deficiency will be addressed, and its impact on the existing on-street and off-street parking supply in the study area, should also be identified. The impact of any deficiency in parking supply relative to the estimated demand, including current users of public parking to be displaced by the project, should be quantified in terms of the estimated increase in occupancy of available on-street and off-street facilities. The amount of parking to be provided for bicycles and the disabled should be cited and compared with Code requirements. Any designated on-street parking spaces for the disabled that may be used by those accessing the project should be noted. Parking access (ingress and egress) should be identified and the dimensions noted. Any impacts or conflicts of parking access with Transit Preferential Streets, other streets identified in the General Plan, streets identified for full or partial priority for pedestrians or bicycles, and any potential conflicts affecting transit, pedestrian, bicycle or vehicular flow should be identified. In cases where there are exceptional peaks in the traffic entering or leaving a garage, a queuing analysis may be necessary. Whenever on-site parking is proposed, sufficient details should be included to the extent possible in order to assess:
• potential for conflicts between ingress and egress traffic; • location of control gates, ticket dispensing facilities, and payment/validation
facilities; • adequacy of on-site space to avoid the potential for queueing onto adjacent
sidewalks and streets; • potential for conflicts with pedestrians, transit, bicycles, autos, and access for
other projects; • measures to functionally separate parking spaces for residential and commercial
uses; • quantity, locations, access, safe and secure character, and provisions for
associated showers and lockers for all bicycle parking spaces whenever required or provided; and quantity, dimensions and locations for all disabled parking spaces.
Any special circumstances affecting the availability of parking in the vicinity of the proposed project as identified in the Setting Section are to be taken into consideration in the analysis and noted.
Transportation Impact Analysis Guidelines October 2002
14
D. Pedestrian Impacts Pedestrian conditions and the project impact should be discussed qualitatively or quantitatively based on the project size and existing circumstances. The Planning Department will determine if a qualitative or quantitative analysis is necessary. If a quantitative analysis is required, pedestrian trips generated by the proposed project should be estimated for P.M. Peak Hour, plus the peak period of pedestrian activity for the immediate area (often in the midday), and/or the proposed project's peak period of trip generation. Level of Service conditions, when appropriate, for existing and existing plus project scenarios are to be calculated. Pushkarev and Zupan Pedestrian Level of Service Standards and Methodology for Average Flow Characteristics Related to Flow In Platoons, or the 2000 Highway Capacity Manual methodology are considered acceptable methodologies for the analysis; appropriate references are to be included. Midblock sidewalk or corner pedestrian Level of Service analyses may, in some situations, be requested in addition to or instead of Level of Service analysis at pedestrian crosswalk (intersection) locations. Pedestrian safety issues related to the project should be assessed. The study should examine potential conflicts between pedestrian movements at driveways, localized pedestrian hazards and, more generally, between pedestrians and vehicles. Any proposed changes affecting the public rights-of-way such as new or modified sidewalks or streets should be detailed and based on advance consultations with relevant City departments, including the Department of Public Works and the Department of Parking and Traffic. Pedestrian access to the project by the disabled should be discussed. Points of ingress and egress that are accessible to the disabled should be identified. Also, accessible curb-cuts or ramps, and other on-street aids for the disabled, on the adjacent streets should be noted. E. Bicycle Impacts The existence of current or future bicycle facilities in the area should be identified from the San Francisco Bicycle Plan and by consultation with the Department of Parking and Traffic. The analysis should examine possible impacts on bicycle traffic on the streets in the vicinity of the project. This would include potential conflicts between auto, truck and bus traffic serving the project during loading and unloading, and potential conflicts due to turning movements across bicycle lanes or routes. Potential barriers or hazards to safe bicycle operations near the project should also be identified. Other conditions that may have a notable negative or positive impact on use, such as bicycle parking or the provision of shower facilities, should also be stated. Details regarding the location and access to any bicycle facilities included in the project should be described in the textual discussion and clearly shown on the site plan included in the background transportation

Transportation Impact Analysis Guidelines October 2002
15
report. The information provided needs to be sufficient to ascertain whether the proposed bicuycle facilities would be secure and practical for bicyclists to use. If sufficient bicycle traffic exists or is anticipated on a study area street, it may be necessary to include a quantitative analysis of the impacts using the methodology in the 2000 Highway Capacity Manual or some similar technique. F. Freight Loading and Service Impacts Off-street truck loading requirements should be specified according to the Planning Code. The analysis should include a description of the frequency of the service deliveries and the estimated mix in the types of vehicles that will be utilized in the freight loading activities for the project. If it is expected that the project will attract a high level of courier and other service deliveries, the report should discuss how these will be accommodated. The analysis of the project should compare the amount of loading space provided by the project (supply) with truck loading demand generated by the project and with the off-street freight loading requirements in the Planning Code. Project truck loading demand and service rate for the peak loading period (which should be specified) and the entire day should be estimated based on proposed uses on the site (using the data shown in Appendix H), and compared with Planning Code requirements and the proposed on-site facilities. The truck loading supply is the number and sizes of off-street truck loading spaces provided by the project on-site. It should be compared to the truck loading demand that the proposed use would generate. The number and sizes of off-street freight loading spaces required should be determined based on Section 152 of the San Francisco Planning Code. The location, number and dimensions (including vertical clearance) of all spaces provided for freight and service functions, including van size spaces substituted for full size spaces, should be specified in the text and on a figure. The figure should indicate the location of freight elevators relative to all loading and service parking and clearly identify the circulation path between the loading/service stalls and elevators. If truck loading demand exceeds supply and/or if no off-street loading facilities are proposed to be included as part of the project, a quantification of the resulting impacts (e.g., time of day, number of instances and duration of double-parked vehicles) should be provided, and details may be required regarding how service needs would be accommodated. If truck movements would require backing into or out of the site on public rights-of-way, the resultant delays to traffic, transit vehicles and pedestrians should be characterized.

Transportation Impact Analysis Guidelines October 2002
16
Truck loading access affecting a Transit Preferential Street, or any street identified in the General Plan for full or partial priority for pedestrians, and any potential conflicts affecting transit, pedestrian or vehicular flow should be identified. In any case in which a project proposes to rely on curbside yellow loading zones, an occupancy and turnover analysis is to be conducted for existing curbside loading spaces in the immediate vicinity of the project site to estimate the probable availability of such spaces to serve the needs of the proposed project, based on the specific use(s) proposed and area conditions. Details should be provided adequate for analysis of garbage needs including dedicated on-site storage independent of loading areas, measures to avoid use of public rights-of-way for garbage storage in accordance with DPW requirements, and well-defined access to accommodate garbage pick-up in order to minimize disruptions to streets and sidewalks. G. Passenger Loading Zones If applicable, the extent of taxi, tour bus, or other types of passenger loading and unloading needs should be specified including details regarding how these functions would be served. Where a porte cochere or other off-street passenger loading area is required or provided, plans should be included showing the location, traffic and parking lanes, adjacent sidewalks, circulation patterns, and all dimensions. Any plans to seek colored, marked curbside areas from the Department of Parking and Traffic should be noted. For cases in which a project proposes to rely on curbside pedestrian loading zones, an occupancy and turnover analysis for similar curbside passenger loading spaces should be made to estimate the probable availability of such spaces to serve the needs of the proposed project, based on the specific use(s) proposed and area conditions. H. Construction Impacts The number of daily and peak period construction truck trips by construction phase should be cited, with proposed truck routings and operating hours indicated. Any proposed closures or temporary use of pedestrian ways, parking lanes or traffic lanes are to be identified, as well as the extent and duration of such closure or temporary use. Impacts associated with such occupation of public rights-of-way should be identified, in terms of parking lost, effect on transit operations, loading needs, or temporary degradation in levels of service for intersections and/or pedestrians. The need to remove or move any transit stops should also be noted. For large projects, the staging plans of construction trucks for materials delivery should be cited, and methods for addressing the parking needs of construction workers should be identified.
Transportation Impact Analysis Guidelines October 2002
17
5. Transportation Mitigation Measures Transportation reports are frequently used not only for environmental evaluation but also in the conditional use and other permit processes. It is important to recognize the differences between these processes. There are also cases in which the transportation analysis for a specific project may conclude that significant transportation impacts are unlikely and that mitigation is not required. If the project has impacts, but they are not considered “significant” as defined by CEQA standards, the analysis should clearly state this at the beginning of the significant impacts and mitigation section. These impacts may be referred to as “non-significant” impacts, and the corresponding measures to alleviate them, as “improvement” measures. They may include desirable measures to improve transportation conditions which may be recommended and subsequently included as conditions of approval. Any recommended improvement measures should be listed, accompanied by identification of the appropriate entity responsible for implementation. Such measures are not to be identified as "mitigation" measures. Mitigation measures required to deal with impacts determined to be environmentally significant according to CEQA standards should be clearly identified as such. If a mitigation or improvement is proposed for an intersection that will change the Level of Service (LOS), then the corresponding LOS calculation sheets need to be included in the report. The calculation sheet (or an attachment) should identify the parameters that were changed, and what specific changes are proposed, including consultation with DPT regarding the feasibility of the proposed changes. Whenever either type of measure is identified, the following should be cited:
• If the implementation would be the responsibility of the project sponsor, indicate whether the project sponsor supports or fails to support each specific recommendation.
• If implementation would be the responsibility of the City or another agency, the
responsible department or agency should be identified and its position on each recommendation should be stated.
• The timing and linkages for implementation of each measure, and whether a
monitoring plan is needed, should be specified.
Transportation Impact Analysis Guidelines October 2002
18
In some unique situations, a cost estimate for a mitigation or improvement measure may be required. Every attempt will be made to identify these cases during the scoping process. If an estimate is deemed necessary, it should be prepared at a “planning level” of detail, which would be more general and less rigorous than a construction cost estimate. Such estimates should indicate the month and year in which they were prepared, so they can be adequately assessed at some future date. Typical transportation mitigation measures for downtown area projects, to address significant impacts as defined by CEQA standards, are shown in Appendix I. While some of these may be appropriate for projects outside of the downtown area, mitigation measures for such projects would generally be a function of the specific conditions and impacts identified by the transportation study for each project. A transportation management program and on-site brokerage services are required for office developments of 100,000 square feet or larger (25,000 square feet in the SSO District) that are located in the C-3 or South of Market Districts. (Reference the Zoning Map of the City and County of San Francisco.) An agreement for the transportation brokerage services and a transportation management plan must be executed with the Planning Department prior to the issuance of a permit of occupancy. The transportation study report should recognize this requirement when applicable. The actual transportation management plan need not be included in the study report, but could be added at the discretion of the project sponsor. Appendix J contains the Planning Code requirements for the plan and services. 6. Appendices for Inclusion in Transportation Reports As appropriate, all transportation analyses should include the following appendices:
• Transportation Study Acknowledgment and Approval form, (Appendix A, Figure A-2) completed by the Planning Department (signed and dated), and a copy of the approved scope of work.
• Complete sets of all required traffic and pedestrian counts and estimated volumes. These should include Existing, Existing plus Project, and Cumulative conditions, at a minimum. The counts should include the date on which the data were collected.
• Complete sets of all traffic and pedestrian Level of Service calculations. Each Calculation sheet should indicate the date on which the data was collected. A summary of the rationales for use of adjustments or default values for the variables used in the calculations should be included.
• Complete sets of all analysis assumptions (including trip generation rates, transit patronage and capacities, parking turnover rates, mode splits, trip distribution, trip assignment, auto occupancy, etc.)
• Intersection LOS definitions and descriptions. • Pedestrian LOS definitions and descriptions.

Transportation Impact Analysis Guidelines October 2002
19


Appendix A
Transportation Impact Analysis Guidelines October 2002
APPENDIX A FIGURES: FORMS and MAPS

Appendix A
Transportation Impact Analysis Guidelines October 2002
FIGURE A-1
PROCESS MEMORANDUM
INSTRUCTIONS FOR SUBMITTAL AND FEES FOR
INITIAL TRANSPORTATION ASSESSMENT, or TRANSPORTATION IMPACT ANALYSIS REPORT
(1) In order for Department staff to determine whether a transportation study is required please submit the following information concerning the proposed project to the environmental planner assigned to your project in the Major Environmental Assessment (MEA) section or to the MEA’s transportation review coordinator, Bill Wycko.
• Existing and proposed specific gross square footage of space for each commercial use (office, retail, restaurant, hotel-including number of rooms, industrial, etc.).
• Existing and proposed number and type of residential units (or live/work units)
including the number of single and multiple bedroom units and senior, affordable, rental, or owner-occupied designations.
• Existing and proposed amounts of off-street parking and loading space.
• A site plan showing the existing and proposed locations of driveways.
• Location of bus stops, nearby curbside loading zones, and designations along
the property’s frontage. (2) This information will be used to determine whether or not a full Transportation Report will be needed for the proposed project and/or in preparation of the appropriate work scope for a full Transportation Report. You will be contacted concerning this determination. (3) If a transportation report is determined to be required, the project sponsor is to select a transportation consultant who will contact the transportation staff of the Major Environmental Assessment section to schedule a scoping meeting. The project sponsor will submit two checks, one for $5,936.00 payable to the San Francisco Planning Department and one check for $400.00 payable to San Francisco Department of Parking and Traffic (DPT). (4) Before the scoping meeting is scheduled, both the DPT and the Planning Department checks, and any requested material, should be submitted to:
A-1
Appendix A
Transportation Impact Analysis Guidelines October 2002
San Francisco Planning Department Attn: Tim Blomgren 1660 Mission Street, 5th Floor San Francisco, CA 94103
(5) Specific questions regarding the transportation review process should be directed to the transportation review coordinator at (415) 558-5972. A-2

Appendix A
Transportation Impact Analysis Guidelines October 2002
FIGURE A-2 APPROVAL FORM
TRANSPORTATION STUDY SCOPE OF WORK ACKNOWLEDGEMENT AND APPROVAL Transmittal To: Date:
The proposed scope of work for the Project, Case No. , dated is hereby _ Approved as submitted _ Approved as revised and resubmitted _ Approved subject to comments below _ Not approved, pending modifications specified below and resubmitted Signed: __________________________ ________________________________ Transportation Environmental Comments: Note: A copy of this approval and the final scope of work are to be appended to the transportation study. The Department advises consultants and project sponsors that review of the draft transportation report may identify issues or concerns of other City agencies not addressed in the scope of work hereby approved, and that the scope of work may need to be modified to accommodate such additional issues.
n:\trans\scpform2.doc A-3

Appendix A
Transportation Impact Analysis Guidelines October 2002
FIGURE A-3 SUPERDISTRICT BOUNDARIES
The Superdistricts are based on the travel analysis zones established by the Metropolitan Transportation Commission (MTC). The Superdistricts in this Figure are aggregations of the MTC’s 1099 Regional Travel Analysis Zones (1/99). Data from the Citywide Travel Behavior Study (CTBS) that are used in other sections of this report have been defined in terms of the Superdistricts.
A-4

Appendix A
Transportation Impact Analysis Guidelines October 2002
FIGURE A-4 C-3 DISTRICT Note: The C-3 boundaries are subject change. Check the San Francisco Planning Code for the latest version. A-5
Appendix A
Transportation Impact Analysis Guidelines October 2002
FIGURE A-5 GREATER DOWNTOWN AREA A-6
Appendix A
Transportation Impact Analysis Guidelines October 2002

Appendix B
B-0 Transportation Impact Analysis Guidelines October 2002
APPENDIX B INTERSECTION LEVEL OF SERVICE ANALYSIS METHODOLOGY
Appendix B
B-1 Transportation Impact Analysis Guidelines October 2002
INTERSECTION LEVEL OF SERVICE ANALYSIS METHODOLOGY
Each intersection specified in the scope of work needs to be analyzed to determine the Level of Service (LOS) for the alternative conditions or scenarios specified in the scope of work. The three common scenarios are (1) existing conditions; (2) existing conditions plus the proposed project; and (3) a future year condition which reflects cumulative impacts from projected future growth, including that associated with the proposed project. The analysis should follow the methodology presented in the 2000 Transportation Research Board’s Highway Capacity Manual (HCM). Because sections of the HCM have and are being revised periodically, it may be appropriate in some circumstances to use a later version for the analysis. If that is the case, it will be indicated during the scoping process. Separate chapters of the HCM deal with signalized and unsignalized intersections, and the corresponding Highway Capacity Software (HCS) provides standard applications of these techniques. Consultants may be authorized to utilize alternative software which is fully consistent with HCS techniques , provided that all user adjustment procedures in alternative software packages and assumptions used can be replicated by HCS. For signalized intersections, the operational analysis technique will normally be used. To retain some level of consistency between the analyses of different projects, at different times and by different consultants, the values for the HCM analysis parameters should be appropriate to the conditions in San Francisco, and should be documented in the report, preferably in the appendix with the LOS calculations. It is expected that there will be differences from the default values, and these should be noted. The consultant may need to obtain current information on the operating conditions at an intersection from the Department of Parking and Traffic or from other appropriate sources. The data used for the existing signal timing should accurately reflect present conditions. If any changes or revisions in existing signal timings are made, these must be fully disclosed in textual discussion and documented in the section of the report that contains the LOS calculation. Existing Conditions To establish the existing condition, it will be necessary to collect traffic counts for through and turning movements at the appropriate intersections as are defined in the scoping process. In some locations, it may be necessary to distinguish vehicle type (e.g., buses and trucks) in the counts. Traffic counts should be taken on days that are representative of normal traffic conditions. For normal weekday traffic, the counts should be taken on Tuesday, Wednesday or Thursday. For intersections with high volumes or volatility, it may be necessary to take counts on more than one day. Some special generators may require counts at a special time, such as a weekend. There should be an awareness of any unusual conditions that may affect the counts, such as accidents, street closures, emergency incidents, traffic diversions and special events. Counts should not be taken in close proximity to holidays and times when commute patterns and volumes may be significantly modified. The nearby location of a special generator may also affect the counts. For example, counts taken near a large university

Appendix B
B-2 Transportation Impact Analysis Guidelines October 2002
during a semester break would generally not be representative of the normal traffic in the area. New traffic counts need to be taken when there have been recent changes in area conditions, traffic patterns or traffic volumes. In stable areas, where counts have been collected within the last one or two years, they may still be useful. The use of counts more than two years old needs to be justified. If data is used from past studies, the consultant must indicate the date that the counts were actually taken, not the date of the report. Copies of all counts used in the analysis, and level of service calculations, are to be included with the report as an appendix. The LOS calculation sheets need to include the date that the data used in the calculation was actually collected. Identification of Methodological Assumptions In San Francisco, it is assumed that the P.M. peak hour and P.M. peak period (4:00 to 6:00 P.M.) normally represents the time of maximum utilization of the transportation system. Traffic counts should be taken for the 4:00 to 6:00 P.M. period, and recorded in 15 minute intervals. The peak hour will normally be the sum of the highest four consecutive 15 minute intervals. In order to maintain consistency in traffic volumes for adjacent intersections, it may be necessary to choose a peak hour that is consistent with most of the study area intersections. The Highway Capacity Manual’s traffic LOS methodology and compatible approaches provide opportunities to account for factors such as pedestrian and bicycle conflicts, transit service and stop locations, truck volumes, street grade and lane widths, on-street parking, differences in saturation flow conditions, and urban character. Based on San Francisco’s dense urban character and constrained street space, our presumption in applying traffic LOS techniques is that adjustments to default parameters (which were developed for broad national and international applications) should typically be made. Advance consultations prior to report submittals between the consultant and the assigned MEA transportation planner and DPT staff are strongly encouraged regarding appropriate adjustments. For each background transportation impact report, the consultant should summarize in an appendix all adjustments to default LOS input factors. The purpose of the summary of factor adjustments is to allow assessment of the reasonableness of the values used as well as the effects on analytical findings. The summary should briefly indicate the basis for each adjustment. Whenever default values are used, the consultant will bear the burden to explain why these are appropriate. Identification of Trips Added by the Project In order to obtain the intersection volumes necessary for the “Existing plus Project” LOS calculations, the consultant must first distribute the projected trips according to the trip distribution percentages available in the tables in Appendix E. The trips then need to be assigned to particular street links and intersections in a path which reasonably connects the origin and destination of the vehicular trip. This requires some judgement and a knowledge of actual operational conditions on the affected streets. It may require specific observations of these conditions during the peak period. Assignments

Appendix B
B-3 Transportation Impact Analysis Guidelines October 2002
that may be contrary to intuitive conclusions (e.g., the vehicles go on to another intersection to make a turn because the more direct route is too congested) may need to be explained in the text of the report. Cumulative Conditions Level of Service must also be estimated and shown for the future cumulative conditions, with a horizon year approximately 10 or more years in the future. (The future horizon year should be a benchmark that will eventually change in five year increments, such as 2015, 2020, etc.) The analysis of future cumulative conditions can use one of three basic methods, which will be determined during the scoping process. They are as follows: (1) A simple application of a growth factor to the traffic volumes. (2) A planning area study method (i.e., regional growth projection method) where an approved set of neighborhood or areawide growth projections are used, as reflected in a previously prepared transportation analysis. A typical example of the latter is the Mission Bay FEIR. Such studies commonly include the application of a city-wide or region-wide travel demand forecasting model such as that used by the Metropolitan Transportation Commission (MTC) or the San Francisco County Transportation Authority. (3) A listed-based method that incorporates traffic volumes and assignments from a list of reasonably foreseeable projects in the area, including those identified and analyzed in relevant planning or environmental reports. The first approach as stated above entails the use of a growth factor for travel in the general geographic area of the project site. Localized growth rates may become available from the San Francisco County Transportation Authority from its countywide transportation model. In the absence of such estimates, the background growth rate for projects using this approach should generally be conservatively assumed at one percent per year. This growth factor will typically assume that net new travel attributable to the project is included, such that it will not normally be necessary to add project travel to the growth rate. If, however, the volumes with the growth rate are less than those in the “Existing plus Project” condition at a particular intersection, consultation with Department transportation staff for further direction may be needed. In the second case, the planning study area method, it normally is assumed that the proposed project is included in the cumulative forecast for the larger study. In some cases, it may be necessary to analyze the localized impacts of the project in more detail than was presented in the areawide study. Specific intersections may have impacts that were not anticipated in the original, more generalized areawide study. In the last method, a project list-based approach, a study area is defined which is expected to capture the impacts relevant to the proposed project. A list of projects in the study area is assembled for which there is a reasonably foreseeable expectation that they will be implemented. These may include projects that are in an accepted plan
Appendix B
B-4 Transportation Impact Analysis Guidelines October 2002
or forecast, those that are in the analysis stage, those approved but not yet implemented, and those under construction. The proposed project is included on the list. The impacts of all projects on the list need to be calculated and combined for the future year condition. Growth associated with a specific proposed project is normally assumed to be encompassed within estimates for cumulative conditions under either of the methodologies described above. In some cases, such as very large projects or projects resulting in highly concentrated localized effects, adjustments may be necessary to standard methodologies for estimating cumulative scenarios. In such exceptional cases, consultants should consult with and proceed according to specific direction from Planning Department MEA transportation staff. Presentation of LOS Findings for Signalized Intersections The presentation of the LOS analysis should include a table indicating the calculated delays and LOS rating for each intersection under each scenario. The changes from the existing condition need to be noted. As a standard, a project’s impact on an intersection is generally considered significant when the LOS degrades from D or better to LOS E or F or if the project makes a cumulatively considerable contribution to LOS E to F conditions. For an intersection operating at LOS E or F under any analyzed scenario, the V/C ratio (Volume/Capacity) should be included in parentheses next to the delay in the tables that report the LOS. The V/C ratio provides another measure of the impact on an intersection already operating below the standard. Presentation of LOS Findings for Unsignalized Intersections Unsignalized intersections should be analyzed using the methodology in the Highway Capacity Manual for both two-way stop controlled (TWSC) and all-way stop controlled (AWSC) intersections. The Level of Service for such intersections should follow the unsignalized criteria, should highlight any movements with a LOS of E or F, and should be analyzed for the worst approach or worst movement. The V/C ratio for LOS E and F intersections should also be presented with the delayas well as whether signal warrants would be satisfied, whenever appropriate. In some cases, analyses for stop-controlled intersections may require supplemental field evaluations to document actual vehicular delay values. Such evaluations would allow for measurement of the delay effects of pedestrian flows on vehicular movements as well as the non-random arrival of traffic when such intersections are influenced by nearby signalized intersections. The results of such field evaluations and corresponding adjustments to LOS calculations should be summarized in an appendix to the transportation report, whenever applicable.

Appendix B
B-5 Transportation Impact Analysis Guidelines October 2002
Identification of Project Contributions to Cumulative Conditions Regardless of the method used for the analysis of cumulative conditions, the report should describe to the extent feasible, the project’s contribution to the cumulative. For example, if an intersection would degrade from LOS E to F under future cumulative conditions, what percentage of the new trips passing through that intersection would be attributable to the project and what would be the project’s impact on the critical movements at the intersection?

Appendix B
Transportation Impact Analysis Guidelines October 2002

Appendix C
Transportation Impact Analysis Guidelines October 2002
APPENDIX C TRIP GENERATION METHODOLOGY

Appendix C
Transportation Impact Analysis Guidelines October 2002
TRIP GENERATION METHODOLOGY
The trip generation approach in these “Guidelines” has been revised to reflect updated information that has become available since the 1991 version of the “Guidelines.” The intent of this revised approach is to make the maximum use of relevant and refined data from the “Citywide Travel Behavior Survey” (CTBS) and other sources (such as the ITE “Trip Generation” reports, the San Francisco Land Use Database and transportation studies), and to better integrate trip generation with other aspects of the analysis process. As more refined data becomes available, it will also be incorporated into the methodology outlined here. Some of the changes may include the use of employee densities in the trip generation process, and the introduction of an adjustment factor to recognize linked and internal trips. The essential data necessary for the calculation of trip generation is contained in Tables C-1 and C-2, and in the trip distribution, mode split, and auto occupancy tables contained in Appendix E. Multiple sources of information, as are cited in footnotes of Tables C-1 and C-2 and the “Selected Sources” were necessary to develop the rates and factors in the tables since no one source was complete in itself nor provided the linkage between the different collection and analysis methodologies. Some judgement derived from experience with San Francisco development and transportation activities was also applied to the development and refinement of the information. The tables in Appendix E are derived from the data in the CTBS reports. The land uses in Tables C-1 and C-2 represent the majority of the projects being developed in San Francisco. However, there are a number of uses that might occur on an infrequent basis which are not specifically represented. In those cases, it may be appropriate to use other data sources or studies for trip generation rates which would be specified during the scoping process. Data sources could include field surveys or acceptable published data such as that from the Institute of Transportation Engineers (ITE) and the San Diego Association of Governments (SANDAG). In its Trip Generation publication, the Institute of Transportation Engineers (ITE) provides one of the largest sources of commonly used trip generation data. Most of this data, however, was collected in a suburban environment with low transit usage and land use and travel patterns different than San Francisco. Furthermore, the rates are based on vehicle trips as opposed to person trips, and there is no corresponding auto occupancy data for the sources. In some cases, it may be possible to use the data with an appropriate conversion to person trips. This would require the assumption of an auto occupancy rate and a percentage of non-auto trips. For example, if the auto occupancy rate were 1.3 and the “Other modes” trips were 10%, the conversion would factor would be 1.3/0.90, or 1.44. One hundred ITE vehicle trips would equate to 144 person trips. C-1
Transportation Impact Analysis Guidelines October 2002
NET NEW TRIPS: PROCEDURES FOR ADJUSTMENTS BASED ON EXISTING LAND USES ON THE PROJECT SITE For project sites that are not vacant or were occupied until recently, adjustments to calculated daily and p.m. peak hour project-generated additional person trips may be made to account for the existing activities on a project site. Whenever feasible, any such adjustment should be based on conducting counts of actual existing commercial trip-making at the project site per specific direction from Planning Department MEA transportation staff. Unless surveys of existing modal splits and distributions are available or conducted, appropriate modal splits and distributions should be applied for the geographic area in which the project site is located in order to estimate net changes for each mode, e.g., vehicles, transit, walking, or other. Net new trips would be derived as follows: Calculated additional trips for the project (for daily & pm peak hour)
- Existing observed trips (from actual counts) = Net new trips Whenever it would be impractical to conduct actual counts of existing commercial trip-making activity at a project site, e.g., because the business has recently ceased operations, procedures for estimating and netting out existing trips shall be developed only according to specific direction from Planning Department MEA transportation staff. Whenever the level of trip-making associated with previous uses appears to have been low and/or prior uses have been discontinued for a substantial period of time, application of the concept of net new trips would be inappropriate and the analysis should be based on estimates of trip generation for the proposed project without adjustments. In cases of existing or recently discontinued residential uses proposed to be replaced by any type of new project, Planning Department residential trip rates from Appendix C and appropriate modal split/distribution census tract data based on procedures described in Appendix D should be applied to estimate existing trips. Net new trips should, in turn, be derived by subtracting existing trips from new trips estimated to be generated by the proposed project. Whenever a project is proposed to replace an existing or recently discontinued parking facility, netting out existing trips linked to the parking facility is generally inappropriate. The inherent character of parking facilities is to accommodate vehicular trips generated by commercial (and sometimes residential) land uses in the vicinity and to concentrate these vehicular trips in immediate proximity to the parking facility’s access points. The basic analytical presumption should be that drivers who have previously parked in a parking facility to be displaced by a proposed project will seek to find other parking nearby and thus these vehicular trips should be treated as remaining at the intersections within the project study area. Therefore, while some reassignments to reflect greater dispersal of vehicles previously using a parking facility on the project site may be appropriate, the reassigned vehicles should be assumed to remain in the project study area. Thus, netting out of vehicles associated with a parking facility on the project site is generally not appropriate. One clear exception to this presumption would apply when the proposed project would replace the underlying land use which primarily accounts for users of the associated parking facility. Appropriate treatment for other exceptional situations should be according to specific direction from Planning Department MEA transportation staff. C-2
Transportation Impact Analysis Guidelines October 2002
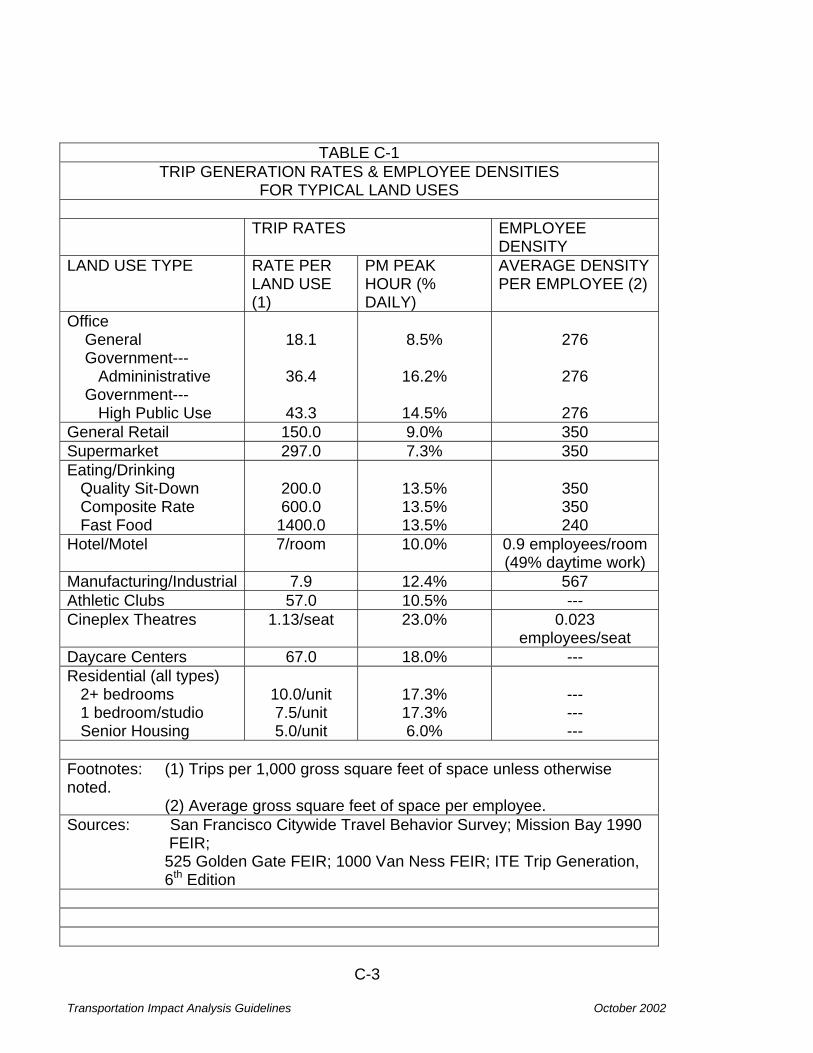
TABLE C-1 TRIP GENERATION RATES & EMPLOYEE DENSITIES
FOR TYPICAL LAND USES TRIP RATES EMPLOYEE
DENSITY LAND USE TYPE RATE PER
LAND USE (1)
PM PEAK HOUR (% DAILY)
AVERAGE DENSITY PER EMPLOYEE (2)
Office General Government--- Admininistrative Government--- High Public Use
18.1
36.4
43.3
8.5%
16.2%
14.5%
276
276
276
General Retail 150.0 9.0% 350 Supermarket 297.0 7.3% 350 Eating/Drinking Quality Sit-Down Composite Rate Fast Food
200.0 600.0
1400.0
13.5% 13.5% 13.5%
350 350 240
Hotel/Motel 7/room 10.0% 0.9 employees/room (49% daytime work)
Manufacturing/Industrial 7.9 12.4% 567 Athletic Clubs 57.0 10.5% --- Cineplex Theatres 1.13/seat 23.0% 0.023
employees/seat Daycare Centers 67.0 18.0% --- Residential (all types) 2+ bedrooms 1 bedroom/studio Senior Housing
10.0/unit 7.5/unit 5.0/unit
17.3% 17.3% 6.0%
--- --- ---
Footnotes: (1) Trips per 1,000 gross square feet of space unless otherwise noted. (2) Average gross square feet of space per employee. Sources: San Francisco Citywide Travel Behavior Survey; Mission Bay 1990 FEIR; 525 Golden Gate FEIR; 1000 Van Ness FEIR; ITE Trip Generation, 6th Edition C-3

Transportation Impact Analysis Guidelines October 2002
TABLE C-2 PERCENTAGE SPLITS BETWEEN WORK & NON-WORK TRIPS
WORK/NON-WORK SPLIT LAND USE TYPE DAILY 24-HOUR
PERIOD PM PEAK HOUR
Office General Government
36%/64% 20%/80%
83%/17% 83%/17%
Retail (including Supermarkets & Eating/Drinking Establishments)
4%/96%
4%/96%
Hotel/Motel 12%/88% 60%/40% Manufacturing/Industrial 40%/60% 67%/33% Residential 33%/67% 50%/50% Sources: South of Market FEIR; Mission Bay 1990 FEIR For commercial uses, 100% of all work trips during the PM peak hour and 50% of all non-work trips during the PM peak hour should be treated as outbound. For residential uses, all PM peak work trips and 33% of all PM peak hour non-work trips should be treated as inbound to the project; resident inbound/outbound trip directions may or may not correspond to peak outbound regional travel direction. C-4

Transportation Impact Analysis Guidelines October 2002
APPENDIX D TRIP DISTRIBUTION, MODE-SPLIT AND ASSIGNMENT METHODOLOGY
Transportation Impact Analysis Guidelines October 2002
Appendix D
TRIP DISTRIBUTION, MODE SPLIT AND TRIP ASSIGNMENT METHODOLOGY
The steps in the transportation analysis process following trip generation include trip distribution, mode split and trip assignment. Unless a travel demand model is used, the procedure described below should be followed. Commercial Land Uses Once it is determined how many person trips are generated by a project, it is necessary to determine the travel mode for the trips, the number of vehicle (auto) trips, the distribution of the trips, and the assignment of the trips to the appropriate transportation network (e.g., street network or transit service). The modal split and distribution can vary by the type of trip (e.g., work or non-work (visitor)), and the land use at the destination (e.g., office, retail, other). To aid in the process, the tables in Appendix E have been prepared using data from the Citywide Travel Behavior Study (CTBS). The data is provided according to the location of the proposed commercial project: the four Superdistricts (SD) in San Francisco, plus the C-3 District within Superdistrict 1. Because the data has been compiled by generalized locations and categories, it may not provide the maximum possible precision for any one project. Overall, however, it provides an adequate representation, and its use will maintain a consistency and comparability between the analyses of different projects. For the C-3 District, work trips are categorized “Office” and “All Other.” The visitor (non-work) trips for the C-3 District are categorized as “Office,” “Retail” and “All Other.” For the four Superdistricts, there is one category for work trips and two categories for visitor trips: “Retail” and “All Other.” Some other areas of the city (e.g., Van Ness Avenue) also have tables that were derived from studies for those areas. The number of trips by mode can be derived by applying the “Mode %” figure to the total trips. In order to calculate the number of auto vehicle trips, the number of auto trips needs to be divided by the “Persons Per Auto.” For the C-3 District, the number of auto vehicle trips equals the number of “Drive Alone” trips plus the “Rideshare” trips that have been divided by “Persons Per Auto, Rideshare.” The tables in Appendix E provide a general distribution of trips (e.g., SD-3, South Bay) which will be useful in directing certain trips to a particular freeway or transit screenline. A graphic representation of these general distributions normally aids in presenting the tabular data. In the next step, judgment must be used to assign the trips to particular links on the street network or to a transit screenline or a feeder bus line to the mainline corridor service. This information needs to be included in the study report, and a graphic presentation is especially important for the street network. Of course, consistency needs to be maintained between the tabular data D-1

Transportation Impact Analysis Guidelines October 2002
and that presented graphically. A user of the report should not need to adjust the tabular data before it matches that used in the graphic form. Intersection volumes, by lane movement, should be consistent with the overall trip distributions and link or directional volumes, both in report graphics and in appendix LOS calculation sheets. Residential Land Uses The modal split for all residential trips should be based on the most recent available U.S. Census journey-to-work data for the census tract in which the project would be located. 2000 U.S. Census journey-to-work data are available at http://factfinder.census.gov/servlet/BasicFactsServlet. Distribution of all residential trips should also be based on the geographic destinations indicated in the relevant census tract data. For the share of trips shown destined within San Francisco by the census tract data, distribution and assignments of these trips should assume that the proportional orientation of this travel will correspond to the general distribution of employment in San Francisco. In general, this means the distribution of residential work and non-work trips within San Francisco should be based on 60 percent of trips destined to greater downtown San Francisco and the remaining 40 percent destined to outlying San Francisco neighborhoods. For projects located within greater downtown, concentrations of trips to and from downtown may be greater. Assignments of auto and transit trips both within San Francisco and the region to specific streets and transit corridors should be consistent with relevant census tract modal split and distribution data. D-2

Transportation Impact Analysis Guidelines October 2002
APPENDIX E
TRIP DISTRIBUTION, MODE SPLIT, AND AUTO OCCUPANCY TABLES BY TRIP TYPE AND ORIGIN AND DESTINATION
The sources of the data in Tables E-1 to E-19 are the “Citywide Travel Behavior Study: Employees and Employers,” May 1993; and “Visitor Travel Behavior,” August 1993. The source of the data in Tables E-18 to E-21 is the “Van Ness Avenue FEIR,” Project no. 87.585E, certified on December 17, 1997. The source of the data in Table E-22 is the “Transportation Impact Analysis for Chinatown Rezoning,” San Francisco Planning Department, January 1987.
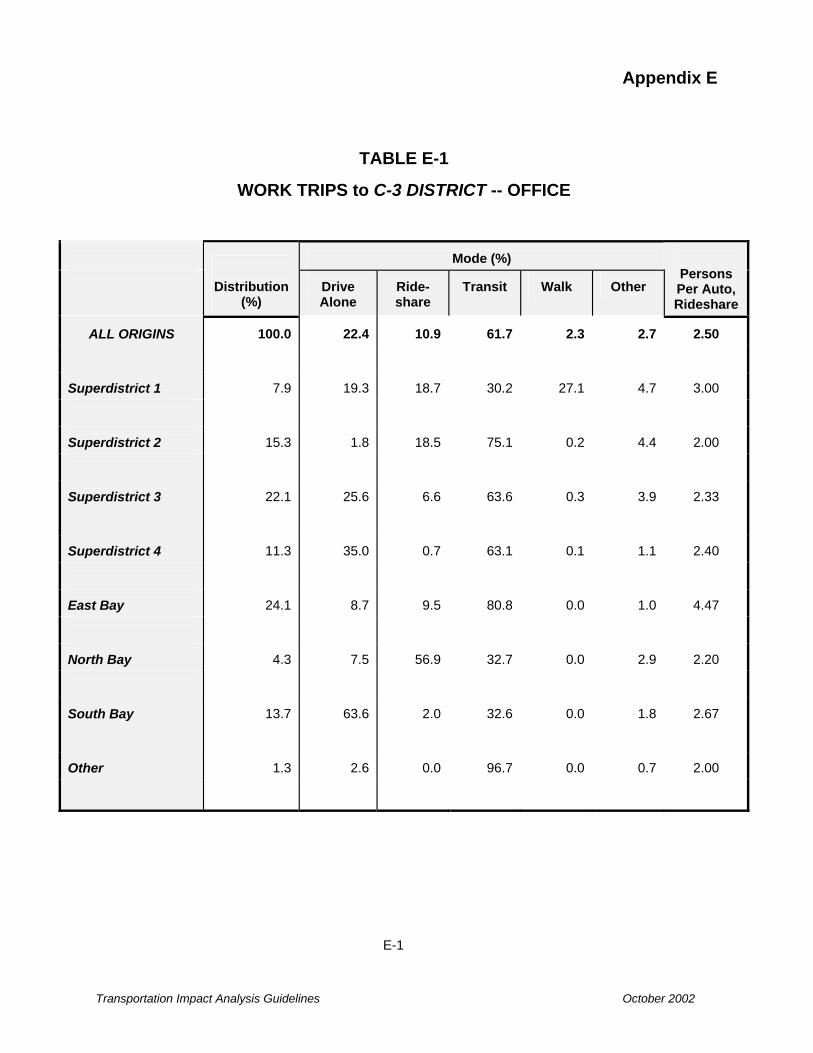
Appendix E
Transportation Impact Analysis Guidelines October 2002
TABLE E-1
WORK TRIPS to C-3 DISTRICT -- OFFICE
Mode (%)
Distribution (%)
Drive Alone
Ride-share
Transit
Walk
Other
Persons Per Auto, Rideshare
ALL ORIGINS
100.0
22.4
10.9
61.7
2.3
2.7
2.50
Superdistrict 1
7.9
19.3
18.7
30.2
27.1
4.7
3.00
Superdistrict 2
15.3
1.8
18.5
75.1
0.2
4.4
2.00
Superdistrict 3
22.1
25.6
6.6
63.6
0.3
3.9
2.33
Superdistrict 4
11.3
35.0
0.7
63.1
0.1
1.1
2.40
East Bay
24.1
8.7
9.5
80.8
0.0
1.0
4.47
North Bay
4.3
7.5
56.9
32.7
0.0
2.9
2.20
South Bay
13.7
63.6
2.0
32.6
0.0
1.8
2.67
Other
1.3
2.6
0.0
96.7
0.0
0.7
2.00
E-1
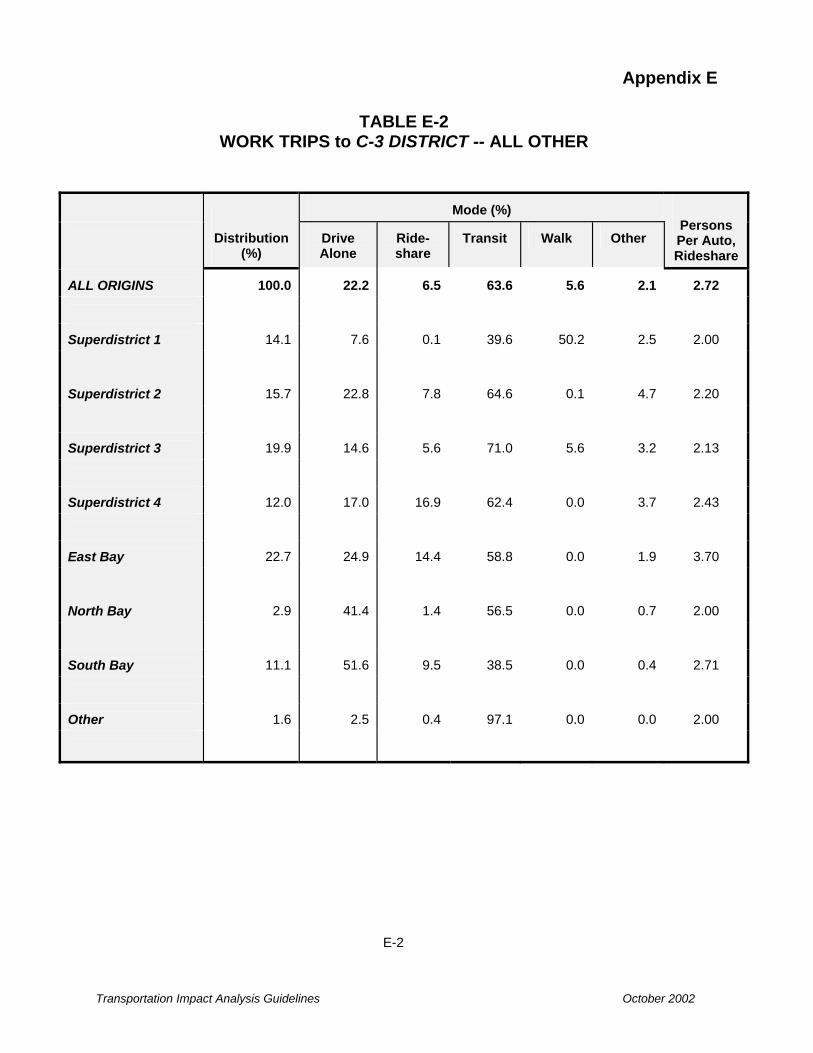
Appendix E
Transportation Impact Analysis Guidelines October 2002
TABLE E-2
WORK TRIPS to C-3 DISTRICT -- ALL OTHER
Mode (%)
Distribution (%)
Drive Alone
Ride-share
Transit
Walk
Other
Persons Per Auto, Rideshare
ALL ORIGINS
100.0
22.2
6.5
63.6
5.6
2.1
2.72
Superdistrict 1
14.1
7.6
0.1
39.6
50.2
2.5
2.00
Superdistrict 2
15.7
22.8
7.8
64.6
0.1
4.7
2.20
Superdistrict 3
19.9
14.6
5.6
71.0
5.6
3.2
2.13
Superdistrict 4
12.0
17.0
16.9
62.4
0.0
3.7
2.43
East Bay
22.7
24.9
14.4
58.8
0.0
1.9
3.70
North Bay
2.9
41.4
1.4
56.5
0.0
0.7
2.00
South Bay
11.1
51.6
9.5
38.5
0.0
0.4
2.71
Other
1.6
2.5
0.4
97.1
0.0
0.0
2.00
E-2

Appendix E
Transportation Impact Analysis Guidelines October 2002
TABLE E-3
WORK TRIPS to SD-1 -- All1
Mode (%)
Distribution (%)
Auto
Transit
Walk
Other
Persons Per Auto
ALL ORIGINS
100.0
38.9
51.7
6.9
2.5
1.54
Superdistrict 1
12.8
13.8
36.0
47.5
2.7
1.28
Superdistrict 2
14.4
31.6
65.8
1.3
1.3
1.23
Superdistrict 3
17.0
39.5
54.4
3.8
2.3
1.29
Superdistrict 4
11.2
41.7
54.5
0.0
3.8
1.53
East Bay
22.4
39.4
57.0
0.0
3.6
3.33
North Bay
6.1
52.8
45.3
0.0
1.9
1.70
South Bay
14.3
58.0
40.7
0.0
1.3
1.23
Other
1.8
47.8
50.0
0.0
2.2
1.50
1Use this table only for SD-1 locations that are not in the C-3 District. E-3
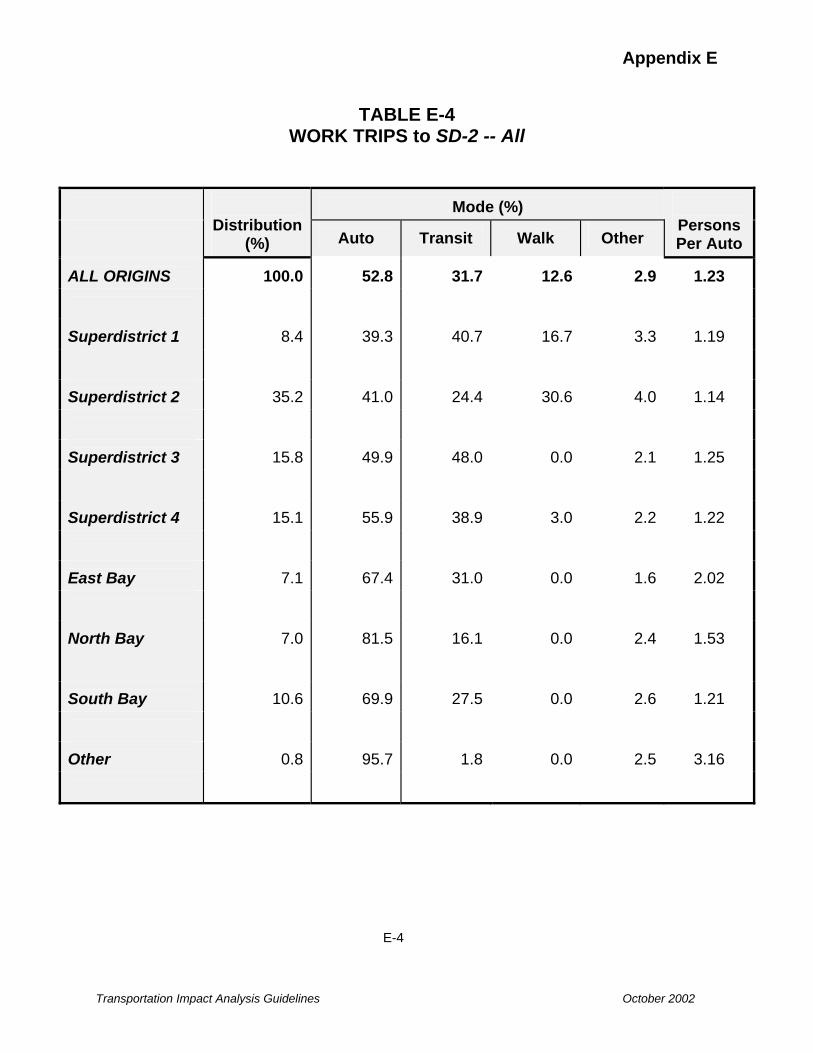
Appendix E
Transportation Impact Analysis Guidelines October 2002
TABLE E-4
WORK TRIPS to SD-2 -- All
Mode (%)
Distribution (%)
Auto
Transit
Walk
Other
Persons Per Auto
ALL ORIGINS
100.0
52.8
31.7
12.6
2.9
1.23
Superdistrict 1
8.4
39.3
40.7
16.7
3.3
1.19
Superdistrict 2
35.2
41.0
24.4
30.6
4.0
1.14
Superdistrict 3
15.8
49.9
48.0
0.0
2.1
1.25
Superdistrict 4
15.1
55.9
38.9
3.0
2.2
1.22
East Bay
7.1
67.4
31.0
0.0
1.6
2.02
North Bay
7.0
81.5
16.1
0.0
2.4
1.53
South Bay
10.6
69.9
27.5
0.0
2.6
1.21
Other
0.8
95.7
1.8
0.0
2.5
3.16
E-4

Appendix E
Transportation Impact Analysis Guidelines October 2002
TABLE E-5
WORK TRIPS to SD-3 -- All
Mode (%)
Distribution (%)
Auto
Transit
Walk
Other
Persons Per Auto
ALL ORIGINS
100.0
71.1
20.2
5.8
2.9
1.23
Superdistrict 1
8.3
46.9
32.7
17.7
2.7
1.30
Superdistrict 2
10.6
64.6
26.4
6.9
2.1
1.26
Superdistrict 3
23.9
59.7
20.6
15.1
4.6
1.25
Superdistrict 4
7.9
75.7
21.5
0.0
2.8
1.48
East Bay
14.3
68.8
29.7
0.0
1.5
1.61
North Bay
5.6
86.9
10.5
0.0
2.6
1.44
South Bay
26.9
88.5
8.8
0.0
2.7
1.13
Other
2.5
61.8
35.3
0.0
2.9
1.56
E-5
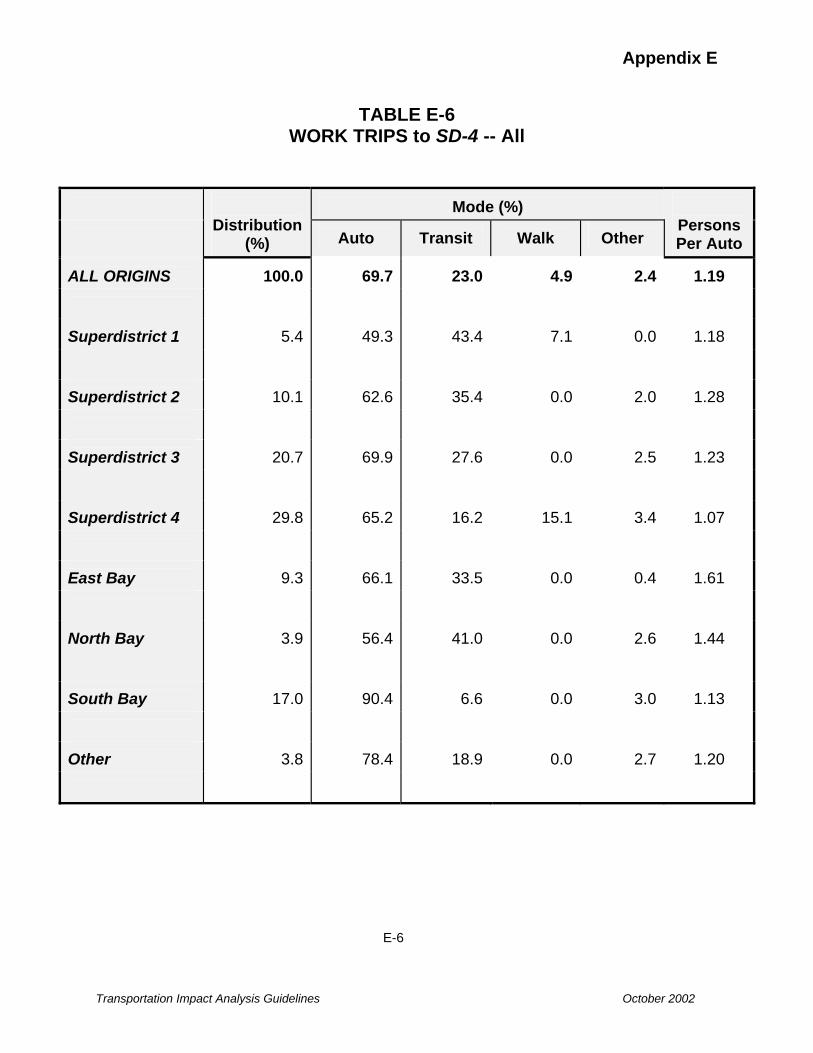
Appendix E
Transportation Impact Analysis Guidelines October 2002
TABLE E-6
WORK TRIPS to SD-4 -- All
Mode (%)
Distribution (%)
Auto
Transit
Walk
Other
Persons Per Auto
ALL ORIGINS
100.0
69.7
23.0
4.9
2.4
1.19
Superdistrict 1
5.4
49.3
43.4
7.1
0.0
1.18
Superdistrict 2
10.1
62.6
35.4
0.0
2.0
1.28
Superdistrict 3
20.7
69.9
27.6
0.0
2.5
1.23
Superdistrict 4
29.8
65.2
16.2
15.1
3.4
1.07
East Bay
9.3
66.1
33.5
0.0
0.4
1.61
North Bay
3.9
56.4
41.0
0.0
2.6
1.44
South Bay
17.0
90.4
6.6
0.0
3.0
1.13
Other
3.8
78.4
18.9
0.0
2.7
1.20
E-6

Appendix E
Transportation Impact Analysis Guidelines October 2002
TABLE E-7 VISITOR TRIPS to C-3 DISTRICT -- OFFICE
ALL ORIGINS
Home-Based
Origins
Work-Based
Origins
All Other Origins
Persons Per
Auto ALL VISITORS
Distribution (%)
100
8
18
74
Mode (%)
Auto
30.5
39.0
27.2
30.4
1.94
Transit
39.9
41.0
13.8
46.4
Walk
22.5
18.0
37.0
19.3
Other
7.1
2.0
22.0
3.9
SUPERDISTRICT 1 RESIDENTS
Distribution (%)
17
3
2
12
Mode (%)
Auto
9.6
10.0
0.0
11.5
1.84
Transit
28.7
40.0
19.4
28.4
Walk
53.1
50.0
41.9
56.0
Other
8.6
0.0
38.7
4.1
SUPERDISTRICT 2 RESIDENTS
Distribution (%)
14
1
4
9
Mode (%)
Auto
24.7
33.3
16.7
27.4
2.00
Transit
43.7
44.5
8.3
58.0
Walk
19.0
11.1
41.7
10.3
Other
12.6
11.1
33.3
4.3
SUPERDISTRICT 3 RESIDENTS
Distribution (%)
14
1
3
10
Mode (%)
Auto
20.5
26.7
16.2
21.0
2.01
Transit
51.7
73.3
18.9
58.9
Walk
17.0
0.0
32.4
14.5
Other
10.8
0.0
32.5
5.6
SUPERDISTRICT 4 RESIDENTS
Distribution (%)
7
0
1
6
Mode (%)
Auto
27.7
0.0
28.6
28.0
2.10
Transit
52.1
0.0
7.1
58.6
Walk
13.8
0.0
35.7
10.7
Other
6.4
0.0
28.6
2.7
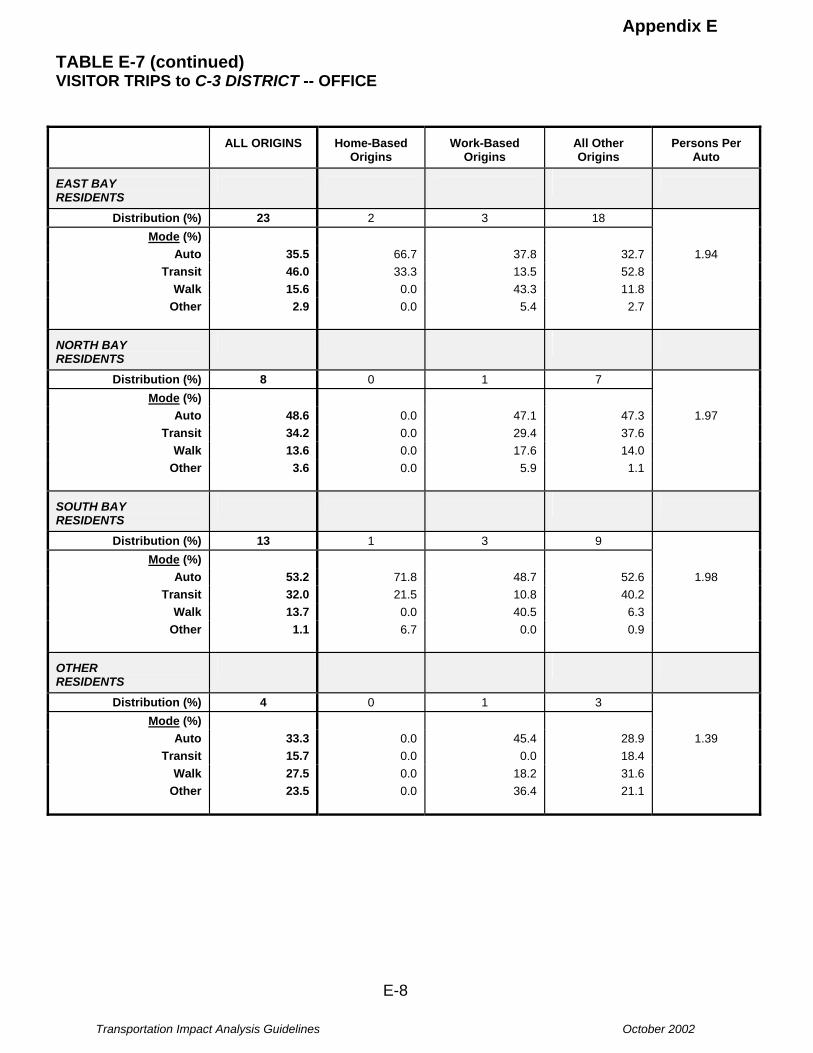
Appendix E
Transportation Impact Analysis Guidelines October 2002
TABLE E-7 (continued) VISITOR TRIPS to C-3 DISTRICT -- OFFICE
ALL ORIGINS
Home-Based
Origins
Work-Based
Origins
All Other Origins
Persons Per
Auto EAST BAY RESIDENTS
Distribution (%)
23
2
3
18
Mode (%)
Auto
35.5
66.7
37.8
32.7
1.94
Transit
46.0
33.3
13.5
52.8
Walk
15.6
0.0
43.3
11.8
Other
2.9
0.0
5.4
2.7
NORTH BAY RESIDENTS
Distribution (%)
8
0
1
7
Mode (%)
Auto
48.6
0.0
47.1
47.3
1.97
Transit
34.2
0.0
29.4
37.6
Walk
13.6
0.0
17.6
14.0
Other
3.6
0.0
5.9
1.1
SOUTH BAY RESIDENTS
Distribution (%)
13
1
3
9
Mode (%)
Auto
53.2
71.8
48.7
52.6
1.98
Transit
32.0
21.5
10.8
40.2
Walk
13.7
0.0
40.5
6.3
Other
1.1
6.7
0.0
0.9
OTHER RESIDENTS
Distribution (%)
4
0
1
3
Mode (%)
Auto
33.3
0.0
45.4
28.9
1.39
Transit
15.7
0.0
0.0
18.4
Walk
27.5
0.0
18.2
31.6
Other
23.5
0.0
36.4
21.1
E-8

Appendix E
Transportation Impact Analysis Guidelines October 2002
TABLE E-8 VISITOR TRIPS to C-3 DISTRICT -- RETAIL
ALL ORIGINS
Home-Based
Origins
Work-Based
Origins
All Other Origins
Persons Per
Auto ALL VISITORS
Distribution (%)
100
11
30
59
Mode (%)
Auto
28.4
51.3
21.5
27.5
1.77
Transit
15.1
30.8
14.6
12.3
Walk
44.6
12.8
58.5
43.7
Other
11.9
5.1
5.4
16.5
SUPERDISTRICT 1 RESIDENTS
Distribution (%)
8
2
2
4
Mode (%)
Auto
8.8
12.5
13.3
3.8
1.33
Transit
28.1
37.5
20.0
26.9
Walk
61.3
50.0
66.7
65.5
Other
1.8
0.0
0.0
3.8
SUPERDISTRICT 2 RESIDENTS
Distribution (%)
8
2
3
3
Mode (%)
Auto
20.4
46.1
9.1
15.8
1.67
Transit
25.9
23.1
27.3
26.3
Walk
48.1
7.7
63.6
57.9
Other
5.6
23.1
0.0
0.0
SUPERDISTRICT 3 RESIDENTS
Distribution (%)
12
1
5
6
Mode (%)
Auto
37.0
51.4
20.6
50.0
1.89
Transit
12.3
34.3
17.6
5.0
Walk
43.3
0.0
53.0
40.0
Other
7.4
14.3
8.8
5.0
SUPERDISTRICT 4 RESIDENTS
Distribution (%)
4
1
1
2
Mode (%)
Auto
14.3
40.0
10.0
7.7
1.75
Transit
28.6
60.0
30.0
15.4
Walk
46.4
0.0
60.0
53.8
Other
10.7
0.0
0.0
23.1

Appendix E
Transportation Impact Analysis Guidelines October 2002
TABLE E-8 (continued) VISITOR TRIPS to C-3 DISTRICT --RETAIL
ALL ORIGINS
Home-Based
Origins
Work-Based
Origins
All Other Origins
Persons Per
Auto EAST BAY RESIDENTS
Distribution (%)
15
2
6
7
Mode (%)
Auto
31.0
38.5
18.4
38.8
2.00
Transit
24.0
61.5
13.2
22.4
Walk
43.0
0.0
68.4
34.7
Other
2.0
0.0
0.0
4.1
NORTH BAY RESIDENTS
Distribution (%)
10
1
4
5
Mode (%)
Auto
46.9
100.0
26.9
51.5
1.40
Transit
18.2
0.0
15.4
24.2
Walk
28.8
0.0
53.9
15.2
Other
6.1
0.0
3.8
9.1
SOUTH BAY RESIDENTS
Distribution (%)
5
1
2
2
Mode (%)
Auto
55.5
75.0
66.7
37.5
3.23
Transit
5.6
25.0
0.0
0.0
Walk
30.6
0.0
33.3
43.7
Other
8.3
0.0
0.0
18.8
OTHER RESIDENTS
Distribution (%)
38
1
7
30
Mode (%)
Auto
23.4
88.9
20.8
21.1
1.69
Transit
6.9
11.1
6.3
6.9
Walk
47.1
0.0
58.3
46.5
Other
22.6
0.0
14.6
25.5
E-10

Appendix E
Transportation Impact Analysis Guidelines October 2002
TABLE E-9 VISITOR TRIPS to C-3 DISTRICT -- ALL OTHER
ALL ORIGINS
Home-Based
Origins
Work-Based
Origins
All Other Origins
Persons Per
Auto ALL VISITORS
Distribution (%)
100
38
19
43
Mode (%)
Auto
36.1
48.4
33.1
26.6
1.85
Transit
27.9
35.0
20.6
25.0
Walk
30.9
11.7
44.1
41.8
Other
5.1
4.9
2.2
6.6
SUPERDISTRICT 1 RESIDENTS
Distribution (%)
26
9
1
16
Mode (%)
Auto
16.1
24.1
10.0
13.1
1.73
Transit
31.2
35.2
40.0
28.7
Walk
48.4
35.1
50.0
54.1
Other
4.3
5.6
0.0
4.1
SUPERDISTRICT 2 RESIDENTS
Distribution (%)
13
6
3
4
Mode (%)
Auto
34.7
30.0
28.6
48.2
1.81
Transit
33.7
47.5
21.4
25.9
Walk
26.3
17.5
42.9
22.2
Other
5.3
5.0
7.1
3.7
SUPERDISTRICT 3 RESIDENTS
Distribution (%)
13
5
4
4
Mode (%)
Auto
44.8
46.0
48.0
40.0
1.59
Transit
27.6
37.8
16.0
24.0
Walk
18.4
5.4
36.0
20.0
Other
9.2
10.8
0.0
16.0
SUPERDISTRICT 4 RESIDENTS
Distribution (%)
5
2
2
1
Mode (%)
Auto
39.3
41.2
45.4
20.0
1.58
Transit
36.4
41.2
18.2
60.0
Walk
15.2
0.0
36.4
20.0
Other
9.1
17.6
0.0
0.0
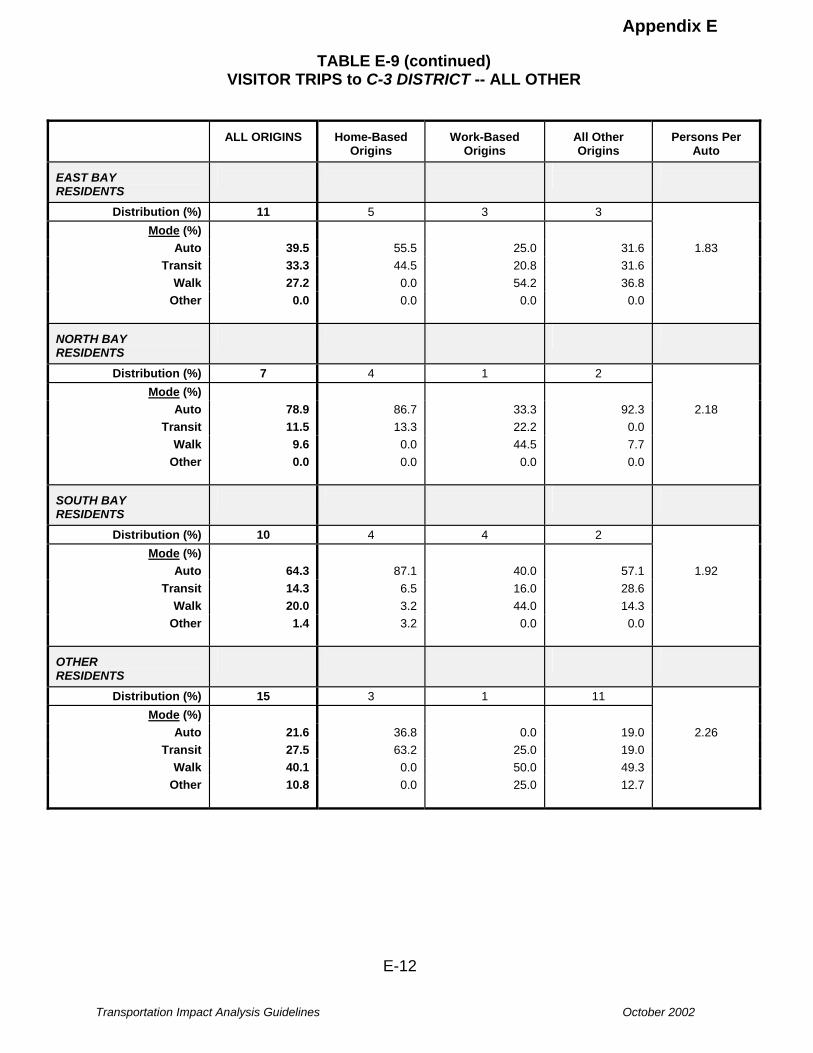
Appendix E
Transportation Impact Analysis Guidelines October 2002
TABLE E-9 (continued) VISITOR TRIPS to C-3 DISTRICT -- ALL OTHER
ALL ORIGINS
Home-Based
Origins
Work-Based
Origins
All Other Origins
Persons Per
Auto EAST BAY RESIDENTS
Distribution (%)
11
5
3
3
Mode (%)
Auto
39.5
55.5
25.0
31.6
1.83
Transit
33.3
44.5
20.8
31.6
Walk
27.2
0.0
54.2
36.8
Other
0.0
0.0
0.0
0.0
NORTH BAY RESIDENTS
Distribution (%)
7
4
1
2
Mode (%)
Auto
78.9
86.7
33.3
92.3
2.18
Transit
11.5
13.3
22.2
0.0
Walk
9.6
0.0
44.5
7.7
Other
0.0
0.0
0.0
0.0
SOUTH BAY RESIDENTS
Distribution (%)
10
4
4
2
Mode (%)
Auto
64.3
87.1
40.0
57.1
1.92
Transit
14.3
6.5
16.0
28.6
Walk
20.0
3.2
44.0
14.3
Other
1.4
3.2
0.0
0.0
OTHER RESIDENTS
Distribution (%)
15
3
1
11
Mode (%)
Auto
21.6
36.8
0.0
19.0
2.26
Transit
27.5
63.2
25.0
19.0
Walk
40.1
0.0
50.0
49.3
Other
10.8
0.0
25.0
12.7
E-12

Appendix E
Transportation Impact Analysis Guidelines October 2002
TABLE E-10 VISITOR TRIPS to SD-1 -- RETAIL1
ALL ORIGINS
Home-Based
Origins
Work-Based
Origins
All Other Origins
Persons Per
Auto ALL VISITORS
Distribution (%)
100
23
26
51
Mode (%)
Auto
35.7
47.4
26.6
34.9
2.43 Transit
15.5
24.0
12.2
13.1
Walk
36.0
18.1
53.6
35.6
Other
12.8
10.5
7.6
16.4
SUPERDISTRICT 1 RESIDENTS
Distribution (%)
19
5
3
11
Mode (%)
Auto
18.1
17.0
16.1
19.1
1.62
Transit
14.7
13.0
19.6
14.2
Walk
63.0
70.0
58.9
60.8
Other
4.2
0.0
5.4
5.9
SUPERDISTRICT 2 RESIDENTS
Distribution (%)
7
2
3
2
Mode (%)
1.66 Auto
27.9
47.6
10.0
29.7
Transit
32.6
40.5
22.0
37.9
Walk
34.1
4.8
66.0
24.3
Other
5.4
7.1
2.0
8.1
SUPERDISTRICT 3 RESIDENTS
Distribution (%)
8
2
4
2
Mode (%)
Auto
31.2
36.7
17.9
48.8
2.08
Transit
21.7
33.3
23.9
9.8
Walk
41.3
20.0
55.2
34.1
Other
5.8
10.0
3.0
7.3
SUPERDISTRICT 4 RESIDENTS
Distribution (%)
3
1
1
1
Mode (%)
Auto
34.0
47.4
21.1
33.3
1.51
Transit
34.0
42.1
21.1
41.7
Walk
28.0
0.0
57.8
25.0
Other
4.0
10.5
0.0
0.0
1Use this table only for SD-1 locations that are not in the C-3 District.

Appendix E
Transportation Impact Analysis Guidelines October 2002
TABLE E-10 (continued) VISITOR TRIPS to SD-1 -- RETAIL1
ALL ORIGINS
Home-Based
Origins
Work-Based
Origins
All Other Origins
Persons Per
Auto EAST BAY RESIDENTS
Distribution (%)
11
4
5
2
Mode (%)
Auto
38.1
59.7
21.7
36.7
2.35
Transit
23.2
40.3
9.8
23.3
Walk
36.6
0.0
68.5
26.7
Other
2.1
0.0
0.0
13.3
NORTH BAY RESIDENTS
Distribution (%)
5
1
2
2
Mode (%)
Auto
46.1
84.7
30.0
35.7
2.27
Transit
17.6
9.7
12.5
32.1
Walk
34.1
0.0
55.0
28.6
Other
2.2
5.6
2.5
3.6
SOUTH BAY RESIDENTS
Distribution (%)
8
4
2
2
Mode (%)
2.84 Auto
73.8
72.0
71.9
78.6
Transit
14.1
28.0
0.0
0.0
Walk
10.1
0.0
28.1
14.3
Other
2.0
0.0
0.0
7.1
OTHER RESIDENTS
Distribution (%)
39
4
6
29
Mode (%)
Auto
37.0
43.4
34.7
36.6
3.12
Transit
8.4
6.6
1.7
10.1
Walk
28.3
0.0
39.0
29.9
Other
26.3
50.0
24.6
23.4
1Use this table only for SD-1 locations that are not in the C-3 District. E-14

Appendix E
Transportation Impact Analysis Guidelines October 2002
TABLE E-11 VISITOR TRIPS to SD-1 -- ALL OTHER1
ALL ORIGINS
Home-Based
Origins
Work-Based
Origins
All Other Origins
Persons Per
Auto ALL VISITORS
Distribution (%)
100
47
18
35
Mode (%)
Auto
36.0
43.6
24.1
31.9
2.37
Transit
25.4
30.4
19.0
21.9
Walk
32.2
20.0
52.7
38.0
Other
6.4
6.0
4.2
8.2
SUPERDISTRICT 1 RESIDENTS
Distribution (%)
22
13
2
7
Mode (%)
Auto
12.9
16.6
15.0
5.7
2.29
Transit
17.1
19.8
22.5
10.7
Walk
65.3
58.3
52.5
81.5
Other
4.7
5.3
10.0
2.1
SUPERDISTRICT 2 RESIDENTS
Distribution (%)
14
8
4
2
Mode (%)
Auto
31.9
39.9
17.6
29.4
2.07
Transit
35.0
41.2
23.0
35.3
Walk
26.7
11.9
52.6
32.4
Other
6.4
7.0
6.8
2.9
SUPERDISTRICT 3 RESIDENTS
Distribution (%)
13
7
3
3
Mode (%)
Auto
38.8
35.3
40.0
47.9
2.39
Transit
36.8
47.0
23.3
23.9
Walk
17.4
7.4
35.0
23.9
Other
7.0
10.3
1.7
4.3
SUPERDISTRICT 4 RESIDENTS
Distribution (%)
7
4
2
1
Mode (%)
Auto
42.5
51.5
22.6
42.9
1.93
Transit
32.7
38.2
25.8
21.4
Walk
17.7
0.0
51.6
28.6
Other
7.1
10.3
0.0
7.1
1Use this table only for SD-1 locations that are not in the C-3 District.
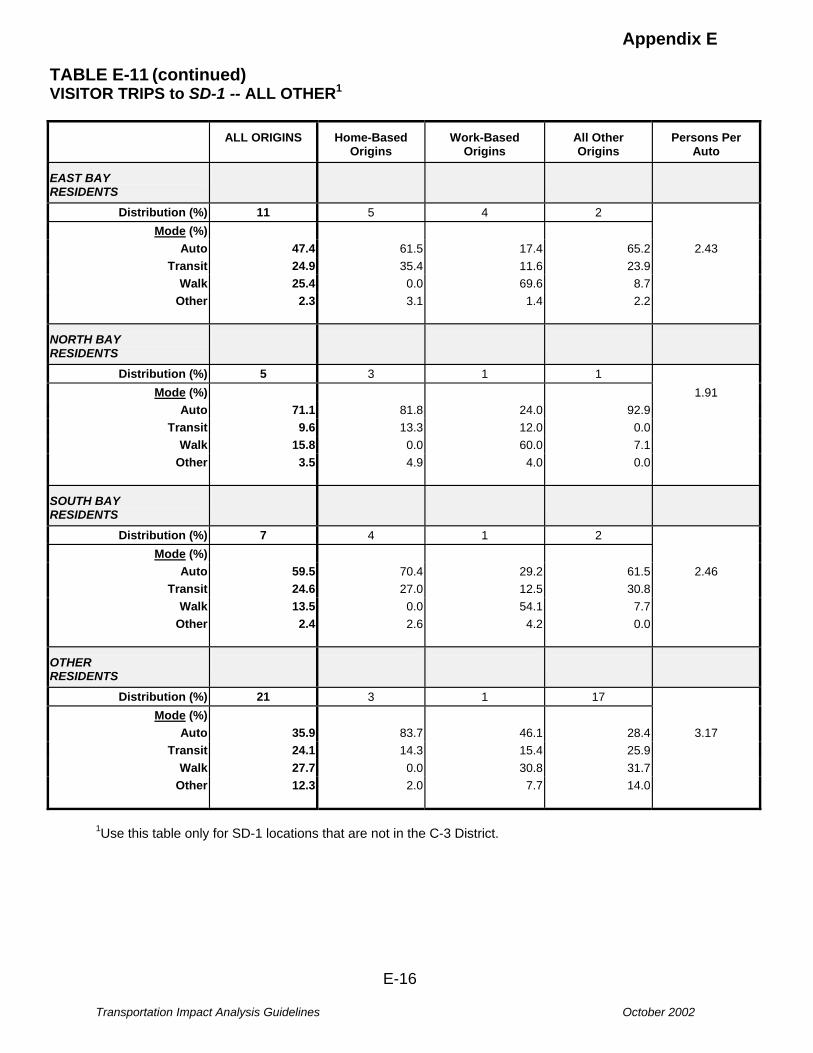
Appendix E
Transportation Impact Analysis Guidelines October 2002
TABLE E-11 (continued) VISITOR TRIPS to SD-1 -- ALL OTHER1
ALL ORIGINS
Home-Based
Origins
Work-Based
Origins
All Other Origins
Persons Per
Auto EAST BAY RESIDENTS
Distribution (%)
11
5
4
2
Mode (%)
Auto
47.4
61.5
17.4
65.2
2.43
Transit
24.9
35.4
11.6
23.9
Walk
25.4
0.0
69.6
8.7
Other
2.3
3.1
1.4
2.2
NORTH BAY RESIDENTS
Distribution (%)
5
3
1
1
Mode (%)
1.91 Auto
71.1
81.8
24.0
92.9
Transit
9.6
13.3
12.0
0.0
Walk
15.8
0.0
60.0
7.1
Other
3.5
4.9
4.0
0.0
SOUTH BAY RESIDENTS
Distribution (%)
7
4
1
2
Mode (%)
Auto
59.5
70.4
29.2
61.5
2.46
Transit
24.6
27.0
12.5
30.8
Walk
13.5
0.0
54.1
7.7
Other
2.4
2.6
4.2
0.0
OTHER RESIDENTS
Distribution (%)
21
3
1
17
Mode (%)
Auto
35.9
83.7
46.1
28.4
3.17
Transit
24.1
14.3
15.4
25.9
Walk
27.7
0.0
30.8
31.7
Other
12.3
2.0
7.7
14.0
1Use this table only for SD-1 locations that are not in the C-3 District. E-16

Appendix E
Transportation Impact Analysis Guidelines October 2002
TABLE E-12 VISITOR TRIPS to SD-2 -- RETAIL
ALL ORIGINS
Home-Based
Oirigns
Work-Based
Origins
All Other Origins
Persons Per
Auto ALL VISITORS
Distribution (%)
100
45
19
36
Mode (%)
Auto
64.3
62.0
63.3
67.6
1.88
Transit
6.9
5.2
8.8
8.1
Walk
26.2
30.4
25.9
21.0
Other
2.6
2.4
2.0
3.3
SUPERDISTRICT 1 RESIDENTS
Distribution (%)
12
6
1
5
Mode (%)
Auto
78.4
72.9
88.9
82.0
2.30
Transit
8.5
10.8
11.1
4.9
Walk
11.1
12.2
0.0
13.1
Other
2.0
4.1
0.0
0.0
SUPERDISTRICT 2 RESIDENTS
Distribution (%)
55
29
9
17
Mode (%)
Auto
56.5
54.5
56.9
59.9
1.57
Transit
7.2
3.9
12.9
9.8
Walk
34.5
39.8
29.3
28.1
Other
1.8
1.8
0.9
2.2
SUPERDISTRICT 3 RESIDENTS
Distribution (%)
8
4
2
2
Mode (%)
Auto
60.9
68.4
33.3
69.3
2.04
Transit
10.0
8.3
12.5
11.5
Walk
25.5
20.0
54.2
11.5
Other
3.6
3.3
0.0
7.7
SUPERDISTRICT 4 RESIDENTS
Distribution (%)
7
3
2
2
Mode (%)
Auto
81.2
75.7
77.3
90.3
2.49
Transit
4.4
5.4
4.5
3.2
Walk
10.0
13.5
9.1
6.5
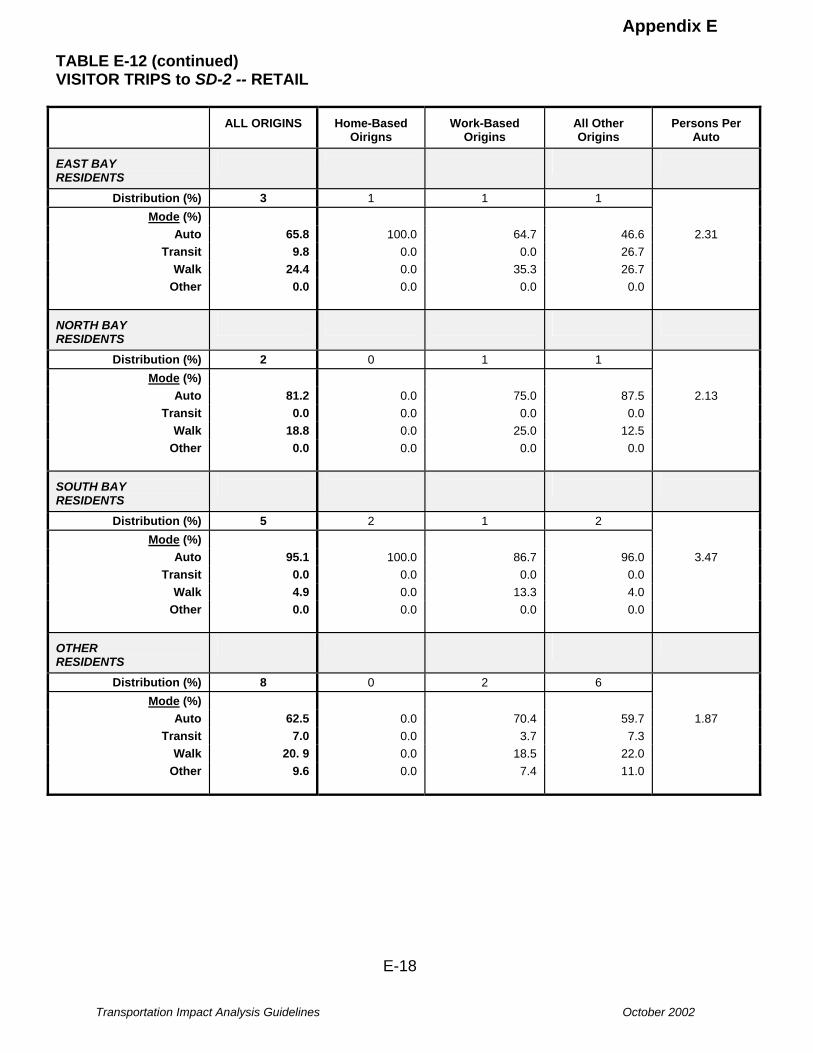
Appendix E
Transportation Impact Analysis Guidelines October 2002
TABLE E-12 (continued) VISITOR TRIPS to SD-2 -- RETAIL
ALL ORIGINS
Home-Based
Oirigns
Work-Based
Origins
All Other Origins
Persons Per
Auto EAST BAY RESIDENTS
Distribution (%)
3
1
1
1
Mode (%)
Auto
65.8
100.0
64.7
46.6
2.31
Transit
9.8
0.0
0.0
26.7
Walk
24.4
0.0
35.3
26.7
Other
0.0
0.0
0.0
0.0
NORTH BAY RESIDENTS
Distribution (%)
2
0
1
1
Mode (%)
Auto
81.2
0.0
75.0
87.5
2.13
Transit
0.0
0.0
0.0
0.0
Walk
18.8
0.0
25.0
12.5
Other
0.0
0.0
0.0
0.0
SOUTH BAY RESIDENTS
Distribution (%)
5
2
1
2
Mode (%)
Auto
95.1
100.0
86.7
96.0
3.47
Transit
0.0
0.0
0.0
0.0
Walk
4.9
0.0
13.3
4.0
Other
0.0
0.0
0.0
0.0
OTHER RESIDENTS
Distribution (%)
8
0
2
6
Mode (%)
Auto
62.5
0.0
70.4
59.7
1.87
Transit
7.0
0.0
3.7
7.3
Walk
20. 9
0.0
18.5
22.0
Other
9.6
0.0
7.4
11.0
E-18

Appendix E
Transportation Impact Analysis Guidelines October 2002
TABLE E-13 VISITOR TRIPS to SD-2 -- ALL OTHER
ALL ORIGINS
Home-Based
Origins
Work-Based
Origins
All Other Origins
Persons Per
Auto ALL VISITORS
Distribution (%)
100
44
15
41
Mode (%)
Auto
54.8
60.5
41.6
53.5
2.06
Transit
23.4
23.8
17.6
25.1
Walk
15.2
10.4
32.8
14.0
Other
6.6
5.3
8.0
7.4
SUPERDISTRICT 1 RESIDENTS
Distribution (%)
13
8
2
3
Mode (%)
Auto
41.7
46.1
26.7
40.0
1.93
Transit
35.5
32.3
20.0
50.0
Walk
16.4
18.5
26.7
6.7
Other
6.4
3.1
26.6
3.3
SUPERDISTRICT 2 RESIDENTS
Distribution (%)
27
14
3
10
Mode (%)
Auto
50.9
45.4
57.7
56.6
1.96
Transit
23.7
24.4
15.4
25.3
Walk
19.7
21.0
26.9
15.7
Other
5.7
9.2
0.0
2.4
SUPERDISTRICT 3 RESIDENTS
Distribution (%)
14
6
2
6
Mode (%)
Auto
57.1
65.5
36.8
58.0
2.05
Transit
22.3
23.0
10.5
24.0
Walk
9.9
1.9
42.2
6.0
Other
10.7
9.6
10.5
12.0
SUPERDISTRICT 4 RESIDENTS
Distribution (%)
9
4
1
4
Mode (%)
Auto
63.4
60.6
37.5
73.3
2.16
Transit
32.4
36.4
37.5
26.7
Walk
4.2
3.0
25.0
0.0
Other
0.0
0.0
0.0
0.0

Appendix E
Transportation Impact Analysis Guidelines October 2002
TABLE E-13 (continued) VISITOR TRIPS to SD-2 -- ALL OTHER
ALL ORIGINS
Home-Based
Origins
Work-Based
Origins
All Other Origins
Persons Per
Auto EAST BAY RESIDENTS
Distribution (%)
11
4
3
4
Mode (%)
Auto
52.2
77.1
24.0
46.8
2.20
Transit
25.0
22.9
28.0
25.0
Walk
14.1
0.0
44.0
6.3
Other
8.7
0.0
4.0
21.9
NORTH BAY RESIDENTS
Distribution (%)
4
2
1
1
Mode (%)
Auto
73.6
93.3
22.2
90.0
1.89
Transit
8.8
6.7
11.1
10.0
Walk
14.7
0.0
55.6
0.0
Other
2.9
0.0
11.1
0.0
SOUTH BAY RESIDENTS
Distribution (%)
8
4
2
2
Mode (%)
Auto
80.5
88.9
68.7
75.0
2.30
Transit
8.3
8.3
6.3
10.0
Walk
5.6
0.0
12.5
10.0
Other
5.6
2.8
12.5
5.0
OTHER RESIDENTS
Distribution (%)
14
2
1
11
Mode (%)
Auto
48.3
84.2
57.1
40.6
2.07
Transit
19.7
10.5
14.3
21.9
Walk
23.8
0.0
28.6
28.1
Other
8.2
5.3
0.0
9.4
E-20

Appendix E
Transportation Impact Analysis Guidelines October 2002
TABLE E-14 VISITOR TRIPS to SD-3 -- RETAIL
ALL ORIGINS
Home-Based
Origins
Work-Based
Origins
All Other Origins
Persons Per
Auto ALL VISITORS
Distribution (%)
100
46
14
40
Mode (%)
Auto
64.1
68.6
54.1
62.3
1.90
Transit
11.7
9.5
26.9
8.9
Walk
22.4
20.6
17.1
26.4
Other
1.8
1.3
1.9
2.4
SUPERDISTRICT 1 RESIDENTS
Distribution (%)
6
3
1
2
Mode (%)
Auto
45.0
51.0
52.6
32.4
1.76
Transit
29.0
29.8
21.1
32.4
Walk
22.0
12.8
26.3
32.3
Other
4.0
6.4
0.0
2.9
SUPERDISTRICT 2 RESIDENTS
Distribution (%)
9
4
2
3
Mode (%)
Auto
61.8
74.2
30.4
62.0
1.52
Transit
15.3
10.3
52.2
4.0
Walk
19.8
13.8
17.4
28.0
Other
3.1
1.7
0.0
6.0
SUPERDISTRICT 3 RESIDENTS
Distribution (%)
61
32
6
23
Mode (%)
Auto
60.4
65.7
45.5
57.5
2.04
Transit
9.5
6.7
31.3
7.2
Walk
28.7
26.8
21.2
33.4
Other
1.4
0.8
2.0
1.9
SUPERDISTRICT 4 RESIDENTS
Distribution (%)
5
2
1
2
Mode (%)
Auto
84.7
91.3
85.7
74.0
1.78
Transit
9.7
2.9
14.3
17.4
Walk
2.8
2.9
0.0
4.3
Other
2.8
2.9
0.0
4.3

Appendix E
Transportation Impact Analysis Guidelines October 2002
TABLE E-14 (continued) VISITOR TRIPS to SD-3 -- RETAIL
ALL ORIGINS
Home-Based
Origins
Work-Based
Origins
All Other Origins
Persons Per
Auto EAST BAY RESIDENTS
Distribution (%)
3
0
1
2
Mode (%)
Auto
75.0
0.0
64.3
91.4
1.77
Transit
12.5
0.0
7.1
4.3
Walk
12.5
0.0
28.6
4.3
Other
0.0
0.0
0.0
0.0
NORTH BAY RESIDENTS
Distribution (%)
2
1
0
1
Mode (%)
Auto
87.5
90.9
0.0
100.0
1.44
Transit
12.5
9.1
0.0
0.0
Walk
0.0
0.0
0.0
0.0
Other
0.0
0.0
0.0
0.0
SOUTH BAY RESIDENTS
Distribution (%)
9
3
2
4
Mode (%)
Auto
86.4
86.8
81.8
88.2
1.98
Transit
9.1
13.2
9.1
5.9
Walk
3.2
0.0
3.0
5.9
Other
1.3
0.0
6.1
0.0
OTHER RESIDENTS
Distribution (%)
5
1
1
3
Mode (%)
Auto
59.2
80.0
44.5
57.6
1.69
Transit
16.9
20.0
33.3
13.5
Walk
19.7
0.0
22.2
23.1
Other
4.2
0.0
0.0
5.8
E-22

Appendix E
Transportation Impact Analysis Guidelines October 2002
TABLE E-15 VISITOR TRIPS to SD-3 -- ALL OTHER
ALL ORIGINS
Home-Based
Origins
Work-Based
Origins
All Other Origins
Persons Per
Auto ALL VISITORS
Distribution (%)
100
66
8
26
Mode (%)
Auto
56.8
61.5
60.3
43.5
2.26
Transit
18.6
16.9
29.2
19.9
Walk
16.3
17.6
4.2
16.7
Other
8.3
4.0
6.3
19.9
SUPERDISTRICT 1 RESIDENTS
Distribution (%)
13
9
1
3
Mode (%)
Auto
36.0
35.8
20.0
40.0
2.03
Transit
19.2
18.9
60.0
10.0
Walk
33.3
28.3
20.0
50.0
Other
11.5
17.0
0.0
0.0
SUPERDISTRICT 2 RESIDENTS
Distribution (%)
14
8
1
5
Mode (%)
Auto
68.6
80.5
50.0
54.8
1.97
Transit
14.5
15.2
33.3
9.7
Walk
2.4
0.0
0.0
6.5
Other
14.5
4.3
16.7
29.0
SUPERDISTRICT 3 RESIDENTS
Distribution (%)
44
30
2
12
Mode (%)
Auto
43.7
52.2
33.3
21.9
2.43
Transit
21.5
16.7
58.4
28.1
Walk
25.4
30.0
0.0
17.2
Other
9.4
1.1
8.3
32.8
SUPERDISTRICT 4 RESIDENTS
Distribution (%)
7
4
1
2
Mode (%)
Auto
67.4
66.7
54.0
69.2
2.51
Transit
16.3
18.5
28.0
15.4
Walk
7.0
3.7
4.0
15.4
Other
9.3
11.1
14.0
0.0

Appendix E
Transportation Impact Analysis Guidelines October 2002
TABLE E-15 (continued) VISITOR TRIPS to SD-3 -- ALL OTHER
ALL ORIGINS
Home-Based
Origins
Work-Based
Origins
All Other Origins
Persons Per
Auto EAST BAY RESIDENTS
Distribution (%)
9
6
2
1
Mode (%)
Auto
68.4
64.9
72.7
77.8
2.59
Transit
29.8
35.1
18.2
22.2
Walk
1.8
0.0
9.1
0.0
Other
0.0
0.0
0.0
0.0
NORTH BAY RESIDENTS
Distribution (%)
1
1
0
0
Mode (%)
Auto
100.0
100.0
0.0
0.0
2.11
Transit
0.0
0.0
0.0
0.0
Walk
0.0
0.0
0.0
0.0
Other
0.0
0.0
0.0
0.0
SOUTH BAY RESIDENTS
Distribution (%)
9
7
1
1
Mode (%)
Auto
94.6
97.6
100.0
75.0
2.28
Transit
3.6
2.4
0.0
12.5
Walk
1.8
0.0
0.0
12.5
Other
0.0
0.0
0.0
0.0
OTHER RESIDENTS
Distribution (%)
3
1
0
2
Mode (%)
Auto
73.6
83.3
0.0
60.0
1.68
Transit
21.1
16.7
0.0
30.0
Walk
0.0
0.0
0.0
0.0
Other
5.3
0.0
0.0
10.0
E-24

Appendix E
Transportation Impact Analysis Guidelines October 2002
TABLE E-16 VISITOR TRIPS to SD-4 -- RETAIL
ALL ORIGINS
Home-Based
Origins
Work-Based
Origins
All Other Origins
Persons Per
Auto ALL VISITORS
Distribution (%)
100
50
9
41
Mode (%)
Auto
74.9
73.8
62.1
78.9
1.84
Transit
6.8
7.6
5.7
6.1
Walk
17.4
17.3
32.2
14.2
Other
0.9
1.3
0.0
0.8
SUPERDISTRICT 1 RESIDENTS
Distribution (%)
2
1
0
1
Mode (%)
Auto
82.4
85.7
0.0
77.8
1.65
Transit
17.6
14.3
0.0
22.2
Walk
0.0
0.0
0.0
0.0
Other
0.0
0.0
0.0
0.0
SUPERDISTRICT 2 RESIDENTS
Distribution (%)
12
5
2
5
Mode (%)
Auto
74.3
73.1
68.2
79.4
1.84
Transit
12.4
23.1
4.5
2.6
Walk
10.6
0.0
27.3
15.4
Other
2.7
3.8
0.0
2.6
SUPERDISTRICT 3 RESIDENTS
Distribution (%)
22
11
2
9
Mode (%)
Auto
82.0
83.5
47.4
87.7
1.79
Transit
7.6
9.7
10.5
4.5
Walk
9.5
6.8
42.1
5.6
Other
0.9
0.0
0.0
2.2
SUPERDISTRICT 4 RESIDENTS
Distribution (%)
46
23
3
20
Mode (%)
Auto
66.1
60.6
73.1
71.7
1.79
Transit
6.2
6.0
3.8
6.7
Walk
27.2
32.6
23.1
21.6
Other
0.5
0.9
0.0
0.0

Appendix E
Transportation Impact Analysis Guidelines October 2002
TABLE E-16 (continued) VISITOR TRIPS to SD-4 -- RETAIL
ALL ORIGINS
Home-Based
Origins
Work-Based
Origins
All Other Origins
Persons Per
Auto EAST BAY RESIDENTS
Distribution (%)
2
0
1
1
Mode (%)
Auto
61.1
0.0
40.0
55.6
1.29
Transit
11.1
0.0
0.0
22.2
Walk
27.8
0.0
60.0
22.2
Other
0.0
0.0
0.0
0.0
NORTH BAY RESIDENTS
Distribution (%)
1
1
0
0
Mode (%)
Auto
91.7
91.7
0.0
0.0
2.83
Transit
0.0
0.0
0.0
0.0
Walk
0.0
0.0
0.0
0.0
Other
8.3
8.3
0.0
0.0
SOUTH BAY RESIDENTS
Distribution (%)
10
7
1
2
Mode (%)
Auto
93.1
100.0
40.0
95.7
2.10
Transit
1.0
0.0
10.0
0.0
Walk
5.9
0.0
50.0
4.3
Other
0.0
0.0
0.0
0.0
OTHER RESIDENTS
Distribution (%)
5
2
0
3
Mode (%)
Auto
93.5
93.3
0.0
92.9
3.09
Transit
4.3
0.0
0.0
7.1
Walk
0.0
0.0
0.0
0.0
Other
2.2
6.7
0.0
0.0
E-26
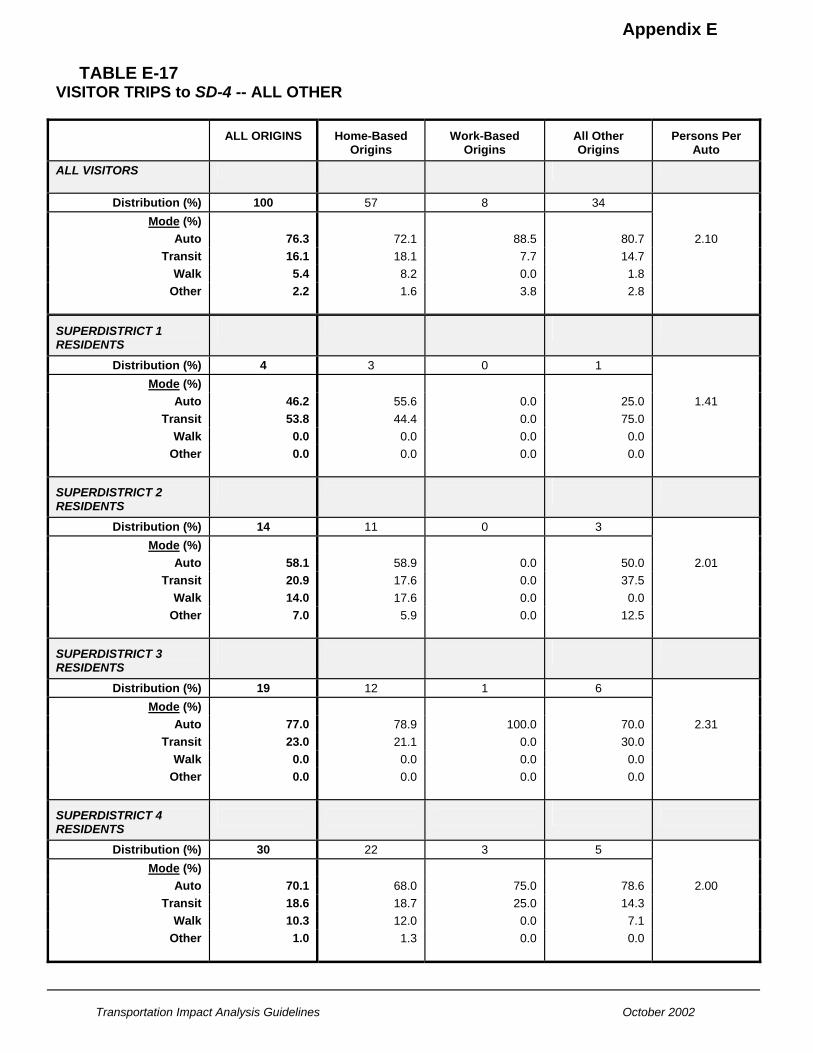
Appendix E
Transportation Impact Analysis Guidelines October 2002
TABLE E-17 VISITOR TRIPS to SD-4 -- ALL OTHER
ALL ORIGINS
Home-Based
Origins
Work-Based
Origins
All Other Origins
Persons Per
Auto ALL VISITORS
Distribution (%)
100
57
8
34
Mode (%)
Auto
76.3
72.1
88.5
80.7
2.10
Transit
16.1
18.1
7.7
14.7
Walk
5.4
8.2
0.0
1.8
Other
2.2
1.6
3.8
2.8
SUPERDISTRICT 1 RESIDENTS
Distribution (%)
4
3
0
1
Mode (%)
Auto
46.2
55.6
0.0
25.0
1.41
Transit
53.8
44.4
0.0
75.0
Walk
0.0
0.0
0.0
0.0
Other
0.0
0.0
0.0
0.0
SUPERDISTRICT 2 RESIDENTS
Distribution (%)
14
11
0
3
Mode (%)
Auto
58.1
58.9
0.0
50.0
2.01
Transit
20.9
17.6
0.0
37.5
Walk
14.0
17.6
0.0
0.0
Other
7.0
5.9
0.0
12.5
SUPERDISTRICT 3 RESIDENTS
Distribution (%)
19
12
1
6
Mode (%)
Auto
77.0
78.9
100.0
70.0
2.31
Transit
23.0
21.1
0.0
30.0
Walk
0.0
0.0
0.0
0.0
Other
0.0
0.0
0.0
0.0
SUPERDISTRICT 4 RESIDENTS
Distribution (%)
30
22
3
5
Mode (%)
Auto
70.1
68.0
75.0
78.6
2.00
Transit
18.6
18.7
25.0
14.3
Walk
10.3
12.0
0.0
7.1
Other
1.0
1.3
0.0
0.0

Appendix E
Transportation Impact Analysis Guidelines October 2002
TABLE E-17 (continued) VISITOR TRIPS to SD-4 -- ALL OTHER
ALL ORIGINS
Home-Based
Origins
Work-Based
Origins
All Other Origins
Persons Per
Auto EAST BAY RESIDENTS
Distribution (%)
5
2
2
2
Mode (%)
Auto
93.7
83.3
100.0
100.0
1.68
Transit
6.3
16.7
0.0
0.0
Walk
0.0
0.0
0.0
0.0
Other
0.0
0.0
0.0
0.0
NORTH BAY RESIDENTS
Distribution (%)
7
2
1
4
Mode (%)
Auto
95.7
100.0
100.0
92.3
2.16
Transit
4.3
0.0
0.0
7.7
Walk
0.0
0.0
0.0
0.0
Other
0.0
0.0
0.0
0.0
SOUTH BAY RESIDENTS
Distribution (%)
8
4
1
3
Mode (%)
Auto
96.2
100.0
66.7
100.0
2.03
Transit
0.0
0.0
0.0
0.0
Walk
0.0
0.0
0.0
0.0
Other
3.8
0.0
33.3
0.0
OTHER RESIDENTS
Distribution (%)
11
1
0
10
Mode (%)
Auto
89.5
100.0
0.0
88.5
2.79
Transit
2.6
0.0
0.0
2.9
Walk
2.6
0.0
0.0
2.9
Other
5.3
0.0
0.0
5.7
E-28
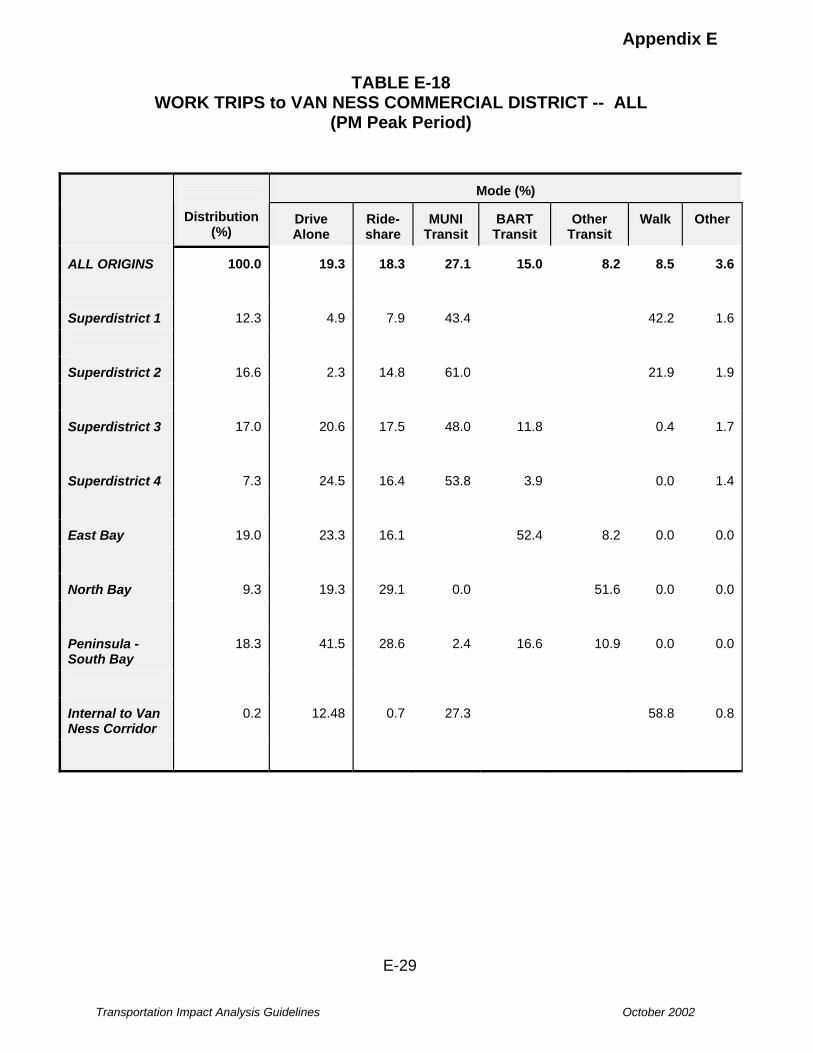
Appendix E
Transportation Impact Analysis Guidelines October 2002
TABLE E-18
WORK TRIPS to VAN NESS COMMERCIAL DISTRICT -- ALL (PM Peak Period)
Mode (%)
Distribution (%)
Drive Alone
Ride- share
MUNI
Transit
BART
Transit
Other
Transit
Walk
Other
ALL ORIGINS
100.0
19.3
18.3
27.1
15.0
8.2
8.5
3.6
Superdistrict 1
12.3
4.9
7.9
43.4
42.2
1.6
Superdistrict 2
16.6
2.3
14.8
61.0
21.9
1.9
Superdistrict 3
17.0
20.6
17.5
48.0
11.8
0.4
1.7
Superdistrict 4
7.3
24.5
16.4
53.8
3.9
0.0
1.4
East Bay
19.0
23.3
16.1
52.4
8.2
0.0
0.0
North Bay
9.3
19.3
29.1
0.0
51.6
0.0
0.0
Peninsula - South Bay
18.3
41.5
28.6
2.4
16.6
10.9
0.0
0.0
Internal to Van Ness Corridor
0.2
12.48
0.7
27.3
58.8
0.8
E-29
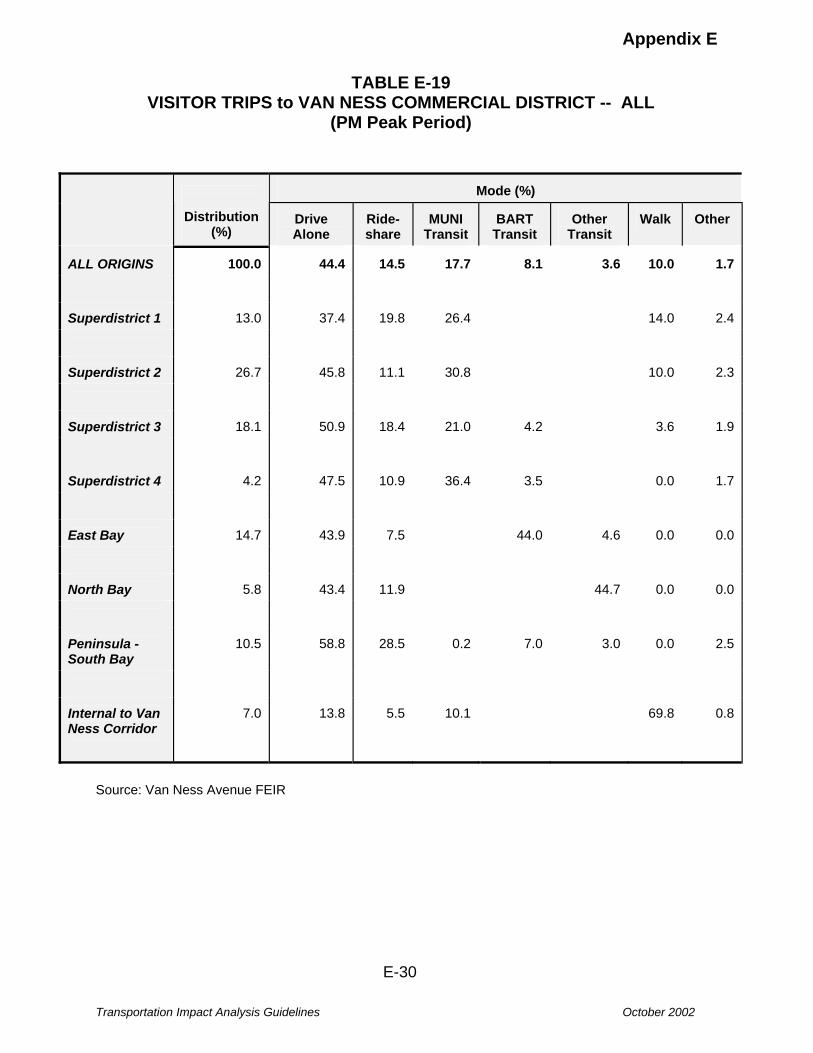
Appendix E
Transportation Impact Analysis Guidelines October 2002
TABLE E-19
VISITOR TRIPS to VAN NESS COMMERCIAL DISTRICT -- ALL (PM Peak Period)
Mode (%)
Distribution (%)
Drive Alone
Ride- share
MUNI
Transit
BART
Transit
Other
Transit
Walk
Other
ALL ORIGINS
100.0
44.4
14.5
17.7
8.1
3.6
10.0
1.7
Superdistrict 1
13.0
37.4
19.8
26.4
14.0
2.4
Superdistrict 2
26.7
45.8
11.1
30.8
10.0
2.3
Superdistrict 3
18.1
50.9
18.4
21.0
4.2
3.6
1.9
Superdistrict 4
4.2
47.5
10.9
36.4
3.5
0.0
1.7
East Bay
14.7
43.9
7.5
44.0
4.6
0.0
0.0
North Bay
5.8
43.4
11.9
44.7
0.0
0.0
Peninsula - South Bay
10.5
58.8
28.5
0.2
7.0
3.0
0.0
2.5
Internal to Van Ness Corridor
7.0
13.8
5.5
10.1
69.8
0.8
Source: Van Ness Avenue FEIR E-30

Appendix E
Transportation Impact Analysis Guidelines October 2002
TABLE E-20
RESIDENTS OF VAN NESS AVENUE -- WORK TRIPS (PM Peak Period)
Mode (%)
Distribution (%)
Drive Alone
Ride- share
MUNI
Transit
BART
Transit
Other
Transit
Walk
Other
ALL ORIGINS
100.0
29.2
11.1
41.8
1.5
0.6
13.9
1.9
Superdistrict 1
59.1
14.9
11.1
53.8
18.4
1.8
Superdistrict 2
17.4
37.7
11.8
31.3
16.7
2.5
Superdistrict 3
9.2
45.2
9.6
40.6
2.4
2.2
Superdistrict 4
2.7
66.7
4.9
25.7
0.0
2.7
East Bay
5.3
70.0
9.0
18.0
3.0
0.0
0.0
North Bay
1.3
71.0
17.5
11.5
0.0
0.0
Peninsula - South Bay
5.0
65.0
15.5
1.8
10.0
6.0
0.0
1.7
Internal to Van Ness Corridor
0.0
0.0
0.0
0.0
0.0
E-31

Appendix E
Transportation Impact Analysis Guidelines October 2002
TABLE E-21
RESIDENTS OF VAN NESS AVENUE -- NON-WORK TRIPS (PM Peak Period)
Mode (%)
Distribution (%)
Drive Alone
Ride- share
MUNI
Transit
BART
Transit
Other
Transit
Walk
Other
ALL ORIGINS
100.0
11.3
14.7
31.8
3.3
0.4
36.0
2.4
Superdistrict 1
12.7
20.9
29.2
37.9
8.8
3.2
Superdistrict 2
9.2
18.1
23.6
44.8
10.4
3.1
Superdistrict 3
6.6
17.7
12.5
60.0
1.8
8.0
Superdistrict 4
5.4
10.4
11.6
73.0
5.0
0.0
0.0
East Bay
1.6
35.1
22.1
42.0
0.8
0.0
0.0
North Bay
1.1
12.4
87.6
0.0
0.0
Peninsula - South Bay
5.9
35.6
17.3
40.1
7.0
0.0
0.0
Internal to Van Ness Corridor
57.5
4.4
8.7
26.0
58.8
2.1
E-32

Transportation Impact Analysis Guidelines October 2002
TABLE E-22
WORK TRIPS to CHINATOWN -- ALL (PM Peak Period)
Mode (%)
Distribution (%)
Drive Alone
Ride-
share*
MUNI
Transit
BART and
Other Transit
Walk
ALL ORIGINS
100
28
8
31
8
25
Superdistrict 1
33
7
4
14
75
Superdistrict 2
19
37
7
56
Superdistrict 3
7
37
7
48
8
Superdistrict 4
25
37
7
49
7
East Bay
6
32
23
45
North Bay
1
52
16
32
Peninsula - South Bay
9
52
16
32
Source: Transportation Impact Analysis for Chinatown Rezoning, Jan. 1987, S. F. Dept. of City Planning *Vehicle occupancy for shared ride assumed to be 2.7 persons per vehicle. E-33

Transportation Impact Analysis Guidelines October 2002
APPENDIX F TRANSIT IMPACT ANALYSIS METHODOLOGY
Transportation Impact Analysis Guidelines October 2002
Appendix F TRANSIT IMPACT ANALYSIS METHODOLOGY I. GENERAL APPROACH The methodology for the analysis of transit impacts will vary based on the location and character of the project. The location of the project determines the availability and level of transit service, and any specific corridors that may serve the area. The character of the project is a determinant in the distribution and direction of trips to and from the site. The analysis focuses on the p.m. peak period and peak hour when the demand on the transit system is at or near a peak, as is the capacity. Therefore, work trips in that period are normally assumed to be outbound from the work sites to residence locations. The tables in Appendix C provide information on the proportion and distribution of transit trips. The analysis of transit trips normally requires one or both of these two components: screenline analysis and directional link analysis. A. Screenline Analysis Screenline analysis assumes that there are identifiable corridors or directions of travel which are served by a grouping of transit lines. It is assumed that someone traveling on transit in that direction will choose one of the transit lines that collectively serve the corridor or that direction of travel. It also assumes that if one line is overloaded, the transit user will shift to another line headed in the same general direction. A screenline is selected that intercepts a group of transit lines at or near their maximum load point. The capacity of a transit line is determined by the type of vehicles used and the frequency of service. The capacity of the transit system for a particular direction of travel is, therefore, assumed to be the sum of the capacity for all the transit lines identified with a particular screenline. Likewise, the loading of the transit system for a particular screenline is assumed to be the sum of the passengers on all the transit lines associated with a screenline. The screenline analysis is most suitable for use in the greater downtown area which is a focal point for transit service, especially for peak hour work trips. B. Directional Link Analysis The “directional link” analysis requires the examination of a limited number of transit lines that serve or are in close proximity to the project site. Transit trips are assigned to the lines based on the direction of travel and the need to link to other transit carriers. A transit rider may use only one line for his or her trip, or may first use a local line to access another transit line that is headed to their final destination. For example, a transit rider may first need to ride in one direction, (e.g., north) in order to connect to corridor service that is headed east or west. In some cases, a rider may need to travel to a regional transit terminal that will eventual provide service to an area outside the city. Or, a rider in superdistrict 3 may find that there is only one transit line that can reasonably be used to travel to superdistrict 4. The directional link analysis is suitable for a number of conditions, including: F-1

Transportation Impact Analysis Guidelines October 2002
• Areas where it is most likely that a local transit line will be used to access a larger transit corridor;
• Areas where transit service is very limited and the local line(s) will be the dominant transit provider regardless of the direction of travel; and;
• Situations where the predominant travel times at a project site are other than the normal peak period.
Directional link analysis may be used in conjunction with a screenline analysis when a sufficient number of trips are linked to one of the screenline corridors or a directional screenline corridor can be defined. II. ANALYSIS BY AREA A. Greater Downtown Area; Screenline Analysis The greater downtown area consists of the C-3, SOMA, and Mission Bay districts. For projects within that area, the transit analysis may require the use of a screenline analysis for the PM peak period and PM peak hour trips for the cumulative condition, which is represented by the horizon year (currently 2020). Separate screenlines are used for MUNI (Figure F-1) and for the regional transit carriers (Figure F-2) for outbound travel. Table F-1 lists the actual PM peak period and peak hour ridership and capacity for the MUNI screenlines as derived from 1999/2000 data. Table F-2 provides similar data for the regional transit operators. Both of these tables will be updated periodically as more current data becomes available and, in particular, as MUNI’s capacity standards may be modified. Similar to traffic impact analyses, the net new transit trips generated by the project should be cited and also expressed as a percentage contribution to the total cumulative ridership and the cumulative growth, by transit operator. Projects which are more distant from the major transit corridors may also require a directional link analysis or directional screenline corridor to be defined. 1. MUNI Analysis Assessments of MUNI’s capacity in relation to demand for Existing, Existing plus Project, and Cumulative conditions for proposed projects in the greater downtown area should include a screenline analysis, unless otherwise directed. In the development of the MUNI analysis, the assignment of transit trips to transit lines and the selection of the appropriate screenline should reflect the location (by Superdistrict) of the destination or origin of the trip. Groupings of MUNI lines for the screenlines, as shown in Figure F-1, were defined for the PM peak hour based on the following considerations. F-2

Transportation Impact Analysis Guidelines October 2002
• The SE screenline should be located not at the Mission Bay Channel (the actual boundary between superdistricts 1 and 3) but instead in the vicinity of Mariposa/3rd Streets in order to keep all of the Mission Bay project area whole.
• Some MUNI lines provide important service across more than one screenline, and therefore need to be included in more than one screenline. A good example is the 15 line which needs to be included in both the Northwest (NW) and Northeast (NE) screenlines.
• MUNI has requested that “policy lines” (which they generally define as bus lines operating at greater than a ten minute headway during the peak periods) should not be included in screenline totals because they should not be presumed to attract significant ridership nor have any “surplus” capacity that is available for use by riders on more crowded lines.
Based on these understandings, the groupings by MUNI screenline for the PM Peak Hour should be as stated below. Normally, one can relate the geographic groupings to the Superdistricts as shown in Figure A-3. MUNI ridership and capacity for Existing, Existing plus Project, and Cumulative conditions should also be reported by the following sub-categories or corridors within each of the four screenlines listed below. Screenline
Transit Corridor/Category
Transit Lines
Northeast
Kearny/Stockton corridor: All other lines:
15, 30, 30X, 45 41, 10, 82X, F
Northwest
Geary corridor: All other lines:
38, 38L, 38AX, 38BX 1, 1AX, 1BX, 2, 3, 4, 5, 21, 30, 31, 31AX, 31BX, 45
Southeast
Third Street corridor: Mission Street corridor: All other lines:
15, (LRT in the future) 14, 14X 9, 9AX, 9BX, J
Southwest
Subway lines: All other lines:
K, L, M, N 6, 7, 71, F
Finally, for those screenlines and/or corridors with substantial crowding, some acknowledgment and discussion of conditions for the p.m. peak period, in addition to the p.m. peak hour, needs to be provided in the study report. If MUNI data is not available to calculate the peak hour ridership, it can be assumed to be about sixty percent of the peak period total. F-3

Transportation Impact Analysis Guidelines October 2002
Because MUNI assesses its capacity differently than other transit operators, discussions of MUNI capacity by screenline or corridor should utilize the following language:
“In contrast to other transit operators, MUNI has established a capacity utilization service standard which includes not only seating capacity but also substantial numbers of standees, with standees representing somewhere between 30% to 80% of seated passengers, depending upon the specific transit vehicle configuration. MUNI screenlines and sub-corridors at or near capacity operate under noticeably crowded conditions with many standees. Because each screenline and most sub-corridors include several MUNI lines with multiple transit vehicles from each line, some individual transit vehicles operate at or above capacity and are extremely crowded during the PM peak hour at their most heavily used points (i.e., screenlines), while others operate under less crowded conditions. Moreover, the extent of crowding is accentuated whenever target headways are not met through either missed runs and/or bunching in service. Thus, in common with other types of transportation operations such as roadways and parking facilities, transit operators may experience substantial problems in service delivery well short of established service capacity standards.”
Load factors for the aggregated lines are to be cited for Existing, Existing plus Project and the Cumulative horizon year during P.M. Peak Hour conditions (subject to the limitations of available data). It should be noted whether the project is upstream or downstream from the Maximum Load Points (MLPs) for the MUNI lines serving the project. The estimated number of trips that transfer between regional carriers and MUNI lines serving the project should be included in the MUNI assignments. For downtown and vicinity projects, BART demand for East Bay and Peninsula directions of travel should be shown separately. 2. Regional Analysis The impact on the regional transit system can be evaluated, in a manner similar to that used for MUNI, by using the regional transit screenlines (Figure F-2) and the regional transit screenline data (Table F-2). The regional transit operators include AC Transit, BART, Caltrain, Golden Gate Transit, SamTrans and the ferry operators. F-4
Transportation Impact Analysis Guidelines October 2002
B. Areas Outside Greater Downtown For projects outside of the C-3, SOMA, and Mission Bay districts, the transit analysis may include a combination of directional link analysis and screenline analysis, depending on the location and nature of the project. The transit analysis techniques will be discussed during the definition of the scope of work. Capacity, ridership and load factors during P.M. Peak Hour conditions for the affected transit lines are to be cited for Existing, Existing plus Project and, in some cases, the Cumulative horizon year. Neighborhood projects normally need not develop estimates for cumulative transit patronage growth for the future horizon year. It should be noted whether the project is upstream or downstream from the Maximum Load Points (MLPs) for the MUNI lines serving the project. The estimated number of trips that transfer between regional carriers and MUNI lines serving the project should be included in the MUNI assignments. III. TRANSIT OPERATOR SERVICE LEVELS The measurement of performance for transit service is much more complex than for roadways. Factors such as coverage, speed, convenience, reliability, safety and comfort would all need to be considered. Some of these factors are difficult to measure and the availability of data is often sparse. “Level of Service” for transit is more than a measure of the capacity of the system. However, there is one measure related to transit vehicle capacity that is more readily measured and available: the “load factor.” Most transit operators develop some standards for their operations based on the load factor concept. Many consider their vehicles to be fully loaded (i.e., a load factor of 1.0) when every seat is taken. Others consider a certain number of standees acceptable on a transit vehicle. The type of vehicle (e.g., motor coach, light rail vehicle) and type of service (local, long distance, high speed) affect the choice of an acceptable load factor. For the purposes of the analysis of impacts on a transit system, a significant impact will be considered to occur when there is an increase in demand on the transit system such that the PM peak hour or peak period level of service exceeds the acceptable level of service for a transit operator. A common measurement of the service level is the “load factor.” Most transit operators define the load factor as a ratio of passengers to seats, which is considered a direct measure of the capacity. However, some operators, such as MUNI define it as a ratio of passengers to a specified capacity of a vehicle, which is not necessarily limited to the number of seats. The capacity varies by the type of MUNI transit vehicle and how it is configured. In any case, the standard of acceptance related to capacity is defined in terms of the load factor. For each transit operator, Table F-4 defines a Transit Operations Level of Service (TOLOS) of “E,” which is considered an unacceptable level of service. The evaluation of the impacts of the proposed project on affected transit systems needs to include a determination of whether a TOLOS of 5 F-5
Transportation Impact Analysis Guidelines October 2002
occurs. The evaluation will be applied in the same manner as that specified in the scoping process for the overall transit analysis, i.e., by screenline, corridor or directional link. Whenever transit capacity in a screenline or corridor for cumulative conditions is analyzed, the significance of the project’s contribution to cumulative growth shall be determined based on direction from MEA transportation staff. A. MUNI Service Levels and Load Factors MUNI, which is the largest transit operator in the region (by riders per day), operates in an urban environment with relatively high densities and high peak hour usage. As such, the system is willing to accept higher passenger loads as a normal part of operation. The load factors for the system reflect this situation. Based on the standards articulated in MUNI’s “Short Range Transit Plan,” MUNI determines maximum load factor standards to represent the greatest number of passengers that can be comfortably carried by a MUNI vehicle. Minimum load factor standards are also calculated to determine lines which are potentially over-serviced. MUNI’s scheduling staff attempt to adjust schedules when the average load per vehicle during any 15-minute time period consistently exceeds the following;
• 45 passengers per 30 ft. coach (MC) [26 seats] • 63 passengers per 40 ft. coach (MC &TC) [40 to 50 seats] • 94 passengers per 60 ft. coach (MC & TC) [52 to 57 seats] • 119 passengers per LRV [52 to 68 seats}
The load factor ranges in Table F-3 can be viewed as somewhat analogous to the LOS categories for roadway evaluations. In fact, the 2000 Highway Capacity Manual discusses transit LOS in a similar manner. The 2000 HCM presents an “A” to “F” LOS rating for transit loading standards that is similar to those found for MUNI in Table F-3. We have added a row entitled “Load Factor Levels” and assigned a number for each column: “A" for the .00-.19 range; “B" for the .20-.39 range, etc. If 0.80 is considered the maximum average load factor for the 4-6 PM period, By analogy to 2000 HCM, the “E” column (.80-.99+ range) might be considered as “maximum scheduled load,” the “D” column (0.60-0.79 range) could be considered as “comfortable loading for standees,” and so forth. This provides some measurement of the level of service provided by a transit line or a group of transit lines in a manner that can be more readily calculated and understood. F-6

Transportation Impact Analysis Guidelines October 2002
B. Regional Operator Service Levels As stated earlier, the regional transit operators serving San Francisco include AC Transit, BART, Caltrain, Golden Gate Transit, SamTrans and the ferry operators. Three operators have only one fixed route within San Francisco: BART, Caltrain and AC Transit. All AC Transit buses are routed through one point, the Transbay Terminal. Caltrain has one major terminal in San Francisco at Fourth Street and Townsend Street, and secondary stations at 22nd Street, Paul Avenue and Bayshore. Each operator sets their own load factors and service standards, as indicated in Table F-2. However, operators vary on the manner in which these standards are articulated. Some operators are more concerned with obtaining adequate ridership rather than exceeding capacity. Each of the Load Factors shown equates to a Transit Operator Level of Service (TOLOS) of 5, i.e., exceeding the maximum scheduled load. While a TOLOS of 5 for one operator might equate to a riders-per-seat ratio of 1.0, for another operator it may equal a ratio of 1.3. This reflects possible differences in the configuration of transit vehicles and/or a difference in the level of acceptability for higher peak loads. The measurement period for a peak loading standard can be one hour or longer. When it is longer than one hour (the time normally calculated for the transportation impact assessment), the peak hour factor can be applied to the one hour data to obtain the equivalent for the peak period associated with the load factor. For example, analyses indicates that transit operators’ peak hour loads typically are approximately 60 percent of the two hour peak period. C. Calculating the Transit Operator Service Level (TOLOS) Tables F-1 through F-3 can be used for determining the TOLOS for each operator. The peak hour ridership divided by the peak hour capacity yields the peak hour load factor. For all operators except MUNI and BART, a peak hour TOLOS of 5 equates to a peak hour load factor of 1.0 and a capacity utilization of 100%. For BART, TOLOS 5 equates to a 1.0 load factor, which equals a peak hour capacity utilization of 135%. For MUNI, a peak hour TOLOS of 5 equates to a peak hour load factor of 1.0, which incorporates a combination of seated and considerable numbers of standees utilization. The peak hour transit ridership for the project needs to be added to the existing ridership in the tables. The new ridership is compared to the peak hour capacity to obtain a new capacity utilization (%) with the project. If that percentage meets the threshold in Table F-3 for TOLOS 5, it should be noted and its significance discussed. The same computations can apply to an individual transit line or group of lines, if that is the analysis methodology specified in the work scope. The cumulative peak hour capacity also needs to be analyzed in terms of the TOLOS standard and the project’s contribution to the cumulative transit ridership. F-7

Transportation Impact Analysis Guidelines October 2002
Appendix F FIGURE F-1 MUNI TRANSIT SCREENLINES F-8
Transportation Impact Analysis Guidelines October 2002
Appendix F FIGURE F-2 REGIONAL TRANSIT SCREENLINES F-9

Transportation Impact Analysis Guidelines October 2002
Appendix F
TABLE F-1 MUNI SCREENLINE DATA
1999/2000 Existing Conditions & 2020 Cumulative Conditions Weekday PM Peak Hour
MUNI SCREENLINES: EXISTING AND 2020 CUMULATIVE CONDITIONS: WEEKDAY PM PEAK HOUR
EXISTING CONDITIONS 2020 CUMULATIVE CONDITIONS SCREENLINE/CORRIDOR HOURLY
RIDERSHIP DEMAND
HOURLY CAPACITY
CAPACITY UTILIZATION
HOURLY RIDERSHIP DEMAND
HOURLY CAPACITY
CAPACITY UTILIZATION
NORTHEAST KEARNY/STOCKTON CORRIDOR ALL OTHER LINES SCREENLINE SUBTOTAL
2,217 946
3,163
2,611 1,706
4,317
85% 55%
73%
2,770 911
3,681
3,468 1,596
5,064
80% 57%
73%
NORTHWEST GEARY CORRIDOR ALL OTHER LINES SCREENLINE SUBTOTAL
2,509 5,956
8,465
2,942 6,989
9,931
85% 85%
85%
2,915 6,939
9,854
3,099 8,293
11,392
94% 84%
87%
SOUTHEAST THIRD STREET CORRIDOR MISSION STREET CORRIDOR ALL OTHER LINES SCREENLINE SUBTOTAL
424
1,168 1,982
3,574
595
1,325 2,170
4,090
71%
88% 91%
87%
758
1,497 2,818
5,073
893
1,685 2,600
5,178
85%
89% 108%
98%
SOUTHWEST SUBWAY LINES ALL OTHER LINES SCREENLINE SUBTOTAL
5,259 1,409
6,668
5,891 1,830
7,721
89% 77%
86%
5,927 1,587
7,514
6,188 1,837
8,025
96% 86%
94%
TOTAL FOR ALL SCREENLINES
21,870
26,059
84%
26,122
29,659
88%
SOURCE: San Francisco Muncipal Railway (MUNI) as compiled by Wilbur Smith Associates; Existing Ridership, Existing Capacity, and Cumulative Capacity from MUNI from 1999/2000 data; Cumulative Ridership derived from San Francisco County Transportation Authority Model
F-10
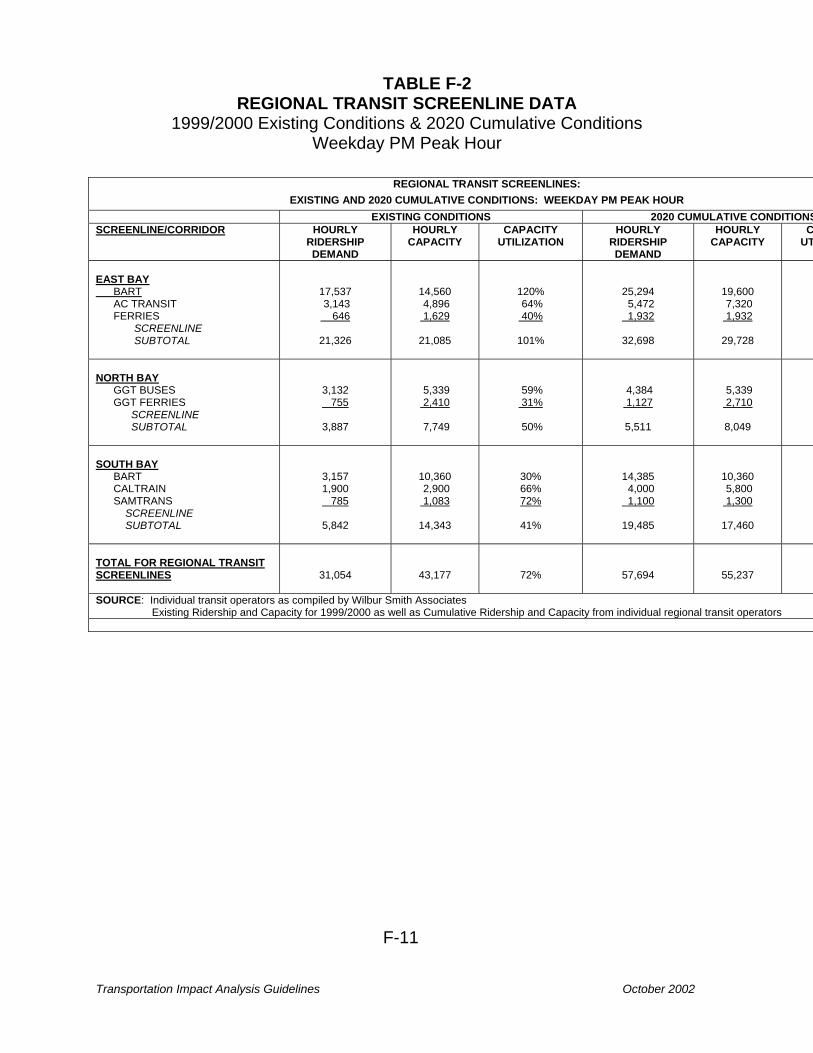
Transportation Impact Analysis Guidelines October 2002
TABLE F-2 REGIONAL TRANSIT SCREENLINE DATA
1999/2000 Existing Conditions & 2020 Cumulative Conditions Weekday PM Peak Hour
REGIONAL TRANSIT SCREENLINES: EXISTING AND 2020 CUMULATIVE CONDITIONS: WEEKDAY PM PEAK HOUR
EXISTING CONDITIONS 2020 CUMULATIVE CONDITIONSSCREENLINE/CORRIDOR HOURLY
RIDERSHIP DEMAND
HOURLY CAPACITY
CAPACITY UTILIZATION
HOURLY RIDERSHIP DEMAND
HOURLY CAPACITY
CUT
EAST BAY BART AC TRANSIT FERRIES SCREENLINE SUBTOTAL
17,537 3,143 646
21,326
14,560 4,896 1,629
21,085
120% 64% 40%
101%
25,294 5,472 1,932
32,698
19,600 7,320 1,932
29,728
NORTH BAY GGT BUSES GGT FERRIES SCREENLINE SUBTOTAL
3,132 755
3,887
5,339 2,410
7,749
59% 31%
50%
4,384 1,127
5,511
5,339 2,710
8,049
SOUTH BAY BART CALTRAIN SAMTRANS SCREENLINE SUBTOTAL
3,157 1,900 785
5,842
10,360 2,900 1,083
14,343
30% 66% 72%
41%
14,385 4,000 1,100
19,485
10,360 5,800 1,300
17,460
TOTAL FOR REGIONAL TRANSIT SCREENLINES
31,054
43,177
72%
57,694
55,237
SOURCE: Individual transit operators as compiled by Wilbur Smith Associates Existing Ridership and Capacity for 1999/2000 as well as Cumulative Ridership and Capacity from individual regional transit operators
F-11

Transportation Impact Analysis Guidelines October 2002
TABLE F- 3 TRANSIT OPERATIONS LEVEL OF SERVICE (TOLOS) by OPERATOR
Transit Operator1
TOLOS
Peak Hour Load
Factor
Ratio:
Riders per Seat
Peak Hour Capacity
Utilization2
MUNI
E
1.0
1.0 -1.83
100%
BART
E
1.0
1.354
135%
AC Transit
E
1.0
1.0
100%
Golden Gate
Transit
E
1.0
1.0
100%
Caltrain
E
1.0
1.0
100%
SamTrans
E
1.0
1.0
100%
Ferries
N.A.
N.A.
N.A.
N.A.
1 Not all transit operators are included.
2 When the “peak hour capacity utilization” noted here is met or exceeded, the relevant portion of the transit system is assumed to be operating at or above the load standard, a TOLOS of 5, which is an unacceptable condition. 3 Varies by type of transit vehicle.
4 The load factor shown for BART is for the peak hour for transbay service. During the tw hour shoulder comprising the remainder of the three hour peak period, average load factors are expected to meet an objective of 1.15 for each route.

Transportation Impact Analysis Guidelines October 2002
Transportation Impact Analysis Guidelines October 2002
APPENDIX G PARKING ANALYSIS METHODOLOGY
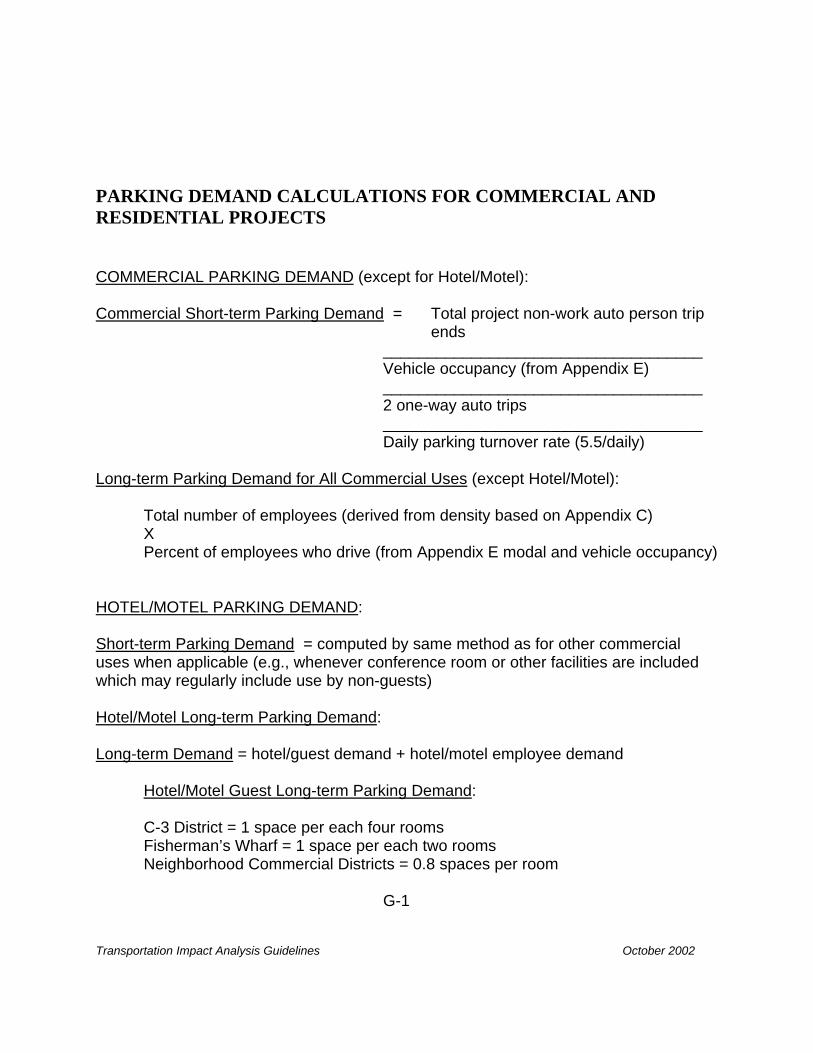
Transportation Impact Analysis Guidelines October 2002
PARKING DEMAND CALCULATIONS FOR COMMERCIAL AND RESIDENTIAL PROJECTS COMMERCIAL PARKING DEMAND (except for Hotel/Motel): Commercial Short-term Parking Demand = Total project non-work auto person trip
ends ____________________________________ Vehicle occupancy (from Appendix E) ____________________________________ 2 one-way auto trips ____________________________________ Daily parking turnover rate (5.5/daily) Long-term Parking Demand for All Commercial Uses (except Hotel/Motel):
Total number of employees (derived from density based on Appendix C) X Percent of employees who drive (from Appendix E modal and vehicle occupancy) HOTEL/MOTEL PARKING DEMAND: Short-term Parking Demand = computed by same method as for other commercial uses when applicable (e.g., whenever conference room or other facilities are included which may regularly include use by non-guests) Hotel/Motel Long-term Parking Demand: Long-term Demand = hotel/guest demand + hotel/motel employee demand Hotel/Motel Guest Long-term Parking Demand: C-3 District = 1 space per each four rooms Fisherman’s Wharf = 1 space per each two rooms Neighborhood Commercial Districts = 0.8 spaces per room G-1

Transportation Impact Analysis Guidelines October 2002
Hotel/Motel Employee Long-term Parking Demand:
0.9 employees/room (from Appendix C) X 49% employees work during daytime (from Apprendix C)
X Work Trips Modal Split (from Appendix E) divided by Work Auto Occupancy (from Appendix E) = Hotel/Motel Employee Long-term Parking Demand Sources: Various EIRs certified by the San Francisco Planning Commission RESIDENTIAL PARKING DEMAND: New residential projects should generally use the following rates to estimate parking demand: One Bedroom or Studios = 1.1 vehicles/unit Two Bedrooms or More = 1.5 vehicles/unit For new affordable rental residential projects only, the following rates should be used to estimate parking demand: Affordable Rental One Bedroom or Studios = 0.45 vehicles/unit Affordable Rental Two Bedrooms or More = 0.92 vehicles/unit Parking demand for new senior housing units = 1 space per each five units In San Francisco, a substantial number of auto owners use transit for commuting and need to park their vehicles at home during the midday period for weekdays. Based on ITE’s “Shared Parking Planning Guidelines” (August 1995), weekday midday residential parking demand has been estimated to be about 80 percent of the overnight residential parking demand for large residential projects. This estimate, as well as other estimates of the effects and opportunities for shared parking, may be subject to modification based on collection of data reflecting specific San Francisco conditions. Sources: Parking Demand for Affordable Housing in San Francisco (San Francisco
Planning Department, January 1992) Residential Conservation Rezoning Study Research (San Francisco
Planning Department, 1989-90) Downtown Residents Parking Surveys (Recht Hausrath Associates, 1986) Shared Parking Planning Guidelines (ITE, August 1995)
G-2

Transportation Impact Analysis Guidelines October 2002
CREDITS FOR EXISTING PARKING DEMAND: For existing commercial or residential projects which would be displaced by proposed new development, existing parking demand should, if possible, be determined from actual empirical counts for the existing uses or derived based on measurements of existing trips. If it is not practical to conduct surveys for actual existing trips and/or parking demand for existing or recently closed commercial uses on the project site, estimates should be prepared by specific direction from Planning Department transportation staff based on applying representative modal splits to appropriate comparable land uses. If it is not practical to conduct surveys for actual existing parking demand for existing or recently closed residential uses on the project site, the most recent U.S. Census auto ownership data available for the census tract in which the proposed project would be located should be used to estimate existing residential parking demand. When adaptive reuse projects are proposed, carryovers of existing legal parking deficiencies as parking credits in relation to San Francisco Planning Code requirements will be determined by the Zoning Administrator of the San Francisco Planning Department. In general, carryover or “grandfathering” of existing, legally-established parking deficiencies are forfeited whenever demolition of an existing structure is necessary to accommodate the proposed new project. G-3

Transportation Impact Analysis Guidelines October 2002
APPENDIX H FREIGHT DELIVERY AND SERVICE DEMAND METHODOLOGY

Transportation Impact Analysis Guidelines October 2002
Appendix H
FREIGHT DELIVERY AND SERVICE DEMAND METHODOLOGY Peak Hour* Generation Number of Spaces per 1,000 GSF = [(1.25)(R)/9]/(2.4) Average Hour Generation Number of Spaces per 1,000 GSF = [(R)/(9)]/(2.4) Daily Truck Trip Generation Per Use = (R)X(GSF/1,000) Where: R = Daily truck trip generation per 1,000 GSF of
use from Table I-1 1.25 = Peak Hour deliveries at 25% higher rate than
other hours 9 = Number of hours deliveries are made (8:00
a.m. - 5:00 p.m.) 2.4 = Assuming average truck delivery/pickup of 25
minutes, 2.4 trucks could be accommodated per hour
*NOTE: Peak Hour Truck Trip Generation generally occurs between 10:00 a.m. and
1:00 p.m., and is unrelated to P.M. Peak Hour used in other transportation analyses.
H-1
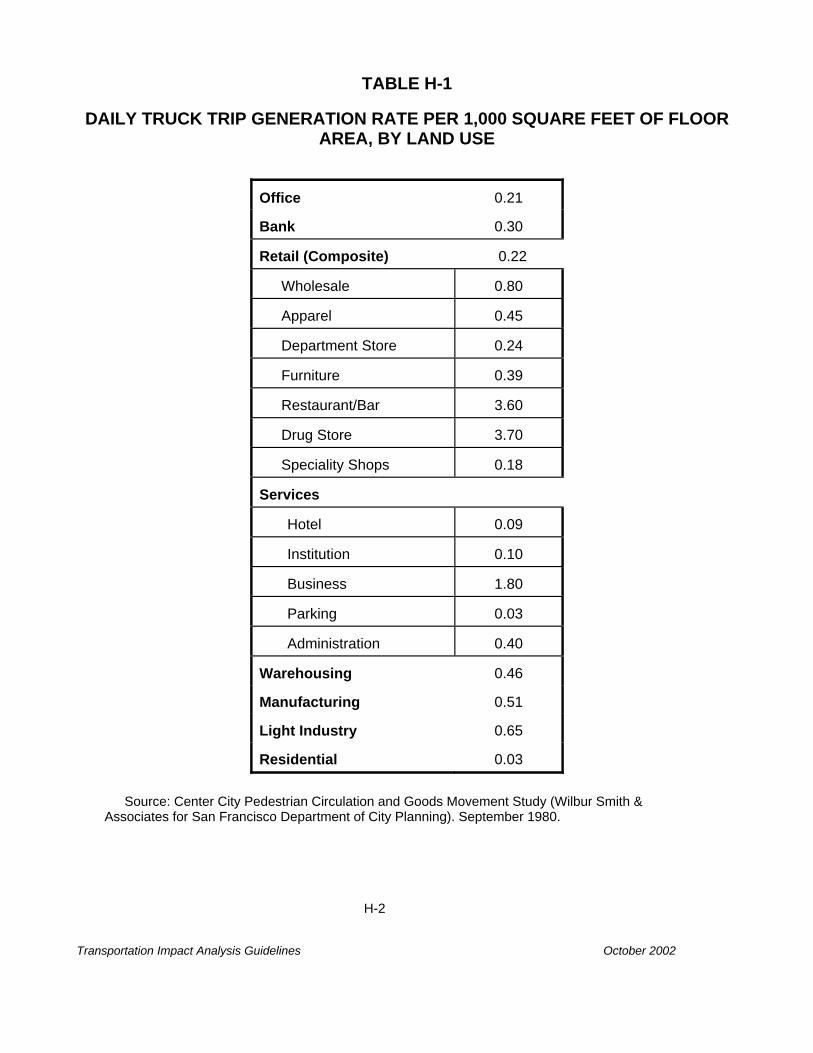
Transportation Impact Analysis Guidelines October 2002
TABLE H-1
DAILY TRUCK TRIP GENERATION RATE PER 1,000 SQUARE FEET OF FLOOR AREA, BY LAND USE
Office
0.21
Bank
0.30
Retail (Composite) 0.22
Wholesale
0.80
Apparel
0.45
Department Store
0.24
Furniture
0.39
Restaurant/Bar
3.60
Drug Store
3.70
Speciality Shops
0.18 Services
Hotel
0.09
Institution
0.10
Business
1.80
Parking
0.03
Administration
0.40 Warehousing
0.46
Manufacturing
0.51
Light Industry
0.65
Residential
0.03
Source: Center City Pedestrian Circulation and Goods Movement Study (Wilbur Smith &
Associates for San Francisco Department of City Planning). September 1980. H-2

Transportation Impact Analysis Guidelines October 2002
TABLE H-2 PERCENT DAILY SERVICE VEHICLE ACTIVITY BY VEHICLE TYPE
Cars and Pickups
25%
Vans
42%
Small Delivery Trucks5
2 axles
9%
Large Delivery Trucks6
2 axles
19%
Large Delivery Trucks7
3 axles
4%
Tractor - Trailer
4 axles
1%
5 Characterized as a small courier, U.S. Mail truck or step van
6 Characterized as a mid-size Hertz rental truck, beverage truck or small furniture truck
7 Characterized as a garbage truck Source: DKS Associates, 1990
H-3
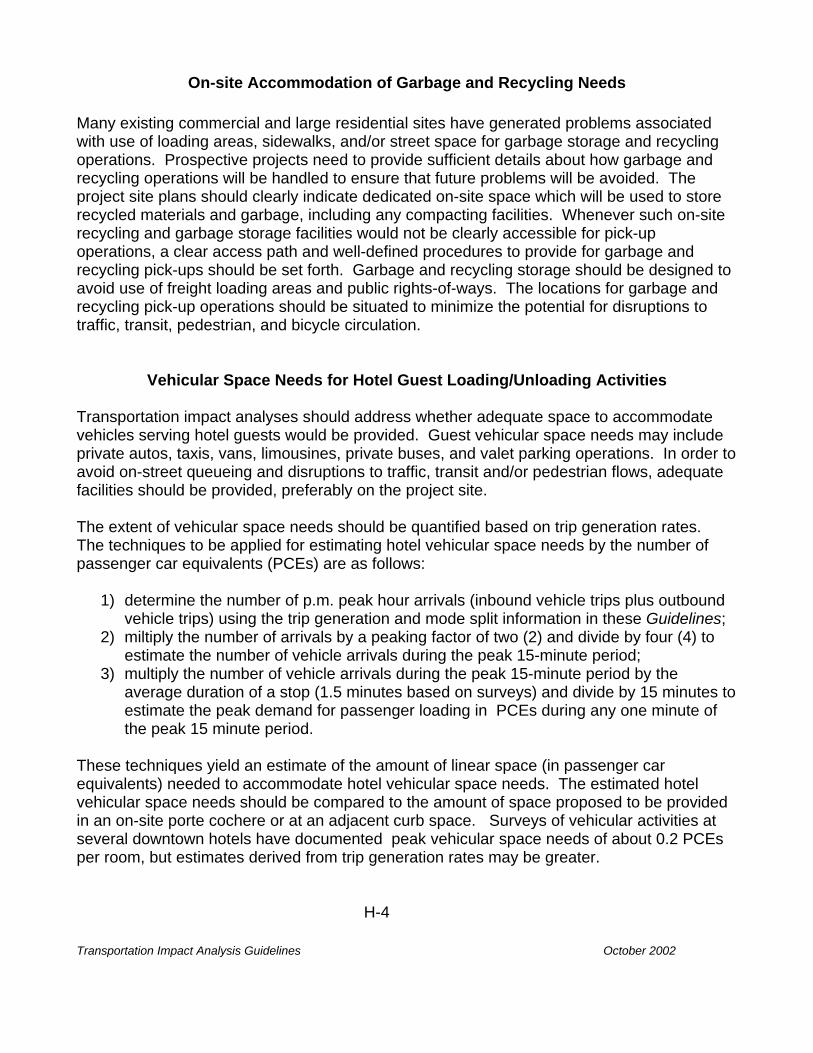
Transportation Impact Analysis Guidelines October 2002
On-site Accommodation of Garbage and Recycling Needs Many existing commercial and large residential sites have generated problems associated with use of loading areas, sidewalks, and/or street space for garbage storage and recycling operations. Prospective projects need to provide sufficient details about how garbage and recycling operations will be handled to ensure that future problems will be avoided. The project site plans should clearly indicate dedicated on-site space which will be used to store recycled materials and garbage, including any compacting facilities. Whenever such on-site recycling and garbage storage facilities would not be clearly accessible for pick-up operations, a clear access path and well-defined procedures to provide for garbage and recycling pick-ups should be set forth. Garbage and recycling storage should be designed to avoid use of freight loading areas and public rights-of-ways. The locations for garbage and recycling pick-up operations should be situated to minimize the potential for disruptions to traffic, transit, pedestrian, and bicycle circulation.
Vehicular Space Needs for Hotel Guest Loading/Unloading Activities Transportation impact analyses should address whether adequate space to accommodate vehicles serving hotel guests would be provided. Guest vehicular space needs may include private autos, taxis, vans, limousines, private buses, and valet parking operations. In order to avoid on-street queueing and disruptions to traffic, transit and/or pedestrian flows, adequate facilities should be provided, preferably on the project site. The extent of vehicular space needs should be quantified based on trip generation rates. The techniques to be applied for estimating hotel vehicular space needs by the number of passenger car equivalents (PCEs) are as follows:
1) determine the number of p.m. peak hour arrivals (inbound vehicle trips plus outbound vehicle trips) using the trip generation and mode split information in these Guidelines;
2) miltiply the number of arrivals by a peaking factor of two (2) and divide by four (4) to estimate the number of vehicle arrivals during the peak 15-minute period;
3) multiply the number of vehicle arrivals during the peak 15-minute period by the average duration of a stop (1.5 minutes based on surveys) and divide by 15 minutes to estimate the peak demand for passenger loading in PCEs during any one minute of the peak 15 minute period.
These techniques yield an estimate of the amount of linear space (in passenger car equivalents) needed to accommodate hotel vehicular space needs. The estimated hotel vehicular space needs should be compared to the amount of space proposed to be provided in an on-site porte cochere or at an adjacent curb space. Surveys of vehicular activities at several downtown hotels have documented peak vehicular space needs of about 0.2 PCEs per room, but estimates derived from trip generation rates may be greater. H-4

Transportation Impact Analysis Guidelines October 2002
Appropriate adjustments should be made to account for the needs of over-sized vehicles such as limousines or private buses. The analysis should also account for constraints due to any likely reservations of space between users, e.g., reserved taxi zones or bus space. Any deficiencies in the amount of space provided compared to estimated hotel vehicular space needs should be identified. Whenever any deficiencies are identified, measures to address any such deficiencies, as well as potential impacts if such measures were not implemented, should be set forth in the background transportation report. In addition to determining the adequacy of hotel vehicular space, the analysis should address the potential for conflicts between hotel guest needs (i.e., luggage and guests waiting for pick-up) and pedestrian circulation. Typically, this would include a pedestrian LOS analysis for the most constrained sidewalk segment as well as careful evaluation of potential disruptions and hazards which may affect pedestrians. Measures to address any deficiencies or conflicts should be identified and potential impacts if such measures were not implemented should be set forth. Example Applying Methodology to Calculate PCEs for Passenger Loading Needs at Hotels:
1. Based on the rates in these Guidelines, assume a project is expected to generate 30 inbound and 40 outbound vehicle trips during the p.m. peak hour. Assume that all of thes trips would involve a vehicle (car) stopping in a passenger loading area (either for a typical passenger drop-off or dropped-off (or pick-up) for valet parking).
2. 70 arrivals * (times) peak factor of 2 divided by 4 = 35 vehicles during the peak 15 minutes of the p.m. peak hour. 3. 35 arrivals during the peak 15-minute period * (times ) average stop duration of 1.5
minutes divided by 15 minutes = 3.5 PCEs during the peak minute. H-5

Transportation Impact Analysis Guidelines October 2002
Transportation Impact Analysis Guidelines October 2002
APPENDIX I TYPICAL TRANSPORTATION MITIGATION MEASURES
FOR THE DOWNTOWN AREA
Appendix I
Transportation Impact Analysis Guidelines October 2002
TYPICAL TRANSPORTATION MITIGATION MEASURES
FOR THE DOWNTOWN AREA In the downtown area, a number of transportation related items are required by law which would serve to mitigate impacts, and are summarized here for informational purposes. They should also be referred to in the Mitigation Section of the EIR, not as mitigation measures specific to the project but rather, as generic mitigation measures applicable in the downtown area. These measures include: contribution of funds for increased transit service per the Transit Impact Development Fee, Board of Supervisors Ordinance #224-81; when auto parking is provided, provision of off-street bicycle storage pursuant to Section 155 of the City Planning Code; provision of transportation brokerage services to coordinate a transportation management program and participation in a network of transportation brokers pursuant to Section 163 of the City Planning Code; priority use of off-street parking in the project for the physically handicapped, travelers in car pools and van pools, and short-term trips by business visitors and clients, pursuant to Section 155 of the City Planning Code; and provision of building directories and signs for service elevators in loading areas, pursuant to Section 155 of the City Planning Code. Additional generic measures apply which are not related to mitigation of transportation impacts. Additional measures which are not required by legislation but which would also serve to mitigate transportation impacts and are generally included in transportation analyses as a policy matter include the following.
Measures that could be implemented by the project sponsor as part of the project:
• The placement of paving, landscaping or structures in the sidewalk area (subject to City approval) would be done in such a way as to minimize interference with pedestrian traffic.
• Secure bicycle facilities would be provided for project commuters and short-term visitors which would, at a minimum, provide safe shelter for the number of spaces required in the project.
I-1

Appendix I
Transportation Impact Analysis Guidelines October 2002
• While subsurface sidewalk vaults are discouraged, the project sponsor would design subsurface sidewalk vaults to allow for possible future widening of adjacent streets. Vault design shall be of sufficient strength to carry maximum vehicular live and dynamic loads. Design of the vault area to accommodate street trees would also be made, subject to Department of Public Works approval. In addition, should vaults exist or be installed as part of the project, the project sponsor would accommodate and pay for the installation of all subsurface footings, supports and foundations as may be required for future public improvements such as street lights, trolley wire poles, signs, benches, transit shelters, etc. within project vault areas. Placement of such improvements is entirely within the discretion of the City. Should the City at any future time determine its need for any subsurface sidewalk space occupied by the project, for any reason, the project sponsor agrees to waive all rights of appeal of revocation of permits to occupy such space.
• During the construction period, the project sponsor would cause to limit
construction truck movement to the hours between 9:00 a.m. and 3:30 p.m., and to prohibit staging or unloading of equipment and materials during the periods of 7:30 a.m. to 9:00 a.m. and 3:30 p.m. to 6:00 p.m., to minimize peak period traffic conflicts and to accommodate queuing of MUNI buses prior to the peak hours of service. The project sponsor and construction contractor would meet with the Traffic Engineering Division of the Department of Parking and Traffic, the Fire Department, MUNI, and the Department of City Planning to determine feasible traffic management and mitigation measures to reduce traffic congestion during construction of this project and other nearby projects. To minimize cumulative traffic impacts due to lane closures during construction, the project sponsor would coordinate with construction contractors for any concurrent nearby projects that are planned for construction or which later become known.
• The project sponsor would, in cooperation with the Municipal Railway, install
eyebolts or make provision for the direct attachment of eyebolts for MUNI trolley wires on the proposed building whenever necessary or agree to waive all rights to refuse the attachment of eye bolts to the proposed building if such attachment is done at City expense.
• The parking driveway would include warning devices (lighted signs and noise-
emitting devices) to alert pedestrians to vehicles exiting the structure.
I-2

Appendix I
Transportation Impact Analysis Guidelines October 2002
Measures that could be implemented by public agencies:
• Coordinate work schedules of Pacific Gas and Electric Company and other utilities requiring trenching, so that street disruption would take place during weekends and off-peak hours. This should be done through the San Francisco Committee for Utility Liaison on Construction and Other Projects (CULCOP). In-street utilities should be installed at the same time as the street is opened for construction of the project to minimize street disruption.
• The City could act upon or endorse the implementation of transportation
mitigations described in: the Mission Bay EIR; and in the South of Market EIR. The measures include those related to roadways, freeway ramps, transit and transportation system management. Such measures include: supporting rail rapid transit lines from downtown San Francisco to suburban corridors and major non-downtown centers in San Francisco; increased funding for San Francisco and regional transit agencies to expand existing non-rail transit service; providing exclusive transit lanes; encouraging car pools, van pools and bicycle use; improving pedestrian circulation within downtown San Francisco; and providing transportation brokerage services.
• Some of the implementing actions would require approval by decision-makers
outside the City and County of San Francisco; many of the measures would require action by City agencies other than the City Planning Commission, such as the San Francisco Public Utilities Commission and/or Board of Supervisors. All except such things as providing transportation brokers would require funding from or approval by MTC. These measures are system-wide measures that must be implemented by public agencies. Other than project-specific measures such as the relevant transportation mitigation measures described above as part of the project or such measures as the Transit Impact Development Fee assessment by San Francisco Ordinance 224-81 which would contribute directly to implementation of these system-wide measures, it is not appropriate to impose mitigation at system-wide levels on individual projects.
I-3
Appendix I
Transportation Impact Analysis Guidelines October 2002
APPENDIX J REQUIRED TRANSPORTATION MANAGEMENT PROGRAMS
AND BROKERAGE SERVICES FOR C-3 AND SOMA OFFICE DEVELOPMENT

J-1 Transportation Impact Analysis Guidelines October 2002
REQUIRED TRANSPORTATION MANAGEMENT PROGRAMS AND
BROKERAGE SERVICES FOR C-3 AND SOMA OFFICE DEVELOPMENT SEC. 163.* TRANSPORTATION MANAGEMENT PROGRAMS AND TRANSPORTATION BROKERAGE SERVICES IN C-3 AND SOUTH OF MARKET DISTRICTS.
(a) Purpose. This Section is intended to assure that adequate measures are undertaken and maintained to minimize the transportation impacts of added office employment in the downtown and South of Market area, in a manner consistent with the objectives and policies of the Master Plan, by facilitating the effective use of transit, encouraging ridesharing, and employing other practical means to reduce commute travel by single-occupant vehicles.
(b) Requirement. For any new building or additions to or conversion of an existing building in C-3 and South of Market Districts where the gross square feet of new, converted or added floor area for office use equals at least 100,000 square feet, or, in the case of the SSO District, 25,000 square feet, the project sponsor shall be required to provide on-site transportation brokerage services for the actual lifetime of the project, as provided in this Subsection. Prior to the issuance of a temporary permit of occupancy (for this purpose Section 149(d) shall apply), the project sponsor shall execute an agreement with the Department of City Planning for the provision of on-site transportation brokerage services and preparation of a transportation management program to be approved by the Director of Planning and implemented by the provider of transportation brokerage services. The transportation management program and transportation brokerage services shall be designed:
(1) To promote and coordinate effective and efficient use of transit by tenants and their employees, including the provision of transit information and sale of transit passes on-site;
(2) To promote and coordinate ridesharing activities for all tenants and their employees within the structure or use;
(3) To reduce parking demand and assure the proper and most efficient use of on-site or off-site parking, where applicable, such that all provided parking conforms with the requirements of Article 1.5 of this Code and project approval requirements;
(4) To promote and encourage project occupants to adopt a coordinated flex-time or staggered work hours program designed to more evenly distribute the arrival and departure times of employees within normal peak commute periods;
(5) To participate with other project sponsors in a network of transportation brokerage services for the respective downtown or South of Market area;
(6) To carry out other activities determined by the Department of City Planning to be appropriate to meeting the purpose of this requirement. (Added by Ord. 414-85, App. 9/17/85; amended by Ord. 115-90, App. 4/6/90) *Source: City and County of San Francisco Planning Code, Article 1.5, Section 163, December 1998.

Transportation Impact Analysis Guidelines October 2002
SELECTED SOURCES
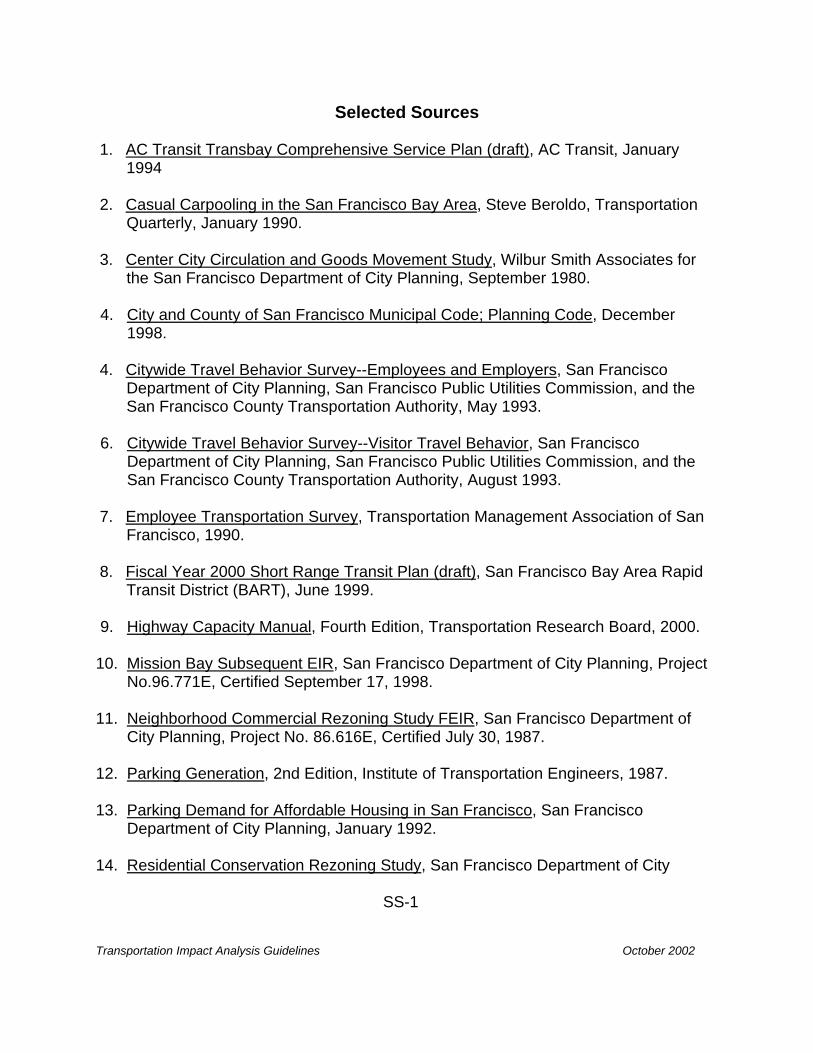
Transportation Impact Analysis Guidelines October 2002
Selected Sources 1. AC Transit Transbay Comprehensive Service Plan (draft), AC Transit, January 1994 2. Casual Carpooling in the San Francisco Bay Area, Steve Beroldo, Transportation Quarterly, January 1990. 3. Center City Circulation and Goods Movement Study, Wilbur Smith Associates for the San Francisco Department of City Planning, September 1980. 4. City and County of San Francisco Municipal Code; Planning Code, December 1998. 4. Citywide Travel Behavior Survey--Employees and Employers, San Francisco Department of City Planning, San Francisco Public Utilities Commission, and the San Francisco County Transportation Authority, May 1993. 6. Citywide Travel Behavior Survey--Visitor Travel Behavior, San Francisco Department of City Planning, San Francisco Public Utilities Commission, and the San Francisco County Transportation Authority, August 1993. 7. Employee Transportation Survey, Transportation Management Association of San Francisco, 1990. 8. Fiscal Year 2000 Short Range Transit Plan (draft), San Francisco Bay Area Rapid Transit District (BART), June 1999. 9. Highway Capacity Manual, Fourth Edition, Transportation Research Board, 2000. 10. Mission Bay Subsequent EIR, San Francisco Department of City Planning, Project No.96.771E, Certified September 17, 1998. 11. Neighborhood Commercial Rezoning Study FEIR, San Francisco Department of City Planning, Project No. 86.616E, Certified July 30, 1987. 12. Parking Generation, 2nd Edition, Institute of Transportation Engineers, 1987. 13. Parking Demand for Affordable Housing in San Francisco, San Francisco Department of City Planning, January 1992. 14. Residential Conservation Rezoning Study, San Francisco Department of City SS-1

Transportation Impact Analysis Guidelines October 2002
Planning, 1990. 15. San Francisco Bicycle Plan, Wilbur Smith Associates, for the San Francisco Department of Parking and Traffic, March 10, 1997. 16. San Francisco General Plan, Department of City Planning, as amended through July 1996. 17. San Francisco Land Use Database, San Francisco Planning Department, Unpublished proprietary dataset, 1998. 18. Shared Parking Planning Guidelines, Institute of Transportation Engineers, 1995. 19. Short Range Transit Plan, Fiscal Years 1999/2000 - 2008/2009 (draft), Golden Gate Bridge, Highway and Transportation District, July 1999. 20. South of Market FEIR, San Francisco Department of City Planning, Project No. 85.463E, Certified October 26, 1989. 21. Survey of Downtown Residents, Recht Hausrath Associates, 1986. 22. Transbay Terminal/Caltrain Downtown Extension/Redevelopment Project DEIS/DEIR, San Francisco Department of City Planning, Peninsula Corridorl Joint Powers Board andSan Francisco Redevlopment Agency, Project No. 2000.048E, October 2002. 23. Trip Generation, 6th Edition, Institute of Transportation Engineers, 1997; and 5th Edition, 1991. 24. Trip Generation Handbook, Institute of Transportation Engineers, October, 1998. 25. Urban Space for Pedestrians, Pushkrev and Zupan, MIT Press, 1975 26. Van Ness Avenue FEIR, San Francisco Department of City Planning, Project No. 87.586E, Certified December 17, 1989. SS-2