Transportation Development Plan April 30, 2021
59
Transportation Development Plan April 30, 2021 Prepared by: Lima-Allen County Regional Planning Commission 130 West North Street - Lima, Ohio 45801 (419) 228-1836 The preparation of this report was financed jointly by the Federal Transit Administration, the Ohio Department of Transportation, and local units of government. The contents of this report do not reflect the official view and/or policies of the Federal Transit Administration, nor the Ohio Department of Transportation. This report does not constitute a standard specification or regulation.
Transcript of Transportation Development Plan April 30, 2021
Transportation Development Plan
April 30, 2021
Prepared by:
Lima-Allen County Regional Planning Commission
130 West North Street - Lima, Ohio 45801
(419) 228-1836
The preparation of this report was financed jointly by the Federal Transit Administration, the Ohio
Department of Transportation, and local units of government. The contents of this report do not
reflect the official view and/or policies of the Federal Transit Administration, nor the Ohio
Department of Transportation. This report does not constitute a standard specification or
regulation.
i
EXECUTIVE SUMMARY
1. Information has been presented throughout this report that reflects the nature and scope ofpast, present and future public transportation in Allen County, Ohio. The report was preparedfor, and with information provided by, the Allen County Regional Transit Authority (ACRTA) inan attempt to document the adequacy of public transportation services currently provided andto present supportable rationale to justify the use of federal/state/local monies in the provisionof such services.
2. The report emphasizes the positive relationship between Section 504 of the Rehabilitation Actof 1973 and the Americans with Disabilities Act of 1990 (ADA), and ACRTA’s compliance.The report also recognizes and addresses Environmental Justice (EJ) requirements,incorporating fixed route service area statistics, current ridership, and the residence andemployment characteristics of low income and minority population in the Lima UrbanizedArea. The fixed route currently serves those census tracts (2010) that contain 84.8% of allpoverty, 67.6% of all disabled, 85.1% of all households without access to a vehicle, 65.2% ofall elderly, and 93.9% of all individuals identified as a minority. Local elected officials and theMPO supported the ACRTA contention that expenditures are necessary to maintain publictransportation service as an alternative mode of travel, choice, and opportunity servicing the community’s transportationally disadvantaged. All vehicles serving the fixed route system are lift-equipped with hydraulic kneeling capability and/or low floors to facilitate travel for the mobility impaired.
3. In CY 2020 the ACRTA reflected a seven (7) member Board of Trustees with an OperationsDirector, an Administrative & Capital Director, a Finance Manager, a Maintenance Manager, two Transportation Managers, one (1) Shift Leader, two (2) mechanics, one (1) service technician, one (1) fueler/washer, one (1) maintenance clerk, three (3) dispatch operators, and twenty-four (24) transit operators (16 full-time, 8 part-time). In all, there were thirty-nine (39) employees under the supervision of the Board and the ACRTA Directors. ACRTA alsocontracted with a CPA.
4. The 2020 fixed route service area encompasses approximately 27 square miles. Serving163,519 riders. The Covid 19 pandemic in 2020 cause a drop in ridership for the year.
5. The complementary paratransit program, Uplift, serves an area of approximately 51 squaremiles performing 6,478 Para Transit and 18,665 Demand Response rides.
6. Federal and state grant allocations, as well as operational costs, are outlined in Section 3.7Table 3-5 reveals 2020 expenses of $3.79 million, and revenues of 4.79 million. Table 3-6gives a detailed breakdown of revenue projections out to 2024, and Table 3-7 does the samefor expenses. With the successful passage of the levy and CARES Funding, ACRTA willexperience a stable financial position through the next several years.
ii
TABLE OF CONTENTS
SECTION PAGE EXECUTIVE SUMMARY ........................................................................................................ i
TABLE OF CONTENTS .......................................................................................................... ii
LIST OF TABLES & MAPS ..................................................................................................... iii
I INTRODUCTION ......................................................................................................... 1-1 1.1 Rationale ......................................................................................................... 1-1 1.2 Objective ......................................................................................................... 1-2 1.3 Overview ......................................................................................................... 1-2
II DEMAND ESTIMATION AND SYSTEM OVERVIEW ................................................. 2-1 2.1 Population ....................................................................................................... 2-1 2.2 Area Employment ............................................................................................ 2-2 2.3 Demand for Transit .......................................................................................... 2-3 2.4 Travel Generators ........................................................................................... 2-3 2.5 Demographic Profile of Service Area .............................................................. 2-5 2.6 Summary ......................................................................................................... 2-20
III 2020 OPERATIONAL UPDATE .................................................................................. 3-1 3.1 Management Structure and Operating Personnel ........................................... 3-1 3.2 Bus Facilities ................................................................................................... 3-1
3.2.1 Transit Properties ................................................................................ 3-2 3.2.2 Transit Vehicles ................................................................................... 3-3 3.2.3 Bus Shelters ........................................................................................ 3-4
3.3 Service Area .................................................................................................... 3-4 3.4 Fare Structure ................................................................................................. 3-5 3.5 Transfer Policy ................................................................................................ 3-6 3.6 Operational Planning ....................................................................................... 3-7
3.6.1 Service Improvements……………………………………………………. 3-8 3.6.2 Coordination of Services…………………………………………………. 3-8
3.7 Funding, Revenues & Expenses ..................................................................... 3-9
IV TRANSIT DEVELOPMENT PROGRAM ..................................................................... 4-1 4.1 Transit Development Program......................................................................... 4-1
APPENDICES A ORGANIZATIONAL CHART ....................................................................................... A - 1 B FIVE-YEAR PLAN ....................................................................................................... B - 1

iii
LIST OF TABLES & MAPS
TABLES PAGE Table 2-1 Allen County Population by Political Subdivision 1980-2010 .......................... 2-1 Table 2-2 Lima Area Employers ...................................................................................... 2-6 Table 2-3 Travel Generators ........................................................................................... 2-7 Table 2-4 Demographic Summary of Census Tracts within Study Area .......................... 2-14 Table 3-1 ACRTA Service Fleet December 31, 2020 ...................................................... 3-3 Table 3-2 2020 ACRTA Fare Structure ........................................................................... 3-6 Table 3-3 Comparison of Service Effectiveness – Performance Measures .................... 3-7 Table 3-4 Comparison of Service Effectiveness – Recovery Ratios ............................... 3-8 Table 3-5 ACRTA Actual Revenue Expenses – Ended December 31, 2020…………… 3-10 Table 3-6 Revenue Projections 2020-2024 ..................................................................... 3-10 Table 3-7 Expense Projections 2021-2024 ..................................................................... 3-10
MAPS Map 2-1 Allen County Base Map…………………………………………………………… 2-2 Map 2-2 ACRTA 2020 Fixed Route System………………………………………………. 2-4 Map 2-3 Major Employers within the Fixed Route Service Area………………………... 2-8 Map 2-4 Social Service Agencies within the Fixed Route Service Area……………….. 2-9 Map 2-5 Shopping Facilities within the Fixed Route Service Area……………………… 2-10 Map 2-6 Medical & Residential Care Facilities within the Fixed Route Service Area… 2-11 Map 2-7 RTA Fixed Route by Census Tract………………………………………………. 2-12 Map 2-8 Percentage of Population 65 Years and Older by Census Tract……………... 2-13 Map 2-9 Percentage of Population Below Poverty level by Census Tract…………….. . 2-15 Map 2-10 Percentage of Population with Mobility Limitation by Census Tract…………. . 2-16 Map 2-11 Percentage of Population with No Vehicle by Census Tract…………………. . 2-17 Map 2-12 Percentage of Minority Population by Census Tract………………………….. . 2-18 Map 2-13 Work Sites by Number of Employees within Fixed Route Service Area…….. 2-19 Map 3-1 General Public……………………………………………………………………… 3-6
1-1
SECTION I INTRODUCTION
Evident by the late 1800's, urban America had been shaped by its dependency upon the ability to move goods and people as efficiently and cheaply as possible. A historical retrospective reveals that the horse-drawn omnibus was the ever-important mode of public transport between 1830 and 1860. Cable cars performed admirably between 1860 and 1890; but, the most universal mode of public transportation from 1890 to the 1940's, in all but the largest of cities, was the electric streetcar. Not only did these early transportation systems lace the urban structure of cities together, they affected the arrangement and function of elements within the structure of cities.
The introduction of the twentieth century's most profound technological development, the automobile, drastically changed the predominant urban structure along with the means of transporting goods and people. Motorized transportation had an immense affect on the urban environment and its internal structure. Travel was no longer confined to the fixed route system of the electric streetcars and the railroad; people and goods were free to move as they wished. Schedules were no longer determined by the rigidity of the public transit system. The transit system's linear and inflexible routes, geared to the traditional downtown, became increasingly irrelevant. With this new freedom of movement came the decentralization of activities, both residential and employment, as well as the elimination of the transportation monopoly enjoyed by fixed route systems.
Since the end of World War II, public mass transit has seen an irreversible decline in ridership. As income increased, so did automobile ownership. Non-work related trips and the decentralization of employment sites caused a shift in residential preference to the suburbs. Public mass transit was losing its share of the market because it was not designed to compete effectively with the automobile in terms of out-of-pocket commuting costs, travel time, comfort, and safety. Mass transit was still structured to service the typical downtown-oriented travel commutes. As a result, mass transit increasingly drew its market share from captive riders or those who have no other choice.
Recent literature emphasizes that even among captive riders (the poor, the aged, and the disabled) mass transit is too inflexible in routing and often dangerous to those who suffer physical disabilities. Studies cite that low income workers find multiple transfers, which are costly in terms of out-of-pocket commuting costs and time, are all too often necessary to get from inner city neighborhoods to the suburban job sites. While, the elderly and disabled find it difficult to utilize mass transit due to associated walks to and from stations, stairways, long waits, the need to step in and out of vehicles, the lack of adequate seating space, the rapid acceleration/deceleration of vehicles, the rapid loading/unloading of vehicles, and crowds.
Although the automobile is now the predominant and preferred mode of transportation within the United States, there is a sizeable segment of our population that is forced to rely on mass transit to satisfy work, medical, school, and personal travel needs. For this reason, urban centers must
continue to provide, fund, and improve public transportation. This study has been prepared, in part, to examine public transportation within Allen County as well as to propose Transit Development Plan for the Allen County Regional Transit Authority (ACRTA) to enable the ACRTA to better accommodate the travel requirements of Allen County residents.
1.1 Rationale In accordance with the Urban Mass Transportation Act of 1964, as amended, the Federal Transit Administration (FTA) has become the principal source of federal financial

1-2
assistance for aiding urban areas in the planning, development, and improvement of comprehensive mass transportation systems. Such financial assistance is provided through a variety of programs within the FTA's statutory authority.
Under the auspices of the Section 5307 Planning Program, the FTA provides financial assistance to state and local governments to aid in the preparation of plans and cost-effective Transportation Improvement Programs (TIPs), which guide the use of Federal capital assistance resources. Although a discretionary program, the distribution of such funds to states and each of 514 urbanized areas is done using a population weighted allocation so that the planning grants are tracked and released in the same way as capital grants.
Recipients of such funding in an Ohio urbanized area, although not required, have been strongly encouraged by the Ohio Department of Transportation (ODOT) to prepare a Transit Development Plan in order to support requests for federal funds made in their capital improvement program. Since the report addresses both FTA and Federal Highway Administration (FHWA) planning requirements, applicants for this type of capital assistance programming may use the document for the purpose of complying with other FTA/FHWA requirements, providing that their proposed projects comply with the information outlined here.
1.2 Objective The objective of this report, which examines public mass transportation as provided by the ACRTA, is three-fold: (1) to document the present nature and scope of public transit services; (2) to assess the adequacy of existing transit services and propose alternatives; and, (3) to provide a detailed rationale for the FY 2020-2024 capital improvement program. This report is intended to provide the insights and justification necessary to develop a financially sound public transportation service and to serve as a guide for policy and technical committees.
1.3 Overview This study is composed of several distinct sections. The Introduction is followed by a demographic overview that provides information of the area's population and income, travel generators, and demand for transit. Section III provides an overview of the ACRTA fixed route system, the complimentary paratransit system, Uplift, the ACRTA fare structure and the ACRTA budget. Section IV provides an overview of ACRTA’s Goals and Objectives.
2-1
SECTION II DEMAND ESTIMATION AND SYSTEM OVERVIEW
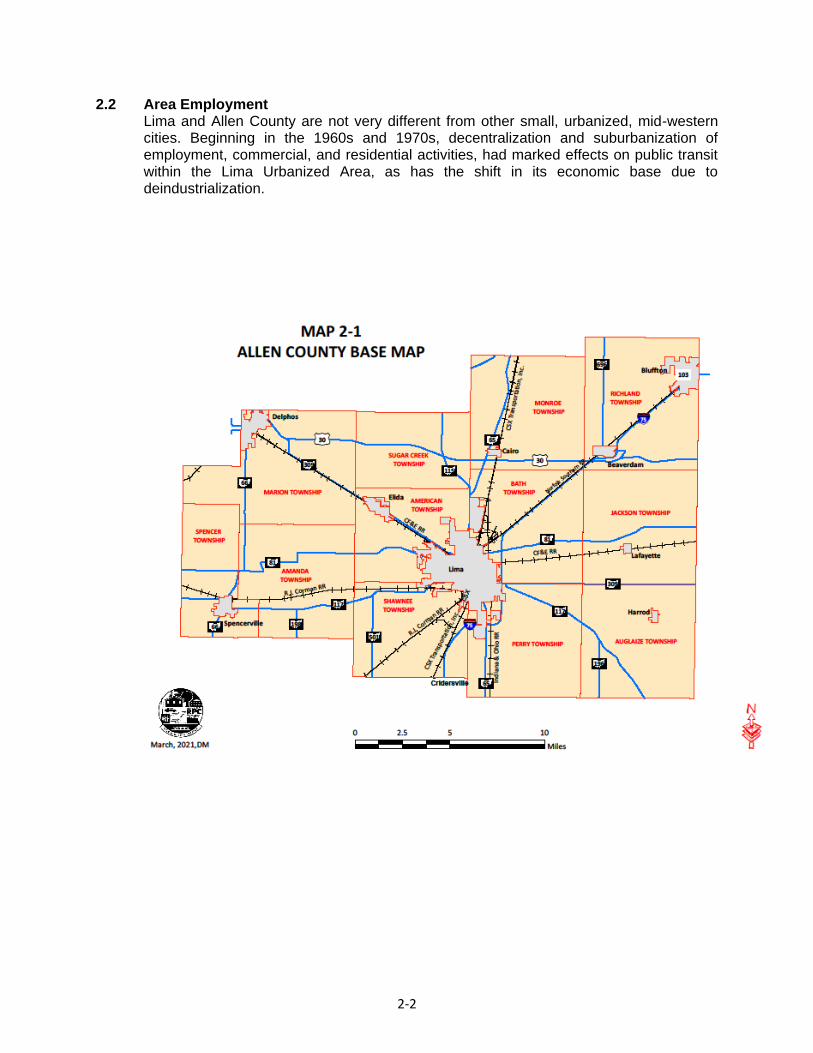
The City of Lima, located in Allen County, Ohio, is the largest inland city in northwest Ohio. Allen County's size is 410 square miles with 12.6 square miles within the municipal limits of Lima. Allen County is both urban and rural in nature, with its urban population centralized around the City of Lima (refer to Map 2-1). The community’s demographics have changed over time and such change has necessarily affected the delivery of the ACRTA’s services. The remainder of this section examines key demographic indices to provide baseline information on the overall demand for public transportation by specific segments of the population.
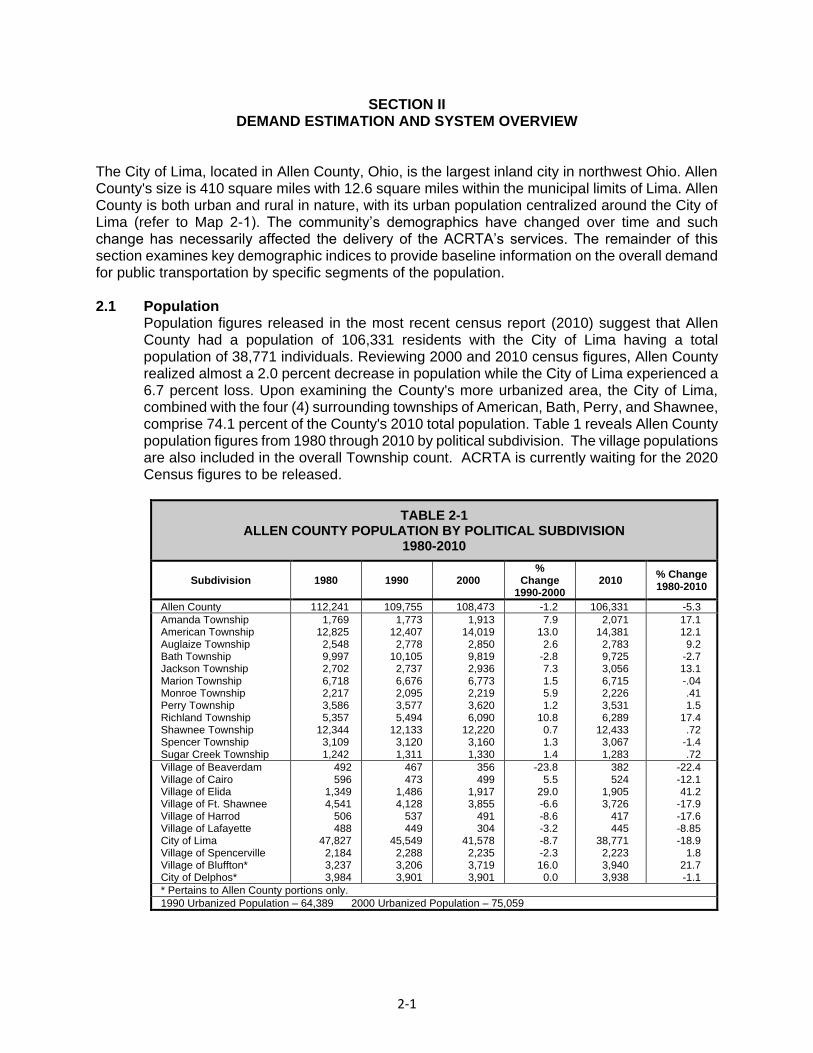
2.1 Population Population figures released in the most recent census report (2010) suggest that Allen County had a population of 106,331 residents with the City of Lima having a total population of 38,771 individuals. Reviewing 2000 and 2010 census figures, Allen County realized almost a 2.0 percent decrease in population while the City of Lima experienced a 6.7 percent loss. Upon examining the County's more urbanized area, the City of Lima, combined with the four (4) surrounding townships of American, Bath, Perry, and Shawnee, comprise 74.1 percent of the County's 2010 total population. Table 1 reveals Allen County population figures from 1980 through 2010 by political subdivision. The village populations are also included in the overall Township count. ACRTA is currently waiting for the 2020 Census figures to be released.
TABLE 2-1ALLEN COUNTY POPULATION BY POLITICAL SUBDIVISION
1980-2010
Subdivision 1980 1990 2000 %
Change 1990-2000
2010 % Change 1980-2010
Allen County 112,241 109,755 108,473 -1.2 106,331 -5.3
Amanda Township American Township Auglaize Township Bath Township Jackson Township Marion Township Monroe Township Perry Township Richland Township Shawnee Township Spencer Township Sugar Creek Township
1,769 12,825
2,548 9,997 2,702 6,718 2,217 3,586 5,357
12,344 3,109 1,242
1,773 12,407
2,778 10,105
2,737 6,676 2,095 3,577 5,494
12,133 3,120 1,311
1,913 14,019
2,850 9,819 2,936 6,773 2,219 3,620 6,090
12,220 3,160 1,330
7.9 13.0
2.6 -2.87.31.55.91.2
10.80.71.31.4
2,071 14,381
2,783 9,725 3,056 6,715 2,226 3,531 6,289
12,433 3,067 1,283
17.1 12.1
9.2 -2.713.1-.04.411.5
17.4.72
-1.4.72
Village of Beaverdam Village of Cairo Village of Elida Village of Ft. Shawnee Village of Harrod Village of Lafayette City of Lima Village of Spencerville Village of Bluffton* City of Delphos*
492 596
1,349 4,541
506 488
47,827 2,184 3,237 3,984
467 473
1,486 4,128
537 449
45,549 2,288 3,206 3,901
356 499
1,917 3,855
491 304
41,578 2,235 3,719 3,901
-23.85.5
29.0-6.6-8.6-3.2-8.7-2.316.0
0.0
382 524
1,905 3,726
417 445
38,771 2,223 3,940 3,938
-22.4-12.141.2
-17.9-17.6-8.85-18.9
1.821.7-1.1
* Pertains to Allen County portions only.
1990 Urbanized Population – 64,389 2000 Urbanized Population – 75,059
2-2
2.2 Area Employment Lima and Allen County are not very different from other small, urbanized, mid-western cities. Beginning in the 1960s and 1970s, decentralization and suburbanization of employment, commercial, and residential activities, had marked effects on public transit within the Lima Urbanized Area, as has the shift in its economic base due to deindustrialization.
2-3
In the past, the County enjoyed a strong manufacturing sector within its economic base, but the economic recession of the early 1980s forced the closing of two of the area's largest employers, Clark Equipment and Sheller Globe, eliminating over 2,000 jobs. Subsequent downturns in the economy coupled with the elimination of government defense programs compelled other major local employers to cut back and/or close operations such as General Dynamics, Airfoil Textron, and Sundstrand. Presently, Allen County's economic base is undergoing transition; it is experiencing renewed growth in various sectors with the number of business establishments growing. Over the past decade, the most significant change has been a shift from the manufacturing sector to the service sector, with local employment in the manufacturing sector decreasing by 20.0 percent and service sector employment increasing by 55.0 percent. Today the service sector accounts for 32.6 percent of all employment in Allen County. In addition, since 1980, the number of retail, wholesale, transportation, and agricultural sector establishments increased in number and diversity, as did employment within those sectors. Based upon historical precedents, available land, existing infrastructure, government support, educational attainment levels and facilities as well as the area's strong work ethic, such growth is expected to continue. Many of these factors had a slight downturn in 2020 because of COVID-19, but are expected to pick up again after the pandemic.
2.3 Demand for Transit Demand for transit service is, at least conceptually, directly related to population growth, and hence based upon residential, commercial, and industrial development. Following such a premise, as an area's population and employment base increases, the demand for, and ultimately ridership of, public transit would theoretically grow as well. Historically, public transit in Allen County has only serviced the urbanized area around the City of Lima; but, various factors have resulted in a geographically expanded service area with increasing ridership. Map 2-2 illustrates the current service area of the ACRTA.
The related processes of decentralization, global mergers, and corporate downsizing have resulted in the loss of several large transit demand generators. Employment growth moving out of the central business district (CBD) and into the suburbs increased the travel distance to work/services for the general public. In addition, this migration resulted in increased pressure to enlarge the public transit service area. However, the loss of the aforementioned generators and the associated population decline, when combined with increased automobile accessibility negatively impacted ACRTA ridership and self-generated revenue. ACRTA passed a levy in May of 2019 which may allow for a smoother more inclusive transit system.
The remainder of this section will identify transit demand generators and deal with specific characteristics of the service area, the consumers of public transit, and the adequacy of present public mass transportation within Allen County.
2.4 Travel Generators The key to maximizing the productivity and efficiency of any public transportation system is the identification of the origins and destinations of a majority of the trips made each day. By identifying the destinations of these trips, it is possible to distinguish travel generators and construct a route schedule that will take into consideration the needs of the ridership, while taking advantage of centralized locations and an economy of scale in delivering such services.

2-4

2-5
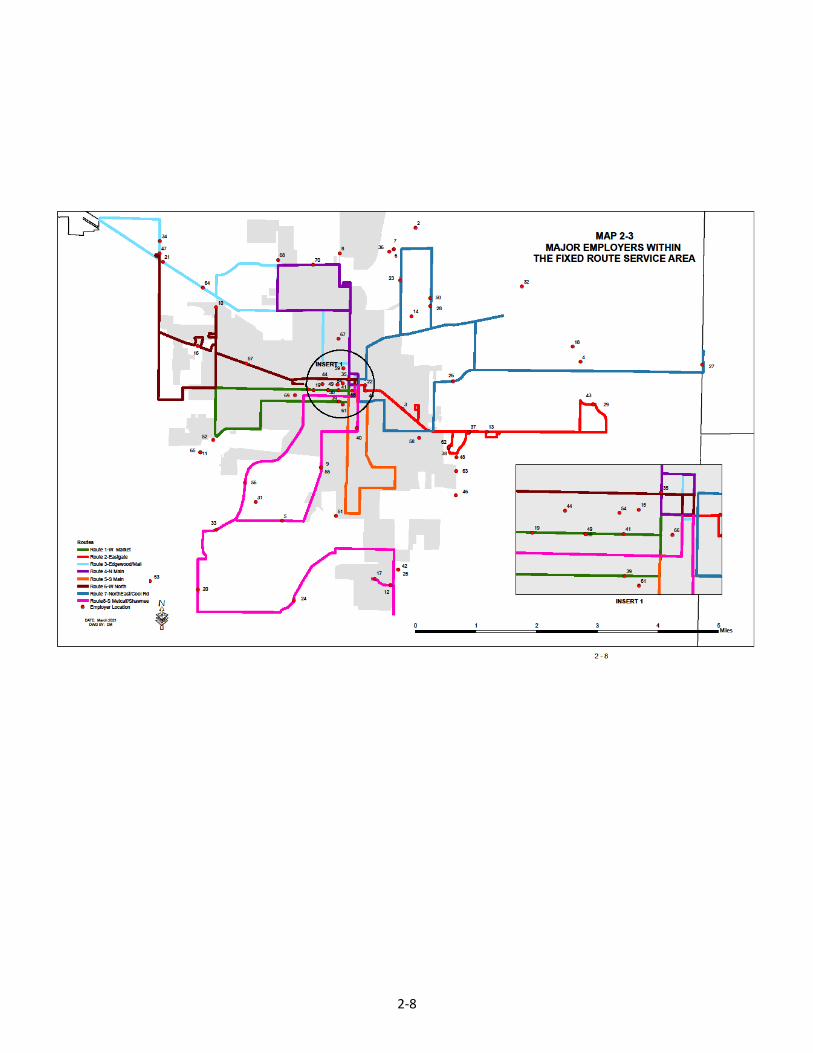
Within Allen County, the City of Lima's CBD must be considered the dominant activity center. Due to the large number of firms and their employees located within the 30 block area (bordered by W. Wayne Street to the north, Elm Street to the south, McDonel Street to the west, and Central Avenue to the east), the CBD must also be considered as the major travel generator. Although the CBD is the dominant generator, it is not alone. There are several other areas located within the Lima Urbanized Area that are also significant traffic generators. These areas are often based on the location of a single large travel generator, or a cluster of smaller activity centers located within close proximity to each other. Examples of major travel generators include St. Rita's Medical Center, located at 730 West Market Street in Lima and Memorial Hospital at 1001 Bellefontaine in Lima. In addition to the large single travel generators, there are a few areas in the urbanized area where several smaller clustered activities are located in close proximity to each other. When combined, these also could be considered as travel generators; examples would include the activity areas centered around roadways servicing business and industry in the areas of Bible/Sugar, Allentown/Cable, Elida/Cable as well as Ft. Amanda/Buckeye.
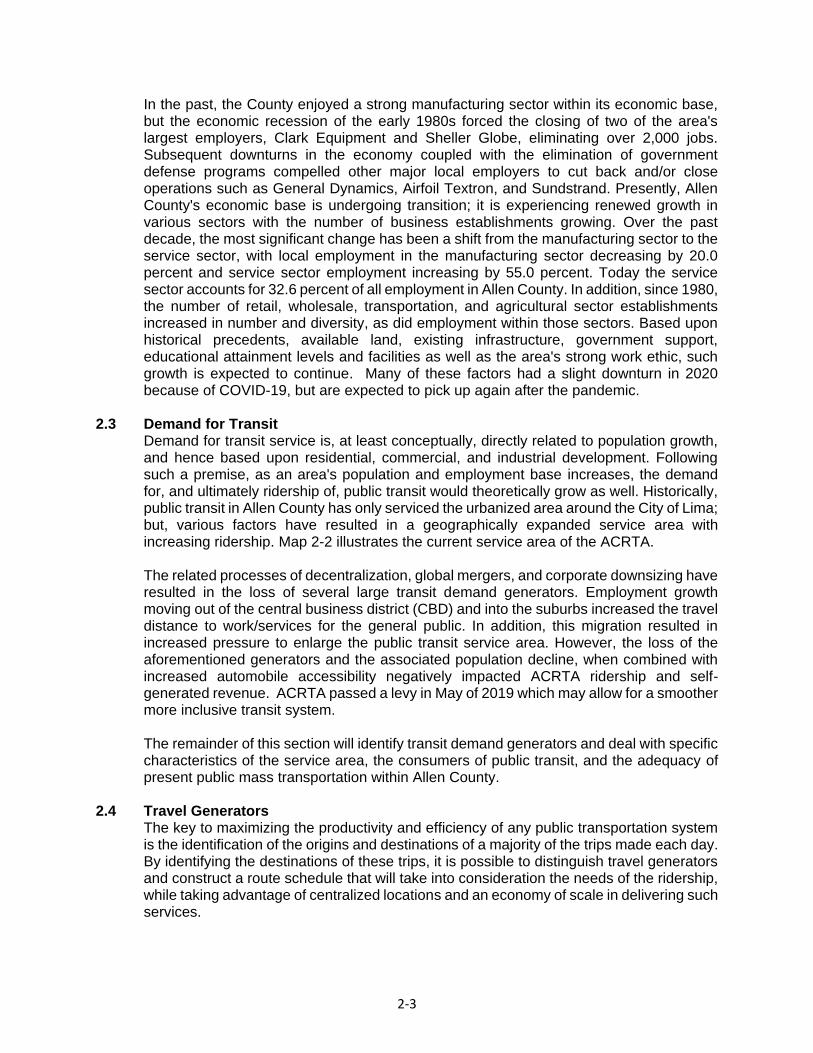
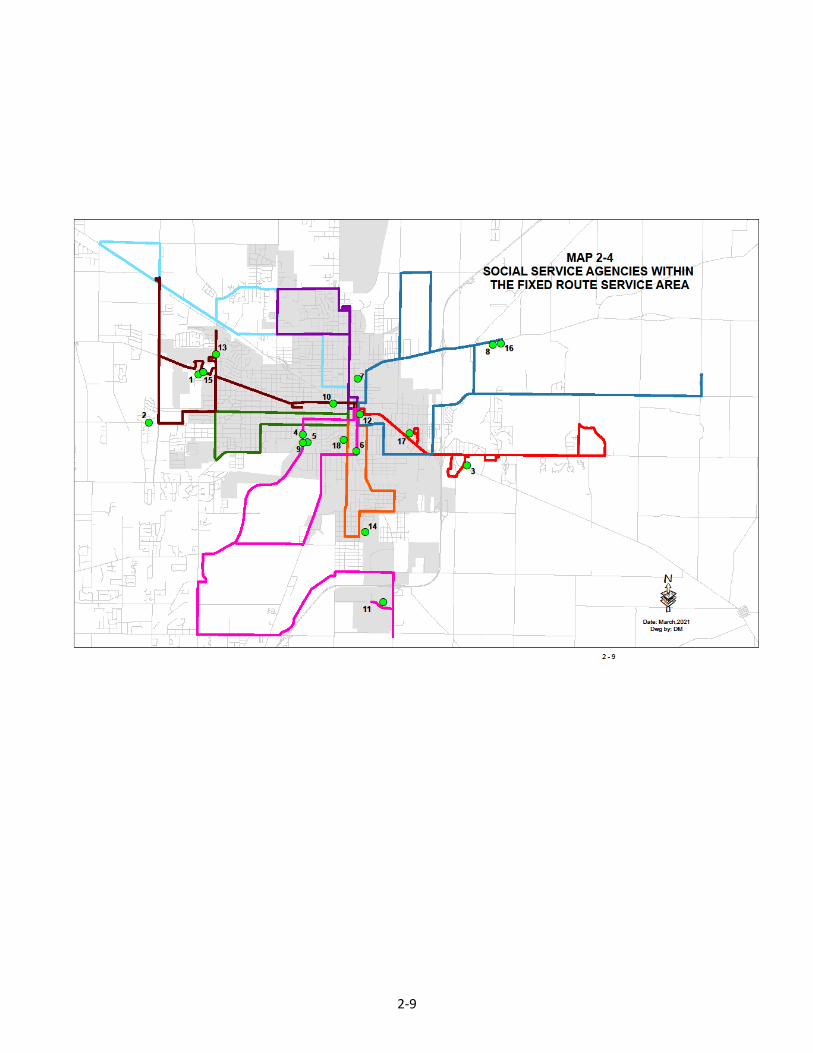
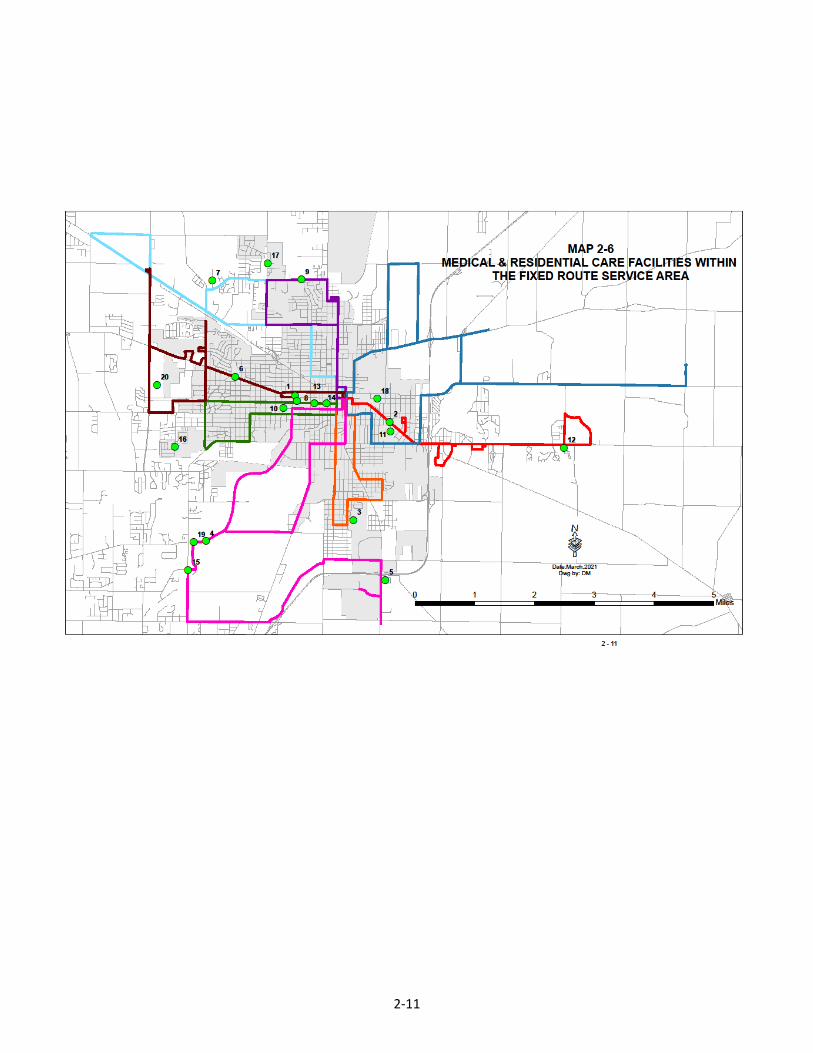
Map 2-3 reveals the location of major employers within the Lima Urbanized Area. Table 2 identifies those employers by site location number. Maps 2-4 through 2-6, inclusive, identify the location of other various trip generators. Map 2-4 reveals the location of private and public social service agencies that tend to be major generators within the City of Lima. While Map 2-5 reveals the location of the various shopping facilities servicing the Allen County population, Map 2-6 depicts the location of the health care facilities within the Lima area. Table 3 provides the identity of the respective institutions by site identification number and map number. Collectively, the maps reveal the extent to which the area employers, the social service agencies, shopping centers, and health care facilities are geographically clustered. In an attempt to study the degree to which the Lima area's major generators are being serviced by the ACRTA, an overlay of the present route system is imposed on the various maps along with the location of previously identified travel generators.
Currently, a vast majority of the generators have access to service. Analysis of the various maps reveal that while the majority of the area's social service agencies, health care facilities, and shopping centers are being serviced, there are several generators that are presently excluded, including such major employers as Husky, Ford Motor Company, Joint Systems Manufacturing Center, Dana, Nickle’s Bakery, Scot Lad Foods Lima, Ineos, Accubilt, and Metokote Corp.
2.5 Demographic Profile of Service Area It has been widely accepted that certain segments of the population are more likely to need and make use of public transit services than the general population as a whole. In general, persons more likely to utilize public transit services, as provided by the ACRTA, are those with one of the following characteristics: over 65 years of age, earn below the local average income, suffer from a transportation disability, are of minority status, or are less likely to have access to a private automobile.
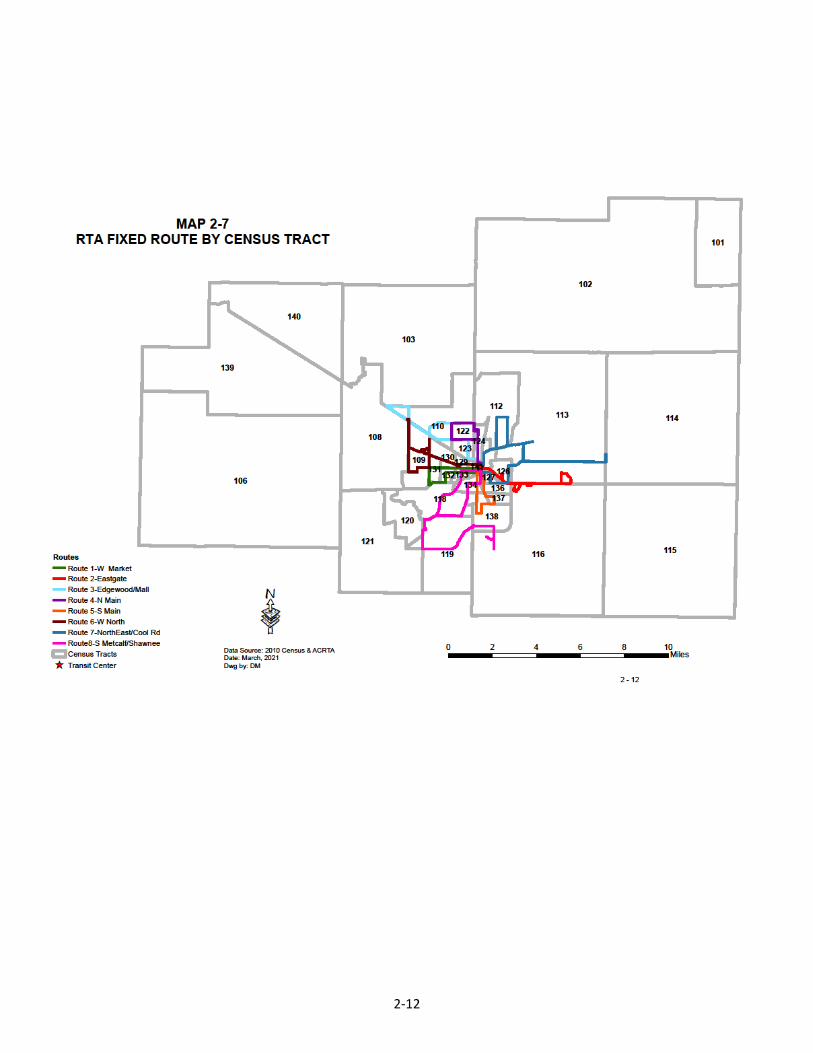
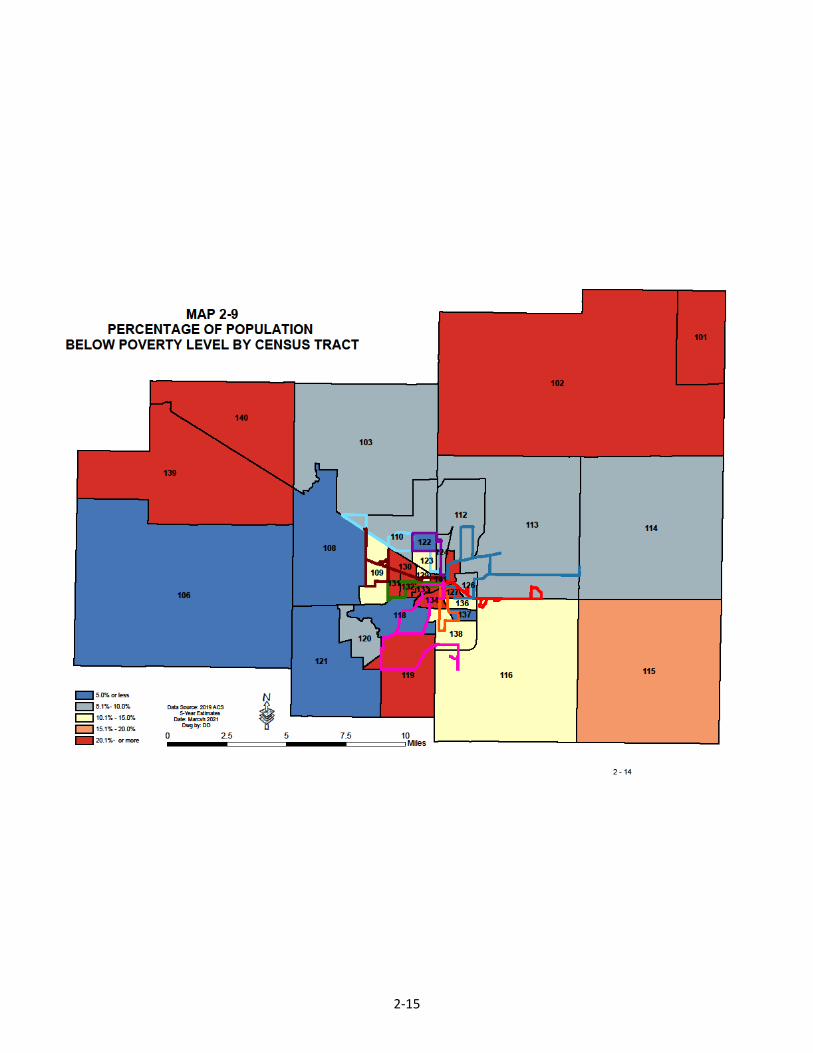
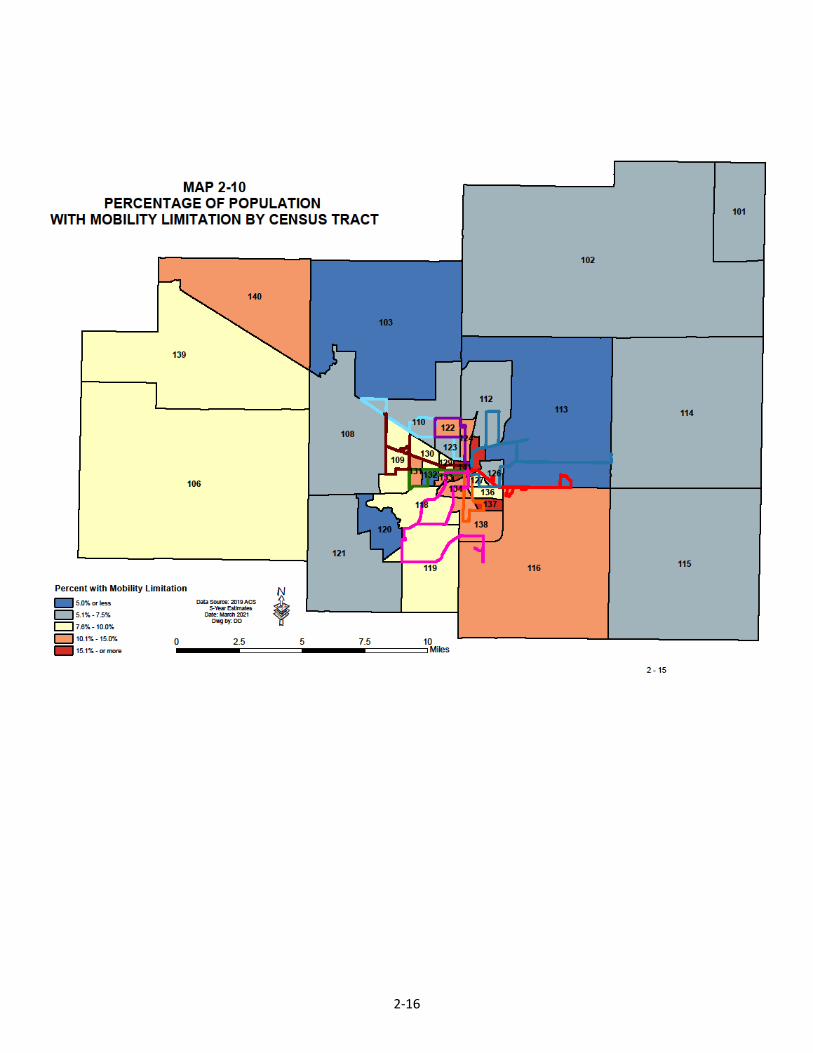
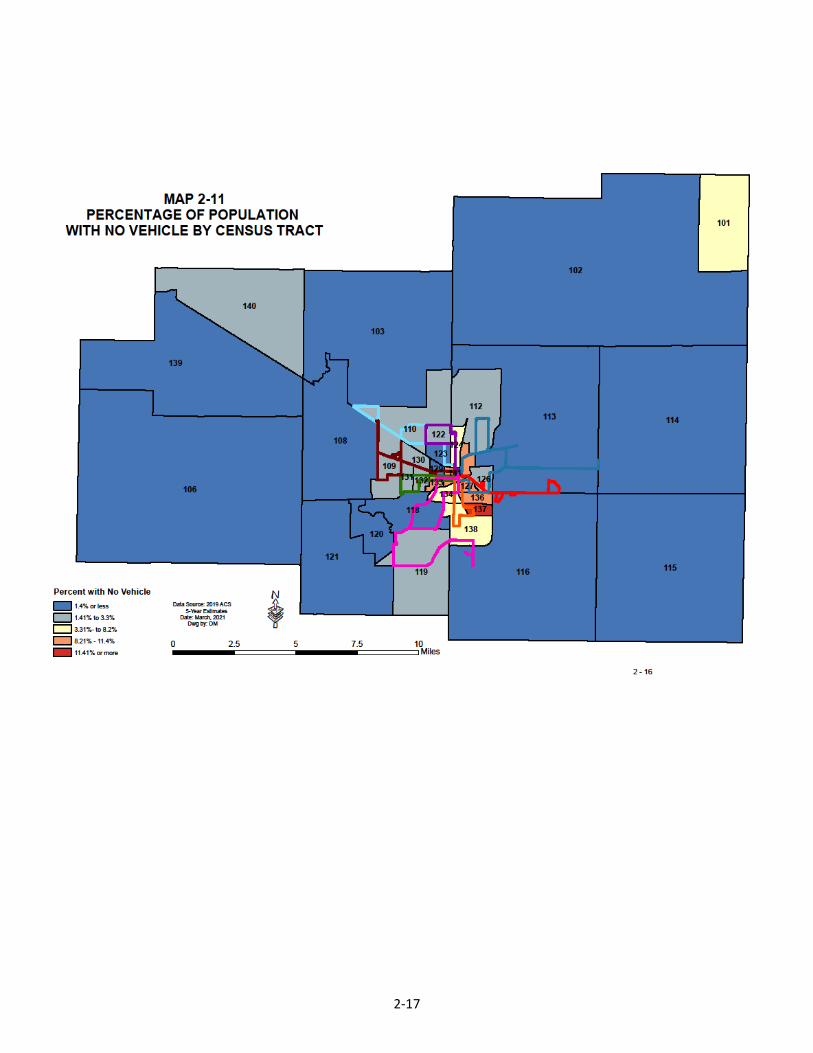
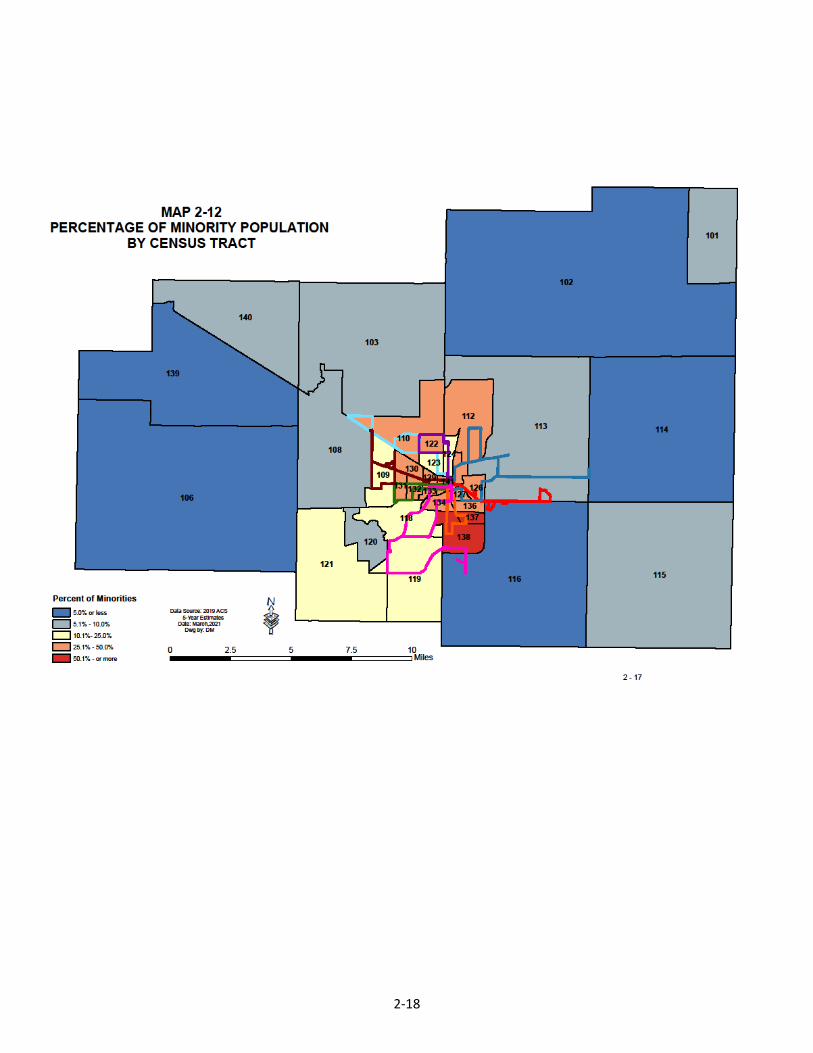
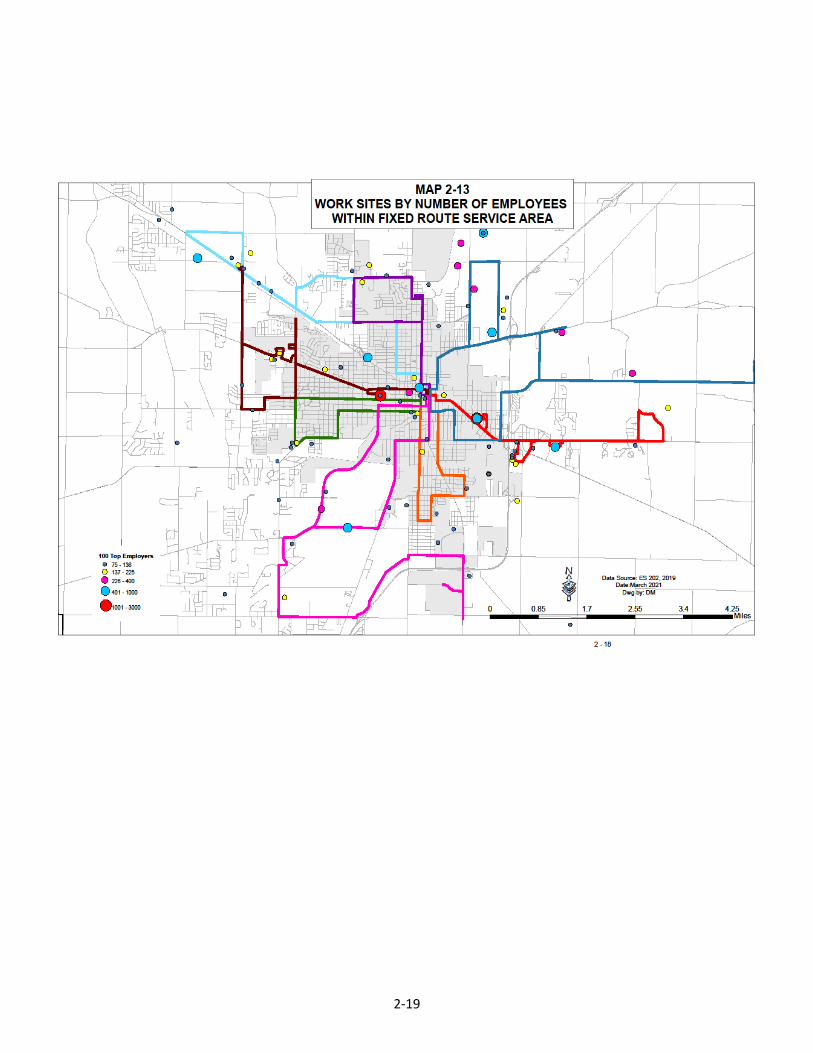
An assessment of the area's transit services and system potential demand depends on various income and household characteristics. Table 4 presents key socio-demographic characteristics as documented in 2000 at the tract level census data. Map 2-7 documents the parameters of the individual census tracts within the Lima Urbanized Area. In an attempt to use socio-demographic variables as barometers of an area's demand for service, Maps 2-8 through 2-12 depict the present transit service area's sociodemographic character. Map 2-13 examines local employers by size of their work force and their location within the service area.
2-6
The geographic distribution of the populations most likely to use transit services can be spatially depicted by census tract. The highest concentration of the elderly, portrayed on Map 2-8, are located in tracts 109, 113, 116, 118, 119, 120, 123,130, and 131, with significant concentrations in 116,130, and 131. Map 2- 9 suggests that census tracts 125, 127, 128, 133, 134, 136, 137, and 138 have the highest proportion of persons below the poverty level, with significant amounts also found in 103, 110, 122, 123, 124, 126, 129, and 130. Map 2-10 suggests that tracts 112, 118, 119, 122, 125, 126, 127, 128, 130, 131, 133, 134, 137, and 138 have a higher-than-average ratio of persons suffering from mobility disabilities. While, tracts 112, 125, 129, and 138, identified in Map 2- 11, had the highest proportion of households with no vehicle available, with significant numbers in 122, 124, and 131. Map 2-12 suggests that tracts 103, 110, 112, 122, 124, 125, 127, 128, 129, 130, 132, 133, 134, 136, 137, and 138 have the highest percentage of minorities. In addition, with respect to the major employers discussed in Section 2.4, Map 2-13 identifies tracts 109, 110, 112, 126, 128, 129, and 133 as having the highest number of employees.

2-7
2-8
2-9

2-10
2-11
2-12

2-13

2-14
2-15
2-16
2-17
2-18
2-19
2-20
There are also correlations, which can be seen throughout the maps, between the census tracts discussed above. Several demographic characteristics discussed are prevalent throughout tracts 122, 125, 127, 128, 129, 130, 131, 134, 137, and 138. These tracts indicate the highest propensity to use and/or need public transportation, provided that the system services these areas.
Map 2-14, a compilation of data from the previous maps, suggests the degree of demand for public transit based on a graduated scale. While tracts 122, 125, 130, and 138 are presumed to have the highest level of need for public transit, tracts 127, 128, 129, 131, 133, 134, and 137 also suggest a strong demand for such services. Examination reveals that all of these tracts are located within the ACRTA's present service. Map 2-14 clearly demonstrates that the ACRTA fixed route serves those census tracts demonstrating the highest probability of need for public transportation. The Transit Authority’s current fixed route service area, operating between the hours of 6:45 a.m. and 5:15 p.m., challenges transit patrons ability to meet work-related commutes and the needs of major employers for a steady, dependable workforce. In addition to the major employers in the CBD, the ACRTA also serves major retail and service providers located in or near the Lima Mall, as well as Eastgate and Clock Tower shopping centers.
The ACRTA service area refers to the geographic area in which the Transit Authority has agreed, under contract or by policy, to provide public transportation services. The ACRTA’s service area differs by type of service. With respect to fixed route transit operations, coverage is considered to include that area within a one-quarter (1/4) mile radius of each fixed route. The current ACRTA fixed route system service area encompasses 58.67 square miles.
With respect to complementary paratransit, the ACRTA provides curb-to-curb service to individuals residing within three (3) miles of the current fixed route system. ACRTA's Uplift is a complementary paratransit program that serves the mobility challenged within Allen County. Any qualifying individual that is prohibited from using the ACRTA regular fixed route bus service, and who is within Zone 1 or Zone 2, approximately three (3) miles off the fixed route, is eligible for the specialized transportation service. The Uplift service area encompasses 88.77 square miles.
Although ACRTA service is concentrated in the City of Lima, it provides limited service to adjacent political subdivisions of Amanda, American, Bath, Perry, Marion, Shawnee and Spencer townships. The remainder of this chapter will provide a basic history of the ACRTA fixed route system as well as a discussion of operations, ridership, and route changes that has had an impact on that system’s ridership in 2010.
2.6 Summary In summation, both Lima and Allen County continued the trend begun in 1980 of a consistent pattern in the loss of population. This has not been the overall trend for the outlying area as eight (8) out of ten (10) townships showed either gain or no loss, assumedly at Lima’s expense. Though Lima’s overall population has declined, the percentage of the remaining population that traditionally demonstrates the need for public transportation services (referring to the poor, elderly, frail, and disabled) has in fact increased.
3 - 1
SECTION 3 2020 OPERATIONAL UPDATE
A public transportation system is developed and ultimately charged with the responsibility of providing transportation services to the general public. A public transportation system reflects its employees and those vehicles, facilities and equipment necessary to support the movement of passengers and goods. Public transportation typically employs the use of buses, trolleys, vans and other modes including ferries, light rail and trains. In smaller communities it is more common for public transportation services to utilize fixed route bus services and augment such service with paratransit services using specially equipped vehicles to accommodate the mobility limited. Public transportation services are regulated by federal and state standards. Their main sources of financing are fare revenues, governmental subsidies, income or property taxes, and advertisements.
Today, public transit systems, like all public entities, are being subjected to ever-increasing scrutiny due to public concerns over increased taxation as well as budget shortfalls at all levels of government. Public transit authorities exist primarily to support the overall mission of providing public transportation in the most efficient and effective means possible. Efficiency indicates the extent to which the Agency produces a given output with the least possible use of resources. Effectiveness has been defined as the comparison of service provided to intended output or objectives. That is, measures of effectiveness are concerned with the extent to which the service is provided – in terms of quantity, location, and character – and corresponds to the goals and objectives established for the transit system by the Transit Authority and the needs of local residents.
This update will provide an overview of transit system services within Allen County in 2020 in an attempt to provide the means to assess the transit system’s efficiency and effectiveness. In November of 2017, the ACRTA ran a levy on the ballot to request local sales tax funding for the transit system. When the levy failed the Transit Authority began to cut services to help control cost, also to control cost no survey of passengers was performed in CY 2017, CY 2018, CY 19 or CY 20 so no comparison of ridership demographics is integrated herein. The ACRTA again ran a levy in May of 2019 which passed, but no funding from the levy became available until 2020.
3.1 Management Structure & Operating Personnel
In CY 2020 the ACRTA reflected a seven (7) member Board of Trustees with an Operations Director, an Administrative & Capital Director, a Finance Manager, a Maintenance Manager, two Transportation Managers, one (1) Shift Leader, two (2) mechanics, one (1) service technician, one (1) fueler/washer, one (1) maintenance clerk, three (3) dispatch operators, and twenty-four (24) transit operators (16 full-time, 8 part-time). In all, there were thirty-nine (39) employees under the supervision of the Board and the Directors, see Illustration 1. ACRTA also contracted for a financial person. The Operations Director and Admirative & Capital Director served as interim executive directors in CY 2020. The ACRTA Organizational Chart is included in this document as Addendum A.
3.2 Bus Facilities According to 49 USCS § 5309 [Title 49. Transportation; Subtitle III. General and Intermodal Programs; Chapter 53. Public Transportation], Buses and Bus Facilities include buses for fleet and service expansion, bus maintenance and administrative facilities, transfer facilities, bus malls, transportation centers, intermodal terminals, park-and-ride stations, acquisition of replacement vehicles, bus preventive maintenance, passenger amenities such as passenger shelters and bus stop signs, accessory and miscellaneous equipment such as mobile radio units, supervisory vehicles, fare boxes,

3 - 2
computers and shop and garage equipment. Following federal procurement policies, the ACRTA has developed a diverse set of resources to manage and support its fixed route and complimentary paratransit services both to expand its services as well as to support local coordination efforts with area non-profit and social service agencies engaged in demand response paratransit services.
3.2.1 Transit Properties Prior to 1998 the ACRTA operated from a combined garage, maintenance, management, and passenger transfer facility located at 240 N. Central Avenue on the northwestern edge of the Lima CBD. The site was problematic because it lacked several significant site elements including adequate parking facilities and appropriate access and egress points. In addition to these shortcomings, the facility, which provided shelter and transfer activities, proved precarious due to the on-site vehicular and pedestrian circulation patterns. In the May 1992 study conducted by ATE Management & Service Company, Inc., the passenger transfer center located in the transit facility yard, was cited as problematic for passenger safety. Therefore, funding for a new transfer facility was sought. The ACRTA eventually secured a site at the corner of High and Union Streets in the Lima CBD and constructed a multimodal transfer facility in 1998. Passengers of both Greyhound and Barron's Bus are currently serviced at the facility. The facility, approximately 2,880 square feet, houses agency dispatchers, provides a small break area and comfort station for drivers, incorporates Greyhound Services & Sales, and provides nearly 1,000 square feet for passengers/luggage.
The Transit Authority retains the original site at 240 N. Central Avenue as its maintenance facility. The maintenance garage is approximately 17,250 square feet and provides shelter and storage for maintenance personnel and vehicles as well as necessary replacement parts and maintenance equipment. The site also serves as a bulk fuel distribution center; both maintenance and fueling functions are coordinated with area social service and non-profit paratransit providers. The site which housed the Agency’s original administrative offices (built circa 1860) was reconfigured in 2009 to support increased vehicle parking/storage.
Construction of a new administrative office building located immediately adjacent to the Transfer Facility began in CY 2002 and was completed in 2003. The 8,200 square feet facility supports transit management and operations allowing ACRTA managers to monitor and accommodate passengers and operational personnel, thereby increasing efficiency. The Transit Authority also rents space to area non-profits and local government services.
The current maintenance facility serves multiple functions at a very busy intersection. The facility supports the parking, storage, maintenance, fueling, etc., for not only the Transit Authority vehicles but also those of area social service agencies. Due to the limited size of the facility, as well as the mix and sizes of the various vehicles, and the number of different agency drivers at the site congestion and safety concerns have risen. The Allen County RTA plans to do additional improvements to the existing maintenance facility to provide shelter for vehicles to protect from the weather and also free up some of the land that currently houses extra garage facilities to free up some of the congestion and also improve the safety concerns.
3.2.2 Transit Vehicles

3 - 3
The ACRTA owns thirteen (13) fixed route buses, twenty-one (21) paratransit vehicles, and four (4) service vehicles. With respect to mass transit vehicles, the fleet reflects: two, (2) 2009 Gillig Buses, two (2) 2013 Gillig, two (2) 2014 Gillig Buses, one (1) 2016 Gillig bus, one (1) 2017 Gillig bus, two (2) 2018 Gillig buses and three (3) 2019 Gillig buses. There are also three (3) 2012 Tesco LTVs, two (2) 2013 Eldorado, one (1) 2015 Tesco van, six (6) 2016 Champion vans. two (2) 2016 Tesco MV1 vans, two (2) 2018 Ford E3FC vans and four (4) 2019 Ford Econoline. The entire transit fleet is accessible by wheelchair.
The seating capacity of the thirteen (13) buses currently within the fleet range from twenty-five (25) to thirty-three (33) seats per vehicle. Currently there are no thirty-five-foot buses beyond their useful life. The mean age of the buses within the fleet is 5.5 years. The bus fleet's mean number of vehicle miles based on December 31, 2020 mileage figures was 146,430 miles. The mean mileage of the paratransit vans is 50,724, with a mean age of 3 years. Table 1 reveals pertinent information pertaining to the service fleet.
All of the Gillig buses have the capability to "kneel", which in effect lowers the height of the bus at the entrance, enabling easier boarding and disembarking for passengers. This accessibility feature is considered essential given the physical limitations of many ACRTA passengers. Service vehicles are not used to transport passengers.
The ease of entry into the paratransit vehicles has also been of interest to the ACRTA. As a result, the agency has required transit-style entry doors on all vehicles in order to provide direct entry. Although this does negatively impact the available seating capacity of the vehicles by effectively eliminating a front passenger seat, the safety and comfort of passenger access and/or egress is seen to more than offset any need for additional capacity.
TABLE 3-1 ACRTA SERVICE FLEET
DECEMBER 31, 2020
Make/Model Quantity Total
Seating Wheelchair
Accessible Seating Mileage
2009 Gilig Bus 35’ 2 34 4 314,299 305,513
2013 Gilig Bus 35’ 2 30 2 266,290 237,349
2014 Gilig Bus 35’ 1 33 4 206,135
2014 Gilig Bus 30’ 1 25 2 176,980
2016 Gilig Bus 29’ 1 23 2 141,054
2017 Gilig Bus 35’ 1 30 2 148,989
2018 Gilig Bus 35’ 2 30 2 106,962 99,404
2019 Gillig Bus 35” 3 29 3 48,995 52,031 53,027
2012 Tesco LTV 25’ 3 16 18
4 131,702 107,736 124,752
2013 Eldorado Bus 35’ 2 30 3 53,320 61,217
3 - 4
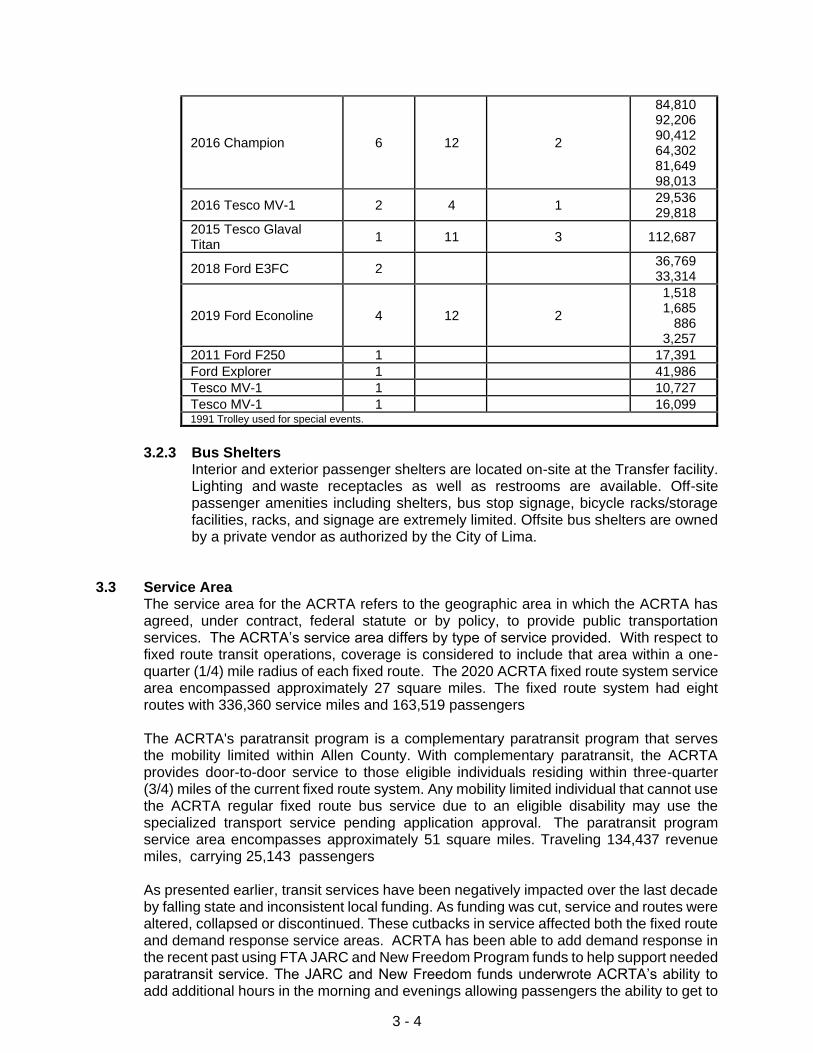
2016 Champion 6 12 2
84,810 92,206 90,412 64,302 81,649 98,013
2016 Tesco MV-1 2 4 1 29,536 29,818
2015 Tesco Glaval Titan
1 11 3 112,687
2018 Ford E3FC 2 36,769 33,314
2019 Ford Econoline 4 12 2
1,518 1,685
886 3,257
2011 Ford F250 1 17,391
Ford Explorer 1 41,986
Tesco MV-1 1 10,727
Tesco MV-1 1 16,099 1991 Trolley used for special events.
3.2.3 Bus Shelters Interior and exterior passenger shelters are located on-site at the Transfer facility. Lighting and waste receptacles as well as restrooms are available. Off-site passenger amenities including shelters, bus stop signage, bicycle racks/storage facilities, racks, and signage are extremely limited. Offsite bus shelters are owned by a private vendor as authorized by the City of Lima.
3.3 Service Area The service area for the ACRTA refers to the geographic area in which the ACRTA has agreed, under contract, federal statute or by policy, to provide public transportation services. The ACRTA’s service area differs by type of service provided. With respect to fixed route transit operations, coverage is considered to include that area within a one-quarter (1/4) mile radius of each fixed route. The 2020 ACRTA fixed route system service area encompassed approximately 27 square miles. The fixed route system had eight routes with 336,360 service miles and 163,519 passengers
The ACRTA's paratransit program is a complementary paratransit program that serves the mobility limited within Allen County. With complementary paratransit, the ACRTA provides door-to-door service to those eligible individuals residing within three-quarter (3/4) miles of the current fixed route system. Any mobility limited individual that cannot use the ACRTA regular fixed route bus service due to an eligible disability may use the specialized transport service pending application approval. The paratransit program service area encompasses approximately 51 square miles. Traveling 134,437 revenue miles, carrying 25,143 passengers
As presented earlier, transit services have been negatively impacted over the last decade by falling state and inconsistent local funding. As funding was cut, service and routes were altered, collapsed or discontinued. These cutbacks in service affected both the fixed route and demand response service areas. ACRTA has been able to add demand response in the recent past using FTA JARC and New Freedom Program funds to help support needed paratransit service. The JARC and New Freedom funds underwrote ACRTA’s ability to add additional hours in the morning and evenings allowing passengers the ability to get to
3 - 5
and from work. In 2017 JARC and New Freedom funds ended and several of the ACRTAs routes had to be cut in 2019. The ACRTA also had to cut Saturday and some evening services in 2019. In May of 2019 a levy of one tenth of a percent was passed. In CY 2020 ACRTA was able to add Saturday routes back into the schedule.
3.4 Fare Structure The cost of providing transit service to Allen County residents has risen steadily over the last 40 years. Costs have risen to such an extent as to be prohibitive to the continued private sector participation in transit within Allen County. In fact, a report released in 1976 by the ATE Management & Service Company, Inc., stated: "It has become clear that transit service within Allen County is no longer a profit-making enterprise and if transit service is to continue to operate at all it must be supported by a public subsidy".1
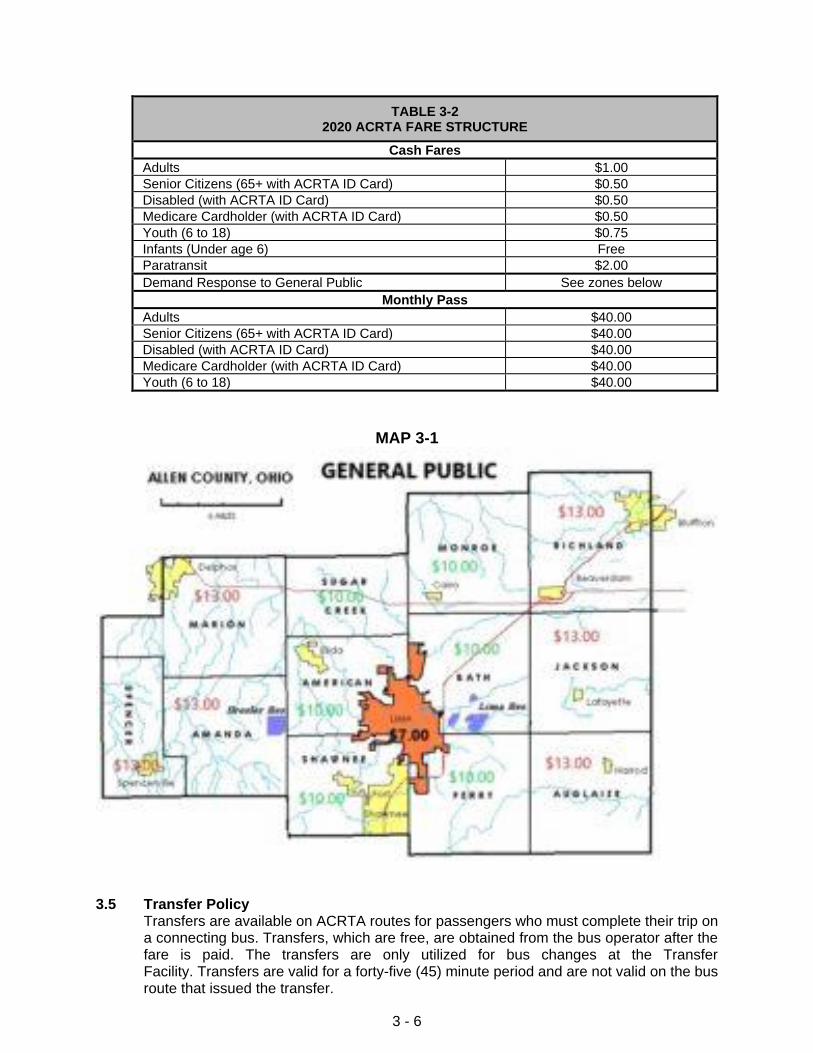
Fares refer to the payment or fee required for passage on a public transit vehicle. Passage can be purchased in various manners, including cash, pre-paid tickets, or pass. In CY 2020, the basic fare for an adult passenger utilizing the fixed route service was $1.00. Discounted fares in CY 2020 of $0.50 were made available to senior citizens and individuals with disabilities through subsidies provided by the FTA and ODOT. Other passes include an unlimited monthly pass for $40.00. The higher fares required for complementary paratransit services provided by the paratransit program reflect the higher level of service. The FY 2020 ACRTA fares are cited in Table 3-2. ACRTA also has a demand service for the general public with those prices stated in Map 3-1
1Allen County Regional Transit Authority Transit Development Program, ATE Management & Service Company, Inc., Cincinnati, Ohio; June 1976.
3 - 6
TABLE 3-2 2020 ACRTA FARE STRUCTURE
Cash Fares
Adults $1.00
Senior Citizens (65+ with ACRTA ID Card) $0.50
Disabled (with ACRTA ID Card) $0.50
Medicare Cardholder (with ACRTA ID Card) $0.50
Youth (6 to 18) $0.75
Infants (Under age 6) Free
Paratransit $2.00
Demand Response to General Public See zones below
Monthly Pass
Adults $40.00
Senior Citizens (65+ with ACRTA ID Card) $40.00
Disabled (with ACRTA ID Card) $40.00
Medicare Cardholder (with ACRTA ID Card) $40.00
Youth (6 to 18) $40.00
MAP 3-1
3.5 Transfer Policy Transfers are available on ACRTA routes for passengers who must complete their trip on a connecting bus. Transfers, which are free, are obtained from the bus operator after the fare is paid. The transfers are only utilized for bus changes at the Transfer Facility. Transfers are valid for a forty-five (45) minute period and are not valid on the bus route that issued the transfer.

3 - 7
The ACRTA recognizes that operational efficiency can be addressed on a number of fronts including: (1) operations planning; (2) service improvements; and, (3) the coordination of services. Operations planning is responsible for efficiently tailoring the supply of transit service between that which is requested or anticipated and the actual demand and available resources. Service improvements are developed to improve performance and satisfy not only local demands for service, but also the manner in which such demands are met. The coordination of services refers to the various arrangements between or amongst those organizations providing transportation services or functions in order to improve the efficiency and effect.
3.6 Operational Planning Operational planning can be divided between maximizing both service effectiveness and service efficiency. Planning analysis requires assessments at the system, route and sub-route levels. The process needs to be sensitive and respond to service indicators and specific productivity standards developed as part of an evaluation network. Such a network defines data collection requirements and guides the analysis of service including such factors as hours of operation, service areas, route locations, travel times and measures of route/trip performance.
System level analysis determines how well the system is performing as a whole. A common diagnostic tool used to assess transit systems is a trend line analysis. A trend line analysis consists of a year-to-year examination of indicators for a single system, analyzing how a transit system has been performing over time. The statistical measures are cumulative and show average annual changes in performance.
Statistics such as passengers-per-hour (PPH) and passengers-per-mile (PPM) measure service effectiveness. ACRTA has had a goal of 1 passenger per mile on the fixed routes system which has been met only 8 out of the last 20 years. The cost per mile is based on actual operating expenses less fuel sold, and GASB entries. In CY 2020 COVID added additional cost and fewer passengers to the fixed route system.
TABLE 3-3 COMPARISON OF SERVICE EFFECTIVENESS – PERFORMANCE MEASURES
Year
Fixed Demand
PPM Cost per
Mile PPH
Cost per Hour
PPM Cost per
Mile PPH
Cost per Hour
2001 0.96 3.30 12.22 42.26 0.14 2.79 1.59 31.53
2002 1.06 3.79 13.00 46.64 0.14 2.59 1.58 28.61
2003 0.91 5.90 11.38 67.26 0.17 15.24 1.58 25.50
2004 0.91 6.69 11.71 78.43 0.17 12.08 1.68 20.32
2005 0.96 5.27 11.85 62.56 0.21 19.58 2.96 58.11
2006 1.08 5.94 13.36 73.28 0.21 5.19 2.99 73.25
2007 1.14 5.43 14.13 67.27 0.24 6.52 3.20 87.09
2008 1.18 7.08 15.19 91.04 0.22 7.55 2.97 78.74
2009 1.08 5.99 14.40 99.16 0.25 6.19 3.11 75.35
2010 1.03 5.83 13.76 78.25 0.26 6.29 3.09 74.23
2011 1.01 6.42 13.52 85.82 0.32 7.09 3.91 86.63
2012 0.97 5.43 11.88 66.41 0.56 6.99 6.99 108.40
2013 1.01 5.41 12.30 65.95 0.32 5.11 5.11 64.54
2014 0.94 9.45 11.00 110.47 0.21 3.09 2.57 48.02
2015 0.74 7.01 10.85 102.27 0.16 3.27 1.93 38.05
2016 0.83 5.91 11.57 80.45 0.13 1.80 1.89 25.10
2017 0.88 6.72 10.71 91.43 0.14 1.37 2.22 20.77

3 - 8
2018 0.91 5.39 10.72 63.91 0.19 5.19 3.86 109.97
2019 0.91 5.11 12.64 70.96 0.25 5.60 2.92 88.06
2020 0.49 5.62 9.73 74.27 0.19 6.79 3.23 117.59
3.6.1 Service Improvements Service improvements are strategic responses to routes or service areas identified during the network analysis as inefficient or unproductive with respect to either system goals or public demands for service. Service improvements are developed to improve performance and satisfy not only local demands for service but also the manner in which such demands can be met given the limited resources available to the ACRTA. Service improvements alter the delivery of service. Such improvements range from balancing services with the level of demand, to schedule adjustments, to reviewing route alignments. Increasing access in certain service sectors of the system are also service improvements as are attempts at improving ridesharing and demand response services.
TABLE 3-4 COMPARISON OF SERVICE EFFECTIVENESS – RECOVERY RATIOS
Year
Fixed Demand
Recovery Ratio
Operating Expense
Recovery Ratio
Operating Expense
2001 13.00% $845,603 7.00% $27,088
2002 16.70% $704,897 14.10% $54,674
2003 14.00% $1,026,613 17.90% $199,314
2004 9.50% $1,189,426 2.50% $177,133
2005 14.72% $744,936 11.48% $253,698
2006 11.70% $1,107,142 6.50% $393,757
2007 13.29% $782,338 12.37% $383,651
2008 11.00% $998,713 14.10% $445,136
2009 13.97% $999,365 16.96% $308,492
2010 17.80% $1,082,979 22.74% $319,806
2011 16.46% $1,251,359 55.28% $457,492
2012 10.70% $1,561,575 58.96% $1,255,437
2013 10.00% $1,216,185 49.90% $1,113,968
2014 15.25% $2,294,125 49.68% $724,126
2015 14.11% $2,970,269 47.54% $776,562
2016 12.67% $2,433,039 62.64% $776,562
2017 12.77% $2,331,703 51.27% $999,302
2018 8.91% $1,107,232 54.33% $1,254,672
2019 13.30% $1,175,286 39.06% $1,300,407
2020 6.94% $1,891,090 28.97% $912,970
No Depreciation accounted for.
3.6.2 Coordination of Services Coordination of services between and amongst local transit and paratransit providers is a difficult process and requires open and honest communications. The coordination of services is one area in which the ACRTA has sought to make in-roads with its local partners, not only to improve its own internal performance measures, but also to improve social services, overall mobility within the community and to reduce costs for all concerned. The ACRTA believes that the coordination of services can achieve certain economies of scale, not available to smaller service providers, which can result in significantly higher levels of service

3 - 9
for both customers and service providers. The ACRTA believes that coordination would further: (1) increased efficiency; (2) improved vehicle life and reliability; and, (3) reduced operating costs per unit of service. At the current time ACRTAcoordinates with agencies to provide service to and from work and school.
3.7 Funding, Revenues & Expenses The ACRTA has used a wide variety of sources to fund transit services within Allen County. The ACRTA has utilized federal and state, as well as local monies, especially City monies, in its efforts to finance those capital acquisitions and support the operation of transit services. In 2018 the ACRTA went out for a levy to match federal and state funding. The levy failed. In 2019 ACRTA again sought a levy and in May of 2019 the levy passed. Transit operations are heavily dependent upon federal and state subsidies, changes at the federal and/or state levels have had significant impacts on local service over the years, but the addition of levy funds should help stabilize the system.
In 2020, along with the aforementioned local, federal and state monies, total operational funds also include those funds generated by fares for service, vending machine sales, lottery ticket sales, the sale of advertising (bus signage, route schedules, interior bus signage), demand response to the Allen County Board of Developmental Disabilities, Jobs and Family Services and the provision of special services to area non-profits (maintenance service, fuel sales contracts to area paratransit operators and the leasing of storage space for paratransit vehicles), Greyhound operations, as well as miscellaneous donations and contributions. Local monies are used to match state and federal funds as required in the grant allocation process.
Federal and state monies, available through the FTA/ODOT and MPO/CMAQ, will continue to be utilized in the acquisition of capital items such as transit vehicles as needed. ACRTA passed a Capital 2020-2024 plan in 2020 which is included in this document as Addendum B. State monies have been successfully employed to subsidize the transportation services provided to the elderly and disabled. In 2020 ACRTA received an additional four and one half million of CARES funding for operational expenses to offset the cost of COVID-19. The additional funds were used for operational cost for personal PPEs, additional cleaning of the buses/ buildings, and to help set-up for social distancing measures. The funds also helped cover other operational cost during the pandemic.
Table 3-5 reveals the actual operating revenues and expenses of the ACRTA for CY 2020. Capital expenses are not accounted for in this table. The sales tax is local funding and consist of almost forty percent of ACRTA total revenues. The levy for the sales tax was passed in May of 2019 for one tenth of one percent. Federal funds are still the major funding source at forty-six percent of all revenue.

3 - 10
TABLE 3-5 ACRTA ACTUAL REVENUE EXPENSES – ENDED DECEMBER 31, 2020
BY FTA CLASS
Operating Expense Revenues
Vehicle Operations 1,751,594.19 60.6% Fares 395,831.23 8.3%
Vehicle Maintenance 503,537.80 17.4% Other Revenues 347,867.15 7.3%
Facility Maintenance 164,715.97 5.7% Sales Tax 1,626,546.92 33.9%
Administration 384,212.26 13.3% State 218,180.00 4.5%
Planning 37,694.54 1.3% Federal 2,206,777.00 46.0%
Non FTA Items 48,584.49 1.7% Total 4,795,202.30 100%
Depreciation 901,966.83 N/A
Total 3,792,306.08 100%
TABLE 3-6
REVENUE PROJECTIONS 2020-2024
Revenues 2019 2020 2021 2022 2023 2024
Passenger Fares 156,349
135,658 141,978 159,818
163,014 166,274
Organization Fares 508,011
266,775 271,950 337,389
344,137 351,020
Other Revenue 342,160
241,997 232,270 238,026
242,787 247,643
Sales Tax Funds 455,020
1,599,082.00 1,562,188 1,600,000
1,700,000 1,750,000
Local Funds 121,721
State Funds 468,736 278,593 150,000 153,000 156,060 159,181
Federal Funds 1,498,330 1,079,379 563,849 528,000 1,200,000 1,200,000
CARES 1,005,597 1,740,000 1,739,231
Total 3,550,327 4,607,081 4,662,235 4,755,464 3,805,998 3,874,118
TABLE 3-7 EXPENSE PROJECTIONS 2021-2024
Expenses 2021 2022 2023 2024
Labor & Fringes 2,245,291 2,290,197 2,336,000 2,382,720
Services 451,098 460,120 469,322 478,709
Materials & Supplies 561,700 572,934 584,393 596,081
Casualty & Liability Ins. 130,000 132,600 135,252 137,957
Utilities 47,688 48,642 49,615 50,607
Taxes 29,900 30,498 31,108 31,730
Miscellaneous 112,600 114,852 117,149 119,492
Depreciation 893,506 911,376 929,604 948,196
Contingency-New Service 180,000 180,000
Total Expenses 4,651,783 4,741,219 4,652,443 4,745,492
3 - 11
ACRTA began Saturday and night service again in 2020 as the levy funds became available. At the end of 2020 all of their Saturday and evening services that had been discontinued in 2018 and 2019 were reestablished. Table 3-7 shows funding for additional new routes in 2021 and 2022. The first areas being considered for new routes are the City of Delphos and the Village of Bluffton.
4-1
SECTION 4 TRANSIT DEVELOPMENT PROGRAM
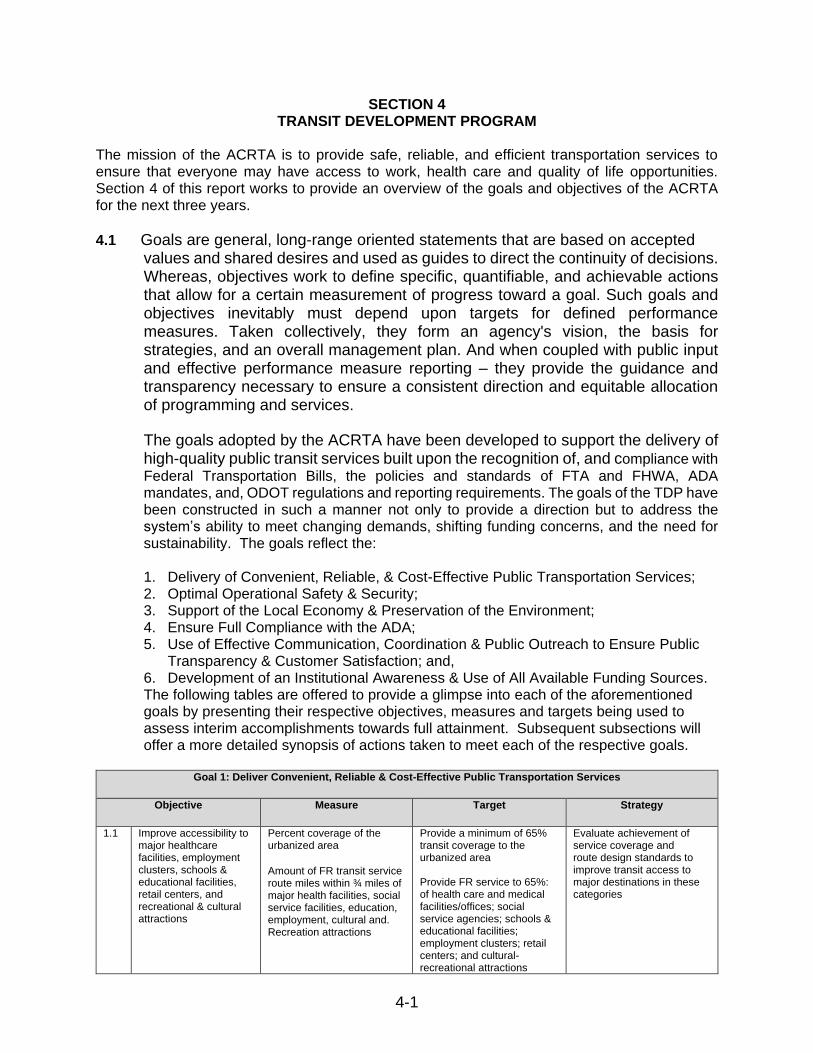
The mission of the ACRTA is to provide safe, reliable, and efficient transportation services to ensure that everyone may have access to work, health care and quality of life opportunities. Section 4 of this report works to provide an overview of the goals and objectives of the ACRTA for the next three years.
4.1 Goals are general, long-range oriented statements that are based on accepted
values and shared desires and used as guides to direct the continuity of decisions. Whereas, objectives work to define specific, quantifiable, and achievable actions that allow for a certain measurement of progress toward a goal. Such goals and objectives inevitably must depend upon targets for defined performance measures. Taken collectively, they form an agency's vision, the basis for strategies, and an overall management plan. And when coupled with public input and effective performance measure reporting – they provide the guidance and transparency necessary to ensure a consistent direction and equitable allocation of programming and services.
The goals adopted by the ACRTA have been developed to support the delivery of high-quality public transit services built upon the recognition of, and compliance with Federal Transportation Bills, the policies and standards of FTA and FHWA, ADA mandates, and, ODOT regulations and reporting requirements. The goals of the TDP have been constructed in such a manner not only to provide a direction but to address the system’s ability to meet changing demands, shifting funding concerns, and the need for sustainability. The goals reflect the:
1. Delivery of Convenient, Reliable, & Cost-Effective Public Transportation Services;2. Optimal Operational Safety & Security; 3. Support of the Local Economy & Preservation of the Environment; 4. Ensure Full Compliance with the ADA; 5. Use of Effective Communication, Coordination & Public Outreach to Ensure Public
Transparency & Customer Satisfaction; and, 6. Development of an Institutional Awareness & Use of All Available Funding Sources.The following tables are offered to provide a glimpse into each of the aforementionedgoals by presenting their respective objectives, measures and targets being used toassess interim accomplishments towards full attainment. Subsequent subsections willoffer a more detailed synopsis of actions taken to meet each of the respective goals.
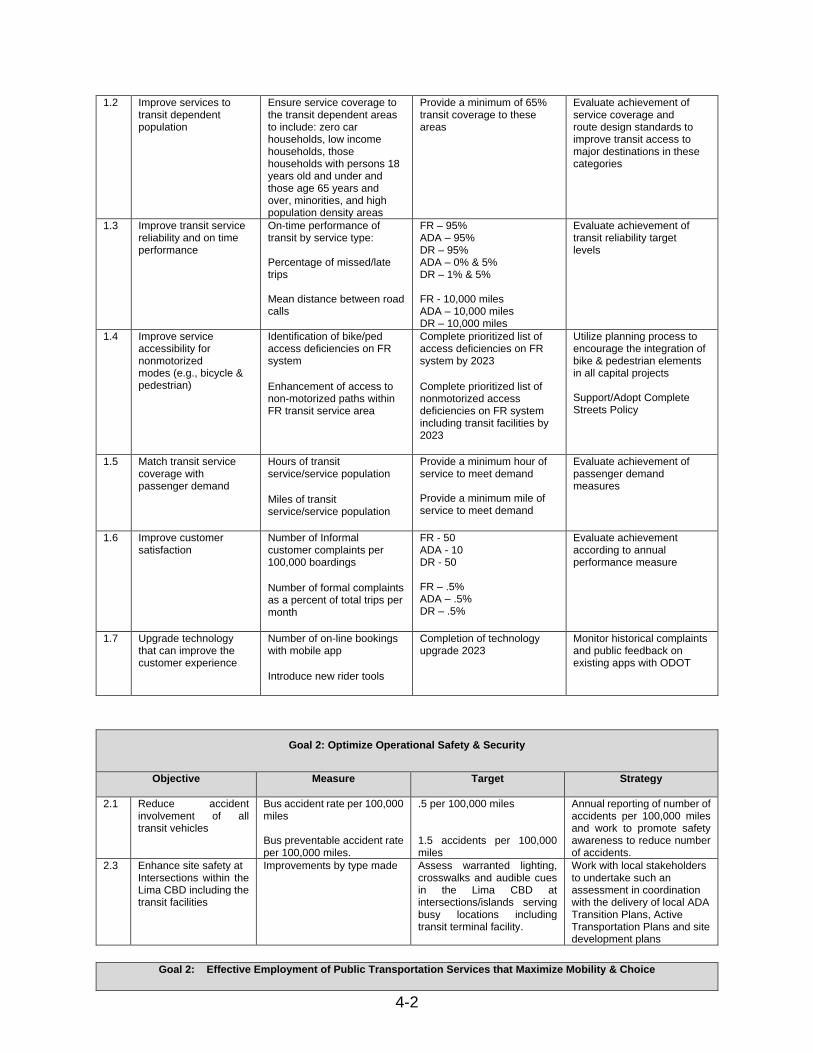
Goal 1: Deliver Convenient, Reliable & Cost-Effective Public Transportation Services
Objective Measure Target Strategy
1.1 Improve accessibility to major healthcare facilities, employment clusters, schools & educational facilities, retail centers, and recreational & cultural attractions
Percent coverage of the urbanized area
Amount of FR transit service route miles within ¾ miles of major health facilities, social service facilities, education, employment, cultural and. Recreation attractions
Provide a minimum of 65% transit coverage to the urbanized area
Provide FR service to 65%: of health care and medical facilities/offices; social service agencies; schools & educational facilities; employment clusters; retail centers; and cultural- recreational attractions
Evaluate achievement of service coverage and route design standards to improve transit access to major destinations in these categories
4-2
1.2 Improve services to transit dependent population
Ensure service coverage to the transit dependent areas to include: zero car households, low income households, those households with persons 18 years old and under and those age 65 years and over, minorities, and high population density areas
Provide a minimum of 65% transit coverage to these areas
Evaluate achievement of service coverage and route design standards to improve transit access to major destinations in these categories
1.3 Improve transit service reliability and on time performance
On-time performance of transit by service type:
Percentage of missed/late trips
Mean distance between road calls
FR – 95% ADA – 95% DR – 95% ADA – 0% & 5% DR – 1% & 5%
FR - 10,000 miles ADA – 10,000 miles DR – 10,000 miles
Evaluate achievement of transit reliability target levels
1.4 Improve service accessibility for nonmotorized modes (e.g., bicycle & pedestrian)
Identification of bike/ped access deficiencies on FR system
Enhancement of access to non-motorized paths within FR transit service area
Complete prioritized list of access deficiencies on FR system by 2023
Complete prioritized list of nonmotorized access deficiencies on FR system including transit facilities by 2023
Utilize planning process to encourage the integration of bike & pedestrian elements in all capital projects
Support/Adopt Complete Streets Policy
1.5 Match transit service coverage with passenger demand
Hours of transit service/service population
Miles of transit service/service population
Provide a minimum hour of service to meet demand Provide a minimum mile of service to meet demand
Evaluate achievement of passenger demand measures
1.6 Improve customer satisfaction
Number of Informal customer complaints per 100,000 boardings
Number of formal complaints as a percent of total trips per month
FR - 50 ADA - 10 DR - 50 FR – .5% ADA – .5% DR – .5%
Evaluate achievement according to annual performance measure
1.7 Upgrade technology that can improve the customer experience
Number of on-line bookings with mobile app
Introduce new rider tools
Completion of technology upgrade 2023
Monitor historical complaints and public feedback on existing apps with ODOT
Goal 2: Optimize Operational Safety & Security
Objective Measure Target Strategy
2.1 Reduce accident involvement of all transit vehicles
Bus accident rate per 100,000 miles
Bus preventable accident rate per 100,000 miles.
.5 per 100,000 miles
1.5 accidents per 100,000 miles
Annual reporting of number of accidents per 100,000 miles and work to promote safety awareness to reduce number of accidents.
2.3 Enhance site safety at Intersections within the Lima CBD including the transit facilities
Improvements by type made Assess warranted lighting, crosswalks and audible cues in the Lima CBD at intersections/islands serving busy locations including transit terminal facility.
Work with local stakeholders to undertake such an assessment in coordination with the delivery of local ADA Transition Plans, Active Transportation Plans and site development plans
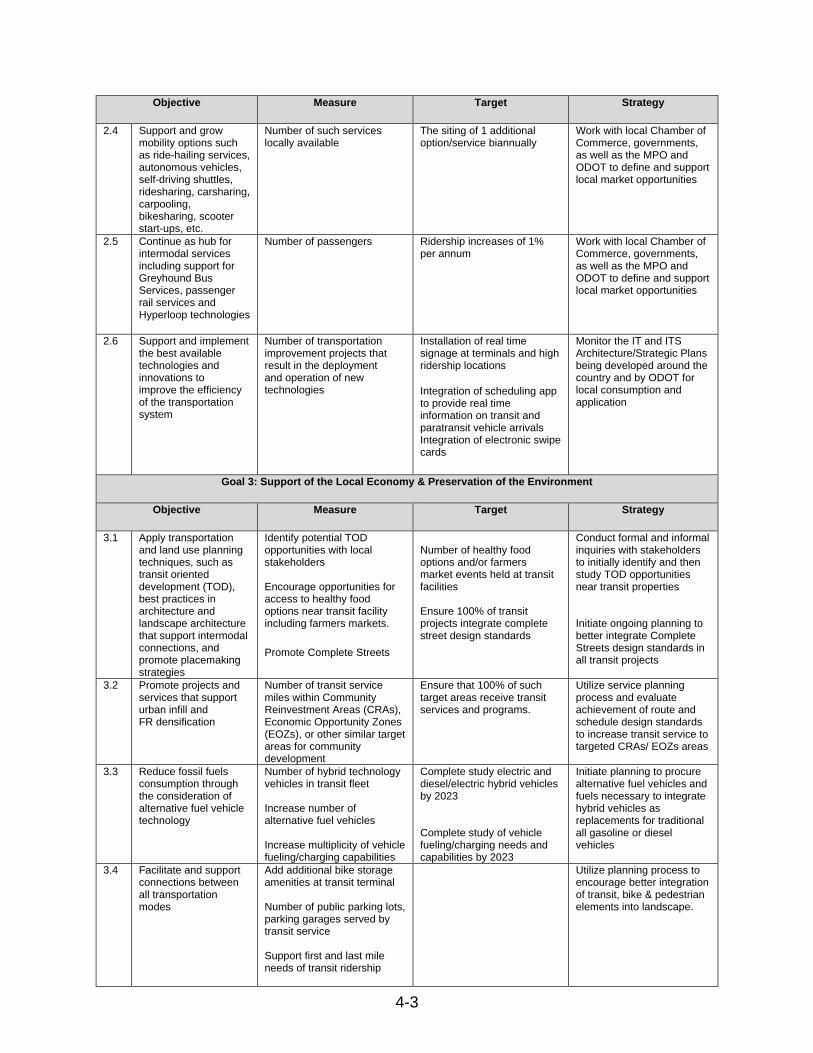
Goal 2: Effective Employment of Public Transportation Services that Maximize Mobility & Choice
4-3
Objective Measure Target Strategy
2.4 Support and grow mobility options such as ride-hailing services, autonomous vehicles, self-driving shuttles, ridesharing, carsharing, carpooling, bikesharing, scooter start-ups, etc.
Number of such services locally available
The siting of 1 additional option/service biannually
Work with local Chamber of Commerce, governments, as well as the MPO and ODOT to define and support local market opportunities
2.5 Continue as hub for intermodal services including support for Greyhound Bus Services, passenger rail services and Hyperloop technologies
Number of passengers Ridership increases of 1% per annum
Work with local Chamber of Commerce, governments, as well as the MPO and ODOT to define and support local market opportunities
2.6 Support and implement the best available technologies and innovations to improve the efficiency of the transportation system
Number of transportation improvement projects that result in the deployment and operation of new technologies
Installation of real time signage at terminals and high ridership locations
Integration of scheduling app to provide real time information on transit and paratransit vehicle arrivals Integration of electronic swipe cards
Monitor the IT and ITS Architecture/Strategic Plans being developed around the country and by ODOT for local consumption and application
Goal 3: Support of the Local Economy & Preservation of the Environment
Objective Measure Target Strategy
3.1 Apply transportation and land use planning techniques, such as transit oriented development (TOD), best practices in architecture and landscape architecture that support intermodal connections, and promote placemaking strategies
Identify potential TOD opportunities with local stakeholders Encourage opportunities for access to healthy food options near transit facility including farmers markets.
Promote Complete Streets
Number of healthy food options and/or farmers market events held at transit facilities Ensure 100% of transit projects integrate complete street design standards
Conduct formal and informal inquiries with stakeholders to initially identify and then study TOD opportunities near transit properties Initiate ongoing planning to better integrate Complete Streets design standards in all transit projects
3.2 Promote projects and services that support urban infill and FR densification
Number of transit service miles within Community Reinvestment Areas (CRAs), Economic Opportunity Zones (EOZs), or other similar target areas for community development
Ensure that 100% of such target areas receive transit services and programs.
Utilize service planning process and evaluate achievement of route and schedule design standards to increase transit service to targeted CRAs/ EOZs areas
3.3 Reduce fossil fuels consumption through the consideration of alternative fuel vehicle technology
Number of hybrid technology vehicles in transit fleet
Increase number of alternative fuel vehicles
Increase multiplicity of vehicle fueling/charging capabilities
Complete study electric and diesel/electric hybrid vehicles by 2023
Complete study of vehicle fueling/charging needs and capabilities by 2023
Initiate planning to procure alternative fuel vehicles and fuels necessary to integrate hybrid vehicles as replacements for traditional all gasoline or diesel vehicles
3.4 Facilitate and support connections between all transportation modes
Add additional bike storage amenities at transit terminal
Number of public parking lots, parking garages served by transit service
Support first and last mile needs of transit ridership
Utilize planning process to encourage better integration of transit, bike & pedestrian elements into landscape.

4-4
Goal 4: Ensure Full Compliance with the ADA Mandates
Objective Measure Target Strategy
4.1 Maintain a transit fleet that is 100% wheelchair accessible with working lifts and/or level boarding and working securement devices
Complete daily pre-trip inspections (including wheelchair/ramp/tie down inspection)
Adherence to preventative maintenance program (including inspections of wheelchair/ramp/tiedowns)
100% adherence
90% adherence
Inspections to identify any operational issues with wheelchair lifts or securement devices
4.2 Upgrade areas within quarter (¼) mile of the FR system to ensure that these areas are 100% wheelchair accessible
Completion of ADA Pedestrian Improvement Plan
Completion of ADA Plan by 2023
Work with local governments, businesses and home owners regarding the construction of sidewalks, ramps and crosswalks to improve mobility and ADA accessibility within a ¼ mile of the FR system
4.3 Continue and promote travel training program to teach passengers with disabilities how to use FR service
Train staff, develop promotion and implement training
Ensure that 3 transit staff persons are trained and promotional materials are developed and updated continuously.
Post some training materials to the website.
Assess training process and assistance provided to disabled during their transition to FR service
4.4 Meet ADA Service Requirements
Document restrictions based upon: number of trips, trip purposes, service area, service hours & days, eligibility, scheduling, fares, &capacity constraints
Full Compliance Ongoing monitoring and testing must be undertaken by the Transit Authority
4.5 Support improved wayfinding system
Ensure that audible and visual information is clear and consistent throughout the transit system
Assessment to be completed by 2022
Utilize stakeholders and MPO planning process to facilitate pedestrian wayfinding system.

4-5
Goal 5: Use of Effective Communication, Coordination & Public Outreach to Ensure Public Transparency & Customer Satisfaction
Objective Measure Target Strategy
5.1 Enhance outreach opportunities to educate the community on transportation issues and highlight transit service benefits such as service reliability, passenger cost savings, and environmental benefits.
Number of community stakeholder outreach events held to address each issue
Number of social media endorsements
Number of transit dependent outreach events per year
Conduct a minimum of 2 public outreach events for community stakeholder per year
Monitor number of social media endorsements
Conduct a minimum of 2 public outreach events for transit dependent population per year
Maintain coordination with county and municipal planning staffs as well as elected officials
Market outreach efforts with civic organizations, employers and other community stakeholders
5.2 Support coordination efforts between local transportation service providers to increase cost effectiveness and ensure more service is available to the transportationally disadvantaged
Number of trips coordinated by Mobility Manager
Fully allocated costs and reimbursements of passenger trips provided
Fully allocated costs per mile of trips provided
Transportation coordination activities supported
Monitor number of passenger trips provided
Monitor costs of passenger trips provided
Monitor costs per mile of passenger trips provided
Monitor and maintain regional coordination activities facilitated by ODOT and Regional Mobility Manager
4-6
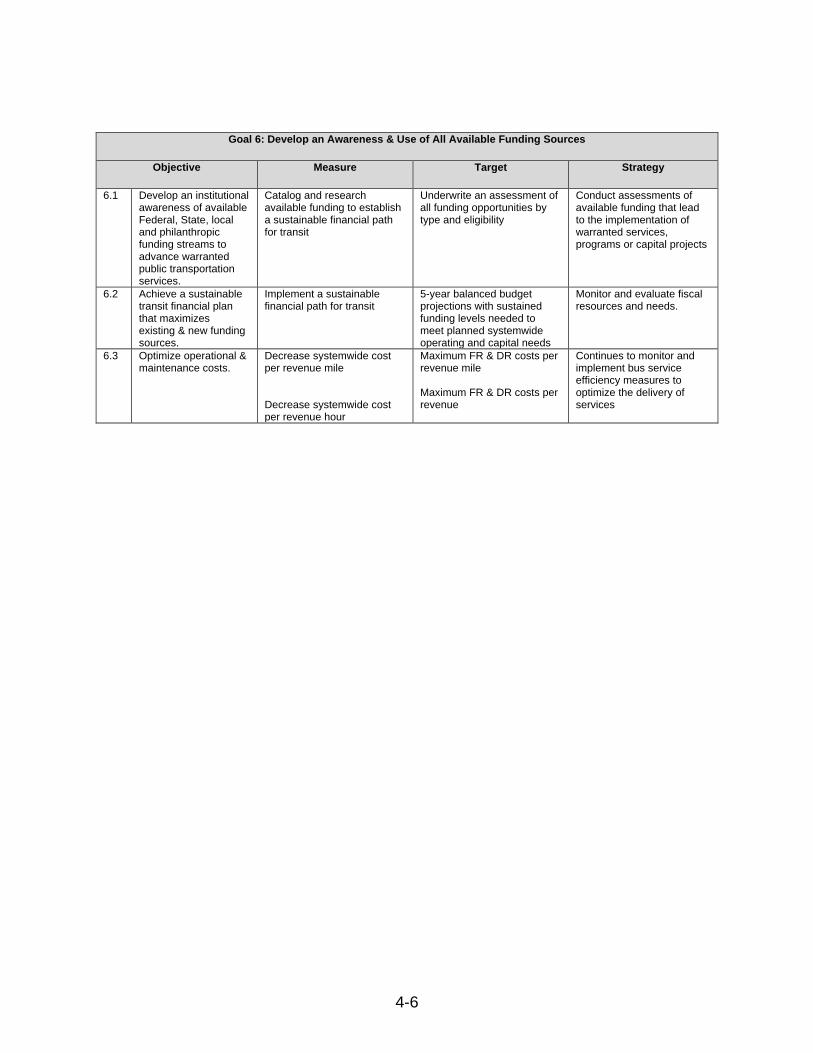
Goal 6: Develop an Awareness & Use of All Available Funding Sources
Objective Measure Target Strategy
6.1 Develop an institutional awareness of available Federal, State, local and philanthropic funding streams to advance warranted public transportation services.
Catalog and research available funding to establish a sustainable financial path for transit
Underwrite an assessment of all funding opportunities by type and eligibility
Conduct assessments of available funding that lead to the implementation of warranted services, programs or capital projects
6.2 Achieve a sustainable transit financial plan that maximizes existing & new funding sources.
Implement a sustainable financial path for transit
5-year balanced budgetprojections with sustainedfunding levels needed tomeet planned systemwideoperating and capital needs
Monitor and evaluate fiscal resources and needs.
6.3 Optimize operational & maintenance costs.
Decrease systemwide cost per revenue mile
Decrease systemwide cost per revenue hour
Maximum FR & DR costs per revenue mile
Maximum FR & DR costs per revenue
Continues to monitor and implement bus service efficiency measures to optimize the delivery of services

Board of Trustees
Executive Director
Operations Director Administration & Capital Director
Finance Manager Office Manager
Transportation Managers Maintenance Manager
Dispatchers
Bus Drivers
Mechanics/Technicians
Parts Clerk
Fueler/Cleaners
A-1

Allen County RTA
5 Year Capital Plan
2020-2024
B-1
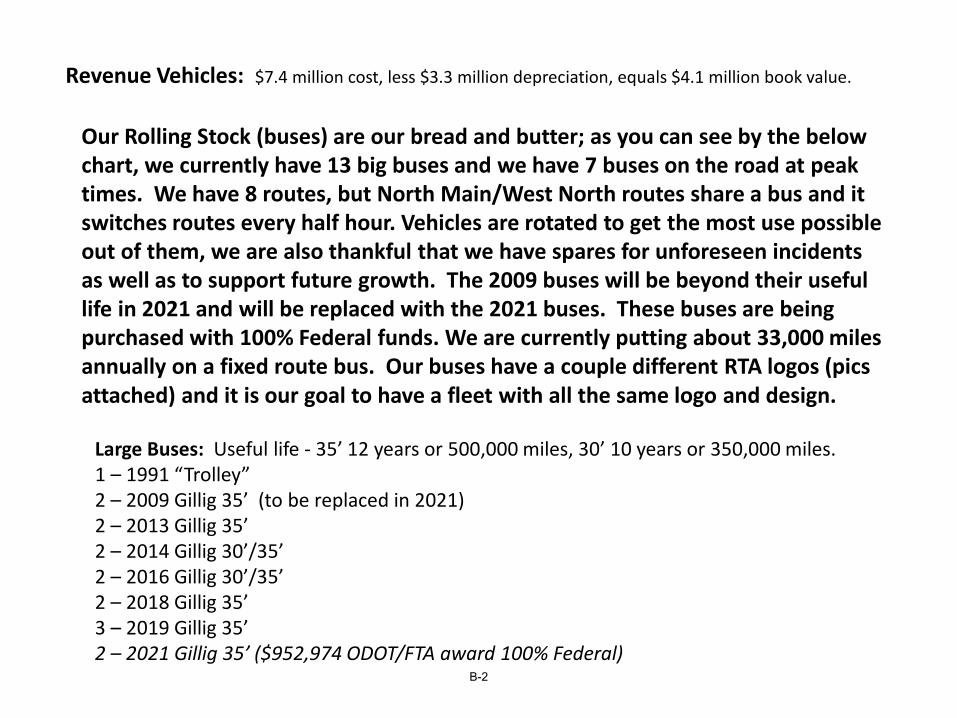
Revenue Vehicles: $7.4 million cost, less $3.3 million depreciation, equals $4.1 million book value.
Large Buses: Useful life - 35’ 12 years or 500,000 miles, 30’ 10 years or 350,000 miles.1 – 1991 “Trolley” 2 – 2009 Gillig 35’ (to be replaced in 2021)2 – 2013 Gillig 35’2 – 2014 Gillig 30’/35’2 – 2016 Gillig 30’/35’2 – 2018 Gillig 35’3 – 2019 Gillig 35’2 – 2021 Gillig 35’ ($952,974 ODOT/FTA award 100% Federal)
Our Rolling Stock (buses) are our bread and butter; as you can see by the below chart, we currently have 13 big buses and we have 7 buses on the road at peak times. We have 8 routes, but North Main/West North routes share a bus and it switches routes every half hour. Vehicles are rotated to get the most use possible out of them, we are also thankful that we have spares for unforeseen incidents as well as to support future growth. The 2009 buses will be beyond their useful life in 2021 and will be replaced with the 2021 buses. These buses are being purchased with 100% Federal funds. We are currently putting about 33,000 miles annually on a fixed route bus. Our buses have a couple different RTA logos (pics attached) and it is our goal to have a fleet with all the same logo and design.
B-2

Current design, all new buses will be ordered like this.
B-3
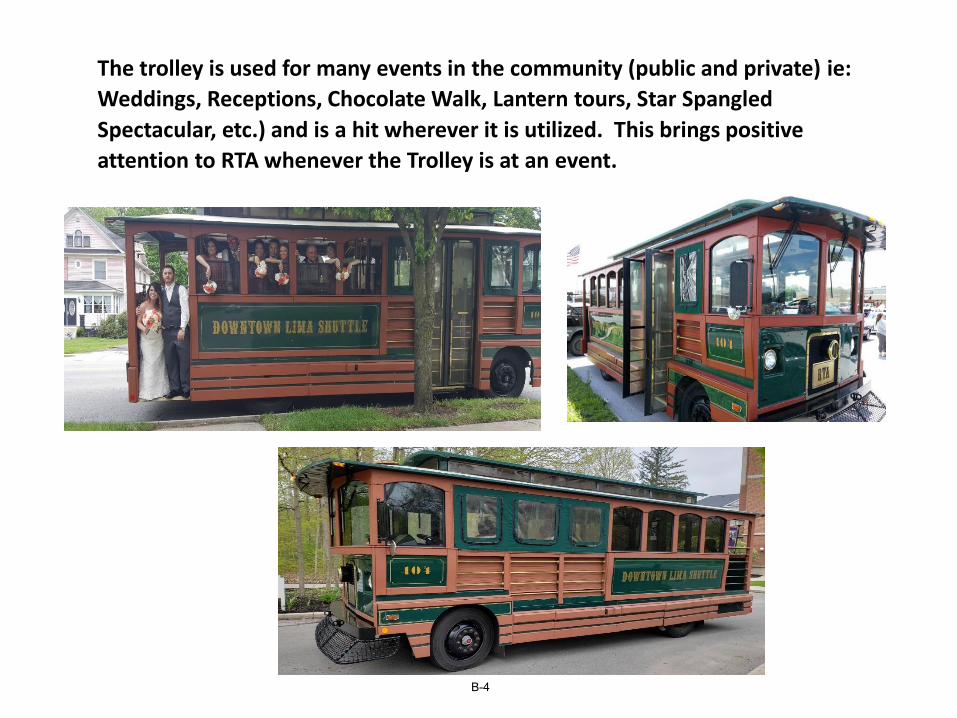
The trolley is used for many events in the community (public and private) ie:
Weddings, Receptions, Chocolate Walk, Lantern tours, Star Spangled
Spectacular, etc.) and is a hit wherever it is utilized. This brings positive
attention to RTA whenever the Trolley is at an event.
B-4
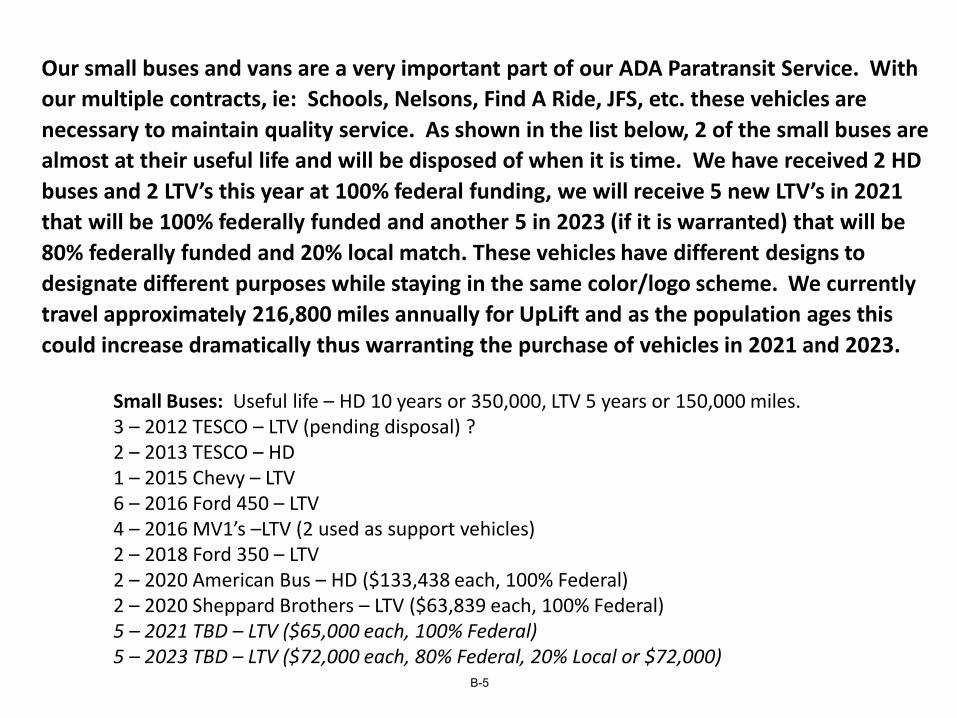
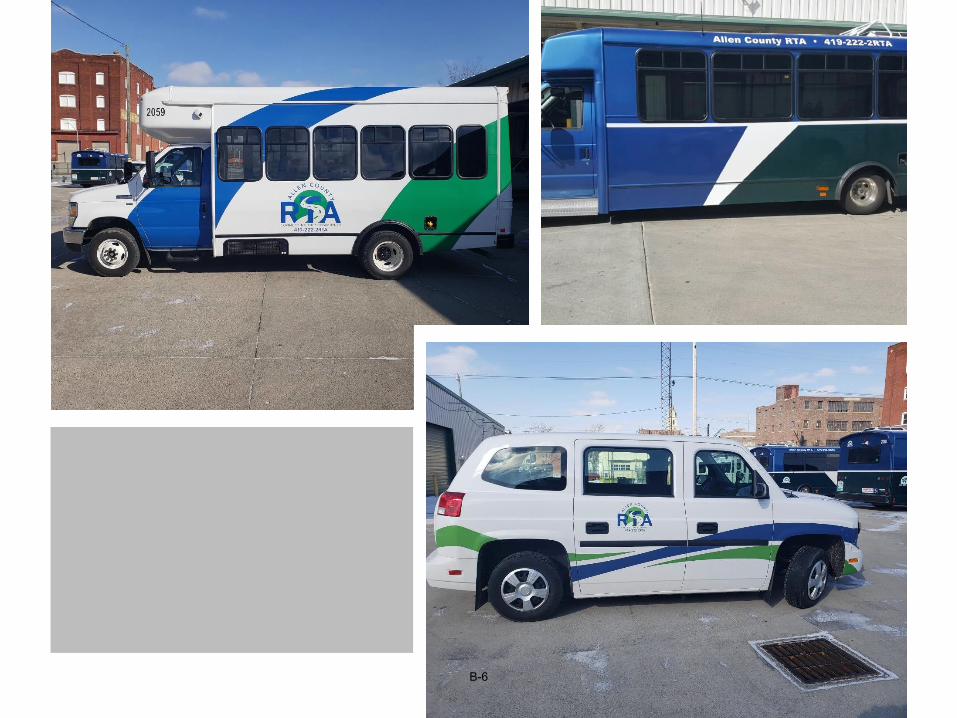
Small Buses: Useful life – HD 10 years or 350,000, LTV 5 years or 150,000 miles.3 – 2012 TESCO – LTV (pending disposal) ?2 – 2013 TESCO – HD 1 – 2015 Chevy – LTV 6 – 2016 Ford 450 – LTV 4 – 2016 MV1’s –LTV (2 used as support vehicles)2 – 2018 Ford 350 – LTV 2 – 2020 American Bus – HD ($133,438 each, 100% Federal)2 – 2020 Sheppard Brothers – LTV ($63,839 each, 100% Federal)5 – 2021 TBD – LTV ($65,000 each, 100% Federal)5 – 2023 TBD – LTV ($72,000 each, 80% Federal, 20% Local or $72,000)
Our small buses and vans are a very important part of our ADA Paratransit Service. With
our multiple contracts, ie: Schools, Nelsons, Find A Ride, JFS, etc. these vehicles are
necessary to maintain quality service. As shown in the list below, 2 of the small buses are
almost at their useful life and will be disposed of when it is time. We have received 2 HD
buses and 2 LTV’s this year at 100% federal funding, we will receive 5 new LTV’s in 2021
that will be 100% federally funded and another 5 in 2023 (if it is warranted) that will be
80% federally funded and 20% local match. These vehicles have different designs to
designate different purposes while staying in the same color/logo scheme. We currently
travel approximately 216,800 miles annually for UpLift and as the population ages this
could increase dramatically thus warranting the purchase of vehicles in 2021 and 2023.
B-5
B-6

Land & Facilities: $4.6 million cost, less $2.2 million depreciation, equals $2.4 million book value.
240 North Central – 1984
Maintenance Garage -$255,000 budgeted for updates to include: Portable evaporative cooler, tire changing machine, recoating floor, scissors lift, and other needed equipment and repairs.
B-7
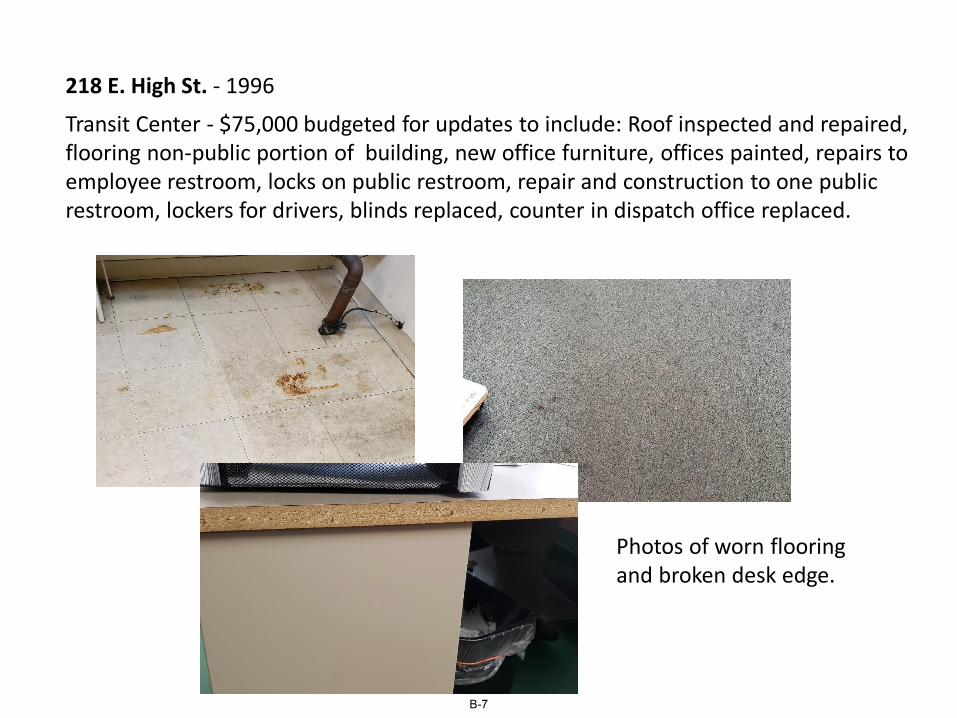
218 E. High St. - 1996
Transit Center - $75,000 budgeted for updates to include: Roof inspected and repaired, flooring non-public portion of building, new office furniture, offices painted, repairs to employee restroom, locks on public restroom, repair and construction to one public restroom, lockers for drivers, blinds replaced, counter in dispatch office replaced.
Photos of worn flooring and broken desk edge.
B-7
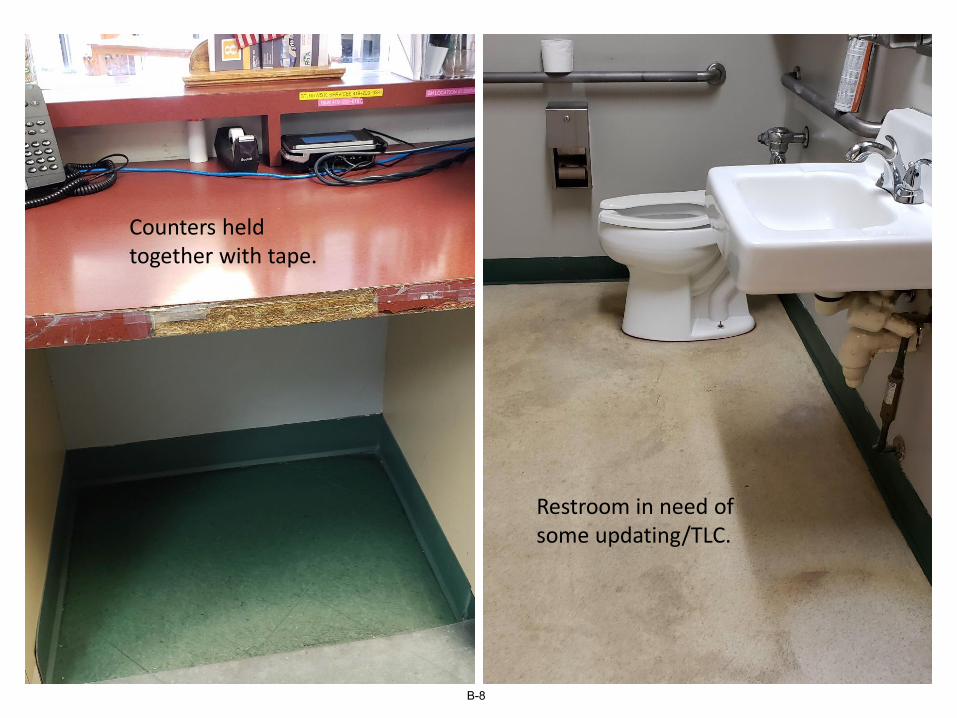
Restroom in need of some updating/TLC.
Counters held together with tape.
B-8

200 East High – 2003
Admin. Facility - $145,000 budgeted for updates to include: Inspection and repair of canopy over bus island, flooring first floor of building, replacement of office furniture, conference room tables and chairs, construct new office, replace blinds, painting, etc.
Rusted canopy support columns.
Rusted canopy roof supports.
Stained carpeting.
B-9
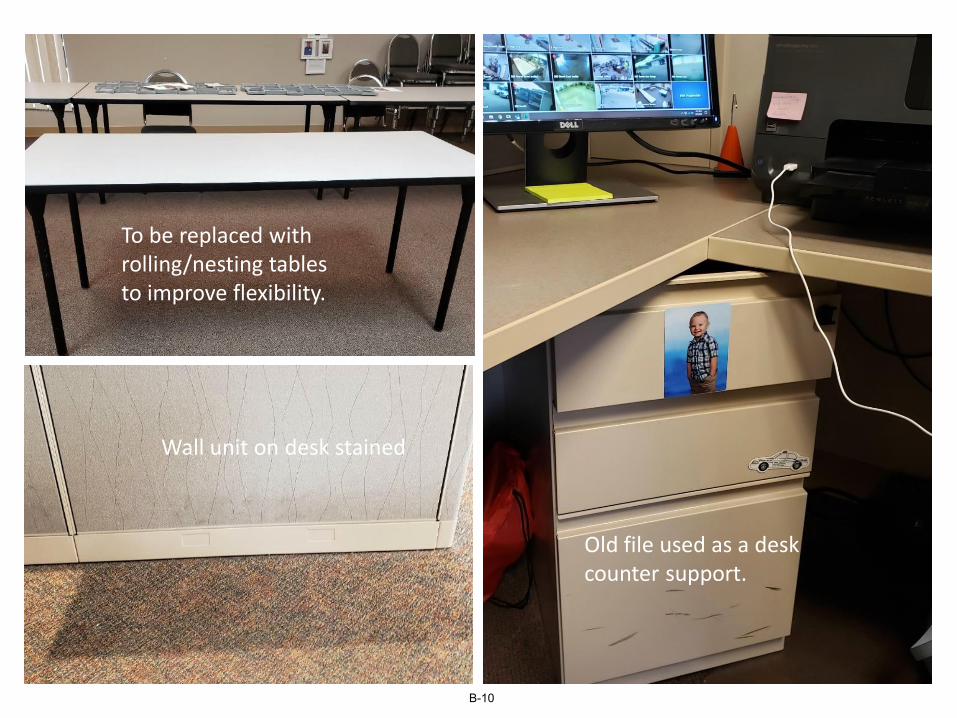
Wall unit on desk stained
To be replaced with rolling/nesting tables to improve flexibility.
Old file used as a desk counter support.
B-10
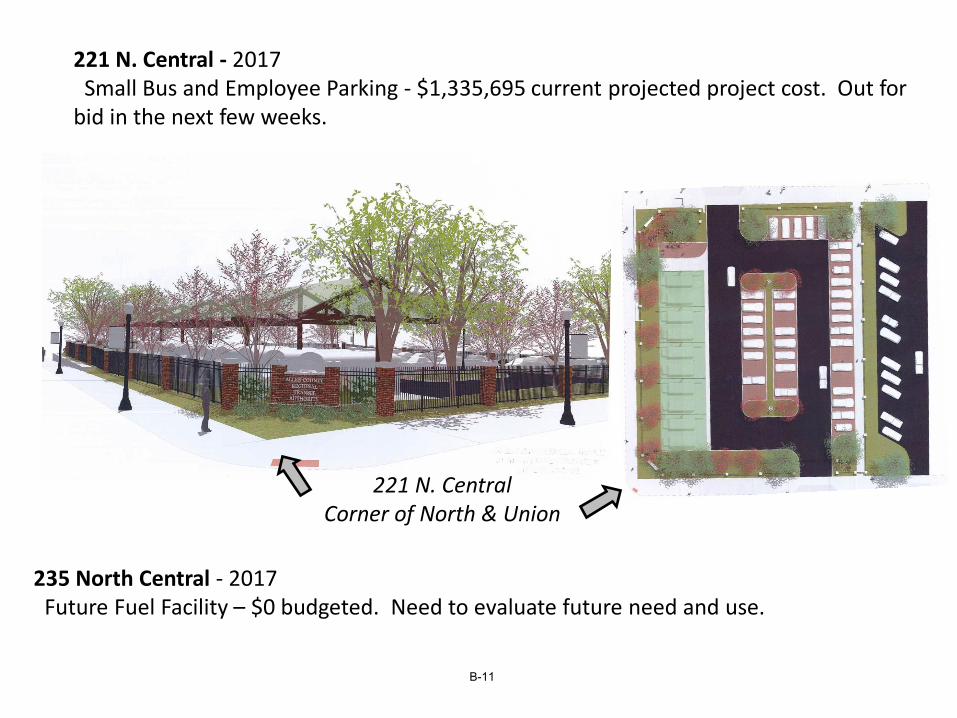
221 N. Central - 2017Small Bus and Employee Parking - $1,335,695 current projected project cost. Out for
bid in the next few weeks.
235 North Central - 2017Future Fuel Facility – $0 budgeted. Need to evaluate future need and use.
221 N. CentralCorner of North & Union
B-11
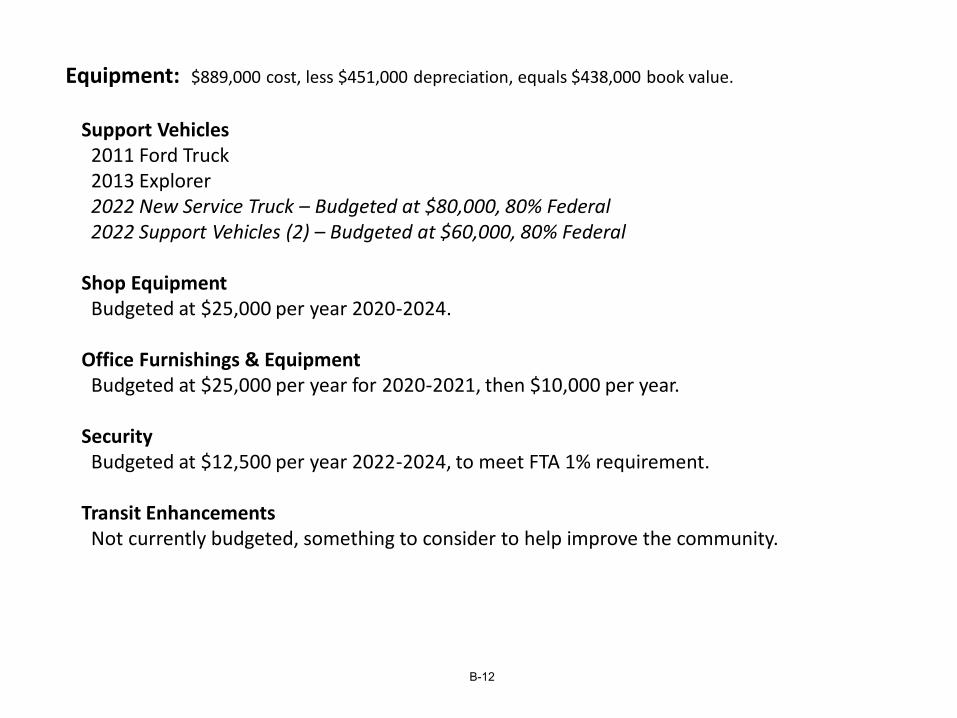
Equipment: $889,000 cost, less $451,000 depreciation, equals $438,000 book value.
Support Vehicles2011 Ford Truck2013 Explorer2022 New Service Truck – Budgeted at $80,000, 80% Federal2022 Support Vehicles (2) – Budgeted at $60,000, 80% Federal
Shop EquipmentBudgeted at $25,000 per year 2020-2024.
Office Furnishings & EquipmentBudgeted at $25,000 per year for 2020-2021, then $10,000 per year.
SecurityBudgeted at $12,500 per year 2022-2024, to meet FTA 1% requirement.
Transit EnhancementsNot currently budgeted, something to consider to help improve the community.
B-12
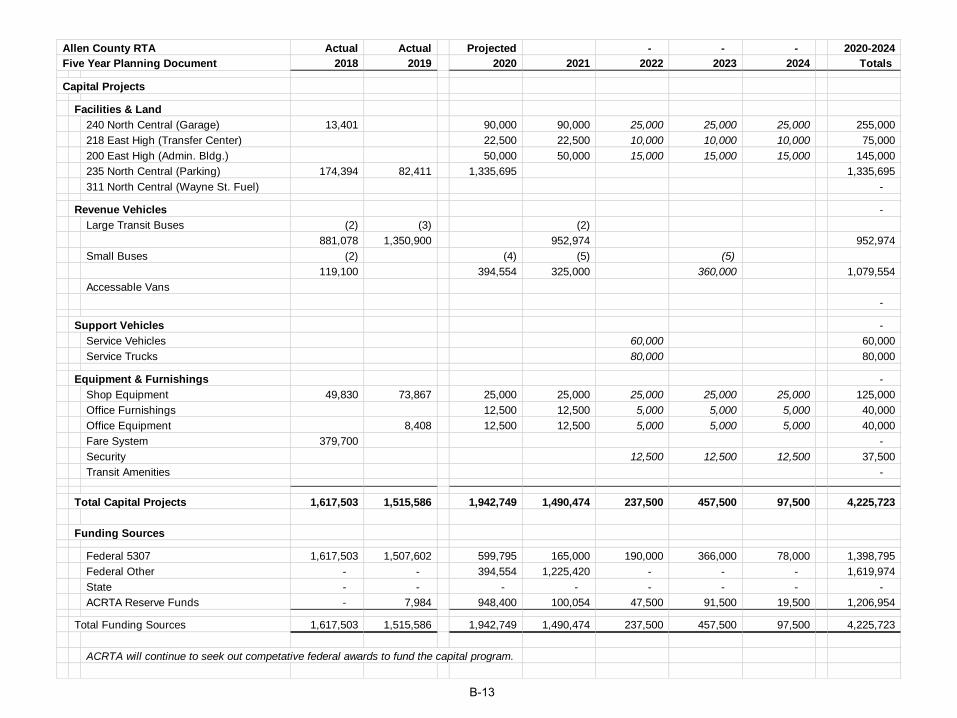
Allen County RTA Actual Actual Projected - - - 2020-2024
Five Year Planning Document 2018 2019 2020 2021 2022 2023 2024 Totals
Capital Projects
Facilities & Land
240 North Central (Garage) 13,401 90,000 90,000 25,000 25,000 25,000 255,000
218 East High (Transfer Center) 22,500 22,500 10,000 10,000 10,000 75,000
200 East High (Admin. Bldg.) 50,000 50,000 15,000 15,000 15,000 145,000
235 North Central (Parking) 174,394 82,411 1,335,695 1,335,695
311 North Central (Wayne St. Fuel) -
Revenue Vehicles -
Large Transit Buses (2) (3) (2)
881,078 1,350,900 952,974 952,974
Small Buses (2) (4) (5) (5)
119,100 394,554 325,000 360,000 1,079,554
Accessable Vans
-
Support Vehicles -
Service Vehicles 60,000 60,000
Service Trucks 80,000 80,000
Equipment & Furnishings -
Shop Equipment 49,830 73,867 25,000 25,000 25,000 25,000 25,000 125,000
Office Furnishings 12,500 12,500 5,000 5,000 5,000 40,000
Office Equipment 8,408 12,500 12,500 5,000 5,000 5,000 40,000
Fare System 379,700 -
Security 12,500 12,500 12,500 37,500
Transit Amenities -
Total Capital Projects 1,617,503 1,515,586 1,942,749 1,490,474 237,500 457,500 97,500 4,225,723
Funding Sources
Federal 5307 1,617,503 1,507,602 599,795 165,000 190,000 366,000 78,000 1,398,795
Federal Other - - 394,554 1,225,420 - - - 1,619,974
State - - - - - - - -
ACRTA Reserve Funds - 7,984 948,400 100,054 47,500 91,500 19,500 1,206,954
Total Funding Sources 1,617,503 1,515,586 1,942,749 1,490,474 237,500 457,500 97,500 4,225,723
ACRTA will continue to seek out competative federal awards to fund the capital program.
B-13

Allen County RTA Actual Actual Projected - - -
Five Year Planning Document 2018 2019 2020 2021 2022 2023 2024
ACRTA Cash Reserves (Current Assets less Current Liabilities)
Opening Balance 22,203 63,948 963,130 1,129,507 2,056,944 3,119,681 3,107,502
Operating Gain/Loss 41,745 907,166 1,114,777 1,027,492 1,110,236 79,321 59,307
Used for Local Capital Share - (7,984) (948,400) (100,054) (47,500) (91,500) (19,500)
Ending Balance 63,948 963,130 1,129,507 2,056,944 3,119,681 3,107,502 3,147,309
Scheule of Federal Funds
Beginning Balance of Federal Funds 1,739,199 5,915,681 3,230,844 1,834,844 1,463,844
5307 Federal Formula Funds
Beginning Balance of Funds 1,739,199 1,270,261 1,490,844 1,834,844 1,463,844
Carryforward Funds 250,000 - - - -
Annual Allocation to ACRTA 1,016,355 1,025,000 1,050,000 1,075,000 1,100,000
Used for Operating Assistance (364,296) - - (600,000) (600,000)
Used for Preventive Maintenance (600,000) (540,000) (480,000) (480,000) (480,000)
Used for ADA Assistance (120,000) (51,417) - - -
Used for Planning Assistance (51,202) (48,000) (36,000) - -
Used for Capital Projects (599,795) (165,000) (190,000) (366,000) (78,000)
Balance of 5307 Funds 1,270,261 1,490,844 1,834,844 1,463,844 1,405,844
Other Federal Funds
Beginning Balance of Funds - 4,645,420 1,740,000 - -
MPO CMAQ Award 450,000 - - - -
CARES Act - FTA Allocation 2,877,930 - - - -
CARES Act - ODOT Transfer 1,606,898 - - - -
5339 ODOT Transfer 1,169,974 - - - -
Used for Operating Assistance (1,064,828) (1,680,000) (1,740,000) - -
Used for Capital Projects (394,554) (1,225,420) - - -
Balance of Other Federal Funds 4,645,420 1,740,000 - - -
Ending Balance of Federal Funds 5,915,681 3,230,844 1,834,844 1,463,844 1,405,844
B-14