Transportation Commuter –Faculty/Staff –Students University Fleet Air travel –Athletic Meets...
22
Transportation • Commuter – Faculty/Staff – Students • University Fleet • Air travel – Athletic Meets – Study Abroad
-
Upload
deirdre-haynes -
Category
Documents
-
view
214 -
download
0
Transcript of Transportation Commuter –Faculty/Staff –Students University Fleet Air travel –Athletic Meets...

Transportation
• Commuter– Faculty/Staff– Students
• University Fleet
• Air travel– Athletic Meets – Study Abroad

Emission Calculation for Commuter Transportation
• Factors effecting the emission:– # of people commuting to WashU– miles driven per year– # of gallons of fuel required– amount of Carbon produced by the fuel
FuelofGallon
gmCarbon
Miles
FuelofGallons
Year
MilesPersonEmission
__
)(__#

Data Collected• Student Parking Permit Data: Count of number of students holding
parking permit from each zip code for fiscal year 2007-08.• Student Local Address Data: Count of the number of students from
each zip code for each fiscal year from 1991-92 to 2007-08.• Student Home Address Data: Count of students from each zip code
all over US and other countries for each fiscal year from 1991-92 to 2007-08.
• Faculty/Staff Parking Permit Data: Count of the number of faculty/staff holding parking permit from each zip code for fiscal year 2007-08.
• Faculty/Staff Local Address Zip code: Count of the number of faculty/staff from each zip code for fiscal year 2007-08.
• Data plotted on Google Earth to see the spatial distribution of the data.

Issues with data
• Some students provide their permanent home address zip code instead of local address zip code.
• Each year over 3000-4000 students do not provide zip code.
• Historic parking permit data not available.
• Historic faculty/staff local zip code not available.

• Data displayed on Google Earth for better understanding of population distribution

• Parking Permit distribution for Faculty/Staff on Google Earth

Annual distance traveled
• Assume every person makes 1 round trip (2 trips) to school per working day of the year.
• Faculty/Staff - 225 working days per year• Students - 165 working days (excluding summer/winter
vacation and weekends)• Distance within 150 miles to WashU considered for
analysis.


Distance Calculation
• Zip code converted to latitude and longitude based on U.S. Gazetteer and zipinfo.
• For WashU, coordinates of Brookings Hall (38.648N, 90.305W) considered.
• Distance from zip code coordinates to WashU coordinates calculated using the reference formula: – Δx = 69.1*(lat1-lat2); Δy = 53.0*(lon1-lon2), – Distance (in miles) = (Δx2+Δy2) 1/2.
• This is straight line distance between WashU and centroid of zip code

• Fudge factors required for calculated distance– Highways and road directions– Bridges on East and North St. Louis
• 18% for students as they live close to school.• 40% for faculty/staff as they live further away from
school


As students moved closer to campus, number of parking permits issued decreased.
Annual miles driven per student decreased most dramatically from 2002-2007. This is explained in part by the shift in student residences from 2001-2007.
1991-92
1995-96
2000-2001
2007-08


Fuel Economy and Carbon Emissions Calculations
• For commuter emissions calculations, gallons per mile was based on the EPA report: Light Duty Automotive Technology and Fuel Economy Trends: 1975-2007. Amongst the multiple estimations for each year, the most realistic estimations were used in our calculations, which assumed stop-and-go city driving, and 43% city and 57% highway weighted averages based on three-year moving averages and sales fractions of cars and light trucks.• To calculate the university fleet fuel economies, EPA values based on yearly guides for gasoline vehicles for each year and model were used. City and highway values were listed separately, and represent lab values. Fuel economies can be found in the EPA fuel economy database. • If Carbon dioxide values are needed, the ratio 44 grams CO2 for every 12 grams C is used based on the molecular mass of each substance and is necessary if calculating mass of carbon dioxide from mass of carbon emitted.
miles gallons2,421 grams of Carbon/Gallon as given by the Code
of Federal Regulations (40 CFR
600.113)
0.99 percent of fuel oxidized
12 grams C
44 grams CO2
mileyearEmissions xx x x=

Total miles traveled by students correlates with number of permits issued.
Fuel economy improved until 1999 when sales fraction of SUVs increased.
Gallons of gasoline consumed decreased with decreasing distance traveled.
Student Carbon Emissions, and Driving Factors
Confidence intervals in miles driven annually per student


Student Commuter Carbon Emissions

University Fleet Contribution
The University fleet grew and contribution steadily increased despite improvements in fuel economy, yet is minimal in comparison to student commuter carbon emissions.


Air Travel Emissions
• General areas of air travel– Faculty– Study abroad– Athletics
• Methodology– Faculty air travel not considered – Study abroad data was provided for the past 6
years– Athletic air travel data provided for the past 3
years
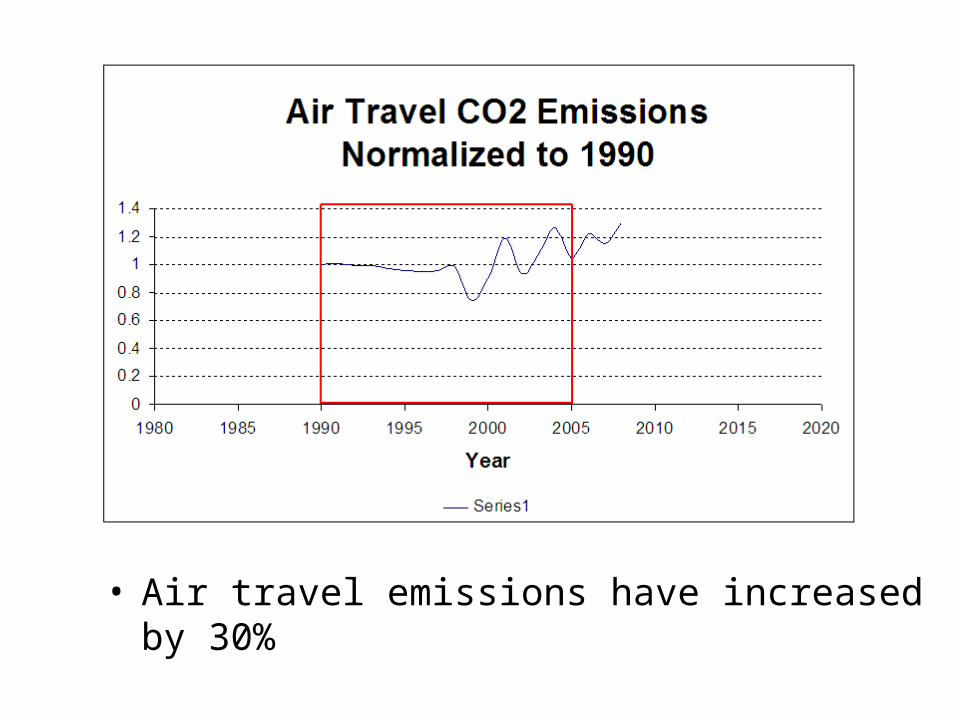
• Air travel emissions have increased by 30%

• Air travel emissions are the driver in this study