Transportation choices and CO 2 emissions By: Dayanara Veliz & Abel Adam.
9
Transportation choices and CO 2 emissions By: Dayanara Veliz & Abel Adam
-
Upload
dominic-craig -
Category
Documents
-
view
214 -
download
0
Transcript of Transportation choices and CO 2 emissions By: Dayanara Veliz & Abel Adam.

Transportation choices and CO2 emissions
By: Dayanara Veliz & Abel Adam
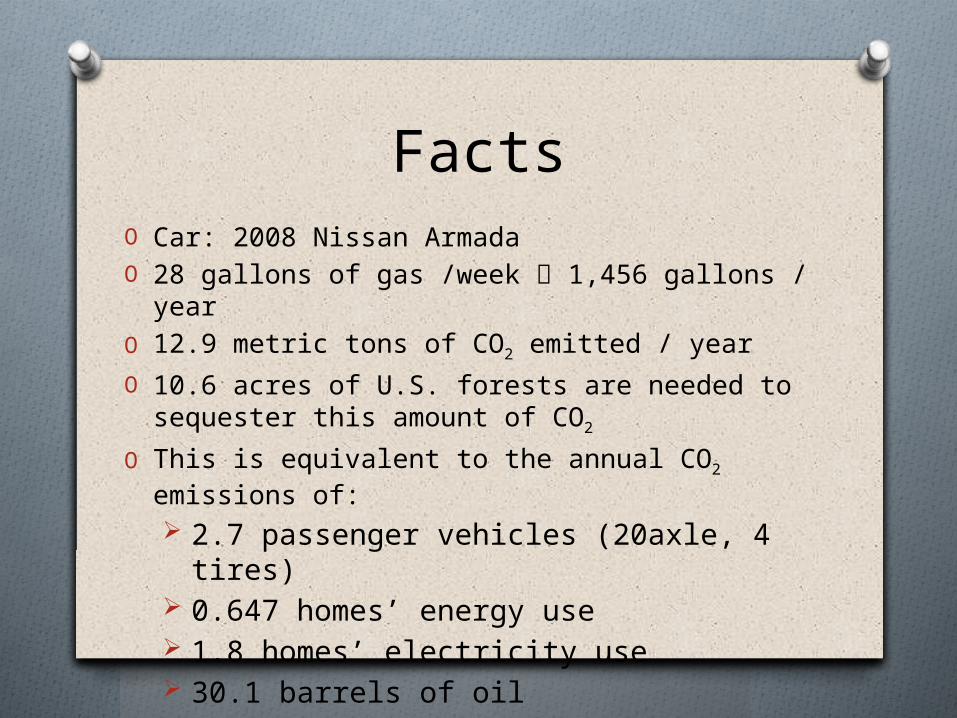
FactsO Car: 2008 Nissan Armada O 28 gallons of gas /week 1,456 gallons / yearO 12.9 metric tons of CO2 emitted / year
O 10.6 acres of U.S. forests are needed to sequester this amount of CO2
O This is equivalent to the annual CO2 emissions of:
2.7 passenger vehicles (20axle, 4 tires) 0.647 homes’ energy use 1.8 homes’ electricity use 30.1 barrels of oil
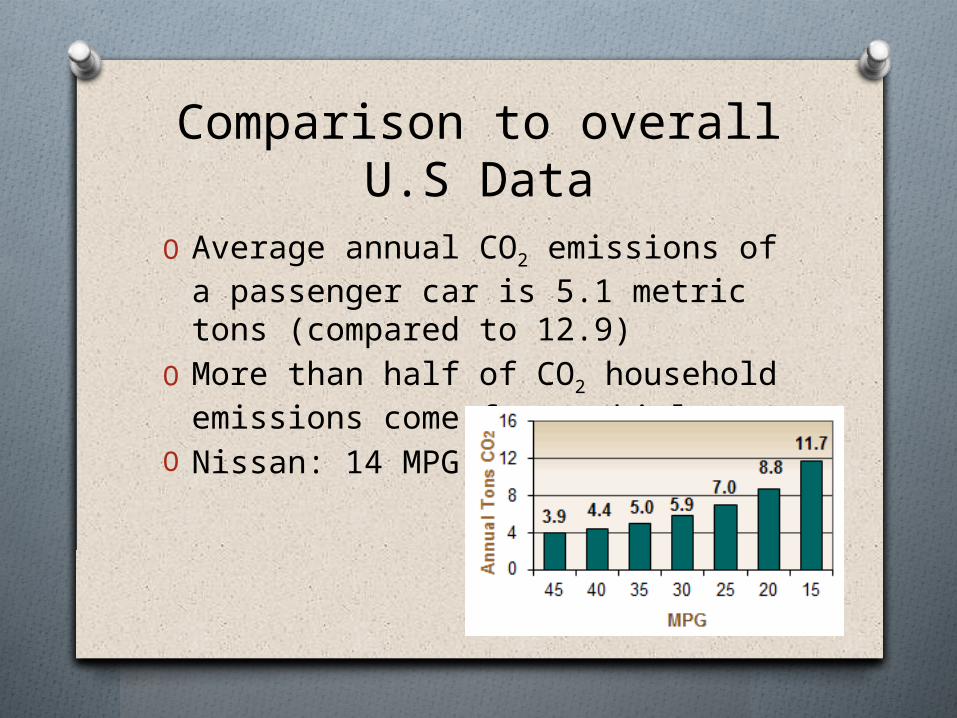
Comparison to overall U.S Data
O Average annual CO2 emissions of a passenger car is 5.1 metric tons (compared to 12.9)
O More than half of CO2 household emissions come from vehicles
O Nissan: 14 MPG
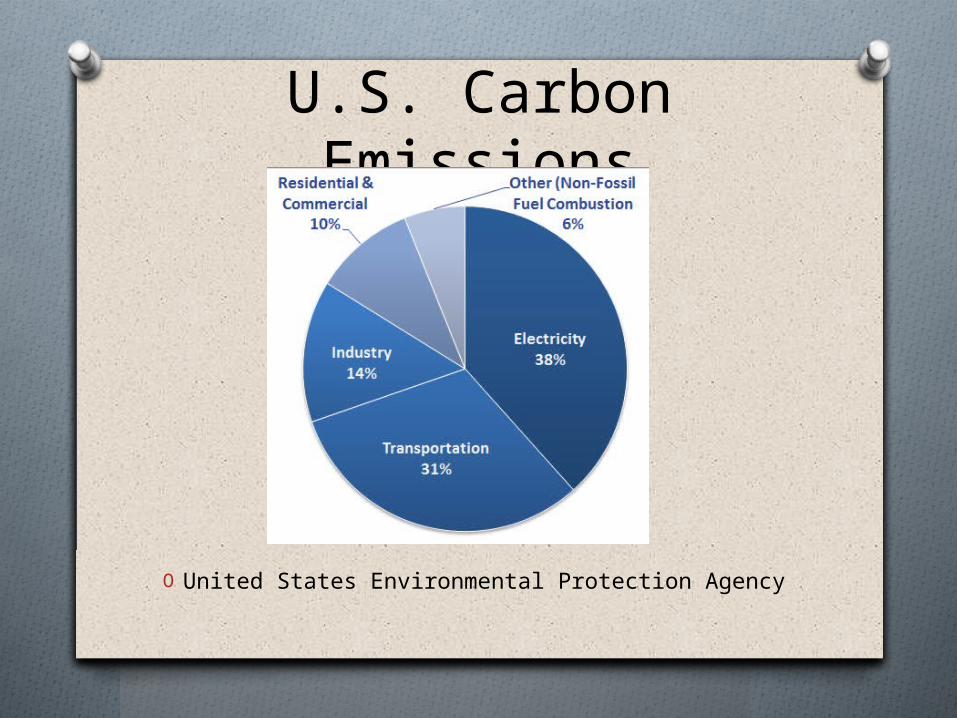
U.S. Carbon Emissions
O United States Environmental Protection Agency
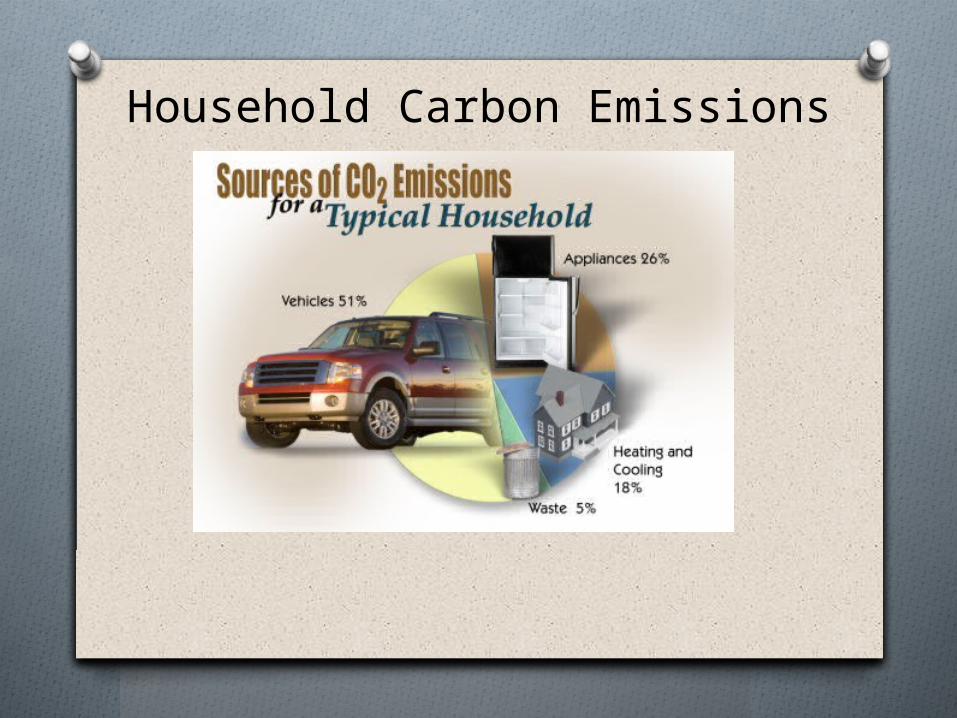
Household Carbon Emissions
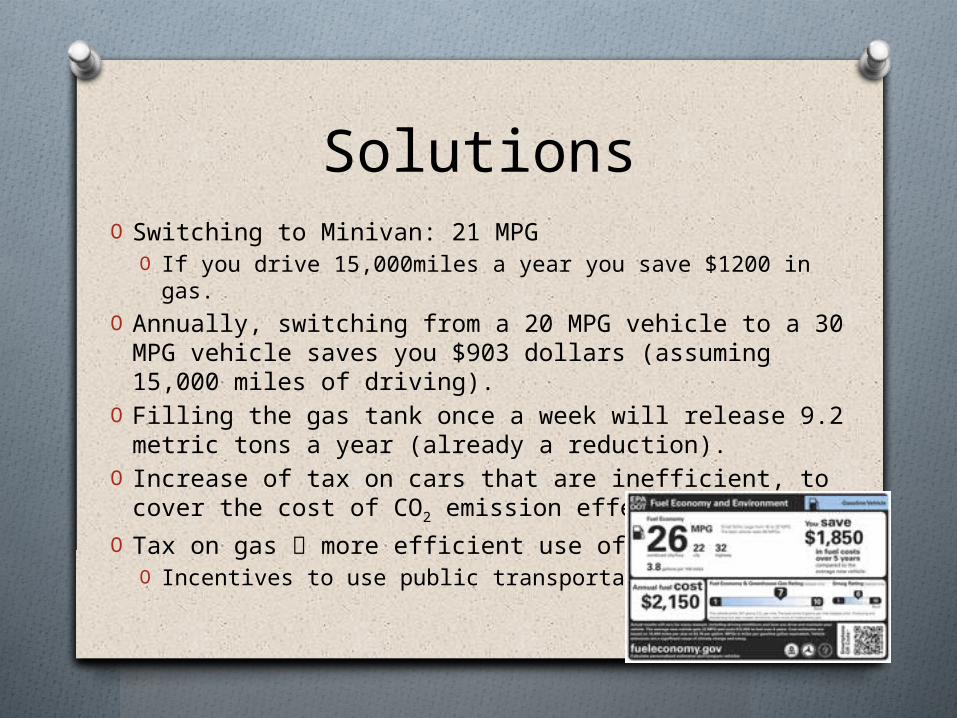
SolutionsO Switching to Minivan: 21 MPG
O If you drive 15,000miles a year you save $1200 in gas. O Annually, switching from a 20 MPG vehicle to a 30 MPG
vehicle saves you $903 dollars (assuming 15,000 miles of driving).
O Filling the gas tank once a week will release 9.2 metric tons a year (already a reduction).
O Increase of tax on cars that are inefficient, to cover the cost of CO2 emission effects.
O Tax on gas more efficient use of carsO Incentives to use public transportation
What you can do?O Drive Smart
O Go easy on the gas pedals and breaksO Regular Tune-up
O A well-maintained car is more efficient
O Check your tires pressure regularlyO Use public transportation
O Save some money and times, especially in large cities.

SourcesO EPA (U.S Environmental Protection
Agency) O www.epa.gov
O U.S Department of EnergyO www.fueleconomy.com