Transportation Benchmarks Implementation Report · Transportation Benchmarks Implementation Report...
33
Transportation Benchmarks Implementation Report August 2003 Summary report on the implementation of transportation benchmarks codified in RCW 47.01.012
-
Upload
nguyenkhanh -
Category
Documents
-
view
237 -
download
0
Transcript of Transportation Benchmarks Implementation Report · Transportation Benchmarks Implementation Report...

Transportation Benchmarks Implementation Report
August 2003
Summary report on the implementationof transportation benchmarks codified in RCW 47.01.012


Transportation Benchmarks Implementation ReportAugust 2003
Contents
Executive Summary ..............................1
Benchmark Results ...............................3
Policy Goal 1: Safety......................................................6
Policy Goal 2: Pavement Condition..............................8
Policy Goal 3: Bridge Condition .................................10
Policy Goal 4: Traffic Congestion ...............................13
Policy Goal 5: Driver Delay .........................................16
Policy Goal 6: Per Capita Vehicle Miles Traveled......17
Policy Goal 7: Non-Auto Share of Commute Trips....18
Policy Goal 8: Administrative Efficiency ...................19
Policy Goal 9: Transit Cost Efficiency........................22
Appendix A: Transportation Commission Benchmark Committee .......................26
Appendix B: RCW 47.01.012 .....................................27
Appendix C: Local Arterial Pavement Condition ....28

Transportation Benchmarks Implementation Report 1
This report was adopted by the Washington State Transportation Commission on August 20, 2003.
For information, contact:Daniela BremmerWSDOT Strategic Assessment310 Maple Park Avenue SEP.O. Box 47374Olympia, WA 98504-7374
Phone: 360-705-7953E-mail: [email protected]
The Gray Notebook is a periodic performance report prepared by WSDOT staff to track a variety of performance and accountability measures for routine review by the Transportation Commission and others. It is published quarterly in February, May, August, and November. For an online version of the Gray Notebook, visit www.wsdot.wa.gov/accountability.
Published August 20, 2003.

Transportation Benchmarks Implementation Report 1
Executive SummaryThis document demonstrates how the Washing-ton State Transportation Commission and the Washington State Department of Transportation (WSDOT) have responded to the benchmarking legislation enacted in 2002 in ESHB 2304 and codified in RCW 47.01.012.
RCW 47.01.012 (ESHB 2304, Part I) BackgroundEfforts to develop benchmarks for tracking and im-proving Washington’s transportation system have been underway for several years.
In November 2000, the Governor-appointed Blue Ribbon Commission on Transportation’s (BRCT) Benchmark Committee published its final report for Washington State. The report recommended eleven benchmarks for Washington’s transportation system and a set of topics for additional benchmarks for future development.
The Washington State Transportation Commission conducted a workshop in January 2001 to analyze the potential application of the BRCT benchmarks. The Commission agreed to pursue the development of a performance measurement program tailored to WSDOT’s needs and programs. The appointment of Doug MacDonald as the new Secretary of Trans-portation in April 2001 reinforced this direction.
In October 2001, the Transportation Commission formed a Benchmark Committee to develop and guide the use of benchmarks for WSDOT, work-ing with the new Secretary and WSDOT staff. The committee proceeded to develop and implement benchmarks and performance measures for the ma-jor policy categories recommended by the BRCT. Appendix A contains more information about the committee.
In January 2002, the Washington State Legislature passed Engrossed Substitute House Bill 2304. Part I of the act, “Establishment of Transportation Performance Measures,” directs the Transporta-tion Commission to develop benchmarks based on policy goals for the operation, performance of, and investment in the state’s transportation system. These policy goals consist of, but are not limited
to, the benchmark categories adopted by the BRCT and complemented the work the Transportation Commission had begun in 2001.
The provisions of ESHB 2304 took effect on July 1, 2002 and are codified in Revised Code of Wash-ington 47.01.012 (see Appendix B for the full text of the bill). There is no express deadline set for the completion of the indicated tasks.
The Transportation Commission’s Benchmark Committee has addressed each of the Legislature’s policy goals. The Benchmark Committee held its final meeting on January 17, 2003.
RCW 47.01.012 Policy GoalsAccording to RCW 47.01.012, the following policy goals are the basis for establishing detailed and measurable performance benchmarks:
• Improving safety;
• No interstate highways, state routes, and local arterials shall be in poor condition;
• No bridges shall be structurally deficient, and safety retrofits shall be performed on those state bridges at the highest seismic risk levels;
• Traffic congestion on urban state highways shall be significantly reduced and be no worse than the national mean;
• Delay per driver shall be significantly reduced and be no worse than the national mean;
• Per capita vehicle miles traveled shall be maintained at 2000 levels;
• The non-auto share of commuter trips shall be increased in urban areas;
• Administrative costs as a percentage of transportation spending shall achieve the most efficient quartile nationally; and
• The state’s public transit agencies shall achieve the median cost per vehicle revenue hour of peer transit agencies, adjusting for the regional cost of living.

2 Transportation Benchmarks Implementation Report Transportation Benchmarks Implementation Report 3
Benchmark DevelopmentWSDOT and the Transportation Commission not only implemented the benchmark requirements, but also attempted to evaluate the effectiveness and adequacy of the proposed benchmarks as results emerged. The process revealed that some of the proposed benchmarks needed to be refined and further developed to use available data and information or to meaningfully reflect the perfor-mance of the particular policy area. In some cases, comparative national data was of poor quality or lacking entirely. This led to some adaptation of the proposed benchmarks, as well as suggestions for new measures.
Experts generally agree that performance measure development is an iterative process. The bench-marks discussed in this report should be expected to be refined as time passes. Some information is part of a baseline, to which performance in future years can be compared. This is especially true with respect to congestion measures. WSDOT has re-sponded to some of the weaknesses of some of the nationally used congestion measures by developing innovative new direction that is widely-recognized as contributing to improved national measurement approaches.
PublicationAll policy goal benchmarks have been published in WSDOT’s quarterly performance report Measures, Markers, and Mileposts (also called the Gray Note-book), first published for the quarter ending March 31, 2001. Some previously published data has been updated for this report.
All editions are available online, and a sub-ject index of published measures is avail-able at www.wsdot.wa.gov/accountability/graybookindex.htm.

2 Transportation Benchmarks Implementation Report Transportation Benchmarks Implementation Report 3
Benchmark ResultsThis page summarizes the RCW 47.01.012 bench-mark status through August 2003. Future reporting will contain updated information for these bench-marks. Congestion measures will likely be further refined. WSDOT’s Gray Notebook, published quarterly, contains a variety of performance and ac-countability measures on department programs and management. The Gray Notebook can be accessed at www.wsdot.wa.gov/accountability.
1. SafetySafety improvement program delivery: 75.9% of plan. During the 2001-2003 biennium, 41 safety construction projects were advertised, compared to a revised plan (due to Supplemental Budget reduc-tions) of 54 project advertisements.
Percent change of fatal and disabling crashes on Washington State Highways since 1990: Down 46.5% in 2001. Since 1990, the number of vehicle miles traveled on state highways has increased 32.6%, while the number of fatal and disabling colli-sions has decreased 46.5%.
2. Pavement ConditionInterstate and state highway pavement condi-tion: 9% poor in 2001. The number of pavement lane miles rated in poor condition was 6% in 2000.
“Due” lane miles of pavement not rehabilitated: 292 in the 01-03 biennium. Using pavement condition measures and the Lowest Life Cycle Cost methodology, WSDOT determines the number of lane miles of pavement due to be rehabilitated each year. Often, funding levels are not sufficient to ad-dress all of the “due” pavements. In the 1999-2001 biennium, 1,181 due and past-due lane miles were not rehabilitated; the majority of these lane miles were addressed in the 2001-2003 biennium.
3. Bridge ConditionBridge deck protection project delivery: 86.7% of plan. During the 2001-2003 biennium, 13 bridge deck protection projects were advertised, compared to a plan of 15 advertisements. From 1980 through August 2003, WSDOT has taken
deck protection action on 1,802 bridges.
Steel bridge painting project delivery: 104.3% of plan. During the 2001-2003 biennium, 24 steel bridge painting projects were advertised, compared to a plan of 23 advertisements.
Bridge seismic retrofit program delivery: 109.1% of plan. During the 2001-2003 biennium, 24 bridge seismic retrofit projects were advertised, compared to a plan of 22 project advertisements. From 1980 to the end of June 2003, WSDOT has completed 441 full or partial seismic retrofit proj-ects to meet current national standards. An addi-tional 920 retrofits await programming.
4. Traffic CongestionNumber of over 90-minute incidents in the first quarter of calendar year 2003: 63 per month (average). This data is part of the baseline for the expanded Incident Response program that began in July 2002. WSDOT and the Washington State Pa-trol (WSP) have adopted a joint performance goal for incident response: “WSDOT and WSP will col-laborate to respond to incidents and coordinate all public and private resources in this effort to work toward clearing incidents within 90 minutes.”
Travel time comparison for 2001 and 2002. WSDOT has published a table comparing travel time measures for 2002 and 2001 on 11 commute routes in the Puget Sound region. The table is available at www.wsdot.wa.gov/accountability/peaktime/Travel_Time_Summary_2001-2002.pdf. Highlighted improvements (despite almost no change in traffic volumes) are shown in the table on page 10. Goals are not yet established but this information will be the basis for a travel time benchmark.
5. Driver DelayPerformance targets for delay are currently under development. WSDOT continues to focus on de-veloping congestion measurements that accurately distinguish between incident related and non-inci-dent related congestion.

4 Transportation Benchmarks Implementation Report Transportation Benchmarks Implementation Report 5
6. Per Capita Vehicle Miles Traveled2002 vehicle miles traveled (VMT) per capita compared to 2000 benchmark: Down 0.7%. In 2002, Washington’s population traveled 9,066 miles per person, below the year 2000 target of 9,133 VMT per person.
7. Non-Auto Share of Commuter TripsCommuting drive-alone rate: 73.3% in the 2000 Census. The proportion of commuters driving alone slightly decreased from the 1990 Census, when the drive-alone rate was 73.9%. Washing-ton and Oregon were the only states to register a decrease in commute drive-alone rate from 1990 to 2000. In Washington, carpooling, use of public transportation, and working at home showed the fastest rates of growth for the state in commuting from 1990 to 2000.
8. Administrative EfficiencyWashington’s administrative cost rank among all 50 states: 21st lowest in 2001. Washington is showing progress toward meeting the first quartile target; it has moved from the top of the last quartile for 1999 to the middle of the second quartile for the 2001 report. National comparison data includes costs from other state transportation agencies, such as the Department of Licensing, and takes admin-istrative spending as a percentage of spending on capital outlay, maintenance, and operations.
WSDOT’s administrative cost: 3.8% in 2002. This internal benchmark using agency data reflects the agency’s administrative cost in relation to its total expenditures, using Federal Highway Adminis-tration (FHWA) allocation guidelines.
9. Transit Cost EfficiencyThe following four benchmarks differentiate sys-tem size averages for fixed route service at urban, small urban, and rural transit agencies, and state-wide averages for demand response and vanpool services. Distinguishing between different types of services and system sizes is essential for valid transit benchmarking. The performance of individ-ual systems can be compared to these benchmarks.
Average operating cost per total hour
• Urban fixed route: $86.21• Small urban fixed route: $75.77• Rural fixed route: $56.28• Demand response (all systems): $50.34
Average boardings per revenue hour
• Urban fixed route: 29.4• Small urban fixed route: 24.0• Rural fixed route: 16.4• Demand response (all systems): 3.0
Average operating cost per passenger mile
• Urban fixed route: $0.60• Small urban fixed route: $0.69
Average operating cost per boarding
• Urban fixed route: $3.33• Small urban fixed route: $3.36• Rural fixed route: $3.93• Demand response (all systems): $19.60• Vanpool service (all systems): $2.48
Transit Cost Efficiency
The results in the box below use 2001 data from the Washington State Summary of Public Transpor-tation Systems — 2001.
4 Transportation Benchmarks Implementation Report Transportation Benchmarks Implementation Report 5
How this Report is OrganizedThe following pages contain a section for each policy goal. The analysis examines the goal and purpose of each benchmark and why it appears to originally have been proposed by the BRCT. Each benchmark has been analyzed for its relevancy and applicability to WSDOT. Where alternatives were necessary, or WSDOT developed additional measures to address the intent of the policy goals, this report documents the work of WSDOT and the Transportation Commission in developing these. Measures previously published in the Gray Note-book relevant to a particular policy goal are also included.
In a few cases, this report identifies alternative measures that are believed to more effectively communicate or measure the intent of the BRCT recommended benchmark.

6 Transportation Benchmarks Implementation Report Transportation Benchmarks Implementation Report 7
Policy Goal 1: SafetyRCW 47.01.012: “In addition to improving safety...”
collisions has decreased 46.5 percent. (September 30, 2002 Gray Notebook)
Relevant Measures that Track ProgressRecent Gray Notebooks have contained other safety measures that support the intent of the policy goal.
• Washington traffic fatality rates compared to U.S. rates. The measurement compares traffic fatalities per 100 million vehicle miles on all Washington public roads and state highways to the national rate. (September 30, 2002 Gray Notebook)
BackgroundThe BRCT did not adopt a specific safety bench-mark. Its Benchmark Committee reviewed data on accident rates in Washington and reported that ac-cident rates had been declining in Washington and other states for several years. The chief reasons cited for this decline were increased enforcement of drunk driving laws and higher seat belt use.
The BRCT Benchmark Committee felt that Washington’s accident rates were already good and that traffic safety was not directly influenced by specific investment choices. The committee recommended a safety target: “Traffic accidents will continue to decline.”
WSDOT analyzes safety issues on the state system and prioritizes capital improvements and low cost safety enhancements. There are many highway safety factors, including driver behavior, vehicle conditions, and weather conditions, that are beyond WSDOT’s control. WSDOT measures some of these factors and reports on overall safety statistics. For example, information on High Accident Loca-tions (HALs) and High Accident Corridors (HACs) have been published in the Gray Notebook.
Safety Benchmarks WSDOT’s main safety benchmark for its own per-formance is the delivery of its safety construction projects — capital projects designed specifically to address safety issues. During the 2001-2003 biennium, 41 safety construction projects have been advertised, compared to a revised plan (due to Supplemental Budget reductions) of 54 project advertisements (a delivery rate of 75.9 percent). Explanations of the delivery performance are on the following page. (June 30, 2003 Gray Notebook)
The other safety benchmark tracks the percent change of fatal and disabling crashes on Washing-ton State Highways compared to vehicle miles trav-eled since 1990. Since 1990, the number of vehicle miles traveled on state highways has increased 32.6 percent, while the number of fatal and disabling
Safety Benchmarks
0
10
20
30
40
50
60
70
Qtr 1 Qtr 2 Qtr 3 Qtr 4 Qtr 5 Qtr 6 Qtr 7 Qtr 8
OriginalPlan
Actual
RevisedPlan
Safety Improvement Program DeliveryPlanned vs. Actual Number of Projects Advertised2001-2003 Biennium, Quarter 8 Ending June 30, 2003
1990 1995 2000
Traffic Fatality Rates Compared to U.S.All Washington Public Roads and Washington State HighwaysFatalities per 100 Million Vehicle Miles
0.00
0.50
1.00
1.50
2.00
2.50
United States
All WashingtonState Public
Roads
WashingtonStateHighways
Fatal and Disabling Crashes andVehicle Miles Traveled (VMT)Percent Change in Washington State
-50%
-40%
-30%
-20%
-10%
0%
10%
20%
30%
40%
Fatal and Disabling Crashes
Vehicle Miles Traveled
Data Incomplete
1990 1995 2000

6 Transportation Benchmarks Implementation Report Transportation Benchmarks Implementation Report 7
• State by state comparison of shoulder safety belt use. Uses national seat belt statistics to show the rate of use in Washington compared to other states. (September 30, 2002 Gray Notebook)
• State by state comparison of motor vehicle fatalities involving high blood alcohol concentration. Uses national statistics to compare the rate of fatalities involving drunk drivers in Washington and other states. (September 30, 2002 Gray Notebook)
Safety Construction Program DeliveryEach quarterly Gray Notebook explains reasons for deferred and deleted safety construction projects. The excerpt below provides explanations for the department’s safety construction program delivery during the 8th quarter of the 2001-2003 biennium. Eight projects went to ad during that period: one originally scheduled project, five previously de-layed projects, and two additions.
From the revised plan of six scheduled projects for ad in the 8th quarter, four were deferred and one was deleted.
• Three projects were deferred due to design, scoping, right-of-way or environmental issues. The first two projects listed below are being developed jointly with one another.
SR 9, Schloman Road Vicinity to 256th Street E Vicinity, north of Arlington. This project will widen SR 9 to 12-foot lanes and 4-foot shoulders, straighten two curves, and flatten the roadside. The original plan identified limited improvements at various locations within the project limits. However, the decision was made to realign the highway for a more comprehensive safety solution. This generated a need to acquire 45 parcels of land and satisfy all federal regulations. As a result, the ad date is delayed 42 months.
SR 9, 252nd St NE Vicinity, north of Arlington. This project will add left turn lanes at the intersection, along with illumination, guardrail, culvert replacement, and relocation of utility poles. It was combined with the project listed above to coordinate safety improvements to the highway. The ad date is likewise delayed 42 months.
SR 20, Libby Rd Vicinity to Sidney Street Vicinity, north of Coupeville. This project
will straighten curves to increase sight distance, improve three intersections, remove roadside hazards, and control access. Several things contributed to the delay: an inadequate existing right of way plan, delay of a required extensive historical/archaeological survey, environmental requirements when the project switched to federal funds due to a shortage of state funds, negotiations with the National Park Service to mitigate impacts to a recreational site and a wildlife refuge, the requirement to evaluate three design alternatives, and conformance with sole-source aquifer regulations. The ad date is delayed an estimated 35 months.
• One project was deferred due to funding issues.
SR 164, 196th Avenue SE Vicinity to 244th Avenue SE in Enumclaw. This project will flatten shoulders, install guardrail, remove fixed objects from the roadside, and improve the layout of three intersections. At 244th Ave SE, turn lanes will be added, the signal upgraded, and visibility increased. Funding for right-of-way was changed from state to federal, requiring a Biological Assessment before right-of-way activities could begin. The project is delayed 17 months.
• One project was deleted as a result of changing project priorities.
SR 507, Skookumchuck Bridge to Zenkner Valley Road in Centralia. The project would have added turn lanes and widened five intersections on SR 507, increased sight distance, reduced access, and replaced the signal at Reynolds Road. Analysis of accident data showed the benefit/cost ratio was too low to justify further work on the project.
Examples of projects that were moved into the 8th quarter:
SR 2, Fairchild Air Force Base Channelization, west of Spokane. In response to traffic backups on SR 2 due to heightened security at the military base, this project was added. The work includes a new right-turn lane and traffic signal improvements.
SR 531, 11th Ave. NE to 16th Dr. NE Vicinity, west of Arlington. The project increases pedestrian safety by adding curbs, gutters, and sidewalk on the south side of SR 531 in front of Lakewood High School. The project was delayed several months to coordinate with the school district. As a result, right of way donations were given to WSDOT that lowered the project cost significantly.

8 Transportation Benchmarks Implementation Report Transportation Benchmarks Implementation Report 9
Policy Goal 2: Pavement Condition“No interstate highways, state routes, and local arterials shall be in poor condition.”
BackgroundThe BRCT proposed a single pavement condition measurement: pavement roughness, as measured by the International Roughness Index (IRI). The proposed benchmark would apply to three categories of roadways in Washington state: interstate high-ways, major state routes and local arterials. This benchmark appears to have been selected because it is the only nationwide pavement condition measure now in place, as reported by the Federal Highway Administration (FHWA). At this time, WSDOT is only applying this policy goal to the state highway system, not local arterials, due to the lack of avail-able, consistent information about local systems.
Legislation enacted in 2003 requires cities and towns to submit pavement rating information on at least 70 percent of the city and town arterial system to the Transportation Commission, beginning in the 2003-2005 biennium. Future benchmark reports will include this information as it is submitted to the Commission.
Challenges with Proposed BenchmarkA large roadblock to WSDOT adopting the BRCT’s single-measure recommendation is state law, which has required Lowest Life Cycle Cost (LLCC) analysis on pavements since 1993.
LLCC analysis has paid dividends for taxpayers: the state saves money by replacing or repairing pave-ment before it becomes more costly to do so, but not so soon that valuable funds are wasted. As a result, data show clearly that an increasing percentage of WSDOT’s state-owned roadways are in “good” con-dition, while a decreasing percentage of pavements are in “poor” condition.
While the goal for pavement is zero miles in “poor” condition, marginally good pavements may deterio-rate into poor condition during the lag time between assessment and actual rehabilitation. As a result, a small percentage of marginally good pavements will move into the “poor” condition category for any given assessment period.
In addition to LLCC analysis, WSDOT’s Washing-
ton State Pavement Management System (WSPMS) characterizes pavement condition using three independent measures. They are roughness, using the IRI; pavement structural condition (PSC), which measures pavement cracking and patching; and rut-ting (depth of wear in the wheel path of vehicles.) Together, these ratings more accurately measure pavement condition and provide a more sound foun-dation for the management of pavement rehabilita-tion and investment than does roughness alone.
Adopted Pavement Condition BenchmarksIn 2001, nine percent of state-owned pavement was rated in “poor” condition, up from six percent in 2000. This appears to be related to a back-log of “due pavement,” an increase in pavement roughness (IRI), a small increase in rutting for all pavement types, and some deterioration of PSC for
Pavement Condition TrendsPercent of Pavements
0%
20%
40%
60%
80%
100%
1973 1981 1988 1992 1996 2000
Good Condition
Poor Condition
Pavement conditions are grouped into five rating categories. Forthis chart, ÒPoorÓ includes ÒpoorÓ and Òvery poor.Ó ÒGoodÓ includesÒfair,Ó ÒgoodÓ and Òvery good.Ó
0
1000
2000
3000
4000
1997-1999 1999-2001 2003-2005
CompletedTotal Need
Pavement RehabilitationLane Miles
Programmed2001-2003
Pavement Condition Benchmarks

8 Transportation Benchmarks Implementation Report Transportation Benchmarks Implementation Report 9
asphalt and chip seal. (December 31, 2002 Gray Notebook)
In the 2001-2003 biennium, 292 “due” lane miles of pavement were not programmed for rehabili-tation. Using pavement condition measures and the LLCC methodology, WSDOT determines the number of lane miles of pavement due to be rehabilitated each year. Often, funding levels are not sufficient to address all of the “due” pavements. (December 31, 2002 Gray Notebook)
State Pavement Roughness ComparisonFHWA published an annual report entitled High-way Statistics that includes information concerning pavement smoothness in each of the 50 states and the District of Columbia based on roughness (IRI) only. (In contrast, as described above, WSDOT
Pavement Roughness by State — 2001
Rank State
Centerline Miles
Reported
Miles in Poor
Condition
Percent in Poor
Condition1 Georgia 11,297 10 0.1%2 Wyoming 4,417 23 0.5%3 Alabama 7,706 43 0.6%4 Nevada 2,954 32 1.1%5 North Dakota 6,177 90 1.5%6 Kentucky 5,192 90 1.7%7 Florida 10,931 192 1.8%8 Minnesota 11,673 238 2.0%9 Kansas 8,830 217 2.5%10 Montana 6,925 177 2.6%11 Maine 2,390 66 2.8%12 Idaho 3,842 107 2.8%13 South Carolina 6,768 195 2.9%14 Arizona 3,875 127 3.3%15 Tennessee 7,717 258 3.3%16 Oregon 6,291 240 3.8%17 Washington 5,396 211 3.9%18 Indiana 6,360 270 4.2%19 Ohio 9,012 423 4.7%20 New Hampshire 1,384 66 4.8%21 Virginia 7,421 364 4.9%22 Mississippi 7,147 359 5.0%23 Utah 3,624 225 6.2%24 New Mexico 5,192 323 6.2%25 Texas 25,379 1,628 6.4%
Median 6.7%26 Illinois 12,320 850 6.9%27 West Virginia 3,377 246 7.3%28 Colorado 7,948 661 8.3%29 Delaware 503 44 8.7%30 Wisconsin 10,597 957 9.0%
49 California 20,416 5,338 26.1%50 Massachusetts 3,298 998 30.3%
Source: Highway Statistics 2001, U.S. Department of Transportation.
measures pavement performance using three rat-ings: pavement structural condition, rutting, and roughness.) The tables below provide a snapshot of the state rankings. The total miles reported includes the interstate system and principal arteri-als owned by the state, cities, and counties, and a sampling of other functional classes.
Washington state was ranked 17th in 2001 in smooth roads, down from 10th in 2000. The change reflects an increase of 80 miles of the total pavement rated as “rough.” (December 31, 2002 Gray Notebook)
Pavement Roughness by State — 2000
Rank State
Centerline Miles
Reported
Miles in Poor
Condition
Percent in Poor
Condition1 Georgia 11,554 7 0.1%2 Alabama 7,721 34 0.4%3 Kansas 8,655 102 1.2%4 Minnesota 11,582 150 1.3%5 North Dakota 6,179 95 1.5%6 Florida 10,398 176 1.7%7 Wyoming 4,413 78 1.8%8 Utah 3,752 80 2.1%9 Arizona 3,861 83 2.1%10 Washington 5,368 131 2.4%11 Kentucky 5,156 130 2.5%12 Idaho 3,839 114 3.0%13 Nevada 2,924 89 3.0%14 Montana 6,968 219 3.1%15 Tennessee 7,250 269 3.7%16 Maine 2,397 89 3.7%17 South Carolina 6,723 268 4.0%18 Alaska 1,715 74 4.3%19 Ohio 9,001 407 4.5%20 Mississippi 7,079 348 4.9%21 Indiana 6,354 339 5.3%22 Colorado 7,926 448 5.7%23 Virginia 7,446 464 6.2%24 Oregon 6,249 407 6.5%25 Texas 25,075 1,762 7.0%
Median 7.4%26 New Hampshire 1,379 106 7.7%27 West Virginia 3,375 265 7.9%28 Maryland 2,777 247 8.9%29 Delaware 505 46 9.1%30 Illinois 12,265 1,202 9.8%
49 Massachusetts 3,294 990 30.1%50 New Jersey 2,883 925 32.1%
Source: Highway Statistics 2000, U.S. Department of Transportation.

10 Transportation Benchmarks Implementation Report Transportation Benchmarks Implementation Report 11
Policy Goal 3: Bridge Condition“No bridges shall be structurally deficient and safety retrofits shall be performed on those state bridges at the highest seismic risk levels.”
3a. Structurally Deficient BridgesThe BRCT Benchmark Committee set a target that zero percent of bridges should be structur-ally deficient, based on data provided to FHWA by WSDOT.
All publicly owned bridges are inspected and rated in accordance with the FHWA Recording and Coding guide for the Structural Inventory and Appraisal of the Nation’s Bridges (also called Na-tional Bridge Inspection, or NBI). The inspections are typically performed at two-year intervals, with some newer bridges having FHWA approval for a four-year inspection cycle.
To standardize the inspection results, FHWA uses a Sufficiency Rating (SR) and a status flag indicating whether a bridge is Structurally Deficient (SD) or Functionally Obsolete (FO). The ratings are used to help determine federal bridge rehabilitation and re-placement funding levels to the states. The adopted benchmark addresses only the SD rating and not the FO rating.
The SD condition categories are superstructure (structure above substructure), deck (driving sur-face), and substructure (structure supporting the bridge deck). A bridge is considered SD if any of these conditions rate at “4” (poor condition) or lower. The SD appraisal categories are structural adequacy (how much weight the bridge can carry) and waterway adequacy (is the bridge high and wide enough). A bridge is considered SD if either of these appraisal categories rate at “2” (very substandard).
Data collected by FHWA shows that Washington ranked 6th nationally in 2002 with 6.3 percent of the state’s 7,624 reported bridges rated SD, com-pared to a national total of 13.8 percent. See the table at right. The data includes both state and local bridges. This information is provided for informational purposes only, because WSDOT has not implemented the SD benchmark, for reasons detailed on the next page.
Structurally Deficient Bridges by State — 2002Number of
Bridges Reported
Number of SD Bridges State
Percent SD Rank
Arizona 7,055 187 2.7% 1Florida 11,376 302 2.7% 2Nevada 1,562 68 4.4% 3Delaware 835 51 6.1% 4Texas 48,202 2,978 6.2% 5Washington 7,624 479 6.3% 6Oregon 7,352 474 6.4% 7Colorado 8,105 597 7.4% 8Idaho 4,090 321 7.8% 9Connecticut 4,173 342 8.2% 10Maryland 4,950 429 8.7% 11Kentucky 13,461 1,170 8.7% 12Tennessee 19,467 1,707 8.8% 13Virginia 12,932 1,175 9.1% 14Utah 2,781 253 9.1% 15Minnesota 12,845 1,208 9.4% 16New Mexico 3,800 379 10.0% 17Illinois 25,610 2,609 10.2% 18Georgia 14,456 1,475 10.2% 19Montana 4,986 557 11.2% 20Arkansas 12,438 1,399 11.2% 21California 23,754 2,757 11.6% 22Ohio 27,988 3,273 11.7% 23Indiana 18,087 2,197 12.1% 24Alaska 1,437 176 12.2% 25Median 12.4%Wisconsin 13,563 1,713 12.6% 26New York 17,389 2,252 13.0% 27Massachusetts 4,925 645 13.1% 28Kansas 25,618 3,453 13.5% 29South Carolina 9,091 1,234 13.6% 30Wyoming 3,077 432 14.0% 31New Jersey 6,375 906 14.2% 32North Carolina 17,116 2,465 14.4% 33Maine 2,363 348 14.7% 34Hawaii 1,089 171 15.7% 35New Hampshire 2,355 374 15.9% 36West Virginia 6,821 1,125 16.5% 37Nebraska 15,462 2,570 16.6% 38Alabama 15,697 2,611 16.6% 39Vermont 2,716 461 17.0% 40Louisiana 13,399 2,321 17.3% 41Michigan 10,799 1,990 18.4% 42South Dakota 5,979 1,106 18.5% 43North Dakota 4,517 859 19.0% 44Iowa 24,955 5,069 20.3% 45Mississippi 16,809 3,652 21.7% 46Missouri 23,495 5,479 23.3% 47Pennsylvania 22,153 5,484 24.8% 48Rhode Island 749 187 25.0% 49Oklahoma 22,989 7,684 33.4% 50Total 588,867 81,154 13.8%Source: FHWA

10 Transportation Benchmarks Implementation Report Transportation Benchmarks Implementation Report 11
Challenges with Proposed BenchmarkWSDOT does not support a count of Structurally Deficient bridges as a benchmark because it would be a reactive measure based solely upon post-in-spection findings. This approach also does not mea-sure important cost-effective preservation activities, including the question of the varying importance of different bridges to Washington’s overall trans-portation infrastructure. While the SD status flag is useful as a standardized, consistent measure among states, a goal of zero SD bridges is inappropriate.
Indeed, the SD categorization was developed as part of a federal funding formula implicitly recognizing that all states will always present a naturally evolv-ing inventory of SD bridges; to have no SD bridges would confound the operation of the formula and subsequently disadvantage a state in the federal funding process.
WSDOT has for years used the Bridge Manage-ment System (BMS) to determine its work plan. WSDOT’s BMS is the result of work by the National Cooperative Highway Research Program, FHWA and the states collectively over the past 15 years. It considers the cost-effectiveness of several feasible corrective actions for any given bridge deficiency and provides cost-effective indices for each potential action in various time periods. Some examples include: bridge replacement and rehabili-tation, seismic retrofit, bridge deck rehabilitation, steel bridge painting, repair or upgrade of me-chanical and electrical operation systems, accident damage repair, and scour prevention work that is performed to prevent foundation support problems rather than repair accumulated damage.
If WSDOT set aside the BMS program basis for pre-serving bridges to get optimum service life in favor of a “zero deficient bridge” approach, it would cost about $600 million, or roughly seven years at cur-rent Preservation program funding levels. This could not be achieved without negative impacts, however:
1. A focus on eliminating SD bridges and bridge elements would promote doing the cheapest, fastest “fix.”
2. This would eat up all of WSDOT’s bridge preservation funding. Ultimately, this would be a counter-productive strategy from a cost-effective perspective, as well as from a political
and public perspective regarding both efficient use of funds and making bridges safe against natural catastrophes.
3. During such a seven-year hiatus from BMS practices, normal bridge aging and deterioration, exacerbated by impacts of having discontinued preservation type work, would result in more bridges becoming structurally deficient.
WSDOT argues, therefore, that the SD benchmark for the state’s bridge program be set aside for a goal related to BMS performance goals. WSDOT currently measures the delivery of several elements of BMS. This direction supports the intent of this policy goal to keep bridges in optimal condition.
3b. Seismic RetrofitThis benchmark is based on WSDOT’s Bridge Seismic Retrofit Program that was approved by the legislature in 1991. The purpose of the program is to minimize and avoid catastrophic bridge failures by retrofitting bridges and structures identified by seismic risk level. WSDOT prioritizes state bridges for seismic retrofit and tracks the status of its retrofit program. WSDOT fully supports the use of this benchmark.
Bridge Condition BenchmarksWSDOT currently has three benchmarks of its own performance that support the intent of this policy goal to track state bridge condition: delivery of steel bridge painting projects, deck protection proj-ects, and seismic retrofit projects. These primarily track progress toward planned projects in the bien-nial budget. Development of additional measures will support annual assessment of bridge condition trends as determined by WSDOT’s BMS.
During the 2001-2003 biennium, 13 bridge deck protection projects were advertised, compared to a plan of 15 advertisements (an 86.7 percent delivery rate). From 1980 through August 2003, WSDOT has taken deck protection action on 1,802 bridges.
During the 2001-2003 biennium, 24 steel bridge painting projects were advertised, compared to a plan of 23 advertisements (a 104.3 percent delivery rate).

12 Transportation Benchmarks Implementation Report Transportation Benchmarks Implementation Report 13
Qtr 1 Qtr 2 Qtr 3 Qtr 4 Qtr 5 Qtr 6 Qtr 7 Qtr 80
5
10
15
20
2001-2003 Deck Protection ProjectsPlanned vs. Actual Number of Projects Advertised2001-2003 Biennium
Actual
Planned
Qtr 1 Qtr 2 Qtr 3 Qtr 4 Qtr 5 Qtr 6 Qtr 7 Qtr 80
5
10
15
20
25
Planned
Actual
2001-2003 Bridge Painting ProjectsPlanned vs. Actual Number of Projects Advertised2001-2003 Biennium
Deck Program Overview
OverlayRequired:35 Bridges
ReplaceProtectiveOverlays:16 Bridges
Monitor:943 Bridges
Protective actiontaken since 1980:
1,802 Bridges
Qtr 1 Qtr 2 Qtr 3 Qtr 4 Qtr 5 Qtr 6 Qtr 7 Qtr 80
5
10
15
20
25
Actual
Planned
Bridge Seismic Retrofit ProgramPlanned vs. Actual Number of Projects Advertised2001-2003 Biennium
Qtr 1 Qtr 2 Qtr 3 Qtr 4 Qtr 5 Qtr 6 Qtr 7 Qtr 80
5
10
15
20
2001-2003 Deck Protection ProjectsPlanned vs. Actual Number of Projects Advertised2001-2003 Biennium
Actual
Planned
Qtr 1 Qtr 2 Qtr 3 Qtr 4 Qtr 5 Qtr 6 Qtr 7 Qtr 80
5
10
15
20
25
Planned
Actual
2001-2003 Bridge Painting ProjectsPlanned vs. Actual Number of Projects Advertised2001-2003 Biennium
Bridge Condition BenchmarksDuring the 2001-2003 biennium, 24 bridge seismic retrofit projects were advertised, compared to a plan of 22 advertisements (a 109.1 percent delivery rate). From 1980 to end of June 2003, WSDOT has completed 441 full or partial seismic retrofit projects to meet current national standards. An ad-ditional 920 retrofits await programming. Retrofit priorities are based on seismic risk of a site, struc-tural detail deficiencies, and route importance.

12 Transportation Benchmarks Implementation Report Transportation Benchmarks Implementation Report 13
Policy Goal 4: Traffic Congestion“Traffic congestion on urban state highways shall be significantly reduced and no worse than the national mean.”
BackgroundThis policy goal, developed by BRCT, was strongly influenced by a mathematical computation of con-gestion performed by Professor David T. Hartgen at the University of North Carolina.
A table generated by Professor Hartgen from data elements judged by him to be helpful, showed for 1999 that 46.39 percent of urban interstate high-ways in Washington were congested, in relation to a national mean of 40.15 percent. This ranked Washington as the 37th least congested state (14th worst congested state). The next year’s table from Professor Hartgen showed that only 18.25 percent of Washington’s urban interstate highways were con-gested, compared to a national mean of 40.13 per-cent. Washington, according to Professor Hartgen, ranked in 2000 as the 14th least congested state (37th worst congested state). The year 2000 is the last year for which data from Hartgen is available.
Problems with the BenchmarkThis dramatic fluctuation in Washington’s ranking over a one-year period under Professor Hartgen’s analysis suggests that the methodology and measure-ment approach is flawed. WSDOT does not believe that congestion dropped that drastically from 1999 to 2000 against national means. A poor benchmark will lead to bad policy choices. Accordingly, Professor Hartgen’s numbers should not be relied upon at this time as a reliable congestion benchmark or as a basis of comparison to other states. The lag in analytic results is also a problem for a benchmark intended to be used to demonstrate results or shape policies.
Benchmark DevelopmentWSDOT has made significant progress in recent months in developing a congestion measurement and benchmarking approach that will address legis-lative intent and also avoid some of the pitfalls il-lustrated in the Hartgen example above. WSDOT’s congestion measurement approach, agreed on by
the Transportation Commission’s Benchmark Com-mittee, is based on the following principles:
• Use real-time measurements (rather than computer models) whenever possible.
• Measure congestion due to incidents as distinct from congestion due to inadequate capacity.
• Show whether reducing congestion from incidents will improve travel time reliability.
• Demonstrate both long-term trends and short-to-intermediate term results.
• Communication about possible congestion fixes using an “apples-to-apples” comparison with the current situation (for example, if the trip takes 20 minutes today, how many minutes shorter will it be if we improve the interchanges?)
• Use plain English to describe measurements.WSDOT is concentrating particularly on reporting the effectiveness of congestion relief programs in support of travel time reliability and system efficien-cy. A significant portion of congestion, and therefore travel time reliability, is affected by unpredictable highway incidents combined with related response and clearance activities. WSDOT’s new approach focuses on measuring efficiency, reliability, and progress that the public can see and experience in the short and immediate term. The congestion measure-ments presented here will continue to be refined and updated with new information and analysis.
A limitation to this new direction is the lack of comparative information with other urban areas. However, several research programs, including FHWA’s Mobility Monitoring Program, are focused on using real-time measurements to measure travel time reliability and make distinctions between differ-ent causes of congestion. As these programs grow to include more urban areas, comparisons will be possible.
Real-Time Travel Time MeasurementsOne of the first elements of WSDOT’s new con-gestion measurement approach was the roll-out on May 15, 2002, of a new web site report of real-time travel times at www.wsdot.wa.gov/

14 Transportation Benchmarks Implementation Report Transportation Benchmarks Implementation Report 15
pugetsoundtraffic/traveltimes. These active travel times are updated every five minutes in order to provide travelers with up-to-the-minute informa-tion for some of the most congested corridors in the Puget Sound region. The site lists two measures for both directions of 11 commute routes:
• Average travel time is the average estimated travel time for a trip starting at the time the site is accessed during several preceding months. Each day of the week is calculated separately.
• Current travel time is the real time it would take to travel under the conditions reported within the last 5 minutes of the time the site is accessed.
Data is collected using the in-pavement loop de-tectors on freeways and arterial roadways. Loop detectors are the mainstay of the operation of traffic signals and freeway management system. Several Puget Sound area newspapers, television, and radio stations now include the travel time information on their web sites, linking directly to WSDOT servers.
Incident Related and Non-Incident Related Travel TimesWSDOT must track progress in reducing conges-
tion and delay caused by traffic accidents and other incidents. WSDOT must also measure the proposed and actual effects of capacity improve-ments in reducing congestion and delay. Using a still-experimental approach, WSDOT has analyzed archived data for the years 2001 and 2002 from its loop detector system for selected commute routes, at both morning and afternoon peak times. Where trips take more than twice as long as free flow travel, travel times may be highly correlated with incident-induced congestion. (WSDOT contin-ues to test and refine this analytic hypothesis, and may in fact propose changes and improvements in analytic technique.) Using this analytical thresh-old of two times free flow, WSDOT has derived measures of average travel times with and without incidents and published the information on its web site. Goals have not yet been established. Changes in the incident related travel time will help deter-mine the effectiveness of efforts to cut down on incident related congestion. Changes in the non-incident related travel time will help measure the effects of operational and capacity improvements and in setting future performance targets. This
2001 & 2002 Peak Travel Times – Highlighted ImprovementsAverage PeakTravel Time
Number of Days When Peak TravelTimes Exceeded 2 X Freeflow *95% Reliable Travel Time
Route Route Description Miles 2001 2002 Change 2001 2002 Change 2001 2002 ChangeI-5 SeaTac to Seattle (AM) 13 24 min. 23 min. -1 min. 84 44 -16% 31 min. 28 min. -3 min.
I-405 Tukwila to Bellevue (AM 13.5 31 min. 30 min. -1 min. 198 178 -10% 43 min. 41 min. -2 min.I-405 Bothell to Bellevue (AM) 9.7 20 min. 19 min. -1 min. 142 127 -7% 27 min. 26 min. -1 min.
SR-167 Renton to Auburn (PM) 9.8 22 min. 19 min. -3 min. 133 92 -18% 39 min. 37 min. -2 min.
Congestion BenchmarksFor the first quarter of calendar year 2003, the number of over 90-minute incidents averaged 63 incidents per month. This data is part of the baseline for the expanded Incident Response program that began in July 2002.
WSDOT has published a table comparing travel time measures for 2002 and 2001 on 11 commute routes in the Puget Sound region. The table is available at www.wsdot.wa.gov/accountability/peaktime/Travel_Time_Summary_2001-2002.pdf. Highlighted improvements (despite almost no change in traffic volumes) are shown in the table below. Goals are not yet established but this information will be the basis for a travel time benchmark. (March 31, 2003 Gray Notebook)

14 Transportation Benchmarks Implementation Report Transportation Benchmarks Implementation Report 15
information is published on the WSDOT website at www.wsdot.wa.gov/accountability/peaktime/reliabletimes.htm.
Travel Time ReliabilityFor each of 11 commute routes in the Puget Sound region route at peak traffic, WSDOT has com-puted the 95 percent reliable travel time from 2002 data. This measure tells commuters that if they begin the route at the peak time, they can expect to arrive at their destination on time in 95 percent of trips if they allow for the 95 percent reliable time. No goal has been established, but changes in this measure should tell travelers, as time goes on, whether efforts to address congestion conditions are making their lives easier in getting where they want to go, when they expect to get there. WSDOT recently launched a web site at www.wsdot.wa.gov/pugetsoundtraffic/traveltimes/reliability where com-muters can calculate the 95 percent reliable time for both directions of the 11 commute routes in five-minute increments from 6 a.m. to 7 p.m.
Incident ResponseWSDOT and the Washington State Patrol (WSP) in 2002 adopted a joint performance goal: “WSDOT and WSP will collaborate to respond to incidents and coordinate all public and private resources in this effort to work toward clearing incidents within 90 minutes.” WSDOT measures the number of incidents with clearance times over 90 minutes and reports this and other incident information in its Gray Notebook reports. Beginning in July 2002, the larger number of response units in WSDOT’s
Average Clearance Time for Incidents LastingOver 90 Minutes(in Minutes) 2001 to 2003
Jul Aug Sep Oct Nov Dec Jan Feb Mar Apr May Jun0
50
100
150
200
250
300
July 2001 to June 2002
July 2002 to June 2003
expanded IR program caused incident clearance times to improve dramatically, as seen in the chart below. These new, improved clearance times are being used as a baseline to measure the effects of its expanded Incident Response program in clear-ing all incidents.

16 Transportation Benchmarks Implementation Report Transportation Benchmarks Implementation Report 17
Policy Goal 5: Driver Delay“Delay per driver shall be significantly reduced to no worse than the national mean.”
BackgroundThis measure was apparently based on Texas Transportation Institute’s (TTI) Urban Mobility Re-port. BRCT refers to the TTI study that provided a congestion ranking of 68 major urban areas by an-nual hours of delay per driver. TTI ceased report-ing delay per driver in 1999 and there is no longer a data source that computes delay per driver. Now TTI has switched from delay per driver to delay per person. The measurement uses volume and lane data in mathematical models in order to estimate traffic speeds. These estimated speeds are then compared to “free flow” speeds and the differences are used to compute measures of delay. According to the 2002 Urban Mobility Report, which sampled 75 metropolitan areas using year 2000 data:
• Spokane has 5 annual hours of delay per person, less than the national average of 7 hours for small urban areas in the measurement sample.
• Tacoma has 14 annual hours of delay per person, equal to the national average of 14 hours for medium urban areas.
• Portland-Vancouver has 23 annual hours of delay per person, slightly more than the national average of 22 hours for large urban areas.
• Seattle-Everett has 34 annual hours of delay per person, compared to the national average of 22 hours for large urban areas.
According to this benchmark, as calculated by TTI, delay per person in three out of four Wash-ington urban areas is close to the national mean for each size category. However, as discussed below, WSDOT believes that this measure gives little use-ful information about congestion, or the effective-ness of policies to manage it. The measure does not help set a high, achievable goal for Washington.
Challenges with Proposed BenchmarkThis measure as available to the BRCT represents
an inadequate measure of congestion. Among other things, it does not take into account incident-related (non-recurring) congestion (see page 14). Incident-related congestion contributes signifi-cantly to daily delays and a meaningful measure-ment needs to be able to assess both recurring and non-recurring congestion. A recent publication from TTI’s Mobility Monitoring Program acknowl-edges this shortcoming. “Incident management activities and other operational improvements have a beneficial effect that is not captured in the Urban Mobility Study procedures.” (Tim Lomax and Richard Margiotta, Monitoring Urban Roadways in 2000: Using Archived Operations Data for Reli-ability and Mobility Measurement, TTI, page 18). In fact, TTI has requested WSDOT and other states to work with it in developing significant improve-ments and new direction to a measurement that many believe is obsolete.
TTI’s next Urban Mobility Report is due in fall 2003.
Benchmark DevelopmentSee the discussion about the traffic congestion poli-cy goal on page 13 for information about WSDOT’s work in developing congestion benchmarks.
For the driver delay policy goal, WSDOT has previously published measures that do not meet the need to evaluate congestion strategies. These mea-sures are listed below for illustrative purposes only.
Published WSDOT Measures• Daily vehicle hours of delay per mile between
1993 and 1999 for urban interstates, urban non-interstates, and rural highways. (June 30, 2001 Gray Notebook)
• Five popular commutes measured by travel rate index, daily vehicle hours of delay per mile, and daily VMT. (June 30, 2001 Gray Notebook)
• Distribution of delay on urban interstates and urban non-interstates by time of day. (June 30, 2001 Gray Notebook)

16 Transportation Benchmarks Implementation Report Transportation Benchmarks Implementation Report 17
Policy Goal 6: Per Capita Vehicle Miles Traveled“Per capita VMT shall be maintained at 2000 levels.”
BackgroundThe BRCT Benchmark Committee recognized that trends in population, economy, land use, and employment, as well as investments in the trans-portation system, all influence changes in Vehicle Miles Traveled (VMT). While changes in VMT per capita are critical to the ultimate success of the transportation system, linking these changes to their underlying causes is problematic at best. Even those changes associated with transportation investments are difficult to adequately link back to state, regional, or local investments.
If the intent of this benchmark is to measure the availability of alternative modes, or an increased use of alternative modes, other additional measures should be developed and used to more fully and accurately track this benchmark’s intent. These measures could include the availability of or state support of alternative modes and/or use of transit, transportation demand management, park and ride lots, or CTR programs. WSDOT’s implementation response to Benchmark 7 contains some of this type of information. (See page 18.)
Per capita VMT BenchmarkIn 2000, the state’s citizens reportedly traveled 9,133 vehicle miles per person on all roadways. Per capita driving mileage dipped below the 2000 level in 2001 to 8,982 miles per person, then rose slightly to 9,066 miles per person in 2002. In the last twenty years, VMT has grown faster than the population (Washington’s population has grown
*How VMT is CalculatedStatewide VMT is based on sample data gathered and reported for the Highway Performance Monitoring System (HPMS).VMT is estimated for the non-sampled mileage. In 1991, new federal legislation required a complete system inventory as the Federal Aid highway system changed and the National Highway System (NHS) was created. At the same time, HPMS data reporting increased to include all principal arterials and NHS routes. This additional data allowed actual calculations on mileage that had been estimated in previous years.For 1993, the first reporting year for HPMS which reflected the system re-inventory and NHS, the VMT was more accurate than had been possible in the past. Current annual VMT calculations are based on more actual data than was available before 1993, since the calculations now include the total principal arterial mileage and NHS mileage.
0
6,000
7,000
8,000
9,000
10,000
1985 1990 1995
Washington State Travel GrowthAnnual Vehicle Miles Traveled per Capita, 1985 to 2002*
* Vehicle miles traveled for 1993 and later years reflects a change inVMT data calculation, accounting for the drop from 1992 to 1993.
2002
Benchmark
Per Capita VMT Benchmark
about 40 percent, while VMT has grown 60 per-cent). However, since the late 1980s, VMT per capita in Washington state has maintained 9,000 miles per person per year (the apparent drop from 1992 to 1993 is actually due to a change in the way VMT is calculated)*.
Washington has less vehicle travel per capita than most other states, ranking 41st highest in 2001. (March 31, 2003 Gray Notebook)

18 Transportation Benchmarks Implementation Report Transportation Benchmarks Implementation Report 19
Policy Goal 7: Non-Auto Share of Commute Trips“The non-auto share of commuter trips shall be increased in urban areas.”
measure is based on the census, so new data is only available every 10 years – useful for tracking long-term trends but an inadequate indicator of short-term performance. (September 30, 2002 Gray Notebook) The next iteration of this benchmark will show mode share results for the state’s urban areas.
Other Relevant MeasuresWashington law requires employers with more than 100 employees, located in nine Washington coun-ties, to participate in a program to decrease energy consumption, improve air quality, and reduce traf-fic congestion by reducing commute trips.
At work sites required to engage in CTR in the City of Seattle, the drive-alone rate was reduced from 49 percent in 1993 to 42 percent in 2001, according to employee surveys. At these CTR work sites, car- and vanpooling remained constant while transit use increased. Changes in mode share were even more pronounced in Seattle’s Central Business District. (December 31, 2001 Gray Notebook)
Other published CTR measures include:
• Number of operating public vanpools in the Puget Sound Region by month. (March 31, 2003 Gray Notebook)
• Percent of capacity used for 32 WSDOT-owned or partnership lots in King County by quarter. (March 31, 2003 Gray Notebook)
BackgroundThe BRCT Benchmark Committee was interested in benchmarking the availability of modal options to individuals using the transportation system. The goal was to “develop a target that would move toward in-creased use of modes other than the single-occupant vehicle and reduce the reliance on roadway capac-ity as a solution to growing transportation demand” (Benchmark Committee Final Report, 2000).
WSDOT interprets this benchmark as a measure of the aggregate ability of many different transporta-tion agencies in providing alternatives to single-oc-cupancy-vehicle (SOV) commuting.
The relative success of WSDOT and others (transit, employers, local jurisdictions) in promoting travel options is captured in the U.S. Census Journey-to-Work surveys related to commuting patterns in Washington.
Non-Auto Share BenchmarkAccording to the U.S. Census, from 1990 to 2000 the state’s drive-alone share of commuting trips decreased from 73.9 percent to 73.3 percent. Oregon was the only other state in the country to see a decrease in the drive-alone rate. As seen in the table below, com-muting rates for carpooling and public transportation both increased in Washington during the decade. This
Washington State Commuting PatternsWorkers 16 and Over, 1990 and 2000 1990 Census 2000 Census Change 1990 to 2000 Commute Mode Number Percent Number Percent Number PercentDrive Alone 1,700,872 73.9 2,040,833 73.3 339,961 20.0Carpool 282,240 12.3 357,742 12.8 75,502 26.8Public Transportation 104,403 4.5 136,278 4.9 31,875 30.5Motorcycle 7,985 0.3 4,353 0.2 - 3,632 - 45.5Bicycle 13,170 0.6 16,205 0.6 3,035 23.0Walked 91,475 4.0 89,739 3.2 - 1,736 - 1.9Other means 16,144 0.7 19,499 0.7 3,355 20.8Worked at Home 86,377 3.8 120,830 4.3 34,453 39.9Total Commuters 2,302,666 100.0 2,785,479 100.0 482,813 21.0
Source: U.S. Census Bureau

18 Transportation Benchmarks Implementation Report Transportation Benchmarks Implementation Report 19
Policy Goal 8: Administrative Efficiency“Administrative cost as a percentage of transportation spending shall achieve the most efficient quartile nationally.”
BackgroundMaking comparisons of administrative efficiency among state departments of transportation is diffi-cult, because, as the BRCT found, “every transporta-tion agency and government entity has slightly dif-ferent methods of categorizing, accounting for, and tracking expenditures, … finding common ground for comparisons [is] extremely difficult” (BRCT Benchmark Committee Final Report, page 12).
The best national source of financial information is the Federal Highway Administration’s (FHWA) annual Highway Statistics report, a compilation of revenue, expenditure, and allocation reporting from all 50 states. The report includes a line item for each state’s general administration and miscel-laneous expenditures, as well as expenditures for planning and research, capital outlay, maintenance, operations, enforcement, etc.
The BRCT Benchmark Committee used this FHWA data, compiled into a “performance report” and interpreted by Professor David T. Hartgen of the University of North Carolina, to compare the 50 states’ spending patterns. The committee used Hartgen’s definition of administrative spending (ad-ministration, research, and planning) for its com-parison, noting that Washington’s “administrative costs” have ranged between the third and fourth quartile nationally, according to Professor Hartgen.
Benchmark DevelopmentTo find some way to determine national consisten-cy, WSDOT focused on the instructions contained in FHWA’s A Guide to Reporting Highway Statis-tics and its requirements for reporting. Building on the work of the BRCT, a comparison of the pro-grams categorized as administrative was made with the Item A.4.a. General administration and engi-neering criteria. Based on FHWA reporting criteria, the costs of WSDOT’s Program T – Transportation Planning, Data and Research were excluded from the administrative category and instead, placed
under FHWA Item A.4.b. Highway planning and research.
The remaining programs from the BRCT adminis-trative classification were then reviewed for align-ment with the FHWA criteria:
• Program D – Highway Management and Facilities
• Program S – Transportation Management and Support
• Program U – Charges from Other AgenciesWhile the total of these programs generally relate to the A.4.a. criteria, some program costs are more properly attributed to categories other than admin-istration. WSDOT has found, for example, that it reports more in FHWA’s general administration and miscellaneous expenditures category than other states. For example, some states allocate a portion of such costs to specific projects, and others report miscellaneous non-DOT expenses as non-trans-portation costs. Disparities in practice can distort state-by-state rankings.
Hartgen’s method compares administrative costs to total state transportation spending, including in the denominator activities such as law enforcement, traffic safety, interest payments, and bond retire-ment. In states like Washington, however, where the Washington State Patrol is the primary spender on law enforcement, the denominator ceases to support “apples to apples” comparison of state departments of transportation. A more consistent denominator is the total of each state’s transportation capital outlay, maintenance, and operations expenditures, as these are closer to the core functions of a state department of transportation.
Comparison ConsiderationsA number of variables affect administrative cost reporting from year to year. Increases or decreases in the size of the WSDOT construction program will affect the percentage of administrative costs compared to total agency expense. In addition, the

20 Transportation Benchmarks Implementation Report Transportation Benchmarks Implementation Report 21
costs of services provided by other state agencies have been on the increase in recent years. Self-in-surance costs continue to increase dramatically, for example. Most of these services are mandatory and beyond WSDOT’s control.
In addition, the administrative costs of other Washington transportation agencies, including the Transportation Improvement Board, the County Road Administration Board, and the Department of Licensing, were included in the A.4.a. amount reported to FHWA in past years. For fiscal year 2002 reporting, some of these costs will be moved to another section of the report (A.9), as allowed by FHWA, and some will remain in A.4.a. The alloca-tion of these costs also affects Washington’s ranking.
Administrative Efficiency Benchmark
National ComparisonUsing general administration cost (A.4.a.) as per-centage of capital outlay, maintenance, and opera-tions expenditures (rather than Hartgen’s use of A.4. out of total expenditures reported to FHWA), WSDOT is showing progress toward meeting the first quartile target. As seen in the 2000 and 2001 National Administrative Cost Comparison tables on the next page, and the Washington Administra-tive Cost Target chart below, the agency has moved from the top of the fourth quartile for 1999 report-ing to the middle of the second quartile for the
Source: WSDOT analysis of FHWA data.
0%
5%
10%
15%
20%
25%
1999 2000 2001
Washington Administrative Cost TargetPercent of Capital Outlay, Maintenance, and Operations Expenditures, 1999-2001
Washington
Highest State
Quartile 1
Lowest State
2001 report, at 6.8 percent. While FHWA cautions strongly against using these numbers to compare states, all state departments of transportation complete the report annually, and it is the only na-tional report source found for administrative costs. (March 31, 2003 Gray Notebook) FHWA data for 2002 will be available after November 2003.
Internal Administrative BenchmarkAfter making the changes described above, WSDOT’s definition of administrative costs now more closely reflect the FHWA “standard” and what other states report. Washington’s report to FHWA for 2002 will incorporate this revised definition of administrative costs for use as an external benchmark. WSDOT’s internal bench-mark for administrative costs is slightly different, due to the differences between the FHWA report, which includes other agencies and only certain costs, and WSDOT’s own accounting practices that include all agency expenditures. WSDOT’s internal measurement compares administrative cost with total agency expenditures, rather than with capital outlay, maintenance, and operations for the FHWA definition. For fiscal year 2002, this alloca-tion comes out to 3.8 percent — $59,862,950 of the agency’s total expenditures of $1,568,546,491. As the first administrative cost measurement using the new criteria, the FY 2002 percentage is a baseline to be compared with future years. (March 31, 2003 Gray Notebook)

20 Transportation Benchmarks Implementation Report Transportation Benchmarks Implementation Report 21
2001 National Administrative Cost Comparison
Admin.State Percent Rank Colorado 2.1% 1Arkansas 2.2% 2Indiana 2.4% 3Wyoming 2.7% 4New Mexico 2.8% 5Kentucky 3.0% 6Missouri 3.2% 7Pennsylvania 3.9% 8Maine 4.2% 9Maryland 4.5% 10West Virginia 4.6% 11Florida 4.8% 12Iowa 5.1% 13Alabama 5.2% 14Georgia 5.6% 15Michigan 5.6% 16Virginia 5.9% 17Alaska 6.5% 18Idaho 6.6% 19New York 6.7% 20Washington 6.8% 21New Hampshire 6.8% 22Illinois 6.9% 23North Carolina 6.9% 24Kansas 7.0% 25Median 7.2%Texas 7.5% 26Vermont 7.5% 27Mississippi 8.2% 28Massachusetts 8.3% 29Oklahoma 8.3% 30Nevada 8.6% 31Minnesota 8.8% 32South Carolina 8.9% 33Oregon 9.1% 34Utah 9.1% 35South Dakota 9.2% 36Delaware 9.5% 37Rhode Island 9.8% 38Nebraska 9.9% 39Tennessee 10.3% 40Ohio 10.6% 41Wisconsin 11.6% 42Connecticut 11.8% 43New Jersey 12.2% 44California 13.0% 45Montana 13.8% 46Arizona 16.0% 47North Dakota 16.6% 48Louisiana 23.4% 49Hawaii 23.8% 50
2000 National Administrative Cost Comparison
Admin.State Percent Rank Arkansas 2.6% 1Colorado 3.0% 2Maryland 3.0% 3Nebraska 3.0% 4Missouri 3.1% 5Pennsylvania 3.2% 6Wyoming 3.5% 7Maine 3.8% 8Florida 4.0% 9West Virginia 4.1% 10Iowa 4.1% 11South Dakota 5.2% 12Michigan 5.2% 13Alaska 5.4% 14Georgia 5.6% 15Indiana 5.7% 16North Carolina 6.1% 17Idaho 6.3% 18New York 6.5% 19Mississippi 6.6% 20Illinois 6.9% 21Oklahoma 7.0% 22Vermont 7.1% 23Massachusetts 7.2% 24Utah 7.4% 25Median 7.5%Texas 7.5% 26Nevada 7.7% 27South Carolina 7.7% 28Minnesota 7.9% 29Ohio 8.0% 30Kansas 8.1% 31Rhode Island 8.3% 32Washington 8.4% 33Virginia 8.7% 34Montana 9.7% 35New Jersey 10.0% 36Alabama 10.2% 37Tennessee 10.2% 38Arizona 10.7% 39Wisconsin 11.0% 40Connecticut 11.2% 41Kentucky 11.5% 42New Hampshire 11.7% 43New Mexico 13.3% 44California 14.4% 45North Dakota 15.0% 46Oregon 16.7% 47Delaware 16.7% 48Louisiana 18.8% 49Hawaii 24.7% 50
Source: WSDOT analysis of FHWA data.

22 Transportation Benchmarks Implementation Report Transportation Benchmarks Implementation Report 23
Policy Goal 9: Transit Cost Efficiency“The state’s public transit agencies shall achieve the median cost per vehicle revenue hour of peer transit agencies, adjusting for the regional cost-of-living.”
BackgroundThe BRCT Benchmark Committee found that “Washington’s transit agencies have consistently ranked high in costs per passenger and per vehicle hour compared to their peers nationally, although, in recent years cost indicators have been flat or declining for Washington transit agencies.”
The BRCT chose not to use a national mean or me-dian as the target, but rather suggested using a peer group of “like-size agencies” for comparison purpos-es. The BRCT also found that transit-operating costs are highly dependent on wages of transit personnel, which in turn are related to the labor market and the cost of living in the region.
The 1998 Washington Public Transit Assessment found that there is no one measure of transit per-formance, due to transit having multiple purposes, some of which are conflicting. Two basic service philosophies – coverage and intensity – result in very different performance characteristics.
The Transportation Commission Benchmark Com-mittee was put in a unique position to implement a transit cost-efficiency benchmark at the statewide level, while transit agencies are governed by local boards and each have their own goals, objectives and measures of success. In order to develop a statewide benchmark, the Benchmark Committee worked with the Washington State Transit Associa-tion (WSTA).
Performance measures used by a transit agency re-flect a range of issues. Many agencies have focused on measures related to financial performance and rid-ership, because of federal reporting requirements and data availability. The National Transit Database, part of the Federal Transit Administration (FTA), requires transit agencies to provide operating and capital-re-lated data annually by service mode. Many measures of internal financial efficiency and effectiveness are available from these data. However, economic mea-sures are but one category in transit performance; for instance, they do not measure a transit system’s ability to meet the needs of its passengers.
Challenges with Proposed BenchmarkThe benchmark proposed in the policy goal has several limitations. Transit systems come in dif-ferent sizes and service areas, and one agency can provide several different types of service, including fixed route (scheduled), demand response (on-call paratransit), and vanpool. Context is important. Transit provides multiple and sometimes-conflicting services (i.e., providing mobility to disabled and el-derly citizens vs. serving the most passengers at the least cost). Different systems have different goals, and one general statewide measure does not capture whether or not local agencies are making progress toward their own specific goals.
Distinguishing between financial performance for fixed route and demand response service is es-sential for valid measurement. For example, cost per boarding is significantly higher for demand response service. Increases in the number of paratransit passengers — meaning additional pick-ups and drop-offs — result in cost increases. But fixed route transit growth usually means more seats are used during the hours of service. As a result, growth usually results in lower cost per passenger due to the economies of scale that exist in fixed route service. A single lump cost measurement of aggregate system performance is not meaningful.
While WSTA supports the intent of the cost per hour efficiency measure, it believes that cost per total hour is better suited for monitoring the cost efficiency of transit operations. The total hour definition is also more consistent among transit op-erators than the revenue hour definition. The total hour measure can fairly measure both commuter and local services. The cost per revenue hour mea-sure always favors local service over peak direc-tion commuter service.
Comparing transit performance with other systems is important, but identifying national peers is dif-ficult. Selecting peers requires examining a variety of general data (e.g., city sizes, level of government support, fare levels, goals and objectives, cost of
22 Transportation Benchmarks Implementation Report Transportation Benchmarks Implementation Report 23
Transit Efficiency Benchmarks Distinguishing between different types of services and system sizes is essential for valid benchmark-ing. In addition to the operating cost per total hour benchmark that meets the intent of the policy goal, WSTA provided three additional benchmarks — operating cost per passenger mile, operating cost per boarding, and boardings per revenue hour — that compile statewide averages for fixed-route (scheduled) service at urban, small urban, and rural transit agencies, and statewide averages for demand response (on-call paratransit) and vanpool services.
The results for six urban transit systems highlight the differences that exist between systems. These are Community Transit (CT), Clark County (C-TRAN), King County’s Metro Transit Division, Everett Tran-sit, Pierce Transit, and Spokane Transit Authority.
living index values, or other similar criteria) to see if a candidate agency presents an appropriate peer comparison. Data collection differences between agencies can produce differences that minimize the value of the comparison.
It is not clear what national peer groups the BRCT used for benchmarking. Most “peer” systems in other parts of the country offer different types of services in different service environments. Setting an unrealistic target based on “peers” without work to discover and account for data reporting and system differences does not lead to useful benchmark comparisons. In addition, the FTA doesn’t collect data from systems in rural areas, so 13 of the state’s transit agencies can-not be compared nationally using FTA’s data.
The difficulty in finding valid peer groups and accounting for data disparities led WSTA and the Benchmark Committee to seek measures that compared transit agencies with other comparable in-state transit systems.
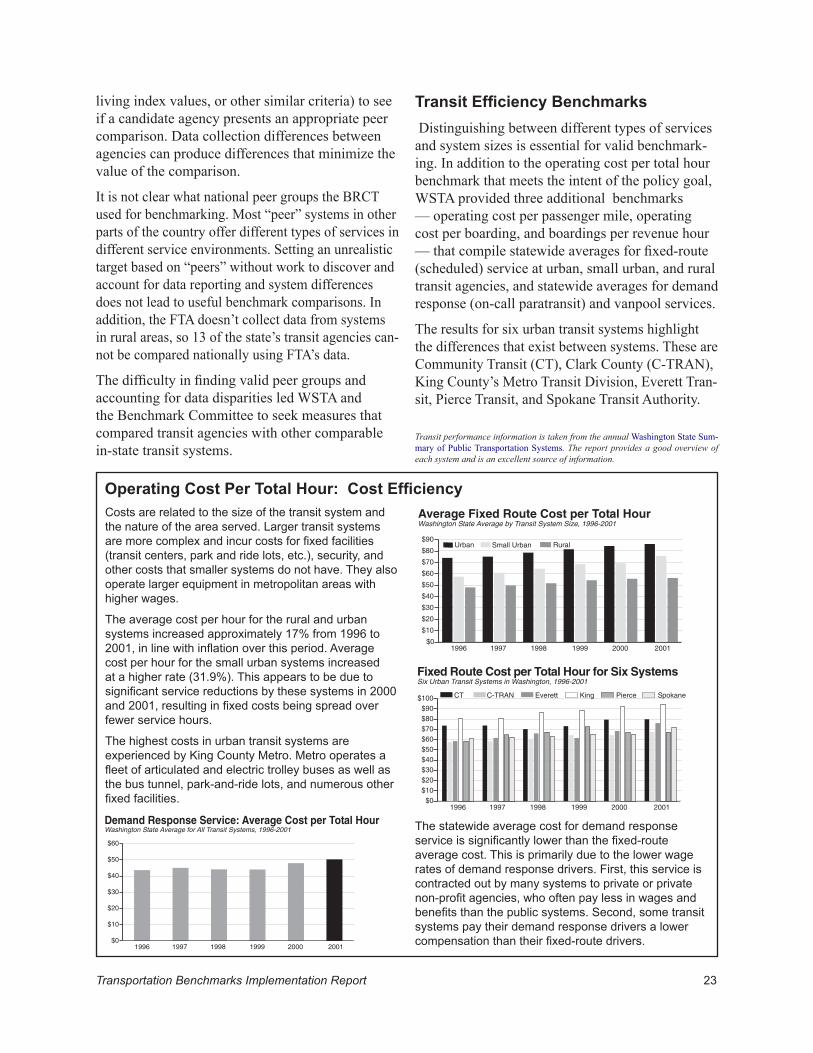
Operating Cost Per Total Hour: Cost EfficiencyCosts are related to the size of the transit system and the nature of the area served. Larger transit systems are more complex and incur costs for fixed facilities (transit centers, park and ride lots, etc.), security, and other costs that smaller systems do not have. They also operate larger equipment in metropolitan areas with higher wages.
The average cost per hour for the rural and urban systems increased approximately 17% from 1996 to 2001, in line with inflation over this period. Average cost per hour for the small urban systems increased at a higher rate (31.9%). This appears to be due to significant service reductions by these systems in 2000 and 2001, resulting in fixed costs being spread over fewer service hours.
The highest costs in urban transit systems are experienced by King County Metro. Metro operates a fleet of articulated and electric trolley buses as well as the bus tunnel, park-and-ride lots, and numerous other fixed facilities.
The statewide average cost for demand response service is significantly lower than the fixed-route average cost. This is primarily due to the lower wage rates of demand response drivers. First, this service is contracted out by many systems to private or private non-profit agencies, who often pay less in wages and benefits than the public systems. Second, some transit systems pay their demand response drivers a lower compensation than their fixed-route drivers.
RuralSmall Urban
$0
$10
$20
$30
$40
$50
$60
$70
$80
$90Urban
1996 1997 1998 1999 2000 2001
Average Fixed Route Cost per Total HourWashington State Average by Transit System Size, 1996-2001
$0$10$20$30$40$50$60$70$80$90
$100
1996 1997 1998 1999 2000 2001
Fixed Route Cost per Total Hour for Six SystemsSix Urban Transit Systems in Washington, 1996-2001
SpokanePierceKingEverettC-TRANCT
$0
$10
$20
$30
$40
$50
$60
1996 1997 1998 1999 2000 2001
Demand Response Service: Average Cost per Total HourWashington State Average for All Transit Systems, 1996-2001
Transit performance information is taken from the annual Washington State Sum-mary of Public Transportation Systems. The report provides a good overview of each system and is an excellent source of information.

24 Transportation Benchmarks Implementation Report Transportation Benchmarks Implementation Report 25
Operating Cost Per Passenger Mile:Cost Effectiveness
Boardings Per Revenue Hour:Service Effectiveness
Passenger miles are the transit parallel to vehicle miles traveled. Passenger mile information is not collected for rural systems. Also, this measure does not apply to demand response service.
The trend for this measure generally reflects inflationary cost increases. The cost per passenger mile increased sharply for small urban systems from 2000 to 2001 due to significant service reductions and fare increases during 2000 by several systems in this category.
The chart illustrates the low cost per passenger mile rate of Community Transit — a system with a high level of express service — while Everett Transit, a system with little express service and short average trip length, has a higher cost per passenger-mile. Spokane’s cost per passenger-mile reflects its lack of an extensive express route system such as those operated by the Puget Sound area systems.
Boardings per revenue hour are the number of passenger boardings for every hour a transit vehicle is transporting passengers. This measure increases with population density and the type of service — urban local service, for example, shows higher boardings per revenue hour than express service.
Performance has been relatively constant for the urban and small urban systems but has dropped among rural systems. The loss of both sales tax equalization and Motor Vehicle Excise Tax funding and the general economic downturn in rural Washington has forced rural systems to reduce service levels and increase fares, resulting in fewer passengers while spreading fixed costs over fewer hours of service.
King County Metro’s more than 30 boardings per revenue hour exceeds the other urban systems in this measure. C-TRAN has seen this measure decline as a function of the increase of express service in its service mix.
Small UrbanUrban
$0
$0.20
$0.40
$0.60
$0.80
1996 1997 1998 1999 2000 2001
Average Fixed Route Cost per Passenger MileWashington State Average by Transit System Size, 1996-2001
$0
$0.20
$0.40
$0.60
$0.80
$1.00
$1.20
$1.40
$1.60
1996 1997 1998 1999 2000 2001
Fixed Route Cost per Passenger Mile for Six SystemsSix Urban Transit Systems in Washington, 1996-2001
SpokanePierceKingEverettC-TRANCT
RuralSmall UrbanUrban
0
5
10
15
20
25
30
35
1996 1997 1998 1999 2000 2001
Average Fixed Route Boardings per Revenue HourWashington State Average by Transit System Size, 1996-2001
SpokanePierceKingEverettC-TRANCT
0
5
10
15
20
25
30
35
1996 1997 1998 1999 2000 2001
Fixed Route Boardings per Revenue Hourfor Six SystemsSix Urban Transit Systems in Washington, 1996-2001
0
0.5
1.0
1.5
2.0
2.5
3.0
3.5
1996 1997 1998 1999 2000 2001
Demand Response Service:Average Boardings per Revenue HourWashington State Average for All Transit Systems, 1996-2001
Small UrbanUrban
$0
$0.20
$0.40
$0.60
$0.80
1996 1997 1998 1999 2000 2001
Average Fixed Route Cost per Passenger MileWashington State Average by Transit System Size, 1996-2001
$0
$0.20
$0.40
$0.60
$0.80
$1.00
$1.20
$1.40
$1.60
1996 1997 1998 1999 2000 2001
Fixed Route Cost per Passenger Mile for Six SystemsSix Urban Transit Systems in Washington, 1996-2001
SpokanePierceKingEverettC-TRANCT
Increases in this measure for demand response service since 1999 are related to service area reductions and the elimination of the least productive services by some transit agencies. As these least productive services, usually serving low-density suburban or rural areas, are eliminated, the associated demand response service is also discontinued. Demand responsive trips in these areas tend to have long trip lengths and are difficult to group with other rides.
RuralSmall UrbanUrban
0
5
10
15
20
25
30
35
1996 1997 1998 1999 2000 2001
Average Fixed Route Boardings per Revenue HourWashington State Average by Transit System Size, 1996-2001
SpokanePierceKingEverettC-TRANCT
0
5
10
15
20
25
30
35
1996 1997 1998 1999 2000 2001
Fixed Route Boardings per Revenue Hourfor Six SystemsSix Urban Transit Systems in Washington, 1996-2001
0
0.5
1.0
1.5
2.0
2.5
3.0
3.5
1996 1997 1998 1999 2000 2001
Demand Response Service:Average Boardings per Revenue HourWashington State Average for All Transit Systems, 1996-2001
0
0.5
1.0
1.5
2.0
2.5
3.0
3.5
1996 1997 1998 1999 2000 2001
Demand Response Service:Average Boardings per Revenue HourWashington State Average for All Transit Systems, 1996-2001

24 Transportation Benchmarks Implementation Report Transportation Benchmarks Implementation Report 25
Operating Cost Per Boarding: Cost EffectivenessOperating cost per boarding measures the cost of carrying one passenger on a single bus trip. An important consideration is that passenger trips can vary greatly in distance. On some systems the average trip length is three miles. On other systems the average trip length is 11 miles. It is reasonable to expect that the latter system would have a higher cost per boarding. Rural transit service will generally be more expensive on a per passenger basis than urban service, largely due to lower population densities and longer trip lengths.
$0
$4
$8
$12
$16
$20
1996 1997 1998 1999 2000 2001
Demand Response Service: Average Costper BoardingWashington State Average for All Transit Systems, 1996-2001
RuralSmall UrbanUrban
$0
$0.50
$1.00
$1.50
$2.00
$2.50
$3.00
$3.50
$4.00
1996 1997 1998 1999 2000 2001
Average Fixed Route Cost per BoardingWashington State Average by Transit System Size, 1996-2001
$0
$1
$2
$3
$4
$5
$6
1996 1997 1998 1999 2000 2001
Fixed Route Cost per Boarding for Six SystemsSix Urban Transit Systems in Washington, 1996-2001
SpokanePierceKingEverettC-TRANCT
$0
$0.50
$1.00
$1.50
$2.00
$2.50
$3.00
1996 1997 1998 1999 2000 2001
Vanpool Service: Average Cost per BoardingWashington State Average for All Transit Systems, 1996-2001
The cost has increased per boarding at approximately the rate of inflation for urban systems, while rural and small urban systems have seen the cost per boarding increase at a much higher rate. Small urban systems saw a significant increase from 2000 to 2001 because service reductions increased the cost per hour of service; also, increased fares led to fewer passengers. Rural systems faced these issues as well, and their cost effectiveness in this measure was hit particularly hard by increased health care and other employee costs.
This chart illustrates the effect of the type of service on cost per boarding and the limitations of using a single measure to determine the effectiveness of a transit system. Community Transit has a significantly higher cost per boarding than other systems due to the high level of express service it operates. Express service experiences fewer boardings per hour than local service but has much longer trip lengths. Despite the high cost per boarding, Community Transit has the lowest cost per passenger mile of any of the urban systems. The overall cost per boarding has been held relatively constant over this period among the large urban systems.
The cost per boarding for demand response service is approximately six times the cost per boarding for fixed-routes service. This measure was constant from 1996 to 1998 with costs increasing due to inflation and increased employee costs since 1999.
Operating cost per boarding is the only statewide benchmark for vanpool service. The cost-effectiveness of the vanpool program is particularly impressive, considering average trip lengths and that vanpool passenger fares cover a substantial portion of the program’s operating and capital costs in many systems. Some systems choose to subsidize vanpool fares to make the service as attractive as possible.
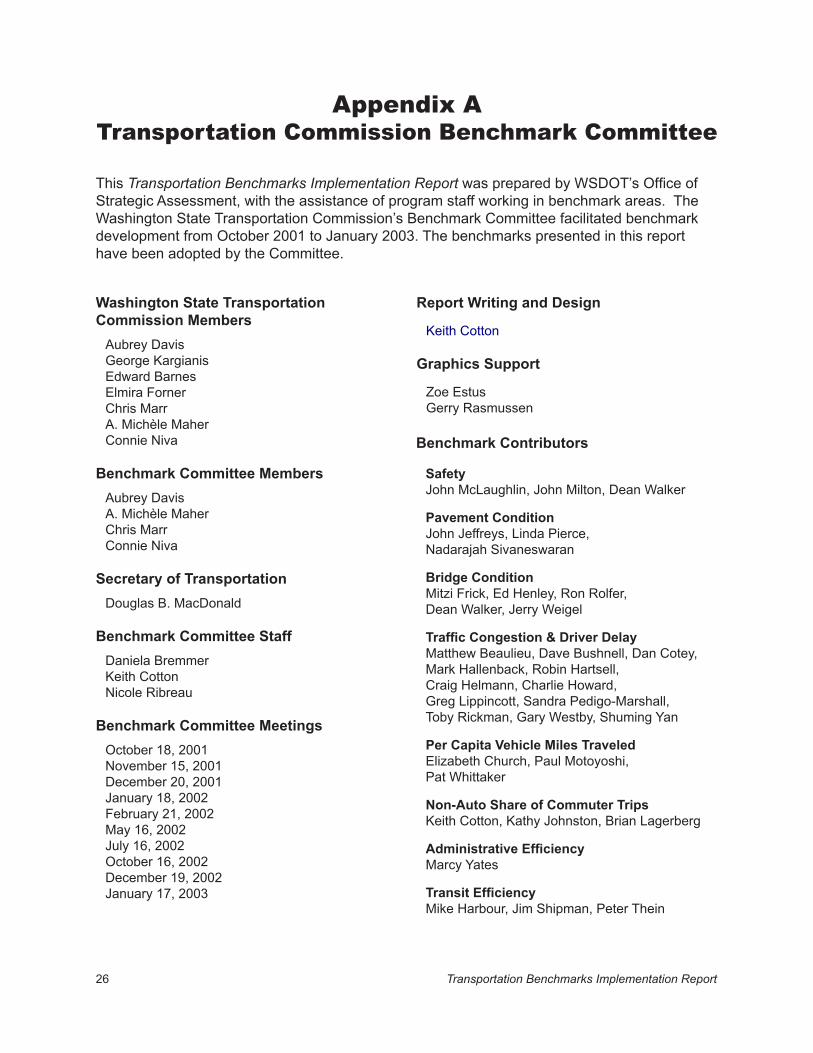
26 Transportation Benchmarks Implementation Report Transportation Benchmarks Implementation Report 27
Appendix ATransportation Commission Benchmark Committee
Washington State Transportation Commission Members
Aubrey DavisGeorge KargianisEdward BarnesElmira FornerChris MarrA. Michèle MaherConnie Niva
Benchmark Committee MembersAubrey DavisA. Michèle MaherChris MarrConnie Niva
Secretary of TransportationDouglas B. MacDonald
Benchmark Committee StaffDaniela BremmerKeith CottonNicole Ribreau
Benchmark Committee MeetingsOctober 18, 2001November 15, 2001December 20, 2001January 18, 2002February 21, 2002May 16, 2002July 16, 2002October 16, 2002December 19, 2002January 17, 2003
This Transportation Benchmarks Implementation Report was prepared by WSDOT’s Office of Strategic Assessment, with the assistance of program staff working in benchmark areas. The Washington State Transportation Commission’s Benchmark Committee facilitated benchmark development from October 2001 to January 2003. The benchmarks presented in this report have been adopted by the Committee.
Benchmark Contributors
SafetyJohn McLaughlin, John Milton, Dean Walker
Pavement ConditionJohn Jeffreys, Linda Pierce,Nadarajah Sivaneswaran
Bridge ConditionMitzi Frick, Ed Henley, Ron Rolfer,Dean Walker, Jerry Weigel
Traffic Congestion & Driver DelayMatthew Beaulieu, Dave Bushnell, Dan Cotey,Mark Hallenback, Robin Hartsell, Craig Helmann, Charlie Howard, Greg Lippincott, Sandra Pedigo-Marshall,Toby Rickman, Gary Westby, Shuming Yan
Per Capita Vehicle Miles TraveledElizabeth Church, Paul Motoyoshi, Pat Whittaker
Non-Auto Share of Commuter TripsKeith Cotton, Kathy Johnston, Brian Lagerberg
Administrative EfficiencyMarcy Yates
Transit EfficiencyMike Harbour, Jim Shipman, Peter Thein
Report Writing and Design
Keith Cotton
Graphics Support
Zoe EstusGerry Rasmussen

26 Transportation Benchmarks Implementation Report Transportation Benchmarks Implementation Report 27
Appendix BRCW 47.01.012
RCW 47.01.012Intent -- 2002 c 5.It is the intent of the legislature to establish policy goals for the operation, performance of, and investment in, the state’s transportation system. The policy goals shall consist of, but not be limited to, the following benchmark categories, adopted by the state’s Blue Ribbon Commission on Transportation on November 30, 2000. In addition to improving safety, public investments in transportation shall support achievement of these and other priority goals:
No interstate highways, state routes, and local arterials shall be in poor condition; no bridges shall be structurally deficient, and safety retrofits shall be performed on those state bridges at the highest seismic risk levels; traffic congestion on urban state highways shall be significantly reduced and be no worse than the national mean; delay per driver shall be significantly reduced and no worse than the national mean; per capita vehicle miles traveled shall be maintained at 2000 levels; the nonauto share of commuter trips shall be increased in urban areas; administrative costs as a percentage of transportation spending shall achieve the most efficient quartile nationally; and the state’s public transit agencies shall achieve the me-dian cost per vehicle revenue hour of peer transit agencies, adjusting for the regional cost-of-living.
These policy goals shall be the basis for establishment of detailed and measurable performance bench-marks.
It is the intent of the legislature that the transportation commission establish performance measures to en-sure transportation system performance at local, regional, and state government levels, and the transporta-tion commission should work with appropriate government entities to accomplish this.
[2002 c 5 § 101.]
NOTES:
Effective date -- 2002 c 5 § 101: “Section 101 of this act takes effect July 1, 2002.” [2002 c 5 § 102.]
Captions not law -- 2002 c 5: “Captions and part headings used in this act are not part of the law.” [2002 c 5 § 419.]
Severability -- 2002 c 5: “If any provision of this act or its application to any person or circumstance is held invalid, the remainder of the act or the application of the provision to other persons or circumstances is not affected.” [2002 c 5 § 420.]

28 Transportation Benchmarks Implementation Report
Appendix CLocal Arterial Pavement Condition
In developing its work plan, the Benchmark Committee discussed the requirements of the bill that the Transportation “work with appropriate government entities” to “establish performance measures to ensure transportation system performance at local, regional, and state government levels.” Based on information presented at the BRCT and the Commission’s January 2001 workshop, neither the Benchmark Committee nor local jurisdictions has enough resources to fully engage in an effort to establish and collect consistent data for local arterial pavement condition.
Legislation enacted in 2003 adds a new section to RCW 46.68 requiring cities and towns to submit pave-ment rating information on at least 70 percent of the city and town arterial system to the Transportation Commission, beginning in the 2003-2005 biennium. Each biennium thereafter, increments of 5 percent more information about the system must be submitted. The rating system must be based on the Washing-ton pavement rating method or an equivalent standard.
Future benchmark reports will include this information as it is submitted to the Transportation Commission.

28 Transportation Benchmarks Implementation Report
Americans with Disabilities Act (ADA) InformationPersons with disabilities may request this information be prepared and
supplied in alternate formats by calling the Washington State Department of Transportation ADA Accommodation Hotline collect (206) 389-2839.
Persons with hearing impairments may access Washington State Telecommunications Relay Service
at TTY 1-800-833-6388, Tele-Braille 1-800-833-6385, Voice 1-800-833-6384, and ask to be connected to (360) 705-7097.
Civil Rights Act of 1964, Title VI Statement to Public Washington State Department of Transportation (WSDOT) hereby
gives public notice that it is the policy of the department to assure full compliance with Title VI of the Civil Rights Act of 1964, the Civil Rights
Restoration Act of 1987, and related statutes and regulations in all programs and activities. Persons wishing information may call the WSDOT
Office of Equal Opportunity at (360) 705-7098.
Other WSDOT Information AvailableThe Washington State Department of Transportation has a vast amount
of traveler information available (including Puget Sound area traffic, mountain pass reports, highway closures, ferry schedules, and more).
Call the WSDOT statewide toll-free number: 1-800-695-ROAD.In the Seattle area: (206) DOT-HIWY [368-4499].
For additional information about highway traffic flow and cameras, ferry routes and schedules, Amtrak Cascades rail, and other transportation
operations, as well as WSDOT programs and projects, visitwww.wsdot.wa.gov