TRANSPORTATION ASSET MANAGEMENT
66
TRANSPORTATION ASSET MANAGEMENT The Strategic Direction of Georgia Department of Transportation 2011 Division of Organizational Performance Management
Transcript of TRANSPORTATION ASSET MANAGEMENT

1
TRANSPORTATION ASSET MANAGEMENT The Strategic Direction of Georgia Department of Transportation
2011
Division of Organizational Performance Management
2 | P a g e
TABLE OF CONTENTS
I EXECUTIVE SUMMARY……………………………………………………………………………………………………….3‐4 II INTRODUCTION ……………………………………………………………………………………………………………...5‐11 III LINKING GEORGIA DOT’S STRATEGIC PLAN AND PERFORMANCE LEVELS OF SERVICE………………………………………………………………………………12‐17 IV LIFE CYCLE MANAGEMENT
IV‐1 LIFE CYCLE MANAGEMENT ‐ PAVEMENTS……………………………………………………………18‐25
IV‐2 LIFE CYCLE MANAGEMENT BRIDGES……………………………………………………………………26‐32
IV‐3 LIFE CYCLE MANAGEMENT – HIGHWAY SIGNS…………………………… ………………………33‐36
V FINANCIAL SUMMARY………………….……………………………………………………..…………………………….37 VI TAM EFFORTS TO DATE …………………....……………………………………………..…………………………..38‐39 VII WHAT’S NEXT WITH TAM? ……………………..…..………………………………………………………………40‐41 VIII CONCLUSION …………………………………………....…………………………………………………………………….41 APPENDICIES

3 | P a g e
I ‐ EXECUTIVE SUMMARY
Transportation Asset Management (TAM) Overview The AASHTO subcommittee on Asset Management describes Transportation Asset Management (TAM) as a strategic process of operating, maintaining, upgrading and expanding physical assets using sound business and engineering practices for resources allocation. The objective of the TAM principles are better decision making based on quality information and well‐defined objectives. In simpler terms, the Department uses the principles of TAM to inform policy and resource allocation decisions based on well defined goals and objectives, sound data and addressing assets that pose the highest risk to mobility. Previously, the Department primarily used a “worst first” philosophy; replacing and improving infrastructure in the order of the worst or lowest scoring asset first. However, this philosophy can result in the delay of maintenance activities on high mobility‐risk facilities. The result can be a larger investment if the facility fails or when deficiencies are addressed in the future. In these lean financial times, the Department is unable to continue this philosophy.
TAM is not a fix for a crisis or emergency. Instead, when used effectively, TAM can assist agencies in preventing major problems by prolonging the life cycles of our most critical assets and by planning for future replacements. Georgia DOT is moving towards informing decisions that impact Districts, Divisions and Offices, data collection and IT systems all on the same TAM principles. Allocation of resources could be based on things such as highest traffic volumes, most maintenance needs, or needs that impose the greatest overall risks to the public. This will likely mean that resources are not distributed equally and while this may take some adjusting, the end result is a better managed and longer useful life of the Department’s assets.
While the idea of applying TAM to the management of transportation infrastructure has existed for a while, it has become more relevant in recent years, due to the budgetary and labor shortages transportation agencies now face. Transportation agencies find that focusing on asset preservation, which is at the core of Transportation Asset Management, not only extends the useful lives of their assets, but also is more cost effective in the long run. While TAM is a good practice for lean times, it is prudent for use during robust times, as well.

4 | P a g e
Organizational Buy‐in and TAM Communication TAM requires significant organizational buy‐in and support. It is a process that can impact previously set goals, objectives, priorities, work practices and decision‐making processes. This shift in work procedures could generate concern due to unfamiliarity with a new way of doing business. Also, there may be resistance to how decisions are made regarding financial resource allocation. However, work units such as Georgia DOT’s Office of Maintenance have already made a shift from “worst first” to “most at risk first.” The Maintenance Office exemplifies how offices throughout the Department can strive to understand and embrace the new concept.
It is imperative that the DOT team understands how the principles of TAM guide our strategic plan (including our goals and objectives), our resource allocation and our daily work task. By understanding how decisions are made each employee can be aware of how their daily job duties contribute to meeting the Department’s four key goals:
• Making GDOT a better place to work will make GDOT a place that works better
• Making safety investments and improvements where the traveling public is most at risk
• Taking care of what we have, in the most efficient way possible
• Planning and constructing the best set of mobility‐focused projects we can, on schedule
Finally, communication is paramount. Each change must be clearly communicated to everyone involved. The communication effort starts from the day TAM is introduced, and continues throughout its implementation and sustainment. Implementation of TAM principles Department‐wide will not happen overnight and will require that all Department offices and divisions support the effort. However, as employees begin to understand how their individual role contributes to the achievement of our goals and objectives, the TAM practice and way of doing business will become a part of the Georgia DOT culture.

5 | P a g e
II‐ INTRODUCTION
II – 1 Purpose of the Transportation Asset Management Plan (TAMP) Each transportation agency has stewardship responsibilities for its infrastructure network, and should have a plan for sustaining that network. While most agencies, including Georgia DOT, have strategic plans that establish goals and objectives for the agency, from a TAM perspective, the strategic plan may not specifically address agency‐owned assets, their condition and service levels, and their preservation methods. Consequently, transportation agencies should develop a TAMP that not only aligns with its strategic plan, but also serves as a “business plan” or guide for how the organization as a whole will manage its existing assets.
The plan should include the Agency’s goals and objectives as well as document the condition and performance levels of its current assets, what the future demand and risk trends are and any planned improvements in asset management business processes. The TAMP is a document that can be used by an organization’s executives and practitioners, as well as its external stakeholders. Its primary role is to provide general overview of what TAM entails, provide guidelines on how to implement TAM, and to address the improvement plan for the future. The plan represents the existence of TAM within an agency, and it contains yardsticks of where the agency is and where the agency is going.
A TAMP should be reviewed and updated regularly. The TAMP review period should not exceed three years; otherwise the plan will lose timeliness and relevance. The TAMP is a “living” document, and revisions are expected.
II – 2 Georgia DOT Overview Georgia DOT is responsible for the administration and operation of an efficient, modern system of public roads, highways and other modes of transportation including public transit, rail, aviation, ports and bicycle and pedestrian facilities.
In 2010, the Department was reorganized under Senate Bill 200 (SB 200), which consolidated the planning function under a Director of Planning, who reports to the Governor. A 13‐member board representing each of Georgia’s congressional districts oversees Georgia DOT.
As one of over 80 agencies that form the state government of Georgia, GDOT’s operations are statewide, with offices located in Atlanta as well as 7 districts, 42 area offices and 148 maintenance facilities offices around the state. The Department is also responsible for 17 rest areas and 9 welcome centers.
To fulfill its mission and operations, Georgia DOT relies on a diverse workforce of men and women who serve in a variety of career fields including planning, engineering, environmental, administration, finance and manual labor. An integrated network of information systems, administrative and support personnel, and over 8,500 pieces of equipment support them. The Department supplements its

6 | P a g e
workforce with consultants and contractors to provide project development support including design and construction.
The Department’s Strategic Plan identifies the Vision, Mission and Core Values of Georgia DOT. It also defines Goals and Objectives as well as strategies to achieve them. The Department’s Vision, Mission and Core Values are below.
II – 3 Vision, Mission and Core Values Vision Keep Georgia Moving With Quality Transportation
Mission
Georgia Department of Transportation provides a safe, seamless and sustainable transportation system that supports Georgia’s economy and is sensitive to its citizens and environment.
Core Values Core values are enduring beliefs, which Georgia DOT leadership and employees hold in common and put into action. Core values answer the question, “How do we act as we move toward achieving our mission and vision?”
Georgia DOT’s core values are: Committed, Accountable, Responsible, and Ethical (C.A.R.E.).
Core Values Meaning
Commitment • Available when the need arises
• Dedicated to the success of Georgia DOT through excellence
Accountability • Doing what we say we are going to do
• Meeting program targets
• Meeting professional standards
Responsibility • Taking ownership and pride in our work
• Being responsive and timely in our actions
Ethics • All actions are based on principles
• Being above board in all our actions
7 | P a g e
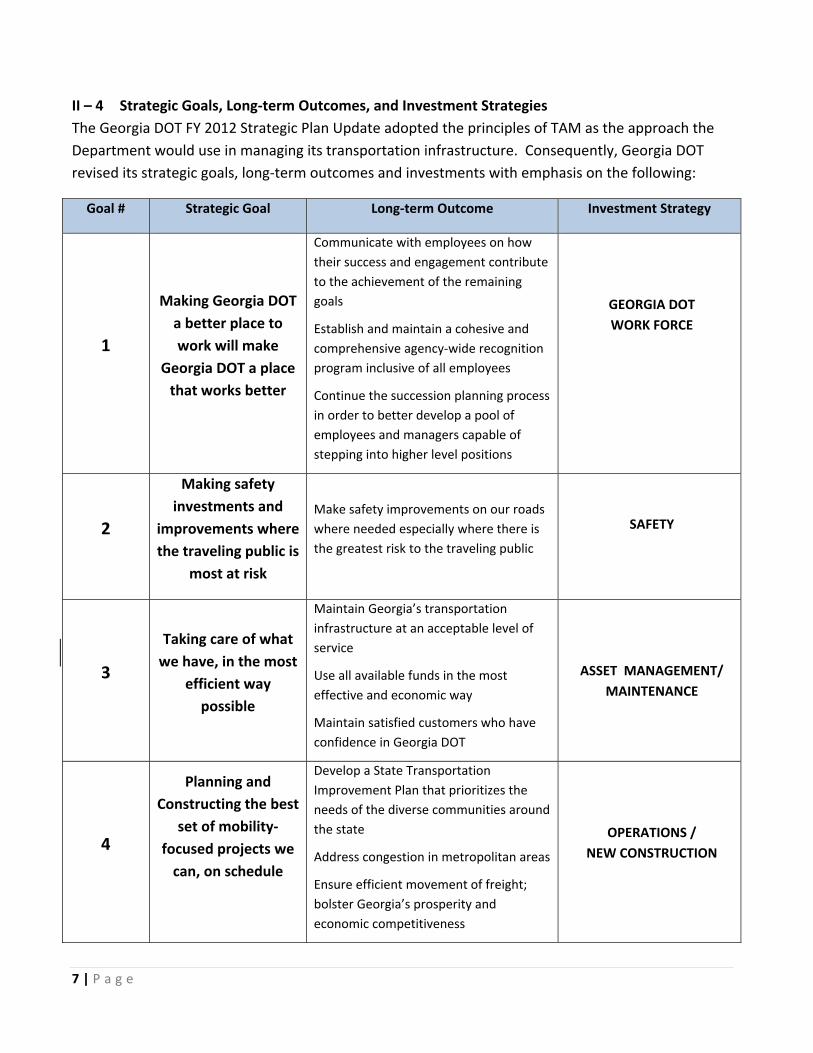
II – 4 Strategic Goals, Long‐term Outcomes, and Investment Strategies The Georgia DOT FY 2012 Strategic Plan Update adopted the principles of TAM as the approach the Department would use in managing its transportation infrastructure. Consequently, Georgia DOT revised its strategic goals, long‐term outcomes and investments with emphasis on the following:
Goal # Strategic Goal Long‐term Outcome Investment Strategy
1
Making Georgia DOT a better place to work will make
Georgia DOT a place that works better
Communicate with employees on how their success and engagement contribute to the achievement of the remaining goals
Establish and maintain a cohesive and comprehensive agency‐wide recognition program inclusive of all employees
Continue the succession planning process in order to better develop a pool of employees and managers capable of stepping into higher level positions
GEORGIA DOT WORK FORCE
2
Making safety investments and
improvements where the traveling public is
most at risk
Make safety improvements on our roads where needed especially where there is the greatest risk to the traveling public
SAFETY
3
Taking care of what we have, in the most
efficient way possible
Maintain Georgia’s transportation infrastructure at an acceptable level of service
Use all available funds in the most effective and economic way
Maintain satisfied customers who have confidence in Georgia DOT
ASSET MANAGEMENT/ MAINTENANCE
4
Planning and Constructing the best
set of mobility‐focused projects we can, on schedule
Develop a State Transportation Improvement Plan that prioritizes the needs of the diverse communities around the state
Address congestion in metropolitan areas
Ensure efficient movement of freight; bolster Georgia’s prosperity and economic competitiveness
OPERATIONS / NEW CONSTRUCTION

8 | P a g e
In order to ensure that customer service levels are considered and tracked, the Department also includes customer service performance measures with desired targets under several of its strategic goals. These measures are taken from employee, public opinion and motorist surveys conducted in prior years. The purpose of these measures is to capture customer ratings of the Department, analyze them, and take necessary actions in areas that need improvement.
II – 5 A Look Back and a Look at the Present Georgia DOT began the move towards the TAM approach in fall of 2009. Previously the Department’s investments were made in silos according to each asset category and location. This led to a reactive “worst first” approach when managing programs and allocating resources. This approach often required a larger allocation of funds due to the complete replacement of assets. This resulted in limited resources for investing in lower cost preventive measures. This reactive approach to managing transportation infrastructure can result in a crisis‐oriented organization.
Faced with budgetary constraints and an overwhelming need for investment in infrastructure, Georgia DOT looked for new ways to optimize investment decisions. To best maintain infrastructure, leadership determined that Transportation Asset Management, already utilized in other states’ departments of transportation, would be an effective approach for Georgia DOT. Key drivers for TAM include:
• Clear links between policy goals and objectives and decisions at all levels.
• An understanding of the connection between proposed investments and expected results.
• An understanding of program‐level impacts and funding allocations.
• A long‐term view of asset performance.
• Decisions that are supported by good information.
• A feedback loop from observed performance to planning and programming decisions.
• Clear accountability.
• The need to unify all Georgia DOT data, processes and divisions.
TAM provides the Department with an integrated, comprehensive and strategic approach to meet Georgia’s transportation needs. TAM’s key strength is that it is data‐driven — decisions can be supported by the data it uses and generates, as well as by engineering judgment. At a time when funding for transportation is constrained and programs are forced to compete with each other, TAM is an effective tool to determine how best to spend every transportation dollar.

9 | P a g e
II – 6 Self Assessment Survey The first step in implementation of TAM throughout the Department was completion of the Asset Management Self Assessment. A TAM task force, consisting of representatives from each department crucial in the TAM implementation process, was established. The members of the TAM task force completed the “Asset Management Self Assessment Survey – Maintenance” (Appendix 1). Georgia DOT’s Deputy Commissioner/Chief Engineer and FHWA’s Assistant Division Administrator from Georgia also performed a higher level assessment. The results and risk factors were summarized. The specific areas of high concern that needed immediate attention were:
• Lack of commitment to setting priorities within a program.
• Resource allocations not guided by a performance‐based approach using consistent criteria.
• Inconsistencies between programs and realistic future revenue projections.
• Limited cost history data for costing of options.
• Policies supporting a long‐term, life cycle approach to evaluating investment benefits and costs.
• Maintenance strategies that involve monitoring, reporting, planning, scheduling and program control.
• Data accessibility, data Integration and information systems integration.
• Decision support tools and IT.
It was evident from the Self Assessment that accurate data was crucial to the implementation of TAM. To have a clear understanding of when and how data is collected, the TAM Task Force met weekly to present, review and analyze the available data collected and used in the Department. Each team member gave a presentation on what data was collected in their office/division, the purpose of the data, which other offices collected the same data, and who the data users were.
After the data was identified, reviewed and checked for duplicate collection, the TAM Task Force recommended that they transition into a new data governance team known as the Georgia Geospatial Advising Council (GGAC). The purpose of the GGAC is to assure data is integrated under one system, is available to all users, and is not collected by more than one office. The GGAC is a crucial link to the implementation of TAM because of its governance over data.

10 | P a g e
II – 7 TAM Communications and Training It is important that the implementation of TAM be communicated throughout the Department. Efforts to “spread the word” have included:
• Communication from Commissioner Vance C. Smith, Jr. announcing implementation of TAM at Georgia DOT, and providing an informal description of TAM in February 2010.
• Adoption of Goals guided by TAM principles.
• Communication from OPM to District Engineers with additional information about Transportation Asset Management.
To assure consistent application of TAM in the future, training will be provided to the appropriate staff in at least two areas:
1. Implementation of TAM best practices 2. How to conduct an asset condition inventory
A DRAFT communications plan is under development in cooperation with Georgia DOT’s Communications Office and representatives from Federal Highway Administration (FHWA). This document provides a step‐by‐step breakdown of how TAM should be communicated to those inside and outside the Department. The plan also addresses the Strengths, Weaknesses, Opportunities and Threats (SWOT) to implementing TAM; including measuring tools.

11 | P a g e
II – 8 Stewardship and Life Cycle Management Requirements Transportation assets make up 60 percent of Georgia’s total public assets. The state highway system is considered one of the best maintained in the nation. It is designed to network Georgia's city streets, county roads, state and national highways, and interstates to form a system of public roads that efficiently carries travelers and goods to their destinations. Below are the broad asset groups and their values, as of September 2010.
ACTIVITY
ASSET COMPONENTS
QUANTITY
MEASURE
FINANCIAL WORTH
Vehicle Network
Road Pavements Road Bridges Freight Track
18,903 6,602 540
Miles Number Miles
Facilities1
Welcome Centers Rest Areas District Offices Area Offices Maintenance Offices Storage facilities TMCs
12 22 96 79 275 683 2
Number Number Number Number Number Number Number
$ 14,617,105 $ 21,330,891 $156,516,312 $ 45,627,537 $ 93,782,884 $ 8,489,965 $ 38,973,409
Network Control and Management
Traffic Signals Traffic Signs Road Markings
3.5 (est.)
Pieces
$350,000,000
Parking
Park & Ride Lots Xpress Stations
14
Locations
$ 48,465,804
Vehicles and Equipment
Vehicles and Equipment 8,657 Pieces $ 39,586,908
IT Equipment Server Equipment Network Equipment Workstations Printers VoIP
640 369 5,100 684 1,357
Pieces Pieces Pieces Pieces Pieces
$ 1,544,992 $ 682,640 $ 5,387,408 $ 237,695 $ 450,000
1 Welcome center totals include all buildings with dollar values District Office totals include special forces, bridge inspection, permits, records, lab, ditching, survey, traffic ops, and training, where identified Maintenance Offices includes all maintenance-related buildings other than storage. It also includes signal shop, sign shop, and motor pool, asphalt shop, “special outfits,” and bridge maintenance, where specified Area entries include all buildings that could be associated with area offices, except maintenance and storage. Area entries also include training buildings, except those identified as belonging to the district Storage includes any building that could be associated with storing anything, including salt pits, vehicle and equipment sheds and barns District 7 includes GO-related buildings, such as OES, OPE, the OGC, ROW, HERO

12 | P a g e
III – LINKING GEORGIA DOT’S STRATEGIC PLAN AND PERFORMANCE LEVELS OF SERVICE
III – 1 Level of Service ‐ Definition In the area of TAM, Level of Service (LOS) is defined as a qualitative measure of the public’s perception of an asset’s condition or of the services provided by an agency. The Department uses three factors to determine its Performance LOS:
1. Strategic objectives – represent target condition levels and are closely tied to the Department’s strategic goals.
2. Department‐wide performance measures – quantifiable measures that are good indicators of where the Department stands at meeting its objectives.
3. Customer feedback – Georgia DOT values customer opinions and regularly conducts employee, motorist and/or public opinion polls to evaluate the services provided. The results are analyzed and measured against the Department’s strategic goals and objectives.
The Levels of Service are directly related to the Department’s strategic plan as shown in the graphic below.

13
III – 2 Strategic Objectives The strategic objectives are the measurable outcomes identified to move the Department toward attainment of the strategic goals. They define Georgia DOT’s current target levels of condition. Department leadership identified these strategic objectives as focus areas for the next three to five years. These objectives are either Agency or Division/District/Office level objectives made of several office measures to be discussed later. They serve as focus areas for improvement that will enable the Department to achieve its vision and mission.
A member of the Executive Team was identified as the “Champion” of each strategic objective. Champions are responsible for guiding teams that define and implement strategies and initiatives. The objective “Owners” are responsible for day‐to‐day monitoring of progress, implementing strategies, determining resource needs, and communicating issues and status to Champions.
III – 3 Georgia DOT Performance Measures Georgia DOT has always been dedicated to setting objectives and measuring performance. The process of performance measurement was formalized in 1996 when the Strategic Management Unit was assigned the task of helping Georgia DOT offices create criteria against which they would measure their office’s performance. This effort resulted in over 400 performance measures Department‐wide.
Each month or quarter (depending on data availability) the Strategic Management Unit would gather and manually input information into the performance management database system called TRAQS (Transportation Reporting, Analysis and Querying System). Results of these measures would be reported during semi‐annual leadership meetings. The process for gathering this information was tedious and resource‐demanding and its usefulness could be called into question. The goal moving forward is to develop automated systems that will allow individual offices to track their own progress while the new Division of Organizational Performance Management (OPM) focuses on tracking a smaller number of Agency‐wide objectives and performance measures. These measures would be limited to those crucial to guiding the Department in making the right decisions to help meet its four identified strategic goals. Agency performance measures will be reviewed and adjusted if needed during the annual update of the GDOT Strategic Plan.
The Division of OPM is currently working with the IT Division to develop an automated tool to track the Agency performance measures. This will ultimately make the measures available for leadership viewing at any time. This ongoing process will take time to complete. Georgia DOT is working towards publishing the performance measures and their results for both the public and personnel.

14 | P a g e
III – 4 FY 2012 Goals, Strategic Objectives and Performance Measures
Strategic Goal Champion Strategic Objectives Current Performance Measures
Goal # 1
Making GDOT a better place to work will make
GDOT a place that works better
Division of Administration
(Human Resources)
Complete the nomination and selection process for the second cohort of the Succession Planning Program by 7/31/2011
Status of completion of the nomination and selection process for the second Succession Planning cohort
Ensure that staff is allocated to achieve maximum efficiency and effectiveness throughout the Agency while meeting authorized staffing levels
Develop staffing and organizational models to meet the requirements of the authorized staffing levels at a Level of Service determined at the completion of the efficiency study
Organizational Performance Management
Improve employee recognition and engagement (Customer Service Objective)
Percent of Georgia DOT employees grading the Employee Satisfaction Rating as “Strongly Agree” or ”Agree”
Percent of Georgia DOT employees grading the Organizational Leadership Effectiveness index as “Strongly Agree” or “Agree”
GOAL # 2 Making Safety Investments and Improvements Where the Traveling Public is Most at Risk
Division of Operations and
Permits
Reduce the number of fatalities by 40 per year Number of fatalities annually with a targeted reduction of 40 per year
Reduce the time that the traveling public would be impeded by incidents
Average HERO Response Time tracked monthly, with a target of ≤ 10 minutes (Automobiles)
GOAL # 3 Taking care of what we have in the most efficient way possible
Division of Operations and
Permits
Maintain Interstates at a COPACES Rating of 75 or more
Average COPACES Rating on all Interstates. Target is a COPACES Rating of 75 or higher
Maintain State owned multi‐lane non‐interstate routes at a COPACES Rating of 70 or more
Average COPACES Rating on multi‐lane non‐interstate routes. Target is a COPACES Rating of 70 or higher
Division of Engineering
Maintain State‐owned bridges such that they meet a determined standard as defined by their Strength and their Condition
Percent of State‐owned bridges that meet or exceed a determined standard based on Strength and Deck condition; defined as follows:
‐ Deck Condition on o Interstates ≥ 7 o U.S. Routes ≥ 6 o State Routes ≥ 5 o Off‐System State‐Owned ≥ 5
or ‐ Interstates, U.S. Routes, State Routes
and Off‐System State owned bridges that are not posted (Posting Code = 5)
Target is ≥ 85% of the bridges meeting this criteria with no Interstate bridge postings

15 | P a g e
FY 2012 Goals, Strategic Objectives and Performance Measures…..cont
Strategic Goal Champion(s) Strategic Objectives Performance Measures
GOAL # 4
Planning and Constructing the
best Set of Mobility‐Focused Projects we can, On Schedule
Division of Planning Reduction in traffic congestion costs
Annual reduction in congestion cost from the previous year as published in the most recent Texas Transportation Institute (TTI) report
Division of Planning/Operations
and Permits
Optimize throughput of people and goods through network assets throughout the day
Peak‐hour AM and PM freeway speeds on Key Performance Indicator corridors
‐ Managed/HOV Lanes
Peak‐hour AM and PM freeway speeds on Key Performance Indicator corridors:
‐ General Purpose Lanes
Division of Engineering
Complete Plan Development and Construction of projects per the
programmed year in the currently approved STIP
(Note: FY 2011 is the baseline year for this objective)
Percent of ROW Authorized on Schedule per the
approved STIP with a target of 80%
Percent of CST Authorized on Schedule per the approved STIP with a target of 80%
Percent of Projects under Construction completed on Schedule
Comparison of CST Award amount to actual Final Cost
Organizational Performance Management
Maintain or improve the percentage of survey respondents that give GDOT a grade of A or B for meeting transportation needs in Georgia (Customer Service Objective)
Percent of Public Opinion Poll survey respondents that give GDOT a grade of A or B in meeting transportation needs in Georgia

16 | P a g e
III – 5 Customer Feedback The Department’s relevant stakeholders and key user groups are its customers. These include taxpayers, the traveling public, cities, counties and legislators, as well as Department personnel. Georgia DOT is committed to providing the best set of mobility services to stakeholders, to considering their priorities when planning and building projects, and to being transparent at all times.
Georgia DOT has incorporated customer feedback into its objectives and performance measures. The Department conducts public opinion surveys of randomly selected participants to evaluate Department’s performance in the areas of maintaining and improving the state highway system, environmental stewardship, communications and overall performance. Feedback from these survey tools is used to gauge how well the Department is meeting its overall objectives. The Department also conducts an employee survey every other year to measure its performance regarding internal customers. Georgia DOT is dedicated to continually improving customer services.
III – 6 Laws and Regulations that impact Transportation Asset Management at Georgia DOT Congressional district fund balancing, or simply “balancing,” refers to a Georgia law that requires Georgia DOT to distribute a percentage of its state and federal transportation improvement funds, excluding earmarks, equally among Georgia’s 13 congressional districts over a five year period. It was enacted by the 1999 Georgia General Assembly in response to concerns that some areas of the state were not receiving their fair share of highway funds and projects. The law originally required that 100 percent of Georgia DOT project funds be divided equally among the Congressional districts when averaged over a three‐year period. Through the years, the General Assembly has modified the law so that the current requirement is that Georgia DOT balance 80% of the funds it receives over a five‐year period. The State Transportation Board has the authority to waive the balancing requirement in cases where it conflicts with federal requirements or where other circumstances prevent timely project implementation. For example, the law was waived during the implementation of the recent $1.06 billion American Recovery and Reinvestment Act of 2009. A two‐thirds vote of the State Transportation Board is required to waive the balancing requirements.
Georgia’s congressional district balancing law presents a unique challenge to implementation and execution of TAM. The principles of TAM identify and guide programming and funding strategies based on need; not location. As a result, if needs are not evenly distributed across the state, asset management funds may also not be evenly distributed. While this may present an additional challenge to complying with Congressional Balancing laws, it does not prohibit the use of TAM as congressional balancing requirements are not segregated to individual programs. In other words, the need may guide the Department to spend more Maintenance funds in one area or more Capacity funds in another, while still balancing overall funding throughout the state in compliance with the law.

17 | P a g e
III – 7 Risk Assessment and Management The evaluation of risk plays a big part in integrating TAM principles into the Agency’s business strategies. Risk should play a key role in influencing decisions. In the most basic terms risk is determining how susceptible an asset is to a natural or manmade hazard that would prevent or limit the asset serving its identified purpose. When considering risk to an asset, generally the following are considered:
• How likely will an event or hazard occur that could impact the asset?
• What is the consequence to the asset if the event or hazard occurs?
• What is the impact to the agency or public if the asset can no longer perform its function?
As TAM is implemented throughout the Agency, the champion of each asset must evaluate the risk associated with the asset. This is critical in the evaluation of funding scenarios for various assets and programs.

18 | P a g e
IV ‐ LIFE CYCLE MANAGEMENT
Life Cycle Management is characterized as “maintaining existing system performance at a constant desired level while minimizing resource consumption and externalities over the long term.”2 The emphasis is on long term preservation and sustainability without sacrificing system performance or public safety.
At Georgia DOT, asset life cycle management involves looking at an asset over its life span and applying preservation treatments to prolong its remaining useful life. Different asset preservation methods significantly prolong an asset’s useful life while keeping performance at a desired level. Also, preservation is significantly less costly than replacement.
As part of its initial TAM implementation, Georgia DOT applied Life Cycle Management in the areas of Pavement and Bridge management. The following describes how this strategy was applied to those various areas.
IV – 1 LIFE CYCLE MANAGEMENT – PAVEMENTS
A. Performance Service Level Statement Georgia roads are maintained at optimum level to provide a safe and reliable means of travel. A key strategic goal is to “Take care of what we have in the most efficient way possible,” and it encompasses the following objectives:
• Maintain an Average COPACES Rating of 75 or more on all interstates
• Maintain an Average COPACES Rating of 70 or more on multi‐lane non‐interstate state routes
B. How do we do this? Georgia DOT’s maintenance program addresses needs identified through scheduled inspections as well as those reported by other means, such as reports and the public. Needs range from pavement deficiencies (potholes, edge ruts) and drainage conditions (ditching, shoulder clipping, shoulder rebuilding, slope repairs) to vegetation issues. Scheduled maintenance inspection programs are in place to ensure that our roadways are safe. These include COmputerized Pavements Condition Evaluation Systems (COPACES), concrete survey, biennial drainage inspections, day inspections and night Inspections.
The maintenance program utilizes a rating system to determine asset condition. Inspections are done for the following asset categories:
• COPACES and Concrete survey – address pavement conditions via a rating system based on type and severity of identified distresses.
2 Supplement to the AASHTO Transportation Asset Management Guide: Volume 2‐A Focus on Implementation

19 | P a g e
• Biennial Drainage Inspections – address drainage structure conditions via a rating system based on type and severity of identified distresses.
• Day inspections – ensure that deficiencies (potholes, edge rutting, and vegetation) are noted and recorded in our Highway Maintenance Management System (HMMS) for future scheduling.
• Night inspections – ensure that nighttime deficiencies (such as retro‐reflectivity of signs, raised pavement markings [RPMs] and pavement markings) are noted and recorded in HMMS for future scheduling.
A roadway is recommended for resurfacing when the COPACES rating is 70 or below; prioritization of actual resurfacing is dependent on priority (which considers both the COPACES rating and risk) and funding availability. Roadway reconstruction is based on lab recommendation and is typically done well after the roadway has rated 70 or below.
C. About Georgia’s Pavements Georgia's highway system is considered one of the best maintained in the nation. The system is designed to network city streets, county roads, state highways, national highways and interstates to form a system of public roads that efficiently carries travelers and goods. Georgia’s highway system is made up of:
• State Highway System 17,986 (Temporary SR mileage not excluded)
• County Roads 79,296
• City Streets 21,492
• 3Other Public 4,143
D. Key Issues Georgia DOT’s Pavement Management team faces various challenges and issues regarding the implementation of preservation. Some of these include:
• Current maintenance budget needs are $1.3 billion with funding of the Maintenance Lump Sum category set at $135 million over the years 2011‐2014. Several projects are being funded outside the Lump Sum category in order to increase the available funding.
• Pavement preservation is the primary maintenance function. Preventing water from penetrating the base material is a primary objective as longevity of the pavement structure is dependent on this.
• It is essential to use the correct resurfacing treatment. Different distresses require different treatments (or combinations of treatments) to ensure roadway longevity.
3 Other public includes roads under Federal jurisdiction (such as Military Bases, U.S. Forest, or National Park Service Roads) or roads under authority and jurisdiction of another local or state agency such as State Parks or Universities. Also, includes roads where authority or ownership is un‐resolved. (Office of Transportation Data)

20 | P a g e
• Reconstruction/major rehabilitation on high traffic volume roads have time constraints and may not enable access during daytime.
E. Strategies for Managing These Issues
• Forecasting pavement maintenance is done by the state maintenance office. To best utilize motor fuel dollars, much of the work has been planned to use as little equipment and materials as possible. The statewide maintenance plan is being implemented to better address maintenance to be economically beneficial to the Department.
• Using the correct resurfacing treatment is accomplished through the COPACES process and field inspections by trained personnel who take into account the type and severity of the distresses, and, on occasion, lab recommendations. Drainage issues are addressed as part of the resurfacing project or prior to the project.
• The Maintenance Office has treatment selection guidelines in place that are dependent upon the type and severity of the identified distresses and predicted funding levels.
• Time restrictions due to high traffic volumes and other factors are considered during the project planning phase.
F. Asset Value ‐ Pavements About 95 percent of GDOT roadways are asphaltic concrete. The remaining 5 percent are concrete roadways, typically limited to interstates or interstate type facilities. The primary road base types are sand clay, graded aggregate, asphaltic concrete, soil cement and concrete. The table below lists total asset values for different objectives.
Strategic Objective Total centerline
(miles) Total lane miles
Cost per lane mile
Total asset value (total lane miles) *
Interstates with 50,000 or more ADT at a COPACES Rating of 80 or
more
536 (assumed 8 lanes)
4,288 $1,214,500 (major rehab)
$5,207,776,000
All other interstates at a COPACES Rating of 75 or more
707 (assumed 4 lanes)
2,828 $1,214,500 (major rehab)
$3,434,606,000
Multi‐lane non‐interstate routes with an ADT of 25,000 or more at a COPACES Rating of 75 or
more
651 (assumed 4 lanes)
2,604 $553,805 (major rehab)
$1,442,108,220
Other routes at a COPACES Rating of 70 or more
16,083 (assumed 2 lanes)
32,166 $553,805 (major rehab)
$17,813,691,630

21 | P a g e
* The Worth and Asset Value columns consider asphalt rehab only. Total asset values as of September 2010.
G. Remaining Life ‐ Pavements GDOT has not determined the overall remaining life of its pavements. Instead, the Maintenance Office annually evaluates every mile of every road and determines the remaining life cycle based on these inspections. On average, concrete pavements normally last 50 years while asphalt pavements last 10 years.
H. Asset Risks and Ways to Manage Risk – Pavements To better utilize Department resources, the risk matrix (see the table below) was developed. The matrix assigns a risk factor to each route based on criteria that directly affects the condition of the asset. When several routes receive the same COPACES rating through our annual evaluation of pavement conditions, the matrix using these key factors and criteria determines the best use of the limited available resources. The analysis first considers the functional classification of the route; then the AADT, percent truck traffic, and finally the population of the county the route is located in. Once the total risk factor is determined, the annual COPACES rating score is divided by the total risk factor to determine the modified COPACES rating. This modified COPACES rating prioritizes the needed work in order to best maintain the entire system.

22 | P a g e
Fede
ral Fun
ctional Classificatio
nBase Unit
> 100,
00050,
000 ‐9
9,999 35,
000‐49
,999 25,
000‐34
,999 15,
000‐24
,999 7,0
00‐14,
999< 6
,999
> 12 %
< 12 %
> 600,
000300
,000‐5
99,000 200
,000‐2
99,000 100
,000‐1
99,00 50,
000‐99
,999 <49
.999
Total Risk
Factor
Adjusted
Paces
Coun
ty Pop
ulation
Truck %
AADT
Interstates
Urban
1.00
0.60
0.50
0.40
0.30
0.20
0.10
0.00
0.50
0.30
0.50
0.40
0.40
0.30
0.20
0.10
Rural
1.00
0.40
0.30
0.20
0.10
0.00
0.00
0.00
0.50
0.30
0.30
0.20
0.20
0.15
0.10
0.00
Free
ways
Urban Free
way and
Expressway
1.00
0.30
0.20
0.10
0.00
0.00
0.00
0.00
0.30
0.10
0.40
0.35
0.30
0.20
0.10
0.05
Arteria
lsUrban Principal A
rterial
1.00
0.30
0.20
0.10
0.00
0.00
0.00
0.00
0.30
0.20
0.40
0.35
0.30
0.20
0.20
0.10
Urban Minor Arterial
1.00
0.20
0.10
0.00
0.00
0.00
0.00
0.00
0.30
0.10
0.30
0.25
0.20
0.10
0.10
0.00
Rural Prin
cipal A
rterial
1.00
0.10
0.00
0.00
0.00
0.00
0.00
0.00
0.30
0.10
0.20
0.15
0.10
0.00
0.00
0.00
Rural M
inor Arterial
1.00
0.00
0.00
0.00
0.00
0.00
0.00
0.00
0.30
0.10
0.10
0.00
0.00
0.00
0.00
0.00
Colle
ctors
Urban Co
llector
1.00
0.10
0.00
0.00
0.00
0.00
0.00
0.00
0.20
0.10
0.30
0.25
0.20
0.10
0.10
0.00
Rural M
ajor Collector
1.00
0.00
0.00
0.00
0.00
0.00
0.00
0.00
0.20
0.10
0.20
0.15
0.10
0.00
0.00
0.00
Rural M
inor Collector
1.00
0.00
0.00
0.00
0.00
0.00
0.00
0.00
0.20
0.10
0.10
0.05
0.00
0.00
0.00
0.00
Local
Urban Local Road
1.00
Rural Local Road
1.00
RISK
FACT
OR MATR
IX

23 | P a g e
I. Revenue Plan It is estimated that revenue of $1.3 billion is needed for pavement preservation in the next 4 years. The trend of anticipated expenditures by year is shown in the table and graphs below.
Year $Major
Rehabilitation $Major
Prevention $Minor
Prevention
Overall Comparative
Rating Score
Percent of System in Varying Conditions
Excellent (%)
Good (%)
Fair (%)
Poor (%)
Bad (%)
2010 $339,935,700 $291,087,300 $20,006,900 81.2 30 24 25 16 5 2011 $4,446,700 $167,565,700 $22,665,300 85.3 41 24 25 8 2 2012 $0 $189,044,700 $25,254,100 84.9 38 27 25 8 2 2013 $43,285,600 $212,776,400 $29,376,200 84.5 36 28 26 8 2 2014 $50,970,900 $248,504,100 $34,301,800 84.4 34 28 27 8 2 2015 $40,391,900 $290,812,700 $39,679,800 84.3 34 28 28 9 1 2016 $24,992,600 $336,689,300 $45,422,900 84.3 34 28 28 9 1 2017 $12,015,600 $385,496,800 $51,611,700 84.3 34 28 28 9 1 2018 $3,160,700 $438,033,300 $58,390,200 84.3 34 28 29 9 1 2019 $0 $495,114,500 $65,933,300 84.3 34 28 28 9 1 2020 $0 $0 $0 84.3 34 28 28 9 1

24 | P a g e
Historical Expenditures The graph below indicates pavement maintenance spending over the past 10 years:
J. Data Reliability TAM is guided by data driven processes; therefore it is imperative that Georgia DOT is confident in the reliability of the data being used. This is currently a challenge for the Department. The tables below indicate Georgia DOT‘s confidence in the reliability of the roadway asset and condition information in our database.
Road Surfacing
Data Attribute Very Uncertain Certain Reliable Highly Reliable
Asset quantity X Asset age X Condition X Performance X
Road Bases
Data Attribute Very Uncertain Certain Reliable Highly Reliable
Asset quantity X Asset age X Condition X Performance X
0
50000000
100000000
150000000
200000000
250000000
300000000
350000000
Year
$ Funding

25 | P a g e
K. IMPROVEMENT PLAN ‐ PAVEMENTS The State Maintenance Office guides GDOT in the overall decision‐making process for all statewide pavement preservation. To keep pavement maintenance practices efficient, the Department explores the use of new and improved materials, techniques and equipment.
Recent budgetary constraints have required Georgia DOT to defer planned reconstruction and resurfacing work. Lack of pavement preservation results in faster network deterioration. Deferred maintenance repair increases the risk of life‐cycle failures. Required maintenance never stabilizes — it only gets worse.
To better meet the needs of the Maintenance Office, Georgia DOT has developed a new tool – the Georgia PAvement Management System (GPAMS) program. In addition to providing forecast data for COPACES each year, GPAMS helps with analysis and prioritization. QA/QC tools, as well as additional improvements, are proposed for this program when funding becomes available. By upgrading the system to include the previously discussed risk factors, GPAMS will give Georgia DOT the ability to better predict current and future needs. The Office of Maintenance is currently testing risk factor types and associated factors to confirm their validity. The office is also evaluating whether other factors, such as safety, should be included as a risk factor.
Based on the established criteria, the pavement preservation process will be implemented through a combination of contract Let projects and internal work forces. GPAMS will provide the list of work that needs to be performed. Contracts will be developed by the Maintenance Office for work to be done by contractors. District Maintenance Offices will prepare an annual work plan, which will be reviewed by the State Maintenance Office, for all preservation work to be done by internal forces.
Georgia DOT’s Area Office performs yearly routine pavement inspections of every five miles of asphaltic roadway. Routes rated 75 or below by the Area Office are re‐inspected by the District Office (Asst. District Maintenance Engineer) and by the State Maintenance Office (Maintenance Liaison Engineer). Routes rated 70 or below by the State Maintenance Office are accepted into the resurfacing program. This practice is used to confirm field observations and to reduce subjectivity.
As discussed earlier, utilizing the modified COPACES rating which includes the risk factor score will allow Georgia DOT to better prioritize work needed to maintain the current system at the new standards based on the classification of the routes. The Department will make informed funding allocation decisions based on needs and the associated risk of not performing the work.
For routine maintenance, Georgia DOT must work with districts on statewide objectives to improve our condition levels. TAM principles identify program and funding strategies based on need; not location. As a result, if needs are not evenly distributed across the state, asset management funds may also not be evenly distributed. These decisions must be coordinated between the District and the leadership team.

26 | P a g e
IV‐2 LIFE CYCLE MANAGEMENT – BRIDGES
A. Service Level Statement Georgia bridges are maintained at a level to provide a safe and reliable means of travel. With respect to bridges, that goal encompasses these objectives:
• Maintain interstate, U.S. Route, State Route and Off‐System State‐Owned bridges such that they can carry all legal loads
• Maintain interstate, U.S. Route, State Route and Off‐System State‐Owned bridges such that they, at a minimum, have decks that are in good condition
B. How do we do this? The Bridge Maintenance Unit (BMU) is a unit of the Office of Bridges and Structures at Georgia DOT and is responsible for inspection of bridge structures and compliance with Code of Federal Regulations (CFR) TITLE 23, PART 650, Subpart C – National Bridge Inspection Standards (NBIS). The NBIS established by FHWA defines a “bridge structure” and sets minimum requirements for inspection of bridge structures. Compliance with NBIS inspection guidelines is a requirement of the law.
Bridge inspection is a two part process:
1) Inspection – Bridge inspectors conduct on‐site bridge structure inspections to determine and report current conditions.
2) Load Rating – Bridge engineers use the inspection report, plans and structural programs to analyze the bridge structure to determine the load carrying capacity. If the capacity is less than legal truck weights, the bridge structure will require posting (signs at the ends of the bridge structure detailing the maximum allowable truck weights) or closing.
A key component of compliance with NBIS requirements is to annually submit reports to FHWA documenting that NBIS requirements have been met.
In addition to inspection and load rating of bridge structures, the BMU has other responsibilities including, but not limited to:
• Maintaining the Bridge Information Management System (BIMS) in order to effectively manage bridge assets throughout the state.
• Communicating with local bridge owners regarding posting requirements and routine maintenance.
• Mobilizing inspection and maintenance resources to address emergency needs (flooding, bridge collisions, etc.).
C. About Georgia’s Bridges Georgia DOT maintains over 6,600 bridge structures. A highway “bridge structure” is a structure carrying traffic loads with a minimum clear span length of 20 feet measured at the centerline of the

27 | P a g e
roadway. It is erected over a depression or an obstruction, such as water, a highway or railway. The term “bridge” is intended to pertain to culvert and pipe structures as well as traditional bridge types.
D. Key Issues • There are approximately 6,600 on‐system or state owned bridges in Georgia. Assuming an
average maximum life span of 75 years, this means that on average we should replace 88 bridges per year. This equates to a yearly cost of $176 million. Current funding limits allow approximately $85 million per year to be spent on bridge replacements.
• The interstate system is approaching 60 years old. Until now most bridges were replaced as a part of widening projects. In years to come, Georgia DOT will need to begin to strategically replace interstate bridges for other reasons (condition, load capacity, etc.)
• In addition to bridge replacements, routine bridge maintenance must be addressed on the state system. This includes painting, deck and joint sealing, and scour repair. Larger maintenance issues such as joint replacement, deck replacement and damaged beam replacement must also be addressed. We need to ensure that the “right” maintenance is done at the “right” time for the “right” bridges.
E. Strategies for Managing Key Issues • Like other assets, the Department’s policy on bridge replacement has been skewed toward a
"worst first" method of prioritization. In addition, certain conditions triggered automatic replacement of the structure, even if there was very low risk.
• Recent changes require that the State Bridge Maintenance Engineer prepare the project Need and Purpose statement for a bridge project. This will enable the Bridge Office to determine from the bridge inspection report whether a rehabilitation or a total replacement is more appropriate for a structure.
• Construction strategies should be identified to allow cost‐effective bridge projects to be implemented sooner and faster.
• A policy should be developed to determine how Georgia DOT will identify Bridge Preservation projects; the goal being to derive the most agency and user benefit with the specified funding.

28 | P a g e
F. Asset Value – Bridges The total value of Georgia’s bridges is indicated in the table below. The value is based on current average replacement costs. The exact value of individual bridges varies.
The following table shows the number of bridges that currently fall below desired target levels and the amount of funding required in 2010 dollars to bring them to the desired target level.
Strategic Objective Number of Bridges Below
Target Level
Total Deck Area(Sq Ft)
Cost of Bridge (per Sq Ft)
Total Cost
Maintain interstate bridges such that they can carry all legal loads
0 0 $105 $0
Maintain interstate bridges such that they, at a minimum, have decks that are in good condition
261 4,499,000 $55 $247,445,000
Maintain U.S. Route bridges such that they can carry all legal loads
20 185,000 $90 $16,650,000
Maintain U.S. Route bridges such that they, at a minimum, have decks that are in satisfactory condition
132 1,845,000 $45 $83,025,000
Maintain State Route bridges such that they can carry all legal loads
66 518,000 $90 $46,620,000
Maintain State Route bridges such that they, at a minimum, have decks that are in fair condition
39 573,000 $45 $25,785,000
Maintain Off‐System State‐Owned bridges such that they can carry all legal loads
15 131,000 $90 $11,790,000
Maintain Off‐System State‐Owned bridges such that they, at a minimum, have decks that are in fair condition
7 96,000 $45 $4,320,000
Funds Needed to Move Current Assets to Desired Target Levels $435,635,000
Structure Location
Total Number of Structures
Total Deck Area (Sq Ft)
Replacement Costper Sq Ft
Total Replacement Cost
Interstates 1129 21,846,000 $105 $ 2,293,830,000 US Routes 1896 19,510,000 $90 $ 1,755,900,000 State Routes 3020 23,747,000 $90 $ 2,137,230,000 Off System
State Owned 559 924,000 $85 $ 78,540,000
TOTAL 6604 $ 6,265,500,000

29 | P a g e
G. Remaining Life – Bridges Bridges experience a natural aging process. Each bridge is unique in the way it ages due to varying factors including material makeup, weather and traffic loads. While there is no way to define an exact useful bridge life, for the purpose of asset management, useful life is considered to be 75 years. The following table shows the existing age of bridges in the state.
Route Type Bridge Age (in years)
< 10 10 to 20
20 to 30
30 to 40
40 to 50
50 to 60
60 to 70
70 to 80
80 to 90
90 to 100
Total
Interstate 35 32 191 331 503 37 0 0 0 0 1129US Route 236 210 241 176 238 288 132 258 112 5 1896State Route 339 419 302 278 449 585 288 292 63 5 3020Off System State Owned
43 51 94 129 214 23 3 2 0 0 559
Totals 653 712 828 914 1,404 933 423 552 175 10 6,604 H. Asset Risks and Ways to Manage Risk ‐ Bridges The greatest risk associated with bridge structures is the loss of the structure for the purpose it was constructed. A bridge can deteriorate to the point that it loses its ability to carry full loading for the road system of which it is a part. When this occurs, the bridge must be posted for a lower load capacity. If a route has a posted bridge, then a vehicle weighing more than the amount posted must use an alternate route. Vehicles using these alternate routes incur additional user costs due to the longer route traveled. Considering this, bridges with the greatest risk potential are those that carry the highest volume of traffic and have the longest "detour length" for alternate routes.
Risk also increases as the classification of the road system increases, with interstates generally having the highest risk and off‐system routes generally having the least risk.
In addition to the inspection and analysis methods previously mentioned, the Bridge Prioritization Ranking (BPR) formula was developed to assist in ranking the state’s bridge projects. This tool concentrates the Department's efforts on structures with the greatest combined risk, rather than on those in the poorest condition.
The Bridge Prioritization Ranking formula is based on two principles: structural capacity and user demand. Structural capacity is based on the strength of the structure to carry vehicle loads, the condition of the different components of the bridge and the type of structure. User demand considers the amount of traffic crossing the bridge, the length of the detour if the bridge is not in service, restrictions on truck weight and classification of the roadway.

30 | P a g e
The Bridge Office uses the ranking from the BPR to identify which bridges are candidates for rehabilitation or replacement and where these bridges need to be scheduled in the construction work program.
The Bridge Information Management System (BIMS) contains standard data elements for each bridge (state‐owned and locally‐owned) in Georgia. These data elements are collected and updated by the Bridge Maintenance Unit (BMU) during a scheduled inspection or when conditions change and the BMU is asked to inspect a bridge. Four data elements (HS Inventory, ADT, Bypass Length and Bridge Condition) are given a higher weight than others in the formula.
Components of the Bridge Prioritization Ranking formula • Inventory Rating ‐ an indicator of the bridge's load carrying capacity. In essence, this answers
the question "How strong is this bridge?"
• Average Daily Traffic ‐ the number of vehicles, on average per day, that use the bridge each year.
• Bypass ‐the distance, in miles, that a vehicle must travel if the bridge is posted or closed.
• Bridge Condition – a factor that indicates the overall condition of the bridge deck, substructure and superstructure.
• Risk Factor ‐ used to weigh the risk associated with the various classifications of roadway systems for which the bridge is a part. This is not a NBIS data item.
Additional weight is also given to bridges with timber components, reduced weight limits, repairs, substandard vertical or horizontal clearance, fracture critical and unknown or scour critical foundations.
The Bridge Prioritization Formula considers risk factors for bridge projects and serves as a tool and starting point to guide decision making. Georgia DOT prepares a new State Transportation Improvement Program (STIP) annually. During STIP development bridge projects are ranked using the formula. Other factors including congressional balancing, proximity to other relevant work, and engineering judgment are considered to establish a final ranking of projects. The development of the 2011‐2014 STIP was the first time the bridge formula was used for ranking projects. A standard method for optimizing decisions regarding maintenance strategies for bridges should be developed.
I. Revenue Plan Assuming a 75‐year useful life, GDOT would need to replace approximately 88 bridges annually. Coupled with annual maintenance and repair requirements, this equates to approximately $210 million annually. The following graph shows the trend of on‐system bridge funding over the past 10 years. Totals
include projects that were authorized for both bridge maintenance and replacement.

31 | P a g e
J. Data Reliability The table below indicates Georgia DOT’s confidence in the reliability of the asset and condition information in our database:
Bridges
Data Attribute Very Uncertain Certain Reliable Highly Reliable Asset quantity X Asset age X Condition X Performance X
K. IMPROVEMENT PLAN ‐ BRIDGES Budgetary constraints have caused Georgia DOT to defer some planned maintenance. As faster deterioration of inventory occurs, deferring maintenance repair increases the risk of life cycle cost increases. Required maintenance never stabilizes — it only gets worse.
Recently, Georgia DOT reorganized and combined bridge design and bridge maintenance into a single Office of Bridges and Structures. This office will drive all bridge maintenance and replacement activities and projects.
$63 $61$72
$126
$243
$351
$156
$91
$38
$79
$0
$50
$100
$150
$200
$250
$300
$350
$400
2001 2002 2003 2004 2005 2006 2007 2008 2009 2010
Cost In
Millions Annual Revenue Needs

32 | P a g e
Operations and Maintenance Bridge maintenance is required to keep Georgia’s bridges in a safe, serviceable condition at a specific level of service. The key strategy in delivering predetermined levels of service in the most cost‐effective way is to focus on prolonging useful life. Georgia DOT manages the asset risk by implementing a bridge maintenance program that includes several progressive levels of maintenance, with each level dependent on the preceding. If a maintenance level is not performed as scheduled and as detailed, the next level will require more repairs, which will be more extensive and costly.
1. Routine Bridge Maintenance ‐ scheduled basic maintenance that is labor intensive; time consuming; requires very little training of personnel; uses a low volume of a few materials (silicone sealant, epoxy) and hand tools (trowel, knife); but requires expensive, heavy equipment (sweeper, high volume washer).
2. Preventative Bridge Maintenance ‐ activities that are required as a result of weather (above or below the Fall Line), bridge age, and usage (ADT, percent of trucks, location). Preventative Bridge Maintenance activities (joint replacement, spall repair, painting, deck and joint sealing) require personnel to be trained, uses a high volume of many materials (silicone sealant, epoxy concrete, reinforcing steel) and requires more hand tools and heavy equipment (jack hammers, jack pumps, concrete mixers, sand blasters).
3. Rehabilitation Bridge Maintenance ‐ is required as a result of deferred maintenance, overloading, overuse, or increase in legal truck weights; to the extent that the existing structure is not capable of functioning as efficiently as it should.
4. Emergency Bridge Maintenance ‐ is generally required due to a structural risk.
Improvement Strategies
• Identify funding strategies based on need; not location per TAM principles.
• Update and publish the Bridge Maintenance Manual
• Address severe staffing issue facing Office of Bridges and Structures
• Expand the use of PONTIS or alternative system to drive decision making
• Formalize methodology for identifying and prioritizing strategies to prolong useful life
• Periodic review of the prioritization formula including refinements as necessary

33 | P a g e
IV‐3 LIFE CYCLE MANAGEMENT – HIGHWAY SIGNS
A. Service Level Statement Georgia’s signs are maintained at the minimum retro‐reflectivity levels prescribed in the current Manual on Uniform Traffic Control Devices (MUTCD). Well‐maintained signs contribute to the safe and orderly movement of highway users.
B. How Do We Do This? Georgia DOT maintains its signs through the Sign Inventory Maintenance System (SIM II) project and by monitoring of retro‐reflectivity measurements. Sign maintenance activities also include day and night inspections, preventive maintenance (sign cleaning, vegetation control), and repairing or replacing signs when needed.
C. About Georgia’s Highway Signs While Georgia has not historically kept a comprehensive sign inventory, this process is underway. Georgia DOT estimates that there are approximately 3.5 million highway signs on state facilities. These consist of Type I Signs – less than 9 ft²; Type II Signs – more than 9 ft²; ground mounted panel type signs; and overhead panel type signs. These include regulatory, warning and guide signs. Support types include wood, square tube, u‐channel, wood strain poles, steel strain poles, concrete strain poles, overhead span wire and overhead structural supports.
D. Key Issues To be compliant with the revised MUTCD, a sign inventory management method must be in place by January 2012. The method, SIMS II, is in place and the gathering of inventory data will begin mid FY 2011.
Another issue facing GDOT is the number of missing signs. The cost and quantity of missing signs is unknown. This may be the result of a decrease in funds allocated to the renewal program. The three year production trend captures the following:
Year Fiscal Year 2008 Fiscal Year 2009 Fiscal Year 2010 Georgia Corrections Industries
$2,708,843 $791,514 $623,724
GDOT $461,336 $447,430 $302,996 TOTAL $3,170,185 $1,238,944 $926,720 E. Strategies for Managing These Issues In order to determine the condition of the signs, an inventory must be completed. To assist with data collection, Georgia DOT will purchase 77 handheld barcode scanners. Once the devices are configured to fully integrate into the SIMS II database, data collection will begin.

34 | P a g e
F. Asset Value – Highway Signs Based on the assumption that there are 3,500,000 signs, estimated values are:
• Average – 4 ft2/sign = 14,000,000 ft2 X $4.00/ft2 = $56,000,000 – signs only
• Average – 9 ft2/sign = 31,500,000 ft2 X $4.00/ft2 = $126,000,000 – signs only
• Average – 12 ft2/sign = 42,000,000 ft2 X $4.00/ft2 = $168,000,000 – signs only
G. Remaining Life – Highway Signs The useful life of highway signs is defined as the length of time that the asset maintains a retro‐reflectivity at or above the minimum level required by FHWA as found in the MUTCD. While the actual useful life will vary, it could also be considered, as the length of time the manufacturer will warrant the product. The manufacturer’s warranty for sign sheeting material is 10 years. Other components have a warranty of more than 10 years.
For example, a stop sign fabricated with ASTM D4956, Type IX sheeting could be damaged due to an accident and only have a useful life of five years. On the other hand, a speed limit sign fabricated with the same type sheeting could be in service for 13 years and still meet or exceed the minimum level of retro‐reflectivity, resulting in a longer useful life. Potentially, 10% of the existing signs may be deficient.
Red series or regulatory signs are repaired or replaced within 24 hours after they become non‐functional.
H. Asset Risks and Ways to Manage Risk – Highway Signs Potential risks associated with not repairing or replacing red series or regulatory signs within 24 hours could be high. There are numerous occurrences across the country where a missing or damaged stop sign may have contributed to a crash that led to serious injury and death.
An aggressive plan to repair and replace signs is in place. To comply with federal MUTCD guidelines, GDOT personnel continue to routinely perform daytime and nighttime sign inspections as part of the Highway Maintenance Management System (HMMS) and to implement one or a combination of the methods below:
• Visual Assessment – Nighttime visual inspection of retro‐reflectivity may be conducted by qualitative observation using one or a combination of the following:
o Calibration signs – This method deals with using sample signs that are at or near minimum levels. During nighttime inspection, the observer views the sample signs from a vehicle and compares them against in‐place signs to determine those that need replacement.
o Comparison panels – This method involves obtaining sample panels at or near minimum levels. During nighttime inspection, the inspector clips the panel to the in‐place sign to make a direct comparison. If the panel appears brighter, then the sign must be replaced.

35 | P a g e
o Consistent parameters – This method uses consistency as a reasonable way to inspect for non‐compliant signs. Observations are made at regular highway speeds from the right travel lane.
• Expected Sign Life – This method calculates sign life from known sign retro‐reflectivity deterioration rates based on sheeting color and sheeting type. Individual signs are replaced when they reach the end of their expected service life. Most GDOT signs have a decal on the back of the sign that has the fabrication date and installation date indicated.
• Blanket Replacement – This method involves replacing all signs along a corridor, within an area, or of same sign and sheeting type.
I. Revenue Plan
Assuming 3,500,000 signs with 10 percent not in compliance each year, for the next 10 years, the estimated revenue needed to maintain signs at the minimum level of compliance would be a minimum of $5,600,000 per year. Maintenance revenue and data collection revenue are funded by State Motor Fuel tax and Federal Funds.
From FY 2008 to FY 2010, the maintenance expenditure for sign replacement decreased from $3,170,185 to $926,720 or 70.8%.
J. Data Reliability Since Georgia DOT has not traditionally maintained sign inventory data, assumptions regarding total number of highway sign assets are not reliable. Data collection will begin mid FY 2011.
L. IMPROVEMENT PLAN – HIGHWAY SIGNS
Districts perform routine daytime and nighttime inspections to identify signs that have low retro‐reflectivity. Regulatory signs such as “STOP,” “YIELD,” “DO NOT ENTER” or “WRONG WAY,” are repaired or replaced within 24 hours after the sign becomes non‐functional. Expenditures on replacement signs purchased through Georgia Correctional Industries have decreased 70.8% over the last three years. In addition, sign maintenance, which includes repair and/or replacement, has decreased over 40% during the same three years. These failures to perform sign replacement could cause GDOT to be out of compliance with new MUTCD minimum guidelines for sign retro‐reflectivity. With completion of a sign inventory management system, GDOT will use a TAM approach to executing highway sign maintenance.
Operations Georgia DOT’s overall operations and maintenance goal is to maintain highway signs at or above the minimum retro‐reflectivity level. A systematic approach will be implemented to identify the total number of signs that need replacement each year based on useful life or expected service life. Once

36 | P a g e
sign inventory is completed in SIMS II, the remaining service life for signs can be determined and used as a baseline for projecting budget expenditures.
Maintenance Sign maintenance includes:
• Inspection
• Preventive maintenance
• Repair and replacement
Georgia DOT is responsible for maintaining all signs on the state highway system and interstates at a defined performance level of service in order to meet the needs of the road users. The performance level of service is defined as the level at which a sign meets the minimum level of retro‐reflectivity as found in the MUTCD.
Renewal Plan – Highway Signs The Department has proposed a Plan for creating an inventory of existing sign structures and ultimately identifying signs for repair/replacement. The steps include:
• Acquire eight or nine portable handheld reflect‐o‐meters for verification and validation of questionable highway signs
• Acquire data collection devices ‐ Georgia DOT will acquire 77 handheld barcode scanners to assist with data collection.
• Begin field data collection ‐ Data collection is expected to begin mid‐fiscal year 2011, once the devices are configured to fully integrate into the Sign Information Management System (SIMS) database.
• Identify signs that have exceeded their useful service life
o Barcodes will be affixed to the back of each sign and specific data will be recorded
o Overhead sign structures are more costly to maintain compared to standard flat sheet aluminum signs. Fabrication costs are 3 ½ times more expensive and even more costly if the overhead structure does not meet new design guidelines and replacement is required.
• Identify corridors where new projects can be programmed for blanket replacement of signs ‐ Georgia DOT may determine to replace all signs along a corridor, within an area, or of the same sign and sheeting type. An example would be when an improvement project will take place in the area in the near future.
• Georgia DOT will collect and maintain sign inventory that will help better anticipate future replacement costs

37 | P a g e
V ‐ FINANCIAL SUMMARY
Georgia DOT Budget Georgia DOT’s FY 2011 budget is $1.8 billion; the previous year’s budget (FY 2010) was $1.9 billion. In both years, over 99 percent of the funding was from motor fuel taxes, federal funds, and other sources; less than 1 percent was from State General Funds. The graph below shows a two year (2009 and 2010) comparison of how the Department used taxpayer money.
The Department bases future budgets on the current year’s funding. Consequently, it is important that the Department carefully plans future expenditures based on sound principles such as TAM.

38 | P a g e
VI ‐ TAM EFFORTS TO DATE
Establishment of the TAM Task Force in the first quarter of FY 2011 formalized the Department’s commitment to the TAM practice of investing in projects where need and risk to mobility are the greatest. The Georgia DOT Task Force consists of leaders who are responsible for collecting, storing or managing data. The meetings proved fruitful in terms of sharing information on data that each office “owned.”
Completing the self‐assessment was the first assignment of the Task Force. The assessment was an opportunity to analyze current practices and to determine where improvements are needed. Not surprisingly, the results from the self‐assessment revealed several challenges. These included data inconsistency, a lack of documented comprehensive processes, inconsistencies in criteria used to set program priorities, and inconsistencies with projections of future revenues. Data accessibility, data integration and information systems integration were identified as high risk areas within the Department. Maintenance strategies that involve monitoring, reporting, planning, scheduling and program control were also identified as a high risk.
Initially, the TAM Task Force’s primary effort was data; its quality, storage, accuracy, and reliability. However, the magnitude of the effort was only realized when the data presentations were completed. As a result, the Data Governance effort was conceived. Data Governance is a process that uses a working level group and an executive level group to monitor and manage changes to our data collection and IT processes. The Division of IT will lead our Data Governance process.
In June 2010, the FY 2011 Strategic Plan Update was developed to reflect the Department’s new goals as well as its focus on TAM practices. Objectives and target performance levels were established for each of the four goals identified in the Strategic Plan.
Implementation of TAM principles has begun in the maintenance areas of pavements, bridges and signs with the intent to expand these principles to other asset management programs within the Department. However, this is only beginning. The Office of Maintenance is working with IT to temporarily add the newly developed risk factors to the COPACES rating. Once the risk factors are validated/adjusted, their application will be added to the COPACES program which was developed through the Georgia Institute of Technology (GA Tech). GA Tech is also exploring a risk factor involving safety which could be added to the COPACES rating.
The Office of Bridge Design has modified its Bridge Prioritization Formula to include risk factors for HS loading, ADT, bypass length and bridge condition. They have validated the results and are moving forward using these risk factors.
GDOT has initiated a statewide routine maintenance effort based on statewide maintenance needs. In coordination with the districts, Office of Maintenance is developing statewide Highway Maintenance Management System (HMMS) goals for districts along with the standard conditions for each asset

39 | P a g e
category. District and area engineers have been informed of this effort; coordination with the Districts will be critical.
The Department recognized early that communicating Transportation Asset Management is essential, not only for organizational buy‐in, but also for allowing each employee the opportunity to learn about TAM. Employees must understand how TAM benefits overall processes, and determine what role their job has in meeting TAM‐related goals. Communication tools for TAM have included emails, Connector newsletter, and presentations. However, the Department realizes that it may be difficult and require time to explain the concept to front line employees and show them how TAM is relevant to their every day jobs. This is an ongoing effort that will require extensive time and effort.
An official Communications Plan is under development. Developing a Transportation Asset Management Communications Plan sets a direction on how and to whom to communicate TAM related information. To be effective, the plan should speak to individual employees and lead them to consider how the solution to a problem they are working on will move Georgia DOT to better asset management; or in simpler terms how our decisions extend the life of our assets that pose the greatest risk if they can no longer perform their function. Having an official internal Communications Plan does not guarantee adherence. The leadership team is encouraged to discuss the principles of TAM when communicating between themselves and with their staff.
Georgia DOT’s Highway Maintenance Management System (HMMS) is client‐based, but efforts are also underway to make the HMMS tool web‐based. Advantages include easy access to information from any computer during meetings, having one HHMS application on the web instead of issuing multiple copies to individual users, and easier and less costly management of the web‐based application.
Finally, two members of Georgia DOT leadership attended a TAM Scanning Tour, which included the states of Washington, Indiana and North Carolina. The purpose of the tour was to learn how other states have implemented TAM principles and to compare Georgia DOT’s implementation steps. Georgia DOT learned that North Carolina DOT has successfully implemented a dashboard reporting system and includes TAM in all performance reviews. Indiana DOT established good scenario analysis with pavements and bridges. Washington State DOT implemented reporting and transparency by providing web‐access to all of its TAM related data. Washington and North Carolina DOTs also have well advanced data governance programs.

40 | P a g e
VII – WHAT’S NEXT WITH TAM?
Management realizes that by adopting TAM practices, the focus for Georgia DOT may shift from retaining the best maintained or smoothest roads in the nation, to meeting the needs of our customers by protecting and extending the life of our assets.
To formalize and make the Transportation Asset Management Program official, GDOT used New Jersey DOT’s guidelines in developing its Transportation Asset Management Policy. The purpose of this policy is to adopt Transportation Asset Management as an official, institutional approach to manage infrastructure assets and make capital investment decisions.
Georgia DOT’s goal moving forward is to establish where prudent and feasible an inventory including the condition and a risk formula for each asset category that the Department owns and manages. These include things such as drainage structures, signals, guard rails and retaining walls. As processes are defined for the various Georgia DOT asset categories, sections similar to those currently included for pavements and bridges will be added to this TAM document.
Georgia Institute of Technology is currently conducting a study to evaluate TAM efforts to date and to make recommendations as to which assets are in greatest risk and need of implementation of TAM practice. This will help guide the Department in determining which asset(s) should be addressed in the near, mid and distant future.
As TAM progresses, the Department will need to develop a process for evaluating the benefit of each program against the investment made in the program. This will require quantifiable measures that can be electronically measured and normalized so that programs can be compared to each other. In other words, a method for calculating a program level benefit/cost must be developed.
Considering that data is the core of TAM, it is essential that the Data Governance program be fully implemented. Consistent, reliable and accurate data will be kept in the system for everyone at Georgia DOT to use.
For TAM to be fully implemented and understood by all levels of the organization, transparency is required. To do this, Georgia DOT is developing a tool to allow easy access to our performance measures and their results. This is commonly known as a “dashboard.” A Project Initiation Request has been submitted to the IT Division for review and approval through the Data Governance process. It is important that the Department establishes effective measures from which to guide Departmental decisions. For this reason, the Leadership Team has identified which of the numerous potential Performance Measures are required to make crucial decisions regarding Departmental policy and funding decisions. The results of these measures will be included on the Department’s dashboard. All other measures will be relocated to a Division/Office level. These measures will be tracked within each Division or Office and will be crucial to the decision‐making process at those levels.

41 | P a g e
There is also a need to develop a tool to monitor state infrastructure. Georgia DOT envisions a GIS Data Visualization tool containing asset inventory, traffic data, asset condition, and mobility. This information would be available for viewing on a layered basis. As the Department moves forward efforts will be made to develop this tool.
As TAM is solidified within the Department, GDOT will inform cities and counties of its TAM practices and encourage them to adopt these processes for their own use. This will enable cities and counties to become more proactive in protecting their assets. The Department should communicate asset management information including the benefits of following this approach, to Association of County Commissioners of Georgia/Georgia Municipal Association ACCG/GMA.
VIII – CONCLUSION
The Department has long recognized the importance of Transportation Asset Management. The tools and methods previously used, such as the “worst first” philosophy, are being transitioned to a data and risk‐based philosophy. The Department has adopted a Policy on Asset Management (Appendix 2). In addition, the Department is committed to documentation of the processes it uses to achieve TAM, as well as the development of electronic tools that will share information and assure transparency. This significant change in thinking will not occur overnight. While states like Washington and Indiana have worked for years to establish TAM processes, they still admit that they have a long way to go. With the documentation of TAM as Georgia DOT’s strategic direction, the Department has made a significant first step and has set the path for moving forward to protect Georgia’s transportation assets in the most efficient and effective way.

42 | P a g e
Appendix 1

43 | P a g e

44 | P a g e

45 | P a g e

46 | P a g e

47 | P a g e

48 | P a g e

49 | P a g e

50 | P a g e

51 | P a g e
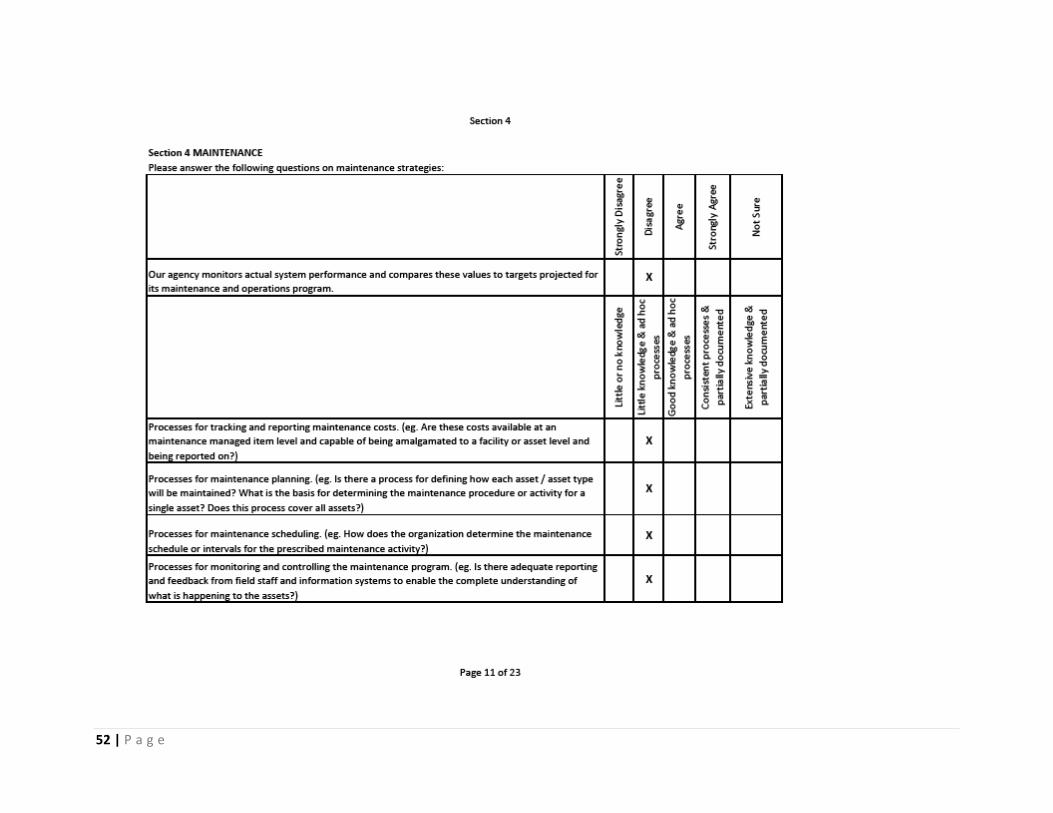
52 | P a g e

53 | P a g e

54 | P a g e

55 | P a g e

56 | P a g e
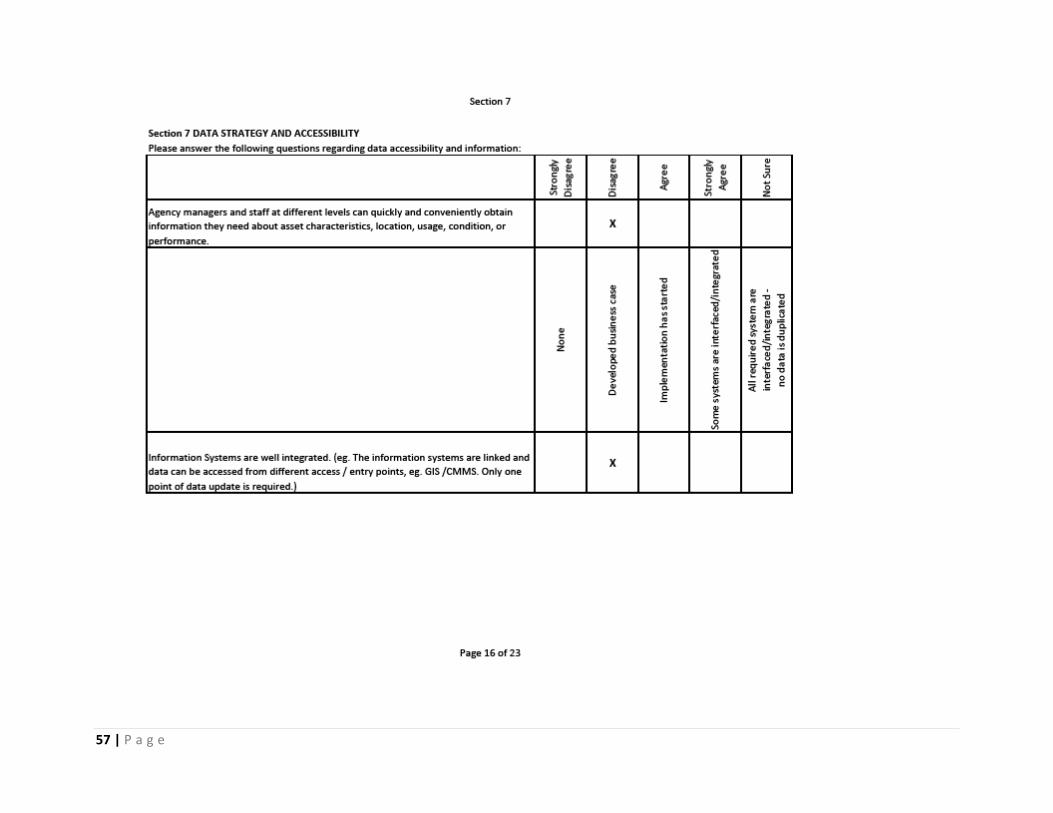
57 | P a g e

58 | P a g e

59 | P a g e
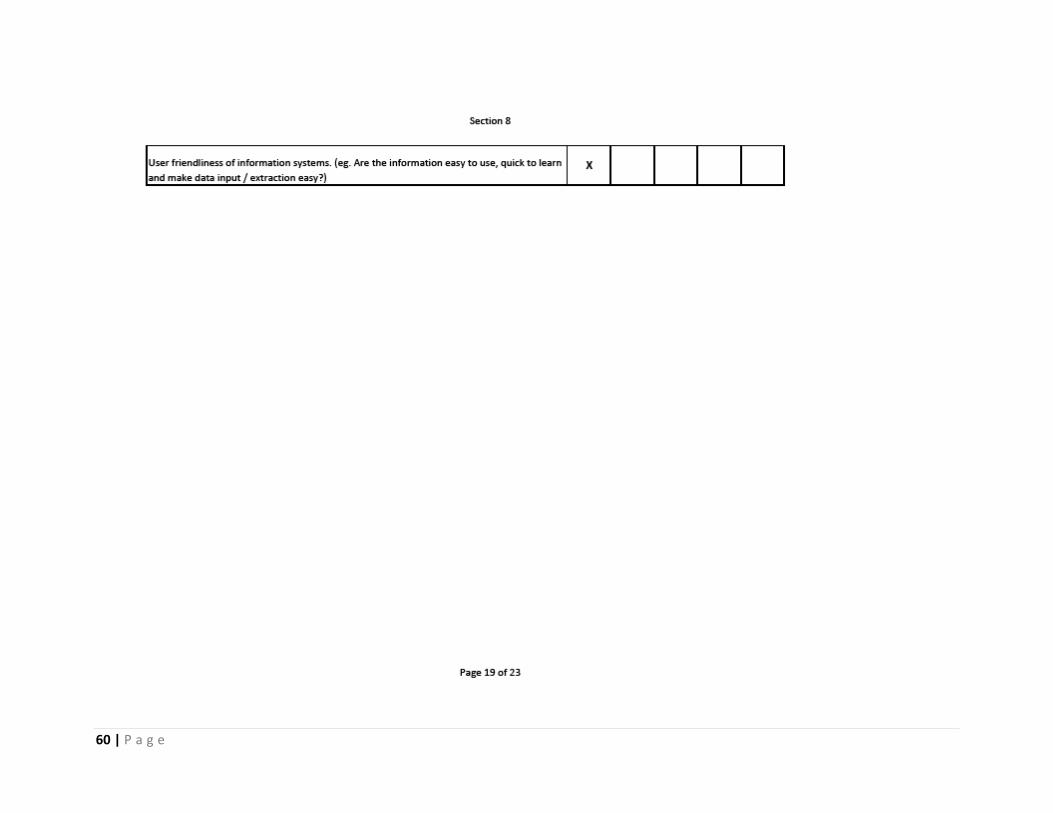
60 | P a g e

61 | P a g e

62 | P a g e

63 | P a g e

64 | P a g e

65 | P a g e
Appendix 2
DEPARTMENT OF TRANSPORATION PROCEDURE
I. Purpose The purpose of this policy is to adopt Transportation Asset Management as the official, institutional approach in managing infrastructure assets and making capital investment decisions at the Georgia Department of Transportation (GDOT).
This approach will serve to support and compliment the 20 year Statewide Strategic Transportation Plan, the State Transportation Improvement Plan, as well as to the agency’s annual Strategic Plan.
II. Background GDOT, as well as other state transportation departments, is facing ever increasing challenges in funding transportation improvements. Although GDOT strives to preserve and improve our transportation system on an ongoing, systematic basis, there is inherently a shortfall of funding needed to achieve these strategic goals.
In order to address this challenge, GDOT must take a more holistic approach to preserving and improving the transportation system. Asset management offers an alternative to focusing solely on problem spots or worst conditions. GDOT will look at an entire asset class based on functional classification and strive to keep that class in an overall desired condition level. This requires that more effort will be made to maintain and preserve assets that are in good condition.
The Federal Highway Administration and the American Association of State Highway and Transportation Officials define Asset Management as a “systematic process of maintaining, upgrading, and operating physical assets cost‐effectively.” GDOT will follow this definition of asset management.
III. Policy The Mission of GDOT is to provide a safe, seamless and sustainable transportation system that supports Georgia’s economy and is sensitive to its citizens and environment. Within that concept, GDOT’s core functions are to
SUBJECT: GDOT Asset Management Policy Effective Date:
Commissioner Approval: Sponsor Approval: Executive Director, Organizational Performance Management Contact Telephone #: 404-347-0610

66 | P a g e
operate, maintain, and improve the state’s transportation system. Resources to effectively carry out those functions
are finite; needs always exceed resources. It is, therefore, essential that GDOT uses those resources in the most cost‐effective manner.
Accordingly, GDOT will develop an Asset Management Program consisting of two primary elements:
In order to effectively and efficiently put into place an Asset Management Program, the Policy recommends the following:
1. The Office of Organizational Performance Management will be responsible for implementing a Department‐wide Asset Management Program.
GDOT will utilize an Asset Management approach to operate, preserve, and improve GDOT infrastructure assets, focusing on roads and bridges initially, and extending to signs, signals, drainage structures, and roadway markings on a step‐by‐step basis. All GDOT assets will eventually be included.
1. An overall Asset Management Plan for GDOT assets. The plan will provide an inventory of specific assets, conditions of specific assets, a performance target for specific assets, and a framework for how best to achieve the performance target through a mix of investments.
2. An overall Asset Management Improvement Strategy. The strategy will look at GDOT’s proficiency and maturity in Asset Management practice. The strategy will identify strengths and weaknesses in the overall and individual Asset Management plans, Asset Management methodologies and practices, and will set goals for improving them.
2. An Asset Management Steering Committee has been established to guide implementation of this Policy and to provide oversight of the GDOT’s TAM effort. The Committee consists of the following GDOT’s representatives: Chief Engineer (Chair), Deputy Commissioner, Director of Organizational Performance Management, Director of Engineering, and Director of Permits and Operations.