Transportation Alternatives
23
Transportation Alternatives 2013 Post NYC Mayoral Primary Agenda PENN SCHOEN BERLAND 1110 VERMONT AVENUE, NW SUITE 1200 WASHINGTON, DC 20005 25 September 2013 NEW YORK • WASHINGTON • DENVER • SEATTLE • LOS ANGELES • SAN FRANCISCO • LONDON • HONG KONG
Transcript of Transportation Alternatives

Transportation Alternatives 2013 Post NYC Mayoral Primary Agenda
PENN SCHOEN BERLAND 1110 VERMONT AVENUE, NW SUITE 1200 WASHINGTON, DC 20005 25 September 2013
NEW YORK • WASHINGTON • DENVER • SEATTLE • LOS ANGELES • SAN FRANCISCO • LONDON • HONG KONG

© 2013 PENN SCHOEN AND BERLAND ASSOCIATES LLC.
Transportation Alternatives Post NYC Mayoral Primary Study 2013
2
Methodology The information contained in this report is from a study conducted by Penn, Schoen & Berland Associates, LLC. (PSB), a Washington, D.C.-based strategic research and communications firm. The study was conducted by telephone among 875 New York City likely voters (including 544 triple prime voters and 676 double prime voters) from September 11 – 18, 2013. The margin of error for this study is +/- 3.31% at the 95% confidence level and larger for subgroups. Some percentages may total more than 100% due to rounding. Tracked data reflects the Transportation Alternatives October 2011 study. Voluntary responses such as “don’t know” are indicated by (Vol.). Definition of Crosstabs
Crosstabs Definition % of all Likely voters All likely voters in this study 100
General Vote d'B Prefers de Blasio in general election 60 Lta Prefers Lohta in general election 19 DK No preference in general election 20
Borough
Qu Queens 21 Bky Brooklyn 34 Brx Bronx 15 Man Manhattan 25
Pub 1+/wk Rides subway or bus at least once per week 51 Car Car owner 61
Triple Prime Voted in 2013 Mayoral primary, 2010 primary for Governor and the 2009 primary for Mayor 61
Identifies as… Dem Strong or weak Democrat 66 Rep Strong or weak Republican 11 ind independent, other, or don’t know 22
Gender M Male 46 F Female 54
Age
<35 Less than 35 years old 18 35-49 35-49 years old 29 50-64 50-64 years old 31 65+ 65 or more years old 22
Race
Wh White 46 Bl Black 28
Hsp Hispanic 17 Oth Other 9
Income
<$35k HHI of less than $35,000 23 $35k-$75k HHI between $35,000 and $75,000 29
>$75k HHI greater than $75,000 33

© 2013 PENN SCHOEN AND BERLAND ASSOCIATES LLC.
Transportation Alternatives Post NYC Mayoral Primary Study 2013
3
Primary Election 1. Did you vote in the September 10 primary elections for Mayor and other citywide offices?
(%) Likely Voters General Vote Borough Pub
1+/wk Car Triple Prime
Identifies as… d’B Lta DK Qu Bky Brx Man Dem Rep ind
Yes, did vote 74 76 69 67 67 78 73 75 77 74 84 75 72 69 No, did not vote 26 24 31 33 33 22 27 25 23 26 16 25 28 31
(%) Likely Voters Gender Age Race Income M F <35 35-49 50-64 65+ Wh Bl Hsp Oth <35k 35-75k >75k
Yes, did vote 74 75 73 66 71 75 80 74 76 73 63 72 72 78 No, did not vote 26 25 27 34 29 25 20 26 24 27 37 28 28 22
2. How likely are you to vote in the November 5th general election for Mayor and other
citywide offices?
(%) Likely Voters General Vote Borough Pub
1+/wk Car Triple Prime
Identifies as… d’B Lta DK Qu Bky Brx Man Dem Rep ind
Definitely vote 87 88 88 83 89 82 89 92 88 88 92 88 87 86 Probably vote 13 12 12 17 11 18 11 8 12 12 8 12 13 14 Might or might not - - - - - - - - - - - - - - Probably not vote - - - - - - - - - - - - - - Definitely not vote - - - - - - - - - - - - - - Don’t know (Vol.) - - - - - - - - - - - - - -
(%) Likely Voters Gender Age Race Income M F <35 35-49 50-64 65+ Wh Bl Hsp Oth <35k 35-75k >75k
Definitely vote 87 86 89 75 88 92 90 86 88 88 93 81 88 92 Probably vote 13 14 11 25 12 8 10 14 12 12 7 19 12 8 Might or might not - - - - - - - - - - - - - - Probably not vote - - - - - - - - - - - - - - Definitely not vote - - - - - - - - - - - - - - Don’t know (Vol.) - - - - - - - - - - - - - -
NOTE: By definition, likely voters had to “definitely vote” or “probably vote.”

© 2013 PENN SCHOEN AND BERLAND ASSOCIATES LLC.
Transportation Alternatives Post NYC Mayoral Primary Study 2013
4
3. If the general election was being held today and the choices were Democrat Bill de Blasio , and Republican was Joe Lhota (RANDOM ROTATED), who would you vote for Mayor?
(%) Likely Voters General Vote Borough Pub
1+/wk Car Triple Prime
Identifies as… d’B Lta DK Qu Bky Brx Man Dem Rep ind
Democrat Bill de Blasio 60 100 0 0 55 62 70 60 64 57 64 76 14 36 Republican Joe Lhota 19 0 100 0 20 18 13 22 16 21 18 7 70 29 Other 3 0 0 16 4 2 3 3 2 4 3 4 2 3 Don't know (Vol.) 17 0 0 84 20 18 14 15 18 18 15 13 13 32
(%) Likely Voters Gender Age Race Income M F <35 35-49 50-64 65+ Wh Bl Hsp Oth <35k 35-75k >75k
Democrat Bill de Blasio 60 56 63 59 63 61 57 46 76 70 68 65 67 58 Republican Joe Lhota 19 23 16 17 17 21 21 32 3 9 18 13 19 23 Other 3 3 4 4 4 3 3 2 6 3 1 5 1 4 Don't know (Vol.) 17 17 17 20 16 15 20 19 14 18 13 17 13 15
Vote History (ALL HEARD THE FOLLOWING) I am now going to read a list of previous elections. Please tell me if you did or did not vote in each of the elections. I do not need to know which candidate you voted for. 4. Did you vote in the following election? 2010 primary for Governor.
(%) Likely Voters General Vote Borough Pub
1+/wk Car Triple Prime
Identifies as… d’B Lta DK Qu Bky Brx Man Dem Rep ind
Yes, did vote 70 73 69 60 64 67 72 77 70 71 100 72 66 63 No, did not vote 24 23 23 30 31 26 19 18 23 23 0 23 25 28 Don’t know (Vol.) 6 5 7 10 5 7 9 4 6 6 0 5 9 9
(%) Likely Voters Gender Age Race Income M F <35 35-49 50-64 65+ Wh Bl Hsp Oth <35k 35-75k >75k
Yes, did vote 70 68 71 55 66 75 80 68 72 73 66 68 73 70 No, did not vote 24 27 22 36 28 20 16 24 24 22 27 29 23 24 Don’t know (Vol.) 6 5 7 10 7 5 5 8 4 6 7 3 4 6
5. Did you vote in the following election? 2009 primary for Mayor.
(%) Likely Voters General Vote Borough Pub
1+/wk Car Triple Prime
Identifies as… d’B Lta DK Qu Bky Brx Man Dem Rep ind
Yes, did vote 68 70 65 60 65 67 68 73 69 71 100 71 71 59 No, did not vote 26 23 31 33 31 25 24 23 25 23 0 23 26 35 Don’t know (Vol.) 6 6 4 7 4 8 8 4 6 6 0 6 3 6
(%) Likely Voters Gender Age Race Income M F <35 35-49 50-64 65+ Wh Bl Hsp Oth <35k 35-75k >75k
Yes, did vote 68 68 69 45 70 75 77 67 72 69 64 61 69 75 No, did not vote 26 28 24 49 26 20 15 27 24 26 26 34 24 21 Don’t know (Vol.) 6 4 7 5 5 6 8 6 4 5 11 5 7 4

© 2013 PENN SCHOEN AND BERLAND ASSOCIATES LLC.
Transportation Alternatives Post NYC Mayoral Primary Study 2013
5
Bike Lanes 6. The city of New York has built protected bicycle lanes and pedestrian islands on major
roads in Midtown Manhattan and downtown Brooklyn. They have been proven to reduce injuries to pedestrians, bicyclists, motorists, and passengers by nearly 50%.
Do you strongly support, somewhat support, somewhat oppose, or strongly oppose bringing protected bike lanes and pedestrian islands to your neighborhood?
(%) Likely Voters General Vote Borough Pub
1+/wk Car Triple Prime
Identifies as… d’B Lta DK Qu Bky Brx Man Dem Rep ind
Strongly support 37 43 17 37 31 34 54 39 42 33 39 44 16 27 Somewhat support 30 29 36 30 33 32 23 27 30 32 28 27 47 32 Somewhat oppose 10 9 18 8 13 10 6 12 9 13 11 10 13 12 Strongly oppose 17 15 24 17 15 20 13 17 14 18 17 14 21 24 Don’t know (Vol.) 5 4 4 8 7 5 4 5 4 5 5 5 2 6
(%) Likely Voters Gender Age Race Income M F <35 35-49 50-64 65+ Wh Bl Hsp Oth <35k 35-75k >75k
Strongly support 37 36 38 53 37 33 31 30 45 38 49 47 38 31 Somewhat support 30 32 29 25 36 31 27 31 26 36 29 29 30 33 Somewhat oppose 10 10 11 4 14 11 9 15 5 7 9 6 8 15 Strongly oppose 17 17 17 16 12 17 25 20 16 16 7 14 18 17 Don’t know (Vol.) 5 4 5 3 2 7 8 4 7 2 6 4 6 3

© 2013 PENN SCHOEN AND BERLAND ASSOCIATES LLC.
Transportation Alternatives Post NYC Mayoral Primary Study 2013
6
7. Thinking about New York City five years from now, do you think…
(%) Likely Voters General Vote Borough Pub
1+/wk Car Triple Prime
Identifies as… d’B Lta DK Qu Bky Brx Man Dem Rep ind
Many more people will use bikes 29 30 25 33 26 31 30 31 30 27 32 32 18 27
Some more people will use bikes 27 30 23 19 21 27 20 36 28 28 25 28 20 25
About the same number will use bikes 27 25 36 21 31 26 29 22 26 28 28 25 43 24
Fewer people will use bikes 6 7 5 9 9 5 7 4 6 7 6 5 8 10
Many fewer people will use bikes 4 4 4 4 5 3 5 2 4 4 4 4 4 3
Don’t know (Vol.) 7 5 7 14 7 8 9 6 7 6 6 6 7 11
(%) Likely Voters Gender Age Race Income M F <35 35-49 50-64 65+ Wh Bl Hsp Oth <35k 35-75k >75k
Many more people will use bikes 29 31 28 31 31 32 22 23 35 35 34 36 30 27
Some more people will use bikes 27 26 27 25 31 25 24 33 17 24 31 23 24 32
About the same number will use bikes 27 26 27 28 26 25 29 29 27 23 19 23 29 28
Fewer people will use bikes 6 6 7 8 5 7 7 5 7 7 11 6 8 5
Many fewer people will use bikes 4 5 3 3 2 4 6 3 4 6 2 4 3 4
Don’t know (Vol.) 7 6 8 6 5 7 12 8 9 4 4 8 6 4 Bike Share 8. How much have you heard about New York City’s recently launched bike sharing
program, known as CitiBike? Have you heard…
(%) Likely Voters General Vote Borough Pub
1+/wk Car Triple Prime
Identifies as… d’B Lta DK Qu Bky Brx Man Dem Rep ind
A lot 52 49 62 52 45 52 35 68 55 53 55 50 53 56 Some 32 35 27 29 38 31 34 28 30 32 30 32 30 34 Not a lot 8 8 7 7 8 10 11 3 7 8 8 9 8 5 Nothing at all 7 7 5 11 8 6 19 2 8 7 7 8 8 5 Don’t know (Vol.) 1 1 0 1 1 1 2 0 1 1 1 1 2 0
(%) Likely Voters Gender Age Race Income M F <35 35-49 50-64 65+ Wh Bl Hsp Oth <35k 35-75k >75k
A lot 52 57 47 52 51 55 47 57 46 47 51 40 53 60 Some 32 28 36 33 34 30 33 33 31 30 36 36 34 29 Not a lot 8 8 8 7 12 5 8 6 13 10 3 11 9 6 Nothing at all 7 6 9 8 3 8 11 4 9 13 11 11 4 4 Don’t know (Vol.) 1 1 0 0 0 1 1 1 1 1 0 2 1 0

© 2013 PENN SCHOEN AND BERLAND ASSOCIATES LLC.
Transportation Alternatives Post NYC Mayoral Primary Study 2013
7
ALL HEARD: CitiBike, the new public bike share program, allows you to rent a bike at a station from one place and leave it at another station, moving more quickly from point to point in the city. Bikes are available for one time rental as well as annual memberships. Right now, CitiBike is sponsored by CitiBank and almost all bike share stations are in Midtown Manhattan and Downtown Brooklyn. 9. Would you say expanding bike share program and stations to low and middle
income areas of New York City is…?
(%) Likely Voters General Vote Borough Pub
1+/wk Car Triple Prime
Identifies as… d’B Lta DK Qu Bky Brx Man Dem Rep ind
Very important 27 32 18 22 25 25 28 33 26 25 28 30 15 24 Somewhat important 34 33 29 41 29 33 38 35 32 37 38 34 40 31 Not very important 16 16 20 11 17 19 12 10 17 16 11 16 15 15 Not at all important 20 16 33 16 25 19 16 17 19 19 19 15 30 27 Don’t know (Vol.) 4 4 0 10 4 3 5 5 5 4 4 5 0 4
(%) Likely Voters Gender Age Race Income M F <35 35-49 50-64 65+ Wh Bl Hsp Oth <35k 35-75k >75k
Very important 27 27 27 26 30 26 24 23 29 28 37 27 23 30 Somewhat important 34 34 33 32 39 27 36 35 36 32 23 36 36 34 Not very important 16 16 15 22 16 12 14 15 14 19 17 20 10 16 Not at all important 20 20 19 18 13 28 21 23 16 19 14 15 26 16 Don’t know (Vol.) 4 3 5 3 2 7 5 4 4 2 8 2 4 3
10. Would you say ensuring the bike share program is affordable to middle and low
income residents is…?
(%) Likely Voters General Vote Borough Pub
1+/wk Car Triple Prime
Identifies as… d’B Lta DK Qu Bky Brx Man Dem Rep ind
Very important 32 36 13 35 20 25 43 45 31 28 30 36 21 25 Somewhat important 34 35 43 21 34 43 26 25 35 34 37 35 27 33 Not very important 13 11 19 15 16 12 5 14 11 12 11 10 23 18 Not at all important 16 14 22 16 25 14 19 9 16 19 16 14 28 16 Don’t know (Vol.) 6 4 4 13 5 6 6 7 7 6 6 5 0 9
(%) Likely Voters Gender Age Race Income M F <35 35-49 50-64 65+ Wh Bl Hsp Oth <35k 35-75k >75k
Very important 32 33 32 33 36 29 33 29 42 33 19 45 26 27 Somewhat important 34 33 34 38 30 39 27 38 25 24 53 31 37 34 Not very important 13 13 13 16 12 13 11 15 9 13 14 8 16 14 Not at all important 16 17 14 8 14 17 22 11 19 24 12 11 14 20 Don’t know (Vol.) 6 4 7 6 8 2 8 7 5 6 3 6 7 5

© 2013 PENN SCHOEN AND BERLAND ASSOCIATES LLC.
Transportation Alternatives Post NYC Mayoral Primary Study 2013
8
Dangerous Street 11. AMONG LIKELY VOTERS WHO LIVE IN QUEENS: In terms of traffic, which street do
you think is the worst street for pedestrians in QUEENS? (Open-ended)
(%) Likely Voters Queens Boulevard in Queens 73 Northern Boulevard in Queens 7 Other 12 Don’t know (Vol.) 7
12. AMONG LIKELY VOTERS WHO LIVE IN MANHATTAN: In terms of traffic, which
street do you think is the worst street for pedestrians in MANHATTAN? (Open-ended)
(%) Likely Voters Sixth Avenue in Manhattan 13 Fifth Avenue in Manhattan 4 Amsterdam Avenue in Manhattan 4 Other 49 Don’t know (Vol.) 30
13. AMONG LIKELY VOTERS WHO LIVE IN BROOKLYN: In terms of traffic, which street
do you think is the worst street for pedestrians in BROOKLYN? (Open-ended)
(%) Likely Voters Atlantic Avenue in Brooklyn 22 Flatbush Avenue in Brooklyn 12 4th Avenue in Brooklyn 5 King's Highway in Brooklyn 5 Broadway in Brooklyn 1 Other 30 Don’t know (Vol.) 24

© 2013 PENN SCHOEN AND BERLAND ASSOCIATES LLC.
Transportation Alternatives Post NYC Mayoral Primary Study 2013
9
14. AMONG LIKELY VOTERS WHO LIVE IN THE BRONX: In terms of traffic, which street do you think is the worst street for pedestrians in the BRONX? (Open-ended)
(%) Likely Voters The Grand Concourse in the Bronx 56 Pelham Parkway in the Bronx 10 Other 23 Don’t know (Vol.) 11
15. AMONG LIKELY VOTERS WHO LIVE IN STATEN ISLAND: In terms of traffic, which
street do you think is the worst street for pedestrians in STATEN ISLAND? (Open-ended)
(%) Likely Voters Hylan Boulevard on Staten Island 75 Clove Road in Staten Island 7 Front/Bay Street on Staten Island 0 Other 13 Don’t know (Vol.) 5
16. Have you or someone you know been seriously injured or killed in a traffic crash while
in a car, while biking, or while walking?
(%) Likely Voters General Vote Borough Pub
1+/wk Car Triple Prime
Identifies as… d’B Lta DK Qu Bky Brx Man Dem Rep ind
Yes, I have 9 8 7 14 7 7 8 13 10 9 10 9 7 11 Yes, I know someone who has 24 24 27 21 20 29 21 22 25 23 23 24 20 26
No, neither I nor someone I know has 64 64 64 60 69 60 69 62 61 65 64 66 71 53
Don’t know (Vol.) 3 3 2 4 4 4 2 2 4 3 3 1 2 10
(%) Likely Voters Gender Age Race Income M F <35 35-49 50-64 65+ Wh Bl Hsp Oth <35k 35-75k >75k
Yes, I have 9 9 9 7 11 10 8 11 7 10 5 9 5 14 Yes, I know someone who has 24 25 22 30 27 21 18 25 20 27 22 30 23 21
No, neither I nor someone I know has 64 62 65 61 60 66 68 61 69 59 69 60 71 65
Don’t know (Vol.) 3 3 4 3 2 3 5 3 4 3 5 1 1 1

© 2013 PENN SCHOEN AND BERLAND ASSOCIATES LLC.
Transportation Alternatives Post NYC Mayoral Primary Study 2013
10
Speed Cameras ALL HEARD: In 2012, more people were killed by traffic than murdered by guns in New York City. Speeding is the most common contributing factor in fatal crashes. New York City has recently installed speeding enforcement cameras in school zones. These cameras record cars that go 10 miles per hour or more through the school zone. Using the cameras, the city police issue speeding tickets with $50 fines 17. Do you strongly support, somewhat support, somewhat oppose or strongly oppose
installing speeding enforcement cameras in school zones?
(%) Likely Voters General Vote Borough Pub
1+/wk Car Triple Prime
Identifies as… d’B Lta DK Qu Bky Brx Man Dem Rep ind
Strongly support 71 72 65 73 62 70 81 76 73 66 72 74 67 64 Somewhat support 18 20 18 12 27 16 14 16 18 18 16 18 24 16 Somewhat oppose 5 4 7 4 4 7 3 3 5 7 5 5 3 6 Strongly oppose 5 4 9 6 6 6 1 5 4 8 6 4 4 11 Don’t know (Vol.) 1 0 1 4 1 2 1 0 1 1 1 1 1 3
(%) Likely Voters Gender Age Race Income M F <35 35-49 50-64 65+ Wh Bl Hsp Oth <35k 35-75k >75k
Strongly support 71 65 76 78 69 69 69 65 73 74 85 84 73 62 Somewhat support 18 21 15 13 18 19 20 20 19 15 8 10 15 24 Somewhat oppose 5 6 4 4 6 5 3 7 3 4 0 2 5 8 Strongly oppose 5 8 3 4 4 7 5 7 3 5 6 2 6 6 Don’t know (Vol.) 1 1 1 0 2 0 2 1 1 2 1 2 1 0
18. Currently, speeding enforcement cameras will be shut off at night, when speeding is
more prevalent. Do you think the cameras should be on 24-hours?
(%) Likely Voters General Vote Borough Pub
1+/wk Car Triple Prime
Identifies as… d’B Lta DK Qu Bky Brx Man Dem Rep ind
Yes, they should be on 24-hours 70 70 68 68 69 67 77 74 72 63 72 73 68 61
No, they should not 26 25 28 29 31 27 17 19 22 34 24 23 32 31 Just right 4 5 4 3 0 6 6 6 5 3 4 4 0 8
(%) Likely Voters Gender Age Race Income M F <35 35-49 50-64 65+ Wh Bl Hsp Oth <35k 35-75k >75k
Yes, they should be on 24-hours 70 66 73 68 68 67 79 63 82 66 77 87 71 66
No, they should not 26 30 22 23 29 31 14 33 13 32 13 10 27 29 Just right 4 4 5 9 2 2 7 4 5 2 10 4 3 5

© 2013 PENN SCHOEN AND BERLAND ASSOCIATES LLC.
Transportation Alternatives Post NYC Mayoral Primary Study 2013
11
19. Some people in New York have suggested expanding the speeding enforcement camera program as a way to improve public safety and cut down on dangerous driving.
Currently, only 20 school zones will have speeding enforcement cameras at any one time, but there are over two thousand schools in New York City. Would you strongly support, somewhat support, somewhat oppose or strongly oppose the city installing more speeding enforcement cameras in school zones?
(%) Likely Voters General Vote Borough Pub
1+/wk Car Triple Prime
Identifies as… d’B Lta DK Qu Bky Brx Man Dem Rep ind
Strongly support 70 75 54 71 66 65 82 75 71 65 69 77 68 53 Somewhat support 16 13 23 15 21 16 6 15 15 17 17 11 22 24 Somewhat oppose 5 4 10 6 7 8 0 2 6 6 5 4 5 9 Strongly oppose 6 5 9 6 5 7 9 5 5 10 7 6 1 10 Don’t know (Vol.) 3 2 3 4 1 4 4 3 3 2 2 2 4 4
(%) Likely Voters Gender Age Race Income M F <35 35-49 50-64 65+ Wh Bl Hsp Oth <35k 35-75k >75k
Strongly support 70 63 75 76 69 67 68 59 77 81 82 85 62 67 Somewhat support 16 16 15 10 17 19 15 20 14 11 8 9 25 14 Somewhat oppose 5 8 3 3 8 5 5 10 2 2 0 3 6 8 Strongly oppose 6 10 3 6 5 7 8 7 3 6 10 2 7 8 Don’t know (Vol.) 3 3 3 5 1 2 4 4 3 0 0 1 0 3

© 2013 PENN SCHOEN AND BERLAND ASSOCIATES LLC.
Transportation Alternatives Post NYC Mayoral Primary Study 2013
12
Transportation Methods 20. Does your household own a car?
(%) Likely Voters General Vote Borough Pub
1+/wk Car Triple Prime
Identifies as… d’B Lta DK Qu Bky Brx Man Dem Rep ind
Yes 61 58 68 64 82 58 62 41 52 100 64 60 68 63 No 38 42 31 34 18 42 37 58 48 0 36 40 32 35 Don’t know (Vol.) 1 0 0 2 0 0 1 1 0 0 1 0 0 2
(%) Likely Voters Gender Age Race Income M F <35 35-49 50-64 65+ Wh Bl Hsp Oth <35k 35-75k >75k
Yes 61 62 61 57 66 65 54 66 54 62 61 36 65 78 No 38 38 38 43 33 35 44 34 45 38 38 64 35 22 Don’t know (Vol.) 1 0 1 0 0 0 2 0 1 0 1 0 0 0
21. What is your primary way to get around the City?
(%) Likely Voters General Vote Borough Pub
1+/wk Car Triple Prime
Identifies as… d’B Lta DK Qu Bky Brx Man Dem Rep ind
Subway 38 44 20 36 34 42 35 40 0 37 34 43 21 33 Car 27 23 38 26 41 24 34 7 0 40 30 23 50 23 Bus 16 19 8 14 15 11 23 19 0 10 15 19 12 9 Walking 12 10 19 12 5 10 8 26 0 8 13 9 10 24 Taxi 3 3 5 3 1 5 0 5 0 1 3 4 3 1 Bike 1 0 4 3 0 2 0 3 0 2 1 2 0 0 Don’t know (Vol.) 3 1 6 5 3 7 0 0 0 2 3 1 4 9
(%) Likely Voters Gender Age Race Income M F <35 35-49 50-64 65+ Wh Bl Hsp Oth <35k 35-75k >75k
Subway 38 36 39 39 48 42 16 25 47 49 52 34 50 28 Car 27 29 25 19 23 28 35 35 15 22 28 15 20 39 Bus 16 13 18 19 11 15 21 12 23 19 10 34 16 10 Walking 12 13 12 16 12 7 17 18 5 10 8 4 10 16 Taxi 3 4 3 7 1 4 3 2 8 0 3 10 4 1 Bike 1 2 1 0 5 0 0 3 0 0 0 0 0 4 Don’t know (Vol.) 3 4 2 0 0 4 8 5 2 0 0 3 0 2

© 2013 PENN SCHOEN AND BERLAND ASSOCIATES LLC.
Transportation Alternatives Post NYC Mayoral Primary Study 2013
13
22. How often do you use the following kind of transportation on average? Do you use it…
(%) Likely Voters 4 or more times per
week 2-3 times per week
About once per
week 2-3 times
per month About
once per month
A few times per
year
I do not use that
transportation
Don’t know (Vol.)
Walk 73 11 4 3 1 3 5 1
Subway 39 12 6 10 5 14 13 1
Drive a car 34 13 6 3 3 5 37 0
Bus 26 14 8 9 8 14 20 1
Bike 5 7 2 4 4 8 69 1
Taxi 5 8 8 12 11 24 32 1 23. How often do you use the following kind of transportation on average?
Walk
(%) Likely Voters General Vote Borough Pub
1+/wk Car Triple Prime
Identifies as… d’B Lta DK Qu Bky Brx Man Dem Rep ind
4 or more times per week 73 75 70 70 66 72 70 84 81 71 74 74 60 76 2-3 times per week 11 11 13 9 12 12 11 7 9 10 9 11 17 8 About once per week 4 4 3 7 6 4 4 3 3 5 4 4 8 3 2-3 times per month 3 3 3 2 3 3 3 1 2 4 3 3 4 1 About once per month 1 0 1 0 1 1 0 0 0 1 1 0 2 0 A few times per year 3 3 2 2 5 2 5 1 2 4 3 4 0 2 I do not use that transportation 5 4 5 7 5 6 6 2 4 5 5 4 8 7
Don’t know (Vol.) 1 1 1 2 1 1 2 0 0 1 1 0 0 3
(%) Likely Voters Gender Age Race Income M F <35 35-49 50-64 65+ Wh Bl Hsp Oth <35k 35-75k >75k
4 or more times per week 73 72 74 80 75 73 64 77 65 71 78 70 74 76 2-3 times per week 11 11 11 7 9 11 15 10 13 14 4 13 9 10 About once per week 4 5 4 5 4 3 7 4 6 5 4 6 2 3 2-3 times per month 3 4 3 3 4 3 2 2 2 5 8 3 4 3 About once per month 1 1 0 0 1 1 0 1 0 0 0 0 2 0 A few times per year 3 3 2 1 4 2 4 1 6 1 4 2 3 4 I do not use that transportation 5 4 5 4 3 6 6 4 7 5 1 6 5 3
Don’t know (Vol.) 1 1 1 0 1 1 1 1 1 0 0 0 0 1

© 2013 PENN SCHOEN AND BERLAND ASSOCIATES LLC.
Transportation Alternatives Post NYC Mayoral Primary Study 2013
14
24. How often do you use the following kind of transportation on average?
Subway
(%) Likely Voters General Vote Borough Pub
1+/wk Car Triple Prime
Identifies as… d’B Lta DK Qu Bky Brx Man Dem Rep ind
4 or more times per week 39 43 27 38 29 42 34 52 57 30 39 41 26 39 2-3 times per week 12 13 13 7 8 13 11 16 17 13 13 12 11 12 About once per week 6 5 10 3 8 5 5 5 9 6 6 6 8 5 2-3 times per month 10 11 8 10 6 11 9 11 5 12 12 10 12 9 About once per month 5 4 10 4 6 4 7 5 2 6 5 6 5 4 A few times per year 14 12 19 14 23 14 16 4 4 17 12 13 18 13 I do not use that transportation 13 11 13 22 20 11 16 5 5 16 13 12 20 15
Don’t know (Vol.) 1 0 1 2 0 0 2 1 0 1 1 0 0 3
(%) Likely Voters Gender Age Race Income M F <35 35-49 50-64 65+ Wh Bl Hsp Oth <35k 35-75k >75k
4 or more times per week 39 41 37 50 47 38 22 34 39 48 48 36 42 39 2-3 times per week 12 12 12 16 11 10 12 14 9 10 15 12 10 14 About once per week 6 7 5 6 5 5 9 7 6 5 2 7 7 6 2-3 times per month 10 10 10 10 9 12 10 10 9 12 11 11 8 12 About once per month 5 4 6 6 5 4 7 5 6 3 6 5 6 5 A few times per year 14 14 13 10 14 15 14 15 14 9 11 13 15 12 I do not use that transportation 13 11 15 3 10 16 23 14 16 12 5 16 12 10
Don’t know (Vol.) 1 1 1 0 0 1 2 1 2 0 1 0 0 0
© 2013 PENN SCHOEN AND BERLAND ASSOCIATES LLC.
Transportation Alternatives Post NYC Mayoral Primary Study 2013
15
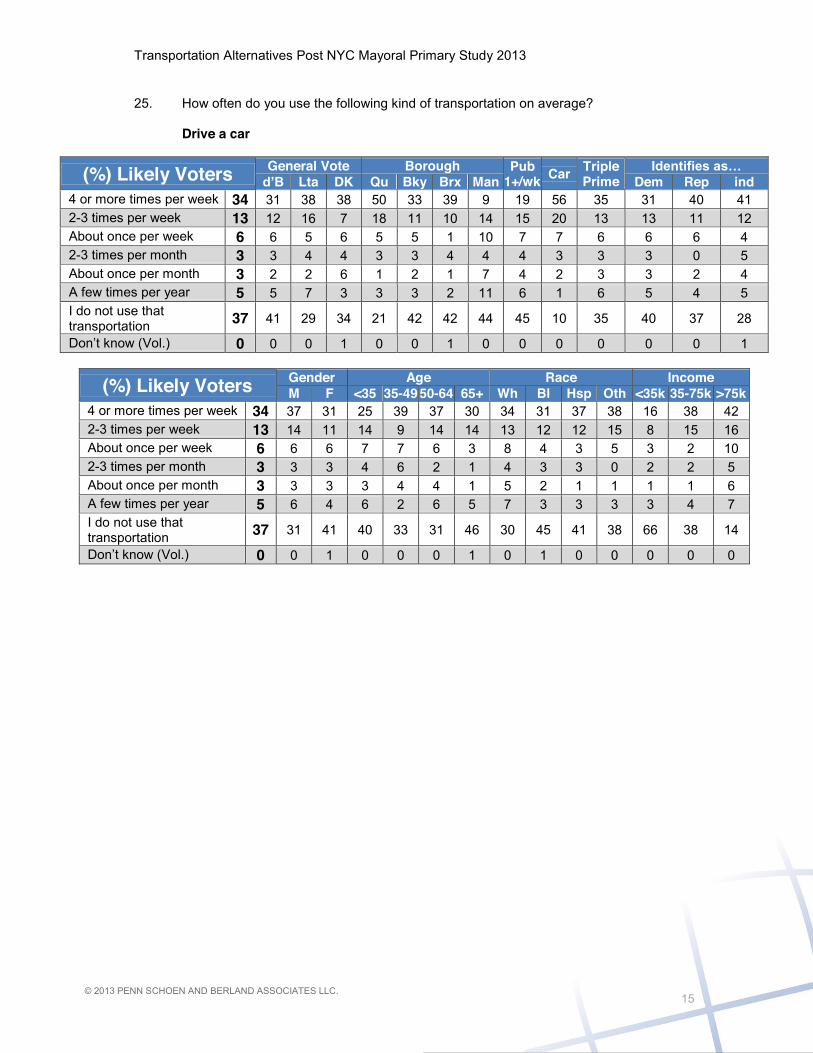
25. How often do you use the following kind of transportation on average?
Drive a car
(%) Likely Voters General Vote Borough Pub
1+/wk Car Triple Prime
Identifies as… d’B Lta DK Qu Bky Brx Man Dem Rep ind
4 or more times per week 34 31 38 38 50 33 39 9 19 56 35 31 40 41 2-3 times per week 13 12 16 7 18 11 10 14 15 20 13 13 11 12 About once per week 6 6 5 6 5 5 1 10 7 7 6 6 6 4 2-3 times per month 3 3 4 4 3 3 4 4 4 3 3 3 0 5 About once per month 3 2 2 6 1 2 1 7 4 2 3 3 2 4 A few times per year 5 5 7 3 3 3 2 11 6 1 6 5 4 5 I do not use that transportation 37 41 29 34 21 42 42 44 45 10 35 40 37 28
Don’t know (Vol.) 0 0 0 1 0 0 1 0 0 0 0 0 0 1
(%) Likely Voters Gender Age Race Income M F <35 35-49 50-64 65+ Wh Bl Hsp Oth <35k 35-75k >75k
4 or more times per week 34 37 31 25 39 37 30 34 31 37 38 16 38 42 2-3 times per week 13 14 11 14 9 14 14 13 12 12 15 8 15 16 About once per week 6 6 6 7 7 6 3 8 4 3 5 3 2 10 2-3 times per month 3 3 3 4 6 2 1 4 3 3 0 2 2 5 About once per month 3 3 3 3 4 4 1 5 2 1 1 1 1 6 A few times per year 5 6 4 6 2 6 5 7 3 3 3 3 4 7 I do not use that transportation 37 31 41 40 33 31 46 30 45 41 38 66 38 14
Don’t know (Vol.) 0 0 1 0 0 0 1 0 1 0 0 0 0 0

© 2013 PENN SCHOEN AND BERLAND ASSOCIATES LLC.
Transportation Alternatives Post NYC Mayoral Primary Study 2013
16
26. How often do you use the following kind of transportation on average?
Bus
(%) Likely Voters General Vote Borough Pub
1+/wk Car Triple Prime
Identifies as… d’B Lta DK Qu Bky Brx Man Dem Rep ind
4 or more times per week 26 28 13 30 24 27 28 29 39 20 28 28 18 25 2-3 times per week 14 16 11 15 10 11 19 22 21 10 15 16 14 10 About once per week 8 7 8 9 5 9 9 7 11 6 5 8 7 8 2-3 times per month 9 9 9 8 8 8 4 15 7 8 10 10 6 9 About once per month 8 7 10 9 6 8 7 7 6 10 7 7 5 11 A few times per year 14 15 19 6 17 17 12 8 6 19 14 14 20 12 I do not use that transportation 20 17 29 21 30 20 19 11 10 26 19 18 31 23
Don’t know (Vol.) 1 0 1 2 0 0 2 1 0 0 1 0 0 2
(%) Likely Voters Gender Age Race Income M F <35 35-49 50-64 65+ Wh Bl Hsp Oth <35k 35-75k >75k
4 or more times per week 26 22 30 32 33 22 20 18 37 29 32 37 26 17 2-3 times per week 14 12 16 12 11 17 18 15 15 13 15 13 15 17 About once per week 8 7 8 8 7 8 7 8 6 11 5 7 10 6 2-3 times per month 9 9 9 6 10 10 9 9 10 10 5 10 8 10 About once per month 8 9 7 6 8 9 7 10 5 6 8 5 9 9 A few times per year 14 18 11 19 14 11 14 16 11 11 15 10 16 15 I do not use that transportation 20 23 18 17 18 23 23 24 15 20 19 18 16 25
Don’t know (Vol.) 1 0 1 0 0 0 2 0 1 0 1 0 0 0

© 2013 PENN SCHOEN AND BERLAND ASSOCIATES LLC.
Transportation Alternatives Post NYC Mayoral Primary Study 2013
17
27. How often do you use the following kind of transportation on average?
Taxi
(%) Likely Voters General Vote Borough Pub
1+/wk Car Triple Prime
Identifies as… d’B Lta DK Qu Bky Brx Man Dem Rep ind
4 or more times per week 5 4 5 9 1 4 7 10 7 4 5 5 8 2 2-3 times per week 8 8 10 4 2 8 8 13 10 6 8 10 6 2 About once per week 8 8 8 11 5 9 6 11 10 7 9 8 8 10 2-3 times per month 12 14 8 9 9 10 10 20 15 10 11 13 7 12 About once per month 11 11 10 11 8 9 12 15 12 9 10 11 10 11 A few times per year 24 24 23 23 30 24 31 16 19 27 25 24 19 25 I do not use that transportation 32 31 35 32 45 37 23 14 27 38 31 29 42 36
Don’t know (Vol.) 1 0 1 2 0 0 3 1 0 1 1 0 0 2
(%) Likely Voters Gender Age Race Income M F <35 35-49 50-64 65+ Wh Bl Hsp Oth <35k 35-75k >75k
4 or more times per week 5 4 5 4 5 5 5 5 7 3 4 4 2 9 2-3 times per week 8 6 9 11 7 8 7 8 8 6 11 8 8 9 About once per week 8 7 9 8 10 7 7 10 7 8 3 10 7 7 2-3 times per month 12 12 12 14 12 15 7 12 13 11 12 12 9 15 About once per month 11 13 9 15 10 8 12 10 11 13 10 13 9 11 A few times per year 24 28 20 22 26 23 22 25 19 29 23 19 27 26 I do not use that transportation 32 29 34 25 29 34 37 30 35 29 35 33 37 23
Don’t know (Vol.) 1 1 1 1 0 0 2 0 1 1 2 0 0 0
© 2013 PENN SCHOEN AND BERLAND ASSOCIATES LLC.
Transportation Alternatives Post NYC Mayoral Primary Study 2013
18
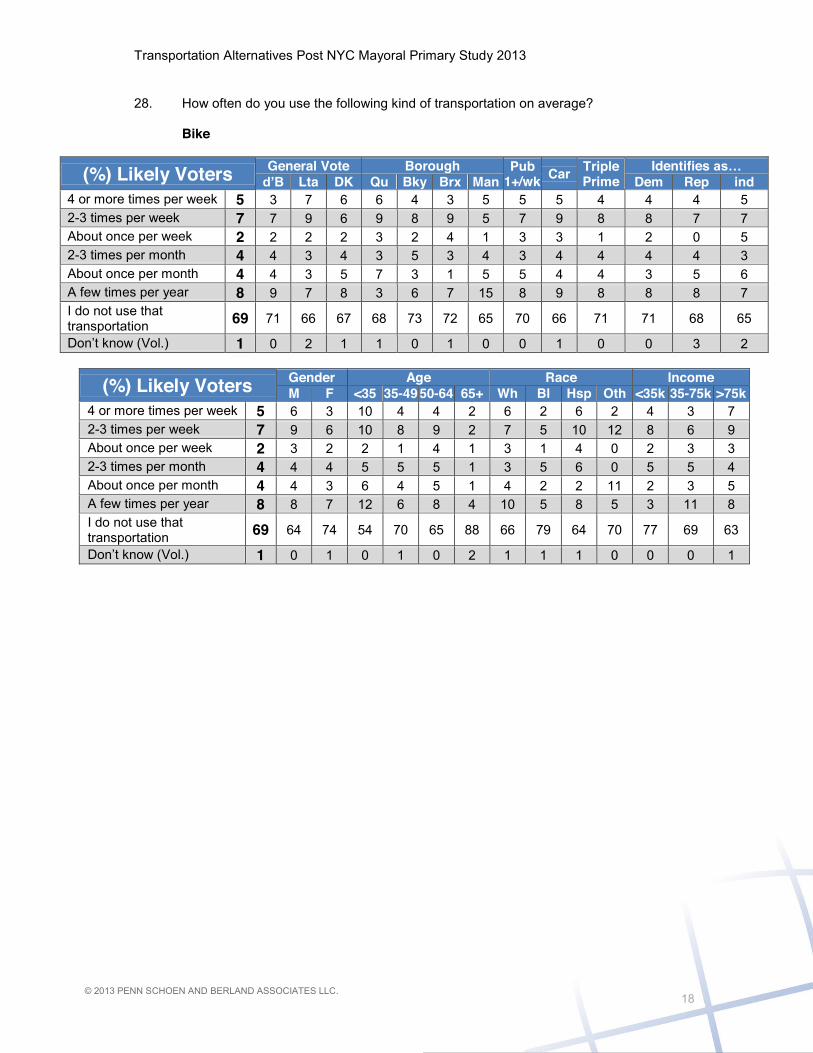
28. How often do you use the following kind of transportation on average?
Bike
(%) Likely Voters General Vote Borough Pub
1+/wk Car Triple Prime
Identifies as… d’B Lta DK Qu Bky Brx Man Dem Rep ind
4 or more times per week 5 3 7 6 6 4 3 5 5 5 4 4 4 5 2-3 times per week 7 7 9 6 9 8 9 5 7 9 8 8 7 7 About once per week 2 2 2 2 3 2 4 1 3 3 1 2 0 5 2-3 times per month 4 4 3 4 3 5 3 4 3 4 4 4 4 3 About once per month 4 4 3 5 7 3 1 5 5 4 4 3 5 6 A few times per year 8 9 7 8 3 6 7 15 8 9 8 8 8 7 I do not use that transportation 69 71 66 67 68 73 72 65 70 66 71 71 68 65
Don’t know (Vol.) 1 0 2 1 1 0 1 0 0 1 0 0 3 2
(%) Likely Voters Gender Age Race Income M F <35 35-49 50-64 65+ Wh Bl Hsp Oth <35k 35-75k >75k
4 or more times per week 5 6 3 10 4 4 2 6 2 6 2 4 3 7 2-3 times per week 7 9 6 10 8 9 2 7 5 10 12 8 6 9 About once per week 2 3 2 2 1 4 1 3 1 4 0 2 3 3 2-3 times per month 4 4 4 5 5 5 1 3 5 6 0 5 5 4 About once per month 4 4 3 6 4 5 1 4 2 2 11 2 3 5 A few times per year 8 8 7 12 6 8 4 10 5 8 5 3 11 8 I do not use that transportation 69 64 74 54 70 65 88 66 79 64 70 77 69 63
Don’t know (Vol.) 1 0 1 0 1 0 2 1 1 1 0 0 0 1

© 2013 PENN SCHOEN AND BERLAND ASSOCIATES LLC.
Transportation Alternatives Post NYC Mayoral Primary Study 2013
19
Demographics 29. How long have you lived in New York City?
(%) Likely Voters General Vote Borough Pub
1+/wk Car Triple Prime
Identifies as… d’B Lta DK Qu Bky Brx Man Dem Rep ind
20+ years 83 85 80 82 85 84 87 77 81 85 88 86 86 73 12-19 years 8 8 9 8 7 7 5 13 9 7 6 7 7 11 7-11 years 4 3 5 6 2 5 2 7 5 4 4 4 5 3 5-6 years 1 1 4 1 1 2 1 1 1 1 0 1 2 1 3-4 years 1 1 1 0 0 1 2 0 1 0 0 1 0 1 For less than 2 years 0 0 0 0 0 0 0 0 0 0 0 0 0 0 Don’t know (Vol.) 3 3 1 3 5 2 3 2 3 2 2 0 0 11
(%) Likely Voters Gender Age Race Income M F <35 35-49 50-64 65+ Wh Bl Hsp Oth <35k 35-75k >75k
20+ years 83 77 89 65 79 92 91 82 84 90 76 86 87 83 12-19 years 8 12 5 15 13 3 4 9 7 5 12 6 7 11 7-11 years 4 4 4 11 5 2 1 4 4 3 6 4 4 5 5-6 years 1 2 0 4 0 1 0 1 1 0 2 2 1 1 3-4 years 1 1 0 3 1 0 0 1 1 0 0 1 1 0 For less than 2 years 0 0 0 0 0 0 0 0 0 0 0 0 0 0 Don’t know (Vol.) 3 3 2 3 2 2 4 2 3 2 3 0 0 0
30. Which Borough do you live in?
(%) Likely Voters General Vote Borough Pub
1+/wk Car Triple Prime
Identifies as… d’B Lta DK Qu Bky Brx Man Dem Rep ind
Queens 21 19 23 26 100 0 0 0 17 28 19 18 25 28 Brooklyn 34 35 31 33 0 100 0 0 34 32 32 34 34 34 Bronx 15 17 10 13 0 0 100 0 15 15 16 17 9 12 Manhattan 25 25 29 22 0 0 0 100 31 17 28 27 18 23 Staten Island 5 3 8 7 0 0 0 0 3 8 5 4 15 4 Outside New York City 0 0 0 0 0 0 0 0 0 0 0 0 0 0
(%) Likely Voters Gender Age Race Income M F <35 35-49 50-64 65+ Wh Bl Hsp Oth <35k 35-75k >75k
Queens 21 24 19 21 19 22 22 20 19 21 31 13 22 22 Brooklyn 34 34 34 49 37 27 28 34 42 22 31 43 35 28 Bronx 15 13 17 9 15 18 15 8 23 24 9 23 13 13 Manhattan 25 24 26 18 23 28 28 30 14 29 25 18 25 32 Staten Island 5 5 5 3 6 5 6 8 2 4 4 2 5 6 Outside New York City 0 0 0 0 0 0 0 0 0 0 0 0 0 0

© 2013 PENN SCHOEN AND BERLAND ASSOCIATES LLC.
Transportation Alternatives Post NYC Mayoral Primary Study 2013
20
31. Which borough do you work in, or do you work outside New York City?
(%) Likely Voters General Vote Borough Pub
1+/wk Car Triple Prime
Identifies as… d’B Lta DK Qu Bky Brx Man Dem Rep ind
Manhattan 32 34 29 26 17 21 28 65 42 30 34 36 21 26 Brooklyn 20 22 18 17 5 51 1 3 17 20 17 19 21 20 Queens 9 8 9 12 34 4 1 1 8 12 8 9 10 8 Bronx 7 8 4 6 3 1 37 3 6 8 7 7 5 8 Staten Island 3 1 3 5 0 0 1 0 1 4 2 2 9 2 Outside New York City 4 5 3 3 10 1 4 4 3 5 5 5 2 4 Don’t know (Vol.) 2 1 2 3 2 1 2 1 2 2 1 0 2 4 I do not work / am not employed (Vol.) 23 20 32 26 28 21 25 22 21 19 25 21 29 27
(%) Likely Voters Gender Age Race Income M F <35 35-49 50-64 65+ Wh Bl Hsp Oth <35k 35-75k >75k
Manhattan 32 33 31 30 39 35 21 33 25 36 41 20 33 42 Brooklyn 20 22 18 31 24 14 14 22 21 14 19 25 21 18 Queens 9 10 9 9 12 11 3 8 10 10 12 5 11 11 Bronx 7 6 8 8 7 9 5 3 11 13 3 10 8 5 Staten Island 3 3 2 2 3 3 2 4 1 2 1 1 2 4 Outside New York City 4 5 3 7 3 5 2 4 5 4 7 2 5 6 Don’t know (Vol.) 2 2 1 1 2 2 1 2 1 2 0 0 1 1 I do not work / am not employed (Vol.) 23 19 27 12 10 21 53 24 26 20 18 36 19 13
32. Do you consider yourself a …
(%) Likely Voters General Vote Borough Pub
1+/wk Car Triple Prime
Identifies as… d’B Lta DK Qu Bky Brx Man Dem Rep ind
Strong Democrat 55 74 13 39 47 55 68 59 58 53 61 84 0 0 Weak Democrat 11 10 10 15 10 11 8 12 11 11 8 16 0 0 Weak Republican 4 2 9 5 6 4 2 1 3 4 3 0 32 0 Strong Republican 8 1 34 4 8 8 5 7 5 9 8 0 68 0 Independent 15 9 26 21 19 14 12 15 16 15 12 0 0 68 Other 2 1 2 3 2 2 2 0 1 2 2 0 0 7 Don’t know/refused (Vol.) 5 3 5 13 9 5 3 5 5 6 6 0 0 25
(%) Likely Voters Gender Age Race Income M F <35 35-49 50-64 65+ Wh Bl Hsp Oth <35k 35-75k >75k
Strong Democrat 55 48 62 46 58 59 54 41 76 60 57 67 58 56 Weak Democrat 11 11 11 19 10 10 8 14 6 11 13 8 13 12 Weak Republican 4 4 3 5 5 3 2 5 2 5 1 4 4 4 Strong Republican 8 9 7 5 5 9 13 13 3 3 5 5 8 8 Independent 15 20 10 16 17 13 16 21 7 14 14 11 15 16 Other 2 3 0 1 2 2 1 1 2 3 2 3 0 2 Don’t know/refused (Vol.) 5 4 7 8 3 5 7 6 4 5 8 3 2 2

© 2013 PENN SCHOEN AND BERLAND ASSOCIATES LLC.
Transportation Alternatives Post NYC Mayoral Primary Study 2013
21
33. Identifies as… (CODED)
(%) Likely Voters General Vote Borough Pub
1+/wk Car Triple Prime
Identifies as… d’B Lta DK Qu Bky Brx Man Dem Rep ind
Democrat 66 84 23 54 57 67 76 72 68 65 70 100 0 0 Republican 11 3 43 9 13 12 7 8 9 13 11 0 100 0 independent/other 22 13 33 37 30 22 17 20 23 23 19 0 0 100
(%) Likely Voters Gender Age Race Income M F <35 35-49 50-64 65+ Wh Bl Hsp Oth <35k 35-75k >75k
Democrat 66 59 73 65 68 69 62 55 82 71 71 75 71 68 Republican 11 13 10 10 10 12 15 18 5 8 6 9 11 12 independent/other 22 28 17 25 22 19 24 28 13 21 23 16 18 20
34. Gender (CODED)
(%) Likely Voters General Vote Borough Pub
1+/wk Car Triple Prime
Identifies as… d’B Lta DK Qu Bky Brx Man Dem Rep ind
Male 46 43 56 45 52 46 40 44 45 46 45 41 54 58 Female 54 57 44 55 48 54 60 56 55 54 55 59 46 42
(%) Likely Voters Gender Age Race Income M F <35 35-49 50-64 65+ Wh Bl Hsp Oth <35k 35-75k >75k
Male 46 100 0 53 42 44 48 52 38 41 48 42 45 50 Female 54 0 100 47 58 56 52 48 62 59 52 58 55 50
35. Into which of the following categories does your age fall? Please just stop me when I
read the appropriate category.
(%) Likely Voters General Vote Borough Pub
1+/wk Car Triple Prime
Identifies as… d’B Lta DK Qu Bky Brx Man Dem Rep ind
18-24 5 4 5 7 6 8 4 2 7 5 2 5 2 6 25-34 13 14 11 14 12 18 7 11 14 12 9 13 14 14 35-49 29 29 25 27 26 31 30 27 31 31 28 30 24 29 50-64 31 32 35 27 32 25 37 35 30 33 35 32 31 27 65 and over 22 21 24 25 23 18 23 25 19 19 26 20 28 23
(%) Likely Voters Gender Age Race Income M F <35 35-49 50-64 65+ Wh Bl Hsp Oth <35k 35-75k >75k
18-24 5 6 4 28 0 0 0 4 3 10 6 11 3 1 25-34 13 14 12 72 0 0 0 13 14 10 13 19 9 11 35-49 29 27 31 0 100 0 0 26 31 32 35 24 34 34 50-64 31 30 32 0 0 100 0 30 31 36 24 23 33 37 65 and over 22 23 21 0 0 0 100 27 21 11 22 23 21 17

© 2013 PENN SCHOEN AND BERLAND ASSOCIATES LLC.
Transportation Alternatives Post NYC Mayoral Primary Study 2013
22
36. Which of the following best describes your ethnic or racial background or heritage?
(%) Likely Voters General Vote Borough Pub
1+/wk Car Triple Prime
Identifies as… d’B Lta DK Qu Bky Brx Man Dem Rep ind
White, Caucasian, European, European-American
47 38 80 52 47 47 24 57 45 51 47 38 73 61
Black, African-American, Caribbean, African, Caribbean-American
29 36 5 28 28 36 46 16 29 26 30 36 12 18
Hispanic, Latino, Latin American 14 16 7 13 12 9 23 17 15 13 14 15 10 11
Asian-American, Asian, Pacific Islander 5 6 2 4 9 4 3 4 6 6 3 6 1 5
Arab, Middle Eastern 0 0 0 0 0 0 0 0 0 0 0 0 0 0 American Indian, Native American 1 1 1 0 2 1 1 1 1 1 1 1 1 1
Other (Vol.) 2 2 3 3 2 3 2 2 2 2 3 2 2 3 Don’t know (Vol.) 1 1 3 0 1 0 1 2 1 1 1 1 2 2
(%) Likely Voters Gender Age Race Income M F <35 35-49 50-64 65+ Wh Bl Hsp Oth <35k 35-75k >75k
White, Caucasian, European, European-American
47 53 42 44 42 47 57 100 0 8 0 28 37 64
Black, African-American, Caribbean, African, Caribbean-American
29 24 34 28 32 30 27 0 100 8 0 45 33 19
Hispanic, Latino, Latin American 14 13 14 18 15 15 7 0 0 80 0 17 16 10
Asian-American, Asian, Pacific Islander 5 5 5 7 7 3 3 0 0 0 56 7 7 5
Arab, Middle Eastern 0 0 0 0 0 0 0 0 0 0 2 0 0 0 American Indian, Native American 1 1 1 1 1 1 1 0 0 0 12 2 1 1
Other (Vol.) 2 2 2 2 3 3 2 0 0 4 19 1 5 2 Don’t know (Vol.) 1 1 1 0 0 1 2 0 0 0 11 1 1 0
37. ASKED IF WHITE, BLACK, OR OTHER: Do you consider yourself of Hispanic or
Latino descent?
(%) Likely Voters General Vote Borough Pub
1+/wk Car Triple Prime
Identifies as… d’B Lta DK Qu Bky Brx Man Dem Rep ind
Yes 5 6 1 6 7 4 7 4 6 6 5 5 2 7 No 94 93 99 94 93 95 93 96 93 94 94 94 98 92 Don’t know (Vol.) 1 1 0 0 1 1 0 1 1 0 1 1 0 1
(%) Likely Voters Gender Age Race Income M F <35 35-49 50-64 65+ Wh Bl Hsp Oth <35k 35-75k >75k
Yes 5 3 6 2 7 7 2 0 0 94 0 8 6 3 No 94 96 93 98 93 92 97 100 98 6 100 90 94 97 Don’t know (Vol.) 1 0 1 0 1 1 1 0 2 0 0 2 0 0

© 2013 PENN SCHOEN AND BERLAND ASSOCIATES LLC.
Transportation Alternatives Post NYC Mayoral Primary Study 2013
23
38. Race (CODED)
(%) Likely Voters General Vote Borough Pub
1+/wk Car Triple Prime
Identifies as… d’B Lta DK Qu Bky Brx Man Dem Rep ind
WHITE 46 36 79 50 45 46 23 56 44 49 46 38 72 57 BLACK 28 34 5 27 25 35 44 15 28 25 29 34 12 17 HISPANIC 17 20 8 17 17 11 28 20 18 17 17 18 11 16 ASAIN 5 6 2 4 9 4 3 4 6 6 3 6 1 5 OTHER 4 4 6 2 4 4 3 5 4 3 5 4 4 5
(%) Likely Voters Gender Age Race Income M F <35 35-49 50-64 65+ Wh Bl Hsp Oth <35k 35-75k >75k
WHITE 46 52 41 44 41 45 56 100 0 0 0 26 36 63 BLACK 28 23 32 27 30 28 26 0 100 0 0 41 33 18 HISPANIC 17 15 18 19 19 20 9 0 0 100 0 23 20 11 ASAIN 5 5 5 7 7 3 3 0 0 0 56 7 7 5 OTHER 4 5 3 3 4 4 6 0 0 0 44 3 5 3
39. Finally, for statistical purposes only, we need to know your total family income for
2012. Will you please tell me which of the following categories best represents your total family income?
(%) Likely Voters General Vote Borough Pub
1+/wk Car Triple Prime
Identifies as… d’B Lta DK Qu Bky Brx Man Dem Rep ind
Less than $20,000 13 14 4 16 11 18 17 6 15 6 12 16 9 5 $20,000-$34,999 11 11 11 9 4 12 19 10 12 8 9 11 9 12 $35,000-$49,999 12 14 8 7 12 13 14 9 12 12 12 13 9 8 $50,000-$74,999 17 17 19 12 19 16 10 20 16 18 17 17 20 15 $75,000-$99,999 11 11 10 9 15 8 14 10 11 13 13 11 10 11 $100,000-$150,000 10 11 13 6 9 9 6 11 10 12 11 10 12 9 $150,000+ 12 10 16 15 9 10 7 20 12 17 12 13 11 10 Don’t know (Vol.) 15 12 18 25 21 14 12 13 13 15 14 10 21 30
(%) Likely Voters Gender Age Race Income M F <35 35-49 50-64 65+ Wh Bl Hsp Oth <35k 35-75k >75k
Less than $20,000 13 11 14 19 11 10 13 5 21 17 17 54 0 0 $20,000-$34,999 11 10 11 19 9 7 12 8 14 14 8 46 0 0 $35,000-$49,999 12 10 13 9 15 10 12 8 14 19 10 0 41 0 $50,000-$74,999 17 17 17 10 19 20 16 14 20 14 26 0 59 0 $75,000-$99,999 11 7 14 5 14 11 9 12 9 11 7 0 0 32 $100,000-$150,000 10 12 9 8 8 13 9 15 7 5 2 0 0 31 $150,000+ 12 17 8 7 16 15 7 18 5 5 16 0 0 37 Don’t know (Vol.) 15 16 15 21 9 13 23 19 11 14 12 0 0 0