Travelling. Transport Places to go AbroadAt home Purpose Business Tourism With whom When.

December 2016
Transport Statistics Great Britain 2016 Modal Comparisons
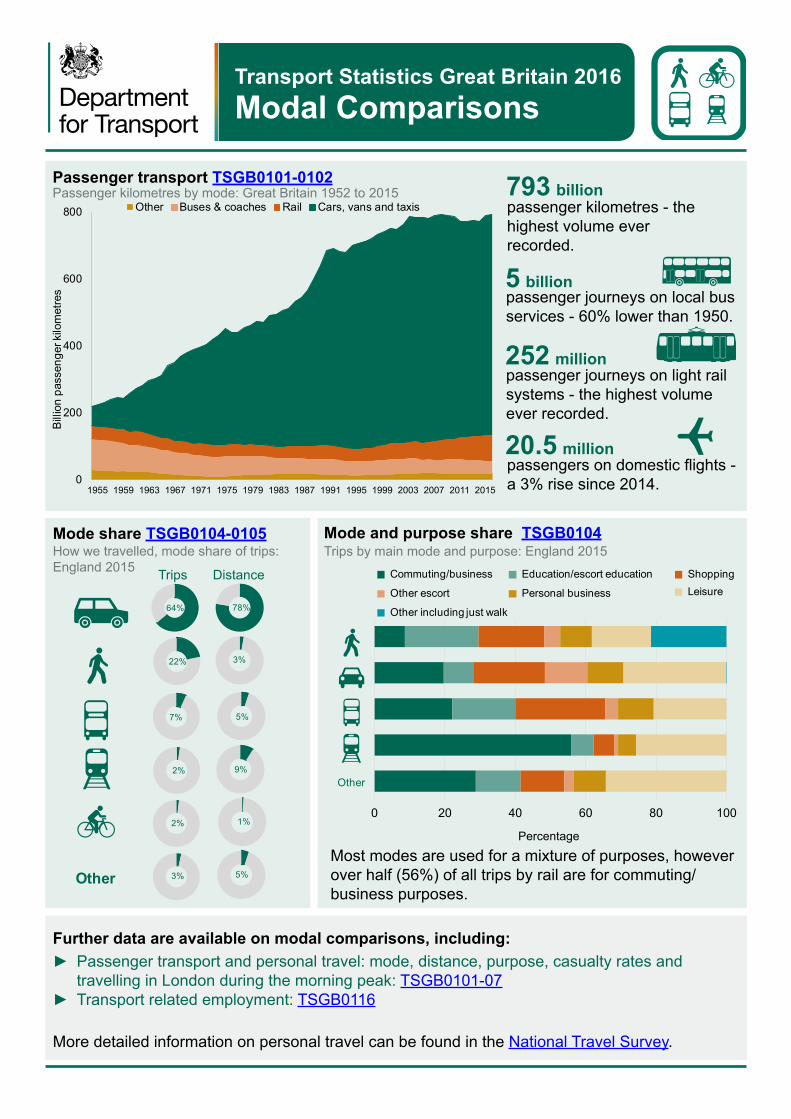
Passenger transport TSGB0101-0102Passenger kilometres by mode: Great Britain 1952 to 2015
0
200
400
600
800
Bill
ion
pass
enge
r kilo
met
res
Other Buses & coaches Rail Cars, vans and taxis793 billionpassenger kilometres - the highest volume ever recorded.
5 billionpassenger journeys on local bus services - 60% lower than 1950.
252 millionpassenger journeys on light rail systems - the highest volume ever recorded.
20.5 millionpassengers on domestic flights - a 3% rise since 2014.1955 1959 1963 1967 1971 1975 1979 1983 1987 1991 1995 1999 2003 2007 2011 2015
Mode share TSGB0104-0105
Trips Distance
How we travelled, mode share of trips: England 2015
Other
64% 78%
22% 3%
7% 5%
2% 9%
2% 1%
3% 5%
Trips by main mode and purpose: England 2015Mode and purpose share TSGB0104
0 20 40 60 80 100
Commuting/business Education/escort education Shopping
Other escort Personal business Leisure
Other including just walk
Other
Most modes are used for a mixture of purposes, however over half (56%) of all trips by rail are for commuting/business purposes.
Percentage
Further data are available on modal comparisons, including: ► Passenger transport and personal travel: mode, distance, purpose, casualty rates and travelling in London during the morning peak: TSGB0101-07
► Transport related employment: TSGB0116
More detailed information on personal travel can be found in the National Travel Survey.
Modal Comparisons
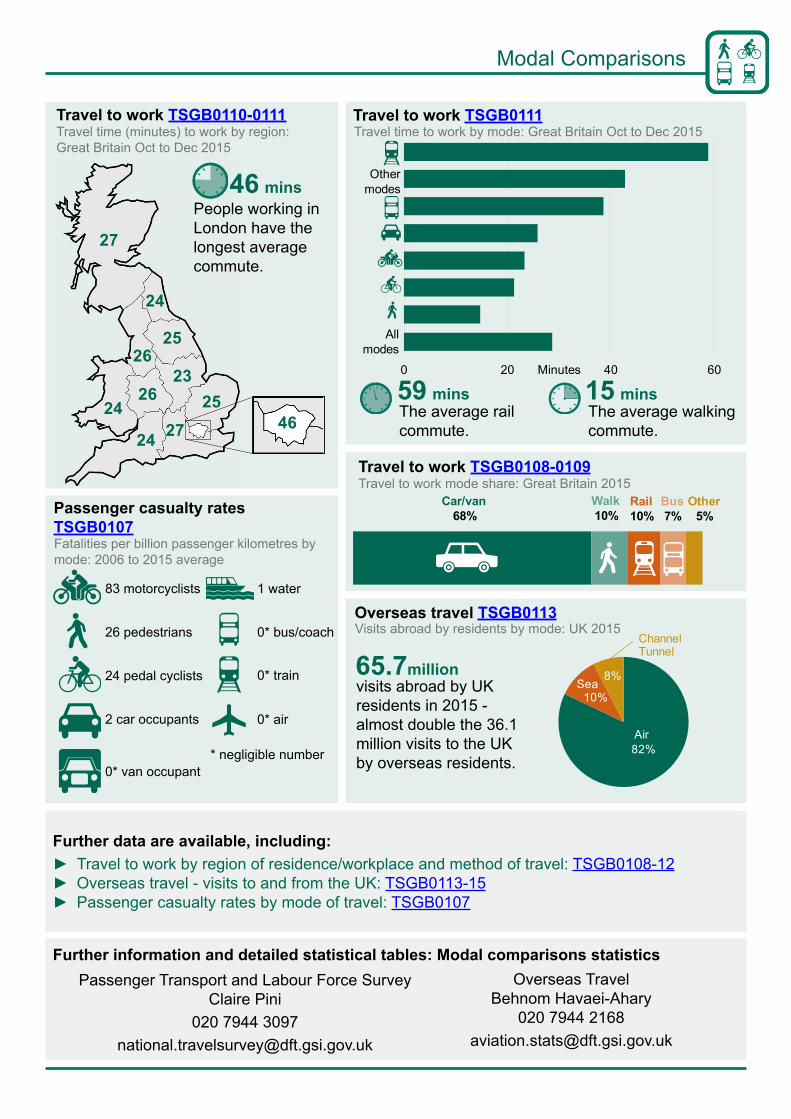
Travel to work TSGB0110-0111Travel time (minutes) to work by region: Great Britain Oct to Dec 2015
24
2625
2326 25
24 27 4624
27
People working in London have the longest average commute.
46 mins
Travel to work TSGB0111Travel time to work by mode: Great Britain Oct to Dec 2015
0 20 40 60Minutes
Other modes
All modes
59 minsThe average rail commute.
15 minsThe average walking commute.
Travel to work TSGB0108-0109Travel to work mode share: Great Britain 2015
Car/van68%
Walk10%
Rail10%
Bus7%
Other5%Passenger casualty rates
TSGB0107Fatalities per billion passenger kilometres by mode: 2006 to 2015 average
83 motorcyclists 1 water
26 pedestrians 0* bus/coach
24 pedal cyclists 0* train
2 car occupants 0* air
* negligible number0* van occupant
Overseas travel TSGB0113Visits abroad by residents by mode: UK 2015
65.7millionvisits abroad by UK residents in 2015 - almost double the 36.1 million visits to the UK by overseas residents.
82%
10%
8%
Air
Sea
Channel Tunnel
Further data are available, including: ► Travel to work by region of residence/workplace and method of travel: TSGB0108-12 ► Overseas travel - visits to and from the UK: TSGB0113-15 ► Passenger casualty rates by mode of travel: TSGB0107
Further information and detailed statistical tables: Modal comparisons statisticsPassenger Transport and Labour Force Survey
Claire Pini020 7944 3097
Overseas TravelBehnom Havaei-Ahary
020 7944 [email protected]
2
9
2
9
Transport Statistics Great Britain 2016 Aviation
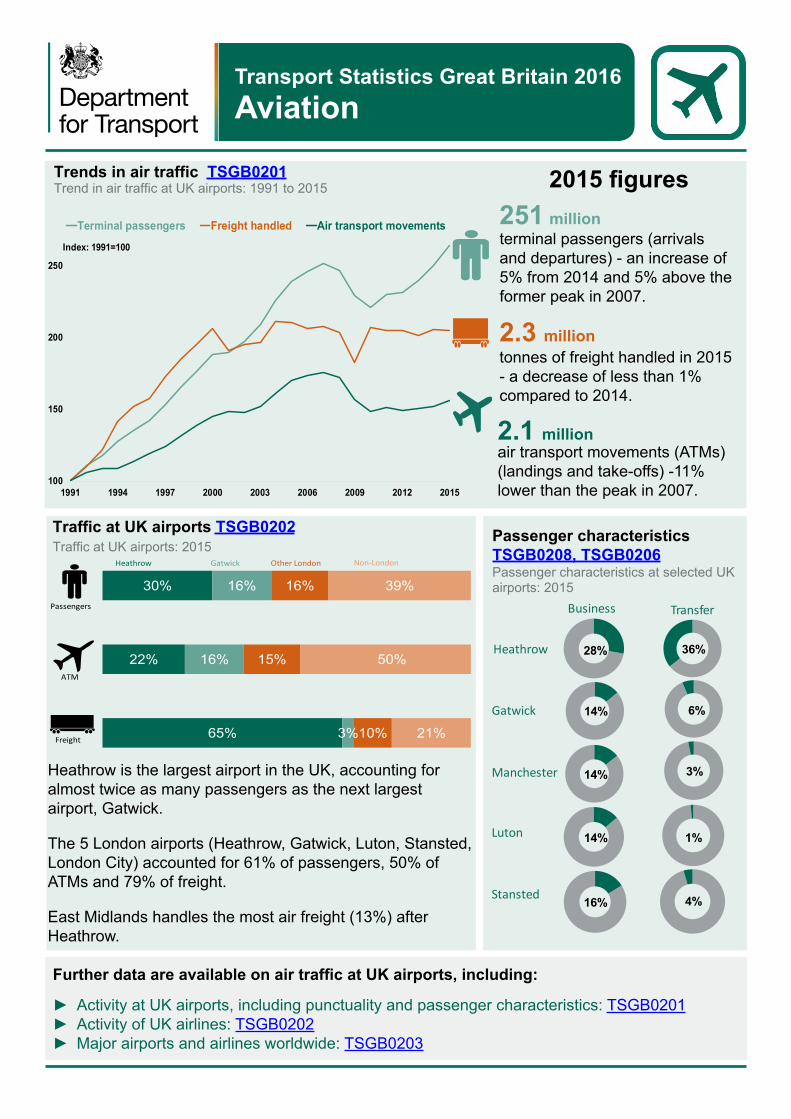
Trends in air traffic TSGB0201 Trend in air traffic at UK airports: 1991 to 2015 2015 figures
Index: 1991=100
100
150
200
250
1991 1994 1997 2000 2003 2006 2009 2012 2015
Terminal passengers Freight handled Air transport movements 251 millionterminal passengers (arrivals and departures) - an increase of 5% from 2014 and 5% above the former peak in 2007.
2.3 milliontonnes of freight handled in 2015 - a decrease of less than 1% compared to 2014.
2.1 millionair transport movements (ATMs)(landings and take-offs) -11% lower than the peak in 2007.
Passenger characteristics TSGB0208, TSGB0206 Passenger characteristics at selected UK airports: 2015
Stansted
Luton
Heathrow
Gatwick
Manchester
Business Transfer
28%
14%
14%
14%
16%
36%
6%
3%
1%
4%
Traffic at UK airports TSGB0202 Traffic at UK airports: 2015
65%
22%
30%
3%
16%
16%
10%
15%
16%
21%
50%
39%
Freight
ATM
Passengers
Heathrow Gatwick Other London Non-London
Heathrow is the largest airport in the UK, accounting for almost twice as many passengers as the next largest airport, Gatwick.
The 5 London airports (Heathrow, Gatwick, Luton, Stansted, London City) accounted for 61% of passengers, 50% of ATMs and 79% of freight.
East Midlands handles the most air freight (13%) after Heathrow.
Further data are available on air traffic at UK airports, including:
► Activity at UK airports, including punctuality and passenger characteristics: TSGB0201 ► Activity of UK airlines: TSGB0202 ► Major airports and airlines worldwide: TSGB0203

Aviation
International passenger movements TSGB0205 International passenger movements at UK airports: 2015 Most Popular
Destinations
Spain & TheCanary Islands
35.6m
USA
18.6m
Germany
13.2m
Italy
12.7m
Ireland
11.6m
0<1 million1 - 5 million5 - 10 million10 - 20 million>20 million
In 2015, nearly three-quarters (74%) of international passenger movements at UK airports were to/from other European countries.
Spain was the most popular country origin/destination for passengers at UK airports, accounting for 17% of international movements, followed by the USA (9%) and then Germany, Italy and Ireland, each at approximately 6%.
Mode of travel TSGB0207 Mode of travel to UK airports: 2015
Over half of terminating passengers at Stansted travelled to the airport by public transport in 2015, compared to 41%-42% at Heathrow and Gatwick, 17% at Manchester and 29% at Luton.
29%
39%
43%
54%
57%
30%
10%
15%
17%
26%
41%
52%
42%
29%
17%
Heathrow
Stansted
Gatwick
Luton
Manchester
Public TransportCar Taxi/minicab
Further data are available on passenger characteristics, including:
► International passenger movements at UK airports: TSGB0205 ► Type of passenger at selected UK airports: TSGB0206 ► Mode of transport to selected UK airports: TSGB0207 ► Purpose of travel at selected UK airports: TSGB0208 ► International passenger movements at UK airports: TSGB0209
Further information and detailed statistical tables: Aviation statisticsBenjamin Lucking
020 7944 [email protected]
John Wilkins020 7944 4441
Behnom Havaei-Ahary020 7944 2168
Transport Statistics Great Britain 2016 Energy and Environment
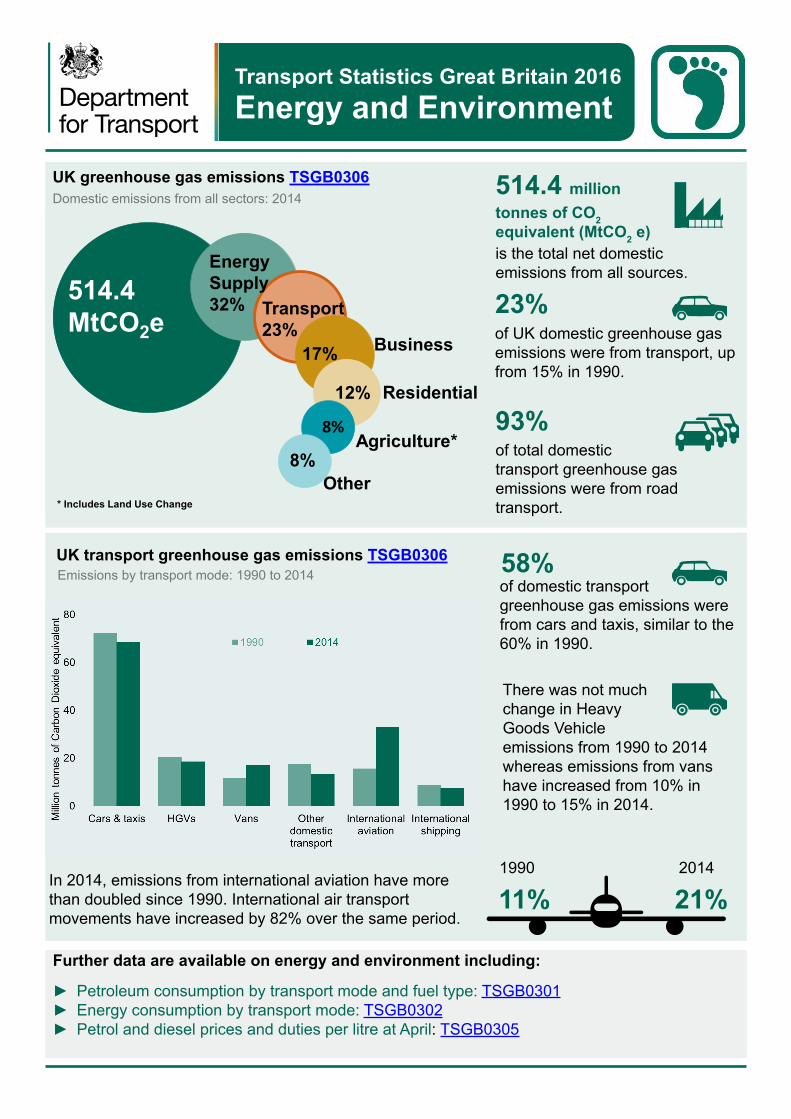
UK greenhouse gas emissions TSGB0306 Domestic emissions from all sectors: 2014
514.4 MtCO2e
32%
Energy Supply
Transport 23%
17% Business
12% Residential
8% Agriculture*
8% Other
* Includes Land Use Change
514.4 milliontonnes of CO2 equivalent (MtCO2 e) is the total net domestic emissions from all sources.
23% of UK domestic greenhouse gas emissions were from transport, up from 15% in 1990.
93% of total domestic transport greenhouse gas emissions were from road transport.
UK transport greenhouse gas emissions TSGB0306 Emissions by transport mode: 1990 to 2014
In 2014, emissions from international aviation have more than doubled since 1990. International air transport movements have increased by 82% over the same period.
58% of domestic transport greenhouse gas emissions were from cars and taxis, similar to the 60% in 1990.
There was not much change in Heavy Goods Vehicle emissions from 1990 to 2014 whereas emissions from vans have increased from 10% in 1990 to 15% in 2014.
1990 2014
21%11%
Further data are available on energy and environment including:
► Petroleum consumption by transport mode and fuel type: TSGB0301► Energy consumption by transport mode: TSGB0302► Petrol and diesel prices and duties per litre at April: TSGB0305
Energy and Environment
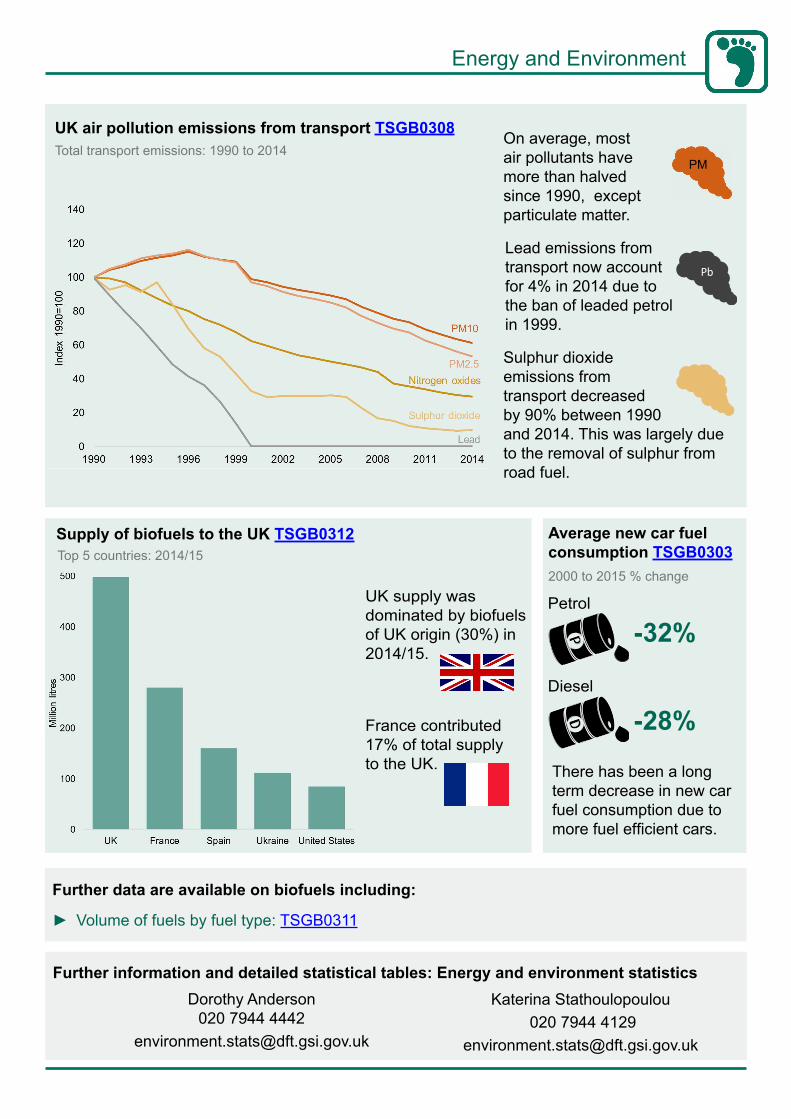
UK air pollution emissions from transport TSGB0308 Total transport emissions: 1990 to 2014
On average, most air pollutants have more than halved since 1990, except particulate matter.
Sulphur dioxide emissions from transport decreased by 90% between 1990 and 2014. This was largely due to the removal of sulphur from road fuel.
Lead emissions from transport now account for 4% in 2014 due to the ban of leaded petrol in 1999.
Supply of biofuels to the UK TSGB0312
Petrol UK supply was dominated by biofuelsof UK origin (30%) in 2014/15.
Top 5 countries: 2014/15
PM
Pb
France contributed 17% of total supply to the UK.
Average new car fuel consumption TSGB0303 2000 to 2015 % change
-32%
Diesel
-28%
There has been a long term decrease in new car fuel consumption due to more fuel efficient cars.
Further data are available on biofuels including:
► Volume of fuels by fuel type: TSGB0311
Further information and detailed statistical tables: Energy and environment statistics Dorothy Anderson Katerina Stathoulopoulou
020 7944 4442 020 7944 4129 [email protected] [email protected]

Transport Statistics Great Britain 2016 Freight
Domestic Freight TSGB0401Domestic freight, goods moved by mode: 1990 to 2015
0
50
100
150
200
250
1990 1995 2000 2005 2010 2015
Goo
ds m
oved
(bill
ion
tonn
e ki
lom
etre
s)
Road Rail Water
201 billion
152 billiontonne kilometres moved by road (76%)
tonne kilometres of domestic freight was moved within the UK in 2015 of which ...
18 billiontonne kilometres moved by rail (9%)
31 billiontonne kilometres moved by water (15%)
Percentages not comparable with TSGB0403
Top 3 freight commodities (by weight) transported by road TSGB0430Proportions of goods lifted 2015
Domestic and international road freight activity TSGB0433Goods lifted by GB registered HGVs: 2005 to 2015
0
5
10
15
20
0
500
1,000
1,500
2,000
2005 2006 2007 2008 2009 2010 2011 2012 2013 2014 2015
Inte
rnat
iona
l goo
ds li
fted
(mill
ion
tonn
es)
Dom
estic
goo
ds li
fted
(mill
ion
tonn
es) Domestic
International
Domestic goods lifted: 1,650 million tonnes (-6% since 2005) International goods lifted: 7.7 million tonnes (-3% since 2005)
► 395 million tonnes of agriculture, forestry and raw material products (24%)
► 297 million tonnes of metal, mineral and chemical products (18%)
► 284 million tonnes of food including beverages & tobacco products (17%)
Further data are available on freight, including: ► Domestic freight by mode: TSGB0401-0403 ► Domestic road freight activity: TSGB0404-0407 and TSGB0429-0433 ► International road freight activity: TSGB0411-0421 ► Rail freight activity: TSGB0422-0424 ► Road goods vehicles travelling to mainland Europe: TSGB0434-0435 ► Notes and definitions are available

Freight
Road goods vehicles TSGB0434Road goods vehicles travelling to mainland Europe: 1995 to 2015
Rail freight TSGB0422
In 2015, a total of 3.0 million goods vehicles travelled from Great Britain to mainland Europe (+3% compared to 2014 and +3% on the 2007 pre-recession peak).
Of these goods vehicles, 2.3 million were powered vehicles (+2% compared to 2014) and 0.7 million were unaccompanied trailers.0.0
0.5
1.0
1.5
2.0
2.5
3.0
3.5
1995 1997 1999 2001 2003 2005 2007 2009 2011 2013 2015
Milli
on v
ehic
les
Total goods vehicles
Foreign registered powered vehicles
Unaccompanied trailers
UK registered powered vehicles
10%
4%
8%
3%
Latest 12 month percentage change
Powered vehicles TSGB0435Top 5 powered vehicles travelling to mainland Europe by country of registration: 2005 and 2015
Goods moved by rail, by commodity: 2015/16
Rail freight TSGB0401Weight of goods lifted by rail
0
5
10
15
20
25
1999/00 2001/02 2003/04 2005/06 2007/08 2009/10 2011/12 2013/14 2015/16
Billi
on to
nne-
kilo
met
res
Coal Domestic intermodal Other
86 Mt2015/16
154 Mt1980/81
In 2015/16, 17.8 billion net tonne kilometres of freight were moved by rail (down 19.8% compared with 2014/15).In 2015/16, domestic intermodal commodities accounted for the largest percentage share of goods moved by rail, at 36%.
Rank2015
Poland
UK
Romania
Netherlands
SpainPoland
UK
Romania
Netherlands
France
1
2
3
4
5
1
2
4
7
16
Top 5Movement out of top 5
Rank2005
3
5
Germany
Spain
One goods vehicle represents 100,000 vehiclesIncreased in 2015 Decreased in 2015
France
Germany
6
7
418
Thousand vehicles
252
214
214
128
100
16
468
283
212
212
133
132
114
Thousand vehicles
The proportion of vehicles registered to countries such as the UK, Netherlands, Germany and France have fallen as a number of countries have increased their share since joining the EU.
Goods vehicles registered to Poland has increased from 5% in 2005 to 21% in 2015. This is a larger share than any other country.
Further information and detailed statistical tables: Freight statisticsRoad freight statistics
Paul McEvoy020 7944 5235
Roll-on roll-off international freightAmardeep Dhani020 7944 3717
Rail freightMargaret Shaw0207 944 2419
Transport Statistics Great Britain 2016 Maritime
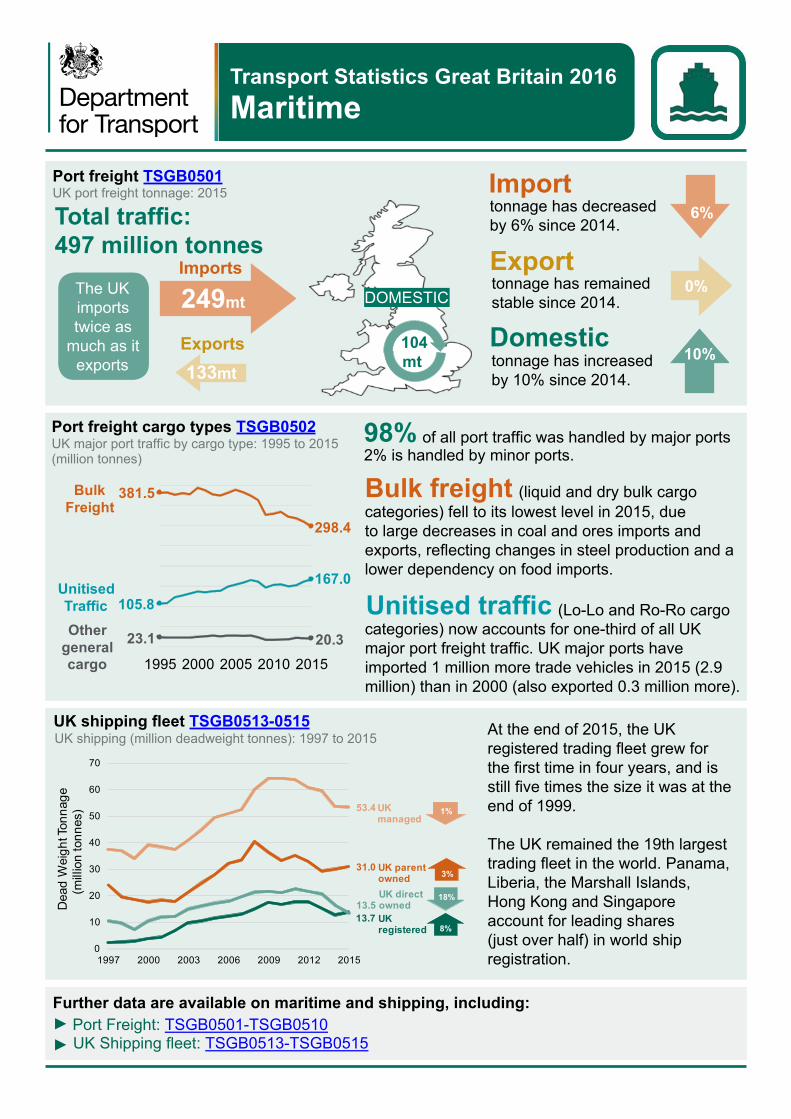
Port freight TSGB0501UK port freight tonnage: 2015
Imports
Total traffic: 497 million tonnes
The UK imports twice as
much as it exports 133mt
Exports 104 mt
Importtonnage has decreased by 6% since 2014.
Exporttonnage has remained stable since 2014.
Domestictonnage has increased by 10% since 2014.
6%
0%
10%
Port freight cargo types TSGB0502 UK major port traffic by cargo type: 1995 to 2015 (million tonnes)
of all port traffic was handled by major ports98%
Bulk freightcategories) fell to its lowest level in 2015, due to large decreases in coal and ores imports and exports, reflecting changes in steel production and a lower dependency on food imports.
2% is handled by minor ports.
(liquid and dry bulk cargo
categories) now accounts for one-third of all UK major port freight traffic. UK major ports have imported 1 million more trade vehicles in 2015 (2.9 million) than in 2000 (also exported 0.3 million more).
Unitised traffic (Lo-Lo and Ro-Ro cargo105.8
167.0
381.5
298.4
23.1 20.31995 2000 2005 2010 2015
UnitisedTraffic
Bulk Freight
Other general cargo
UK shipping fleet TSGB0513-0515UK shipping (million deadweight tonnes): 1997 to 2015
13.713.5
31.0
53.4
0
10
20
30
40
50
60
70
1997 2000 2003 2006 2009 2012 2015
Dea
d W
eigh
t Ton
nage
(mill
ion
tonn
es)
UK registered
UK direct owned
UK parent owned
UK managed
3%
1%
8%
18%
At the end of 2015, the UK registered trading fleet grew for the first time in four years, and is still five times the size it was at the end of 1999.
The UK remained the 19th largest trading fleet in the world. Panama, Liberia, the Marshall Islands, Hong Kong and Singapore account for leading shares (just over half) in world ship registration.
Further data are available on maritime and shipping, including: ► Port Freight: TSGB0501-TSGB0510► UK Shipping fleet: TSGB0513-TSGB0515
249mt DOMESTIC

Maritime
Sea passengers TSGB0511UK international short sea passenger journeys: 2015 compared to 2005, millions
0
6
12
18
France Irish Republic
Netherlands Belgium Other
-7%
-19%+5%
-55% -63%
Percentage change from 2005 to 2015
In 2015, there were 21.0 million international short sea passenger journeys to and from the UK.
Journeys to and from France accounted for 3 out of every 4 of these.
The port of Dover handled 62% of all international short sea passengers.
In 2015, there were 41.7 million passengers travelling on domestic routes, Cairnryan - Belfast remained the most popular route with 1.1 million passengers.
Cruise passengers TSGB0512UK cruise passengers
2015
1995207 thousand
1,895 thousand
There were 9 times more UK cruise passengers in 2015 than 20 years ago.
In 2015, 4 out of every 5 UK cruise passengers began or ended their cruise at Southampton.
Civilian search and rescue helicopters TSGB0518All eleven UK bases were fully operational after January 2016. There were 1,680 civilian search and rescue helicopter taskings in the UK during the year to end March 2016.
Passenger Vehicles TSGB0507Accompanied pass. vehicles: UK 2015
In 2015, there were 23,380 UK seafarers active at sea - an increase of 2 per cent compared to 2014 (22,910).
There were 1,920 officer trainees active at sea in 2015 - a 90 per cent increase compared to 2002 (1,010).
5.8 millioncars were handled at UK ports in 2015 - 53% travelled to or from France.
UK seafarers active at sea: 2002 to 2015
Further data are available on Maritime and shipping, including: ► Sea Passengers: TSGB0501-TSGB0510 ► Seafarers: TSGB0513-TSGB0515 ► Accompanied Passenger Vehicles: TSGB0506-TSGB0507
Seafarers TSGB0519
Further information and detailed statistical tables: Maritime statisticsAmardeep Dhani020 7944 3717
0
5,000
10,000
15,000
20,000
25,000
30,000
2002 2003 2004 2005 2006 2007 2008 2009 2010 2011 2012 2013 2014 2015
Certificated Officers Uncertificated Officers Ratings Officer trainees

Transport Statistics Great Britain 2016
Public Transport
Passenger journeys on public transportPassenger journeys by mode (billion): Great Britain 1985/86 to 2015/16
Passenger kilometres on public transport Passenger kilometres by mode (billion): Great Britain 1985/86 to 2015/16
5.04 billionlocal bus passenger journeys in Great Britain in 2015/16, 60% of all public transport journeys
57% increase in National Rail passenger journeys in Great Britain since 2005/06
257 millionpassenger journeys on light rail and tram systems in Great Britain, a record level since comparable records began in 1983
Share of passenger journeys and kilometres by public transport modePercentage share of passenger journeys and kilometres by mode: 2015/16
Growth in passenger kilometres for all public transport modes apart from buses, which have remained broadly flat.
Local bus and rail fares
1.9% 0.7% Local bus fares Rail fares in in Great Britain Great Britain in in the 12 months the 12 months to to March 2016 January 2016
Further data are available for each of the public transport modes, including: ► National Rail: TSGB0601-TSGB0608 ► Underground: TSGB0609-TSGB0610► Light Rail & Trams: TSGB0611-TSGB0617► Local Bus Services: TSGB0618-TSGB0624► Taxis: TSGB0628

10
8
6
4
0
2
National Rail in Great Britain
Passenger revenue
Total government support
04/05 07/08 09/10 11/12 13/14 15/16
10
8
6
4
2
0
Buses in England
Passenger fare receipts
Net government support (n/a in 15/16)
04/05 07/08 09/10 11/12 13/14 15/16
Public Transport
Revenue and government support TSGB0622 TSGB0623 TSGB0602 TSGB0625 Revenue and government support for rail and buses (£ billion): 2004/05 to 2015/16
Bus revenue has increased since 2004/05, net government support has fallen since 2009/10. For rail, passenger revenue has increased year-on-year while total government support remains steady.
Local bus concessionary travel TSGB0627 England 2015/16
9.9 million older and disabled concessionary travel passes
0.97 billion older and disabled concessionary bus journeys
98 concessionary bus journeys per pass
Taxis and Private Hire Vehicles TSGB0628 Taxis and PHVs by area (thousand): England 2015
Passengers in excess of capacity (PiXC)1
TSGB0607 PiXC for London & SE operators
1 PiXC is the percentage of passengers in excess of capacity on a typical autumn weekday.
Light rail passenger journeys TSGB0611 Passenger journeys (million): England 2015/16
Further information and detailed statistical tables: Public transport statistics Rail Buses, Light Rail & Taxis
Margaret Shaw Julie Sullivan 020 7944 2419 020 7944 3094
Transport Statistics Great Britain 2016 Roads and Traffic
LGV
HGV
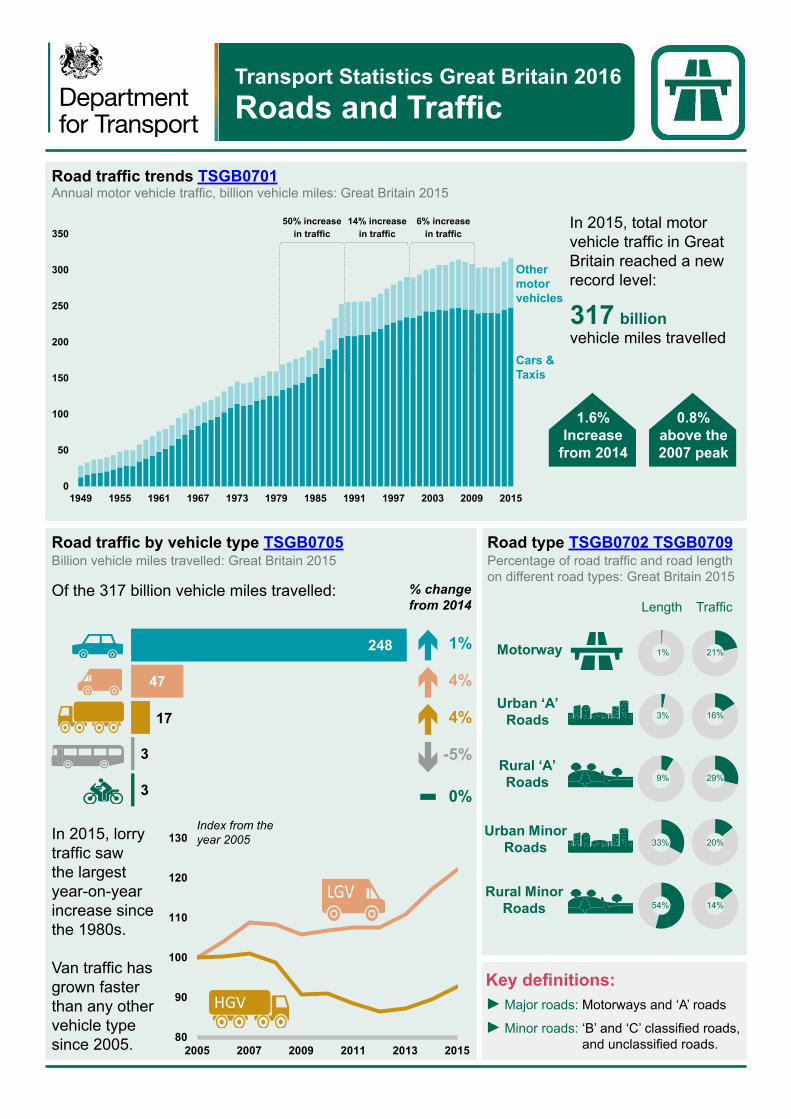
Road traffic trends TSGB0701Annual motor vehicle traffic, billion vehicle miles: Great Britain 2015
0
50
100
150
200
250
300
350
1949 1955 1961 1967 1973 1979 1985 1991 1997 2003 2009 2015
Cars & Taxis
Other motorvehicles
50% increase in traffic
14% increasein traffic
6% increase in traffic
In 2015, total motor vehicle traffic in Great Britain reached a new record level:
317 billionvehicle miles travelled
1.6%Increase
from 2014
0.8%above the 2007 peak
Billion vehicle miles travelled: Great Britain 2015Road traffic by vehicle type TSGB0705
Of the 317 billion vehicle miles travelled:
3
3
17
47
248
% change from 2014
1%
4%
4%
-5%
0%
Road type TSGB0702 TSGB0709Percentage of road traffic and road length on different road types: Great Britain 2015
TrafficLength
Motorway
Urban ‘A’ Roads
Rural ‘A’ Roads
Urban Minor Roads
Rural Minor Roads
1% 21%
3% 16%
9% 29%
33% 20%
54% 14%
In 2015, lorry traffic saw the largest year-on-year increase since the 1980s.
Van traffic has grown faster than any other vehicle type since 2005.
Index from the year 2005
80
90
100
110
120
130
2005 2007 2009 2011 2013 2015
Key definitions: ► Major roads: Motorways and ‘A’ roads
► Minor roads: ‘B’ and ‘C’ classified roads, and unclassified roads.

Roads and Traffic
Congestion on local ‘A’ roads in England TSGB0716Average delay compared to free flow (seconds per vehicle per mile)
35
40
45
50
55
Mar2014
Jun2014
Sep2014
Dec2014
Mar2015
Jun2015
Sep2015
Dec2015
Year ending
Monthly
0
The average delay on local ‘A’ roads in England in 2015 was:
44.6 seconds pervehicle per mile
5.4%increase on
previousyear
Road length TSGB0709Vehicle speed compliance TSGB0714 TSGB0715Free flowing vehicles exceeding the speed limit on roads: Great Britain 2015
thousand miles of road
less than0.1 per cent increase from 2014
245.9
Road Type 2011 2015 2011 2015 2011 2015
Motorways 49% 46% ▼ 49% 46% ▼ 1% 1% ▬
National speed limit single carriageways 9% 8% ▼ .. .. .. ..
30 mph roads 54% 52% ▼ 58% 56% ▼ 47% 44% ▼
20 mph roads .. 84% .. 83% .. 73%
Motorways and ‘A’ roads accounted for 13% of total road length, but carried 66% of total road traffic.
Since 2011, average free flow speeds for all vehicle types across each road type monitored have remained broadly stable. The percentage of vehicles exceeding the speed limit for each type of vehicle has generally declined for nearly all vehicle types and road types.
‘C’ road
‘B’ road
‘A’ roadMotorway
Unclassifiedroad
2015road
lengthFurther data are available on roads and traffic, including:
► Road traffic and lengths: TSGB0701-13 ► Road speeds: TSGB0714-15 ► Road congestion: TSGB0721 ► Road construction and expenditure TSGB0717-0720
Further information and detailed statistical tables: Roads and traffic statisticsRoad traffic and speed
compliance020 7944 3095
Road length, condition and expenditure020 7944 5032
[email protected] [email protected]
Road congestion and travel times020 7944 5383
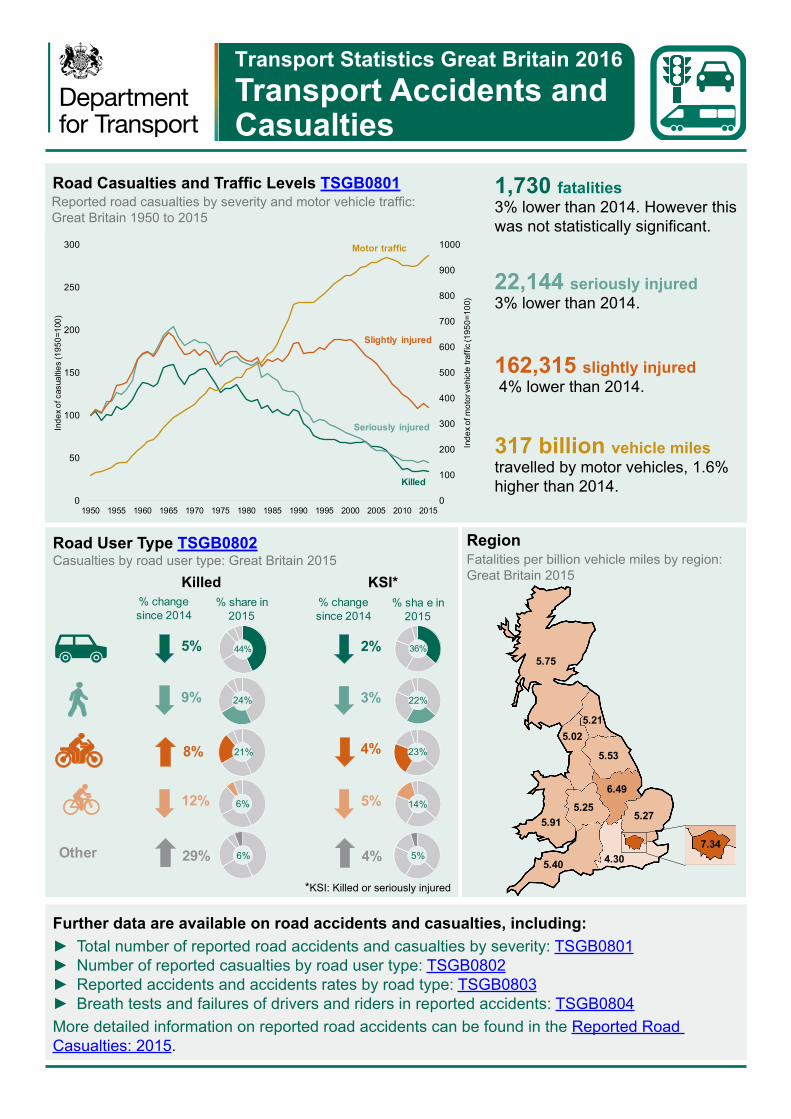
Road Casualties and Traffic Levels TSGB0801Reported road casualties by severity and motor vehicle traffic: Great Britain 1950 to 2015
Transport Statistics Great Britain 2016 Transport Accidents and Casualties
0
100
200
300
400
500
600
700
800
900
1000
0
50
100
150
200
250
300
1950 1955 1960 1965 1970 1975 1980 1985 1990 1995 2000 2005 2010 2015
Inde
x of
mot
or ve
hicl
e tra
ffic
(195
0=10
0)
Inde
x of
cas
ualti
es (1
950=
100)
Killed
Seriously injured
Slightly injured
Motor traffic
1,730 fatalities3% lower than 2014. However this was not statistically significant.
22,144 seriously injured3% lower than 2014.
162,315 slightly injured 4% lower than 2014.
317 billion vehicle milestravelled by motor vehicles, 1.6% higher than 2014.
Casualties by road user type: Great Britain 2015Road User Type TSGB0802
*KSI: Killed or seriously injured
Other
44%
24%
21%
6%
6%
5%
9%
8%
12%
29%
% change since 2014
% share in 2015
36%
22%
23%
14%
5%
2%
3%
4%
5%
4%
% change since 2014
% sha e in 2015
Killed KSI*
RegionFatalities per billion vehicle miles by region: Great Britain 2015Ki l
4
2
2
36%
22%
23%
14%
5%
KSI
5
9
8
12
29
2%
3%
4%
5%
4%
% chans nce 20
% sh re20
% changesince 2014
% sha e in 2015
K l
%
%
%
%
%
%
%
%
%
changece 2014
share n 15
Ki l
4
2
2
Other
KSI
5
9
8
12
29
% chans nce 20
% sh re20
5.75
5.53
5.915.25
6.49
5.27
5.40 4.30
5.025.21
7.34
Further data are available on road accidents and casualties, including: ► Total number of reported road accidents and casualties by severity: TSGB0801 ► Number of reported casualties by road user type: TSGB0802 ► Reported accidents and accidents rates by road type: TSGB0803 ► Breath tests and failures of drivers and riders in reported accidents: TSGB0804
More detailed information on reported road accidents can be found in the Reported Road Casualties: 2015.

Transport Accidents and Casualties
Rail accidents and safety TSGB0805-0807Fatalities on the national rail network: Great Britain 2001/02 to 2015/16
0
40
80
120
160
01/02 02/03 03/04 04/05 05/06 06/07 07/08 08/09 09/10 10/11 11/12 12/13 13/14 14/15 15/16
Inde
x 20
01/0
2 =
100
fatalities (excl suicides)
suicides
passenger km 64.4 billion passenger kms65% higher than in 2001/02.
252 suicides31% higher than in 2001/02.
297 fatalities9% higher than in 2001/02.
0 passengers
297fatalities in 2015/16
Suicides 85%
Trespassers 10%
Levelcrossings
1%
Other 4%
National rail casualties by type: Great Britain 2015/16
Fatalities 2%
Major injuries 4%
Shock / Trauma 7%
Minor injuries 88%Total
casualties:14.4k
Fatalities only 2% of all rail accident casualties
Signals passed at danger (SPADs) TSGB0808SPADs on Network rail controlled infrastructure: Great Britain 2015/16
No significant risk 72%Potentially significiant 25%
Potentially severe 3%2015/16 in 2001/02.
277SPADs - 36% lower than the 433
72%of SPADs posed no significant risk compared with 31% in 2001/02.
Further data are available on rail accidents and casualties, including: ► Rail accidents and safety: TSGB0805-0807 ► Signals passed at danger (SPADs) on Network Rail controlled infrastructure: TSGB0808
Further information are published by the Rail Safety and Standards Board.
Further information and detailed statistical tables: Accidents and casualties statisticsRoad accidents and casualties
Lizzie Wloch020 7944 6595
Rail accidents and safetyMargaret Shaw020 7944 2419
killed in train accidents since 2007/08
Transport Statistics Great Britain 2016 Vehicles
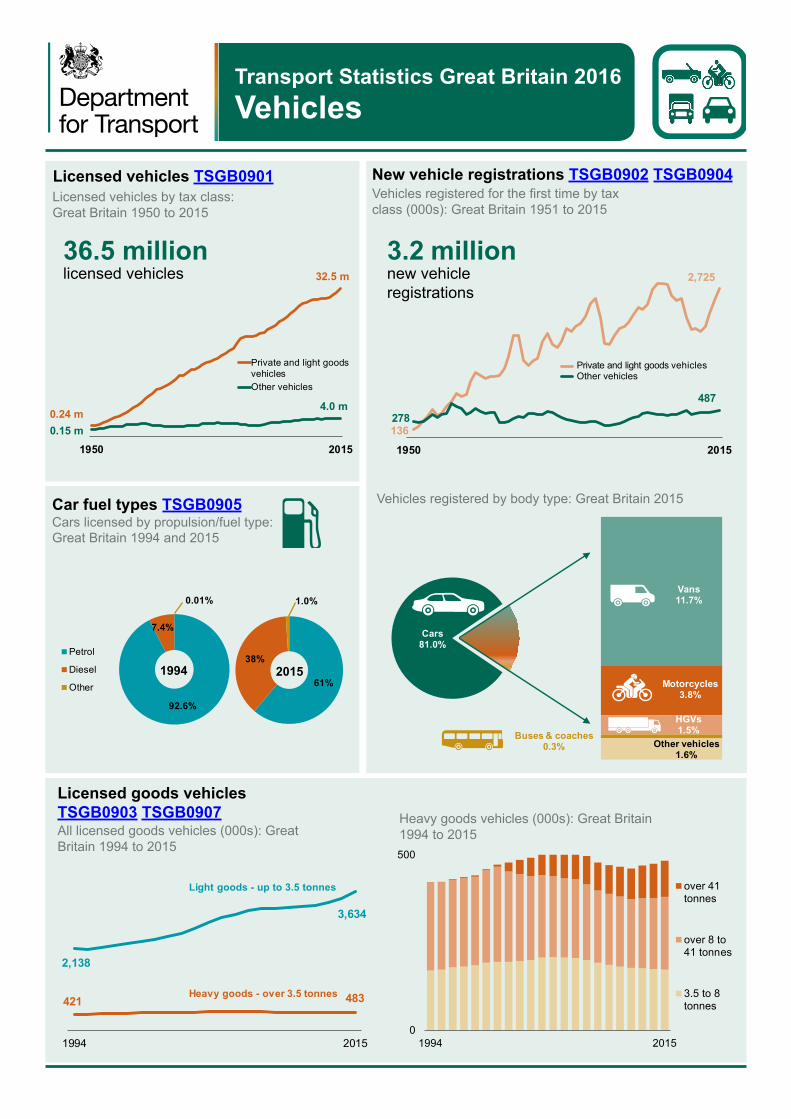
Licensed vehicles TSGB0901Licensed vehicles by tax class:Great Britain 1950 to 2015
36.5 millionlicensed vehicles
1950 2015
Private and light goodsvehiclesOther vehicles
0.24 m0.15 m
4.0 m
32.5 m
Vehicles registered for the first time by tax class (000s): Great Britain 1951 to 2015
New vehicle registrations TSGB0902 TSGB0904
3.2 millionnew vehicle registrations
136
2,725
278
487
1950 2015
Private and light goods vehicles Other vehicles
Car fuel types TSGB0905 Cars licensed by propulsion/fuel type: Great Britain 1994 and 2015
92.6%
7.4%
0.01%
Petrol
Diesel
Other 61%
38%
1.0%
1994 2015
All licensed goods vehicles (000s): Great Britain 1994 to 2015
Licensed goods vehicles TSGB0903 TSGB0907
2,138
3,634
421 483
1994 2015
Light goods - up to 3.5 tonnes
Heavy goods - over 3.5 tonnes
Vehicles registered by body type: Great Britain 2015
Cars81.0%
Vans11.7%
Motorcycles3.8%
HGVs1.5%Buses & coaches
0.3% Other vehicles1.6%
Heavy goods vehicles (000s): Great Britain 1994 to 2015
0
500
1994 2015
over 41tonnes
over 8 to41 tonnes
3.5 to 8tonnes
Vehicles
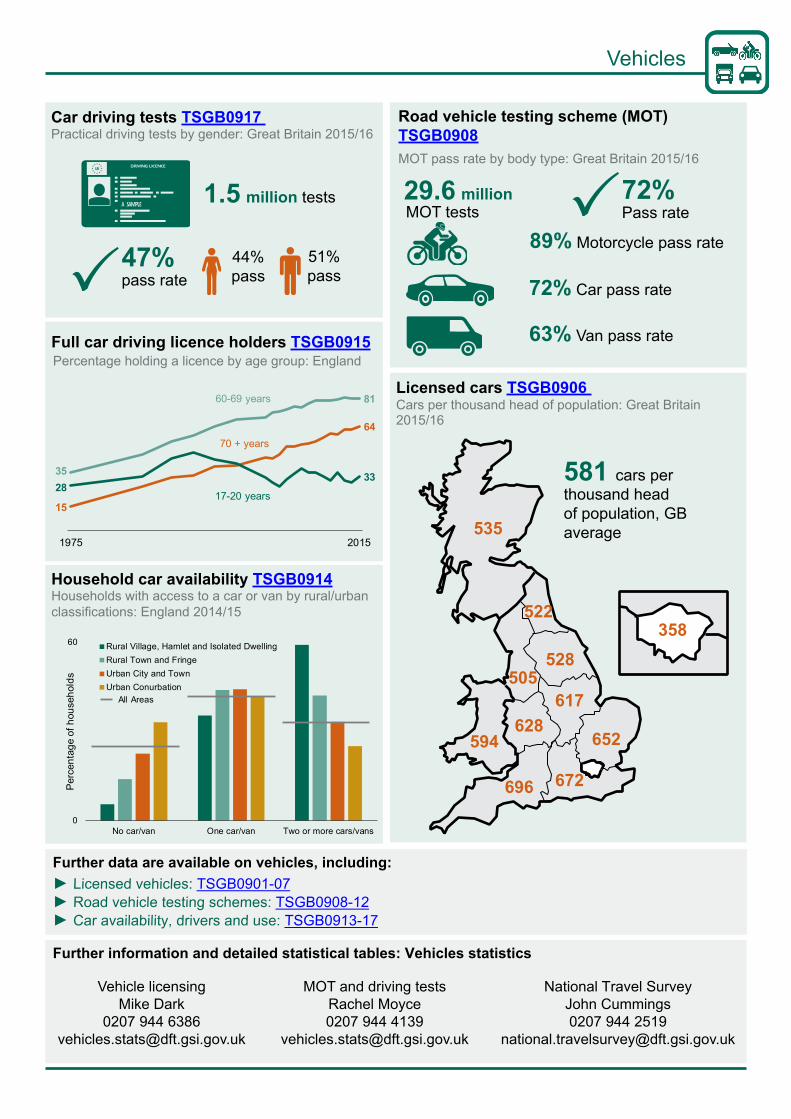
Car driving tests TSGB0917 Practical driving tests by gender: Great Britain 2015/16
1.5 million tests
44% pass
47% pass rate
51% pass
Full car driving licence holders TSGB0915Percentage holding a licence by age group: England
35
81
15
64
2833
1975 2015
17-20 years
60-69 years
70 + years
Household car availability TSGB0914Households with access to a car or van by rural/urban classifications: England 2014/15
0
60
No car/van One car/van Two or more cars/vans
Per
cent
age
of h
ouse
hold
s
Rural Village, Hamlet and Isolated DwellingRural Town and FringeUrban City and TownUrban Conurbation
All Areas
Road vehicle testing scheme (MOT) TSGB0908MOT pass rate by body type: Great Britain 2015/16
29.6 millionMOT tests
72%Pass rate
89% Motorcycle pass rate
63% Van pass rate
72% Car pass rate
Licensed cars TSGB0906Cars per thousand head of population: Great Britain 2015/16
522
505
628594
528
535
696
617
672
652
358
581 cars perthousand head of population, GB average
Further data are available on vehicles, including:► Licensed vehicles: TSGB0901-07► Road vehicle testing schemes: TSGB0908-12► Car availability, drivers and use: TSGB0913-17
Further information and detailed statistical tables: Vehicles statistics
Vehicle licensingMike Dark
0207 944 [email protected]
MOT and driving testsRachel Moyce0207 944 4139
National Travel SurveyJohn Cummings0207 944 2519
Transport Statistics Great Britain 2016 Walking and Cycling
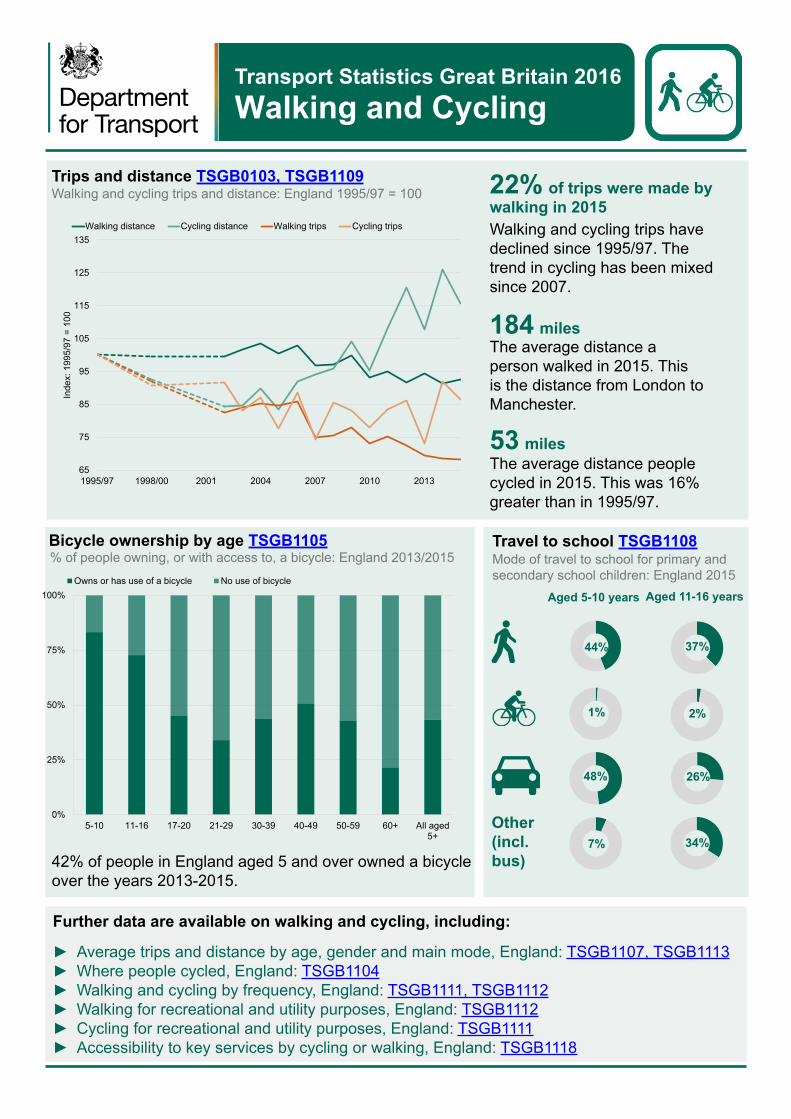
Trips and distance TSGB0103, TSGB1109Walking and cycling trips and distance: England 1995/97 = 100
65
75
85
95
105
115
125
135
1995/97 1998/00 2001 2004 2007 2010 2013
Inde
x: 1
995/
97 =
100
Walking distance Cycling distance Walking trips Cycling trips
22% of trips were made bywalking in 2015Walking and cycling trips have declined since 1995/97. The trend in cycling has been mixed since 2007.
184 milesThe average distance a person walked in 2015. This is the distance from London to Manchester.
53 milesThe average distance people cycled in 2015. This was 16% greater than in 1995/97.
% of people owning, or with access to, a bicycle: England 2013/2015Bicycle ownership by age TSGB1105
0%
25%
50%
75%
100%
5-10 11-16 17-20 21-29 30-39 40-49 50-59 60+ All aged5+
Owns or has use of a bicycle No use of bicycle
42% of people in England aged 5 and over owned a bicycle over the years 2013-2015.
Mode of travel to school for primary and secondary school children: England 2015
Travel to school TSGB1108
Aged 5-10 years Aged 11-16 years
Other(incl.bus)
7% 34%
44% 37%
48% 26%
1% 2%
Further data are available on walking and cycling, including:
► Average trips and distance by age, gender and main mode, England: TSGB1107, TSGB1113 ► Where people cycled, England: TSGB1104 ► Walking and cycling by frequency, England: TSGB1111, TSGB1112 ► Walking for recreational and utility purposes, England: TSGB1112 ► Cycling for recreational and utility purposes, England: TSGB1111 ► Accessibility to key services by cycling or walking, England: TSGB1118

Walking and Cycling
Cycling frequency TSGB1101% of adults cycling at least once per month: England 2014/15
0%
5%
10%
15%
20%
England North East North West Yorkshireand theHumber
EastMidlands
WestMidlands
East ofEngland
London South East South West
15% of adults in Englandcycled at least once a month in 2014/15.
17% of adults in the East ofEngland, South West and South East cycled at least once a month.
58% of adults in Cambridgecycled at least once a month - the highest rate in the country.
Pedestrian and pedal cycle road accidents TSGB1110Reported killed or seriously injured casualties: Great Britain 1979 to 2015 3,339 pedal cycle KSIs
This was an 5% fall on the 2014 figure.
100 pedal cycle deathsThe number of deaths has remained between 100 and 118 since 2008.
5,348 pedestrian KSIsin reported road traffic accidents. This was an decrease of 3% on the 2014 figure. 22% of all KSIs were pedestrians and 14% 0
5,000
10,000
15,000
20,000
25,000
1979 1982 1985 1988 1991 1994 1997 2000 2003 2006 2009 2012 2015
Pedestrians
Pedal cyclists
Further data are available on pedestrian and pedal cyclist road accidents, including:
► Vehicle accident numbers and rates by severity, GB: TSGB1119 ► Perception of roads being too dangerous to cycle on, GB: TSGB1120 ► International comparisons of road deaths, UK: TSGB1121
Further information and detailed statistical tables: Walking and cycling statisticsLocal Transport Statistics
Adam Evans020 7944 3094

Transport Statistics Great Britain 2016 Transport and Disability
Travel by people with mobility difficulties TSGB1201Trips per person per year by age and mobility status: England 2014
0
200
400
600
800
1,000
All aged 16+ 16-49 50-59 60-69 70+
With a mobility difficulty Without a mobility difficulty
9% of adultsreported having a mobility difficulty* in England in 2015
38% fewer tripsby individuals aged 16 and over with mobility difficulties
474 trips per person per year were taken by those aged 70 and over with mobility difficulties - nearly half the number of trips undertaken by those with no mobility disability
Percentage of trips per person per year by mobility status and main mode: England 2015
Travel by mobility status and main mode TSGB1203
38% 30% 16% 9% 8%
51% 14% 20% 7% 8%
With a mobility difficulty
Without a mobility difficulty
A similar proportion of people with and without mobility difficulties use the car for trips. However, people with mobility difficulties do a higher proportion of car trips as a passenger
Public transport: accessibility to disabled people% fully accessible vehicles: England March 2015
58% Mar 2015 2
since 2005 TSGB1207
94% Mar 2016 65
since 2005 TSGB1206
Percentage points
Percentage points
Percentage points
Driver
70% Jul 2016 9
since Nov 2015
No mobility difficulty
Trips per person per year by purpose: England 2015
Travel by trip purpose TSGB1202
With mobility difficulty
35%
32%
24%
6%
4%
22%
30%
17%
24%
7%
BANK
LIBRARY
Leisure/other
Commuting
Shopping
Personal/other escort
Education/education escort*The National Travel Survey definition of mobility difficulty is based on adults who say they have difficultes travelling on foot, by bus or both
Further data are available on transport and disability, including:
► Travel by people with mobility difficulties (National Travel Survey): TSGB1201-3 ► Disability accessible buses and taxis: TSGB1206 (buses) and TSGB1207 (taxis) ► List of rail vehicles built or refurbished to modern accessibility standards
Transport and Disability
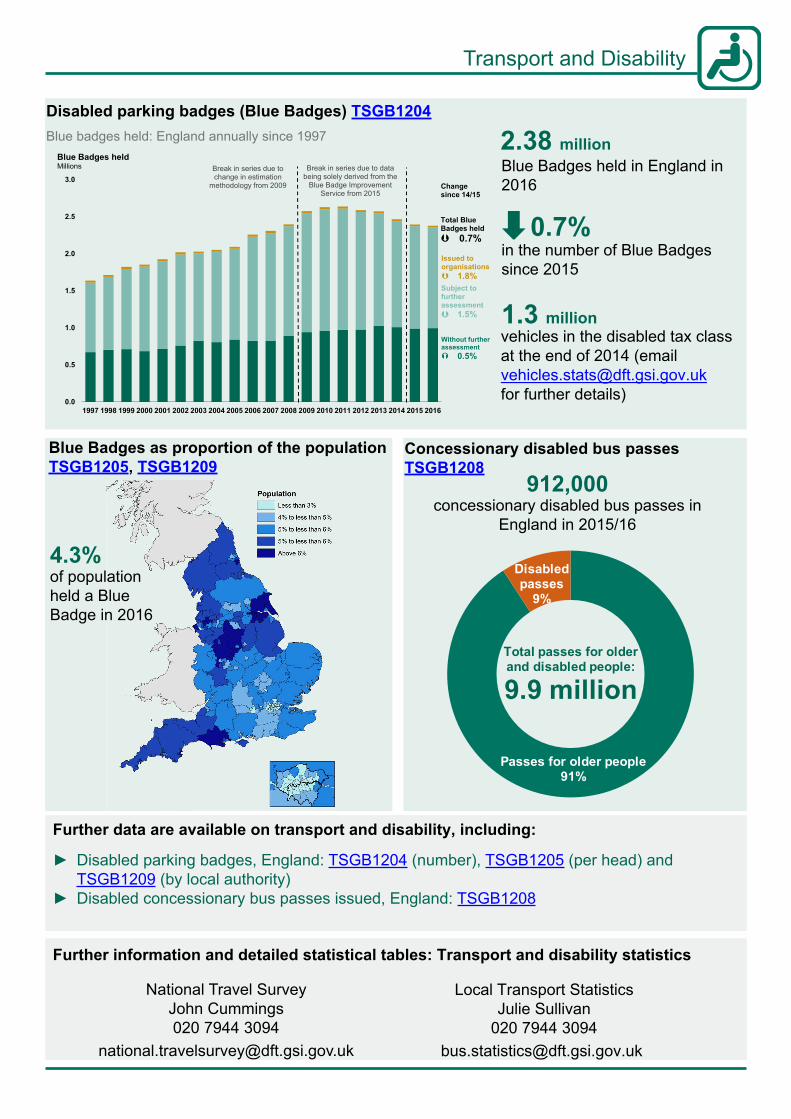
Disabled parking badges (Blue Badges) TSGB1204Blue badges held: England annually since 1997
0.0
0.5
1.0
1.5
2.0
2.5
3.0
1997 1998 1999 2000 2001 2002 2003 2004 2005 2006 2007 2008 2009 2010 2011 2012 2013 2014 2015 2016
Break in series due to change in estimation
methodology from 2009
Blue Badges held Millions Break in series due to data
being solely derived from the Blue Badge Improvement
Service from 2015Change since 14/15
Total Blue Badges held 0.7%
Issued toorganisations 1.8%Subject to further assessment 1.5%
Without further assessment 0.5%
2.38 millionBlue Badges held in England in 2016
in the number of Blue Badges since 2015
0.7%
1.3 millionvehicles in the disabled tax class at the end of 2014 (email [email protected] for further details)
Blue Badges as proportion of the population TSGB1205, TSGB1209
4.3%of population held a Blue Badge in 2016
Concessionary disabled bus passes TSGB1208
912,000concessionary disabled bus passes in
England in 2015/16
Total passes for older and disabled people:
9.9 million
Passes for older people91%
Disabled passes
9%
Further data are available on transport and disability, including:
► Disabled parking badges, England: TSGB1204 (number), TSGB1205 (per head) and TSGB1209 (by local authority)
► Disabled concessionary bus passes issued, England: TSGB1208
Further information and detailed statistical tables: Transport and disability statistics
National Travel SurveyJohn Cummings020 7944 3094
Local Transport Statistics Julie Sullivan
020 7944 [email protected]

Transport Statistics Great Britain 2016 Transport Expenditure
UK public expenditure on transport TSGB1301Transport expenditure: 1989-90 to 2015-16
£29.2 billion in 2015-16
2015-16 prices
Current
£29.2 billionspent on public transport expenditure in 2015-16. Includes National Rail for the first time.
increase on 2014-15, mainly due to National Rail being included (33%).
£7.2 billion
8% increase on 2014-15 excluding rail (£1.0 billion).
UK public expenditure on transport TSGB1303Expenditure by transport function: 2015-16
National Roads13%
Local Roads19%
Local Public
Transport9%
Rail52%
Other transport
7%
Total transportexpenditure
£29.2billion
£15 billionspending on railways in 2015-16, accounting for 52% of total public expenditure on transport.
£5 billionspending on local roads in 2015-16, accounting for 19% of total public expenditure on transport.
Further data are available on transport expenditure, including:
► Public expenditure on transport by country and spending authority: TSGB1302 ► Total UK public corporation capital expenditure on transport: TSGB1304 ► Public expenditure on specific transport areas: TSGB1305

Transport Expenditure
Consumer price index TSGB1307Transport components: 1987 to 2015
0
50
100
150
200
250
1997 1999 2001 2003 2005 2007 2009 2011 2013 2015
All items CPI
Motoring
Rail passenger transportBus passenger transport
The cost of travel has risen faster than the cost of living since 1997.
Increases in the cost of travelling by different surface modes are similar.
Transport taxes TSGB1310Fuel duty revenue more than tripled between 1987 and 2010 but has remained around £27 billion since then.
Vehicle excise duty generated around £6 billion in 2015, down 1% from 2014.
Other motoring costs
Transport fares
Air and other travel
Fuel duty and vehicle excise duty: 1987 to 2015
15%
8%
14%
Further data are available on transport expenditure, including:
► Household expenditure on transport: TSGB1306 ► Road taxation revenue: TSGB1310
Further information and detailed statistical tables: Transport expenditure statisticsDorothy Anderson
020 7944 [email protected]
14.1%of household expenditure per week was spent on transport in 2014 of which:
33% Purchase of vehicles
31% Petrol, Diesel andother oils


![“Transport and travelling.” [ei][][][i] planeluggageship trainbusticket stayBus stopmiss.](https://static.fdocuments.in/doc/165x107/56649e3a5503460f94b2c27d/transport-and-travelling-eii-planeluggageship-trainbusticket.jpg)