Transport of Asian Dust to the Mid-Atlantic United States: Lidar, satellite observations and PM 2.5...
26
Transport of Asian Dust to the Mid-Atlantic United States: Lidar, satellite observations and PM 2.5 speciation. Rubén Delgado, Sergio DeSouza-Machado Joint Center for Earth Systems Technology University of Maryland, Baltimore County Baltimore, MD
-
Upload
nickolas-bruce -
Category
Documents
-
view
213 -
download
0
Transcript of Transport of Asian Dust to the Mid-Atlantic United States: Lidar, satellite observations and PM 2.5...
Transport of Asian Dust to theMid-Atlantic United States:
Lidar, satellite observations and PM2.5 speciation.
Rubén Delgado, Sergio DeSouza-Machado
Joint Center for Earth Systems TechnologyUniversity of Maryland, Baltimore County
Baltimore, MD

CREST Lidar Network (CLN)Comprised of 4 lidar facilities partially supported by
NOAA’s Office of Education Educational Partnership Program Cooperative Remote Sensing Science and Technology Center.
•City College of New York (2004)New York City, NY
•Univ. of MD, Baltimore County (2001)Catonsville/Baltimore, MD
•Hampton University (2008)Hampton, VA
•Univ. Of Puerto Rico, Mayagüez (2008) Mayagüez, PR
•Remote sensing studies of the atmosphere with lidar measurements to determine the vertical distribution of aerosols (natural and anthropogenic) and gases.
•Lidar activities at UMBC support NOAA CREST Lidar Network, WMO-GALION, Maryland’s Department of the Environment and Energy Administration, NOAA and NASA satellite cal/val efforts.
•Understanding optical, chemical and physical properties of atmospheric aerosols and lower troposphere atmospheric dynamics.
•The integration of measurements of atmospheric aerosol properties contribute to an operational service in support of policy issues on air quality, energy, and climate change .
UMBC Monitoring of Atmospheric Pollution(UMAP)

Profiling Air Quality over BaltimoreUMBC Monitoring of Atmospheric Pollution (UMAP)
http://alg.umbc.edu/umap
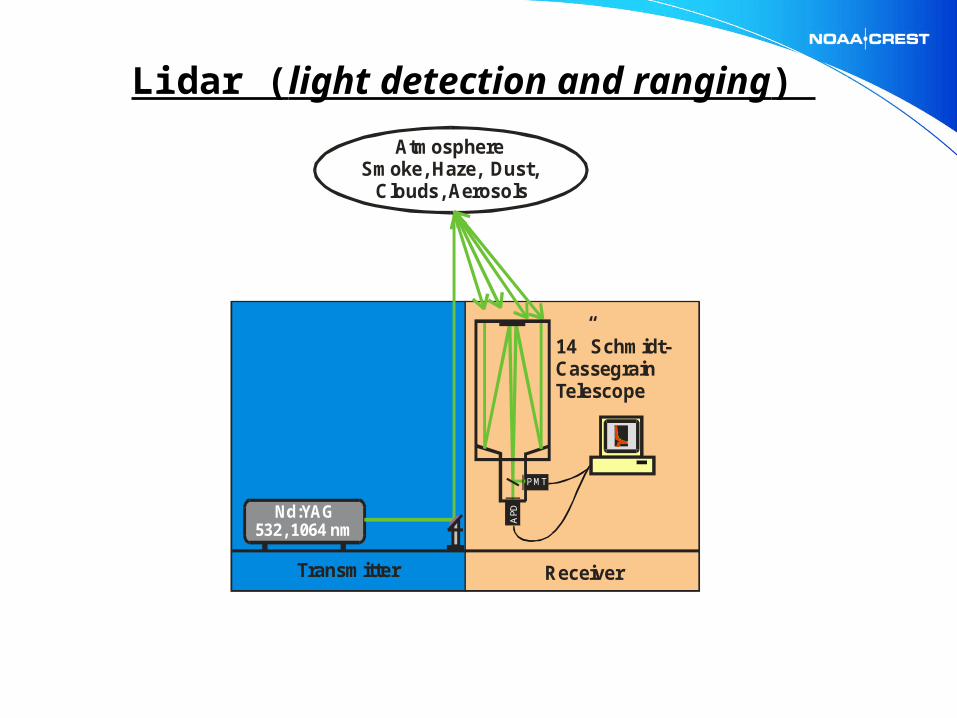
Lidar (light detection and ranging)
Nd:YAG532, 1064 nm
PMT
APD
AtmosphereSmoke, Haze, Dust, Clouds, Aerosols
14” Schmidt-Cassegrain Telescope
Transmitter Receiver

•Transport triggered by warm conveyor belts over eastern Asia [Eckhardt e. al., 2004].
•Strong winds, associated to frontal activity, provide a mechanism of injection of soil (sand) from the Gobi and Taklimakan deserts into troposphere [Merrill et al., 1989].
•Asian dust contributes 0.2-1.0 µg m-3 of the total PM2.5 mass concentration in North America, with higher frequency of transport during spring (March-May) [VanCuren and Cahill, 2002].
•Dust particles affect the concentration of gaseous pollutants and secondary aerosols components by acting as condensation surfaces and catalysts in heterogeneous reactions [Dentener et al., 1996; Wang et al., 2007].
Trans-Pacific transport of Asian Dust
Air Quality: Pollutant Transport to Maryland
• Difficult to apportion impact of long-range vs. local emissions. Determination of sources contributing to local pollution.
• Atmospheric and pollution dynamics aloft are missed by surface instruments. Insight to processes influencing the fate of pollutants in the atmosphere.
• Aloft transport is important during pollution events: pollutants aloft mix down increasing surface concentrations.
• Lidar allows real-time monitoring of the evolution of pollutants and their role during air quality events.
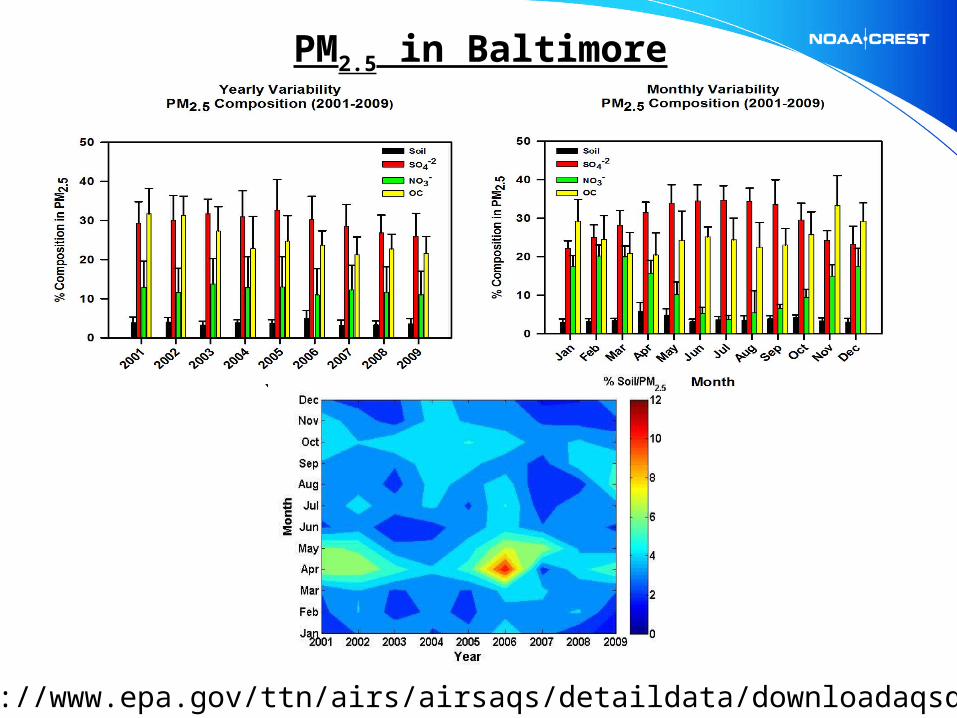
PM2.5 in Baltimore
http://www.epa.gov/ttn/airs/airsaqs/detaildata/downloadaqsdata.htm
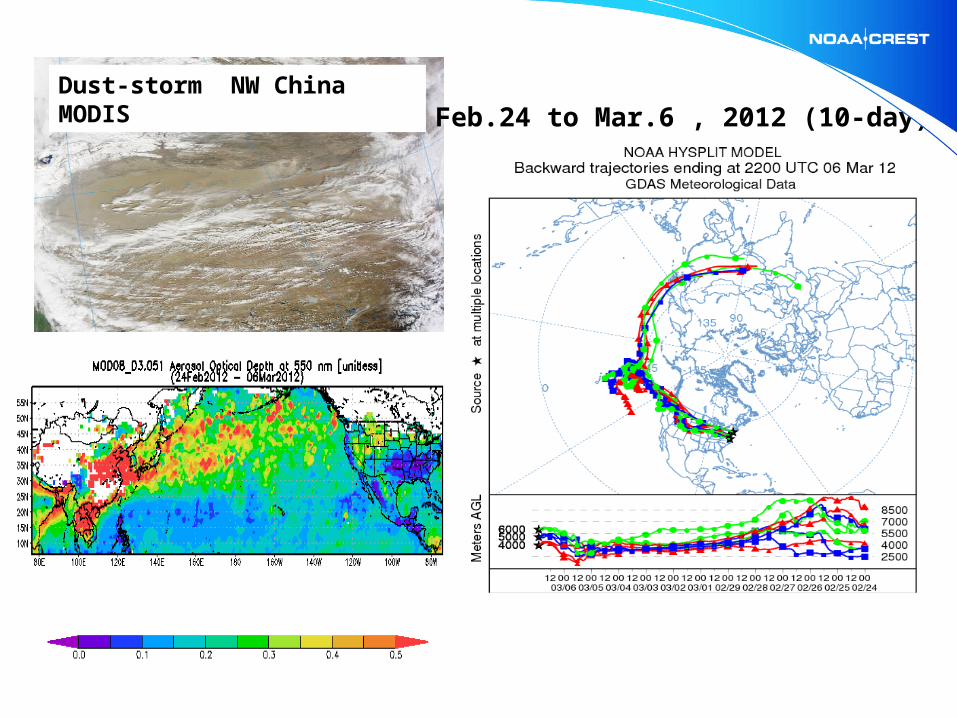
Dust-storm NW China MODISFeb.24 to Mar.6 , 2012 (10-day)

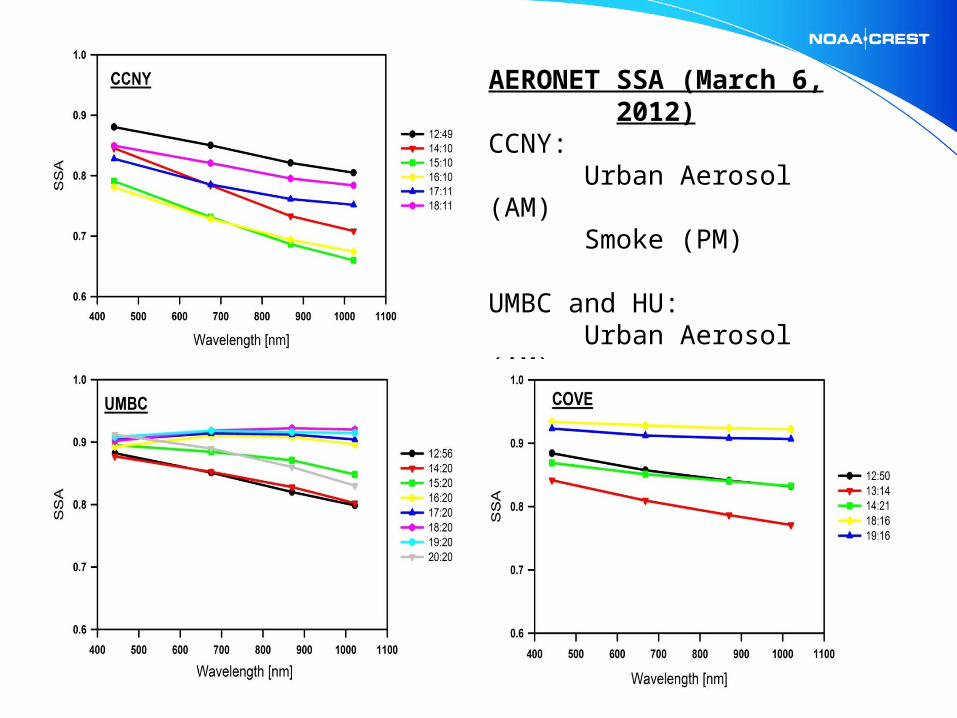
AERONET SSA (March 6, 2012)
CCNY:Urban Aerosol (AM)Smoke (PM)
UMBC and HU:Urban Aerosol (AM)Dust/Smoke (PM)

15:45 UTC
19:45 UTC
17:45 UTC
21:45 UTC
GOES-AOD: Spatial-temporal variation of AOD (AOD 0.1 – 0.4)


OMI Aerosol Index
*O. Torres NASA GSFC
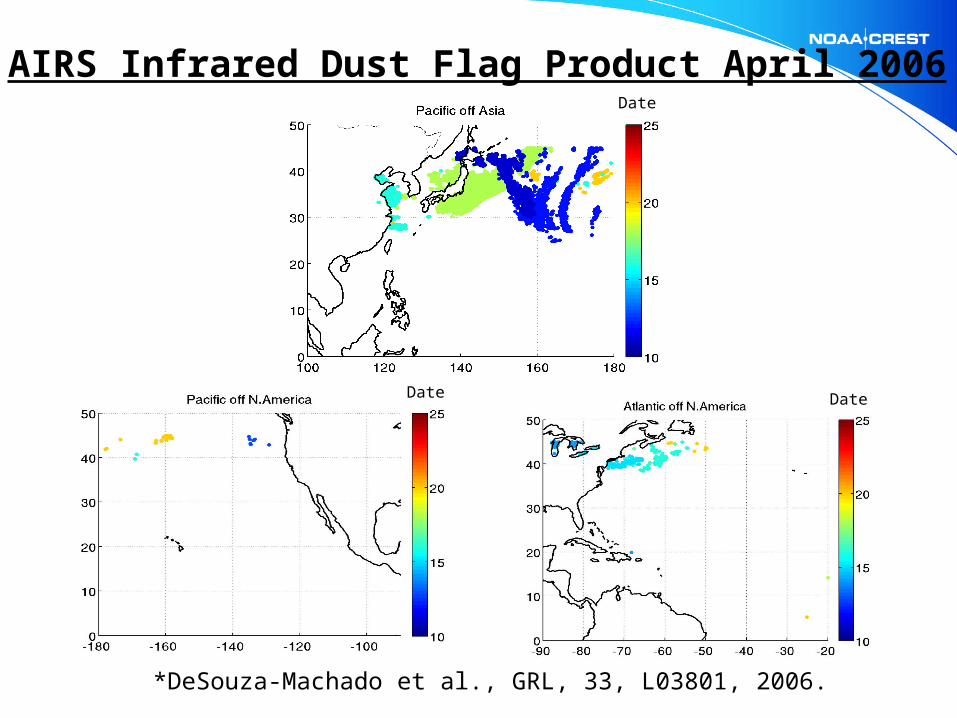
AIRS Infrared Dust Flag Product April 2006
*DeSouza-Machado et al., GRL, 33, L03801, 2006.
Date Date
Date


Angstrom ExponentSmall Exp.= Coarse/Large Particles
Single Scattering Albedo Positive Slope = dust

Baltimore Apr 17 Apr 20 Apr 23
PM2.55.10 4.83 9.37
PM1012.20 16.70 12.90
PM coarse 7.10 11.87 3.53
PM2.5 dust 0.97 1.81 0.53
Ca 0.06 0.14 0.03
IMPROVE Aerosol Monitoring Network
PM2.5 dust = 2.2[Al] + 2.49[Si] + 1.63[Ca] + 2.42 [Fe] + 1.94[Ti].Malm et al., J. Geophys. Res. 1994, 99, 1347–1370.
Ca: April 20, 2006
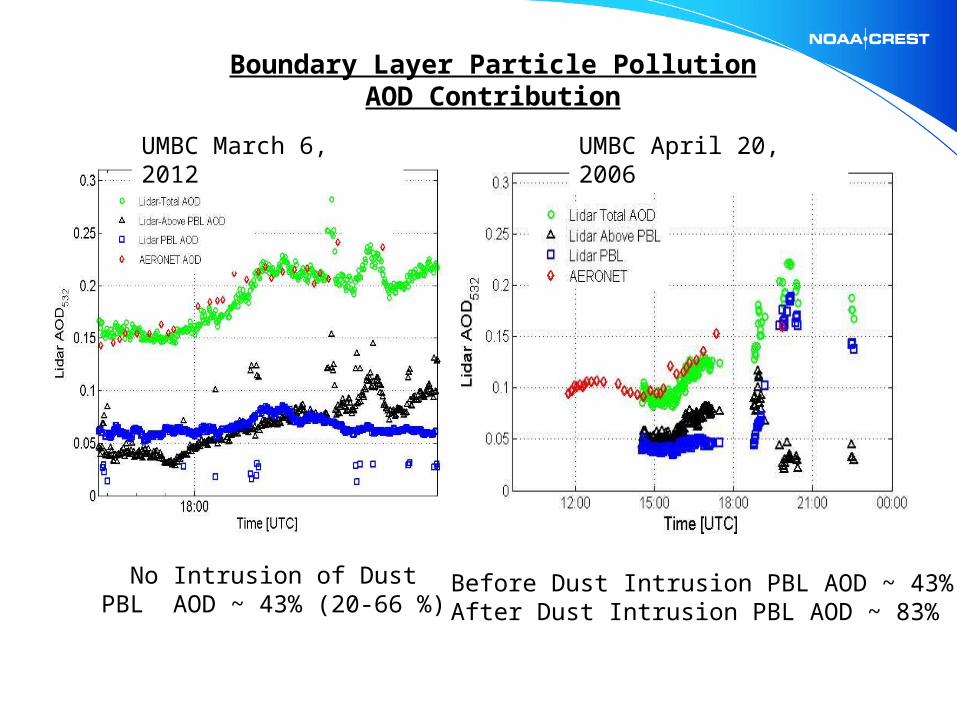
UMBC March 6, 2012 UMBC April 20, 2006
Boundary Layer Particle PollutionAOD Contribution
Before Dust Intrusion PBL AOD ~ 43%After Dust Intrusion PBL AOD ~ 83%
No Intrusion of DustPBL AOD ~ 43% (20-66 %)
Summary
•Vertical and temporal resolution of lidar aids to assess the impactof long range transport of natural and anthropogenic aerosols tolocal air quality.
•Lidar + real time ground monitoring of pollutants: characterization of temporal and spatial changes of particlepollution, oxidants, and precursors.
•Spring (March-May) Asian dust contribution ~17% (6-37%) of PM2.5 mass concentration in Baltimore.
•Dust contribution to column AOD ~ 47% (15-89%).

ACKNOWLEDGEMENTS
NOAA/Office of Education Educational Partnership Program
Maryland Department of the EnvironmentMaryland Energy Administration
Smog Blog: http://alg.umbc.edu/usaqUMAP: http://alg.umbc.edu/umap
*The statements contained within the manuscript are not the opinions of the funding agency or the U.S. government, but reflect the author’s
opinions.
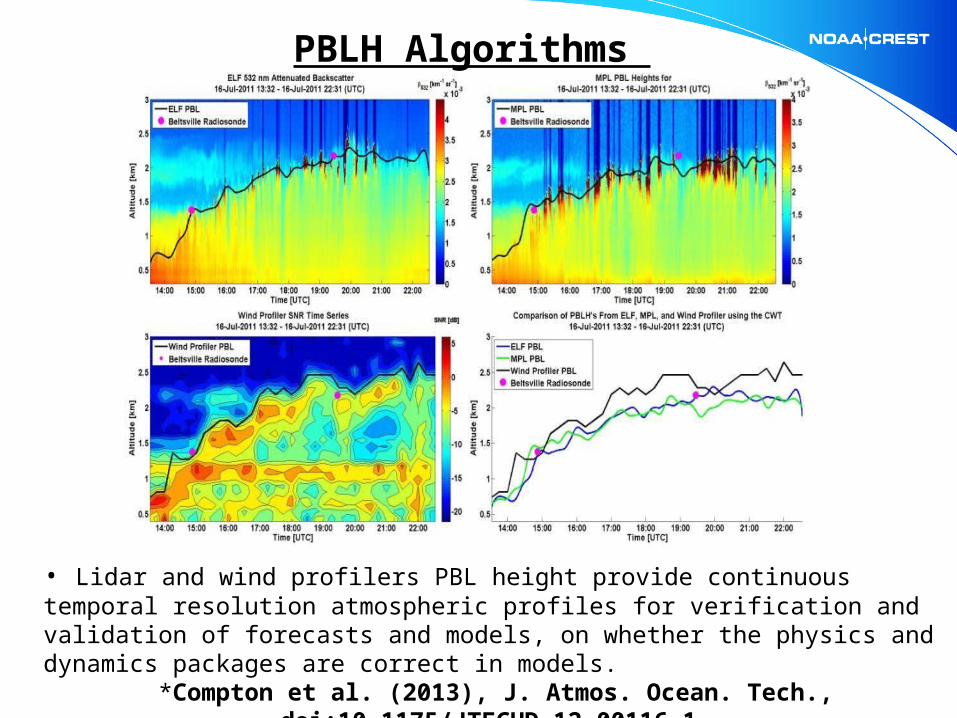
PBLH Algorithms
• Lidar and wind profilers PBL height provide continuous temporal resolution atmospheric profiles for verification and validation of forecasts and models, on whether the physics and dynamics packages are correct in models.
*Compton et al. (2013), J. Atmos. Ocean. Tech., doi:10.1175/JTECHD-12-00116.1

NASA-MODIS Apr. 9,2010
April 2010-Dust Taklimakan Desert
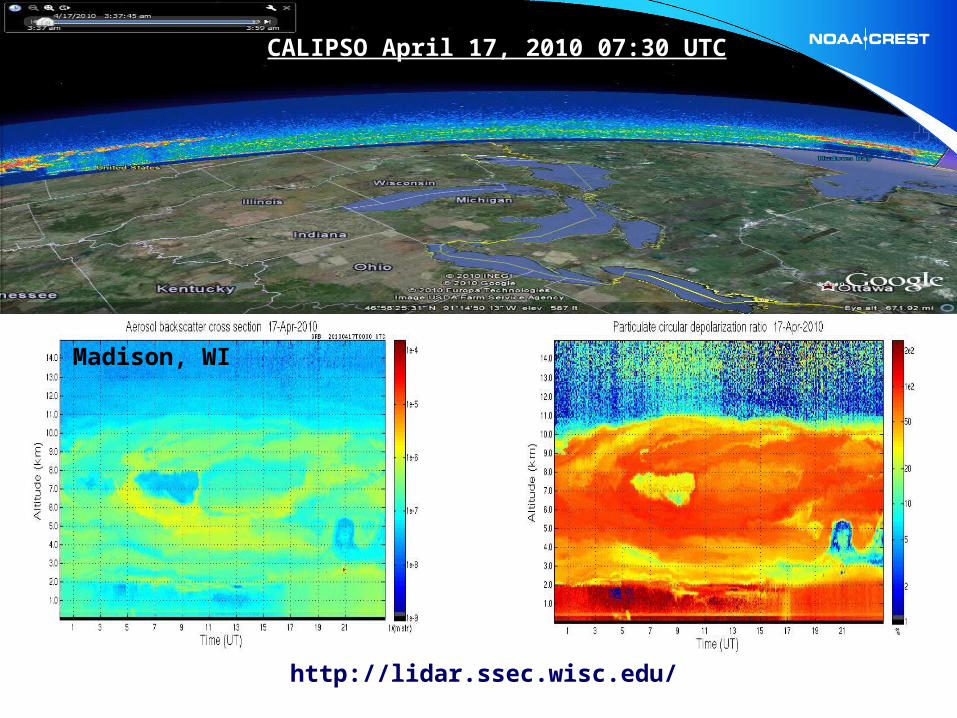
Madison, WI
http://lidar.ssec.wisc.edu/
CALIPSO April 17, 2010 07:30 UTC
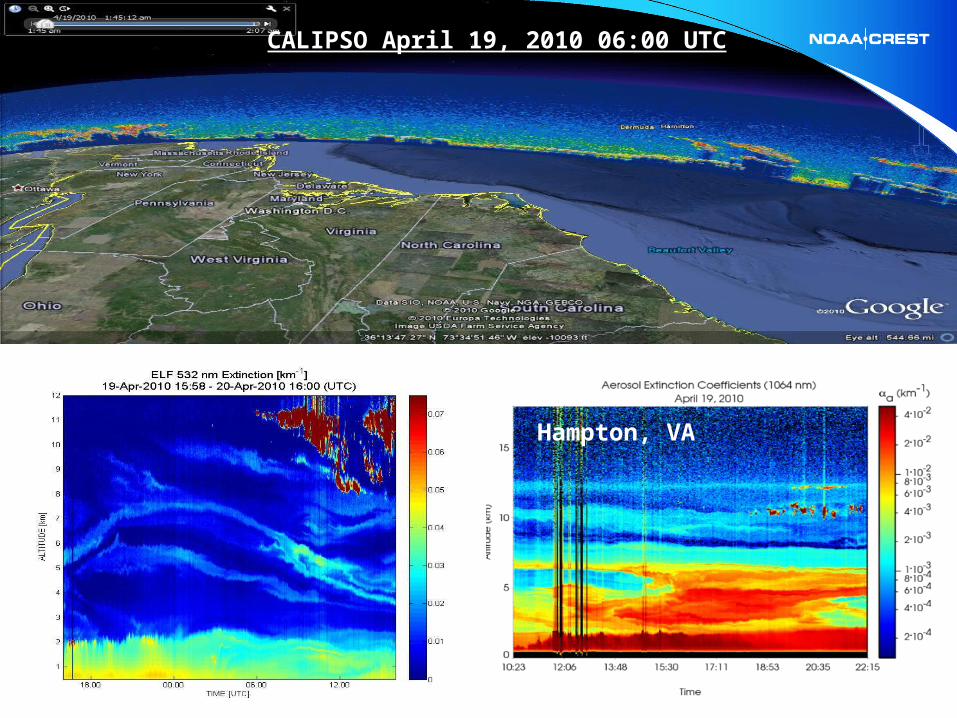
Hampton, VA
CALIPSO April 19, 2010 06:00 UTC
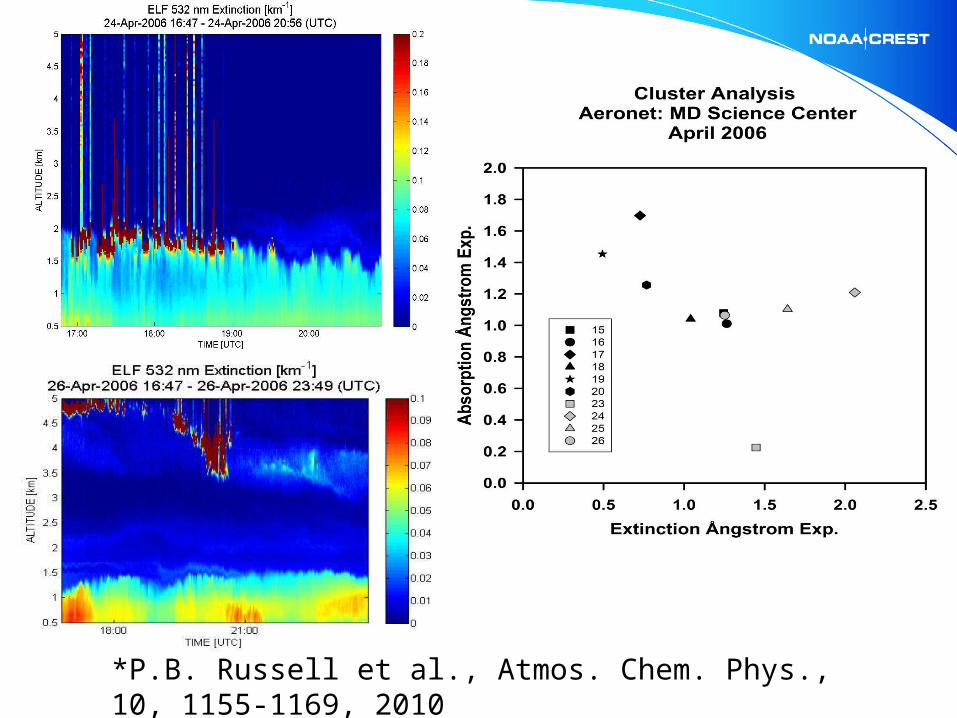
*P.B. Russell et al., Atmos. Chem. Phys., 10, 1155-1169, 2010