Transport equipment - ec.europa.eu
22
Transport equipment
Transcript of Transport equipment - ec.europa.eu

Transport equipment
12 Transport equipment
286 European business — Facts and figures
Th e manufacture of transport equipment is split into two NACE divisions, the fi rst of which cov-ers the manufacture of motor vehicles (NACE Division 34), while the other covers the manu-facture of other types of transport equipment, namely, shipbuilding, railway rolling stock, aero-space equipment, motorcycles and bicycles, and a residual category of other transport equipment (all included under NACE Division 35).
Th e transport equipment manufacturing sector is central to economic development, as it provides the means for transporting both individuals and goods. Demand for transport equipment has ris-en as the volume of goods transported and the distance travelled by passengers have expanded greatly – see Chapter 21 which provides informa-tion on transport fl ows.
Th e issue of sustainable development is likely to play an important role in future product devel-opments, as transport equipment manufacturers try to meet demands for more environmentally friendly transport solutions, for example, engines with lower fuel consumption or emissions.
Most transport equipment manufacturing ac-tivities are structured on the basis of complex pyramidal relationships between major manu-facturers and several tiers of component suppli-ers, ranging from systems suppliers down to very small, specialised manufacturers that may pro-vide a single component for a vehicle. It is com-mon to fi nd clusters of enterprises concentrated in regions around the leading producers.
Structural profi le
Th e EU-27’s transport equipment manufactur-ing sector (NACE Subsection DM) consisted of 45.7 thousand enterprises which employed 3.2 million persons in 2006. Paid employees domi-nated this workforce, accounting for 98.6 % of all persons employed: this proportion was above the non-fi nancial business economy average (86.5 %) as well as the industrial average (94.2 %) and in most of the subsectors the proportion reached 99.0 % or higher.
In terms of output, the EU-27’s transport equip-ment manufacturing sector was substantial, generating EUR 195.0 billion of value added in 2006, the fi ft h largest amount among the indus-trial sectors presented in Chapters 2 to 15 of this publication. Th e transport equipment manufac-turing sector accounted for 3.5 % of the value added created within the EU-27’s non-fi nancial business economy (NACE Sections C to I and K) and employed 2.4 % of the non-fi nancial business economy workforce.
Th e transport equipment manufacturing sector is dominated by the manufacture of motor vehi-cles, trailers and semi-trailers (NACE Division 34), as this activity represented 73.9 % of sectoral value added in 2006. Among the EU-27’s other transport equipment manufacturing (NACE Division 35) activities, the manufacture of aero-space equipment (NACE Group 35.3; Subchapter 12.4) was by far the largest activity in 2006, with a 15.4 % share of value added for the whole of
(1) Rounded estimates based on non-confi dential data.(2) Rounded estimates based on non-confi dential data; turnover and value added, 2005.
Source: Eurostat (SBS)
Table 12.1: Manufacture of transport equipment (NACE Subsection DM)Structural profi le, EU-27, 2006
(thousand)
(% of
total)
(EUR
million)
(% of
total)
(EUR
million)
(% of
total) (thousand)
(% of
total)
Transport equipment 45.7 100.0 945 417 100.0 194 970 100.0 3 151.8 100.0
Motor vehicles, trailers & semi-
trailers18.4 40.3 780 001 82.5 143 992 73.9 2 234.8 70.9
Ships & boats (1) 20.8 45.5 41 737 4.4 11 226 5.8 300.0 9.5
Railway equipment (1) 1.1 2.5 22 249 2.4 7 052 3.6 164.8 5.2
Aircraft & spacecraft 2.3 5.1 89 067 9.4 29 964 15.4 384.0 12.2
Miscellaneous transport
equipment (2)3.0 6.6 11 519 1.3 2 727 1.5 64.5 2.0
Persons employedEnterprises Turnover Value added
Transport equipment 12
287 European business — Facts and figures
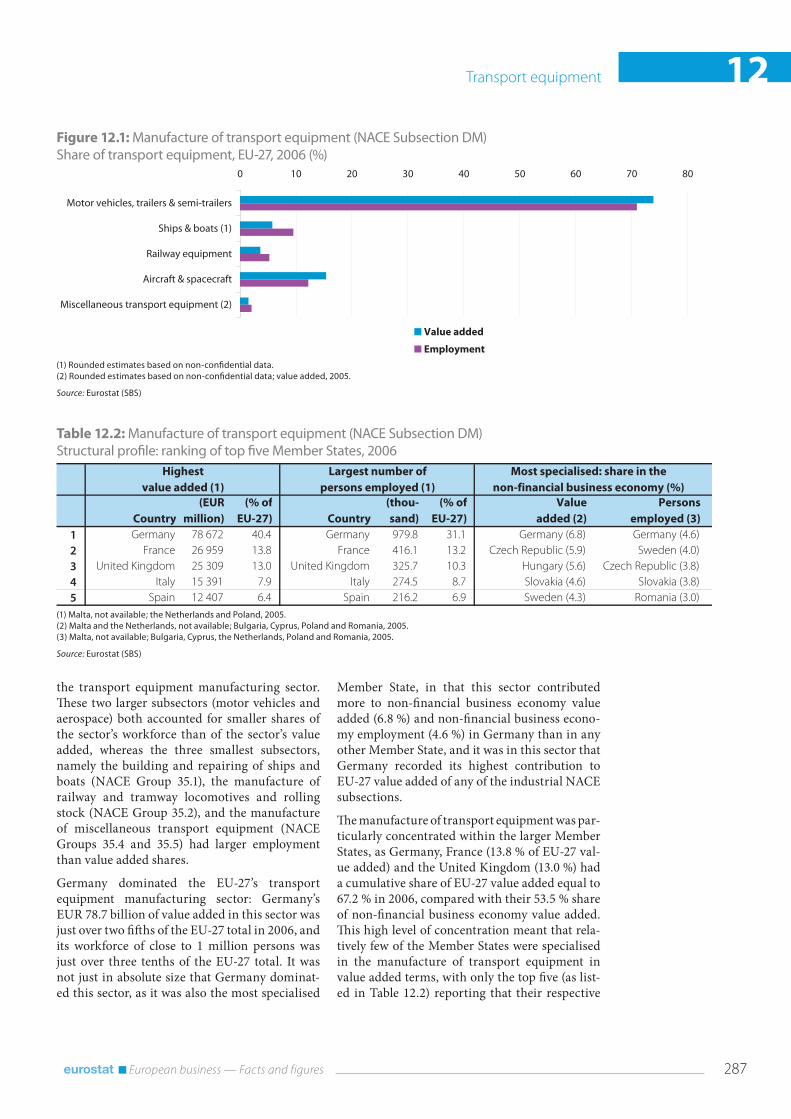
the transport equipment manufacturing sector. Th ese two larger subsectors (motor vehicles and aerospace) both accounted for smaller shares of the sector’s workforce than of the sector’s value added, whereas the three smallest subsectors, namely the building and repairing of ships and boats (NACE Group 35.1), the manufacture of railway and tramway locomotives and rolling stock (NACE Group 35.2), and the manufacture of miscellaneous transport equipment (NACE Groups 35.4 and 35.5) had larger employment than value added shares.
Germany dominated the EU-27’s transport equipment manufacturing sector: Germany’s EUR 78.7 billion of value added in this sector was just over two fi ft hs of the EU-27 total in 2006, and its workforce of close to 1 million persons was just over three tenths of the EU-27 total. It was not just in absolute size that Germany dominat-ed this sector, as it was also the most specialised
Member State, in that this sector contributed more to non-fi nancial business economy value added (6.8 %) and non-fi nancial business econo-my employment (4.6 %) in Germany than in any other Member State, and it was in this sector that Germany recorded its highest contribution to EU-27 value added of any of the industrial NACE subsections.
Th e manufacture of transport equipment was par-ticularly concentrated within the larger Member States, as Germany, France (13.8 % of EU-27 val-ue added) and the United Kingdom (13.0 %) had a cumulative share of EU-27 value added equal to 67.2 % in 2006, compared with their 53.5 % share of non-fi nancial business economy value added. Th is high level of concentration meant that rela-tively few of the Member States were specialised in the manufacture of transport equipment in value added terms, with only the top fi ve (as list-ed in Table 12.2) reporting that their respective
(1) Rounded estimates based on non-confi dential data.(2) Rounded estimates based on non-confi dential data; value added, 2005.
Source: Eurostat (SBS)
Figure 12.1: Manufacture of transport equipment (NACE Subsection DM)Share of transport equipment, EU-27, 2006 (%)
0 10 20 30 40 50 60 70 80
Motor vehicles, trailers & semi-trailers
Ships & boats (1)
Railway equipment
Aircraft & spacecraft
Miscellaneous transport equipment (2)
Value added
Employment
(1) Malta, not available; the Netherlands and Poland, 2005.(2) Malta and the Netherlands, not available; Bulgaria, Cyprus, Poland and Romania, 2005.(3) Malta, not available; Bulgaria, Cyprus, the Netherlands, Poland and Romania, 2005.
Source: Eurostat (SBS)
Table 12.2: Manufacture of transport equipment (NACE Subsection DM)Structural profi le: ranking of top fi ve Member States, 2006
Country
(EUR
million)
(% of
EU-27) Country
(thou-
sand)
(% of
EU-27)
Value
added (2)
Persons
employed (3)
1 Germany 78 672 40.4 Germany 979.8 31.1 Germany (6.8) Germany (4.6)
2 France 26 959 13.8 France 416.1 13.2 Czech Republic (5.9) Sweden (4.0)
3 United Kingdom 25 309 13.0 United Kingdom 325.7 10.3 Hungary (5.6) Czech Republic (3.8)
4 Italy 15 391 7.9 Italy 274.5 8.7 Slovakia (4.6) Slovakia (3.8)
5 Spain 12 407 6.4 Spain 216.2 6.9 Sweden (4.3) Romania (3.0)
Most specialised: share in the
non-financial business economy (%)
Highest
value added (1)
Largest number of
persons employed (1)

12 Transport equipment
288 European business — Facts and figures
Source: Eurostat (SBS)
Map 12.1: Manufacture of transport equipment (NACE Subsection DM)Persons employed in the manufacture of transport equipment as a proportion of those employed in the non-fi nancial business economy (NACE Sections C to I and K)
0 600 km
Persons employed in the manufactureof transport equipment(NACE Subsection DM)
as a proportion of those employedin the non-financial business economy
(NACE Sections C to I and K),by NUTS 2 regions, 2006
Cartography: Eurostat — GISCO, 04/2009© EuroGeographics Association, for the administrative boundariesSource: Eurostat (SBS)
<= 1
> 1 and <= 2
> 2 and <= 3.5
> 3.5
Data not available
(%)
BG, DK, SI: national level instead of NUTS 2BG: construction (45) 2005CY: excluding research and development (73)
Guadeloupe (FR)
0 25
Martinique (FR)
0 20
Guyane (FR)
0 100
Réunion (FR)
0 20
Açores (PT)
0 100
Madeira (PT)
0 20
Canarias (ES)
0 100
Malta
0 10
0 100
Ísland
Transport equipment 12
289 European business — Facts and figures
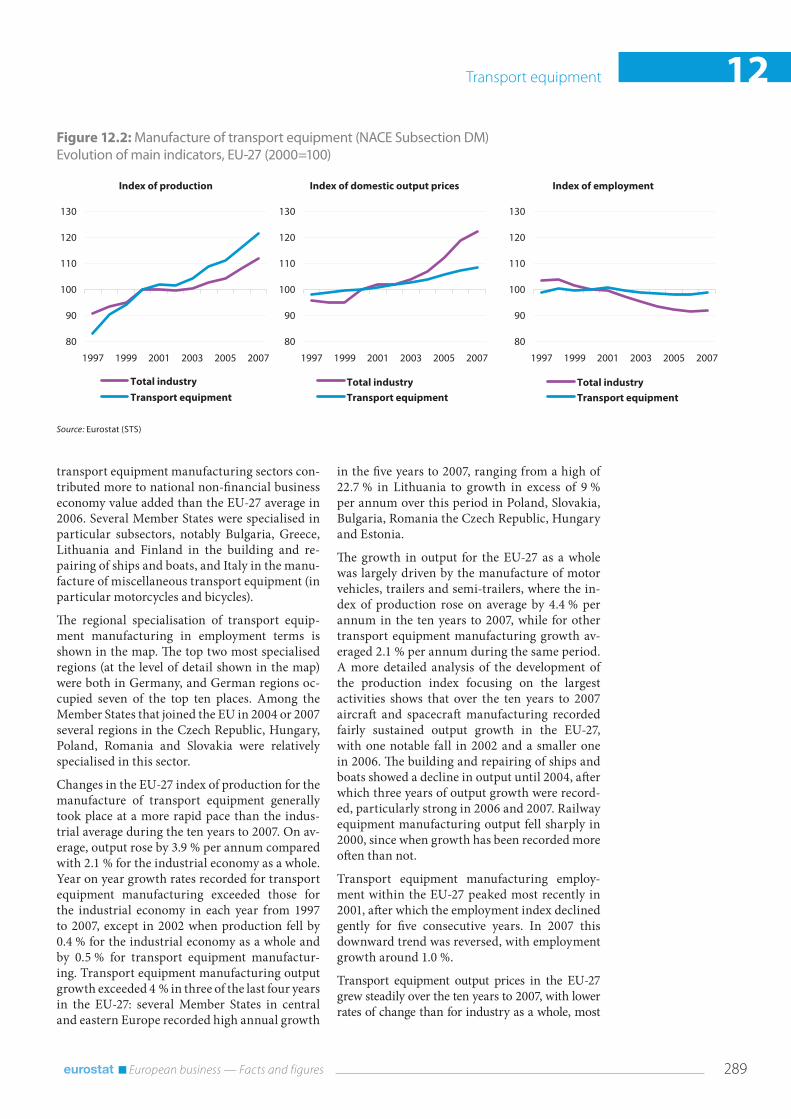
in the fi ve years to 2007, ranging from a high of 22.7 % in Lithuania to growth in excess of 9 % per annum over this period in Poland, Slovakia, Bulgaria, Romania the Czech Republic, Hungary and Estonia.
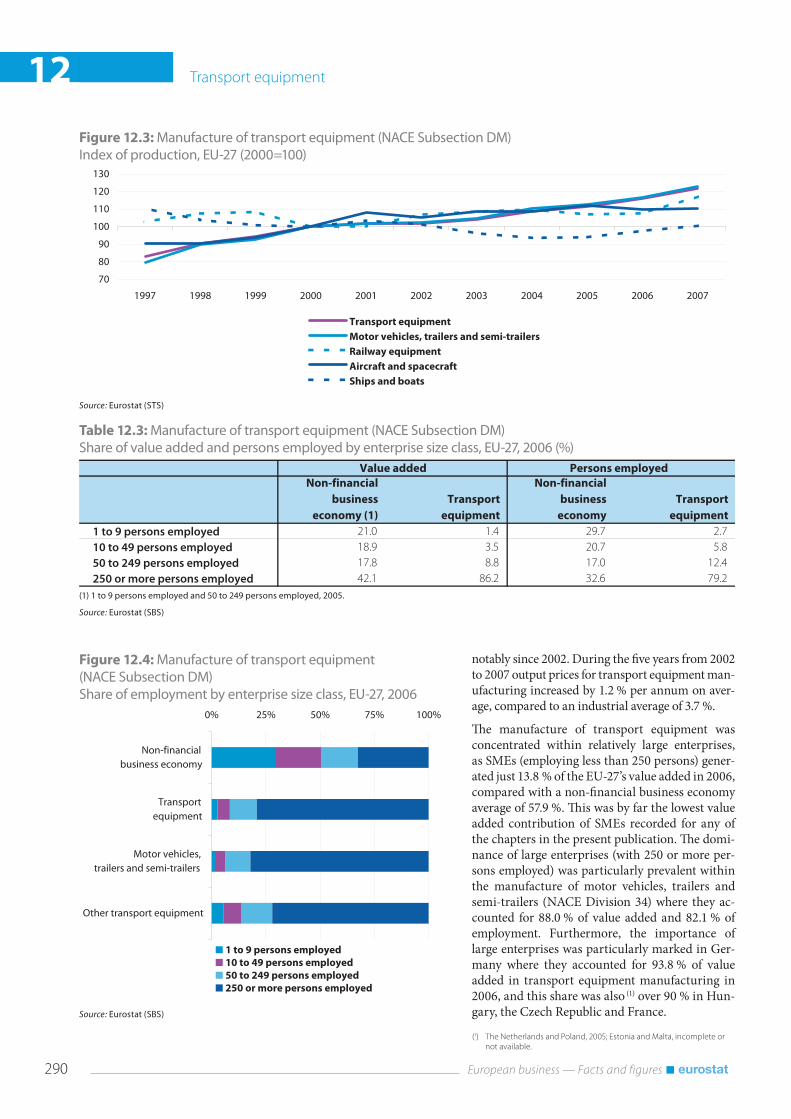
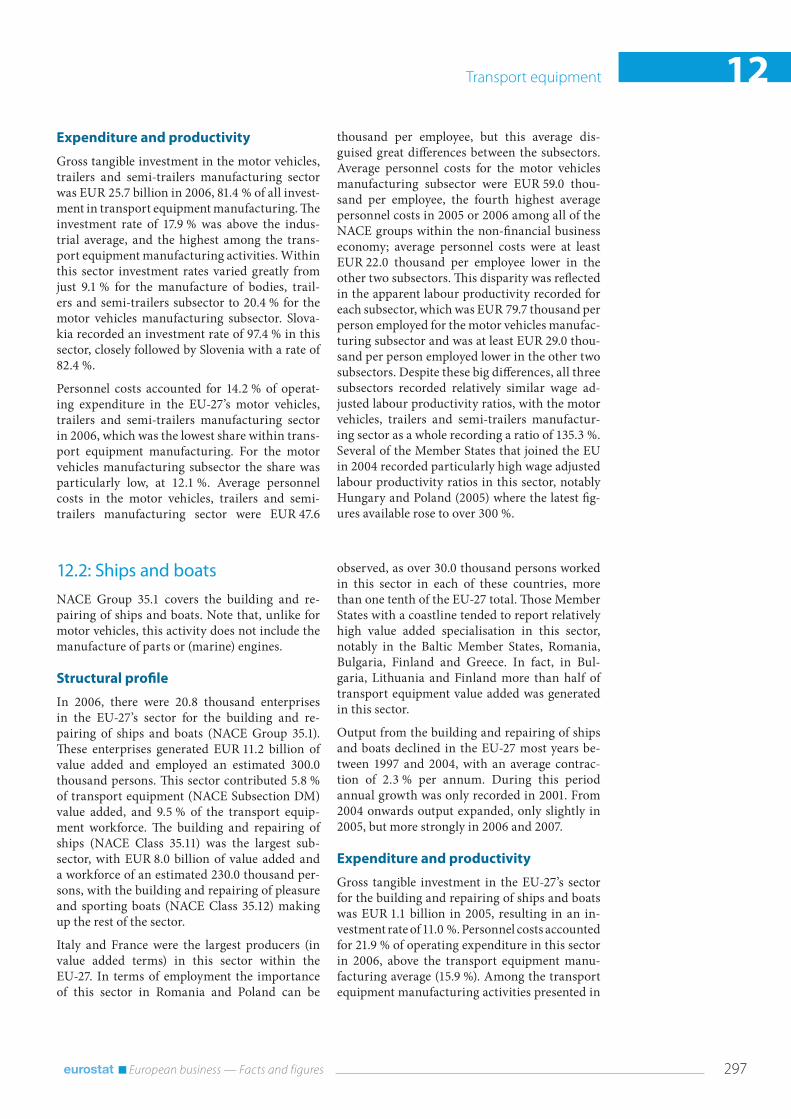
Th e growth in output for the EU-27 as a whole was largely driven by the manufacture of motor vehicles, trailers and semi-trailers, where the in-dex of production rose on average by 4.4 % per annum in the ten years to 2007, while for other transport equipment manufacturing growth av-eraged 2.1 % per annum during the same period. A more detailed analysis of the development of the production index focusing on the largest activities shows that over the ten years to 2007 aircraft and spacecraft manufacturing recorded fairly sustained output growth in the EU-27, with one notable fall in 2002 and a smaller one in 2006. Th e building and repairing of ships and boats showed a decline in output until 2004, aft er which three years of output growth were record-ed, particularly strong in 2006 and 2007. Railway equipment manufacturing output fell sharply in 2000, since when growth has been recorded more oft en than not.
Transport equipment manufacturing employ-ment within the EU-27 peaked most recently in 2001, aft er which the employment index declined gently for fi ve consecutive years. In 2007 this downward trend was reversed, with employment growth around 1.0 %.
Transport equipment output prices in the EU-27 grew steadily over the ten years to 2007, with lower rates of change than for industry as a whole, most
transport equipment manufacturing sectors con-tributed more to national non-fi nancial business economy value added than the EU-27 average in 2006. Several Member States were specialised in particular subsectors, notably Bulgaria, Greece, Lithuania and Finland in the building and re-pairing of ships and boats, and Italy in the manu-facture of miscellaneous transport equipment (in particular motorcycles and bicycles).
Th e regional specialisation of transport equip-ment manufacturing in employment terms is shown in the map. Th e top two most specialised regions (at the level of detail shown in the map) were both in Germany, and German regions oc-cupied seven of the top ten places. Among the Member States that joined the EU in 2004 or 2007 several regions in the Czech Republic, Hungary, Poland, Romania and Slovakia were relatively specialised in this sector.
Changes in the EU-27 index of production for the manufacture of transport equipment generally took place at a more rapid pace than the indus-trial average during the ten years to 2007. On av-erage, output rose by 3.9 % per annum compared with 2.1 % for the industrial economy as a whole. Year on year growth rates recorded for transport equipment manufacturing exceeded those for the industrial economy in each year from 1997 to 2007, except in 2002 when production fell by 0.4 % for the industrial economy as a whole and by 0.5 % for transport equipment manufactur-ing. Transport equipment manufacturing output growth exceeded 4 % in three of the last four years in the EU-27: several Member States in central and eastern Europe recorded high annual growth
Source: Eurostat (STS)
Figure 12.2: Manufacture of transport equipment (NACE Subsection DM)Evolution of main indicators, EU-27 (2000=100)
80
90
100
110
120
130
200720052003200119991997
Total industry
Transport equipment
80
90
100
110
120
130
200720052003200119991997
Total industry
Transport equipment
80
90
100
110
120
130
200720052003200119991997
Total industry
Transport equipment
Index of production Index of domestic output prices Index of employment
12 Transport equipment
290 European business — Facts and figures
notably since 2002. During the fi ve years from 2002 to 2007 output prices for transport equipment man-ufacturing increased by 1.2 % per annum on aver-age, compared to an industrial average of 3.7 %.
Th e manufacture of transport equipment was concentrated within relatively large enterprises, as SMEs (employing less than 250 persons) gener-ated just 13.8 % of the EU-27’s value added in 2006, compared with a non-fi nancial business economy average of 57.9 %. Th is was by far the lowest value added contribution of SMEs recorded for any of the chapters in the present publication. Th e domi-nance of large enterprises (with 250 or more per-sons employed) was particularly prevalent within the manufacture of motor vehicles, trailers and semi-trailers (NACE Division 34) where they ac-counted for 88.0 % of value added and 82.1 % of employment. Furthermore, the importance of large enterprises was particularly marked in Ger-many where they accounted for 93.8 % of value added in transport equipment manufacturing in 2006, and this share was also (1) over 90 % in Hun-gary, the Czech Republic and France.
Source: Eurostat (STS)
Figure 12.3: Manufacture of transport equipment (NACE Subsection DM)Index of production, EU-27 (2000=100)
70
80
90
100
110
120
130
20072006200520042003200220012000199919981997
Transport equipment
Motor vehicles, trailers and semi-trailers
Railway equipment
Aircraft and spacecraft
Ships and boats
(1) 1 to 9 persons employed and 50 to 249 persons employed, 2005.
Source: Eurostat (SBS)
Table 12.3: Manufacture of transport equipment (NACE Subsection DM)Share of value added and persons employed by enterprise size class, EU-27, 2006 (%)
Non-financial
business
economy (1)
Transport
equipment
Non-financial
business
economy
Transport
equipment
1 to 9 persons employed 21.0 1.4 29.7 2.7
10 to 49 persons employed 18.9 3.5 20.7 5.8
50 to 249 persons employed 17.8 8.8 17.0 12.4
250 or more persons employed 42.1 86.2 32.6 79.2
Persons employedValue added
Source: Eurostat (SBS)
Figure 12.4: Manufacture of transport equipment (NACE Subsection DM)Share of employment by enterprise size class, EU-27, 2006
0% 25% 50% 75% 100%
Non-financial business economy
Transport equipment
Motor vehicles, trailers and semi-trailers
Other transport equipment
1 to 9 persons employed
10 to 49 persons employed
50 to 249 persons employed
250 or more persons employed
(1) The Netherlands and Poland, 2005; Estonia and Malta, incomplete or
not available.

Transport equipment 12
291 European business — Facts and figures
In terms of the age profi le of the EU-27’s transport equipment manufacturing workforce there was little diff erence compared with the non-fi nancial business economy average when analysed accord-ing to the three age classes presented. Comparing the age structure of the two NACE divisions in this sector, the most notable diff erence was the proportion of the workforce that was aged 50 or over, which was 20.4 % in the manufacture of mo-tor vehicles, trailers and semi-trailers, compared with 25.9 % for the manufacture of other trans-port equipment. Among the Member States the age profi le of the transport equipment manufac-turing workforces in Poland and Slovakia stood out, with more than one third of the workers aged less than 30.
Employment characteristics
Th e most notable characteristics of the transport equipment manufacturing workforce are the high proportions of men in the workforce and the very high propensity to employ on a full-time basis. Men accounted for 81.5 % of the EU-27’s trans-port equipment manufacturing workforce in 2007, compared with a non-fi nancial business economy average of 64.9 %. Th e proportion of the workforce that was male was above the non-fi nancial busi-ness economy average for both the manufacture of motor vehicles, trailers and semi-trailers (79.4 %) and in particular the manufacture of other trans-port equipment (86.4 %). As many as 96.3 % of the EU-27’s transport equipment manufacturing workforce worked on a full-time basis in 2007.
Source: Eurostat (LFS)
Figure 12.5: Manufacture of transport equipment (NACE Subsection DM)Employment characteristics, 2007
0%
25%
50%
75%
100%
Non-financialbusinesseconomy
Transportequipment
Male
Female
0%
25%
50%
75%
100%
Non-financialbusinesseconomy
Transportequipment
Full-time
Part-time
0%
25%
50%
75%
100%
Non-financialbusinesseconomy
Transportequipment
50+30 to 4915 to 29
By gender By working time By age
Expenditure, productivity and
profi tability
In 2006, the transport equipment manufacturing sector recorded a level of gross tangible investment of EUR 31.6 billion, some 3.0 % of the total within the EU-27’s non-fi nancial business economy. In-vestment in this sector was equivalent to 16.2 % of value added, 2.2 percentage points below the aver-age investment rate for the EU-27’s non-fi nancial business economy, and fractionally below the industrial average (16.6 %). Th e investment rate was slightly higher for the manufacture of motor vehicles, trailers and semi-trailers subsector, and lower in all of the other subsectors. Slovakia and Slovenia recorded the highest investment rates in this sector in 2006, 93.5 % and 70.3 % respectively. In several Member States tangible investment in transport equipment manufacturing reached 5 % of all tangible investment in the non-fi nancial business economy, most notably in Slovakia, the Czech Republic, Hungary and Germany.
An analysis of operating expenditure shows that the transport equipment manufacturing sector in the EU-27 did not diff er greatly from the non-fi nan-cial business economy average: 15.9 % of operat-ing expenditure was devoted to personnel costs in this sector, compared with a non-fi nancial business economy average of 16.1 %. However, this share was lower in the largest subsector, the manufacture of motor vehicles, trailers and semi-trailers, where the share was 14.2 %, while it was notably higher for the manufacture of aerospace equipment (26.3 %) and the manufacture of railway and tramway locomo-tives and rolling stock (24.2 %).
In terms of average personnel costs, productivity and profi tability the EU-27’s transport equipment sector diverged signifi cantly from the industrial and non-fi nancial business economy averages. Average personnel costs were EUR 46.4 thou-sand per employee, some EUR 17.6 thousand per employee higher than the non-fi nancial business

12 Transport equipment
292 European business — Facts and figures
Th e relatively high apparent labour productiv-ity combined with the particularly high average personnel costs, resulted in a wage adjusted la-bour productivity ratio of 133.3 % for the EU-27’s transport equipment manufacturing sector in 2006, well below the 151.1 % average ratio record-ed for the non-fi nancial business economy. None of the transport equipment subsectors recorded high wage adjusted labour productivity ratios, the highest being 137.7 % for the manufacture of miscellaneous transport equipment, while the lowest was 124.1 % for the building and repairing of ships and boats. Among the Member States, the only Member State to record a wage adjusted labour productivity ratio below parity (100 %) was Ireland, which in fact recorded a negative ratio due to negative value added in this sector. Hungary and Poland (2005) recorded by far the highest wage adjusted labour productivity ratios in this sector, and in both cases these were well above the average ratios for their non-fi nancial business economies, as was also the case in the Czech Republic, Slovenia and Austria.
Th e gross operating rate for the EU-27’s transport equipment manufacturing sector was also low (5.4 %), half the non-fi nancial business economy average (10.8 %), as high average personnel costs kept the gross operating surplus low. Th is was the lowest gross operating rate of any industrial NACE subsection. In none of the EU-27’s trans-port equipment manufacturing subsectors did the gross operating rate exceed the non-fi nancial business economy average in 2006, the highest being 8.4 % for the manufacture of railway and tramway locomotives and rolling stock.
economy average. Most of the subsectors, howev-er, recorded much lower average personnel costs, just over EUR 30.0 thousand per employee, and therefore below the industrial average; the high transport equipment manufacturing average re-sulted from higher average personnel costs in the two largest subsectors, notably the manufacture of aerospace equipment. A similar pattern could be observed for apparent labour productivity, with the smaller subsectors recording averages below the industrial average, and the two larger subsectors, led by the manufacture of aerospace equipment, recording higher averages. As a result, the transport equipment manufacturing sector recorded apparent labour productivity above the industrial average, reaching EUR 61.9 thousand per person employed.
(1) 2005.
Source: Eurostat (SBS)
Figure 12.6: Manufacture of transport equipment (NACE Subsection DM)Investment rate, EU-27, 2006
0 5 10 15 20
Motor vehicles, trailers & semi-trailers
Ships & boats (1)
Railway equipment
Aircraft & spacecraft
Miscellaneous transport equipment (1)
(1) Investment in tangible goods, 2005.(2) Rounded estimates based on non-confi dential data.(3) Investment in tangible goods, apparent labour productivity, wage adjusted labour productivity and gross operating rate, 2005.
Source: Eurostat (SBS)
Table 12.4: Manufacture of transport equipment (NACE Subsection DM)Expenditure, productivity and profi tability, EU-27, 2006
Personnel
costs
Purchases
of goods
& services
Invest-
ment in
tangible
goods
Apparent
labour
produc-
tivity
Average
personnel
costs
Wage
adjusted
labour
produc-
tivity
Gross
operating
rate
Transport equipment 144 181 760 190 31 589 61.9 46.4 133.3 5.4
Motor vehicles, trailers
& semi-trailers105 316 638 400 25 715 64.4 47.6 135.3 5.0
Ships & boats (1) 9 049 32 214 1 100 37.4 30.2 124.1 5.2
Railway equipment 5 194 16 264 462 42.8 31.8 134.4 8.4
Aircraft & spacecraft (2) 22 692 63 649 3 748 78.0 59.4 131.4 8.2
Miscellaneous transport
equipment (3)1 930 9 600 309 41.4 31.4 137.7 7.2
(%)
(EUR thousand
per person)(EUR million)

Transport equipment 12
293 European business — Facts and figures
billion, and imports at EUR 110.2 billion, 16.4 % and 8.3 % respectively of industrial trade. Over two thirds (67.8 %) of exports were accounted for by motor vehicles, trailers and semi-trailers (CPA Division 34), while in contrast, only just over half (54.2 %) of the imports were accounted for by the same products. Th ese diff erences in the respec-tive shares of transport equipment exports and imports were refl ected in the EU-27’s trade sur-plus for motor vehicles, trailers and semi-trailers (EUR 70.1 billion). Trade in aircraft and space-craft (CPA Group 35.3) dominated other trans-port equipment, with exports of EUR 41.5 billion in 2007 generating a trade surplus of EUR 11.2 billion. Trade surpluses just over EUR 2 billion were recorded for ships and boats as well as for railway and tramway locomotives and rolling-stock (CPA Groups 35.1 and 35.2), while a defi cit of EUR 4.5 billion was recorded for motorcycles and bicycles (CPA Group 35.4). In 2007 the Unit-ed States retained its position as the most impor-tant market for EU-27 exports of transport equip-ment, although its share declined.
External trade
Just over two thirds (68.5 %) of exports of transport equipment (CPA Subsection DM) by the EU-27 Member States were destined for other Member States, in other words intra-EU trade. Th is share was slightly higher than the average for all indus-trial products (CPA Sections C to E). Germany was by far the largest EU exporter of transport equip-ment in 2007, with exports to the rest of the world valued at EUR 208.0 billion, some 34.2 % of the to-tal for all Member States. France (13.5 %) was the only other Member State to report a double-digit share of exports among the EU-27 Member States. Th e largest shares of industrial exports accounted for by transport equipment were 27.4 % in Spain and 26.0 % in Slovakia.
Th e EU-27 ran a signifi cant trade surplus with non-member countries for transport equipment which was valued at EUR 81.2 billion in 2007, the second highest surplus among the industrial chapters (Chapters 2 to 14) in this publication. Exports from the EU-27 were valued at EUR 191.4
Source: Eurostat (Comext)
Table 12.5: Transport equipment (CPA Subsection DM)External trade, EU-27, 2007
Extra-EU
exports
Extra-EU
imports
Trade
balance
Transport equipment 191 379 110 212 81 167 16.4 8.3
Motor vehicles, trailers & semi-trailers 129 804 59 733 70 071 11.2 4.5
Ships & boats 14 991 12 778 2 213 1.3 1.0
Railway equipment 3 158 983 2 175 0.3 0.1
Aircraft & spacecraft 41 450 30 267 11 183 3.6 2.3
Miscellaneous transport equipment 1 976 6 452 -4 476 0.2 0.5
Value (EUR million) Share of
industrial
exports (%)
Share of
industrial
imports (%)
Source: Eurostat (Comext)
Figure 12.7: Transport equipment (CPA Subsection DM)Main trading partners, EU-27, 2007 (% share of exports/imports in value terms)
United States26.6%
Rest of the world50.7% Russian
Federation6.7%
China6.6%
Turkey5.2%Switzerland
4.2%
EU-27 exports
United States30.0%
Japan19.7%
Rest of the world24.6%
South Korea10.8%
Turkey9.8%
China5.1%
EU-27 imports
12 Transport equipment
294 European business — Facts and figures
on the type-approval of hydrogen-powered mo-tor vehicles, aiming to simplify the marketing of clean and safe hydrogen vehicles.
Th e motor vehicles, trailers and semi-trailers manufacturing sector is characterised by a struc-ture that is dominated by enterprises belonging to a few very large enterprise groups. Th ese are sup-ported by partners and contractors who deliver systems, parts and accessories. Demand for vehi-cle parts and accessories is divided between that for original equipment (OE) which is supplied directly to motor vehicle manufacturers, and that for the aft er-market (AM) as used for the upkeep, repair and modifi cation of vehicles. Larger vehi-cle parts suppliers tend to cluster around their major customers.
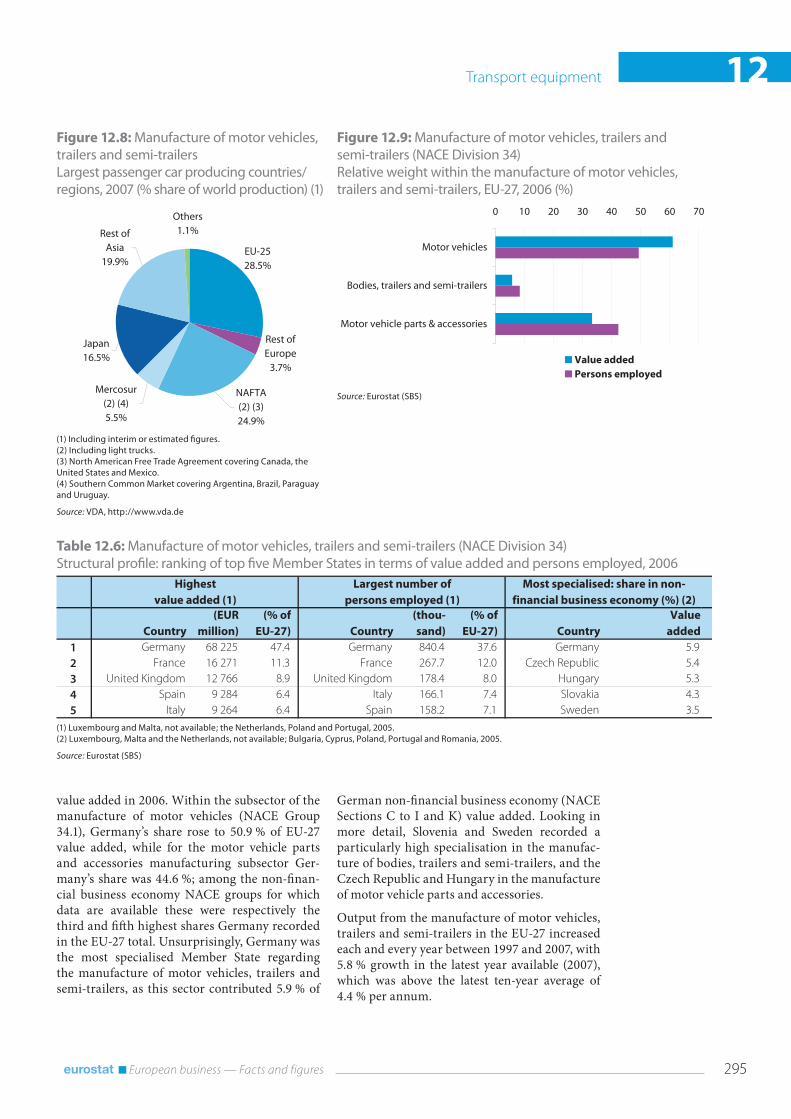
According to VDA (6), the EU-25 produced 28.5 % of the world’s passenger cars in 2007 a slightly larger share than the three NAFTA (7) countries (24.9 %), but less than the Asian total of 36.4 %. For information on the retail sale (rather than production) of motor vehicles please refer to Chapter 17.
Structural profi le
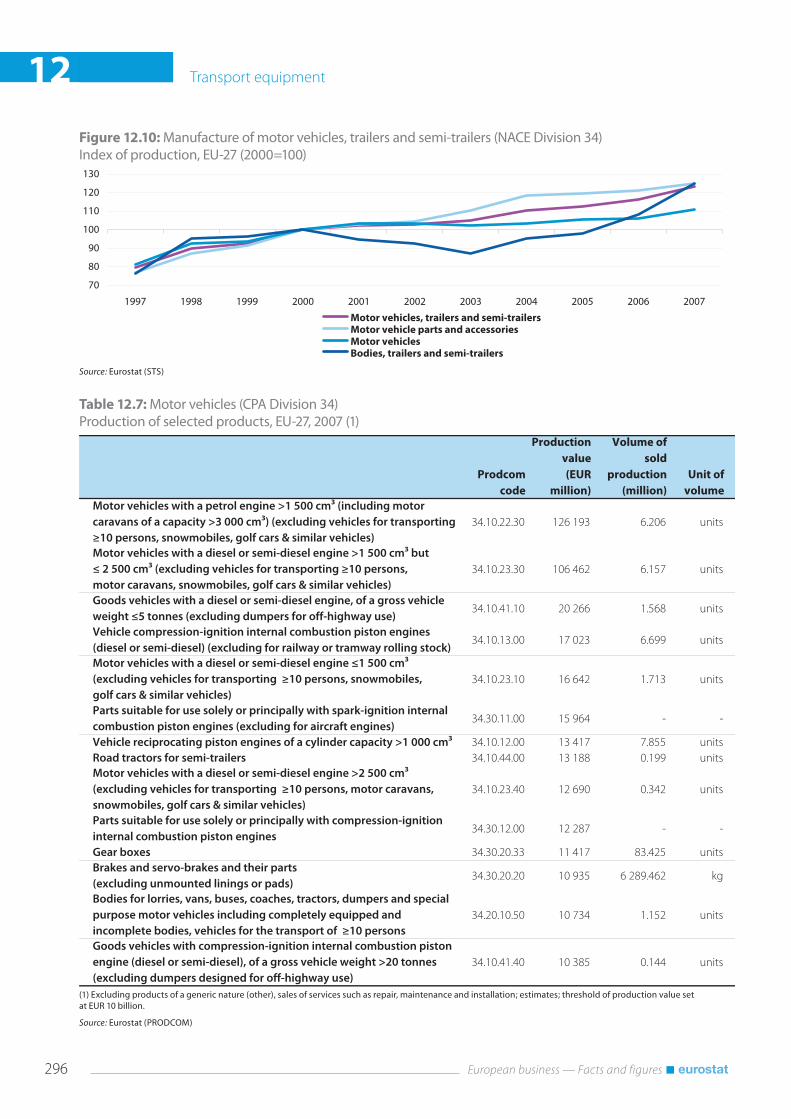
Th e EU-27’s motor vehicles, trailers and semi-trailers (NACE Division 34) sector consisted of 18.4 thousand enterprises which generated EUR 144.0 billion of value added in 2006, which equated to 73.9 % of the transport equipment manufacturing (NACE Subsection DM) total. Its share of the transport equipment manufacturing workforce was less, at 70.9 %, implying a higher than average apparent labour productivity. With-in this sector, the motor vehicles manufacturing subsector (NACE Group 34.1) generated 61.0 % of EU-27 sectoral value added, motor vehicle parts and accessories manufacturing (NACE Group 34.3) a further 33.3 %, and the manufacture of bodies, trailers and semi-trailers (NACE Group 34.2) the remaining 5.7 %; in employment terms the share of motor vehicles manufacturing was considerably lower and that of the other two sub-sectors higher.
As already noted, Germany dominated trans-port equipment manufacturing in general, and this was particularly true for the manufacture of motor vehicles, trailers and semi-trailers where it generated close to half (47.4 %) of the EU-27’s
12.1: Motor vehicles, trailers and semi-trailersNACE Division 34 covers the manufacture of mo-tor vehicles, trailers and semi-trailers. It contains three NACE groups, namely, the manufacture of motor vehicles (NACE Group 34.1), the manu-facture of bodies for motor vehicles, trailers and semi-trailers (NACE Group 34.2) and the manu-facture of parts and accessories for motor vehi-cles and their engines (NACE Group 34.3). Th e data presented in this subchapter does not cover the manufacture of tyres (see Chapter 7), nor that of batteries or other electrical equipment used in motor vehicles (see Chapter 11).
In December 2005 the European Commission published a ten year strategy for the EU’s car sector put forward by the ‘CARS 21 High Level Group’. In October 2008 a conference based on a mid-term review of the strategy was held (2) to focus on actions to foster a competitive Europe-an car industry. Th is recommended: a support-ive regulatory framework and better regulation; basing future policy to reduce carbon dioxide emissions from road transport on an integrated approach involving motor vehicles, fuels, con-sumers/drivers and infrastructure; increased trade liberalisation, provided this is achieved on the basis of mutual benefi t.
Reducing emissions remain a major issue for all types of vehicle manufacturing. In December 2007 the European Commission adopted a pro-posal (3) for setting emission performance stand-ards for new passenger cars. Th e aim is to intro-duce binding requirements on car manufacturers to reduce carbon dioxide emissions, while at the same time trying to reduce emissions in other ways, for example, through changes in fuels, tyres and other components impacting fuel consump-tion. Aft er the adoption of new standards (re-ferred to as Euro 5 and 6) to reduce the emissions of new passenger cars and light commercial vehi-cles in 2007, the European Commission adopted in December 2007 a proposal (4) for standards (referred to as Euro VI) for heavy duty vehicles. Compared to the Euro V standards, emissions of nitrogen oxides from lorries and buses should be reduced by 80 % and particulate matter by 66 %. In January 2009 a Regulation of the European Parliament and of the Council (5) was adopted
(2) See http://ec.europa.eu/enterprise/automotive/pagesbackground/competitiveness/cars21.htm.
(3) COM(2007) 856.
(4) COM(2007) 851.
(5) Regulation (EC) No 79/2009 of the European Parliament and of the Council of 14 January 2009 on type-approval of hydrogen-powered motor vehicles.
(6) VDA (Verband der Automobilindustrie), more information at: http://www.vda.de.
(7) NAFTA (North American Free Trade Agreement) is a free trade agreement between Canada, the United States and Mexico.
Transport equipment 12
295 European business — Facts and figures
German non-fi nancial business economy (NACE Sections C to I and K) value added. Looking in more detail, Slovenia and Sweden recorded a particularly high specialisation in the manufac-ture of bodies, trailers and semi-trailers, and the Czech Republic and Hungary in the manufacture of motor vehicle parts and accessories.
Output from the manufacture of motor vehicles, trailers and semi-trailers in the EU-27 increased each and every year between 1997 and 2007, with 5.8 % growth in the latest year available (2007), which was above the latest ten-year average of 4.4 % per annum.
value added in 2006. Within the subsector of the manufacture of motor vehicles (NACE Group 34.1), Germany’s share rose to 50.9 % of EU-27 value added, while for the motor vehicle parts and accessories manufacturing subsector Ger-many’s share was 44.6 %; among the non-fi nan-cial business economy NACE groups for which data are available these were respectively the third and fi ft h highest shares Germany recorded in the EU-27 total. Unsurprisingly, Germany was the most specialised Member State regarding the manufacture of motor vehicles, trailers and semi-trailers, as this sector contributed 5.9 % of
(1) Including interim or estimated fi gures.(2) Including light trucks.(3) North American Free Trade Agreement covering Canada, the United States and Mexico. (4) Southern Common Market covering Argentina, Brazil, Paraguay and Uruguay.
Source: VDA, http://www.vda.de
Figure 12.8: Manufacture of motor vehicles, trailers and semi-trailersLargest passenger car producing countries/regions, 2007 (% share of world production) (1)
Mercosur (2) (4)5.5%
Rest of Europe
3.7%
NAFTA (2) (3)24.9%
EU-2528.5%
Japan16.5%
Others1.1%Rest of
Asia19.9%
Source: Eurostat (SBS)
Figure 12.9: Manufacture of motor vehicles, trailers and semi-trailers (NACE Division 34)Relative weight within the manufacture of motor vehicles, trailers and semi-trailers, EU-27, 2006 (%)
0 10 20 30 40 50 60 70
Motor vehicles
Bodies, trailers and semi-trailers
Motor vehicle parts & accessories
Value added
Persons employed
(1) Luxembourg and Malta, not available; the Netherlands, Poland and Portugal, 2005.(2) Luxembourg, Malta and the Netherlands, not available; Bulgaria, Cyprus, Poland, Portugal and Romania, 2005.
Source: Eurostat (SBS)
Table 12.6: Manufacture of motor vehicles, trailers and semi-trailers (NACE Division 34)Structural profi le: ranking of top fi ve Member States in terms of value added and persons employed, 2006
Country
(EUR
million)
(% of
EU-27) Country
(thou-
sand)
(% of
EU-27) Country
Value
added
1 Germany 68 225 47.4 Germany 840.4 37.6 Germany 5.9
2 France 16 271 11.3 France 267.7 12.0 Czech Republic 5.4
3 United Kingdom 12 766 8.9 United Kingdom 178.4 8.0 Hungary 5.3
4 Spain 9 284 6.4 Italy 166.1 7.4 Slovakia 4.3
5 Italy 9 264 6.4 Spain 158.2 7.1 Sweden 3.5
Most specialised: share in non-
financial business economy (%) (2)
Highest
value added (1)
Largest number of
persons employed (1)
12 Transport equipment
296 European business — Facts and figures
Source: Eurostat (STS)
Figure 12.10: Manufacture of motor vehicles, trailers and semi-trailers (NACE Division 34)Index of production, EU-27 (2000=100)
70
80
90
100
110
120
130
20072006200520042003200220012000199919981997
Motor vehicles, trailers and semi-trailersMotor vehicle parts and accessoriesMotor vehiclesBodies, trailers and semi-trailers
(1) Excluding products of a generic nature (other), sales of services such as repair, maintenance and installation; estimates; threshold of production value set at EUR 10 billion.
Source: Eurostat (PRODCOM)
Table 12.7: Motor vehicles (CPA Division 34)Production of selected products, EU-27, 2007 (1)
Prodcom
code
Production
value
(EUR
million)
Volume of
sold
production
(million)
Unit of
volume
Motor vehicles with a petrol engine >1 500 cm3 (including motor
caravans of a capacity >3 000 cm3) (excluding vehicles for transporting
≥10 persons, snowmobiles, golf cars & similar vehicles)
34.10.22.30 126 193 6.206 units
Motor vehicles with a diesel or semi-diesel engine >1 500 cm3 but
≤ 2 500 cm3 (excluding vehicles for transporting ≥10 persons,
motor caravans, snowmobiles, golf cars & similar vehicles)
34.10.23.30 106 462 6.157 units
Goods vehicles with a diesel or semi-diesel engine, of a gross vehicle
weight ≤5 tonnes (excluding dumpers for off-highway use)34.10.41.10 20 266 1.568 units
Vehicle compression-ignition internal combustion piston engines
(diesel or semi-diesel) (excluding for railway or tramway rolling stock)34.10.13.00 17 023 6.699 units
Motor vehicles with a diesel or semi-diesel engine ≤1 500 cm3
(excluding vehicles for transporting ≥10 persons, snowmobiles,
golf cars & similar vehicles)
34.10.23.10 16 642 1.713 units
Parts suitable for use solely or principally with spark-ignition internal
combustion piston engines (excluding for aircraft engines)34.30.11.00 15 964 - -
Vehicle reciprocating piston engines of a cylinder capacity >1 000 cm3 34.10.12.00 13 417 7.855 units
Road tractors for semi-trailers 34.10.44.00 13 188 0.199 units
Motor vehicles with a diesel or semi-diesel engine >2 500 cm3
(excluding vehicles for transporting ≥10 persons, motor caravans,
snowmobiles, golf cars & similar vehicles)
34.10.23.40 12 690 0.342 units
Parts suitable for use solely or principally with compression-ignition
internal combustion piston engines34.30.12.00 12 287 - -
Gear boxes 34.30.20.33 11 417 83.425 units
Brakes and servo-brakes and their parts
(excluding unmounted linings or pads)34.30.20.20 10 935 6 289.462 kg
Bodies for lorries, vans, buses, coaches, tractors, dumpers and special
purpose motor vehicles including completely equipped and
incomplete bodies, vehicles for the transport of ≥10 persons
34.20.10.50 10 734 1.152 units
Goods vehicles with compression-ignition internal combustion piston
engine (diesel or semi-diesel), of a gross vehicle weight >20 tonnes
(excluding dumpers designed for off-highway use)
34.10.41.40 10 385 0.144 units
Transport equipment 12
297 European business — Facts and figures
thousand per employee, but this average dis-guised great diff erences between the subsectors. Average personnel costs for the motor vehicles manufacturing subsector were EUR 59.0 thou-sand per employee, the fourth highest average personnel costs in 2005 or 2006 among all of the NACE groups within the non-fi nancial business economy; average personnel costs were at least EUR 22.0 thousand per employee lower in the other two subsectors. Th is disparity was refl ected in the apparent labour productivity recorded for each subsector, which was EUR 79.7 thousand per person employed for the motor vehicles manufac-turing subsector and was at least EUR 29.0 thou-sand per person employed lower in the other two subsectors. Despite these big diff erences, all three subsectors recorded relatively similar wage ad-justed labour productivity ratios, with the motor vehicles, trailers and semi-trailers manufactur-ing sector as a whole recording a ratio of 135.3 %. Several of the Member States that joined the EU in 2004 recorded particularly high wage adjusted labour productivity ratios in this sector, notably Hungary and Poland (2005) where the latest fi g-ures available rose to over 300 %.
Expenditure and productivity
Gross tangible investment in the motor vehicles, trailers and semi-trailers manufacturing sector was EUR 25.7 billion in 2006, 81.4 % of all invest-ment in transport equipment manufacturing. Th e investment rate of 17.9 % was above the indus-trial average, and the highest among the trans-port equipment manufacturing activities. Within this sector investment rates varied greatly from just 9.1 % for the manufacture of bodies, trail-ers and semi-trailers subsector to 20.4 % for the motor vehicles manufacturing subsector. Slova-kia recorded an investment rate of 97.4 % in this sector, closely followed by Slovenia with a rate of 82.4 %.
Personnel costs accounted for 14.2 % of operat-ing expenditure in the EU-27’s motor vehicles, trailers and semi-trailers manufacturing sector in 2006, which was the lowest share within trans-port equipment manufacturing. For the motor vehicles manufacturing subsector the share was particularly low, at 12.1 %. Average personnel costs in the motor vehicles, trailers and semi-trailers manufacturing sector were EUR 47.6
12.2: Ships and boatsNACE Group 35.1 covers the building and re-pairing of ships and boats. Note that, unlike for motor vehicles, this activity does not include the manufacture of parts or (marine) engines.
Structural profi le
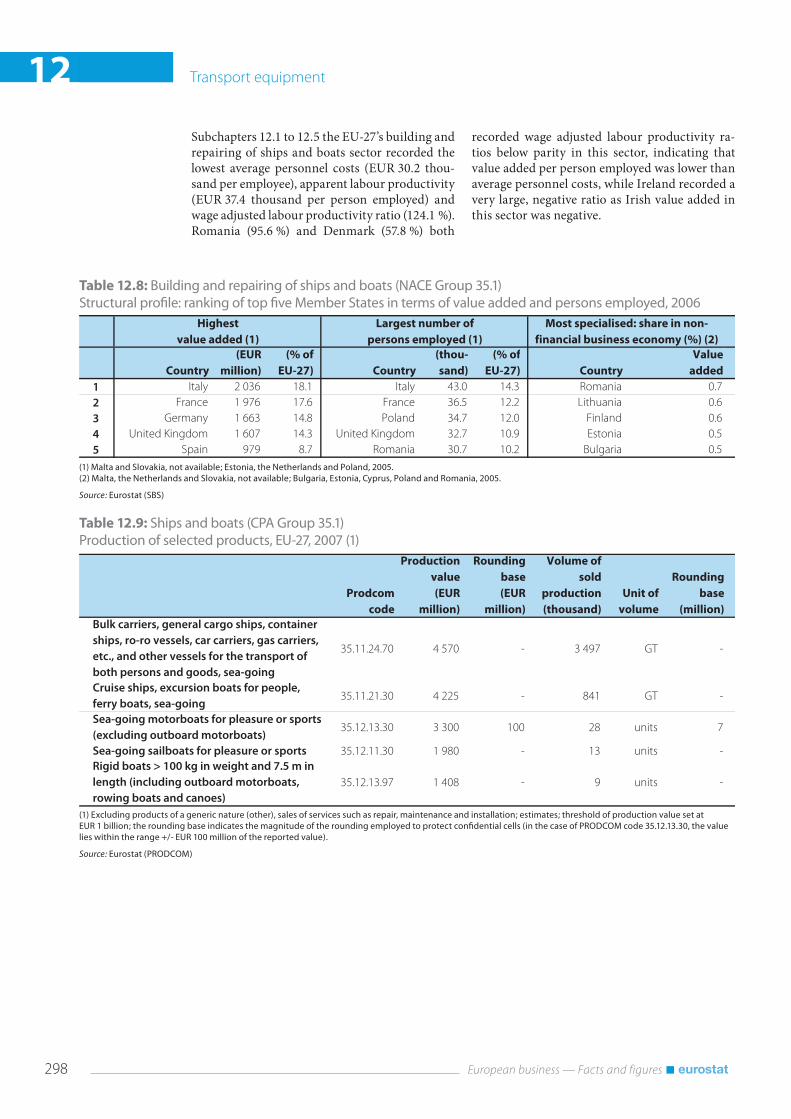
In 2006, there were 20.8 thousand enterprises in the EU-27’s sector for the building and re-pairing of ships and boats (NACE Group 35.1). Th ese enterprises generated EUR 11.2 billion of value added and employed an estimated 300.0 thousand persons. Th is sector contributed 5.8 % of transport equipment (NACE Subsection DM) value added, and 9.5 % of the transport equip-ment workforce. Th e building and repairing of ships (NACE Class 35.11) was the largest sub-sector, with EUR 8.0 billion of value added and a workforce of an estimated 230.0 thousand per-sons, with the building and repairing of pleasure and sporting boats (NACE Class 35.12) making up the rest of the sector.
Italy and France were the largest producers (in value added terms) in this sector within the EU-27. In terms of employment the importance of this sector in Romania and Poland can be
observed, as over 30.0 thousand persons worked in this sector in each of these countries, more than one tenth of the EU-27 total. Th ose Member States with a coastline tended to report relatively high value added specialisation in this sector, notably in the Baltic Member States, Romania, Bulgaria, Finland and Greece. In fact, in Bul-garia, Lithuania and Finland more than half of transport equipment value added was generated in this sector.
Output from the building and repairing of ships and boats declined in the EU-27 most years be-tween 1997 and 2004, with an average contrac-tion of 2.3 % per annum. During this period annual growth was only recorded in 2001. From 2004 onwards output expanded, only slightly in 2005, but more strongly in 2006 and 2007.
Expenditure and productivity
Gross tangible investment in the EU-27’s sector for the building and repairing of ships and boats was EUR 1.1 billion in 2005, resulting in an in-vestment rate of 11.0 %. Personnel costs accounted for 21.9 % of operating expenditure in this sector in 2006, above the transport equipment manu-facturing average (15.9 %). Among the transport equipment manufacturing activities presented in
12 Transport equipment
298 European business — Facts and figures
recorded wage adjusted labour productivity ra-tios below parity in this sector, indicating that value added per person employed was lower than average personnel costs, while Ireland recorded a very large, negative ratio as Irish value added in this sector was negative.
Subchapters 12.1 to 12.5 the EU-27’s building and repairing of ships and boats sector recorded the lowest average personnel costs (EUR 30.2 thou-sand per employee), apparent labour productivity (EUR 37.4 thousand per person employed) and wage adjusted labour productivity ratio (124.1 %). Romania (95.6 %) and Denmark (57.8 %) both
(1) Malta and Slovakia, not available; Estonia, the Netherlands and Poland, 2005.(2) Malta, the Netherlands and Slovakia, not available; Bulgaria, Estonia, Cyprus, Poland and Romania, 2005.
Source: Eurostat (SBS)
Table 12.8: Building and repairing of ships and boats (NACE Group 35.1)Structural profi le: ranking of top fi ve Member States in terms of value added and persons employed, 2006
Country
(EUR
million)
(% of
EU-27) Country
(thou-
sand)
(% of
EU-27) Country
Value
added
1 Italy 2 036 18.1 Italy 43.0 14.3 Romania 0.7
2 France 1 976 17.6 France 36.5 12.2 Lithuania 0.6
3 Germany 1 663 14.8 Poland 34.7 12.0 Finland 0.6
4 United Kingdom 1 607 14.3 United Kingdom 32.7 10.9 Estonia 0.5
5 Spain 979 8.7 Romania 30.7 10.2 Bulgaria 0.5
Most specialised: share in non-
financial business economy (%) (2)
Highest
value added (1)
Largest number of
persons employed (1)
(1) Excluding products of a generic nature (other), sales of services such as repair, maintenance and installation; estimates; threshold of production value set at EUR 1 billion; the rounding base indicates the magnitude of the rounding employed to protect confi dential cells (in the case of PRODCOM code 35.12.13.30, the value lies within the range +/- EUR 100 million of the reported value).
Source: Eurostat (PRODCOM)
Table 12.9: Ships and boats (CPA Group 35.1)Production of selected products, EU-27, 2007 (1)
Prodcom
code
Production
value
(EUR
million)
Rounding
base
(EUR
million)
Volume of
sold
production
(thousand)
Unit of
volume
Rounding
base
(million)
Bulk carriers, general cargo ships, container
ships, ro-ro vessels, car carriers, gas carriers,
etc., and other vessels for the transport of
both persons and goods, sea-going
35.11.24.70 4 570 - 3 497 GT -
Cruise ships, excursion boats for people,
ferry boats, sea-going35.11.21.30 4 225 - 841 GT -
Sea-going motorboats for pleasure or sports
(excluding outboard motorboats)35.12.13.30 3 300 100 28 units 7
Sea-going sailboats for pleasure or sports 35.12.11.30 1 980 - 13 units -
Rigid boats > 100 kg in weight and 7.5 m in
length (including outboard motorboats,
rowing boats and canoes)
35.12.13.97 1 408 - 9 units -
Transport equipment 12
299 European business — Facts and figures
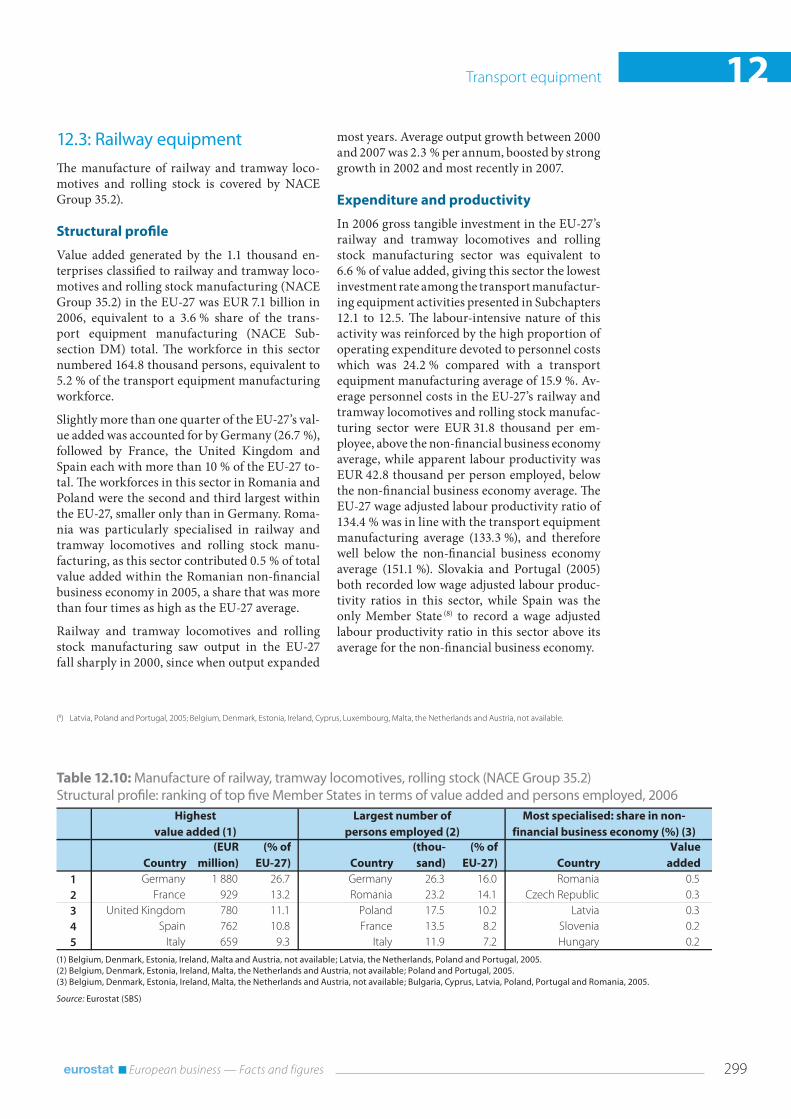
most years. Average output growth between 2000 and 2007 was 2.3 % per annum, boosted by strong growth in 2002 and most recently in 2007.
Expenditure and productivity
In 2006 gross tangible investment in the EU-27’s railway and tramway locomotives and rolling stock manufacturing sector was equivalent to 6.6 % of value added, giving this sector the lowest investment rate among the transport manufactur-ing equipment activities presented in Subchapters 12.1 to 12.5. Th e labour-intensive nature of this activity was reinforced by the high proportion of operating expenditure devoted to personnel costs which was 24.2 % compared with a transport equipment manufacturing average of 15.9 %. Av-erage personnel costs in the EU-27’s railway and tramway locomotives and rolling stock manufac-turing sector were EUR 31.8 thousand per em-ployee, above the non-fi nancial business economy average, while apparent labour productivity was EUR 42.8 thousand per person employed, below the non-fi nancial business economy average. Th e EU-27 wage adjusted labour productivity ratio of 134.4 % was in line with the transport equipment manufacturing average (133.3 %), and therefore well below the non-fi nancial business economy average (151.1 %). Slovakia and Portugal (2005) both recorded low wage adjusted labour produc-tivity ratios in this sector, while Spain was the only Member State (8) to record a wage adjusted labour productivity ratio in this sector above its average for the non-fi nancial business economy.
12.3: Railway equipmentTh e manufacture of railway and tramway loco-motives and rolling stock is covered by NACE Group 35.2).
Structural profi le
Value added generated by the 1.1 thousand en-terprises classifi ed to railway and tramway loco-motives and rolling stock manufacturing (NACE Group 35.2) in the EU-27 was EUR 7.1 billion in 2006, equivalent to a 3.6 % share of the trans-port equipment manufacturing (NACE Sub-section DM) total. Th e workforce in this sector numbered 164.8 thousand persons, equivalent to 5.2 % of the transport equipment manufacturing workforce.
Slightly more than one quarter of the EU-27’s val-ue added was accounted for by Germany (26.7 %), followed by France, the United Kingdom and Spain each with more than 10 % of the EU-27 to-tal. Th e workforces in this sector in Romania and Poland were the second and third largest within the EU-27, smaller only than in Germany. Roma-nia was particularly specialised in railway and tramway locomotives and rolling stock manu-facturing, as this sector contributed 0.5 % of total value added within the Romanian non-fi nancial business economy in 2005, a share that was more than four times as high as the EU-27 average.
Railway and tramway locomotives and rolling stock manufacturing saw output in the EU-27 fall sharply in 2000, since when output expanded
(1) Belgium, Denmark, Estonia, Ireland, Malta and Austria, not available; Latvia, the Netherlands, Poland and Portugal, 2005.(2) Belgium, Denmark, Estonia, Ireland, Malta, the Netherlands and Austria, not available; Poland and Portugal, 2005.(3) Belgium, Denmark, Estonia, Ireland, Malta, the Netherlands and Austria, not available; Bulgaria, Cyprus, Latvia, Poland, Portugal and Romania, 2005.
Source: Eurostat (SBS)
Table 12.10: Manufacture of railway, tramway locomotives, rolling stock (NACE Group 35.2)Structural profi le: ranking of top fi ve Member States in terms of value added and persons employed, 2006
Country
(EUR
million)
(% of
EU-27) Country
(thou-
sand)
(% of
EU-27) Country
Value
added
1 Germany 1 880 26.7 Germany 26.3 16.0 Romania 0.5
2 France 929 13.2 Romania 23.2 14.1 Czech Republic 0.3
3 United Kingdom 780 11.1 Poland 17.5 10.2 Latvia 0.3
4 Spain 762 10.8 France 13.5 8.2 Slovenia 0.2
5 Italy 659 9.3 Italy 11.9 7.2 Hungary 0.2
Most specialised: share in non-
financial business economy (%) (3)
Highest
value added (1)
Largest number of
persons employed (2)
(8) Latvia, Poland and Portugal, 2005; Belgium, Denmark, Estonia, Ireland, Cyprus, Luxembourg, Malta, the Netherlands and Austria, not available.

12 Transport equipment
300 European business — Facts and figures
at the top of the pyramid, followed by a second-tier of suppliers making systems, medium-sized enterprises producing structural elements and components, and a fi nal tier of SMEs producing materials, soft ware and services (note that these may be excluded from data on this sector, as their principal activity may not be the manufacture of aerospace equipment). Th ere are two main mar-ket segments for the aerospace sector, military and civilian, with the former dependent on gov-ernment defence spending plans and the latter being a cyclical market.
Globally the main producers of civil aircraft are Boeing and Airbus; their delivery fi gures since 1989 clearly indicate the cyclical nature of this part of the sector.
12.4: Aerospace equipmentTh is subchapter includes information on the pro-duction of aircraft that are used for the transport of passengers or freight, as well as military ap-plications. Th e data presented also cover other means of air transport, for example, gliders, bal-loons and spacecraft , as well as the manufacture of parts and accessories which are used in the construction of aerospace equipment; all of these activities are classifi ed under NACE Group 35.3.
Th e aerospace equipment manufacturing sector is highly concentrated within the EU and the Unit-ed States, and within a few large manufacturers with a pyramidal supply chain: manufacturers of aircraft , missiles, space equipment and engines
(1) Excluding products of a generic nature (other), sales of services such as repair, maintenance and installation; estimates; threshold of production value set at EUR 1 billion.
Source: Eurostat (PRODCOM)
Table 12.11: Railway equipment (CPA Group 35.2)Production of selected products, EU-27, 2007 (1)
Prodcom
code
Production
value
(EUR
million)
Volume of
sold
production
(million)
Unit of
volume
Parts of locomotives or rolling-stock 35.20.40.30 4 987 - -
Self-propelled railway or tramway coaches, vans and trucks powered
from an external source of electricity (excluding railway or tramway
maintenance or service vehicles)
35.20.20.30 3 040 2 units
Rail/tramway passenger coaches; luggage vans, post office coaches
and other special purpose rail/tramway coaches excluding
rail/tramway maintenance/service vehicles, self-propelled
35.20.32.00 2 353 1 units
Rail locomotives powered from an external source of electricity 35.20.11.00 1 100 1 units
(1) Including McDonnell Douglas for all years.
Source: Boeing (http://www.boeing.com) and Airbus (http://www.airbus.com)
Figure 12.11: Manufacture of aircraft and spacecraftDeliveries of commercial aircraft (number)
0
100
200
300
400
500
600
700
1989 1991 1993 1995 1997 1999 2001 2003 2005 2007
Airbus
Boeing (1)
Transport equipment 12
301 European business — Facts and figures
Personnel costs accounted for a notably higher share of operating expenditure in the EU-27’s aerospace equipment manufacturing sector, a lit-tle more than one quarter (26.3 %) of the total, which was around 10 percentage points above the transport equipment manufacturing and non-fi nancial business economy averages.
Average personnel costs were EUR 59.4 thousand per employee in the EU-27’s aerospace equipment manufacturing sector in 2006, the third high-est level among non-fi nancial business economy NACE groups in 2005 or 2006, while apparent labour productivity was EUR 78.0 thousand per person employed. For both of these indicators these were the highest levels recorded among the transport equipment manufacturing activities presented in Subchapters 12.1 to 12.5. Combin-ing the ratios of apparent labour productivity and average personnel costs, the EU-27’s wage adjusted labour productivity ratio for aerospace equipment manufacturing was 131.4 % in 2006, slightly below the transport equipment manu-facturing average (133.3 %). In most Member States (10) value added per person employed ex-ceeded average personnel costs per employee, the exceptions being the Czech Republic, Ireland and Bulgaria where the wage adjusted labour produc-tivity ratio was below 100 %.
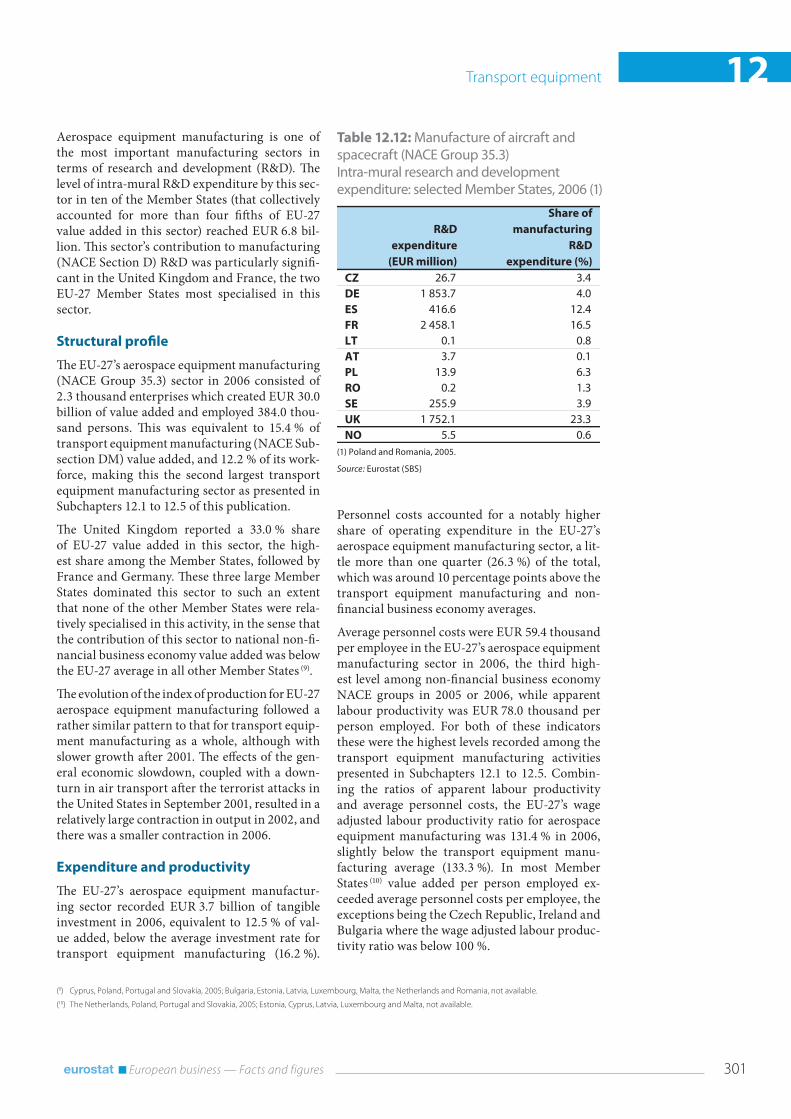
Aerospace equipment manufacturing is one of the most important manufacturing sectors in terms of research and development (R&D). Th e level of intra-mural R&D expenditure by this sec-tor in ten of the Member States (that collectively accounted for more than four fi ft hs of EU-27 value added in this sector) reached EUR 6.8 bil-lion. Th is sector’s contribution to manufacturing (NACE Section D) R&D was particularly signifi -cant in the United Kingdom and France, the two EU-27 Member States most specialised in this sector.
Structural profi le
Th e EU-27’s aerospace equipment manufacturing (NACE Group 35.3) sector in 2006 consisted of 2.3 thousand enterprises which created EUR 30.0 billion of value added and employed 384.0 thou-sand persons. Th is was equivalent to 15.4 % of transport equipment manufacturing (NACE Sub-section DM) value added, and 12.2 % of its work-force, making this the second largest transport equipment manufacturing sector as presented in Subchapters 12.1 to 12.5 of this publication.
Th e United Kingdom reported a 33.0 % share of EU-27 value added in this sector, the high-est share among the Member States, followed by France and Germany. Th ese three large Member States dominated this sector to such an extent that none of the other Member States were rela-tively specialised in this activity, in the sense that the contribution of this sector to national non-fi -nancial business economy value added was below the EU-27 average in all other Member States (9).
Th e evolution of the index of production for EU-27 aerospace equipment manufacturing followed a rather similar pattern to that for transport equip-ment manufacturing as a whole, although with slower growth aft er 2001. Th e eff ects of the gen-eral economic slowdown, coupled with a down-turn in air transport aft er the terrorist attacks in the United States in September 2001, resulted in a relatively large contraction in output in 2002, and there was a smaller contraction in 2006.
Expenditure and productivity
Th e EU-27’s aerospace equipment manufactur-ing sector recorded EUR 3.7 billion of tangible investment in 2006, equivalent to 12.5 % of val-ue added, below the average investment rate for transport equipment manufacturing (16.2 %).
(1) Poland and Romania, 2005.
Source: Eurostat (SBS)
Table 12.12: Manufacture of aircraft and spacecraft (NACE Group 35.3)Intra-mural research and development expenditure: selected Member States, 2006 (1)
R&D
expenditure
(EUR million)
Share of
manufacturing
R&D
expenditure (%)
CZ 26.7 3.4DE 1 853.7 4.0ES 416.6 12.4FR 2 458.1 16.5LT 0.1 0.8AT 3.7 0.1PL 13.9 6.3RO 0.2 1.3SE 255.9 3.9UK 1 752.1 23.3NO 5.5 0.6
(9) Cyprus, Poland, Portugal and Slovakia, 2005; Bulgaria, Estonia, Latvia, Luxembourg, Malta, the Netherlands and Romania, not available.
(10) The Netherlands, Poland, Portugal and Slovakia, 2005; Estonia, Cyprus, Latvia, Luxembourg and Malta, not available.

12 Transport equipment
302 European business — Facts and figures
In 2006 the EU-27’s motorcycles and bicycles manufacturing subsector combined an appar-ent labour productivity of EUR 42.6 thousand per person employed with low average person-nel costs (EUR 30.9 thousand per employee) to leave a wage adjusted labour productivity ratio of 138.0 %, the highest among the transport equip-ment manufacturing NACE groups. In most Member States (11) value added per person em-ployed exceeded personnel costs per employee, the exceptions being Slovenia and France where the wage adjusted labour productivity ratio was below 100 %, and in Ireland where negative value added resulted in a large, negative wage adjusted labour productivity ratio.
Manufacture of other transport equipment n.e.c.
Th e EU-27’s other transport equipment manufac-turing not elsewhere classifi ed subsector (NACE Group 35.5) consisted of just under 0.7 thousand enterprises in 2006, which employed 8.6 thousand persons. In 2005 the value added of this subsector in the EU-27 was EUR 0.3 billion. Th is subsector represented just 0.2 % and 0.3 % respectively of transport equipment manufacturing value added and employment.
Germany generated EUR 186.7 million of value added in this subsector, far ahead of the next larg-est Member State which was the United Kingdom with EUR 59.1 million of value added.
Th e EU-27’s other transport equipment n.e.c. subsector recorded apparent labour productiv-ity of EUR 38.8 thousand per person employed in 2005, and average personnel costs of EUR 34.9 thousand per employee in 2006.
12.5: Miscellaneous transport equipmentTh is subchapter brings together information on the manufacture of motorcycles and bicycles (NACE Group 35.4), and the manufacture of oth-er transport equipment (NACE Group 35.5), such as wheelbarrows, hand-carts and luggage trucks.
Manufacture of motorcycles and bicycles
Th e EU-27’s motorcycles and bicycles manufac-turing subsector (NACE Group 35.4) consisted of 2.3 thousand enterprises which created EUR 2.4 billion of value added in 2006, equivalent to a 1.2 % share of the transport equipment manufac-turing (NACE Subsection DM) total. Th e sector employed 55.9 thousand persons, 1.8 % of the transport equipment manufacturing total.
Italy was the largest producer of motorcycles and bicycles in the EU-27, with a 40.2 % share of EU-27 value added and a 34.9 % share of the workforce; Italy and Lithuania were the most specialised producers of motorcycles and bicycles within the EU-27 in terms of the sector’s contribution to non-fi nancial business economy (NACE Sections C to I and K) value added.
In 2007 motorcycles and bicycles manufactur-ing output in the EU-27 grew by 2.2 %, following 1.8 % growth in 2006: this was the fi rst time since 1998 that output growth was recorded for two successive years.
(1) Estonia, Latvia, Luxembourg and Malta, not available; the Netherlands, Poland, Portugal and Slovakia, 2005.(2) Estonia, Luxembourg and Malta, not available; the Netherlands, Poland, Portugal and Slovakia, 2005.(3) Bulgaria, Estonia, Latvia, Luxembourg, Malta, the Netherlands and Romania, not available; Cyprus, Poland, Portugal and Slovakia, 2005.
Source: Eurostat (SBS)
Table 12.13: Manufacture of aircraft and spacecraft (NACE Group 35.3)Structural profi le: ranking of top fi ve Member States in terms of value added and persons employed, 2006
Country
(EUR
million)
(% of
EU-27) Country
(thou-
sand)
(% of
EU-27) Country
Value
added
1 United Kingdom 9 878 33.0 United Kingdom 99.7 26.0 France 1.0
2 France 7 572 25.3 France 92.8 24.2 United Kingdom 0.9
3 Germany 6 429 21.5 Germany 77.1 20.1 Germany 0.6
4 Italy 2 457 8.2 Italy 33.7 8.8 Sweden 0.4
5 Spain 1 098 3.7 Spain 15.7 4.1 Italy 0.4
Most specialised: share in non-
financial business economy (%) (3)
Highest
value added (1)
Largest number of
persons employed (2)
(11) Poland, 2005; Estonia, Cyprus, Latvia, Luxembourg, Malta, the Netherlands and Romania, not available.

Transport equipment 12
303 European business — Facts and figures
(1) Rounded estimates based on non-confi dential data; turnover and value added, 2005.(2) Rounded estimates based on non-confi dential data.(3) Turnover and value added, 2005.
Source: Eurostat (SBS)
Table 12.14: Miscellaneous transport equipment (NACE Groups 35.4 and 35.5)Structural profi le, EU-27, 2006
Enterprises
(thousand)
Turnover
(EUR
million)
Persons
employed
(thousand)
Value
added
Persons
employed
Miscellaneous transport equipment (1) 3.0 11 519 2 727 64.5 100.0 100.0
Motorcycles and bicycles (2) 2.3 11 200 2 380 55.9 87.6 86.7
Other transport equipment n.e.c. (3) 0.7 1 041 337 8.6 12.4 13.3
Share in total (%)Value
added
(EUR
million)
(1) Belgium, Denmark, Ireland, Latvia, Luxembourg, Malta, Austria, Romania, Slovenia and Slovakia, not available; value added: the Netherlands and Poland, 2005; share of EU-27: all 2005.(2) Belgium, Denmark, Ireland, Luxembourg, Malta, the Netherlands, Austria, Slovenia and Slovakia, not available; Poland, 2005.(3) Belgium, Bulgaria, Denmark, Ireland, Latvia, Luxembourg, Malta, the Netherlands, Austria, Romania, Slovenia and Slovakia, not available; Cyprus and Poland, 2005.
Source: Eurostat (SBS)
Table 12.15: Miscellaneous transport equipment (NACE Groups 35.4 and 35.5)Structural profi le: ranking of top fi ve Member States in terms of value added and persons employed, 2006
Country
(EUR
million)
(% of
EU-27) Country
(thou-
sand)
(% of
EU-27) Country
Value
added
1 Italy 975 34.0 Italy 19.9 30.8 Italy 0.2
2 Germany 475 17.0 Germany 9.8 15.3 Lithuania 0.1
3 Spain 284 9.6 France 5.6 8.7 Sweden 0.1
4 United Kingdom 278 9.0 United Kingdom 4.7 7.3 Spain 0.1
5 France 212 8.8 Spain 4.0 6.1 Portugal 0.0
Most specialised: share in non-
financial business economy (%) (3)
Highest
value added (1)
Largest number of
persons employed (2)
(1) Excluding products of a generic nature (other), sales of services such as repair, maintenance and installation; estimates; threshold of production value set at EUR 600 million; the rounding base indicates the magnitude of the rounding employed to protect confi dential cells (in the case of PRODCOM code 35.41.12.70, the volume of production lies within the range +/- 90 000 units of the reported value).
Source: Eurostat (PRODCOM)
Table 12.16: Miscellaneous transport equipment (CPA Groups 35.4 and 35.5)Production of selected products, EU-27, 2007 (1)
Prodcom
code
Production
value
(EUR
million)
Rounding
base
(EUR
million)
Volume of
sold
production
(thousand)
Unit of
volume
Rounding
base
(thousand)
Non-motorized bicycles and other
cycles with ball bearings
(including delivery tricycles)
35.42.10.50 1 699 - 10 256 units -
Parts and accessories for motorcycles,
mopeds and scooters (excluding saddles)35.41.20.90 1 452 - - - -
Motorcycles with an engine capacity
> 800 cm335.41.12.70 1 000 500 180 units 90
Scooters with an engine capacity
> 50 cm3 but ≤ 250 cm335.41.12.13 840 60 360 units 30
Motorcycles, and cycles fitted with an
auxiliary motor, with an engine capacity
≤ 50 cm3
35.41.11.00 706 - 530 units -
Motorcycles with an engine capacity
> 500 cm3 but ≤ 800 cm335.41.12.50 693 - 109 units -
12 Transport equipment
304 European business — Facts and figures
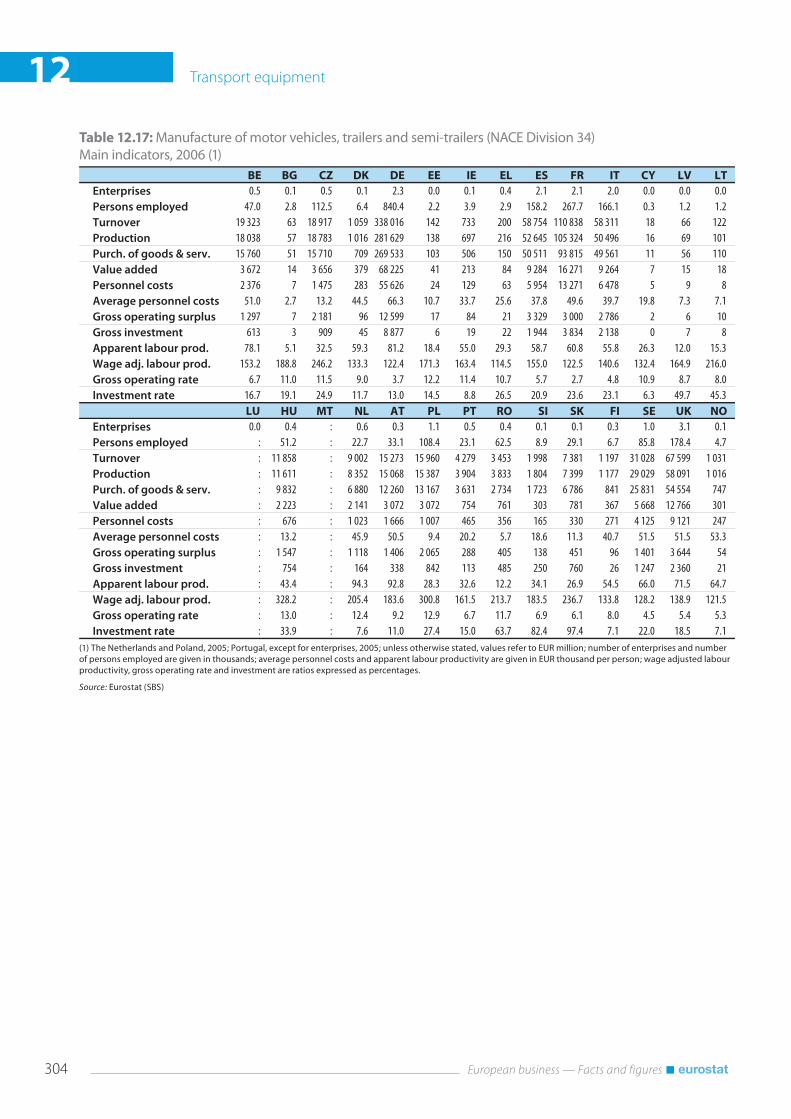
(1) The Netherlands and Poland, 2005; Portugal, except for enterprises, 2005; unless otherwise stated, values refer to EUR million; number of enterprises and number of persons employed are given in thousands; average personnel costs and apparent labour productivity are given in EUR thousand per person; wage adjusted labour productivity, gross operating rate and investment are ratios expressed as percentages.
Source: Eurostat (SBS)
Table 12.17: Manufacture of motor vehicles, trailers and semi-trailers (NACE Division 34)Main indicators, 2006 (1)
BE BG CZ DK DE EE IE EL ES FR IT CY LV LT
Enterprises 0.5 0.1 0.5 0.1 2.3 0.0 0.1 0.4 2.1 2.1 2.0 0.0 0.0 0.0Persons employed 47.0 2.8 112.5 6.4 840.4 2.2 3.9 2.9 158.2 267.7 166.1 0.3 1.2 1.2Turnover 19 323 63 18 917 1 059 338 016 142 733 200 58 754 110 838 58 311 18 66 122Production 18 038 57 18 783 1 016 281 629 138 697 216 52 645 105 324 50 496 16 69 101Purch. of goods & serv. 15 760 51 15 710 709 269 533 103 506 150 50 511 93 815 49 561 11 56 110Value added 3 672 14 3 656 379 68 225 41 213 84 9 284 16 271 9 264 7 15 18Personnel costs 2 376 7 1 475 283 55 626 24 129 63 5 954 13 271 6 478 5 9 8Average personnel costs 51.0 2.7 13.2 44.5 66.3 10.7 33.7 25.6 37.8 49.6 39.7 19.8 7.3 7.1Gross operating surplus 1 297 7 2 181 96 12 599 17 84 21 3 329 3 000 2 786 2 6 10Gross investment 613 3 909 45 8 877 6 19 22 1 944 3 834 2 138 0 7 8Apparent labour prod. 78.1 5.1 32.5 59.3 81.2 18.4 55.0 29.3 58.7 60.8 55.8 26.3 12.0 15.3Wage adj. labour prod. 153.2 188.8 246.2 133.3 122.4 171.3 163.4 114.5 155.0 122.5 140.6 132.4 164.9 216.0Gross operating rate 6.7 11.0 11.5 9.0 3.7 12.2 11.4 10.7 5.7 2.7 4.8 10.9 8.7 8.0Investment rate 16.7 19.1 24.9 11.7 13.0 14.5 8.8 26.5 20.9 23.6 23.1 6.3 49.7 45.3
LU HU MT NL AT PL PT RO SI SK FI SE UK NO
Enterprises 0.0 0.4 : 0.6 0.3 1.1 0.5 0.4 0.1 0.1 0.3 1.0 3.1 0.1Persons employed : 51.2 : 22.7 33.1 108.4 23.1 62.5 8.9 29.1 6.7 85.8 178.4 4.7Turnover : 11 858 : 9 002 15 273 15 960 4 279 3 453 1 998 7 381 1 197 31 028 67 599 1 031Production : 11 611 : 8 352 15 068 15 387 3 904 3 833 1 804 7 399 1 177 29 029 58 091 1 016Purch. of goods & serv. : 9 832 : 6 880 12 260 13 167 3 631 2 734 1 723 6 786 841 25 831 54 554 747Value added : 2 223 : 2 141 3 072 3 072 754 761 303 781 367 5 668 12 766 301Personnel costs : 676 : 1 023 1 666 1 007 465 356 165 330 271 4 125 9 121 247Average personnel costs : 13.2 : 45.9 50.5 9.4 20.2 5.7 18.6 11.3 40.7 51.5 51.5 53.3Gross operating surplus : 1 547 : 1 118 1 406 2 065 288 405 138 451 96 1 401 3 644 54Gross investment : 754 : 164 338 842 113 485 250 760 26 1 247 2 360 21Apparent labour prod. : 43.4 : 94.3 92.8 28.3 32.6 12.2 34.1 26.9 54.5 66.0 71.5 64.7Wage adj. labour prod. : 328.2 : 205.4 183.6 300.8 161.5 213.7 183.5 236.7 133.8 128.2 138.9 121.5Gross operating rate : 13.0 : 12.4 9.2 12.9 6.7 11.7 6.9 6.1 8.0 4.5 5.4 5.3Investment rate : 33.9 : 7.6 11.0 27.4 15.0 63.7 82.4 97.4 7.1 22.0 18.5 7.1
Transport equipment 12
305 European business — Facts and figures
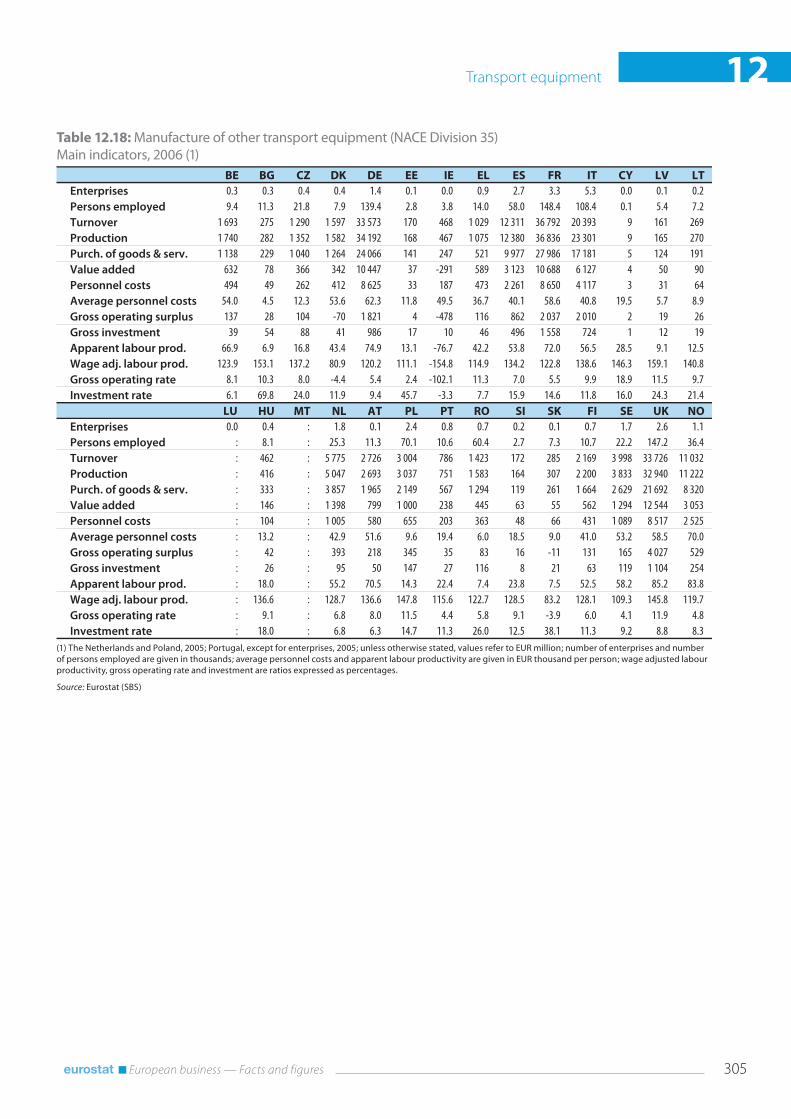
(1) The Netherlands and Poland, 2005; Portugal, except for enterprises, 2005; unless otherwise stated, values refer to EUR million; number of enterprises and number of persons employed are given in thousands; average personnel costs and apparent labour productivity are given in EUR thousand per person; wage adjusted labour productivity, gross operating rate and investment are ratios expressed as percentages.
Source: Eurostat (SBS)
Table 12.18: Manufacture of other transport equipment (NACE Division 35)Main indicators, 2006 (1)
BE BG CZ DK DE EE IE EL ES FR IT CY LV LT
Enterprises 0.3 0.3 0.4 0.4 1.4 0.1 0.0 0.9 2.7 3.3 5.3 0.0 0.1 0.2Persons employed 9.4 11.3 21.8 7.9 139.4 2.8 3.8 14.0 58.0 148.4 108.4 0.1 5.4 7.2Turnover 1 693 275 1 290 1 597 33 573 170 468 1 029 12 311 36 792 20 393 9 161 269Production 1 740 282 1 352 1 582 34 192 168 467 1 075 12 380 36 836 23 301 9 165 270Purch. of goods & serv. 1 138 229 1 040 1 264 24 066 141 247 521 9 977 27 986 17 181 5 124 191Value added 632 78 366 342 10 447 37 -291 589 3 123 10 688 6 127 4 50 90Personnel costs 494 49 262 412 8 625 33 187 473 2 261 8 650 4 117 3 31 64Average personnel costs 54.0 4.5 12.3 53.6 62.3 11.8 49.5 36.7 40.1 58.6 40.8 19.5 5.7 8.9Gross operating surplus 137 28 104 -70 1 821 4 -478 116 862 2 037 2 010 2 19 26Gross investment 39 54 88 41 986 17 10 46 496 1 558 724 1 12 19Apparent labour prod. 66.9 6.9 16.8 43.4 74.9 13.1 -76.7 42.2 53.8 72.0 56.5 28.5 9.1 12.5Wage adj. labour prod. 123.9 153.1 137.2 80.9 120.2 111.1 -154.8 114.9 134.2 122.8 138.6 146.3 159.1 140.8Gross operating rate 8.1 10.3 8.0 -4.4 5.4 2.4 -102.1 11.3 7.0 5.5 9.9 18.9 11.5 9.7Investment rate 6.1 69.8 24.0 11.9 9.4 45.7 -3.3 7.7 15.9 14.6 11.8 16.0 24.3 21.4
LU HU MT NL AT PL PT RO SI SK FI SE UK NO
Enterprises 0.0 0.4 : 1.8 0.1 2.4 0.8 0.7 0.2 0.1 0.7 1.7 2.6 1.1Persons employed : 8.1 : 25.3 11.3 70.1 10.6 60.4 2.7 7.3 10.7 22.2 147.2 36.4Turnover : 462 : 5 775 2 726 3 004 786 1 423 172 285 2 169 3 998 33 726 11 032Production : 416 : 5 047 2 693 3 037 751 1 583 164 307 2 200 3 833 32 940 11 222Purch. of goods & serv. : 333 : 3 857 1 965 2 149 567 1 294 119 261 1 664 2 629 21 692 8 320Value added : 146 : 1 398 799 1 000 238 445 63 55 562 1 294 12 544 3 053Personnel costs : 104 : 1 005 580 655 203 363 48 66 431 1 089 8 517 2 525Average personnel costs : 13.2 : 42.9 51.6 9.6 19.4 6.0 18.5 9.0 41.0 53.2 58.5 70.0Gross operating surplus : 42 : 393 218 345 35 83 16 -11 131 165 4 027 529Gross investment : 26 : 95 50 147 27 116 8 21 63 119 1 104 254Apparent labour prod. : 18.0 : 55.2 70.5 14.3 22.4 7.4 23.8 7.5 52.5 58.2 85.2 83.8Wage adj. labour prod. : 136.6 : 128.7 136.6 147.8 115.6 122.7 128.5 83.2 128.1 109.3 145.8 119.7Gross operating rate : 9.1 : 6.8 8.0 11.5 4.4 5.8 9.1 -3.9 6.0 4.1 11.9 4.8Investment rate : 18.0 : 6.8 6.3 14.7 11.3 26.0 12.5 38.1 11.3 9.2 8.8 8.3