Transport and the economy: full report (SACTRA) (PDF - 2053 KB)
298
1 Transport and the economy: full report (SACTRA) Contents Summary Report ............................................................................................................6 Introduction .............................................................................................................................. 6 Do Transport Improvements Lead to Increased, or More Efficient, Economic Activity? ....... 6 Can Economic Growth be 'Decoupled' from Traffic Growth?................................................. 8 Are Economic Impacts Captured in Current Procedures? ....................................................... 9 Recommendations for Appraisal ............................................................................................ 13 Concluding Comments........................................................................................................... 13 Acknowledgements ................................................................................................................ 14 Chapter 1 - Introduction..............................................................................................15 Terms of Reference ................................................................................................................ 15 Method of Working................................................................................................................ 15 Interim Report ........................................................................................................................ 16 New Policy Context ............................................................................................................... 16 Conceptual Issues................................................................................................................... 18 Some General Observations ................................................................................................... 19 Structure of the Report ........................................................................................................... 20 Acknowledgements ................................................................................................................ 21 Chapter 2 - The Debate about Transport and the Economy....................................22 Introduction ............................................................................................................................ 22 The Need to Understand the Relationship between Transport and the Economy.................. 22 The Nature of the Debate about Transport and the Economy ................................................ 22 Transport and Economic Trends ............................................................................................ 23 Micro-Level Relationship between Transport and the Economy........................................... 30 Spatial Issues.......................................................................................................................... 32 Macro-Level Relationship between Transport and the Economy .......................................... 35 Conclusion ............................................................................................................................. 38 Chapter 3 - Key Concepts Explained .........................................................................40 Introduction ............................................................................................................................ 40 Transport: Some Definitions .................................................................................................. 40 GDP as a Measure of Economic Performance ....................................................................... 42
Transcript of Transport and the economy: full report (SACTRA) (PDF - 2053 KB)
1
Transport and the economy: full report (SACTRA)
Contents
Summary Report ............................................................................................................6
Introduction.............................................................................................................................. 6
Do Transport Improvements Lead to Increased, or More Efficient, Economic Activity?....... 6
Can Economic Growth be 'Decoupled' from Traffic Growth?................................................. 8
Are Economic Impacts Captured in Current Procedures? ....................................................... 9
Recommendations for Appraisal............................................................................................ 13
Concluding Comments........................................................................................................... 13
Acknowledgements................................................................................................................ 14
Chapter 1 - Introduction..............................................................................................15
Terms of Reference................................................................................................................ 15
Method of Working................................................................................................................ 15
Interim Report ........................................................................................................................ 16
New Policy Context ............................................................................................................... 16
Conceptual Issues................................................................................................................... 18
Some General Observations................................................................................................... 19
Structure of the Report........................................................................................................... 20
Acknowledgements................................................................................................................ 21
Chapter 2 - The Debate about Transport and the Economy....................................22
Introduction............................................................................................................................ 22
The Need to Understand the Relationship between Transport and the Economy.................. 22
The Nature of the Debate about Transport and the Economy................................................ 22
Transport and Economic Trends ............................................................................................ 23
Micro-Level Relationship between Transport and the Economy........................................... 30
Spatial Issues.......................................................................................................................... 32
Macro-Level Relationship between Transport and the Economy.......................................... 35
Conclusion ............................................................................................................................. 38
Chapter 3 - Key Concepts Explained .........................................................................40
Introduction............................................................................................................................ 40
Transport: Some Definitions.................................................................................................. 40
GDP as a Measure of Economic Performance....................................................................... 42
Transport and the economy: full report (SACTRA)
2
Sustainable Development....................................................................................................... 42
The Sources of Economic Growth ......................................................................................... 43
Efficient Allocations of Resources ........................................................................................ 45
Applying the Principles of Marginal Cost Pricing................................................................. 47
Social Cost Benefit Analysis.................................................................................................. 48
Transport Benefits and Final Economic Benefits .................................................................. 52
'More Productive' and 'Less Productive' Travel ..................................................................... 55
Summary ................................................................................................................................ 58
Overview of Chapters 4 and 5................................................................................................ 60
Causes of economic growth ................................................................................................... 60
Transport improvements considered as reductions to trade barriers...................................... 61
Theoretical modelling of transport effects in the context of imperfect competition.............. 61
Freight and logistics............................................................................................................... 62
Labour markets ...................................................................................................................... 62
Local and regional effects ...................................................................................................... 63
Recommendations.................................................................................................................. 64
Conclusion ............................................................................................................................. 65
Chapter 4 - The Linking Mechanisms: An Outline ..................................................66
Introduction............................................................................................................................ 66
Transport and the Economy ................................................................................................... 66
Transport infrastructure and growth ...................................................................................... 67
Robustness ............................................................................................................................. 80
Land-Use/Transport Interaction Models, Imperfect Competition and the Evaluation of Economic Benefits .................................................................................................................................. 82
Conclusions............................................................................................................................ 82
Chapter 5 - Linkages in a Spatial Economy ..............................................................84
Introduction............................................................................................................................ 84
How Firms Respond to Transport Changes ........................................................................... 84
How Labour and Housing Markets Respond to Transport Changes...................................... 90
Agglomeration and Geography.............................................................................................. 98
Input-Output Models............................................................................................................ 103
The Role Of Land-Use/Transport Interaction Models ......................................................... 106
Conclusions: Implications for Research and Appraisal ....................................................... 109
Chapter 6 - Transport Intensity................................................................................112
Transport and the economy: full report (SACTRA)
3
The Potential for 'Decoupling' Economic Growth from Traffic Growth ............................. 112
Introduction.......................................................................................................................... 112
Transport Intensity ............................................................................................................... 112
Price and other Policy-related Influences on Traffic Volumes ............................................ 118
Conclusion ........................................................................................................................... 125
Chapter 7 - The Economic Impacts of Reducing Traffic .......................................126
Introduction.......................................................................................................................... 126
Market Failures in Road Transport ...................................................................................... 127
Double-Dividends and Economic Growth........................................................................... 132
Compensation ...................................................................................................................... 135
Measures to Reduce Traffic and their Economic Impact..................................................... 137
Implications for Appraisal ................................................................................................... 144
Conclusions.......................................................................................................................... 146
Chapter 8 - Implications For Appraisal ...................................................................149
Introduction.......................................................................................................................... 149
The Context For Our Considerations ................................................................................... 151
Implications for Appraising the Effects of Transport Interventions on the Economy ......... 152
Appraisal Requirement 1: What is the Rationale for the Intervention? ............................... 153
Appraisal Requirement 2A: What are the Benefits/Disbenefits of the Intervention Calculated Using Conventional Transport Cost Benefit Analysis (Using Best Practice and on the Assumption of a Perfectly Competitive Economy outside the Transport Sector)?.............. 153
Appraisal Requirement 2B: What are the Total Economic Impacts of the Intervention?.... 158
Appraisal Requirement 3: What is the Pattern of Gains and Losses, in both Economic Activity and Jobs, which will arise from the Intervention? ............................................................... 159
Relationship with our Interim Report Diagnostic Tests....................................................... 160
Interventions: Schemes and Projects, Regions and Corridor Strategies, and National Policies160
Chapter 9 - Current Appraisal Practice ..................................................................162
Introduction.......................................................................................................................... 162
An Overview Of Current Appraisal Practice ....................................................................... 162
The Content of this Chapter ................................................................................................. 165
Cost Benefit Analysis .......................................................................................................... 165
Appraisal at Different Levels............................................................................................... 181
Chapter 10 - Recommendations for an Improved Appraisal Practice..................186
Introduction.......................................................................................................................... 186
Emphasis and Structure of this Chapter ............................................................................... 186
Transport and the economy: full report (SACTRA)
4
Observations from the Consultees ....................................................................................... 187
Appraisal Requirement 1: What is the Rationale for the Intervention? ............................... 188
Appraisal Requirement 2A: What are the Benefits/Disbenefits of the Intervention Calculated using Conventional Transport Cost Benefit Analysis (Using Best Practice and on the Assumption of a Perfectly Competitive Economy outside the Transport Sector)?.................................. 190
Appraisal Requirement 2B: What are the Total Economic Impacts of the Intervention?.... 200
Appraisal Requirement 3: What is the Pattern of Gains and Losses, in both Economic Activity and Jobs, which will arise from the Intervention? ............................................................... 221
Ex-Post Evaluation Studies.................................................................................................. 224
Equilibrium Modelling......................................................................................................... 226
Concluding Remarks............................................................................................................ 226
Chapter 11 - List of Recommendations....................................................................228
Introduction.......................................................................................................................... 228
The Nature and Significance of the Relationship between Transport and the Economy..... 228
The Scope to Reduce the Transport 'Intensity' of the Economy .......................................... 229
Improvements to Current Appraisal Practice....................................................................... 230
Appendix A - List of Members and Terms of Reference........................................234
List of Members................................................................................................................... 234
Members of the SACTRA Secretariat ................................................................................. 234
Terms of Reference for SACTRA ....................................................................................... 235
Appendix B - Evidence Supplied to the SACTRA Committee...............................238
Section One the committee's request for evidence............................................................... 238
1) Chairman's letter of 3 march 1997................................................................................... 238
2) Annex a of the Chairman's letter General Issues ............................................................. 239
3) Annex B of the Chairman's letter The Relationship Between Improvements In Transport Provision And Economic Growth ........................................................................................ 240
4) Annex c of the Chairman's letter Conventional Cost Benefit Appraisal Methods For Transport............................................................................................................................................. 241
5) Annex D of the chairman's letter The Impact On Economic Growth Of Measures To Reduce Transport Intensity ............................................................................................................... 242
Section Two Responses & contributions ............................................................................. 244
6) Written Evidence ............................................................................................................. 244
7) SACRA research.............................................................................................................. 247
8) Miscellaneous consultancy .............................................................................................. 247
9) Other submissions to SACTRA....................................................................................... 247
10) Attendees at seminar on the implications of imperfect competition for transport appraisal248
Transport and the economy: full report (SACTRA)
5
11) Attendees of special meetings and/or additional advice to SACTRA ........................... 248
Appendix C - Economic Effects of Transportation Activities................................249
Appendix D - Interpretation and Analysis of Transport Intensity........................250
Analysis of Transport Intensity............................................................................................ 250
Differences in Intensity........................................................................................................ 254
Appendix E - Benefits and Disbenefits of Traffic Reduction Measures................265
General Appraisal Issues with respect to Traffic Reduction Measures ............................... 265
Urban Congestion Charging................................................................................................. 266
Parking Controls .................................................................................................................. 267
Motorway Charging ............................................................................................................. 268
Road Capacity Reductions or Roadspace Reallocations...................................................... 269
Bibliography ...............................................................................................................271
Summary Report .................................................................................................................. 271
Chapter 1 Introduction ......................................................................................................... 271
Chapter 2 The Debate about Transport and the Economy ................................................... 271
Chapter 3 Key Concepts Explained ..................................................................................... 273
Overview of Chapters 4 and 5.............................................................................................. 274
Chapter 4 The Linking Mechanisms: An Outline ................................................................ 274
Chapter 5 Linkages In A Spatial Economy.......................................................................... 276
Chapter 6 Transport Intensity and the Potential for 'Decoupling' Economic Growth from Traffic Growth ................................................................................................................................. 279
Chapter 7 The Economic Impacts of Reducing Traffic ....................................................... 280
Chapter 8 Implications For Appraisal .................................................................................. 282
Chapter 9 Current Appraisal Practice .................................................................................. 282
Chapter 10 Recommendations for an Improved Appraisal Practice .................................... 284
Appendix C .......................................................................................................................... 287
Appendix D.......................................................................................................................... 287
Appendix E .......................................................................................................................... 287
Glossary ............................................................................................................................... 287
Glossary.......................................................................................................................288

Transport and the economy: full report (SACTRA)
6
Summary Report
Introduction
1 In 1996 the Standing Advisory Committee on Trunk Road Appraisal (SACTRA) was asked by the then Secretary of State for Transport to consider the effects on the performance of the economy which might be caused by transport projects and policies, including new infrastructure, changing prices, demand management and measures to reduce traffic. Following the change in Government in May 1997, we produced an Interim Report (December 1997) to assist preparation of the White Paper 'A New Deal for Transport: Better for Everyone'. We now submit our final report.
2 The report addresses four main questions:
• do transport improvements lead to increased economic activity?
• is it possible to 'decouple' growth in traffic levels from growth in the economy, in order to obtain the positive benefits of greater wealth, while reducing some of the negative effects of congestion and environmental impacts?
• are economic impacts fully captured in the procedures for estimating benefits and costs currently used by the Department of the Environment, Transport and the Regions?
• what recommendations follow for the Department's procedures and practice for transport appraisal?
3 Our terms of reference go beyond the specific question of trunk road schemes and, therefore, the Committee has aimed at a general approach which treats even-handedly all types of transport investment or policy initiative, for all modes. The best balance among these will vary from time to time and place to place in accordance with specific conditions and strategic considerations, but the principles and factual basis of appraisal should always be consistent.
4 In considering the effects of transport on the economy, we have borne in mind that transport policy also has many other objectives, including the improvement of safety, environment, travelling conditions, accessibility, integration and social inclusion. Provided that the successfully delivered benefits under these headings justify the costs, improvements may be well worthwhile even if they do not produce a positive effect on economic performance.
5 The Committee's conclusions in answer to the four questions are as follows.
Do Transport Improvements Lead to Increased, or More Efficient, Economic Activity?
6 Theoretical considerations suggest that the main mechanism by which changes in transport could have an effect on the economy is by a change in the costs of movement. We therefore defined a transport improvement as any intervention - whether by infrastructure investment, more efficient transport management, or otherwise - which successfully produces sustained reductions in transport costs, or equivalent improvement in service delivered.

Transport and the economy: full report (SACTRA)
7
7 These cost reductions accrue to different categories of traffic, some clearly contributing more directly to economic activity than others, which in some cases will be reflected in their higher valuation of savings in travel time. However, we have not found it possible or helpful to define an absolute distinction between 'productive' and 'unproductive' classes of vehicle or traveller. So while focusing mainly on the traded transactions measured in GDP, we must also make allowance for some important activities, producing economic welfare, which take place outside the market context.
8 Given these definitions of 'improvement' and 'the economy', theory suggests that there are a number of important mechanisms by which such transport improvements could, in principle, improve economic performance. These include:
• reorganisation or rationalisation of production, distribution and land use;
• effects on labour market catchment areas and hence on labour costs;
• increases in output resulting from lower costs of production;
• stimulation of inward investment;
• unlocking' inaccessible sites for development; and
• triggering growth which in turn stimulates further growth.
9 Thus measures which reduce transport costs could encourage economic performance in various ways. Businesses can pass on the benefit of lower production costs to consumers in the form of lower prices, or they can implement further efficiency improvements by reorganising production and distribution. The economy can also benefit if lower transport costs help stimulate easier transfer between jobs, or greater competition among firms.
10 We consider these theories, which deal with the linkages between transport improvements and economic activity, to be strong. They are internally consistent, and provide insight into a complex pattern of effects leading in different directions, not all of which are intuitively obvious - notably, for example, the 'two-way road' argument: this reminds us that improved accessibility between two countries (and, similarly, between cities, areas or regions) may sometimes benefit one of them to the disbenefit of the other. We emphasise that these theories as a whole should be subject to empirical testing before any of them can be taken as proved.
11 In the search for empirical evidence, we find that direct statistical and case-study evidence on the size and nature of the effects of transport cost changes is limited. Some authors have claimed that national programmes of public investment, including road construction, lead to high rates of social return measured in terms of economic growth and productivity improvement. Other authors suggest that such effects do occur but on a smaller scale than has been claimed, and that, in general, any contribution to the sustainable rate of economic growth of a mature economy, with well-developed transport systems, is likely to be modest. Our investigations support the latter assessment. We have also reviewed available evidence from specific local studies seeking to detect economic impacts from completed transport investment projects in the recent past. The state of the art of this important field is poorly developed and the results do not offer convincing general evidence of the size, nature or direction of local economic impacts.
12 Thus we are provided with a strong theoretical expectation that all or part of a successfully achieved transport cost reduction may subsequently be converted into a range of different
Transport and the economy: full report (SACTRA)
8
wider economic impacts. This, in principle, provides for the possibility of improved economic performance. Empirical evidence of the scale and significance of such linkages is, however, weak and disputed. We conclude that the theoretical effects listed can exist in reality, but that none of them is guaranteed. Our studies underline the conclusion that generalisations about the effects of transport on the economy are subject to strong dependence on specific local circumstances and conditions.
Can Economic Growth be 'Decoupled' from Traffic Growth?
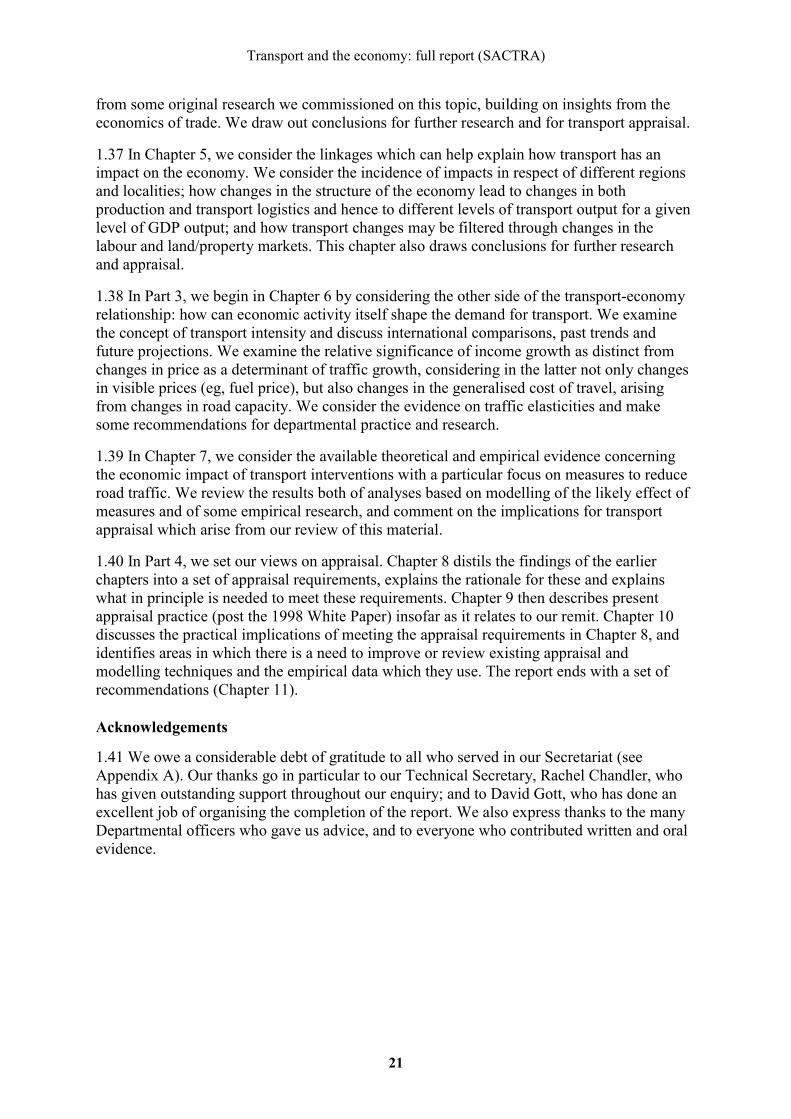
13 Many commentators have found a strong correlation between economic growth and road traffic growth, though there is not a consensus on the causes of this correlation. Recent discussion has observed that they have not been growing at the same pace, but traffic has been growing faster than the economy as a whole. The result is that the 'transport intensity' of the economy has been increasing, ie, each unit of output is associated with a greater amount of movement of people or goods. Our investigations confirm this observation. The concept of transport intensity has some problems of definition and measurement which make it inappropriate as a target in its own right, but it has usefully focused concern about the economic and environmental costs of this road traffic growth by raising the question of whether it is possible and desirable to separate the two trends, in order to obtain the benefits of economic growth while reducing the costs imposed by traffic.
14 We separate this question into two parts. First, is the volume of traffic subject to influence by available policy instruments? Secondly, if it is, would doing so have a favourable or unfavourable economic effect?
15 Our consideration of the evidence leads us to conclude that income growth does have a strong effect on traffic growth, but that the amount of traffic is also influenced by the price, speed and quality of transport. An extensive literature of empirical studies suggests that this sensitivity is sufficient to result in a significant degree of variation in how much traffic will arise from any given level of national income. This leads us to conclude that policies intended to change the volume of traffic that will arise from any particular level of economic activity are, in principle, feasible.
16 We then considered whether doing so will have a positive or negative effect on economic performance. Answering this question raises an apparent paradox: we have noted above that reducing transport costs should assist economic performance, so how could it be that raising transport prices could be good for the economy?
17 In part, this paradox is resolved by noting that 'improvements', as defined above, and 'traffic reductions' are not necessarily mutually exclusive. Most authorities will combine a package of measures which interact with each other and are intended to produce a better overall outcome than each measure taken separately.
18 However, the more fundamental resolution requires recognition that 'transport costs' are not identical with 'transport prices' - the real resource costs that transport imposes on the economy include the hidden or 'external' costs of congestion, accidents, pollution and other environmental impacts. When these are included, the overall marginal cost of a trip to society may be quite different from the direct money cost of car use, or public transport fares, paid by each individual traveller. The circumstances where reducing traffic levels could contribute usefully to economic performance are, in general, those where transport prices are currently below marginal social costs, primarily because of the existence of external costs of congestion and environmental damage.
Transport and the economy: full report (SACTRA)
9
19 In these circumstances, traffic reduction policies which result in a better alignment of prices and costs not only reduce the incidence of such external costs, but also, in doing so, can increase economic welfare. Conversely, where transport prices already fully include, or exceed, all internal and external marginal costs, measures to reduce traffic are likely to entail some sacrifice of economic welfare. Accepting that the full money valuation of all external environmental costs is not in prospect, it is still unavoidably necessary to make a case-by-case judgement about whether these costs are likely to be large enough to make the marginal social cost greater than the price, since this is critical to the whole analytical framework.
20 Questions of the geographical incidence of such benefits then have to be addressed. In the case where traffic reduction is achieved by increasing prices, the geographical incidence and nature of any additional benefits will depend, in large part, on the use of net revenues collected, since this would be the mechanism for determining whether the benefits 'stay in the local economy' or are passed elsewhere. It follows that the necessary conditions for increased transport prices to have a positive economic impact in a particular target area are likely to include well-judged recycling of the revenue in the area for purposes which are themselves good value for money.
21 In practice, it is often the case that traffic reducing measures are implemented using non-price methods, such as reallocation of road capacity, some forms of parking control, pedestrian zones, selective bans on certain categories of vehicle or certain times, etc, since these can have significant operational advantages, as well as having a history of tried and tested experience. The economic analysis of these methods is more complex, as in such cases direct net revenues will not be generated, so that this mechanism for influencing the incidence of benefits is not available. The economic effect will therefore tend to be determined by the precision with which the policies can be targeted on appropriate classes of traffic, in specific parts of the network: for example, scarce road capacity may be more effectively utilised if space is reserved for specific categories of vehicles (eg, buses, lorries, high occupancy cars, emergency services) and some cities make special arrangements for delivery lorry access at convenient times to areas where vehicles are otherwise excluded. Empirical evidence exists of many cases where some non-price measures, especially pedestrianisation of town centres, have had successful local economic effects, but provides no information on whether there are any net effects at a national level.
22 To sum up: we have a strong theoretical basis for identifying conditions where measures may increase some direct prices, reduce traffic, reduce resource costs, and also have a favourable local or national economic impact. There is extensive empirical evidence on two aspects (the sensitivity of traffic levels to some cost changes, and the local economic effects of pedestrianisation) but not on effects on economic performance at a national level. The degree of traffic reduction to aim for, and the selection of specific measures, will vary according to the circumstances, and should therefore be the subject of cost benefit appraisal, as in the case of infrastructure investment.
Are Economic Impacts Captured in Current Procedures?
23 The underlying assumption in the appraisal of most transport improvements is that direct benefits and costs (such as reductions in travel time) may be converted into wider economic effects (such as reduced wage costs or higher property values) by the operation of the market. Crucially, these final effects are assumed to have the same total value as the initial impacts, and not to be additional to them: this implies that in general, the value of direct transport benefits must decline if indirect economic benefits are to grow. The identity of initial and
Transport and the economy: full report (SACTRA)
10
final benefits is a theoretical proposition arising logically from the assumption of 'perfect competition' in the economy as a whole - that is, an economy where all prices are correctly aligned to the costs of production by (among other conditions) active competition among enough firms to ensure that none can dominate the market.
24 If these conditions hold, we concur that the value of the estimated costs and benefits to transport users (notably time savings, operating costs and accident reduction), and to non-users (notably environmental impacts - provided that they have all been identified and a money value attributed to them) would give a full and unbiased estimate of the value of the overall economic impact. This is equivalent to the statement that no 'additional' economic value exists. However, the incidence may change, as the initial transport benefits may accrue to different people from those who receive the final economic benefits.
25 In such cases, a high-quality assessment of the transport and environmental costs and benefits will be the best practical approach to assessing the value of the overall economic effects. If the estimated transport costs and benefits are complete, and conditions in the economy are of all-round perfect competition, it will not be possible to demonstrate credible proof that there are additional benefits from wider economic effects.
26 Having clarified the basis of the conventional assumptions, we now move to a major part of our work, which has been the identification and analysis of three important general cases where the calculation of transport costs and benefits will not give the full economic impact. These relate to the completeness of the transport appraisal itself, the existence of imperfections in the economy, and the spatial incidence of impacts.
Completeness of the Transport Appraisal 27 First, the logical identity of the value of transport and economic impacts will not apply if the transport assessment is itself significantly incomplete, either in its calculation of the transport effects or in its conversion of those effects into money values.
28 The calculation of the transport effects needs to take account of all sources of transport costs, and all the important direct and indirect behavioural responses of individuals and firms, in the short and long run, to changes in those costs. This is necessary in order to make an accurate assessment of the resulting pattern and conditions of travel and environmental effects. These conditions are not usually fulfilled: in practice, simplified assumptions are used which leave out some important responses.
29 We therefore make recommendations on the importance of improving conventional appraisal methods, with a special focus on the modelling and forecasting of freight movement and travel for business purposes whose connection with economic activity is more direct. We also comment on improvements in the treatment of travel time and reliability. Calculation of the transport impacts will need improved treatment of the patterns of behavioural responses of individual travellers and of companies (such as structural changes in land-use, production and employment) since these may themselves have further impacts on the volume and pattern of traffic, and the resulting costs.
30 Even if the transport effects are fully estimated, the identity of their value with the final economic value can then only apply if all those transport impacts are correctly expressed in terms of their money values. This condition is also not usually met, and is not in prospect. Money values are attributed only to some of the known transport impacts. In particular, conventional transport appraisal will usually describe the physical impacts of environmental effects, but not their economic costs. Similarly, the effects of transport changes on land-use -

Transport and the economy: full report (SACTRA)
11
when they are systematically estimated at all, which is rare - are not expressed as user benefits in money terms.
31 We do not make further recommendations about the money valuation of environmental impacts, beyond those discussed in the Committee's 1992 report, but we stress that environmental costs represent real economic resources even when their money values are not calculated: from this point of view, the description of physical impacts in a conventional environmental appraisal carries the implication of economic impacts. Therefore the conventionally calculated transport net present value alone, because it does not include environmental costs, can only provide an unbiased measure of the value of the final economic impact in the case where there are no environmental impacts, either positive or negative.
Imperfections in the Economy 32 Secondly, real economies may not be perfectly competitive. We have considered two main classes of imperfection, both of which are marked by a difference between the prices charged, and the real economic value of the resources used. These imperfections are:
• price levels for goods and services which differ from efficient resource costs if there are distortions caused by imperfectly competitive product, labour or other markets, subsidies and taxes; and
• external costs, such as congestion and environmental damage, both in the transport sector and from economic activities in general, which have not been included in the price charged.
33 If these imperfections exist, analysis demonstrates that the value of initial 'transport' impacts will not be the same as the value of final 'economic' impacts. In that case, even the most complete conventional appraisal method that could, theoretically, be devised (which we have called a 'fully-specified' cost benefit analysis) would still leave out some wider economic impacts. These are the circumstances where claims for additional economic impacts, with a value which is not captured in the calculation of direct transport benefits and costs, may be valid. Thus even if the uncharged cost of congestion, say, is included in the conventional assessment of transport benefits, it will still be necessary to make further allowance for the effects such imperfections have on the operation of the economy as a whole.
34 A key conclusion of our work is that these additional economic impacts, over and above the value of direct transport impacts, may be either positive or negative, depending on whether prices are higher or lower than marginal social costs, which in turn depends on the combined effect of divergences between price and marginal cost of output, taxes and subsidies, and uncharged external costs. Therefore there will be some conditions where including wider economic impacts would lead to an increase in the value for money of a transport improvement, compared with a conventional appraisal, and other conditions where including these wider impacts will lead to a reduction in the value for money.
35 For example, if local prices are in general too high due to monopoly power, then a transport improvement, if it successfully opened the area to external competition, could lead to additional benefits for the economy. Conversely, if transport prices are currently too low due to uncharged congestion or environmental effects, then a transport improvement could lead to additional costs for the economy.
36 These two examples illustrate a potential effect of prices which are too high in the transport-using sector, or too low in the transport sector, but these are not the only conditions which could apply. We have identified at least eight different hypothetical conditions, which

Transport and the economy: full report (SACTRA)
12
are defined by different combinations of price imperfections in the transport-using and transport-providing sectors. None of these cases could be ruled out on grounds of logic or inherent implausibility, so we searched for empirical evidence on the likely occurrence of each of the cases.
37 Evidence does exist that it is quite common for prices to be higher than marginal private costs of production in many sectors of the economy, but lower in a few subsidised sectors. There is also much evidence about the existence of external costs of transport, and some other industries, and in some cases of their values. This establishes that such departures from perfectly competitive conditions are real. But some of these effects lead to prices which are lower than marginal social costs, and others lead to prices which are higher. At present we have not found evidence of their combined effect on the relationship between prices and full social marginal costs. Therefore we cannot assess the relative incidence of transport projects sitting within each of these cases. At present there is no basis for judging whether the positive cases (ie, where inclusion of wider economic effects would increase the net benefits) are more or less frequent than the negative cases (ie, where inclusion would reduce the net benefits).
38 For this reason, assessment of the economic impacts would have to be calculated for each case, based on the specific conditions in sectors (or economic activities) in areas affected. The calculation would depend on assessment of the incidence and magnitude of imperfect competition and uncharged external costs, in both transport-using and transport-providing sectors.
39 This assessment will determine whether the usual perfect competition assumptions are, in each case, valid, or whether allowance for wider economic impacts needs to be made, and - if so - whether these impacts will increase, or reduce, the value for money of a transport improvement.
Spatial Distribution Effects 40 Thirdly, the direct transport effects are often assessed, for practical reasons, only for a defined area in the neighbourhood of the transport improvement. Studies in economic geography confirm that there is no guarantee that transport improvements will benefit the local or regional economy at only one end of the route - roads operate in two directions, and in some circumstances the benefits will accrue to other, competing, regions. Thus in the important case discussed above where monopoly prices in a sector may be reduced by competition from outside, some benefits, such as increased employment, may accrue to the distant competitors rather than the local producers. Assessment of whether economic impacts will actually benefit the intended target area will need to consider impacts outside the immediate neighbourhood. This is the case whether or not imperfect competition applies. Therefore greater attention should be paid to the question of where the impacts will occur, and on whom they will fall.
41 This analysis highlights the importance of considering the 'winners and the losers' separately, in addition to the usual procedure of adding them all together into an overall impact. This is particularly important if it is indeed the case that the initial transport impacts will be converted into different effects on the economy, since the initial and final beneficiaries of the intervention may be quite different: the initial winners may end up losers. It follows that where transport interventions are expected, or intended, to have economic impacts in any particular area, there should also be consideration of the impacts on other competing areas as an integral part of the appraisal.
Transport and the economy: full report (SACTRA)
13
Recommendations for Appraisal
42 In practice, the Department has to deal with a wide variety of transport projects and policies, and in all of these - whether or not there are wider economic consequences - a high quality assessment of the transport and environmental costs and benefits remains central to the appraisal process. Because any wider economic effects may then go in unintended as well as intended directions, and may accrue to other than the intended area, we consider it important that some degree of formal consideration of these effects should be applied to all substantial projects, policies and interventions (whether road or rail investment projects, traffic management schemes or traffic reducing strategies), not only to those whose main declared intention is to promote regeneration.
43 Our recommendations for doing so are as follows:
• We propose a new formal procedure, early in the process of appraising all important transport projects and policy initiatives, requiring consideration of the rationale for the intervention and initial consideration of whether the relevant prices, in the transport-using and transport-providing sectors, are likely to be greater or lower than full marginal social costs.
• A wider economic impact assessment should then be carried out in all cases, though the level of detail warranted will depend on the results of the initial consideration. The assessment would include:
- any additional effects after taking account of the actual relationship between prices and full marginal social costs in the transport-using and transport-providing sectors; and - the incidence (spatial, sectoral and social) of estimated gains and losses in economic activity.
• Our broad conclusion is that the conventional social cost benefit procedures need to be improved if they are to do full justice to the direct transport behavioural responses and choices, let alone the complex effects of these on the economy. In all cases therefore we recommend improvements to current procedures to bring them closer to a 'fully specified' conventional cost benefit analysis. These improvements will include special attention to the short, medium and long term effects of projects and policy interventions on vehicle ownership, frequency and structure of travel, and land use, for passenger and freight movement.
• We suggest a standard 'Economic Impact Report', which would bring these strands of work together into an overall statement to be applied to all major transport projects and interventions, derived from the form of analysis described here, including explicit treatment of any expected structural changes in production, service, resource and labour markets, and explanation of the mechanisms expected to bring these about. It is important that this Report should include estimates of the patterns of changes in economic activity and jobs between areas and sectors, so that not only are the winners identified but also the losers.
44 We recognise that some of the proposed improvements represent relatively easy changes to present practice, based on existing knowledge, while others will require new research, or more fundamental changes to current models. Therefore our recommendations envisage a staged programme of improvements.
Concluding Comments
45 A large part of our investigation has been concerned with the economic impact of transport initiatives in the context where prices are not, in general, set equal to full internal
Transport and the economy: full report (SACTRA)
14
and external marginal costs. If they were, there would in principle be a positive impact on the economic effectiveness of all other transport interventions. This is because the volume and pattern of traffic would be altered to different, more economically efficient levels: this would provide the context, and in some cases the funds, to enable a new, better-judged, balance of infrastructure investment for the various modes and more efficient management of the systems we already have.
46 It is because such optimal pricing frequently does not apply, that assessment of the price conditions is the critical step which can allow appraisal to identify the conditions in which improvements may assist the promotion of economic growth. And the same assessment also enables identification of conditions where traffic may be reduced without harming the economy (and, indeed, potentially benefiting it) if done by pricing mechanisms which restore the relationship between price and marginal cost, or by well-targeted non-price instruments.
47 We conclude that there is scope for carefully judged policies which help to decouple the rate of traffic growth from the rate of economic growth, thereby reducing the environmental and congestion costs of traffic and also - to some extent - assisting in delivering the benefits of economic growth. Such policies include pricing, management and investment initiatives, in a balance which will vary according to the specific circumstances of each intervention. Appraising each case requires improved assessment of the conventional transport and environmental impacts, together with a more systematic consideration of the impacts on the wider economy.
Acknowledgements
48 The Committee gratefully acknowledges the support it has received from its Secretariat, especially Rachel Chandler, other DETR officials, representatives from other relevant Government departments, experts who have provided theoretical and practical advice commissioned by the Committee, and the many individuals and institutions who submitted written and spoken evidence.

Transport and the economy: full report (SACTRA)
15
Chapter 1 - Introduction 1.01 This chapter introduces the report by describing our remit, and the evolving policy context within which we have carried out our work. It explains how we set about our work; and how we have chosen to interpret our terms of reference. Finally, it describes the structure of the report.
Terms of Reference
1.02 This SACTRA enquiry began in the autumn of 1996 under terms of reference given to us by the Secretary of State for Transport in the previous Government. The full terms of reference, and our membership, can be found in Appendix A.
1.03 Our terms of reference were endorsed by the present Government, which took office in May 1997. In addition we were invited to contribute to the wide ranging review of transport policy, which the Deputy Prime Minister initiated in the summer of 1997 by providing an interim report by the end of that year. This entailed a slight extension to our remit.
1.04 Our initial terms of reference can be simplified into four main strands:
• What is the nature and significance of the relationship between transport provision and economic growth? To what extent does transport provision affect economic growth, and to what extent is it in turn shaped by economic growth? What are the main factors underlying the links between transport provision and economic growth? What are the implications for economic competitiveness?
• Is there scope to reduce the transport 'intensity' of the economy? Insofar as growth in transport provision and traffic has appeared in the past closely correlated to the growth in economic activity, is it feasible to reduce or even prevent the growth of road traffic in particular, without reducing the rate of growth in economic activity?
• What are the implications for the appraisal of individual transport schemes - both of which seek to meet the demand for movement and of those which seek to reduce road traffic growth? Specifically, does the method of cost benefit analysis conventionally applied to trunk road schemes omit significant elements of the relationship between transport schemes and economic activity?
• What recommendations follow from our analysis of conventional transport appraisal for the Department's procedures and practice?
1.05 The terms of our remit indicate a primary focus of interest on how transport projects and policies, including individual transport schemes, affect the national (ie, UK) economy. They do, however, also ask us to consider what can be said in general about regional and local impacts. The local dimension is of particular interest to the present Government, which asked for our advice on how individual road schemes might contribute to regeneration objectives, and how this might be captured in appraisal.
1.06 The terms of reference raised a number of issues of interpretation and posed a number of conceptual problems. We explain later in this chapter our approach to some of these issues.
Method of Working
1.07 We have carried out our investigation in a similar fashion to previous SACTRA enquiries. We started by addressing conceptual issues and issues of interpretation raised by

Transport and the economy: full report (SACTRA)
16
the remit, by familiarising ourselves with some of the key literature and by obtaining background information from the Department. This enabled us to establish the key questions to be answered, and the core concepts to be defined. At the same time, our Secretariat assembled an extensive library of the literature relevant to the remit.
1.08 We decided to consult a wide range of interested parties at an early stage in our deliberations, that is, when we had identified the main issues, but before we had arrived at tentative answers. We issued our consultation paper in March 1997. Over 130 respondents from the academic community in Britain and abroad, transport planning experts, business and economic development organisations, transport providers, environmental bodies, local government, Government departments and the general public replied.
1.09 When the new Government launched their consultation on transport policy, we made available to them, with our consultees' agreement, the full responses to our own consultation exercise. Our account in Chapter 2 of the state of the transport debate when we started work draws largely on the outcome of the consultation exercise.
1.10 As well as issuing the consultation paper, we took oral evidence from a number of researchers and academics who have specialised in some of the less fully researched areas of our remit. We went on to commission a number of research reviews and some original research, and have subjected these to peer review. The reports of these research projects are published in parallel with this report . Details of the research projects and the related consultations are given in Appendix B.
Interim Report
1.11 We submitted our interim report to the Department in December 1997. In addition to making a contribution to the Government's policy review processes, this gave us the chance to make public the lines of our thinking at that time. The report focused on two main issues: the scope for economically beneficial traffic reduction measures and how the regeneration effects of road projects might be assessed. It also indicated the stage we had reached in our thinking about the significance of linkages between transport investment and economic growth, and the circumstances in which there could be additional effects beyond those included in conventional cost benefit analysis.
1.12 Nothing in the reactions to that document led us to believe that we were on the wrong track in conceptual terms, though there was agreement that converting conceptual thinking into practical improvements in appraisal would be a considerable challenge. Some observations in our interim report were sensationalised in the media and used in an inappropriately black and white way by protagonists in the 'roads good/roads bad' debate. As we show in this final report, the nature of the relationships between transport and the economy is complex and highly dependent on context. The subject does not readily lend itself to the sound-bite. We have taken the opportunity in this final report to define terms more fully than was possible in the interim report and have attempted to make our findings as proof against misinterpretation as possible.
New Policy Context
1.13 The publication in the summer of 1998 of the Government's Integrated Transport Policy White Paper (DETR, 1998a) and associated documents provides a new context for transport policy and appraisal; and hence for this report. We draw attention to four aspects of this new context.
Transport and the economy: full report (SACTRA)
17
1.14 First, the new transport policy is to be integrated and multi-modal. As our name implies, SACTRA's core task in the past has been to advise on the appraisal of trunk road infrastructure schemes. Our present remit, particularly as regards our understanding of the linkages between transport and the economy, is explicitly not restricted to trunk roads, or to roads, or to infrastructure investment, and we have therefore aimed at a general approach which treats even-handedly all types of transport investment or policy initiative, for all modes.
1.15 This is consistent with the suggestion of some consultees who have advocated the desirability of a 'level playing field' between road and rail investment appraisal. However, we have not been able to pursue this question by considering the practical implications for the different institutional arrangements that exist between the funding of road and rail investment. We also recognise the increasing saliance of air transport to any truly comprehensive account of the issues raised by our remit. It has been beyond the resources of this Committee to cover air transport in the depth required to do the subject justice. But our approach should be applicable in principle to other modes, and we hope that policy makers and specialists in these sectors will be able to extend our findings.
1.16 Second, there is now a New Approach to Transport Appraisal (NATA &- DETR 1998b), which enables the impacts of road schemes on each of the Government's objectives of environment, economy, safety, accessibility and integration to be assessed on a consistent basis and in a readily understood form. The NATA is currently being developed for use in a multi-modal appraisal context. Our recommendations for appraisal are designed to build on and sit within that framework.
1.17 Third, the challenge of reducing road traffic growth without damaging prospects for economic growth or competitiveness is now at the heart of transport policy. We respond to this in a number of ways:
• by examining the theoretical conditions under which it would be appropriate to do this and reviewing such evidence as exists about the likely economic impact of reducing traffic (Chapter 7);
• by highlighting the relevance of cost benefit analysis to traffic reduction measures and framing our recommendations for improved appraisal with such measures in mind (Chapter 10); and
• by framing a general account of the linkages between transport changes and the economy which is equally applicable, whether the transport measure in question is designed to increase capacity or to restrain traffic demand.
1.18 Fourth, the new transport policy gives more emphasis to local and regional decision making. Local authorities are required to prepare local transport plans. Existing regional planning guidance for English regions will be supplemented by regional transport strategies. The Government's broader emphasis on devolution means that more bodies will be involved in transport decision making: the Scottish Parliament, the Welsh Assembly, regional chambers/assemblies of local authorities and Regional Development Agencies in England, and the Mayor and new Greater London Authority in London.
1.19 All this means that there will be many more fora and levels where transport policy- making and appraisal will be conducted. Hence we think there is a greater need for a clear understanding of the relationship between transport and the economy; and a common basis
Transport and the economy: full report (SACTRA)
18
for appraising the impact of transport policies, programmes and schemes on the regional and national economy.
Conceptual Issues
1.20 An issue which is central to the report concerns the terms in which economic success is conceived, defined and measured. Our terms of reference indicate a primary concern with economic growth, which is defined for practical purposes as the rate of increase in the nation's Gross Domestic Product (GDP). We are also asked to identify impacts on competitiveness. We are then asked to consider how these impacts can be reflected in appraisal.
1.21 However, cost benefit analysis, which has been the corner stone of appraisal for decades, deals in a different yardstick of economic success - national economic welfare. Unlike GDP, economic welfare includes valuations of costs and benefits to which no price is attached or where no monetary transaction is involved, eg, changes in leisure time and time spent doing work around the home. In the context of transport, welfare costs and benefits include time savings on leisure journeys, which do not form part of GDP. The differences between these various terms are discussed in more detail in Chapter 3.
1.22 We have had to decide which is the more appropriate measure for the purpose of our remit. If we were to interpret our terms of reference narrowly, we would focus on measured GDP. This might lead us, as well as identifying any benefits which should be added to cost benefit analysis, to identify welfare benefits included within CBA which should be omitted for the purpose of measuring impacts on the economy, on the grounds that they do not score towards GDP. It seems that Government has interests on the impacts of transport policy on both GDP and on economic welfare. In its response to our initial consultation paper, the Treasury argued that GDP should not be regarded as, conceptually, a better yardstick of economic success than the broader definition captured by economic welfare: however, GDP is used for practical reasons because it can be measured.
1.23 We have in general adopted the Treasury view, particularly in our approach to appraisal. In discussing how transport changes may affect the level and rate of growth of the economy, and the relation of transport to productivity and competitiveness, it is common practice to distinguish between transport/ travel costs which feed directly into the costs of production - freight and travel in the course of business - and other travel costs which only indirectly, if at all, affects the costs of producing goods and services. The question of whether changes in costs of various categories of non-business travel can have any wider economic impacts beyond the conventional welfare benefits, is one we address in Chapter 3. The point to make here is that even if the answer to that question is 'no', that answer would not, in our view, justify excluding the conventional welfare benefits from savings in non-business travel times from the measure of total economic benefits.
1.24 The position taken in the preceding paragraph is inconsistent with the line of thought which draws a clear distinction between productive and non-productive, or between essential and non-essential, traffic. In extreme cases, blanket labels are attached to particular modes of transport, as in freight = productive traffic = essential traffic, unproductive traffic = car traffic = inessential traffic. This crude analysis is unhelpful as a basis for rational policy making. There are, however, real points underlying these crude distinctions. We have sought to tease these out.

Transport and the economy: full report (SACTRA)
19
1.25 First, there is already a method in cost benefit analysis for recognising the different values attached to different types of travel. Most of the transport benefits come in the form of time savings to transport users and these time savings are, in principle, related to what different categories of users have said, or shown by their behaviour, that they would be prepared to pay to save travel time. There can be discussion about the adequacy and the detail of the estimates in current use (covered in Chapter 10), but that does not affect the principle.
1.26 At present, typically some 20% of the total time expected to be saved from a road improvement is by people in working time. But given the higher value ascribed to working time, the monetary value of benefits from time estimated to be saved for a typical scheme splits about 50/50 in each category. The difference between these figures indicates the extent to which the existing appraisal system recognises a distinction between the value of business time saved and leisure time saved.
1.27 It can, of course, be argued that the value attached to journeys should be those of society, not those of transport users. However, such an approach would have implications for the valuation of journeys in the course of production, as well as of consumption, and it would be well nigh impossible to get agreement on how society as a whole valued particular types of journey. To the extent that travel in pursuit of the private benefit of producers or consumers imposes costs on the rest of society, cost benefit analysis allows in principle for these to be taken into account also.
1.28 Second, the policy interest in distinguishing between journeys of greater or lesser value has grown with the increasing emphasis on the need to reduce road traffic growth without avoidable damage to economic growth. This puts the spotlight on whether some categories of traffic can be more readily justified as the target for reduction than others. As Chapter 3 and Chapter 7 point out, economic theory explains that the first best solution to this issue is to find a way of changing the costs faced by travellers or transporters so that they match as nearly as possible the full marginal costs, including the costs imposed on society in the form of environmental damage and congestion.
1.29 There may be practical or social policy reasons why this 'first best' position cannot be achieved in practice, so that some compromise solution may be necessary. The reason why what might be called the market solution is superior to, say, regulation in terms of economic efficiency is that the pricing signal, by definition, squeezes out the journeys which are of lower value and allows the more highly valued journeys to continue. It also raises revenue which could be spent beneficially, for example, either by compensating losers created by the measure to reduce traffic, or by reducing distortionary taxes in the economy as a whole. As we argue in Chapter 7, however, robust cost benefit analysis of traffic reduction measures, as with all transport interventions, is essential to establishing whether a welfare gain will follow from their implementation.
Some General Observations
1.30 We have found that the state of the art in developing a modern economic analysis of the relationships between transport and the economy is relatively underdeveloped. We have not therefore been able to assume a received wisdom. What the report does, in large part, is to provide a vehicle for encouraging the practical application of new approaches. The development of this new economic analysis is complex, since it seeks to deal with a world containing space and time and where other conventional simplifying assumptions of economists (eg, of perfect competition) typically do not hold.

Transport and the economy: full report (SACTRA)
20
1.31 This presents the dilemma that these conceptual and analytical developments in theory take our understanding of the processes at work beyond what can in practice be incorporated fully in practical models and appraisal systems, given modelling and data limitations. We consider that developing an improved understanding of what is known, and what is not known, about the links between transport and the economy has value in itself. We indicate how far we think it feasible to adjust appraisal systems in the short term and offer advice on priorities for further research and development.
1.32 It is worth repeating the point about the complex nature of the linkages between transport and the economy. At various points in the report, we come back to the same issue. Almost any statement about the nature and significance of these relationships needs to carry the caveat that it is dependent on the context within which transport interventions take place - for example, on the state of economic development, on the degree of integration of markets, on the extent to which there is already a well developed transport infrastructure, on the strength of competitive forces in the areas affected by the transport change, on the capacity of areas targeted for regeneration to respond to the opportunities and threats of wider markets, on the incidence of congestion. One conclusion to draw from this is to beware of sweeping generalisations about transport and the economy. Another is to reinforce the importance of subjecting proposed interventions to context-specific appraisal. Both of these conclusions apply as much to restraint policies as to capacity enhancements.
Structure of the Report
1.33 There are a number of different audiences for this report and we have structured it in a way which we hope will meet their differing needs. Much of the work we were asked to do is for academic or professional audiences, both within and outside Government. For them, we have provided a degree of technical detail, some of which may not be easily digestible for the lay reader. We have structured the relevant chapters so that the lay reader with a reasonable grasp of basic economics, or a basic familiarity with appraisal, will be able to follow the thread of the argument, with the more technical detail in boxes within the text, where possible. For the reader with limited time to spare, the summary report gives a broad picture of the ground we have covered together with our conclusions and recommendations.
1.34 In this first part of the report, having outlined the context and our conceptual approach in this chapter, we go on in Chapter 2 to summarise the state of the debate about transport and the economy as it appeared at the outset of our work and also to provide a factual background to the report. As we mentioned earlier, this draws very largely on the arguments submitted to us in the consultation process.
1.35 In Part 2, we provide an economic analysis of the role of transport and how changes in the transport system affect the economy. Chapter 3 introduces and defines the main terms and concepts on which we base our analysis. We then introduce a less-technical overview of the following two chapters, whose content depends heavily on the approach and analytical framework of economic theory.
1.36 In Chapter 4, we present current thinking on the causes of economic growth and discuss the potential role of transport in that process. We identify all the main relationships in this process, from the direct effects on transport users to the various second round and wider effects to which these may give rise, for example through property or labour markets. We consider how these relationships may affect the level and growth of the economy. We discuss the role of imperfect competition in the growth 'story' and report the conclusions we draw
Transport and the economy: full report (SACTRA)
21
from some original research we commissioned on this topic, building on insights from the economics of trade. We draw out conclusions for further research and for transport appraisal.
1.37 In Chapter 5, we consider the linkages which can help explain how transport has an impact on the economy. We consider the incidence of impacts in respect of different regions and localities; how changes in the structure of the economy lead to changes in both production and transport logistics and hence to different levels of transport output for a given level of GDP output; and how transport changes may be filtered through changes in the labour and land/property markets. This chapter also draws conclusions for further research and appraisal.
1.38 In Part 3, we begin in Chapter 6 by considering the other side of the transport-economy relationship: how can economic activity itself shape the demand for transport. We examine the concept of transport intensity and discuss international comparisons, past trends and future projections. We examine the relative significance of income growth as distinct from changes in price as a determinant of traffic growth, considering in the latter not only changes in visible prices (eg, fuel price), but also changes in the generalised cost of travel, arising from changes in road capacity. We consider the evidence on traffic elasticities and make some recommendations for departmental practice and research.
1.39 In Chapter 7, we consider the available theoretical and empirical evidence concerning the economic impact of transport interventions with a particular focus on measures to reduce road traffic. We review the results both of analyses based on modelling of the likely effect of measures and of some empirical research, and comment on the implications for transport appraisal which arise from our review of this material.
1.40 In Part 4, we set our views on appraisal. Chapter 8 distils the findings of the earlier chapters into a set of appraisal requirements, explains the rationale for these and explains what in principle is needed to meet these requirements. Chapter 9 then describes present appraisal practice (post the 1998 White Paper) insofar as it relates to our remit. Chapter 10 discusses the practical implications of meeting the appraisal requirements in Chapter 8, and identifies areas in which there is a need to improve or review existing appraisal and modelling techniques and the empirical data which they use. The report ends with a set of recommendations (Chapter 11).
Acknowledgements
1.41 We owe a considerable debt of gratitude to all who served in our Secretariat (see Appendix A). Our thanks go in particular to our Technical Secretary, Rachel Chandler, who has given outstanding support throughout our enquiry; and to David Gott, who has done an excellent job of organising the completion of the report. We also express thanks to the many Departmental officers who gave us advice, and to everyone who contributed written and oral evidence.
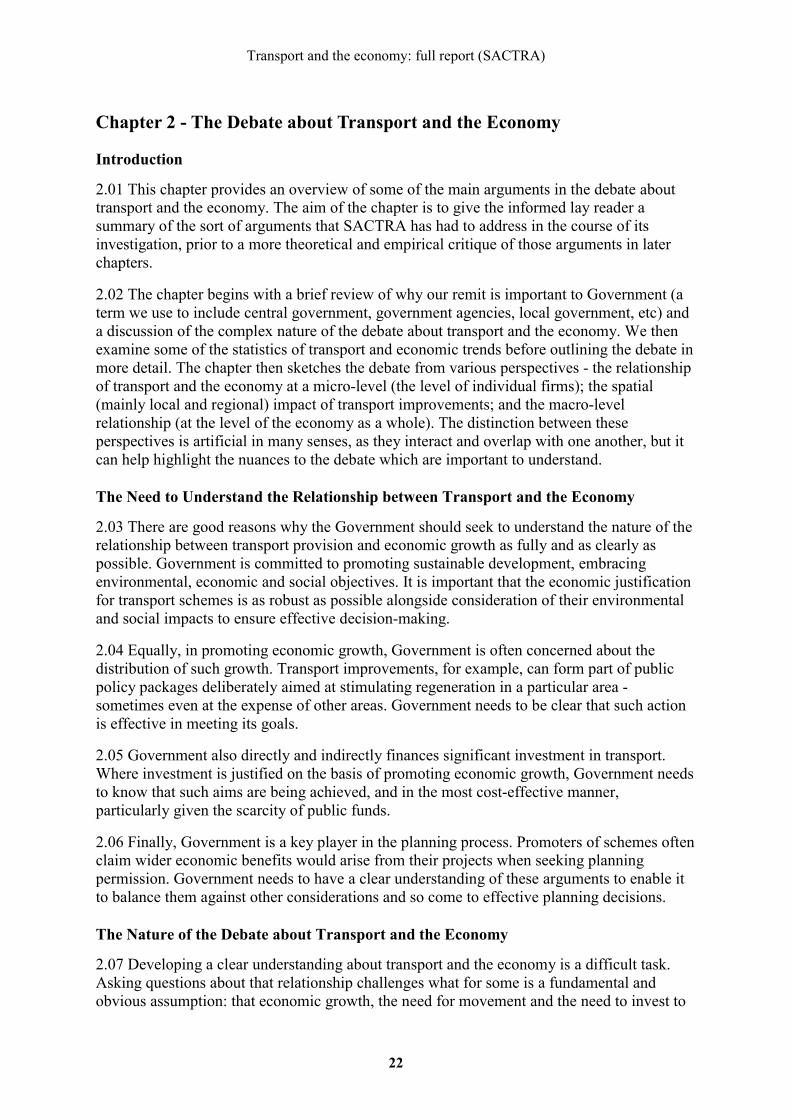
Transport and the economy: full report (SACTRA)
22
Chapter 2 - The Debate about Transport and the Economy
Introduction
2.01 This chapter provides an overview of some of the main arguments in the debate about transport and the economy. The aim of the chapter is to give the informed lay reader a summary of the sort of arguments that SACTRA has had to address in the course of its investigation, prior to a more theoretical and empirical critique of those arguments in later chapters.
2.02 The chapter begins with a brief review of why our remit is important to Government (a term we use to include central government, government agencies, local government, etc) and a discussion of the complex nature of the debate about transport and the economy. We then examine some of the statistics of transport and economic trends before outlining the debate in more detail. The chapter then sketches the debate from various perspectives - the relationship of transport and the economy at a micro-level (the level of individual firms); the spatial (mainly local and regional) impact of transport improvements; and the macro-level relationship (at the level of the economy as a whole). The distinction between these perspectives is artificial in many senses, as they interact and overlap with one another, but it can help highlight the nuances to the debate which are important to understand.
The Need to Understand the Relationship between Transport and the Economy
2.03 There are good reasons why the Government should seek to understand the nature of the relationship between transport provision and economic growth as fully and as clearly as possible. Government is committed to promoting sustainable development, embracing environmental, economic and social objectives. It is important that the economic justification for transport schemes is as robust as possible alongside consideration of their environmental and social impacts to ensure effective decision-making.
2.04 Equally, in promoting economic growth, Government is often concerned about the distribution of such growth. Transport improvements, for example, can form part of public policy packages deliberately aimed at stimulating regeneration in a particular area - sometimes even at the expense of other areas. Government needs to be clear that such action is effective in meeting its goals.
2.05 Government also directly and indirectly finances significant investment in transport. Where investment is justified on the basis of promoting economic growth, Government needs to know that such aims are being achieved, and in the most cost-effective manner, particularly given the scarcity of public funds.
2.06 Finally, Government is a key player in the planning process. Promoters of schemes often claim wider economic benefits would arise from their projects when seeking planning permission. Government needs to have a clear understanding of these arguments to enable it to balance them against other considerations and so come to effective planning decisions.
The Nature of the Debate about Transport and the Economy
2.07 Developing a clear understanding about transport and the economy is a difficult task. Asking questions about that relationship challenges what for some is a fundamental and obvious assumption: that economic growth, the need for movement and the need to invest to

Transport and the economy: full report (SACTRA)
23
facilitate that movement go hand in hand. The result has been an often quite polarised debate, in both academic and non-academic circles.
2.08 Business argues that an efficient transport network is vital to a strong economy - locally, regionally and nationally - by providing high quality access to labour, suppliers and customers. Business has consistently argued that substantial investment is needed to improve the existing network, focusing mainly on road transport, but also on heavy rail, urban public transport and airports.
2.09 Other commentators argue that there is scant evidence for a causal link between transport improvements and economic growth. Some claim that a transport scheme can in fact "suck out" economic activity from an area, rather than attract it. Concern about the environmental impacts of transport and the need to balance competing claims on the public purse have also raised questions about the validity of calls for greater transport investment.
2.10 Nor is the debate simply a question of whether there are net positive or negative economic impacts arising from transport improvements. The question of size of effect is also important. Some commentators query whether the journey time savings generated, for example, by road improvements, provide anything more than marginal economic benefit. Others argue that transport improvements, for example, help enable firms to re-organise their operations, yielding significant benefits beyond those conventionally identified in investment appraisal.
2.11 The debate about transport and the economy is frequently made even less clear by a confusion of terms. The relationship between the two is sometimes taken to embrace different things: transport investment, transport infrastructure, transport improvement (however achieved - ie, by infrastructure development or through other policies), road traffic, etc. Even the term "economic growth" can mean different things to different people and is often confused with loosely defined discussions of competitiveness. Issues surrounding the definition of terms are addressed in Chapter 3.
2.12 A further complication is the difficulty in isolating the effect of transport provision on economic activity, be it at the national, regional or local level. The difficulty with, for example, before and after studies of transport projects is that we simply do not know what might have happened to the economy if a scheme had not gone ahead and the money had been put to some other use instead. Equally, there are many factors which can be
Transport and Economic Trends
2.13 The debate about transport and the economy takes place against the background of significant trends in both. Figures 2.1 to 2.7 and Tables 2.1 to 2.3 seek to give some indication of how the economy and the demand for transport have changed over time.
2.14 The last 40 years have seen growth in both the national economy, as measured by GDP, and domestic traffic. Figure 2.1 shows that passenger traffic across all modes has grown at a faster rate than the economy as a whole, while freight traffic has grown at a slightly slower rate. This embraces a significantly greater increase in LGV traffic than HGV traffic (as borne out by the billion vehicle kilometres in Table 9.4). Figure 2.2 indicates that this experience is broadly one that the UK has shared with other European countries.
Figure 2.1 Transport trends against GDP: UK 1953 - 1997 Source: Transport Statistics Great Britain 1998, ONS

Transport and the economy: full report (SACTRA)
24
2.15 Cars (together with vans and taxis) have accounted for an increasing share of UK passenger kilometres over the last 40 years, plateauing at about 86% of passenger travel during the 1990s (Figure 2.3). Figure 2.4 shows that, while the strong growth in passenger kilometres travelled by car has also occurred in recent years in many developed economies, some countries have also experienced significant growth in passenger kilometres travelled on some forms of public transport (eg Netherlands, Switzerland, Italy and USA). However, not all have experienced the latter trend, and a significant contraction in public transport passenger kilometres travelled has occurred in some countries, particularly in Germany.
2.16 Tables 2.1 to 2.3 provide a more detailed snapshot of the components of passenger travel in this country. Table 2.1 shows that the distance travelled per year by the average person has increased by more than 40% over the last twenty years to 10,726 kilometres. Looking at personal travel across all modes, the three most significant reasons for travelling are shopping, commuting and visiting friends at home, accounting for 21%, 15% and 13% respectively of journeys per person per year (Table 2.2). In terms of the distance covered by the average person, however, these journey purposes account for 17%, 20% and 13% respectively of the total (Table 2.3).
Figure 2.2: Transport Trends Against GDP: EU 1970-1996 Source: Eurostat
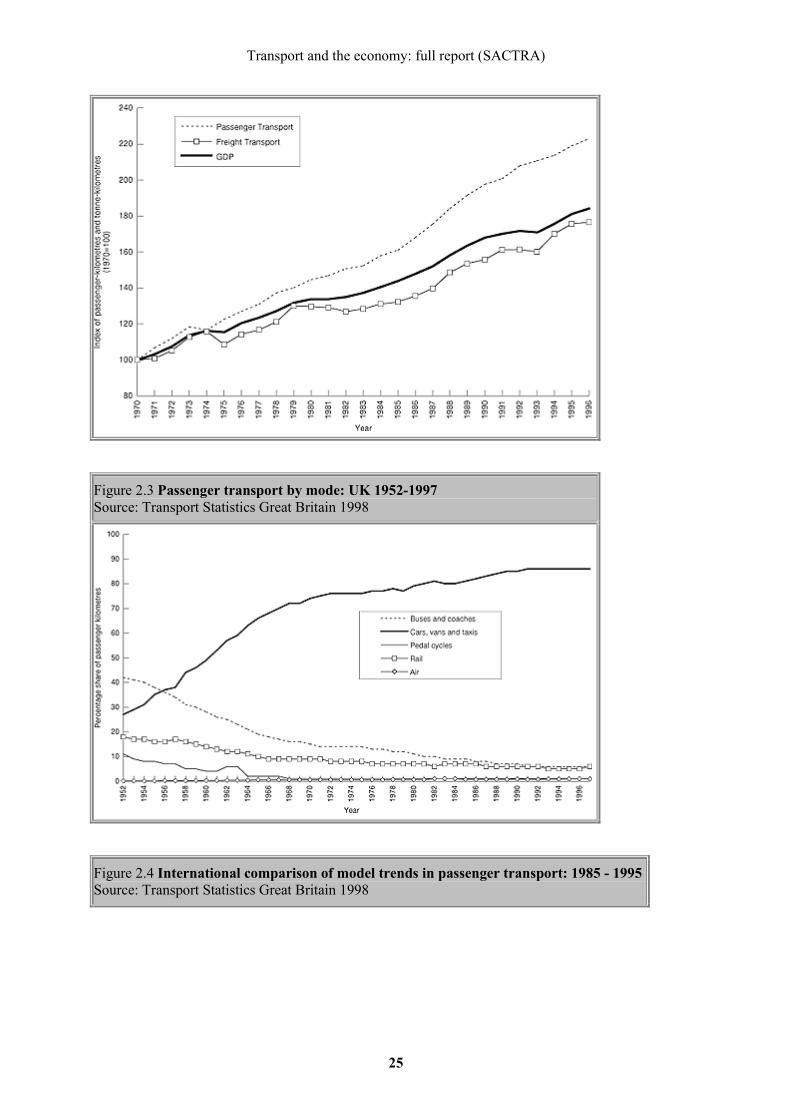
Transport and the economy: full report (SACTRA)
25
Figure 2.3 Passenger transport by mode: UK 1952-1997 Source: Transport Statistics Great Britain 1998
Figure 2.4 International comparison of model trends in passenger transport: 1985 - 1995 Source: Transport Statistics Great Britain 1998
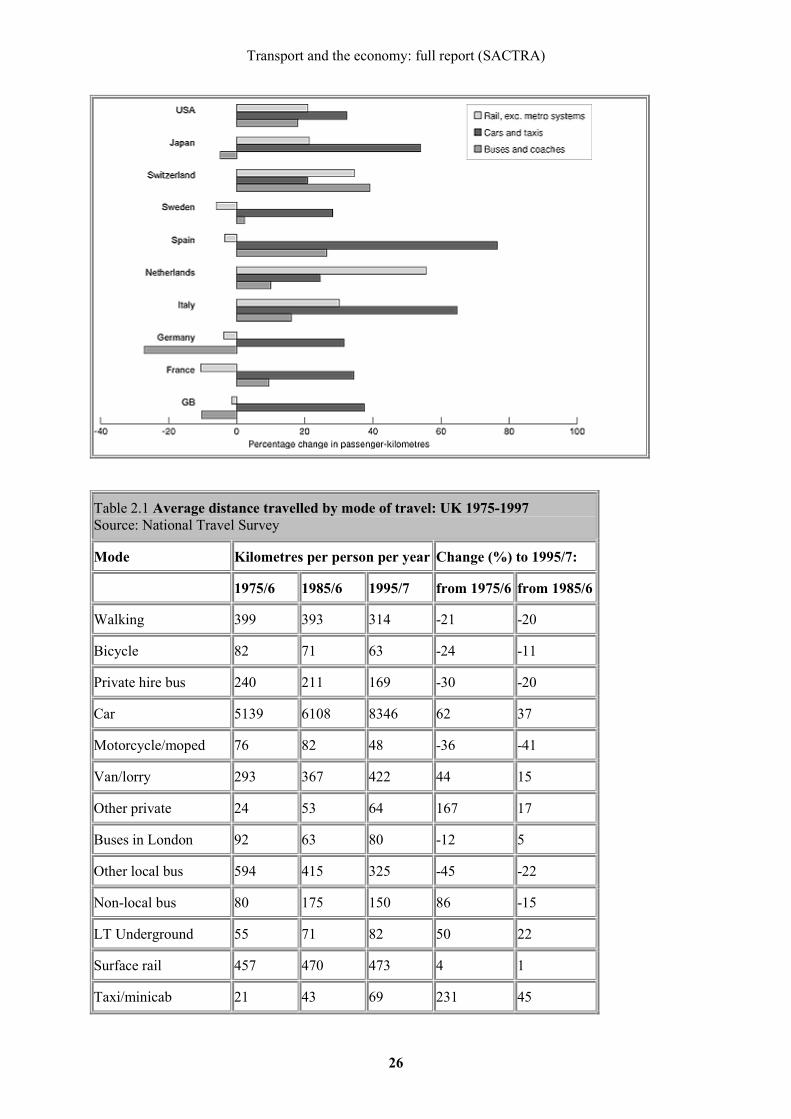
Transport and the economy: full report (SACTRA)
26
Table 2.1 Average distance travelled by mode of travel: UK 1975-1997 Source: National Travel Survey
Mode Kilometres per person per year Change (%) to 1995/7:
1975/6 1985/6 1995/7 from 1975/6 from 1985/6
Walking 399 393 314 -21 -20
Bicycle 82 71 63 -24 -11
Private hire bus 240 211 169 -30 -20
Car 5139 6108 8346 62 37
Motorcycle/moped 76 82 48 -36 -41
Van/lorry 293 367 422 44 15
Other private 24 53 64 167 17
Buses in London 92 63 80 -12 5
Other local bus 594 415 325 -45 -22
Non-local bus 80 175 150 86 -15
LT Underground 55 71 82 50 22
Surface rail 457 470 473 4 1
Taxi/minicab 21 43 69 231 45

Transport and the economy: full report (SACTRA)
27
"Other public, inc. air" 27 35 121 341 180
All modes 7578 8555 10726 42 25
Table 2.2 Journeys per person per year by main mode and journey purpose : UK 1995/7 Source: National Travel Survey
Kilometres
Purpose Walk Bicycle Driver1 Pass-enger1
Motor-cycle Buses Tube2 Rail3 Taxi All modes
Commuting 19 6 92 20 2 12 3 5 1 162
Business 4 1 27 3 0 0 0 1 0 37
Education 31 1 3 18 0 10 0 1 1 68
Escort education 24 0 19 6 0 1 0 0 0 51
Shopping 71 2 76 48 0 20 1 1 2 222
Other escort 11 0 46 23 0 1 0 0 0 83
Other personal business 31 1 40 24 0 6 1 1 1 106
Visiting friends at home 31 2 52 45 1 6 1 1 2 141
Visiting friends elsewhere 15 0 11 13 0 1 0 0 2 44
Social/entertainment 11 1 22 21 0 3 0 0 1 62
Holidays/day trips 2 2 10 13 0 2 0 0 0 31
Other, inc. just walking 43 0 1 1 0 0 0 0 0 45
All purposes4 293 17 401 236 4 64 6 11 10 1052
1 Note: Drivers and Passengers of cars and vans 2 Note: London Transport Underground 3 Note: Surface rail 4 Note: Figures rounded to nearest whole number
Table 2.3 Journey distance per person per year by main mode and purpose : UK 1995/7 Source : National Travel Survey
Kilometres
Purpose Walk Bicycle Driver1 Pass- enger1
Motor-cycle Buses Tube2 Rail3 Taxi All modes
Commuting 23 23 1429 230 23 95 37 201 6 2108

Transport and the economy: full report (SACTRA)
28
Business 3 2 882 103 0 5 6 50 5 1146
Education 27 2 42 80 2 80 3 18 5 302
Escort Education 16 0 97 32 0 3 0 0 0 150
Shopping 63 5 616 483 3 122 6 32 6 1345
Other escort 8 0 380 214 0 10 2 5 2 624
Other personal business 24 3 375 2216 3 34 6 32 6 722
Visiting friends at home 27 6 825 785 5 61 6 68 10 1823
Visiting friends elsewhere 13 2 132 156 2 16 3 13 11 359
Social/entertainment 11 5 304 298 3 27 5 23 6 721
Holidays/day trips 3 14 391 647 10 116 2 77 6 1350
Other, inc. just walking 51 0 14 5 0 0 0 5 0 79
All purposes4 272 61 5488 3253 50 566 77 523 64 10726
1 Note: Drivers and passengers of cars and vans 2 Note: London Transport Underground 3 Note: Surface Rail 4 Note: Figures rounded to nearest whole number
2.17 In the case of freight, Figure 2.5 shows that road transport has become the predominant mode of moving goods in the UK over the last 40 years. As with passenger transport, Figure 2.6 shows that strong growth in road freight traffic has also been experienced recently in many other countries, although again some countries (eg USA, Portugal, Italy and Finland) have seen significant increases in freight traffic moved by rail. Analysis of four EU countries, highlighted in Chapter 6, indicates that, although an increase in the average length of haul was the single most important determinant of the increase in traffic, several other factors have had a significant impact in influencing patterns of freight traffic.
Figure 2.5 Domestic freight transport by mode: UK 1953-1997 Source: Transport Statistics Great Britain 1998

Transport and the economy: full report (SACTRA)
29
Figure 2.6 An international comparison of modal trends in freight transport: 1985-1995 Source: Transport Statistics Great Britain 1998
Figure 2.7 Growth in Economic sectors: UK 1957-1997 (By Gross Value Added at constant 1995 basic prices) Source: Economic Trends Annual Supplement 1998
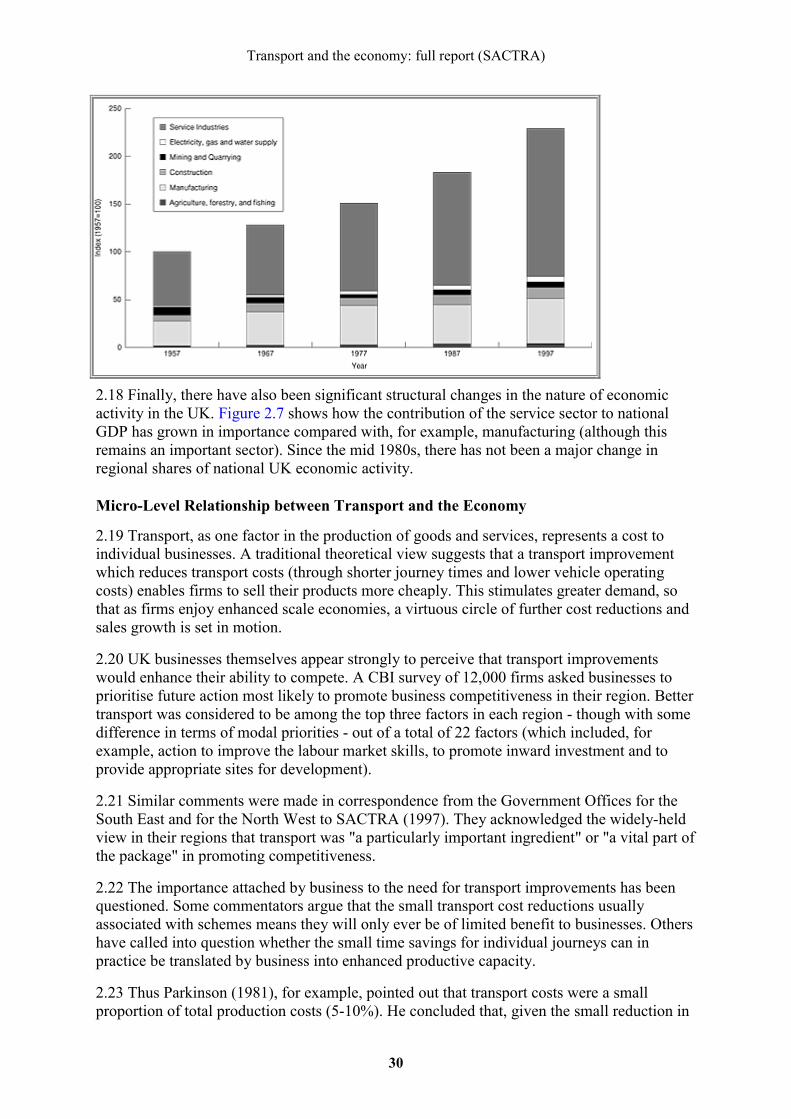
Transport and the economy: full report (SACTRA)
30
2.18 Finally, there have also been significant structural changes in the nature of economic activity in the UK. Figure 2.7 shows how the contribution of the service sector to national GDP has grown in importance compared with, for example, manufacturing (although this remains an important sector). Since the mid 1980s, there has not been a major change in regional shares of national UK economic activity.
Micro-Level Relationship between Transport and the Economy
2.19 Transport, as one factor in the production of goods and services, represents a cost to individual businesses. A traditional theoretical view suggests that a transport improvement which reduces transport costs (through shorter journey times and lower vehicle operating costs) enables firms to sell their products more cheaply. This stimulates greater demand, so that as firms enjoy enhanced scale economies, a virtuous circle of further cost reductions and sales growth is set in motion.
2.20 UK businesses themselves appear strongly to perceive that transport improvements would enhance their ability to compete. A CBI survey of 12,000 firms asked businesses to prioritise future action most likely to promote business competitiveness in their region. Better transport was considered to be among the top three factors in each region - though with some difference in terms of modal priorities - out of a total of 22 factors (which included, for example, action to improve the labour market skills, to promote inward investment and to provide appropriate sites for development).
2.21 Similar comments were made in correspondence from the Government Offices for the South East and for the North West to SACTRA (1997). They acknowledged the widely-held view in their regions that transport was "a particularly important ingredient" or "a vital part of the package" in promoting competitiveness.
2.22 The importance attached by business to the need for transport improvements has been questioned. Some commentators argue that the small transport cost reductions usually associated with schemes means they will only ever be of limited benefit to businesses. Others have called into question whether the small time savings for individual journeys can in practice be translated by business into enhanced productive capacity.
2.23 Thus Parkinson (1981), for example, pointed out that transport costs were a small proportion of total production costs (5-10%). He concluded that, given the small reduction in
Transport and the economy: full report (SACTRA)
31
transport costs typically arising from a new or improved road, it is implausible that the fall in prices that could result from this small reduction in transport costs would lead to a significant increase in GDP.
2.24 Other empirical evidence paints a somewhat different picture. An Ernst and Young study (1996) made clear that the ranges of transport costs as a proportion of total business costs, identified by Parkinson and others, masked significant variation between sectors. For some firms, transport costs can represent a major item. Figures compiled by Diamond and Spence (1989) indicate that as a percentage of operating costs, transport costs accounted for 2.6% of motor vehicle part production, 7.7% for pharmaceuticals and 12% for wholesale distribution. In other sectors, such as construction, the figures can be significantly higher. Potentially, improvements which reduce those costs may thus be of considerable benefit.
2.25 The study also reveals that even in high-value added firms, where goods transport can account for less than 1% of total business costs, those costs are nevertheless closely monitored. The implication is that firms, in a bid to remain competitive, remain keen to control and reduce costs, no matter how small. This impression is strengthened if one considers that transport costs will appear more significant to businesses when expressed as a percentage of profits. Other work by Mackie and Simon (1986), in their case study of the Humber Bridge, cites that three-quarters of the firms questioned claimed that they were able to use their savings productively.
2.26 While there remains debate about the scale of the direct benefits to businesses arising from transport improvements, attention has also focused on potentially wider, indirect micro-level benefits. In the Ernst and Young study (1996), just over 20% of firms reported that changes in their use of transport due to new or improved transport had led to wider business benefits in the form of reduced inventory costs (through reorganisation and centralisation of distribution operations), their ability to access new markets, and their increased size of labour catchment areas.
2.27 A considerable amount of work has been done, for example, by Quarmby (1989), Mackie and Tweddle (1993), and McKinnon (1995), to suggest that road improvements can have a much greater indirect impact on competitiveness by enabling firms to restructure their logistical systems. Several commentators have also identified the growing importance to business - particularly with regard to goods distribution - of schemes which improve the reliability of journey times.
2.28 Critics have, however, raised concerns about the centralisation of logistics operations made possible by, among other things, road improvements. It is argued that, by serving markets from fewer distribution centres, additional traffic is induced, thus increasing environmental externalities, such as pollution. Since the cost of these externalities is paid for by society at large, and not by the businesses responsible for causing them, the result is deemed to be economically sub-optimal. Businesses respond that improved efficiency of distribution operations has reduced fuel consumption, and consequently reduced the level of their emissions.
2.29 Another criticism sometimes voiced derives from the view that traffic generated by new road building means that any benefits to business and, indeed, other road users are transient, if not actually negative. It is argued by proponents of this view that any time savings generated by a scheme are soon lost as the new road fills with traffic and congestion returns; while at the same time the additional traffic generates greater external costs such as pollution.
Transport and the economy: full report (SACTRA)
32
2.30 In fact, SACTRA's 1994 report indicated that, in conditions of congestion, the consumer benefits of a scheme would be generally reduced by the effects of induced traffic and, in some circumstances, this could then make the net present value of the scheme negative, though this would not necessarily be the case. The Committee's analysis suggested that the more typical case would probably be to make the net consumer benefits smaller, but still positive. The environmental effects of induced traffic would, however, generally be unambiguously negative.
Spatial Issues
2.31 A key aspect of the debate about the relationship between transport and the economy are the claims made about the impact of a transport project on a local area or region. Claims can emphasise the value of transport improvements to an area - large or small - as a means of overcoming what are, in effect, barriers to trade with other areas of economic activity.
2.32 Some of these claims deal with issues of perception, such as the impression in the minds of potential inward investors about the accessibility (and so attractiveness) of particular parts of the country. A recent AA/CBI survey (1998) showed that over 70% of local authority economic development officers who responded said that the quality of transport links were an important feature in attracting investors to their areas. North Lanarkshire Council (Lawson, 1997) claims that the relative success of Lanarkshire Enterprise Zone in attracting investors compared with Clydebank Enterprise Zone can be explained by the different quality of road links serving the two areas.
2.33 These studies reflect a widespread view by promoters that schemes can overcome perceptions, especially on the part of inward investors, of distance, peripherality or disadvantage. For example, business interests have argued for a motorway-standard link beyond Exeter to serve the south west, for dualling of the A590 to serve Cumbria and for direct rail services from the Channel Tunnel to the North of England and Scotland, to overcome the perceived distance of those areas from key markets. The Government Office for the North West (1997) claimed that even peripheral considerations such as the image enhancement of an area can be "significant spin-offs" from investment in new or improved transport infrastructure.
2.34 In another piece of evidence received by SACTRA, a study by the Welsh Economy Research Unit (1997) on economic development in Merthyr suggests that improved road access to the area has been an important factor in influencing the location decisions of recent investors. The report contends that the wider economic benefits in terms of generated new income and employment are likely to outweigh the economic significance of any direct savings in transport user costs.
2.35 Removing trade barriers by improving transport links is also argued to be a key part of policies to promote economic regeneration in areas of particular poverty. These areas are characterised by under-utilisation of a range of resources, such as labour and/or land. Transport improvements are often seen as a way of 'unlocking' these resources, for example, by providing access to derelict sites or to new job opportunities for the unemployed, so contributing to the typical high-level aims of removing deprivation, and enhancing economic development and social cohesion.
2.36 Transport schemes aimed at promoting regeneration might take different forms. The Black Country Development Corporation (1997) said in its evidence to SACTRA that the direct access to 3 million square feet of industrial and commercial floor space provided by the
Transport and the economy: full report (SACTRA)
33
Black Country Spine Road was critical to its programme of regenerating previously derelict land. The Coalfields Task Force (1998), on the other hand, has stressed that there is an urgent need in coalfield communities - where levels of car ownership are low - to enhance public transport (through better bus services, shared use of a minibus, car pools or re-opening of redundant railway stations) as a way of giving people ready access to towns and employment sites.
2.37 Removing barriers to trade can also be seen as important to other, wider areas than simply blackspots of economic deprivation. Poor transport links between one region and another, it is argued, can protect uncompetitive indigenous firms, enabling them to charge prices higher than those which are efficient. Removing that effective barrier through improved links could benefit the wider regional economy by reducing prices to end consumers and producers. One manufacturer in North Wales is quoted by the Freight Transport Association (1997) as having benefited in precisely these ways due to improvements to the A55.
2.38 It is also worth noting that the need to tackle trade barriers is seen as important even in the case of those areas which are relatively strong economic performers. One of the arguments used to support the cases for Heathrow's Terminal 5 (Coopers and Lybrand, 1995) and modernising the London Underground claims that the project is an essential part of efforts to maintain London's status (economic, as well as cultural and political) as a world city. The Government Office for the South East - a region usually thought of as relatively prosperous - also emphasised (1997) that poor transport links have long been identified as a factor limiting developing in Sheppey and Hastings, which both have Assisted Area status.
2.39 However, there are alternative views about the impact of transport improvements on the economic prospects for an area. First, commentators point out that better transport by itself is highly unlikely to stimulate economic activity. The campaign group South Coast Against Road Building (SCAR) intuit this by quoting Whitelegg (1994): "Birmingham with its ample supply of motorway connections is not a conspicuous economic success and Edinburgh, with far less motorway linkage than Glasgow, has certainly not suffered economic decline in comparison with its traditional rival".
2.40 Inward investors, it is pointed out, look to a range of factors in determining the attractiveness of a location. The AA/CBI survey (1998) of local authority economic development officers indicates that issues such as the availability of suitable sites and a skilled workforce are as important, if not more so, to investors when they choose where to locate. Attempts to overcome perceptions of distance and disadvantage can also be made by means other than additions to transport infrastructure, including improved frequency, quality or marketing of transport services. For example, the Government responded in 1996 to business calls for a motorway-standard route beyond Exeter by reclassifying the existing A38 as an expressway and colouring it blue (as with motorways) on maps.
2.41 McKinnon (1996) suggests that the Scottish economy has successfully adapted to its geographical peripherality by, for example, developing sectors of high valued added products and making use of traffic flow imbalances to secure favourable export haulage rates. As a result, Scottish manufacturers actually spend less on transport than the UK average, expressed as a proportion of value added or net output. He also notes that firms such as IBM and Digital have closed down their national distribution centres across the Continent and manage satisfactorily to supply their European customers from Scottish plants.
Transport and the economy: full report (SACTRA)
34
2.42 However, McKinnon warns that, as the cycle times of logistics operations continue to be compressed, this will magnify differences in transit time between peripheral and more central regions. He also anticipates that attempts to capture the environmental costs of transport through higher fuel taxes and new road user charges will discriminate against businesses in more remote regions which have to travel further to access markets.
2.43 Supporters of schemes themselves recognise that, while transport improvements may be necessary, they are rarely, if ever, a sufficient condition for stimulating economic activity. Parkinson (1981) also notes that the empirical evidence suggests that areas with low levels of development seldom lack just good accessibility - they have disadvantages other than or in addition to transport inaccessibility, such as lack of sites or of skilled labour.
2.44 Initiatives to promote regeneration also recognise that the degree to which a transport scheme is complementary to other policy tools is essential to maximising the contribution of that scheme. Evaluation of the effect of the Bristol Spine Road (DETR, 1997a) showed that the regeneration benefits of the scheme had been limited - though still positive - because the Urban Development Corporation had failed to put in place a coherent regeneration strategy.
2.45 A second common observation is that transport improvements can harm a local or regional economy, by exposing indigenous firms to competition from stronger rivals outside the area - the so-called 'two-way road' argument. Where improved transport links behave in a way similar to the removal or reduction of a trade barrier, there can be winners and losers from the improvement, depending on among other things the structure of local and regional economies. A report on completing the European Single Market (Emerson, 1998) - which aims to reduce barriers to trade within the EU - indicated that, while overall EU productivity would rise, much of this came from a rationalisation of industry that would imply the end of production in individual sectors in some countries.
2.46 A study of transport and development changes around Inverness for the Transport Research Laboratory (Halden and Sharman, 1994) also helps highlight the point. The study concludes that expansion of tourism in the area would not have been possible without the major transport improvements in the area examined. But it also acknowledges that the improvements may have had negative effects in more peripheral parts of the study area, by increasing the pressure to close local health centres or offices in peripheral areas and to service the population from more centrally-located facilities.
2.47 Friends of the Earth in Cornwall (1997) cite the experience of different towns in the county to make a similar point. On the one hand, it is claimed that the local economies of Okehampton and Liskeard are suffering due to the effects of recently completed bypasses, as locals go elsewhere to shop (Exeter in the former case and Plymouth and Truro in the latter) and as companies transfer operations elsewhere. On the other hand, attention is drawn to the apparent success of Millbrook, with no empty shops and a complete range of services and facilities, which despite being only three miles from Plymouth is poorly served by transport links.
2.48 DETR (1997b) concedes that in rural areas improved transport links could run counter to regeneration and other policy objectives, though it emphasises that it is hard in general to say whether the net effect is positive or negative. In the specific case of regeneration, DETR points out that the low levels of wages, property costs and congestion on local roads associated with deprived areas means that these areas are highly unlikely to suffer economically if opened up to greater competition.
Transport and the economy: full report (SACTRA)
35
2.49 Equally, where regeneration policy supported by transport improvements simply shifts economic activity from one area to another, with no aggregate economic benefits being created, this may be entirely consistent with policy aims. The Government Office for the South East (1997) reminded us that, given the forecasts of growth in household numbers in the region, it was an objective of public policy to provide a higher proportion of the new homes and jobs in Kent Thames-side, supported where appropriate through improved transport provision.
2.50 Even where a transport improvement does have a positive impact on more than one area, it does not necessarily follow that all affected areas will benefit to the same extent. Dodgson's (1974) case study of the impacts of the M62 underlines the point that, for example, some areas (eg, West Yorkshire) were likely to have benefited more than others (eg, Lancashire) from reductions in freight transport costs arising from construction of the motorway.
2.51 Cornwall and Wiltshire Friends of the Earth (1997) make a further related point when they suggest that road building in rural areas in fact allows wealthier households to displace local poorer families, either by buying second homes or by facilitating long car commuting journeys. The extent to which there may be social distribution issues associated with transport schemes is an explicit area of interest for the current Government.
Macro-Level Relationship between Transport and the Economy
2.52 The debate about the relationship between transport and the economy focuses not only on the impacts on individual businesses and of local or regional areas, but also on the economy as a whole. The close correlation between economic growth and increased movement - and, since 1945, the correlation in particular between road traffic growth and economic growth - is seen as evidence of a close link between transport and the economy. But this does not help clarify the direction of cause and effect - whether increased movement is a sign of economic growth stimulated by other factors; whether traffic growth, facilitated by transport improvements, itself stimulates economic activity; or whether there is some iteration of the two.
2.53 Nevertheless, commentators point to the historical contribution of transport improvements to economic development. This is particularly true of the case of developing countries, where the transition from a fragmented communications system to even a poorly developed network is of great importance (Owen, 1987; Hilling, 1996). Perhaps the single most important factor is the transition to all-weather, all-the-year-round road surfaces.
2.54 In this sense, the complete absence of a well developed transport system acts as a serious constraint on growth. It helps explain why up to 40% of World Bank loans have been used on transport projects (Hilling, 1996) and why the UN designated the ten years to 1988 as the transport decade. Similar emphasis on transport can be found in the portfolio of the European Investment Bank (Pinder, Edwards and Wise, 1995).
2.55 The role of transport in promoting the integration of markets has also repeatedly been argued to have been a major factor in the British primacy in the Industrial Revolution (Szostak, 1991). Turnpike roads, canals and then the railways were each important in reducing transport costs and facilitating urbanisation and the development of large scale industry.
2.56 Similarly, the development of the UK motorway network in the last 40 years is seen to have played its part in post-war economic development, for example, by making possible
Transport and the economy: full report (SACTRA)
36
systemic transformation in the distribution and logistics sectors. McKinnon (1995) argues that the strategic road building programme "can be viewed in historical terms as a major 'network development episode', comparable to the earlier eras of canal and railway construction". One might add that the development of air transport links has been a further similar type of development which has helped contribute to the globalisation of business and economic activity.
2.57 The work of others suggests, however, that it would be wrong to assign undue prominence to any one particular mode, even railways, which are often seen as the most spectacular invention of the Industrial Revolution. It has been estimated that the direct resource savings from freight transport by rail compared with alternative modes of transport were around 4% of 1865 GDP, a result that echoed the findings of Fogel (1964) for 19th century America. A somewhat smaller gain probably resulted from investments in canals in 1800 (Hawke and Higgins, 1981).
2.58 Furthermore, a study of the inequalities in and production potential of European regional economies (Biehl, 1986; 1991) explained the differences in per capita GDP as a function of the regional endowments of labour, capital and various forms of infrastructure. While the lack of an effective transport system did appear to be a constraint on a regional economy achieving its full production potential in some regions, it was shown that in many poorer regions this was not the case and thus that simply improving transport would not lead to growth without other parallel interventions.
2.59 For a country such as the UK, with a now well-developed transport network, the question arises as to whether further improvements to the network can have anything more than merely marginal benefits to the national economy. McKinnon (1995) takes the view that new road construction projects are likely to make a smaller contribution to economic development than in the past, partly because much of the earlier benefit was network related, but also because the business restructuring processes have largely run their course.
2.60 While there is a sense that the tangible benefits arising from significant transport improvements may have already been largely tapped, major reductions in travel costs have still resulted from projects completed only relatively recently. Projects such as the Humber and Severn Bridges, the improvements to the A55 and the combined transport changes around Inverness are all ones which have led to significant reductions in transport costs.
2.61 The recently completed A14 link between the A1 and M1 is reported to have saved 30-35 minutes on journeys accessing the motorway network (Government Office for Eastern England, 1997). Since opening the final section of the route in Northamptonshire, industrial and commercial development within seven miles of the road is reported to have increased by 470% (including both relocation and expansion of companies). The Rural Development Commission (Spence and Linneker, 1995) makes the observation that, since the 1980s, rural areas have experienced relatively high levels of economic growth, despite having the least transport infrastructure - though, it goes on to say, rural areas have generally seen the largest improvements in their infrastructure.
2.62 Alternatively, in the UK, significant programmes of remaining improvements to important parts of the transport network have been identified - for example, Railtrack's investment programme, modernisation of the London Underground and the strategic roads programme - amounting to tens of billions of pounds. It is arguable that these improvements, in aggregate, could substantially improve the quality of transport in the UK, to the benefit of the economy. Calculations carried out by the Centre for Economic and Business Research
Transport and the economy: full report (SACTRA)
37
(CEBR, 1994) suggest that expenditure on modernising the Underground would increase the UK's GDP growth by 0.06% per annum in the period to 2003; while a 50% increase in expenditure on roads would lead to GDP 0.73% higher by 2010.
2.63 Several variations on this theme can be found in the claims made for expenditure on a range of transport projects. A study by Roger Tym and Partners for the North of England Assembly (1992) into the benefits of dualling the A1 claimed that 855 new jobs would be created directly and indirectly, adding £19.5 million to GDP. A report by JMP consultants (1989) on the Dearne Towns Link Road claimed that once the link road was open, an initial 860 jobs might arise due to developments associated with the road, with a further 129 jobs per annum from progressive development of key sites. The multiplier effects of development were predicted to provide 125 jobs with a further 23 jobs per annum.
2.64 Friends of the Earth (Jenkins, 1997) similarly claim that policies to promote public transport, cycling and walking could lead to the creation of 130,000 new jobs by 2010, more than offsetting the loss of jobs in the motor industry as a result of decreasing car use. BA point to the cumulative potential wider job losses and loss of value added in the UK economy were a fifth terminal not to be built at Heathrow Airport. A study on the effect on the East Midlands of proposed improvements to the Midland Main Line (W.S. Atkins et al, 1990) also sought to identify the net employment benefits arising from various factors such as overseas inward investment (500 jobs), indigenous expansion (1,500 jobs) and office decentralisation (500 jobs).
2.65 Others treat the claimed wider impacts of schemes and programmes on GDP and employment with some caution. Barker and Lewney (1997) of Cambridge Econometrics claim in their response to SACTRA that the effect on GDP of investing in transport infrastructure (even in large projects, such as a new rail freight network linking UK regional centres with the Channel Tunnel) would appear to be very small. The CEBR figures on economic growth are, indeed, marginal in size yet depend upon major expenditure running to billions of pounds, which may be difficult to raise either in the public or private sectors.
2.66 Parkinson (1981) also reminds us of the potential weaknesses in approaches which claim wider effects on economic activity arising through a multiplier effect from investment in transport improvements. Necessary conditions for such an effect to occur are that there is no offsetting public or private expenditure decrease to accommodate the increased roads expenditure; the Government (in the case of publicly-funded schemes) can finance the scheme without affecting output through inflation or taxes; and that there are unemployed resources to meet the increased demand.
2.67 Another line of argument suggests that public investment in transport does in fact have more than a marginal positive impact on GDP. Aschauer (1989) argues that public investment in infrastructure leads to improvements which increase firm's profitability - or rate of return to private capital (such as the capital invested in a company's distribution fleet). Firms then respond to increased profit by expanding the pace of capital investment, in turn leading to higher labour productivity and output, so perpetuating a further virtuous spiral of investment. The result, contends Aschauer, is a return on publicly-invested infrastructure projects significantly higher than investment in private firms.
2.68 Critics, however, claim that these suggested high rates of return on public investment simply defy experience. They also point out that the empirical evidence used by Aschauer (1989) could suggest a different relationship of cause and effect - higher transport investment not causing economic growth but being made affordable by that growth in income.

Transport and the economy: full report (SACTRA)
38
Conclusion
2.69 The evidence received by SACTRA clearly indicates that the debate about transport and the economy - academic and non-academic - is highly complex and one which has many strands.
2.70 When surveyed, businesses claim that transport improvements are important to competitiveness. Businesses claim they are able to use time savings from transport improvements productively, often leading to wider business benefits, for example, in the form of restructured logistical operations.
2.71 These views are questioned by those who argue, for example, that transport cost savings are typically small in scale and potentially transient as, in the case of new road capacity, any time savings are whittled away due to generation of new traffic.
2.72 Transport improvements are frequently argued to improve the economic prospects of an area. This might occur by increasing the attraction of a location to inward investors, unlocking under-utilised resources (such as derelict sites) and increasing competition between firms.
2.73 Alternatively, it is argued that improved transport by itself is unlikely to be sufficient to improve an area's economic performance and that, by exposing indigenous firms to competition from outside stronger rivals, a transport project might suck economic activity out of an area (though this may be an explicit aim of public policy).
2.74 One line of argument suggests that the creation of a well-developed transport system has been and remains important to countries with developing economies, although some commentators have warned against putting undue weight on the contribution of transport in these instances. In the case of well-developed economies, such as the UK, doubts are raised as to whether even significant programmes of transport investment can have anything more than marginal impact on national GDP.
2.75 The Committee felt it important to disentangle some of these strands, and to examine certain specific issues in greater detail, if it was itself to come to a clearer understanding about the relationship between transport and the economy.
2.76 At a very basic level, it became clear that there are two inter-related aspects to that relationship. On the one hand, there are linkages which can help explain how transport has an impact on economic activity. On the other hand, economic activity itself can shape the demand for transport. There may often be iterations between these two aspects - for example, a transport intervention may lead to changes in the economy which in turn may have further impacts on the demand for transport. For the sake of simplicity, we examine each aspect separately, with Chapters 4 and 5 focusing on the former type of linkages, and Chapter 6 the latter.
2.77 Much of the evidence also suggested that potentially there were impacts arising from transport improvements other than those currently evaluated by project appraisal. Before the Committee felt it could address the adequacy of current transport project appraisal, we felt it important to understand better the sorts of situations (both in terms of the nature of the economy and the size of the project) where potentially wider impacts (negative and positive) might arise. SACTRA commissioned research on this topic, which we examine in Chapter 4.

Transport and the economy: full report (SACTRA)
39
2.78 In addition, the Committee also felt it was important to examine more closely the validity of claims made about the likely economic impacts of schemes and about some of the claimed shortcomings in appraisal methodology. Again, we commissioned research and address these issues in Chapter 10.
2.79 First, however, we felt it was important to be clear about the definition of those terms which are central to our inquiry. The next chapter addresses this issue. A glossary of terms is also provided for ease of reference at the end of the report.
Transport and the economy: full report (SACTRA)
40
Chapter 3 - Key Concepts Explained
Introduction
3.01 The preceding chapter identified the range of issues and claims which are relevant to our remit. Ultimately, our aim is to ensure that all these considerations are properly dealt with when proposed transport programmes, schemes and policies are being appraised. To do so, we must first consider the analytical tools which can provide a framework for assessing the issues and for evaluating the evidence that might provide support for the claims. In so doing, we consider here, and in the following four chapters, the theoretical analyses underlying conventional practice in appraising transport schemes, together with possible criticisms of and extensions to them. In later chapters, we review conventional methods of appraisal in more detail and examine the implications of our analysis for current practice.
3.02 The main objective of this chapter is to explain the meaning of various terms that we shall use which may otherwise be subject to some ambiguity. This will involve considering how economists think about transport. Complementary to this is a discussion of concepts relating to economic growth including competitiveness, productivity, transport intensity and the distinction between gross domestic product (GDP) and broader measures of economic performance. In addition, the chapter considers the distinction between policies designed to increase GDP, to raise the rate of economic growth or to raise economic welfare and offers a preliminary review of the role of transport cost benefit analysis in informing such interventions.
Transport: Some Definitions
3.03 Transport is the function which allows movement of goods or persons from one physical location to another. Traffic is the measure of the extent of such movement. Our definition of traffic refers to flow times distance in the transport network as a whole, and is measured in vehicle-kilometres. In this report 'traffic' usually refers to road traffic, unless prefixed with a modal or geographical reference such as air traffic or local traffic, and is expressed as the total distance covered by all the passenger and freight journeys made per period. Travel is the use made of the transport system in terms of the number of trips.
3.04 The demand for transport is very largely a derived demand arising from other activities. The demand for freight transport arises from the following:
• the purchase of goods and services by final users which requires the carriage of inputs to the place of production; and
• the distribution of products from the place of production to the final point of use via the point of sale.
The demand for passenger transport arises from the following:
• journeys that bring people to work, education and training, in economic terms supplying labour to production;
• journeys that allow access for individuals to consumption opportunities, such as shopping, leisure and tourism;
• journeys that allow access for individuals to other individuals (e.g. visiting friends and relatives); and
Transport and the economy: full report (SACTRA)
41
• journeys that provide direct value to individuals (e.g. travelling on a preserved steam railway).
All but the last of these reveal transport in the role of an intermediate good rather than something enjoyed for its own sake. As the economy grows and production, sales and incomes rise, these various demands for transport can all generally be expected to increase (if past trends continue).
3.05 The supply of transport services occurs through a combination of providing and using infrastructure across a range of modes. Provision of infrastructure incurs capital costs and covers, for example, roads, railway lines, airports and ports, while usage is made possible through vehicles (eg, cars, trucks, trains, aeroplanes and boats) and management systems (eg, traffic lights, signals, air traffic control, navigational aids). From the traveller's point of view, a key aspect of supply is its price, ie, the cost of using the transport system.
3.06 The cost of transport to the user is conventionally discussed in terms of generalised cost, which includes operating costs, fares or tolls paid, incidental costs, such as parking fees, and also the (often sizeable) costs of time involved in making the journey; a fuller definition is given in Chapter 9 (paragraph 9.32 et seq). The generalised cost of a journey will clearly depend on, among other things, the amount of congestion on the network and may therefore vary by time of day and location. It can be expected that the demand for transport will be inversely related to its costs as perceived by the users (not always the same as the full costs actually paid).
3.07 Clearly, for business users of transport, a deterioration in the supply of transport leading to a rise in its cost will tend to raise the price at which they can supply the market. Similarly, an improvement in transport supply leading to a fall in costs will tend to lower the price. To the extent that these transport costs are passed through, the impact of changes in the cost of transport is felt by the purchaser of the final goods and services to which transport is an input. Given that different areas have varying transport requirements for the distribution of sales and/or the sourcing of inputs, the level of transport costs can influence the location of economic activity between towns, regions or even countries.
3.08 The supply of transport can be altered in a number of ways, including decisions relating to the following:
• investment in, additions to, or improvements in, quality in the infrastructure stock (e.g., new roads or railway lines or rail electrification);
• replacement of existing infrastructure assets (resurfacing a road or renewing railway track);
• reductions in road capacity;
• better management of the asset base (clearing breakdowns faster, better management of traffic flows, new services making fuller use of existing infrastructure); and
• changes in money costs (e.g. tolls, parking charges, fuel prices).
When people talk of a transport improvement, this is frequently taken to mean investment in new infrastructure. For the purposes of this report, we take the definition to be much wider. From the perspective of the user, a transport improvement will result from any of the above which delivers a reduction in generalised cost for a given volume of traffic.
3.09 An increase in traffic can reflect greater demand for and/or greater supply of transport services. The latter will be reflected in a lowering of the generalised cost of transport at the
Transport and the economy: full report (SACTRA)
42
margin. This can be regarded as a transport improvement, which may reflect additions to the stock of transport infrastructure or changes in its pattern of use. Extra demand for transport services on a given transport infrastructure will generally tend to raise the generalised cost as volumes of traffic rise. Evidently, an increase in traffic should not be confused with an improvement in transport of which it may, but need not, be the result.
GDP as a Measure of Economic Performance
3.10 Gross Domestic Product (GDP) is the usual measure for assessing the performance of the economy. The level of GDP can be defined as the sum of all the value added in the economy per year. An estimate of GDP, which appears in the National Income Accounts, is made by the Office of National Statistics (ONS) from estimates of:
• the monetary flows of expenditures on final goods and services;
• the incomes earned by factors of production (see below) in the economy; and
• the sales of final output.
The rate of economic growth is usually defined as the percentage change in GDP per head of population per year measured in constant prices (ie, excluding inflation).
3.11 GDP principally captures flows of output that involve cash transactions (plus some imputations, e.g. for owner-occupied housing). It does not take account of household production that is not bought and sold in the market. Yet this non-paid work supplies services to the economy, including caring, catering, education, housework, etc, which have an implicit economic value. It has been widely argued that 'true' GDP would include the estimated value of output from non-paid work, although there is disagreement on the best way to implement this suggestion. National statistical offices (including ONS) are currently experimenting with satellite national accounts. The Household Satellite Account for the UK (Neuburger, 1996; Murgatroyd and Neuburger, 1997) focuses on time use, and estimates household unpaid work to be worth at least 39% of conventional GDP.
3.12 Three particular weaknesses of percentage rate of change in real GDP as the unit in which to measure economic growth stand out in the context of transport appraisal:
• its failure to take account of environmental damage resulting from economic activity;
• its exclusion of unpaid non-market production of goods, and especially services, from output; and
• its neglect of changes in leisure and non-market work time.
All these might be expected to influence economic welfare, as Nordhaus and Tobin (1972) pointed out in proposing their well-known alternative Measure of Economic Welfare which attempted to quantify these and other omissions.
Sustainable Development
3.13 GDP measures the value of current production rather than the traditional notion of real national income, which is the amount that can be consumed in the present year while leaving future consumption possibilities intact, ie, without eating into capital. In traditional national income accounts this is taken to be net national product (NNP), which adds to GDP net property income from abroad and subtracts from it the investment necessary to make good

Transport and the economy: full report (SACTRA)
43
depreciation of the capital stock. Satellite national accounts which embrace environmental considerations would regard NNP as too narrow a measure of real national income, since it does not recognise the depreciation of the natural capital stock through resource depletion and environmental degradation, which can be thought of as its quantity and quality aspects respectively. In principle, resource depletion and environmental degradation might be quantified in monetary terms and a green NNP could then be calculated, but in practice this is controversial and difficult.
3.14 Sustainability of development requires that future generations are bequeathed a capital stock that will permit current levels of consumption to be sustained. If there is substitutability between the various components of the capital stock, this would amount to restraining consumption to the value of green NNP. Depletion of natural resources can be compensated by additions to other forms of capital. If there is no substitutability, and all components of the capital stock are necessary for meeting current consumption standards, then each of them must be maintained at current levels.
3.15 There are several links between the concept of sustainable development and transport schemes and interventions. First, and most obvious, transport infrastructure is part of the capital stock and failure to maintain its value jeopardises sustainability, unless it can be adequately offset by other forms of investment. Secondly, many of the externalities resulting from traffic lead to depreciation of the natural capital stock. Thirdly, destruction of the natural capital stock may result from investment in transport infrastructure.
The Sources of Economic Growth
3.16 In the long run, output growth depends on growth of the economy's productive potential, that is in the supply-side of the economy. Thus, the proximate sources of growth are increases in the factors of production (the quantity and quality of capital, labour and natural resources) and in their productivity. In the short run, from year to year, output growth will reflect changes in the pressure of demand and associated variations in the degree to which available productive potential is actually employed. Additions to transport infrastructure may have direct positive impacts on growth through both short and long run effects. In the construction phase, the investment spending on transport projects (as with any construction projects) injects demand into the economy while, in the long run, the additions to the capital stock raise productive potential.
3.17 In thinking about improvements in the supply-side it is important to distinguish between levels effects and growth rate effects, ie, between changes in circumstances or policies that have a once-and-for-all effect on the level of GDP and those which affect the long run rate of growth of GDP. A standard example of the former would be a reallocation of resources that increases the productivity of the economy given its current endowment of productive assets. A standard instance of the latter would be an increase in the rate of investment that gives rise to a permanent increase in the rate of growth of the capital stock. Models of economic growth which have the property of endogenous growth are those in which the long run growth rate is explained within the model and depends on innovative activity and/or investment decisions that result from economic stimuli.
3.18 In recent years, governments have embraced assessments of competitiveness impacts as a key policy criterion. In this context, national competitiveness has been defined as "the degree to which the country can ... produce goods and services which meet the test of international markets, while simultaneously maintaining and expanding incomes of its people

Transport and the economy: full report (SACTRA)
44
over the long term." (DTI, 1994). Competitiveness then is more to do with the economy's growth than with the efficient allocation of resources per se (see below) but is often thought to be reflected in superior levels of productivity, namely the volume of output obtained per unit of input.
3.19 Usually comparisons of productivity are made in terms of output per unit of labour input, but a better measure of overall efficiency is total factor productivity (TFP) which measures output compared with a weighted sum of all inputs. TFP growth results from technological progress, more efficient use of resources and economies of scale.
3.20 Competitiveness at the national level, as defined in paragraph 3.18, is primarily about growth rate effects stemming from growth in the capital stock and in TFP, ie, growth of productive potential, rather than the efficiency of allocation of a given amount of productive resources. Yet productivity improvement results from efforts to reduce costs, while the accumulation of capital equipment and skills depends on investment decisions. At a deeper level, therefore, growth depends on incentives to invest and to innovate, and thus may be influenced by various aspects of microeconomic arrangements, such as the structure of taxation, or the amount of competitive pressure on managers of firms (Aghion and Howitt, 1998).
ECONOMIC ROLE OF TRANSPORT
3.21 Transport can facilitate economic activity, and it is this which establishes the need to consider the impact on economic growth of proposals to invest in infrastructure or to adopt traffic reduction measures. Economic policies generally aim to promote an efficient use of resources - defined as land, labour and capital; in general, we might expect that improvements in transport contribute to using resources more efficiently but are costly to provide. Changes in transport costs have economic effects through their influence on regional patterns of commerce, on incentives to invest and to innovate, on the location decisions of firms, on the commuting and migration decisions of households. These effects are felt also through other costs to the economy such as pollution and congestion. From the perspective of policymakers, transport provision has distributional implications, and may also be a key ingredient in terms of addressing issues of social exclusion, defined as the exclusion of disadvantaged groups from participation in society.
3.22 At the same time, economic growth and development affect the demand both for the pattern and also the volume of transport services. Higher incomes stimulate car ownership, growth of business sales activates the carriage of more freight, technological change allows new methods of communication, adjustments to the composition of economic activity, including de-industrialisation, lead to new traffic flows, etc. These impacts may, on occasion, have unfortunate side-effects, such as environmental degradation, so the economic growth may not be sustainable. Policy-makers may wish to intervene to modify the transport implications of economic development but, in so doing, ideally would like to know the impacts of their actions on future economic growth.
3.23 Transport intensity is an aggregate measure of the importance of transport in the economy, in principle covering all modes, which was formally suggested by Peake and Hope (1994). Peake proposed the concept of gross mass movement, adding together both passenger and freight mobility into a single index expressed in terms of tonne miles. Transport intensity is then the ratio of gross mass movement to GDP. By extension it is possible to talk of traffic intensity, the ratio of vehicle kilometres to GDP, and to develop separate indices for passenger and freight movement, etc. More is said about transport intensity in Chapter 6.

Transport and the economy: full report (SACTRA)
45
Efficient Allocations of Resources
3.24 An efficient allocation of resources requires that the prices charged reflect both the costs of production of any additional unit, referred to as marginal costs, and the benefits to consumers of an additional good or service, referred to as marginal benefits. For transport, the relevant costs are opportunity costs, defined as the opportunity foregone by consuming this good instead of using the resources to make an alternative output. Not all costs of production fall on the suppliers or producers of goods and services. Some fall on society as a whole, for example, pollution and road accidents. These costs are known as social costs or external costs to distinguish them from the costs which are paid by producers and consumers. Where measures are introduced to bring these social costs into prices, this is known as internalisation. Opportunity costs of individual goods and services should include all social or external costs, e.g., of pollution, rather than simply those incurred by the supplier; such a calculation is known as marginal social cost (MSC). Opportunity costs are variable (avoidable) costs. In the short run, capital costs can be regarded as fixed (unavoidable) and thus not part of marginal cost, but long run marginal cost does include capital costs, which can be thought of as the interest that the capital could earn if not used for the present purpose.
3.25 An efficient allocation of resources means that the maximum value of output is being obtained at any point in time from a given amount of productive resources. Thus, in principle, the criterion that marginal benefit equals marginal cost equals price applied throughout the economy should be consistent with maximising the value of production from existing productive potential and is a necessary condition for optimising economic welfare.
3.26 When economic circumstances do not permit these conditions for an efficient allocation of resources to be met, there is market failure. Examples of market failure include divergences of social and private costs (stemming from externalities such as pollution and congestion), and of social and private benefits from investment where some of the returns accrue to persons other than the investor. In such cases, there is a prima facie case for government to intervene to correct the market failure, for example, by using taxes or subsidies to align private with social costs and benefits. Departures from perfect competition such as monopoly are further examples of market failure.
3.27 Establishing the existence of market failure that is leading to a substantial resource misallocation is not, however, sufficient to justify government intervention. This requires that intervention can improve economic efficiency, after taking into account administrative costs and distortionary costs arising from the need to finance government spending. To achieve this, an intervention should address the causes rather than the consequences of market failure.
Figure 3.1 Optional travel demand under different marginal cost conditions

Transport and the economy: full report (SACTRA)
46
In Figure 3.1, the downward sloping line labelled MB shows the marginal benefit for different volumes of traffic. When marginal social cost is defined by LRMC + MEC1 (long run marginal cost plus marginal external costs of pollution, congestion etc), the optimal travel demand is at Q* where marginal benefit (reflecting willingness to pay for transport services) is equal to marginal opportunity cost. (For simplicity at this stage we assume that the value of time is identical across all transport users.) This travel demand could result from volume reduction measures which set the right level of use or from charges and taxes which set the appropriate price. In the case where marginal social cost is defined by LRMC + MEC2, the optimal volume of traffic would be higher at Q**.
Imposing a tax on road travel will raise the cost to the user. The diagram considers a case where a tax initially raises the user cost to Pt. If road users pay a price equal to Pt and there are no volume reduction measures in place, then in the case where Q* is optimal, volume is too high, and where Q** is optimal, volume is too low. In the former case it would be appropriate to raise price to P* or to adopt other reduction measures with an equivalent impact on travel demand with a welfare gain shown by the shaded triangle ABC in Figure 3.1 as traffic whose marginal cost exceeds marginal benefit is eliminated. In the latter case traffic should be increased by a lowering of taxes to P** with a welfare gain of CDE as traffic with a marginal benefit greater than marginal cost is encouraged.
Figure 3.1 also shows the potential links between road improvements and external costs. Suppose that without road improvements MSC = LRMC + MEC1 but, over time with improvements to alleviate congestion, costs could be reduced to LRMC + MEC2. Although, initially, it would be right to aim for P*Q*, it is then worth investing in the improvements to obtain a welfare accruing from the excess of MB over long run MSC by moving to P**Q** in the long run. Inspection of Figure 3.1 reveals that:
• the optimal traffic reduction charge is larger in the short than in the long run;
• the optimal traffic volume is larger in the long run when capacity can be adjusted;
• a failure to take account of external costs will lead to the construction of too much capacity implying
Transport and the economy: full report (SACTRA)
47
provision for a volume of Qnx rather than Q**; and
• a failure to raise capacity would mean that a possible welfare gain of ADEF is lost.
3.28 Achieving an efficient allocation of resources may have distributional implications for certain areas or groups of people that are regarded by government as undesirable. In such circumstances, there will be a trade-off between equity and efficiency, and policymakers will have to judge what sort of compromise between the two objectives is appropriate.
Applying the Principles of Marginal Cost Pricing
3.29 The principles of marginal cost pricing as a tool for achieving an efficient allocation of resources can be illustrated by considering the consequences of seeking to reduce volumes of road traffic and in the cost benefit analysis of new road schemes (see Figure 3.1). This allows us to calculate the optimal travel demand where marginal benefits equal marginal generalised and social costs. This volume of traffic could result from quantity reduction measures which set the right level of use or from charges and taxes which set the appropriate price; the theoretically optimal level of charges and taxes can be calculated using these principles. This in turn can be used, as shown in Figure 3.1, to identify situations where road improvement schemes or traffic reduction policies can be justified.
3.30 It should be noted that the efficiency gain from moving to the optimal volume of traffic may well have distributional implications which depend, in turn, on the type of traffic reduction measure adopted. The imposition of taxes or road charges imposes costs on travellers and implies flows of revenue to government which would need to be offset by reductions of other taxes if the scheme were not to raise taxes overall (described as fiscal revenue neutral).1 The detailed implementation of traffic reduction measures would need careful consideration of these distributional effects.
3.31 At this point it is useful to distinguish between two different types of external costs associated with road traffic. The first falls both on travellers and non-travellers; an example is pollution. The second falls on travellers in the form of congestion costs (in Figure 3.1, the onset of congestion costs would be reflected in the sharp increase in the gradient of the MSC curves). In cases where adding to road capacity is feasible, the latter type of external cost can be very directly influenced by road improvement schemes designed to increase the volume of traffic that the network can carry.
3.32 All governments need to raise revenue to pay for the public sector and to finance transfer payments such as pensions, unemployment benefits, etc. In the long run, public expenditure has to be funded by taxation. Unfortunately, in general, the imposition of taxes interferes with the optimal allocation of resources in the economy, ie, it is distortionary. This is because taxation usually implies that, whether for factors of production, such as labour, or goods and services, prices diverge from marginal opportunity costs, and that, as a result, there are efficiency losses when taxes are levied. Society loses to the extent that output is no longer bought for which marginal benefit exceeds marginal social cost - this is known as dead-weight welfare loss. 2
Figure 3.2 Welfare effects of revenue raising taxes
a) Inelastic Supply and Demand b) Elastic Supply and Demand
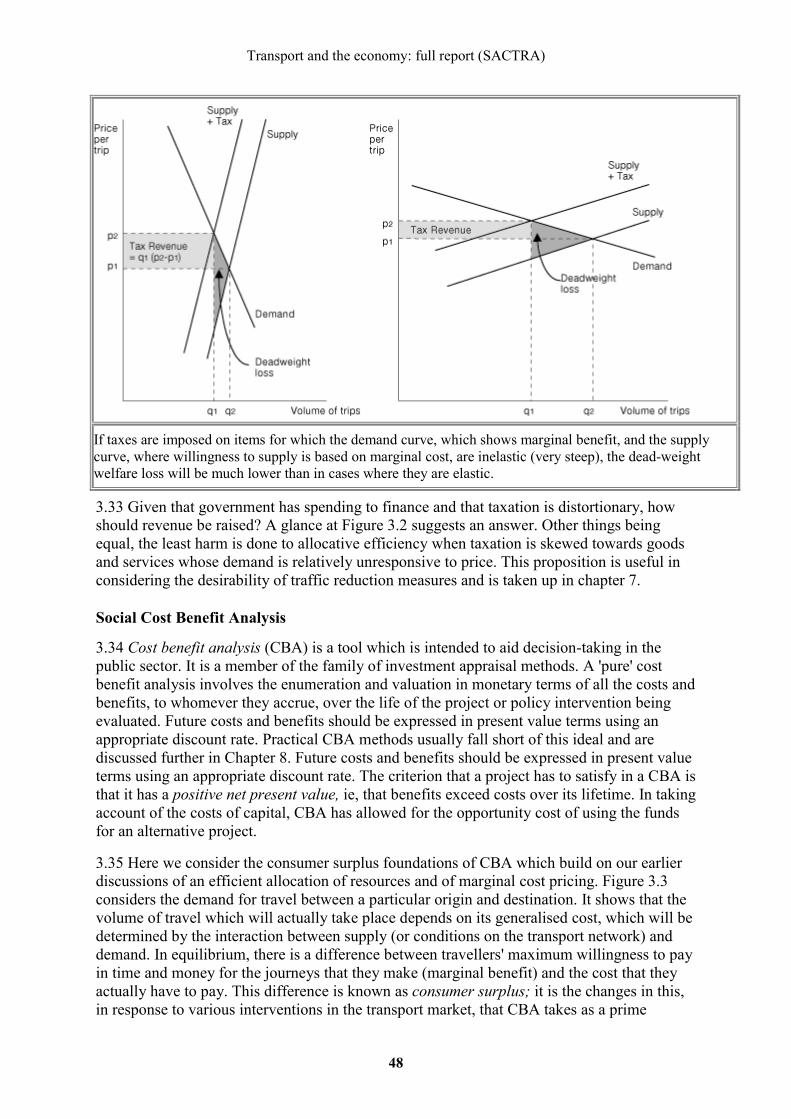
Transport and the economy: full report (SACTRA)
48
If taxes are imposed on items for which the demand curve, which shows marginal benefit, and the supply curve, where willingness to supply is based on marginal cost, are inelastic (very steep), the dead-weight welfare loss will be much lower than in cases where they are elastic.
3.33 Given that government has spending to finance and that taxation is distortionary, how should revenue be raised? A glance at Figure 3.2 suggests an answer. Other things being equal, the least harm is done to allocative efficiency when taxation is skewed towards goods and services whose demand is relatively unresponsive to price. This proposition is useful in considering the desirability of traffic reduction measures and is taken up in chapter 7.
Social Cost Benefit Analysis
3.34 Cost benefit analysis (CBA) is a tool which is intended to aid decision-taking in the public sector. It is a member of the family of investment appraisal methods. A 'pure' cost benefit analysis involves the enumeration and valuation in monetary terms of all the costs and benefits, to whomever they accrue, over the life of the project or policy intervention being evaluated. Future costs and benefits should be expressed in present value terms using an appropriate discount rate. Practical CBA methods usually fall short of this ideal and are discussed further in Chapter 8. Future costs and benefits should be expressed in present value terms using an appropriate discount rate. The criterion that a project has to satisfy in a CBA is that it has a positive net present value, ie, that benefits exceed costs over its lifetime. In taking account of the costs of capital, CBA has allowed for the opportunity cost of using the funds for an alternative project.
3.35 Here we consider the consumer surplus foundations of CBA which build on our earlier discussions of an efficient allocation of resources and of marginal cost pricing. Figure 3.3 considers the demand for travel between a particular origin and destination. It shows that the volume of travel which will actually take place depends on its generalised cost, which will be determined by the interaction between supply (or conditions on the transport network) and demand. In equilibrium, there is a difference between travellers' maximum willingness to pay in time and money for the journeys that they make (marginal benefit) and the cost that they actually have to pay. This difference is known as consumer surplus; it is the changes in this, in response to various interventions in the transport market, that CBA takes as a prime

Transport and the economy: full report (SACTRA)
49
indicator of user benefit. Figure 3.3 shows how this concept can be applied to justify a road improvement scheme where it produces a consumer surplus (ie, where marginal benefits exceed marginal social costs over the long term), developing the argument in Figure 3.1.
3.36 CBA, when applied to transport interventions and projects, takes journey time savings to be of real value to travellers. In practice, certain valuation conventions are used to value time benefits, and since on average 85-90 per cent of the monetised benefits of major road schemes come in the form of time savings, the cost benefit results are sensitive to the conventions that are followed. For travel time in the course of work, savings are valued according to the gross wage rate plus employment-related overhead costs of the relevant class of employee. The value of working time savings is the main way in which benefits of road schemes to business are represented in the DETR's cost benefit analysis technique, COBA (Highways Agency et al). For all other journey purposes, including both commuting and leisure usage, a standard average value of time savings is used which is currently 25 per cent of that attributed to the average working time value. All time savings, regardless of size, are assumed to attract the same value per minute.
3.37 Obviously, the analysis of Figure 3.3 is over-simplified. For example, transport is characterised by multiple interdependencies. The demand for travel between any two points (i and j in Figure 3.3) depends partly on the cost of travel to other destinations. So the above analysis needs to be modified for multiple demand shifts. In fact, the formula used (the 'rule of a half') can be extended to cover multiple origins and destinations, times of day and modes. The framework is thus highly versatile; provided that the initial and final generalised costs and volumes for each travel choice can be forecast, the benefits of any change in the network can be computed.
Figure 3.3 Increased consumer surplus with improved travel conditions
For the cost conditions represented by the supply curve S0 in Figure 3.3 the consumer surplus is shown as the light shaded area.
Suppose that travel conditions between i and j are improved so that generalised costs fall from C0 to C1. The volume of trips increases from T0 to T1 and the increase in consumer surplus, taken by CBA

Transport and the economy: full report (SACTRA)
50
as indicating user benefit, is the darker shaded area C0XYC1. For small changes in generalised cost, the demand curve can be assumed to be linear with very little loss of accuracy and the user benefit is given by the famous rule of a half formula: 0.5(C0 - C1)(T0 + T1).
Returning to the analysis in Figure 3.1, let us now consider the implications of the road improvement scheme considered there in terms of consumer surplus and economic benefit minus cost assuming that initially traffic is restrained by a tax set equal to P*. The gain in consumer surplus is P*ADP**. The government loses revenue of P*AGP** on the pre-project traffic volume but gains revenue of GDQ**Q* on the additional traffic. Additional social costs are incurred on this extra traffic and are measured by the area FEDQ**Q*. The net economic benefit is therefore the area ADEF as noted in Figure 3.1.
3.38 Practical modelling exercises often involve simplifications of this framework. For example, COBA evaluations of road schemes prior to SACTRA's last report in 1994 were underpinned by a 'fixed trip matrix' assumption, where origins and destinations, and hence demand, are treated as fixed (as opposed to a 'variable trip matrix' which allows for changes in behaviour and demand in response to road improvements). The fixed trip matrix can be thought of as 'turning off' nearly all the behavioural responses which underlie the variable trip matrix. The fixed trip matrix assumption allows only a single traveller response - that of change of route - and ignores the possibility of other responses, such as change of time, and frequency of travel, mode and destination.
3.39 This might appear to be a helpful simplification that will ease computation, while simply omitting a small part of the benefits (see Figure 3.4). The method does, however, have serious dangers, as SACTRA (1994) pointed out. In particular, in congested conditions, the fixed trip matrix method could overestimate true benefits, perhaps significantly, by failing to allow for the congesting effect of induced traffic on the network service quality for all traffic.
3.40 This point has much resonance for the current enquiry. It is clear that a major concern is the effect of new transport infrastructure on the real economy. By measuring the generalised costs savings for a fixed volume of transport, the fixed matrix may appear to be picking up most of this. But, inasmuch as the focus is on the business reorganisation and generation effects of improved infrastructure, the fixed trip simplification omits the very responses that are of central interest. If it is argued that infrastructure schemes stimulate economic restructuring then, for consistency, a variable demand approach to the traffic forecasting and economic appraisal is required.
Figure 3.4 Consumer surplus change where demand is fixed
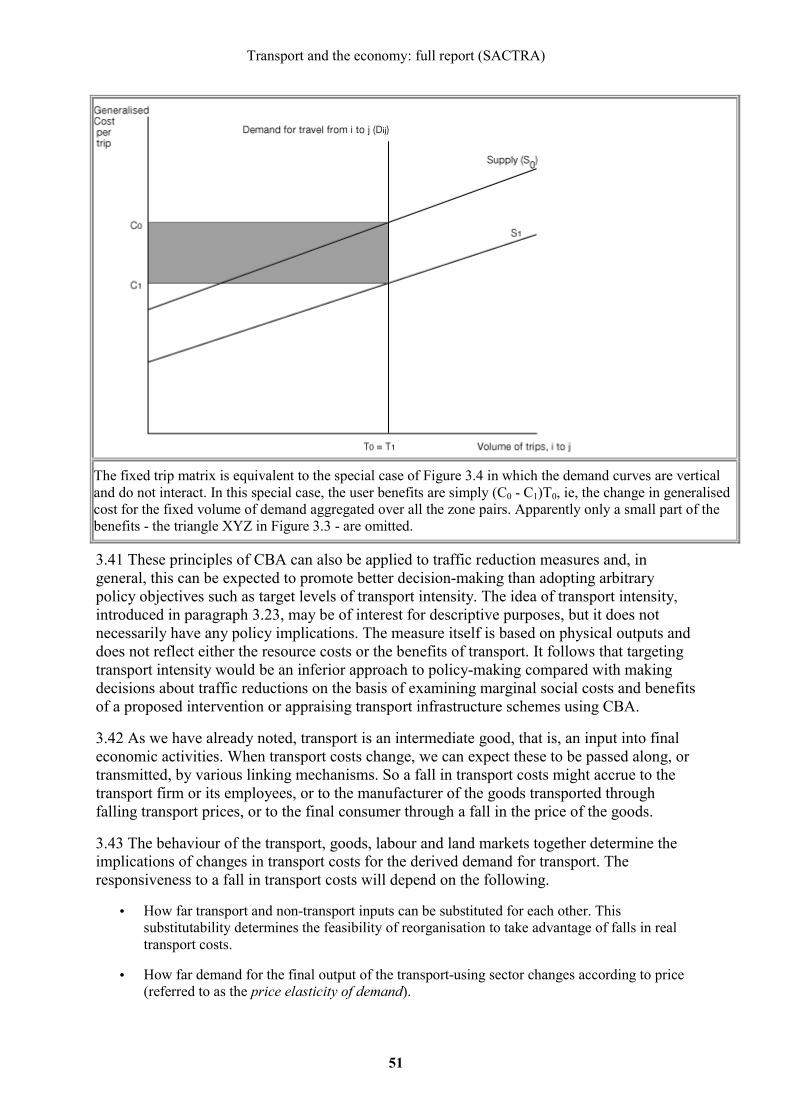
Transport and the economy: full report (SACTRA)
51
The fixed trip matrix is equivalent to the special case of Figure 3.4 in which the demand curves are vertical and do not interact. In this special case, the user benefits are simply (C0 - C1)T0, ie, the change in generalised cost for the fixed volume of demand aggregated over all the zone pairs. Apparently only a small part of the benefits - the triangle XYZ in Figure 3.3 - are omitted.
3.41 These principles of CBA can also be applied to traffic reduction measures and, in general, this can be expected to promote better decision-making than adopting arbitrary policy objectives such as target levels of transport intensity. The idea of transport intensity, introduced in paragraph 3.23, may be of interest for descriptive purposes, but it does not necessarily have any policy implications. The measure itself is based on physical outputs and does not reflect either the resource costs or the benefits of transport. It follows that targeting transport intensity would be an inferior approach to policy-making compared with making decisions about traffic reductions on the basis of examining marginal social costs and benefits of a proposed intervention or appraising transport infrastructure schemes using CBA.
3.42 As we have already noted, transport is an intermediate good, that is, an input into final economic activities. When transport costs change, we can expect these to be passed along, or transmitted, by various linking mechanisms. So a fall in transport costs might accrue to the transport firm or its employees, or to the manufacturer of the goods transported through falling transport prices, or to the final consumer through a fall in the price of the goods.
3.43 The behaviour of the transport, goods, labour and land markets together determine the implications of changes in transport costs for the derived demand for transport. The responsiveness to a fall in transport costs will depend on the following.
• How far transport and non-transport inputs can be substituted for each other. This substitutability determines the feasibility of reorganisation to take advantage of falls in real transport costs.
• How far demand for the final output of the transport-using sector changes according to price (referred to as the price elasticity of demand).
Transport and the economy: full report (SACTRA)
52
• The proportion of transport costs in total costs.
• The extent of competition in intermediate markets. Competition in any market ranges from a complete monopoly, where a single firm supplies all consumers, through oligopoly, where a few firms control output, and imperfect competition, where there is some competition but also some firms influencing the market, to perfect competition, where there is free entry and exit to the market and no one firm has any dominant role. In economic theory, a tendency towards monopoly in any market will tend to dampen reorganisation and output effects.
• Dynamic responses within and between sectors.
3.44 Thus, correct transport CBA is conceptually very demanding. It requires us to use the travel demand curve, which is derived to incorporate the reorganisation and output effects as travel costs change. These depend on the size of the five factors listed in paragraph 3.43. So, in principle, transport CBA requires knowledge of the relevant conditions in all the markets affected by a transport scheme in order that the desired demand curve can be correctly estimated. This then has to be equilibrated with transport supply. In practice, simplifying assumptions are made - we return to the acceptability of these in Chapter 10.
Transport Benefits and Final Economic Benefits
3.45 Ideally we would like to measure the final economic impacts of schemes. As an input to the social and political assessment process, we would like to be able to say, not only how large the impacts are, but to whom and where the costs and benefits accrue. In practice, this is 'too difficult' and economic appraisal of transport projects has sought to use the size of the transport costs and benefits (time savings, etc) as an acceptable approximation.
3.46 Is this legitimate? Our review of the literature, see for example, Jara-Diaz, (1986), indicates that it is valid, provided that there is perfect competition in all markets. In this case, the benefits of the derived demand for travel (the area under the curve C0XYC1 in Figure 3.3) are an exact measure of the final benefits in the transport-using sectors of the economy. The demand curve for transport is derived from the demand for inputs or final products, and values the additional transport demand correctly in terms of the willingness to pay for extra inputs in the case of the producer or the willingness to pay for additional outputs in the case of the consumer.
3.47 This approach rests on the following proposition (see Appendix C). When travel costs fall, the pattern of prices changes throughout the economy, thereby altering the pattern of demand and the deployment of resources between sectors. Provided prices equal marginal social costs in all relevant markets, there are no additional surplus gains or losses in the final sectors over and above the gains or losses already captured in the transport sector.
3.48 A transport CBA which takes account of all indirect and direct responses by economic agents to a project/policy that would occur under conditions of perfect competition in the economy as a whole - including all dimensions of travel choice and repercussions on land use and economic activity, as well as all externalities including environmental impacts quantified in monetary terms - may be thought of as theoretical 'best possible practice' that could ever be produced while still assuming perfect competition. This form of cost benefit analysis can be thought of as a useful benchmark and is termed CBA** in this report.
3.49 As soon as the perfect competition assumption is dropped, equivalence between the total economic benefits and the transport benefits can no longer be assumed. In practice, discrepancies between price and marginal social cost result from 'imperfections' or 'failures'
Transport and the economy: full report (SACTRA)
53
in both goods and factor markets. Examples of market imperfections relevant to this report include imperfect competition in product markets, wages that exceed the opportunity cost of labour, taxation effects and external costs and benefits.
3.50 In the presence of imperfect competition, benefits will be understated if net additional amounts of goods priced at above marginal cost are purchased, since these will generate gains to producers in addition to the valuation placed on the goods by consumers. This point is explored in detail in Chapter 4. Also, if some locations have unemployed labour so that the wage paid does not reflect opportunity cost (ie, the marginal social cost or shadow price), then a transport improvement which attracts employment to those locations from places where wages do reflect opportunity costs should be credited with an extra benefit per job equal to the excess of the wage over the shadow price. Only in this case of a discrepancy between wages and opportunity costs of labour is it appropriate to consider valuation of the employment effects of transport schemes as a possible source of benefits additional to those already captured by the transport benefits. This point is considered further in paragraphs 3.60 - 3.62 below.
3.51 At this point, it is also worth noting that major changes to the transport network could conceivably induce investment or TFP growth from behavioural responses elsewhere in the economy. Examples might include cases, initially affecting the level of output, where the expansion of demand for a sector allows internal economies of scale and learning effects which lower costs, or where cheaper transport encourages relocation of firms next to similar firms, giving rise to external economies of scale. Growth rate effects might follow, if the externalities also encourage extra innovative activity, and productivity growth increases as a result. These aspects of economic integration are the centre of attention in the 'new economic geography', which is discussed in Chapter 4 and Chapter 5, but will not usually be captured by conventional CBA.
3.52 These considerations will only matter, however, where the economy is responsive to changes in transport costs through input substitution and/or output effects. In other words, the extent to which transport benefits are a correct measure of final economic benefits depends both upon the size of differences between price and marginal social cost and the responsiveness of the relevant markets. We return to this issue in Chapter 4.
3.53 From this base we can define another, even better, notional assessment procedure labelled CBA***. This is the limiting case where not only are all direct and indirect responses by economic agents taken into account, but the assumption of perfect competition is itself relaxed and the analysis explicitly takes into account an imperfect economy. Implementing CBA*** or CBA** is a demanding, if not impossible, proposition. We explore the practical implications of these different degrees of appraisal in Chapter 8 and Chapter 10.
TRANSPORT BENEFITS, GDP AND BROADER MEASURES OF ECONOMIC PERFORMANCE
3.54 A high proportion of the benefits identified in a transport CBA accrue in the form of time savings. The COBA manual indicates that just over a quarter of all vehicle kilometres per year (including 14.6% of car travel and 72% of Light Goods Vehicle travel) are for work purposes and, therefore, a substantial fraction of the time savings from new road schemes are obtained by users who are engaged in personal business, commuting, shopping and 'pure' leisure travel. At the values of time currently used in COBA, in cases where traffic proportions equate to the national average, around 44% of the value of time savings would go to travellers in non-work mode.

Transport and the economy: full report (SACTRA)
54
3.55 Where work time is saved by a transport intervention, the benefits which arise are, in effect, measured in terms of the value of the extra output that employers can obtain from the redeployment of workers' time. This has a direct counterpart in terms of a gain in GDP as measured in the national accounts. Benefits in transport CBA which derive from non-work time would not raise GDP, but some of them would imply an increase in a broader measure of economic performance, 'true GDP', which included the value of household production as well as market production.
3.56 Clearly, savings of travel time by households could be important in releasing time for use in unpaid work. For a project with traffic proportions at the national average, and where the proportion of non-working time savings used for unpaid work is equal to the household average, about 16% of the total value of time savings would be reflected in extra household production. If household production is valued at its opportunity cost after tax, as in one variant of the Household Satellite Accounts (Neuburger and Murgatroyd, 1997), then the value of the time savings estimated by COBA is very similar to the implied gain in the value of unpaid work which would be reflected in true GDP. The adoption of satellite accounts might therefore be a step towards reconciling the conflict between the treatment of time savings in COBA and in conventional national income accounting, where they are ignored. At present, it should be remembered that, insofar as the benefits of transport improvements estimated by cost benefit analyses include savings of non-market work time, they overestimate the gain in real GDP as conventionally measured by ONS.
3.57 Some time savings counted in transport CBA benefits are enjoyed as greater leisure. These would not show up either in conventional GDP or in the expanded concept of 'true GDP' embraced by the Household Satellite Accounts. They are, however, valued by users, are therefore correctly identified as benefits, and should be included in a comprehensive measure of economic performance and of economic growth (Usher, 1980, ch. 7).
TRANSPORT IMPROVEMENTS AND JOB CREATION
3.58 Transport schemes are sometimes advocated on the grounds that they will create jobs in assisted areas, which are targeted by government as locations in which additional employment is socially beneficial. Where this applies, the implication is that employment creation is not seen as the criterion by which to appraise schemes but as something additional to the benefits captured by CBA. Although this might be considered as increasing the competitiveness at the local level, we prefer to use the term regeneration to cover attempts at job creation in assisted areas while using the term competitiveness to refer to the pursuit of higher productivity at the national level.
3.59 Conventional economic analysis assumes market clearing, ie, that prices adjust to balance demand and supply, with excess demand (supply) being eliminated by an increase (reduction) in prices. In the markets for different types of labour, wage adjustments would fulfil this balancing role. With full and instantaneous market clearing, the economy is always at its equilibrium level of employment and any increase in employment or output at one location must be matched by an offsetting reduction somewhere else in the economy. Once a labour market has cleared, the wage rate reflects the opportunity cost of a worker, ie, what he/she could earn in alternative employment and her/his value to an alternative employer. The suggestion that transport schemes could create employment would be ill-founded and so there could be no addition to benefits obtained through CBA** for job creation.
3.60 The notion, introduced in paragraph 3.50, that the shadow price of labour is less than the wage rate, is typically based on the assumption that labour markets are slow to clear. In this
Transport and the economy: full report (SACTRA)
55
case, CBA*** measures the benefits in terms of the additional employment times the excess of its value (measured by its wage cost) over its opportunity cost. In a limiting case, the labour employed will never find any alternative employment and its opportunity cost or shadow price is zero. More generally, it may be that the workers would eventually find alternative work - perhaps through migration - and the shadow price of labour will be less than the wage rate by an amount depending on the expected waiting time to re-employment.
3.61 In practice, it may be very hard, or even impossible, to accurately estimate this shadow wage rate. If so, the best way to handle the economic benefits from employment creation in assisted areas may be analogous to the treatment of environmental costs, which are, in principle, quantifiable in money terms but where, in practice, adequate information for the task is not available. In other words, an estimate of the jobs created by a scheme in a target area is stated as an additional non-monetised benefit. Alternatively, following Treasury guidance, the success of a project in achieving a social objective of regeneration in terms of employment creation in assisted areas might be assessed in terms of gross public expenditure per job created and cost-effectiveness can then be compared with alternative interventions with a similar objective.
3.62 The approaches suggested in paragraph 3.61 are difficult to implement, however. Ideally, we wish to know how many additional job-years of employment are created by the activities which are stimulated as a result of the transport improvement. This requires the estimation of both displacement (ie, are other jobs lost?) and multiplier (ie, does spending the income lead to further job creation?) effects. It also requires an estimate of how long the workers who are hired would have waited for alternative employment - (ie, the key ingredient required to estimate the shadow price of labour). Thus, it is net employment creation that matters, but this is both much harder to estimate than, and may not be closely correlated with, gross employment creation (Armstrong and Taylor, 1993). In principle, however, we note that it is possible, once the shadow wage rate and other appropriate shadow prices are known, to use CBA to appraise regeneration projects and to suggest the level of subsidy appropriate per job created (see below).
The following table is made available in Adobe Acrobat format for downloading. The Adobe Acrobat Reader can be freely downloaded.
• Table (45kb)
'More Productive' and 'Less Productive' Travel
3.63 It is often suggested that some travel is 'more productive' than other travel, and indeed this distinction may be built into political priorities, such as favouring roads to ports, or differential exemption from certain charges. At one level, the difference is so manifestly true that it becomes almost a statement of the obvious. For example, it is clear that the movement of raw materials to a factory is an inherent part of the process of production which, at each stage, adds value to them. By comparison, a drive to the sea-front to admire the view does not add value to any marketable commodity. Similarly, it seems intuitively obvious that a lorry carrying a full load of goods to its destination would seem to be contributing more efficiently to economic performance, other things being equal, than two half empty lorries taking the same goods to the same destination. Therefore, it is relevant, for a study looking at the effects of transport on the economy, to consider such differences in the productivity of different movements.
Transport and the economy: full report (SACTRA)
56
3.64 On the other hand, it is remarkably difficult to draw well-defined dividing lines between productive and unproductive travel. Shopping trips by final consumers, for example, are not usually considered to add value to the product bought, and nor does travelling to work add value to the work itself, but nevertheless it is essential for the economy as a whole that people go to work and buy the goods they have produced. Substantial changes in the cost of travel to work or to the shops would arguably have some impact on wage rates and shop prices. Many other categories of trips, while not in themselves productive, nevertheless can have substantial impacts on the economy, by changing patterns of demand for leisure activities, for example, which then stimulate the development of services. The case of tourism, where the trip itself may be part of the product, can also have powerful economic implications: in some areas, tourism may be the main industry.
3.65 Thus, while the distinction of more and less productive movement seems intuitively sensible, and directly relevant to our terms of reference, it is not immediately obvious how - or indeed whether - it can be converted into an operational and unambiguous classification of vehicles or journeys.
3.66 We start by considering how the national income accounting system itself handles this problem. In principle, its approach is clear: if a good or service is bought and sold in a market, it is part of GDP, and its value is measured by its price. Although some ambiguities and exceptions can arise, in most cases this approach is well-defined and consistent. From the point of view of transport, there can be some implications which do not correspond exactly with the categories used in travel surveys and transport models - doing your own shopping does not contribute to GDP, but paying someone else to do so does (as also does paying for the goods to be delivered to your door). However, these particular anomalies are of the same form as general issues of national income accounting, as discussed in paragraphs 3.11 - 3.12, and are not usually thought to be so serious as to invalidate the usefulness of GDP.
3.67 A much bigger issue for transport has surrounded the empirical observation that people are prepared to pay definite, but not unlimited, amounts of money to save time, for example, by choosing a fast expensive method of transport in preference to a slower, cheaper one. This is demonstrated for actual choices made by people who are confronted by such an alternative, and also by many hypothetical studies of what they would choose. Some willingness to pay for such time savings applies independently of whether the trip is for a productive or unproductive purpose (though the amount people would be willing to pay can vary). The logic then goes that, if they are willing to pay money for such an advantage, it must be bringing them a benefit or utility in some ways comparable to what they would get if they spent the money on some alternative product.
3.68 This has lead to the widespread use in transport appraisal of what is often called 'economic welfare' - a measure of the benefit of 'consuming a trip' which is logically identical to the benefit of 'consuming a commodity', and applies whether or not the trip itself has a productive objective, and also whether or not any money actually changes hands: it is what people would pay that is counted, not what they do pay.
3.69 This leads to a standard economic analysis as portrayed in Figure 3.1 and Figure 3.3, which sees the value of travel in terms of consumer surplus, calculated from the total value of the trip (measured by the area under the demand curve) minus the outlay in terms of money and time added together into a generalised cost. For marginal changes in generalised cost of the sort produced by many transport improvements, the change in the consumer surplus can
Transport and the economy: full report (SACTRA)
57
be calculated relatively simply, provided only that the demand curve is reasonably correctly estimated over the relevant small region.
3.70 The downward sloping demand curve implies that users' valuation of journeys varies. If the marginal generalised cost (including cost of time) is common to all users, then there is an implied hierarchy of response to, say, a progressive increase in the price of travel. Those journeys with the lowest consumer surplus - ie, the ones with least value for users - will be the first ones that are discontinued, with higher value trips only being discouraged when the price has exceeded the benefit they bring. However, if the same volume of reduction in trips were achieved by other means, such as prohibiting certain types of journey, this is likely to remove a mixture of journeys with both low and high consumer surplus. Therefore, this way of conceptualising 'more productive' - ie, in terms of consumer surplus - suggests that arbitrary categorisation of journeys, failing to allow for within-category differences in consumer surplus, will produce less overall benefit than price methods.
3.71 In relaxing some of the simplifications in these diagrams, the most important complication is to allow for different users to have different values of time and thus to value and react to changes in generalised costs differently. In current DETR appraisal practice there is a combination of the 'national income' approach and the 'economic welfare' approach. Time saved on trips made for 'employers' business' purposes are assumed to contribute an economic value equivalent to what a profit-maximising employer operating in perfect competition would pay for the value of the product that the employee would create in the saved time - ie, at the margin, the average wage rate plus employers overheads. (Some empirical studies have suggested that employers do indeed behave in this way, approximately). On the other hand, time saved on trips made for other purposes - journeys to work, shopping, leisure, etc. - are given a value based on the empirical studies and surveys of what the travellers would pay themselves, which is usually found to be in the range of 20% to 50% of their wage rates.
3.72 This distinction is operationally rather easy, and implies that, while economic welfare arises from all trips, on average a considerably larger contribution is obtained from freight, travelling salesmen, service engineers and the like (for which salaries are paid and which enter into GDP) than for other trips, which are made at the travellers own expense and do not enter into GDP. However, empirical values of travel time estimated in this way do show very considerable variation, for example, by journey purpose, by method of transport, and by the income of the people concerned. These interact: for example, in one recent study, inter-urban car travel on employers' business is estimated to have an average time value of 16.9 pence per minute, compared with 1.89 pence per minute for urban leisure travel on buses (Wardman, 1998).
3.73 There is a limit to how many different categories of values of time may be allowed for in practical appraisal, especially when some of the sources of variation are not apparent simply by observation of class of vehicle used. In addition, there are problems of interpretation of the empirical results - for example, that people with higher incomes are prepared to spend more money to make travel time savings may not indicate that they are receiving higher welfare gains from doing so, but merely that the value of money to them is less. In addition, for each of these categories, there will be a distribution about the mean. Similarly individual transport users' demand curves will differ. This means that it is not really feasible to obtain accurate estimates, for every individual and trip, of the consumer surplus change arising from changes in traffic conditions, transport infrastructure, or measures to reduce traffic. A degree of averaging is always necessary.
Transport and the economy: full report (SACTRA)
58
3.74 Thus we have, at the moment, two theoretically possible methods of distinguishing more and less productive travel. The first relies entirely on GDP conventions, and would value trips in accordance with 'the market', measured by the actual transactions where money changes hands. This would give weight to lorries, service vehicles, individuals travelling on company business, bus drivers and professors going to official advisory committees, but would accord little, or in some cases, no productive value to journeys to work, shop, leisure, bus passengers, or professors going to unpaid television interviews. The second relies on willingness to pay (whether or not the payment is actually made) which accords a value - smaller, but in aggregate very substantial indeed - to all these unpaid trips.
3.75 The difference between the two is so large that it is probably the main source of difference between the 'economic welfare' interpretation of our brief, and the 'GDP' interpretation, as discussed in paragraphs 3.11 - 3.12. We have discussed, but been unable to devise, any operationally usable third system which would reflect more closely the intuitive judgements which in paragraph 3.63 seemed so simple. As a Committee, we feel more comfortable with the broader economic welfare approach, and make the caveat that this implies that transport measures which contribute usefully to the economy will not always be reflected in the measured output of productive companies.
Summary
3.76 An efficient allocation of resources requires that marginal benefits and marginal social costs are equal. In cases of market failure, government action may be justified to raise economic welfare by improving resource allocation. In the case of transport, external diseconomies from congestion and pollution are likely to require appropriate interventions. Care should be taken to consider the distributional as well as the efficiency implications (paragraphs 3.24-3.28). Failure to take account of the external costs of transport will tend to encourage the provision of too large a road capacity, but failure to invest in roads when marginal benefit exceeds marginal social cost implies that capacity is suboptimal (see text of Figure 3.1).
3.77 Social cost benefit analysis is a valuable tool for assessing both transport infrastructure schemes and traffic reduction measures. In an economy where there is perfect competition in all markets, valuing the transport benefits amounts also to valuing the total economic benefits of an intervention (paragraph 3.46). We define the notional best possible assessments under these conditions, including environmental effects, as CBA** if land use impacts are included (paragraph 3.48). Market imperfections in both product and factor markets mean that, in practice, total economic benefits may differ from transport benefits and further analysis will then be necessary (paragraph 3.50). We define the notional best possible assessment under conditions of imperfect competition with labour market imperfections and allowing for all externalities as CBA*** (paragraph 3.53).
3.78 In circumstances of market failure where wage rates do not reflect the true opportunity cost of labour, it may be appropriate to subsidise regeneration in well-defined areas. The maximum subsidy rate should depend on the magnitude of the wage distortion and the additional job-years of employment that are predicted (paragraph 3.62).
3.79 The idea of 'more productive' and 'less productive' travel has been shown to have several meanings and to be difficult to use in practice (paragraphs 3.63-3.75). It should, nevertheless, be recognised that a substantial, although variable, fraction of the benefits from transport

Transport and the economy: full report (SACTRA)
59
infrastructure schemes accrue in the form of time savings to persons that do not figure in GDP (paragraphs 3.54-3.57).
3.80 Decisions made with regard to transport policy will have implications for sustainable development. These will arise both through impacts on the stock of transport infrastructure capital and through impacts on resource depletion and environmental degradation (paragraphs 3.13 - 3.15).
1 Thus, in Figure 3.1, raising taxes to P* would generate a revenue flow of P*AHPT.
2 However, policy interventions, especially through use of the funds raised through taxation, may reduce this loss. This is explored further in chapter 7.
Transport and the economy: full report (SACTRA)
60
Overview of Chapters 4 and 5
1 Chapter 4 and Chapter 5 explore the way in which transport contributes to the growth and efficiency of the economy, necessarily using the language and technical apparatus of economic theory. This overview is intended to give a less technical summary of the argument for those who want to bypass these chapters, or to have signposts in their mind while reading them. Chapter 4 looks at the general processes at work in the economy as a whole. Chapter 5 develops these in more detail at the level of the individual firm, household and locality.
Causes of economic growth
2 Traditional economic theory suggested that economic growth depended on greater inputs, or more efficient use, of capital and labour: investment would have an effect on the level of production, but only a transient effect on its rate of growth. More recent theories treat skills, knowledge, and infrastructure as forms of capital, with effects that can ultimately increase growth rates as they spread through the economy. One approach suggests that an initial public investment (if it does not 'crowd out' even more worthwhile investment elsewhere) can both enhance the productivity of private capital, and trigger innovation which then fuels itself by further improvements and further growth.
3 In these theories innovation is central, but problematic. If many small firms are engaged in perfect competition this should force prices down to the most efficient levels but this will give little incentive, or cash, to fund innovation. On the other hand, firms enjoying the benefits (to them) of a degree of monopoly power may have the incentive and cash to innovate, but at the expense of higher prices than is economically efficient.
4 Therefore, the question arises whether public investment in general, and transport infrastructure in particular, can fulfil this role of stimulating innovation and growth. An influential study was carried out in the US by Aschauer (1989), who compared output and productivity in regions and in times of greater or lower infrastructure investment. He reported that these measures of economic performance seemed to be very much higher in conditions of high public investment implying rates of return which were much greater than those typically calculated in cost benefit studies of transport investment, and therefore appearing to support suggestions that the economic benefit must be additional to the transport benefit usually calculated. However, subsequent technical reviews of this work by other analysts suggested that the results were substantially exaggerated, due to various methodological and analytical flaws. On balance, the Committee concludes that this evidence cannot be used to support the case for a significant positive effect of public infrastructure on private economic activity, over and above that which would be suggested by cost benefit studies.
5 This dispute over the evidence highlighted the importance of clarifying what mechanisms, affecting innovation, it would be reasonable to expect from transport improvements. These could include:
• increasing the size of markets, to allow higher expected sales to cover fixed costs in the event of successful innovation;
• encouraging the formation of clusters of firms whose specialist knowledge has synergetic effects;
• stimulating technology transfer by helping to attract foreign investment; and
• leading to better integration of markets, and enhancing competition.

Transport and the economy: full report (SACTRA)
61
Transport improvements considered as reductions to trade barriers
6 Such considerations led to a new strand of theoretical analysis in which transport costs are treated as analogous to 'trade barriers' in general (eg, duties imposed on imports to protect home producers). Such barriers are often thought to have a big effect on international trade, especially where markets are not assumed to be perfectly competitive. For example, the removal of barriers in Europe connected with the 'single market' were estimated by the European Commission to have the potential to raise EU gross domestic product, by 4%-6%, because of the efficiency of larger scale production, greater competitive pressure, concentration of some products in the countries most suited to produce them, and transfer of new technologies. In addition, some have pointed to longer run impacts on growth through favourable impacts on innovation and investment.
7 We suggest that this analogy seems most plausible when considering very large investments, or combinations of investments, which have a large cumulative effect on the transport network, or address particularly inaccessible areas. With this caveat, the analogy produces a number of insights which have not been emphasised previously:
• Not all the effects of market integration will be favourable for a given geographical area. There will be winners and losers as some activities expand while others contract. Moreover, the stronger competitive pressures arising from freer trade could involve losses of profits to domestic producers which outweigh gains for domestic consumers. Market size or market access effects may encourage some firms to relocate towards more centrally located regions, while changed cost differentials may draw others to the periphery.
• The potential for a transport improvement to promote growth through market integration may be dampened if the potential benefits of reduced transport costs are offset by rises in other business costs and increased congestion.
• 'Imports and exports' are a much greater proportion of the activity of a city or region than of a nation, so that the smaller the geographical area considered, the larger the part of the local effects which is likely to consist of redistributing benefits, rather than increasing them overall.
Theoretical modelling of transport effects in the context of imperfect competition
8 The Committee commissioned Venables and Gasiorek to carry out a theoretical study (1998) allowing for the existence of imperfect competition. It is a simplified model which does not itself allow for congestion and other external costs, though the Committee has extended its logic to include these. Its results are expressed as a ratio of the final economic benefit to the net present value calculated from an otherwise perfect 'conventional' CBA. We stress that the calculated ratios themselves cannot be applied, in size or even direction, to the output of, for example, a DETR COBA study of a specific road scheme, partly because COBA itself has some other weaknesses, and partly because some of the numbers in the model, at this stage, are only assumptions rather than having an empirical base.
9 With these caveats, the model's approach suggests the following:
• where a transport improvement enables more output to be sold by an industry whose prices exceed marginal social cost as the result of market power, the transport benefits will understate the total benefits, and conversely, understate the disbenefits from a measure which increases transport cost;
Transport and the economy: full report (SACTRA)
62
• where price in the transport-using sector is below social marginal cost, for example, because of subsidies, transport benefits will overstate the final economic benefits of a transport improvement and vice versa for cost-increasing interventions; and
• where the transport improvement induces increased competition and reduces price cost margins in a sector which previously exercised market power, there will be a further welfare gain not captured by the transport benefits and, conversely, a welfare loss if the effect is to strengthen market power.
10 In practice, there will be combinations of degrees of imperfection in competition in the transport and transport-using sectors which allow for a variety of possible outcomes. Chapter 4 identifies eight possible situations in addition to that represented by the conventional CBA model (see Table 4.2). The model, though still significantly incomplete, permits diagnosis of some cases in which it is very likely that conventional methods of appraisal will seriously mislead.
11 The Committee concludes that, given a substantial degree of imperfect competition, even a correctly performed cost benefit analysis may give seriously biased results. There is, however, no 'magic' number applicable in all circumstances, and the bias may go in either direction.
12 The Committee then considered a number of detailed linkages which have been underdeveloped in traditional models and which appear to require further attention.
Freight and logistics
13 Analysis of the effect of transport changes on firms' freight and logistics operations suggests that:
• direct savings in a firm's existing transport costs as the result of a transport improvement are typically seen as too small to improve productivity enough to induce increased output; but
• transport improvements do present firms with a range of opportunities for reorganisation from which cost savings significantly in excess of the initial transport cost savings may be achieved, for example, from a reduction in the number of production locations or depots and from lower stock levels; and
• other opportunities to improve efficiency and/or output include improved vehicle utilisation, the opportunity to source supplies more widely, leading to better quality and or more competitive prices, and to compete for sales in more distant markets.
14 These effects are marked, at the level of the firm, by thresholds below which little or no change is warranted, but above which quite large changes in production or distribution may be triggered. If firms are very similar to each other, then threshold effects at the level of the firm will result in pronounced discontinuities of effect when they are aggregated together.
Labour markets
15 Labour is a major input to all activities and is generally locationally specific. One of the specific mechanisms whereby transport improvements can have an effect on labour productivity is by reducing the time spent travelling both for travel in the course of work, and for commuting to work. In addition, firms may be able to access better skills through easier access to a wider labour market. Some of this gain might be allocated to the employees themselves in higher wages, and some to customers in lower prices. On the other hand, some
Transport and the economy: full report (SACTRA)
63
commuters may respond to easier commuting by increasing their area of job search, as they can travel further for the same generalised cost. The effect of this on wages might go either way: competition for local jobs by distant employees would tend to reduce local wages, while competition for workers by distant employers would tend to increase wages for local residents. The outcome may not be the same for all skills and sectors.
16 These labour market effects allow increased specialisation of the labour force with consequent benefits for productivity. This is the main premise upon which a number of recent modelling studies produce findings of large scale continuing productivity and growth effects from major transport improvements. Although we find the existence of such an impact plausible, there is so far a lack of robust, transparent evidence to back up the scale of the claims that have been made.
Housing market
17 A further linkage is from the labour market to the housing market. A common response of commuters to transport improvements is to move house to an area more distant from their work in search of lower house prices or a better quality of life. This migration response will have a number of effects, sometimes operating to dampen the direct effect of the commuting responses just discussed:
• there will be an increase in the potential labour supply of the new area, which will tend to raise unemployment or exert downward pressure on wages paid by local firms, in the opposite direction to the effect of extra competition from firms in that original area; and
• the migration of extra workers to the new area will raise the demand for housing and, especially if there are constraints preventing a ready increase in the supply of housing, will put upward pressure on local house prices, which will lead to upward pressure on wage rates to compensate.
18 The housing market is known to display fairly close relationships with transport improvements, and indeed house prices, and land values may rise speculatively in anticipation of transport improvements. It may be that much of the benefit arising from a reduced generalised cost of commuting are captured in the housing market rather than the labour market, especially where there are severe housing supply constraints. These are typically treated as double-counting and therefore ignored, but we suspect that there may be more complex linkages at work here which could have additional impacts to those measured in the direct transport benefits.
Local and regional effects
19 When transport costs between a region and the outside world are high, firms within that region serving their own regional market are protected from competition from firms in other regions, and also find it difficult to compete in those outside markets. A reduction in transport costs will not automatically ensure larger markets: lower transport costs may benefit firms with the potential to achieve larger scale economies, but they may also benefit firms which have lower input costs which they can use to undercut the costs of larger firms. Such firms may either be located within the region where the improvement in transport has been implemented, or in another region.
20 This process can have ambiguous effects on the relative development of different regions:
Transport and the economy: full report (SACTRA)
64
• where there are efficiency advantages in large scale production, there will be a tendency for economic activity to concentrate in central core regions, up to the point where these regions become too crowded; and
• where lower costs of inputs, such as labour or rents, dominate, there may be a deconcentration of economic activity.
21 This analysis helps to explain the problem which we call 'the two way road'. Claims that the impact of improved transport facilities will arise at one end of facility ignore the competitive impact on other regions served. Which end of the link gets the greater benefit will depend on whether either region has unique assets to exploit (such as natural resources), the relative configuration of scale economies, the size of the local markets, local labour and land market conditions, and the nature and scale of backward and forward linkages in local sectors.
22 The model developed by Venables and Gasiorek (1998) was used to explore the effects of different assumptions on which region would benefit from transport improvements between two or three regions engaging in imperfect competition. The results confirm that the effects are complex, and may go in different directions sometimes favouring a large central region and sometimes a small peripheral region. While the specific results depend on the assumptions made, the exercise confirms that the approach is capable of producing quantitative estimates of inter-regional effects, and we judge that it would be worthwhile to carry out further work with the model especially in including empirical data on imperfect competition, external costs, and the specific trade among some real regions.
23 An alternative route into some of the spatial effects is offered by Land-Use/Transport Interaction (LUTI) models. There have recently been significant developments in this field, though there are reservations about them in relation to:
• the treatment of market mechanisms, in particular where there is imperfect competition;
• problems of consistency in the treatment of all aspects of all markets, the models were designed to focus just on the transport elements of decisions;
• the assumption of convergence to equilibrium and the lack of a genuine dynamic response, although models do deal with a quasi-dynamics that allows a period by period iteration;
• substantial data and estimation problems; and
• their ability, even when land-use effects are accurately forecast, to express these in terms of changes in economic welfare.
Recommendations
24 In Chapter 4 and Chapter 5, the detailed argument leads to a number of recommendations, which are collated together here for convenience.
• We recommend that the Department undertakes further development of CGE modelling of the total economic impacts of transport schemes with particular emphasis on incorporating endogenous growth, alternative assumptions as to the behaviour of the labour market and better representations of the transport system. (Paragraph 4.58)
• We recommend that the Department investigates the use of CGE modelling in conjunction with a transport model, to explore the size of the discrepancies between total economic impacts and transport impacts in the cells of Table 4.2. (Paragraph 4.76)

Transport and the economy: full report (SACTRA)
65
• We recommend that further work be devoted to research on the use of input-output models in helping determine and measure the key linkages through which transport affects regional economies. (Paragraph 5.106)
• There is a need for more consistent research evidence on the use of transport and transport costs by sector to inform appraisal practice. We recommend detailed discussion with ONS to define improvements in data collection which will, in particular, allow for better assessment of the role of employers' business travel. (Paragraph 5.130)
• The relationship between wages and employment (the wage equation) in local labour markets, how this is affected by the costs of transport (both into and out of a region and within it) is a major question for further research. We recommend a detailed study of the commuting response to a substantial change in transport provision which examines not just changes in commuting patterns, but also the impact on wages and employment levels in adjacent areas. (Paragraph 5.131)
Conclusion
25 The theoretical and analytical argument of these chapters represents the core of the approach that the Committee has built on in identifying the nature of links that might be expected between changes in transport costs and the performance of the economy, and the conditions under which the impacts may be favourable or unfavourable. The reader wishing to follow this analysis at a more technical level will do so in the following two chapters. Alternatively, it may be preferred to move directly to Chapter 6, which addresses the question of the effectiveness of policy instruments to reduce traffic levels, if this is desired, and Chapter 7 which considers the economic effect of doing so.

Transport and the economy: full report (SACTRA)
66
Chapter 4 - The Linking Mechanisms: An Outline
Introduction
4.01 The main purpose of this chapter is to examine in more detail ways in which changes in transport infrastructure or traffic reduction measures may affect the growth, and thus the competitiveness, of the economy. Starting from the building blocks established in chapter 3, impacts on the level and on the rate of growth of GDP are distinguished. The mainsprings of long run economic growth are investment and productivity growth. If transport provision has an impact on the long run growth process it must work through these channels, either directly or indirectly, as a result of its effects on the decisions made by households and firms.
4.02 One of the main impacts historically of improvements in transport has been to reduce the costs of long distance trade and thus to make markets better integrated. This is perhaps the aspect which makes transport infrastructure 'special' rather than simply a run of the mill addition to the capital assets of the economy. This may be more important with regard to the impact of better transport networks than at the level of the individual road scheme and it may lead to important economic effects which are not captured in conventional cost benefit analyses, if prices are not equal to marginal social costs in all markets.
4.03 This chapter explicitly considers the effects of market integration on productivity levels and on growth as an effective way to deeper analysis of the possibility that total economic benefits (or disbenefits1) diverge from transport benefits of transport schemes even where the latter are well-measured. Particular attention is given to circumstances where the transport-using sector is imperfectly competitive (and thus prices will exceed marginal private, and probably marginal social, costs), bearing in mind that we can expect imperfect competition to be a pervasive feature of a growing economy in which innovation is strong. Possible impacts on productivity coming from reorganisation of firms' activities, including the realisation of economies of scale, are also discussed.
4.04 Recent developments in economic modelling have made it possible formally to analyse some of these aspects of economic development that were previously too difficult. In particular, it is now feasible to incorporate increasing returns and imperfect competition and to allow for the possibility of vicious and virtuous circles. In the later part of this chapter, detailed investigation of these impacts of transport investment allows us to identify cases where it is likely that measurement of transport benefits in CBA**, will either over or underestimate the total economic benefits from investment in transport infrastructure, and also cases where current practice is likely to give a reasonable first approximation of overall economic benefits. Detailed examination of the implications of this discussion for appraisal practice is, however, held over to Chapter 8.
Transport and the Economy
4.05 Traditionally, transport has been thought of in terms of derived demand, implying that the basic causality runs from the level of activity in the economy to the demand for transport. People and businesses demand transport in order to enable them to carry out desired activities. This is too simple, however, since changing the provision of transport enables changes in the location and composition of activities. For individuals, this might be reflected in changes in commuting patterns or holiday destinations. For businesses, the impact might be felt in terms of new sources of supplies, reorganisation of production or access to more distant markets.

Transport and the economy: full report (SACTRA)
67
4.06 The efficiency aspects, stemming from the role that improved transport can have in promoting increases in total factor productivity (TFP), are central to assessing the importance of transport to the economy. These form the basis of the claim that improving transport provision will improve competitiveness or raise the rate of economic growth. This argument has, for example, been widely used at an EU level in the context of increasing integration of markets through projects such as the Trans-European Networks. The next section sets out the analytic underpinnings of these arguments in detail at a macroeconomic level. The following chapter traces out further ramifications in terms of the housing and labour markets and examines spatial implications including regional aspects.
Transport infrastructure and growth
4.07 We first examine the sources of economic growth at the macroeconomic level in general and then see how these arguments can be applied to transport. Output is a function of the capital and labour inputs used in the economy together with the efficiency with which these inputs are used. Growth thus depends on increases in these factor inputs and TFP. Transport can be seen to have an obvious role here, both directly through investment in transport infrastructure, vehicles and logistic systems increasing capital, and through the impact that more efficient transport can have indirectly through inducing greater efficiency in the way that other sectors use their own inputs.
4.08 Traditional neo-classical views of economic growth (Solow, 1956) place emphasis on diminishing returns to capital accumulation, such that the impact of a higher investment rate on capital stock growth, and thus on output growth, eventually tends to ebb away, so that higher investment leads to a rise in the level of output per head rather than a permanent increase in its growth rate. In the long run, trend growth in incomes per head would depend on growth in TFP which was regarded as an unexplained constant, reflecting the impact of technological change. More recently, there has been more interest in identifying circumstances in which diminishing returns to capital accumulation may not obtain and in which growth rates can be influenced by investment in the longer term.
4.09 In this context, two different strands of theorising in terms of endogenous growth have developed. One widens the definition of capital to include, for example, human capital and/or infrastructure as well as directly productive physical capital. Because of this broader definition of capital, at the least, diminishing returns can be expected to be less severe, such that any boost to growth from investment takes longer to work through the economy and for growth rates to revert to the trend. More ambitiously, it might even be argued that investment in broad capital would not be subject to diminishing returns at all.
4.10 The role of public infrastructure investment in this type of model as a possible antidote to diminishing returns to private capital accumulation has been argued by some to be very important, and this has led to a number of attempts at quantification which are reviewed below. On the other hand, given the importance of incentives in the growth process, the raising of taxation to finance public infrastructure spending can have a negative impact on growth through reducing private investment. An important consideration for government is the balance between these two offsetting effects.
4.11 In fact, extensive investigation of this broad capital model of growth has produced fairly general agreement that there are still diminishing returns to investment (Oulton and Young, 1996). This has led to increasing interest in explaining TFP growth through models in which innovation, including technology transfer, is endogenous, ie, responsive to economic

Transport and the economy: full report (SACTRA)
68
conditions. Here, additions to the capital stock could be one of a number of factors that encourage higher innovative effort to reduce costs. These concerns are very similar to the emphasis of the recent Competitiveness White Paper that "entrepreneurship and innovation are central to the creative process in the economy and to promoting growth, increasing productivity and creating jobs." (DTI, 1998, p. 14).
4.12 At a deeper level, growth depends on incentives to invest and to innovate and these are captured by the notion of expected returns, ie, the expected flow of profits that will accrue to the decision maker, as the driver of accumulation and endogenous innovation. For transport, the key question is whether improvements in transport provision are likely to encourage more TFP growth by improving incentives to innovative activity. This is more likely to be important at the level of the mega project or when a series of schemes has a large cumulative effect on the transport network than for the individual road scheme. For example, this might work through increasing the size of markets, thereby allowing higher expected sales to cover fixed costs in the event of successful innovation, or through encouraging the formation of clusters of firms with favourable knowledge spillovers, or by stimulating technology transfer through foreign investment.
4.13 Given that innovative effort incurs fixed costs, it will not generally be supplied by private agents in conditions of perfect competition where instantaneous imitation by other producers will not permit these costs to be covered. This has long been recognised in the form of patent protection for inventors, although in general other imperfections of competition which permit a period of supernormal profits, such as long lead times in replicating a new product or process where details remain confidential to the pioneer, are more important in encouraging innovation (Levin, Klevonick, Nelson and Winter, 1987). From the perspective of the endogenous innovation approach, growth is embedded in an economic environment in which imperfect competition is a central feature.
4.14 This implies that there may be a trade-off between achieving an efficient allocation of resources at each point in time - where imperfections in competition might be regarded as a form of market failure - and ensuring adequate incentives for productivity improvement over time. Again, this is a familiar proposition that has been encountered in the context of regulation of privatised utilities with market power where the solution adopted in the UK has been price capping with periodic reviews. At the same time, it might be recalled that the best reward to the monopolist has been said to be the prospect of 'a quiet life', and empirically it seems that the absence of entry threats or strong competition encourages organisational slack that tends to outweigh the advantages of monopoly rents in stimulating innovation (Geroski, 1994). In general, transport improvements which lead to better integration of markets can be expected to enhance competition (see paragraphs 4.32 and 4.33 below).
Figure 4.1 Proximate and underlying sources of growth
4.15 In Figure 4.1, the main thrust of these arguments is summarised by a flow diagram. Impacts of underlying microeconomic foundations, ie, incentives and the policy framework by which these are underpinned, working through higher expected returns to greater investment and innovative effort are traced through their impact on capital stock and TFP growth to their growth rate effects. It is also important to recognise that investment with unchanged technology is generally subject to diminishing returns. Technological progress is fundamental to long run growth, as it is the way round the diminishing returns problem and is
Transport and the economy: full report (SACTRA)
69
the underpinning of long run productivity growth. Figure 4.1 captures these effects with the feedback arrows from TFP growth and capital stock per person growth to expected returns. Additional transport infrastructure will contribute to growth in physical capital per person, while improved transport provision, by leading to greater integration of the market, may also raise expected returns to innovation.
4.16 Figure 4.1 is presented in terms of an explanation of the proximate and underlying sources of the growth of real GDP/person. Reference back to the definition given in chapter 3, (paragraph 3.19) suggests that it could have been labelled as outlining the sources of improvements in competitiveness. This point is reinforced when the endogenous innovation model of growth is placed in a standard international trade context. In that case, one of its predictions is that relatively strong productivity growth by a country leads to an expanding share of world trade, thus implying success in the international markets test as well as faster income growth (Krugman, 1989). In general then, we can regard anything that leads to faster long-run growth as an improvement in competitiveness.
4.17 In most economies, a very high proportion of technological change results from technology transfer from other countries. If the rate of technological progress is sensitive to innovative effort, which itself responds to economic incentives and is not exposed to diminishing returns, then we have the truly endogenous growth envisaged by recent theorists. It should be noted that, in cases where TFP grows very rapidly, there are usually important contributions also from economies of scale and improvements in the efficiency of resource use.
4.18 The Competitiveness White Paper stresses three aspects of improved competitiveness and hence productivity growth, namely improved capabilities (to acquire, absorb and exploit knowledge), better collaboration through effective networking and developing clusters and markets where firms are more subject to pressures from rival producers. It is also clear that the DTI recognises the importance of incentive structures in supporting such activity. Thus the approach to enhancing competitiveness which underlies the White Paper is similar to our analysis of growth. It should also be clear that transport improvements may have a part to play in promoting each of these routes to better productivity performance.
4.19 Although there are clearly good reasons to believe a well-developed economy must have a well-developed transport system, it does not follow that marginal changes in investment in transport in an already well-developed economy will necessarily have a big impact on either the level or growth rate of income per head. There are essentially two reasons for this. First, the size of benefits projected to result from scheduled investment in roads is typically small relative to GDP. For example, the trunk road schemes that were shelved as a result of the recent Roads Review were estimated using current DETR methodology (which is less accurate than CBA*** and so may be a biased estimate) to have a net present value of benefits minus costs of about £2.2bn, implying an annual flow of net benefits equal to only a fraction of total GDP. Second, although the advent of endogenous growth theories gives encouragement that appropriate policy interventions might raise the long term growth rate, both the historical record and consideration of the components of TFP growth suggest that it is hard to change the overall rate of growth by much in a mature economy (Crafts, 1996). The Government's own recent pre-budget statement accepts that seeking to raise the trend rate of growth by 0.25 per cent per year by whatever means is an ambitious target (HM Treasury, 1998, paragraph 3.6).

Transport and the economy: full report (SACTRA)
70
Aggregate Productivity Models 4.20 Many empirical studies of the impact of transport on the economy have sought to correlate the impact of investments in transport infrastructure with GDP growth at the whole economy level. This research has been profoundly influenced by the results found by Aschauer (1989), which hugely raised the profile of this issue and undertook pioneering econometric analysis.
4.21 The approach adopted by Aschauer, and those who followed in his footsteps, was to think of infrastructure as an additional factor input in an aggregate production function relating GDP to the use of labour and capital. The approach was firmly in the tradition of broad capital approaches to economic growth and did not seek to model the implications of transport provision for innovation or productivity. Indeed, in pursuing correlation at the aggregate level, Aschauer did not explicitly identify the way in which infrastructure impacted on GDP and his paper was essentially a 'black box'. Aschauer (1989) found, using time series of data for recent decades in the USA, an elasticity of output with respect to public infrastructure capital of 0.4, implying a social rate of return on this investment of over 100 per cent, and that investments of this type were a very important source of economic growth.
4.22 Subsequent investigation of the United States experience, including some by Aschauer himself, has suggested that the original Aschauer results greatly exaggerated the quantitative impact of transport infrastructure. An output elasticity of around 0.1 seems a more likely estimate. Moreover, it also seems clear that there generally are diminishing returns to transport infrastructure investment and that, in extreme cases, returns can even be negative (Duffy-Deno and Eberts, 1991). Much less work of this kind has been carried out for Europe, the main study being that of Ford and Poret (1991) who obtained rather mixed results which they concluded offered little general support to Aschauer's argument that failure to invest in infrastructure was at the heart of the 1970's growth slowdown.
4.23 Subsequent research, however, has indicated that many of these econometric results were technically flawed. Good reviews can be found in Gramlich (1994) and Hurst (1995). Essentially the problems with Aschauer's work are that his results do not successfully rule out the possibility that the direction of causality runs from growth to infrastructure (via derived demand) or that the correlations that he found are spurious, reflecting the role of some other unspecified variable. The most sophisticated subsequent econometric studies, which go some way to circumventing these difficulties, tend to find much lower elasticities, also of the order of 0.1 (Lau and Sin, 1997), and thus imply rates of return much lower than those indicated by Aschauer originally.
4.24 A further problem with Aschauer-type work is that measurement of the value of publicly provided capital always causes problems, because of the difficulty of measuring the true cost of capital to the public sector. This calls into question the interpretation of the estimated 'production function coefficient', and raises the possibility that the estimated value of the output elasticity is too high because the true shadow price of public investment is understated by the method. Some authors have attempted to overcome this problem by the use of cost functions; research of this kind for the UK is in Lynde and Richmond (1993). These studies tend to suggest positive contributions of public capital, confirming the view that efficient public infrastructure can reduce the costs of the private sector and hence enhance the rate of return to private capital, but with much lower rates of return than suggested by Aschauer. It should be noted, however, that American research does suggest that, although infrastructure investment was not a major factor in productivity growth in manufacturing industry, it may

Transport and the economy: full report (SACTRA)
71
have more impact per dollar spent than publicly-financed research and development (Nadiri and Mamuneas, 1994).
4.25 A recent review of the American evidence by the Transportation Research Board (1997) came to two main conclusions:
• first, that, on balance, the evidence suggests that infrastructure investments have a modest positive effect on the nation's private economic activity; and
• secondly, that, when the opportunity costs of infrastructure investment are taken into account, it is likely that other forms of capital accumulation by the private sector or putting more resources into education and training are likely to offer better returns.
Transport Costs and the Integration of the Market: Levels Effects 4.26 It was noted in the introduction to this chapter that a key role of improvements in transport provision is to contribute to the integration of markets. Analysis of this contribution has some similarities with a situation where tariff and/or non-tariff barriers to trade are reduced and, thus, with the review of the static effects of the European Single Market Programme carried out by the European Commission. Figure 4.2, which is adapted and extended from their analysis, captures some of the possible channels of influence and opens the way to closer examination of the microeconomic mechanisms by which a transport improvement might affect productivity levels.
Figure 4.2 Transport costs and integration of markets: Static effects
4.27 Inter alia, the Cecchini Report (Emerson, 1988) argued that the Single Market would raise productivity through reducing the resources tied up in inventories, through promoting economic rationalisation to achieve scale economies and the removal of inefficiency and monopoly rents by strengthening competitive pressures, and by facilitating greater specialisation along lines of comparative advantage.
4.28 The basic logic of Figure 4.2, which could be used at the national or regional level and in which the signs represent the predicted direction of the relationship, is fairly simple. Consider a reduction in transport costs. This is expected to increase opportunities both for exporting and importing. The greater exposure to imports is seen as intensifying competitive pressure on firms and thus promoting greater efficiency, both through restructuring of industry and encouraging leaner production, and thus reducing production costs through raising productivity. Another channel of influence might run directly from lower transport costs to productivity and production costs, through the implications of better transport provision as firms are able to reap more internal economies of scale in production or obtain productivity gains from agglomeration effects.
4.29 In a given region, greater exports would tend to raise, and greater imports to lower, production, while production decisions will be taken in the light of the level of production costs. This means that changes in transport costs will have effects which work through onto the demand for factor inputs and are reflected especially in the land and labour markets. In general, these will tend to dampen the initial impact of any transport improvement. Thus, if the net effect is to raise the demand for labour and land, wages and rents will tend to rise and offset, to some extent, the initial cost reductions resulting from better productivity. Also, if the overall implication of higher production is to raise the volume of traffic, there is a possible feedback effect on transport costs through increased congestion.
Transport and the economy: full report (SACTRA)
72
4.30 Not all the effects of a reduction in barriers to trade are favourable for a given geographic area. In general, there will be winners and losers as some activities expand while others contract. While the Cecchini Report estimated that the completion of the Single Market could raise overall productivity in the EU by something of the order of 4.3 to 6.4 per cent, much of this came from a rationalisation of industry that would imply the end of production in individual sectors in some countries. Thus, pharmaceuticals were seen as likely to be produced in only two or three countries rather than ten. More fundamentally, recognition of the importance of monopolistic competition means that freer trade could possibly involve losses of profits made by domestic producers that outweigh gains for domestic consumers.
4.31 In order to explore fully the implications of economic integration, it is clearly necessary to examine the micro as well as the macroeconomic implications. This raises the possibility that there will be significant differences between the impacts on different sectors of the economy especially at the regional level. Market size or market access effects may encourage re-location of some firms towards the 'centre', while changed cost differentials may provide an offset which draws others to the 'periphery'. The process of 'creative destruction' in which economic development leads to the disappearance of many old jobs at the same time as new ones proliferate may be enhanced. Some employers may face an enhanced effective labour supply, as commuting costs are reduced, and respond by increasing investment. Depending on the relative strength of these forces, either convergence or divergence between regional income levels may result. Reductions in transport costs may also affect the equilibrium level of unemployment in a region, although this is not made explicit in Figure 4.2. These issues are taken up in Chapter 5.
Economic integration and growth 4.32 Strictly speaking, the above are levels effects rather than growth rate effects. Nevertheless, the argument can be extended beyond comparative statics. Baldwin (1989) suggested that there might be a substantial additional 'growth dividend' from the Single Market as some of any initial gain in income would be re-invested and since the efficiency gains would lead to a lower incremental capital to output ratio (ICOR) and the growth rate of the capital stock would increase. How strong an effect this would have on long term output growth depends, of course, on assumptions about diminishing returns.
4.33 Another reason to consider that there may be growth rate effects from what seems, prima facie, to be a one-off improvement could be that an endogenous growth extension of the Cecchini analysis would suggest that there are (probably favourable) effects on technology transfer and on innovation. This is exactly the argument favoured by the Competitiveness White Paper. Proximity to large markets is well-known to attract foreign direct investment which, in turn, often implies accelerated technology transfer. A recent econometric analysis found that foreign direct investment's impact on technological change accounted for 30 per cent of labour productivity growth in UK manufacturing between 1985 and 1995 (Barrell and Pain, 1997, p. 1781). The Single Market may also promote faster productivity growth based on the incentive effects of wider markets which allow the spreading of the fixed costs of research and development over higher expected sales volumes and of greater competition waking up sleepy management. Baldwin (1989, p. 268) estimated that the profitability of innovation would be substantially enhanced and that this might add somewhere between 0.3 and 0.8 percentage points to the EU growth rate. There is, however, a possible downside if competition increases so much as to undermine the appropriation of rents from investment in research and development.

Transport and the economy: full report (SACTRA)
73
4.34 Despite the possible theoretical ambiguities of the implications of greater openness to trade and the problems for empirical work in measuring openness well, at the national level, the evidence seems to be very clear that reducing barriers to trade raises TFP growth. Edwards (1998) finds a robust and sizeable relationship across countries between their openness to trade measured in several alternative ways and TFP growth. It seems plausible that similar effects will result from substantial improvements to transport networks.
Figure 4.3 Improved transport provision and economic growth
4.35 Figure 4.3 tries to capture in a very simplified form some of the links between economic integration and growth by combining some aspects of Figure 4.1 and Figure 4.2 and the discussion of them. The right hand branch of the diagram captures Baldwin's arguments about the dynamic effects of the Single Market. The left hand branch of the diagram follows up the suggestion by Aschauer (1989) that infrastructure investment has a strong direct influence on economic growth. The middle branch reflects the arguments about labour supply (noted in paragraph 4.31) in the context of Figure 4.2 and now extended to the long run. This maintains that transport improvements lower the effective cost of labour to firms which are thereby induced to raise investment so that transport improvements have a growth rate effect. Both these broad capital mechanisms relating transport improvement to faster growth may, in fact, have transitory rather than permanent effects, if diminishing returns to investment are taken into account.
4.36 Clearly, the validity and importance of these hypothesised relationships is an empirical question, and it could be that some of these putative effects are at best very weak or unproven. Also, rather more complicated links between improved transport provision and growth might be pursued which allow for interactions and feedbacks that are ignored in Figure 4.3. These typically involve explicit consideration of microeconomic effects working through land, labour and product markets. Further consideration is given to these issues in Chapter 5.
Possible implications for appraisal 4.37 It follows from the above that there are a number of ways in which decisions relating to the provision and management of transport infrastructure might affect economic growth outcomes. They can be summarised in the following questions which can be considered in the context of Figures 4.1 to 4.3.
• Is there reason to expect that investment or innovation will be increased/decreased? If so, in the aggregate or only in one region at the expense of another?
• Are there likely to be favourable effects on incentives for productivity improvement?
• Are there important consequences for productivity in the transport-using sector to be considered?
• Is there an effect on the efficiency of resource allocation?
• Is it likely that there will be any material effect on the integration of the market?
In each case, the further issue arises as to whether what is predicted is a one-off effect on the level of output or a growth rate effect.

Transport and the economy: full report (SACTRA)
74
4.38 Much of the above envisages the possibility of adjustments in the wider economy when transport provision changes (or economic integration is intensified) that would not be encompassed in conventional cost benefit analyses of road improvements. In chapter 3, it was established that transport benefits would not equal total economic benefits when prices diverged from marginal costs in the transport-using sector, in the goods market, or the labour market. In this section, we have added further reasons to suppose that, on occasions, transport benefits will fail to capture all economic benefits, including induced innovation effects, changed growth rates of the capital stock in the transport-using sector, and economies of scale which reduce production costs but are not reflected in extra road traffic.
4.39 It is therefore likely that conventional CBA will fail to capture all the economic impacts of infrastructure or reduction measures. It might be argued that CBA** should capture growth rate effects in shifts over time in the demand curve for transport as organisational change occurs and land use patterns adjust in the long run but this overlooks the key feature of endogenous innovation set out in paragraph 4.14 namely, that it occurs in an inherently imperfectly competitive environment and would only be adequately measured by using CBA***. It also follows that CBA** would tend not to reflect all the implications of transport schemes for competitiveness.
4.40 If these omissions are important, it may well be at the level of assessing big changes (eg, Britain without its motorway network or the introduction of traffic reduction measures on a very wide scale) rather than of the individual road scheme. Where these large scale changes are assessed, the implication is that traditional methods may not be adequate because they are partial rather than general equilibrium methods, because they are static rather than dynamic methods, and because they do not take full account of the implications of imperfect competition.
4.41 It must be recognised, however, that, at present, endogenous growth economics is stronger on theory than precise empirical results and is unclear about some predictions - for example, when exactly does imperfect competition promote innovation and what sort of imperfections in competition are good for technological change? Although there is good support for the proposition that incentives matter for productivity performance (Crafts, 1996), there is no ready reckoner that can be applied to adjust the results of CBA** for the consequences of transport interventions on incentives to invest and innovate, and adequate modelling of these impacts remains out of reach at present.
Changes in transport costs in an imperfectly competitive economy
4.42 If perfect competition is not pervasive and if there are increasing returns to scale in some sectors, then greater economic integration can give rise to important linkage effects. These can be thought of as feedback effects that arise from the expansion and contraction of various activities and resultant changes to structures of demand and costs and the locations of firms or industries. Productivity growth may also change as a result. Although ignored by CBA**, these aspects of economic integration are the centre of attention in the 'new economic geography' and it seems useful to find out whether techniques developed by practitioners in this discipline have anything to offer transport appraisal as a step toward CBA***.
4.43 One area of rapid progress in the new economic geography has been in Computable General Equilibrium (CGE) modelling which provides analysis of the effects of changes in transport costs and of greater economic integration between regions from the perspective of a general equilibrium approach allowing for the role of linkage effects. As noted in paragraph 4.04, it is now possible to model aspects of the role of transport in economic development

Transport and the economy: full report (SACTRA)
75
that were previously too difficult but represent cases where it is likely that transport benefits of projects will not be a good estimate of overall economic benefits. This style of modelling can potentially capture an important part of the effects to be considered in CBA***.
4.44 Accordingly SACTRA commissioned research to review the implications for cost benefit analysis of transport improvements or traffic reduction measures in the context of a world in which (some) transport-using sectors are imperfectly competitive and/or have internal economies of scale and with a model in which input-output linkages and externalities from the presence of other firms could be analysed explicitly (Venables and Gasiorek, 1998). The model is designed simply to consider transport as supplying a derived demand from industry and considers the equilibrium response in situations where transport costs change. Different modes of transport and congestion in the transport network are not analysed - nor are labour markets that do not clear. The assumed elasticities of the derived demand for transport for realistic levels of transport costs changes are in the range -0.3 to -0.6. This section seeks to convey the flavour of this approach and the following sections then consider the implications for possible bias in cost benefit analysis and the robustness of the results. We include in our analysis the implications of not including some transport externalities within the CBA, since that possibility has a profound influence on the results.
4.45 The most straightforward implication of divergences between price and marginal social cost in the transport-using sector is shown in Figure 4.4, which contains simple permutations of diagrams encountered in earlier chapters, and uses the same notation as chapter 3.
4.46 In Figure 4.4a, price exceeds marginal social cost as a result of the exercise of market power in the transport using industry. Initially, price at p2 exceeds marginal social cost (c1 + t2) including a transport element of t2. An improvement in transport costs from t2 to t1 has the usual benefits shown by the areas A + B when price in the transport-using sector falls to p1. In addition, however, marginal benefit exceeds marginal social cost for the additional quantity of output sold. This yields an additional benefit, (q2 - q1)[p1 - (c1 + t1)], represented on the diagram by the area C, such that total benefit is A + B + C. In Figure 4.4b, traffic has an external cost, say, from pollution. Ignoring this externality, gains from a transport improvement that reduces long run marginal costs from LRMC2 to LRMC1 will be A + B. External costs are raised by B + D from the additional journeys (q2 - q1) now undertaken and this reduces the net gains to A - D.
Figure 4.4 Cost Benefit Analysis with imperfect competition in the transport-using sector
(a) With no externalities (b) With externalities
4.47 Of course, improved transport provision may change the degree of market power in the transport-using sector, as was envisaged in Figure 4.2. Thus, in a case where economies of scale and rationalisation lead to many fewer producers staying in business, price-cost margins could rise. Conversely, where falls in transport costs increase entry threats in a sector the gap between price and marginal cost may narrow. In terms of Figure 4.4a the first outcome will tend to mean that price does not fall as far as p1 and welfare gains are thus reduced, while the second outcome will push price down below p1 and welfare gains will be enhanced.
Table 4.1 A Matrix of Market Failure Cases
Transport using sector
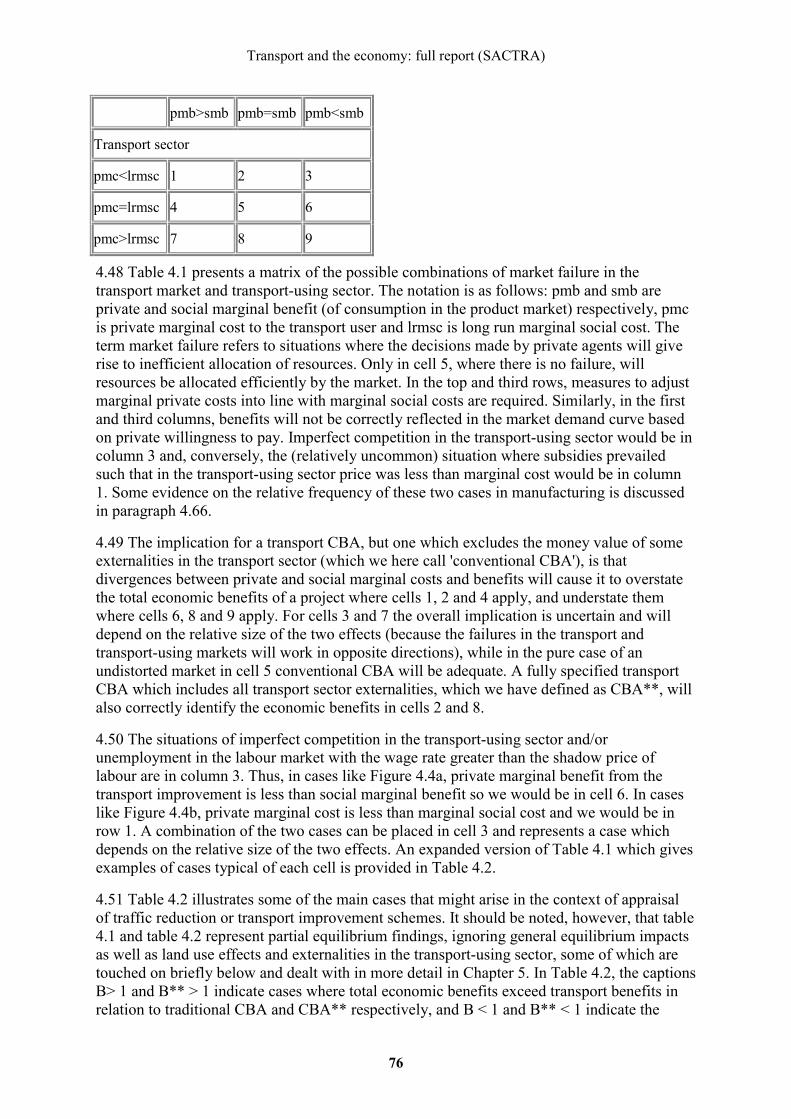
Transport and the economy: full report (SACTRA)
76
pmb>smb pmb=smb pmb<smb
Transport sector
pmc<lrmsc 1 2 3
pmc=lrmsc 4 5 6
pmc>lrmsc 7 8 9
4.48 Table 4.1 presents a matrix of the possible combinations of market failure in the transport market and transport-using sector. The notation is as follows: pmb and smb are private and social marginal benefit (of consumption in the product market) respectively, pmc is private marginal cost to the transport user and lrmsc is long run marginal social cost. The term market failure refers to situations where the decisions made by private agents will give rise to inefficient allocation of resources. Only in cell 5, where there is no failure, will resources be allocated efficiently by the market. In the top and third rows, measures to adjust marginal private costs into line with marginal social costs are required. Similarly, in the first and third columns, benefits will not be correctly reflected in the market demand curve based on private willingness to pay. Imperfect competition in the transport-using sector would be in column 3 and, conversely, the (relatively uncommon) situation where subsidies prevailed such that in the transport-using sector price was less than marginal cost would be in column 1. Some evidence on the relative frequency of these two cases in manufacturing is discussed in paragraph 4.66.
4.49 The implication for a transport CBA, but one which excludes the money value of some externalities in the transport sector (which we here call 'conventional CBA'), is that divergences between private and social marginal costs and benefits will cause it to overstate the total economic benefits of a project where cells 1, 2 and 4 apply, and understate them where cells 6, 8 and 9 apply. For cells 3 and 7 the overall implication is uncertain and will depend on the relative size of the two effects (because the failures in the transport and transport-using markets will work in opposite directions), while in the pure case of an undistorted market in cell 5 conventional CBA will be adequate. A fully specified transport CBA which includes all transport sector externalities, which we have defined as CBA**, will also correctly identify the economic benefits in cells 2 and 8.
4.50 The situations of imperfect competition in the transport-using sector and/or unemployment in the labour market with the wage rate greater than the shadow price of labour are in column 3. Thus, in cases like Figure 4.4a, private marginal benefit from the transport improvement is less than social marginal benefit so we would be in cell 6. In cases like Figure 4.4b, private marginal cost is less than marginal social cost and we would be in row 1. A combination of the two cases can be placed in cell 3 and represents a case which depends on the relative size of the two effects. An expanded version of Table 4.1 which gives examples of cases typical of each cell is provided in Table 4.2.
4.51 Table 4.2 illustrates some of the main cases that might arise in the context of appraisal of traffic reduction or transport improvement schemes. It should be noted, however, that table 4.1 and table 4.2 represent partial equilibrium findings, ignoring general equilibrium impacts as well as land use effects and externalities in the transport-using sector, some of which are touched on briefly below and dealt with in more detail in Chapter 5. In Table 4.2, the captions B> 1 and B** > 1 indicate cases where total economic benefits exceed transport benefits in relation to traditional CBA and CBA** respectively, and B < 1 and B** < 1 indicate the
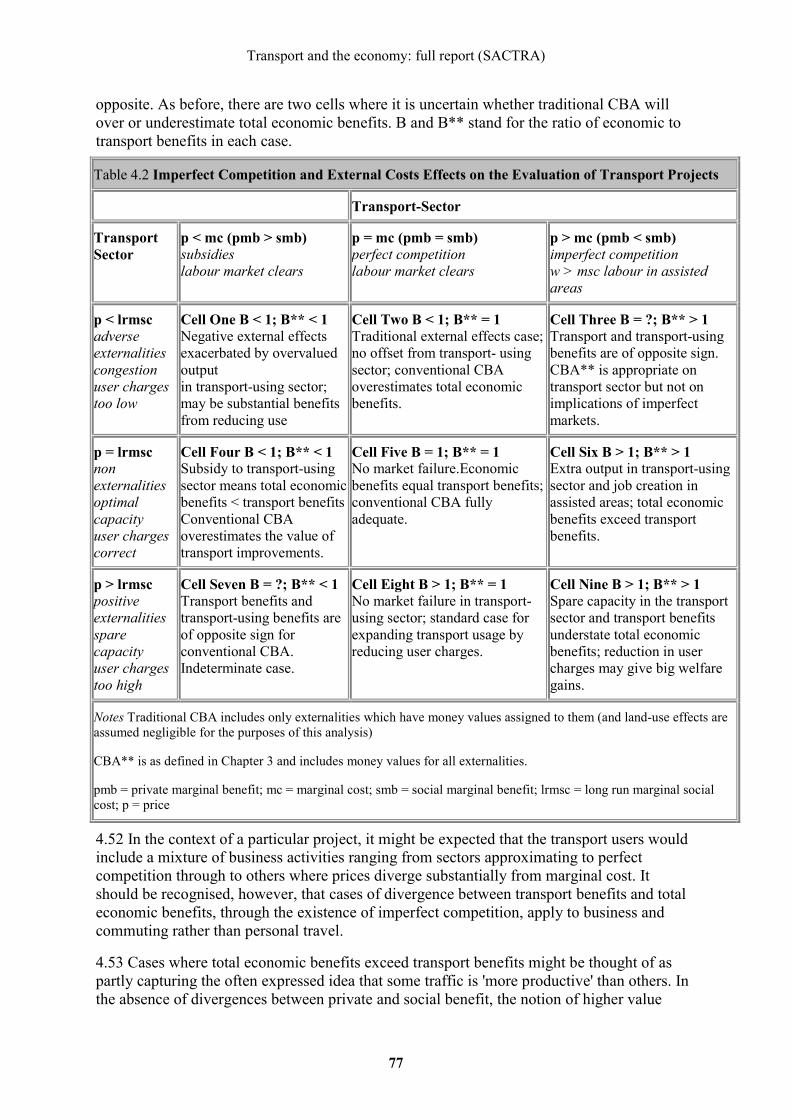
Transport and the economy: full report (SACTRA)
77
opposite. As before, there are two cells where it is uncertain whether traditional CBA will over or underestimate total economic benefits. B and B** stand for the ratio of economic to transport benefits in each case.
Table 4.2 Imperfect Competition and External Costs Effects on the Evaluation of Transport Projects
Transport-Sector
Transport Sector
p < mc (pmb > smb) subsidies labour market clears
p = mc (pmb = smb) perfect competition labour market clears
p > mc (pmb < smb) imperfect competition w > msc labour in assisted areas
p < lrmsc adverse externalities congestion user charges too low
Cell One B < 1; B** < 1 Negative external effects exacerbated by overvalued output in transport-using sector; may be substantial benefits from reducing use
Cell Two B < 1; B** = 1 Traditional external effects case; no offset from transport- using sector; conventional CBA overestimates total economic benefits.
Cell Three B = ?; B** > 1 Transport and transport-using benefits are of opposite sign. CBA** is appropriate on transport sector but not on implications of imperfect markets.
p = lrmsc non externalities optimal capacity user charges correct
Cell Four B < 1; B** < 1 Subsidy to transport-using sector means total economic benefits < transport benefitsConventional CBA overestimates the value of transport improvements.
Cell Five B = 1; B** = 1 No market failure.Economic benefits equal transport benefits; conventional CBA fully adequate.
Cell Six B > 1; B** > 1 Extra output in transport-using sector and job creation in assisted areas; total economic benefits exceed transport benefits.
p > lrmsc positive externalities spare capacity user charges too high
Cell Seven B = ?; B** < 1Transport benefits and transport-using benefits are of opposite sign for conventional CBA. Indeterminate case.
Cell Eight B > 1; B** = 1 No market failure in transport-using sector; standard case for expanding transport usage by reducing user charges.
Cell Nine B > 1; B** > 1 Spare capacity in the transport sector and transport benefits understate total economic benefits; reduction in user charges may give big welfare gains.
Notes Traditional CBA includes only externalities which have money values assigned to them (and land-use effects are assumed negligible for the purposes of this analysis)
CBA** is as defined in Chapter 3 and includes money values for all externalities.
pmb = private marginal benefit; mc = marginal cost; smb = social marginal benefit; lrmsc = long run marginal social cost; p = price
4.52 In the context of a particular project, it might be expected that the transport users would include a mixture of business activities ranging from sectors approximating to perfect competition through to others where prices diverge substantially from marginal cost. It should be recognised, however, that cases of divergence between transport benefits and total economic benefits, through the existence of imperfect competition, apply to business and commuting rather than personal travel.
4.53 Cases where total economic benefits exceed transport benefits might be thought of as partly capturing the often expressed idea that some traffic is 'more productive' than others. In the absence of divergences between private and social benefit, the notion of higher value
Transport and the economy: full report (SACTRA)
78
traffic would be based on the consumer surplus analysis discussed in Chapter 3. When the transport-using sector is analysed explicitly and where total economic benefits exceed transport benefits there is an extra component to the idea. The analysis of this section suggests that imperfect competition in the transport-using sector means that this may apply to some but not all business travel.
4.54 Imperfect competition in transport-using sectors whose output changes in the light of changes in transport costs is an important reason why conventional appraisal methods may be inaccurate. Figure 4.4a and the analysis of Table 4.2 are only part of the story, however. The CGE model also takes account of welfare effects coming from changes in firms' market power reflected in adjustments to margins of price over marginal social cost, and of changes in costs from economies or diseconomies of scale. Most importantly, when the perspective is one of general equilibrium, reduced transport costs can encourage firms to cluster near to their industrial suppliers and/or customers; in this case, there may be agglomeration effects (reflected perhaps in the clusters discussed in the Competitiveness White Paper) resulting from cost advantages of proximity to other producers in the transport-using industry. Also, in general, some sectors will expand and others will contract.
4.55 Variants of the model allow for different degrees of adjustment by firms to the change in transport costs. In the short run, the number of firms is assumed constant but, in the long run, transport improvements lead to entry and exit. When inter-industry considerations are allowed in, linkage effects occur through the implications of changes in one sector for the demand and cost conditions of other sectors. In general, a more integrated market tends to support fewer firms, which charge lower prices and remain profitable by producing at a larger scale, and encourages relocation when costs change, taking into account not only the transport costs of supplying final consumers or intermediate users but also feedback on wage costs and externalities from the presence of other producers. These are also effects of the type reviewed in Figure 4.2.
4.56 Central to the welfare implications in the full general equilibrium version of the model, which considers the full redeployment of resources in the economy following a transport improvement, is the issue of whether imperfectly competitive sectors elsewhere in the economy expand or contract relative to perfectly competitive sectors. Where imperfectly competitive sectors expand (contract), the additional benefits identified in Figure 4.4a will tend to be boosted (diminished). In terms of Table 4.2, it is clear that, in general equilibrium, we also need to consider revisions in the relative sizes of the cells resulting from changes in transport costs.
4.57 In sum, this model allows for many more interactions than would be included in conventional CBA and, in so doing, examines cases in which theory tells us to expect that conventional measurement of transport benefits will not identify overall economic benefits. It can also be used to consider the geographic incidence of benefits and to highlight losers as well as gainers from changes in transport costs. These aspects are taken up in Chapter 5.
4.58 Nevertheless, in its present form it by no means encompasses all the possible impacts of large transport schemes discussed earlier in the chapter. For example, the model does not consider feedback through the property market, nor imperfections in the labour market nor does it allow any of the endogenous growth mechanisms, in terms of induced investment or innovation, to operate, although extensions to incorporate these features may be possible in due course. It therefore does not, at this stage, encompass major aspects of competitiveness in the Knowledge Driven Economy of the Competitiveness White Paper. At present, it is

Transport and the economy: full report (SACTRA)
79
appropriate to use the model more to permit diagnosis of some cases in which it is very likely that conventional methods of appraisal will seriously mislead rather than to provide precise correction factors or a full accounting of competitiveness benefits. We recommend that the Department undertakes further development of CGE modelling of the total economic impacts of transport schemes with particular emphasis on incorporating endogenous growth, alternative assumptions as to the behaviour of the labour market, and better representations of the transport system.
Diagnosis of possible failures in cost benefit analysis
4.59 In the study referred to in paragraph 4.44, Venables and Gasiorek (1998) present their results in terms of the ratio of true benefit to that which would be estimated using CBA** assuming universal perfect competition, ie, B** of Table 4.2. This can be written as the ratio of the sum of the changes in consumer and producer surplus over the transport cost savings which, using the familiar 'rule of one half', can be written as
B** = ( CS + PS)/CBA
In general equilibrium, this may be either greater or less than one, depending on the relationships between price and marginal social cost in the transport and transport-using sectors, and the state of competition in expanding and contracting sectors.
4.60 The model embodies assumptions concerning its key market structures, cost functions, etc, chosen on the basis that the investigators believe them to be plausible, but they have not been directly observed or econometrically estimated. The present version sets environmental externalities equal to zero and also assumes market-clearing in the labour market, but these features could be modified reasonably easily. Although the values of key parameters have been selected a priori rather than subjected to empirical validation, they can be varied to investigate the sensitivity of results to the assumptions employed. Simulations of the model show that underestimates of benefits in CBA** will tend to be more serious the larger is:
• the demand elasticity facing the representative transport-using firm;
• the extent of market power (ie, the price-cost margin) in the transport-using sector;
• the size of linkage effects working through reductions in prices of input goods; and
• gains in efficiency from agglomeration.
4.61 The general tenor of the results obtained from the model as applied to business traffic can be summed up as follows. First, given substantial amounts of imperfect competition, CBA** may give seriously biased results. Thus, many of the permutations considered give ratios of total economic benefits to transport benefits above 1.3 and a few exceed 1.6. Secondly, there is no 'magic number'; on the contrary, the model suggests that as circumstances vary a wide range of values for B** will be found. In some cases, they are less than one (ie, CBA** would exaggerate the welfare gains). Thirdly, occasionally there are significant non-linearities where linkage effects and the entry and exit of firms suddenly become significant after a threshold of cost reduction is passed. Fourth, in comparison with CBA** which does not include environmental impacts, the ratio B rather than B** is appropriate in the event of divergences between marginal private cost and marginal social cost in transport arising from congestion, pollution, etc. Negative externalities of this kind imply that B would on average be lower and would more often be less than one than B**.
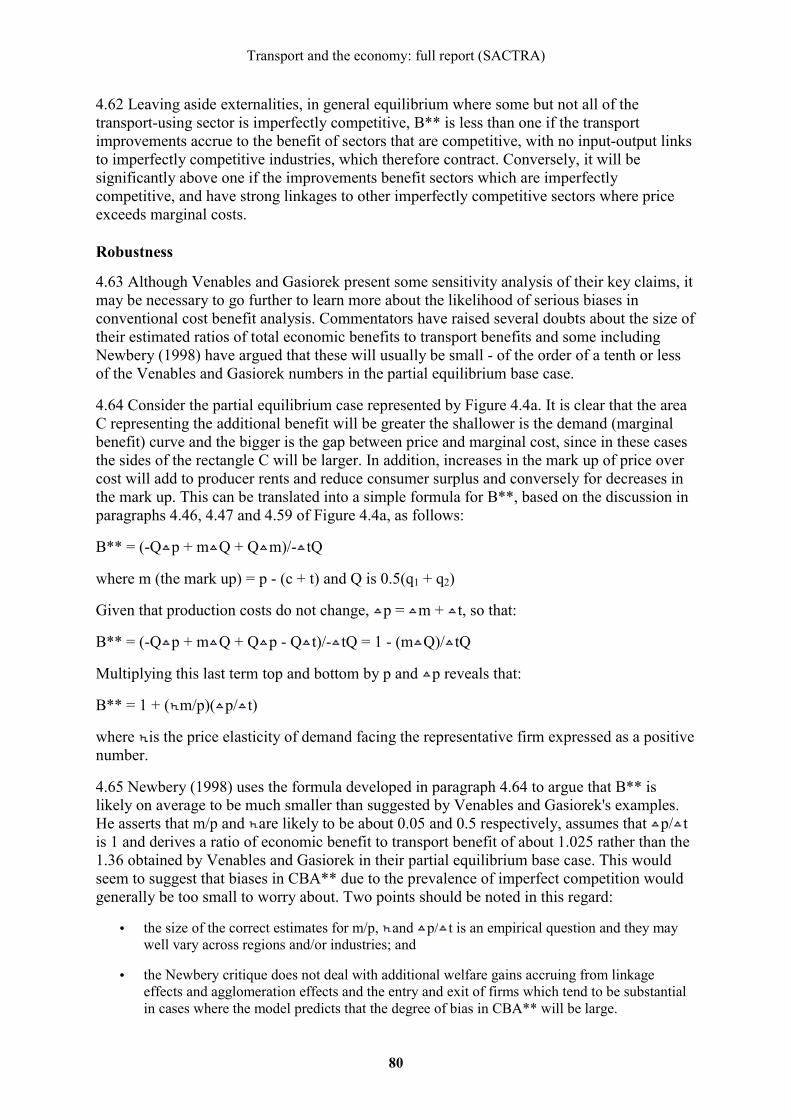
Transport and the economy: full report (SACTRA)
80
4.62 Leaving aside externalities, in general equilibrium where some but not all of the transport-using sector is imperfectly competitive, B** is less than one if the transport improvements accrue to the benefit of sectors that are competitive, with no input-output links to imperfectly competitive industries, which therefore contract. Conversely, it will be significantly above one if the improvements benefit sectors which are imperfectly competitive, and have strong linkages to other imperfectly competitive sectors where price exceeds marginal costs.
Robustness
4.63 Although Venables and Gasiorek present some sensitivity analysis of their key claims, it may be necessary to go further to learn more about the likelihood of serious biases in conventional cost benefit analysis. Commentators have raised several doubts about the size of their estimated ratios of total economic benefits to transport benefits and some including Newbery (1998) have argued that these will usually be small - of the order of a tenth or less of the Venables and Gasiorek numbers in the partial equilibrium base case.
4.64 Consider the partial equilibrium case represented by Figure 4.4a. It is clear that the area C representing the additional benefit will be greater the shallower is the demand (marginal benefit) curve and the bigger is the gap between price and marginal cost, since in these cases the sides of the rectangle C will be larger. In addition, increases in the mark up of price over cost will add to producer rents and reduce consumer surplus and conversely for decreases in the mark up. This can be translated into a simple formula for B**, based on the discussion in paragraphs 4.46, 4.47 and 4.59 of Figure 4.4a, as follows:
B** = (-Q p + m Q + Q m)/- tQ
where m (the mark up) = p - (c + t) and Q is 0.5(q1 + q2)
Given that production costs do not change, p = m + t, so that:
B** = (-Q p + m Q + Q p - Q t)/- tQ = 1 - (m Q)/ tQ
Multiplying this last term top and bottom by p and p reveals that:
B** = 1 + ( m/p)( p/ t)
where is the price elasticity of demand facing the representative firm expressed as a positive number.
4.65 Newbery (1998) uses the formula developed in paragraph 4.64 to argue that B** is likely on average to be much smaller than suggested by Venables and Gasiorek's examples. He asserts that m/p and are likely to be about 0.05 and 0.5 respectively, assumes that p/ t is 1 and derives a ratio of economic benefit to transport benefit of about 1.025 rather than the 1.36 obtained by Venables and Gasiorek in their partial equilibrium base case. This would seem to suggest that biases in CBA** due to the prevalence of imperfect competition would generally be too small to worry about. Two points should be noted in this regard:
• the size of the correct estimates for m/p, and p/ t is an empirical question and they may well vary across regions and/or industries; and
• the Newbery critique does not deal with additional welfare gains accruing from linkage effects and agglomeration effects and the entry and exit of firms which tend to be substantial in cases where the model predicts that the degree of bias in CBA** will be large.
Transport and the economy: full report (SACTRA)
81
4.66 Evidently, reliable estimates of m/p and would be extremely valuable in probing the possible unreliability of traditional cost benefit analysis. Harris (1998) provides some evidence on the mark-up of price over marginal cost in British manufacturing for 13 industry groups in 11 administrative regions for 1968-1991 based on data from the Census of Production. He used the traditional industrial economics technique of calculating the margin of gross value added over labour costs and depreciation, and found an overall average mark up of 0.27. Mark-ups were estimated to be much more variable between industries (range of 0.05 to 0.43) than across regions (0.16 to 0.29). Nearly all price-cost margins were positive, but there were seven negative cases reflecting transport-using sectors, which would presumably be classified in Table 4.1 as in one of cells 1, 4 or 7, whereas prima facie the vast majority appear to be in cells 3, 6 or 9. Interestingly, Harris also found that there is a correlation between transport costs per employee and the estimated price-cost margin which might be consistent with the proposition that transport improvements can raise welfare by reducing market power.
4.67 The evidence produced by Harris should be treated with caution but is, nevertheless, in line with much other work in industrial economics. It only covers manufacturing and the level of aggregation of sectors is higher than is desirable. In particular, it overestimates the excess of price over long run marginal cost, because it does not allow for costs of capital other than depreciation. Allowance for this might reduce the average mark up to about 0.2 which would be similar to results at the national level of more disaggregated studies at the three-digit level of the Standard Industrial Classification, which suggest that about ten per cent of manufacturing has price-cost margins as low as those proposed by Newbery, while about ten per cent operates a level of 0.3 or more with a median around 0.15 to 0.2 (Davies, 1998).
4.68 Davies (1998) also reviewed the evidence on price elasticities of demand facing firms when selling output, and concluded that there is virtually no reliable information. However, given that the price elasticity faced by a representative firm in an industry is related to the profit maximising choice of output through its impact on marginal revenue, it may be possible to work round this problem. If, as in some models of oligopoly, it is assumed that there is a relationship between the optimal mark up and the number of firms in the industry, then an alternative expression for B** can be obtained that eliminates the elasticity term and requires instead a sectoral index of industrial concentration to be made operational. This approach also highlights that p/ t will generally not equal one, but will depend on the state of competition.
4.69 For example, under the assumption that each firm treats the output of the others as invariant to its own output decision, m/p = 1/N , where N is the 'numbers equivalent' firms in the industry. This formula allows the formula derived in paragraph 4.64 to be modified to
B** = 1 + 1/[N(1 - m/p)]
Evidence on values of N suggests that at the four-digit SIC level, which may be the most appropriate level of disaggregation, the median figure for British manufacturing may be about 10 with the upper decile about 2.5 (Davies, 1998). Using this together with the earlier information on price cost margins and the revised formula for B**, suggests an average value of about 1.12, with the possibility that, where the transport-using sector comprises firms entirely drawn from the most imperfectly competitive sectors, the value could rise to about 1.6.

Transport and the economy: full report (SACTRA)
82
4.70 These ratios would apply to business traffic. They would therefore need to be adjusted to take account of the proportions of leisure traffic where the presumption is that B** is one, and commuting traffic which seems likely to be an intermediate case. For the typical transport scheme, this might suggest that the overall ratio of total economic benefits to transport benefits may be about 1.06, that is about half the value of 1.12 produced by using Davies method to evaluate B** in the Venables and Gasiorek model for business traffic.
Land-Use/Transport Interaction Models, Imperfect Competition and the Evaluation of Economic Benefits
4.71 The Venables and Gasiorek model is presently an aid to understanding where CBA** may fall short of a full assessment of economic benefits rather than an appraisal technique. Its closest relation among existing appraisal methodologies can probably be found in Land-Use/ Transport Interaction (LUTI) models, which subsume in some detail many of the impacts of transport costs changes highlighted by Venables and Gasiorek. LUTI models are covered more fully in Chapter 5 and Chapter 10, but some preliminary remarks may be useful at this point.
4.72 The evidence presented to SACTRA both by LUTI model proprietors and independent commentators agrees that there are key features of the CGE approach that do not appear in current LUTI models. These include imperfect competition, location decisions of firms, economies of scale and agglomeration effects. In essence, these are both the main reasons to worry that CBA** might inadequately represent total economic benefits as opposed to transport benefits, and also the key elements of the Venables and Gasiorek model in terms of competitiveness implications of transport interventions. We have received conflicting advice on the feasibility of extending LUTI models to incorporate these missing features and are not convinced that this can readily be accomplished.
Conclusions
4.73 Economic growth and competitiveness result from investment and innovation and the incentive structures that support these activities. Current DTI thinking emphasises the roles of capabilities, collaboration and markets free of monopoly in promoting competitiveness and therefore economic growth. Transport interventions have some impact on each of these aspects but other non-transport policy levers may be more important, especially in a country already possessing a well developed transport infrastructure (paragraphs 4.18-4.19).
4.74 Imperfect competition in transport-using sectors can mean that conventional methods of CBA fail fully to capture the economic benefits of transport schemes (paragraphs 4.46-4.50). Explicit consideration of endogenous growth and competitiveness makes this failure potentially more serious. Modern methods of analysis have refined our ability to conceptualise these propositions without providing compelling evidence that the error in using transport benefits from a well-specified CBA** as an estimate of overall economic benefits is generally large (paragraphs 4.41 and 4.61).
4.75 It seems unlikely that we should dismiss imperfect competition as always unimportant in cost benefit analysis. The prima facie evidence suggests that price-cost margins are, on average, likely to be too large to allow this and, in addition, dropping the assumptions of perfect competition and constant returns to scale opens up a wide range of further reasons why the ratio of total economic benefits to transport benefits may, on occasions, be quite far from one. Nevertheless, typically, although the assumption of perfect competition in non-

Transport and the economy: full report (SACTRA)
83
transport-using sector introduces errors, they may be quite small relative to those involved in estimating conventional transport benefits (paragraph 4.70).
4.76 Our review of the implications of imperfect competition has indicated that there may be a wide range of values for B** while, at the same time, showing that, in the present state of knowledge, we are nowhere near to being able to offer precise estimates. Thus, there is clearly no immediate prospect of making the Venables and Gasiorek model operational as a tool for appraisal. In particular, we are not persuaded that this can easily be achieved through the modification of the current generation of LUTI models (paragraph 4.72). What the CGE approach does suggest, however, is the value of diagnostic checks on whether it is likely that conventional appraisal methods might be seriously biased. We recommend that the Department investigates the use of CGE modelling in conjunction with a transport model, to explore the size of the discrepancies between total economic impacts and transport impacts in the cells of Table 4.2.
4.77 At the level of the individual scheme, these would presumably centre on a partial equilibrium approach that considered the implications of imperfect competition in the transport-using sector and unemployment in the labour market. Bias would presumably be most likely in cases where business use by sectors with high price-cost margins and high industrial concentration accounted for a relatively high proportion of the conventional benefits, and where additional employment in the transport-using sector accrued in areas of high unemployment (paragraphs 4.69-4.70 and Table 4.2).
4.78 General equilibrium considerations matter more for the analysis of macro transport policy or projects with large network implications (including large scale traffic reduction measures). Here, the relevant issues to consider would be broader and require at least an embryonic input-output framework to make much progress in terms of exploring the likelihood that the intervention will tend to expand or contract imperfectly competitive sectors (paragraphs 4.38-4.40 and 4.56).
1 From now on in this chapter, we use the term 'economic benefits' as shorthand to mean either positive or negative economic benefits (ie, economic disbenefits).
Transport and the economy: full report (SACTRA)
84
Chapter 5 - Linkages in a Spatial Economy
Introduction
5.01 In Chapter 4 we have developed a general structure which outlines the ways in which transport interacts with other markets in the economy. This has provided a general indication of the relevant interactions, but has left a number of key gaps in the analysis which we propose to fill in this chapter. Most of these relate to the ways in which actors respond within the individual markets identified previously. In exploring these in more detail we are able to introduce the spatial dimension more explicitly. Thus we shall examine the ways in which firms respond to changes in transport provision, the ways in which labour markets are influenced by transport changes and the implications of these changes for the geographical distribution of economic activity and the relative growth of regions.
5.02 The early sections of the chapter explore the evidence relating to each of these questions. We then consider them further in the context of the computable general equilibrium (CGE) framework introduced in the previous chapter. Finally, we discuss the way in which existing model structures deal with these questions, thus providing a link forward to the more detailed practical discussion of appraisal issues in Chapters 8 to 10.
How Firms Respond to Transport Changes
5.03 This section aims to explain how firms, both transport providers and transport users will respond to the changes discussed in Chapter 4. In a perfectly competitive world, we assume that firms pay the marginal cost of the transport they use and price their output according to their marginal costs. In such a situation any change of transport costs will have a direct impact on the cost of the output and hence on the final price and quantity of output. This is the basic linkage in the traditional model.
5.04 Here it is relevant to note that traditional approaches have suggested that because transport costs are a relatively small proportion of total costs, we can expect the output response to any change in transport costs to be small. It is possible to argue that transport costs might have a slightly larger role if we assume that transport costs are more variable than other costs of production. For example, in an economy in which input prices were constant in all locations, and firms enjoyed no scale economies in production, the only costs which could be varied would be those relating to location. A change in transport costs could make a substantial difference to the rate of return, thus causing the firm to react more than the change in total costs would imply.
5.05 Traditional approaches to the role of transport costs in the determination of levels of economic activity assume that firms will attempt to minimise transport costs for a given level of activity. Thus, as transport costs change, firms would be expected to adjust their levels of output to reflect the lower costs of reaching markets and acquiring inputs. If the transport costs of factor inputs and outputs change differentially in different locations, the optimal location of the firm would be expected to change.
5.06 Transport at the firm level will include both freight transport and personal business travel. These are trip purposes which are not well represented in current transport modelling and appraisal, but which we shall show need to be understood in greater depth than hitherto if we are to ensure that all the impacts of transport on the economy are fully integrated. We
Transport and the economy: full report (SACTRA)
85
present some evidence on this in Chapter 6 and deal with the appraisal issues in Chapters 8-10.
5.07 The question of changes in output has been dealt with in some detail in the previous chapter. This is the way in which, in an imperfectly competitive market, firms will not change output in the unambiguous way suggested by traditional approaches which assume perfect competition. For example, the reduction of transport costs to firms in the imperfect market may result in an increase of output by firms, or an increase in the number of firms, or an increase in price-cost margins, by which the firms absorb the fall in transport costs in increased economic rent.
5.08 Much of the impact is likely to depend on the way in which the changes in transport costs affect the opening up of markets to increases in competition, and the relative efficiency of firms in the different markets. We return to this issue later in this chapter.
5.09 More significantly, we need to explore the ways in which changes in transport costs affect the way goods are produced or activities undertaken. This may ultimately affect output, but even without changes in output there could be changes in the amount of transport used by firms due to the reorganisation of the process of production.
5.10 How this operates within firms will depend on how their operations are structured. Firms which are vertically integrated (ie, with different stages of the production process under a single firm's control), but with different operations in different locations, may be less able to take advantage of such changes than independent firms which buy and sell in the most appropriate markets. However, even independent firms have to find new suppliers and markets, sign new contracts, set up new quality control procedures, etc. There is, therefore, always a transactions cost to any change which may be too high to enable the firm to respond effectively to a change in transport costs.
5.11 We also need to recognise that firms do not just consider transport independently of the rest of their operations. Transport needs are integrated with other aspects of firms' logistic operations. Thus, as transport has become more reliable, firms have been able to reduce their stockholding and concentrate this in fewer depots or logistics centres. DETR (1999) quotes statistics showing a 20% fall in the ratio of manufacturing stocks to output, realising a saving of £17 billion with a further £11 billion savings in wholesaling and retailing.
5.12 Total logistics costs for firms will include the total costs of their warehousing and stockholding, plus the direct costs of transporting goods. Thus a change in transport costs could have a number of different impacts. The provision of new road capacity could reduce both total costs and the variance in those costs. Thus firms regard transport as cheaper and substitute transport for other parts of the logistics process. This could lead, for example, to fewer warehouses and longer average trip lengths. It may also make logistics cheaper relative to total production costs leading to firms seeking new markets and/or new sources of supply.
5.13 On the other hand an upward trend in the average cost of transport, for example, through the imposition of higher charges for road vehicles, could lead to firms attempting to reduce total logistics costs. This may not necessarily mean a reversal of a general trend to fewer larger depots; indeed the need to make savings may lead to more transport as firms seek cheaper sources of supply to compensate for more expensive transport. It may also cause firms to be more efficient in their use of transport, for example ensuring higher load factors or increasing vehicle size.

Transport and the economy: full report (SACTRA)
86
5.14 This suggests that a number of possible responses could be counter-intuitive, eg, higher costs of transport leading to more transport, if the full logistics picture is not taken into account.
5.15 We need to introduce here what happens when firms are not operating in a world of perfect competition or continuous cost functions. If there are discontinuities or threshold effects, firms may, on the one hand not respond directly to quite substantial changes in their transport costs, often because of the cost of making these changes, but on the other hand make major changes apparently in response to quite small changes in transport costs. It is thus not sufficient to base any assessment of impacts on a simple analysis of the relative size of transport costs in the total costs of an activity. Firms may only be able to change their operations in discrete steps. Hence, it is only when certain thresholds are reached that it becomes efficient to the firm to revise its number or location of depots, or the location of suppliers or main marketing points.
5.16 Although the individual firm may respond in this way, this would not lead to a need to change the basic model of behaviour as long as these discontinuous responses were to average out across all firms. However, it is possible that, in imperfect markets with relatively small numbers of firms, such averaging cannot take place. Systematic evidence is not available to test the hypotheses implied in this discussion. We do, however, have a number of pieces of independent evidence which provide some support for the views expressed.
5.17 The evidence available suggests that the complex relationship between transport improvements and business costs can be seen at a number of levels, as follows.
• Firms can benefit from a range of re-organisational opportunities which appear to exceed the benefits arising from pure savings in journey times and vehicle operating costs.
• Different firms respond in different ways to the opportunities which transport improvements make possible.
• Some categories of benefit appear to be assuming greater importance than others for business transport users. If one also considers that, compared with the freight needs of business, little is known about how transport improvements affect firms' labour productivity, then it is likely that the relationship is yet more complex.
5.18 The factors leading to changes in the organisation of logistics and supply can be summarised under four main headings:
• restructuring of logistical systems - the spatial concentration of production or inventories;
• realignment of supply chains - vertical disintegration of production, changing patterns of sourcing, changing markets;
• rescheduling of product flow - use of just-in-time, etc; and
• management of transport resources - changes in vehicle size etc, increasing efficiency of vehicle utilisation, handling systems.
5.19 These will have different effects on the nature of the change in the transport demand resulting. The first two of the points in the previous paragraph are the main drivers behind changes in handling and average lengths of haul. They tell us about the factors which have led to an increase in the numbers of legs in a typical supply chain and the fact that increasing dispersion of locations and increases in market areas have led to increasing journey lengths. Changes in the latter two points reflect the efficiency of the transport logistics sector and will
Transport and the economy: full report (SACTRA)
87
affect the total amount of transport through changes in carrying capacity and load factors. We examine some quantitative evidence on these issues in Chapter 6.
5.20 Quarmby (1989) has shown that improvements to a road network can enable a retailer to serve the same number of outlets from a smaller number of distribution depots. The benefits of this re-organisation can exceed the straight time savings by 30-50%. This evidence is supported by work done by Mackie and Tweddle (1993). In modelling a large change in network quality on the distribution systems of three case study firms, they conclude that distribution costs savings may be significantly in excess of the transport costs savings in certain circumstances.
5.21 Instead of arguing that there may be benefits to firms in excess of journey time savings (ie, direct cost savings), McKinnon (1995) claims that infrastructure improvements may themselves have little direct effect on economic activity. He argues that "firms are often influenced much more by the service opportunities that are created [by road improvements] than by marginal changes in transport cost.".
5.22 McKinnon's approach is based on two views.
• Transport costs are not a significant element in total costs for many firms (and that therefore savings in these costs from network improvements are potentially even less significant). A survey of European logistics costs claims that manufacturers spend, on average, only 1.5-2.0% of sales revenue on transport (McKinnon, 1996, p2). Even if a significant reduction in transport costs were translated into lower prices, the prices of manufactured goods would fall by an amount so small as to be very unlikely to have much effect on the level of economic activity.
• Transport must be seen within the wider context of logistics management. The importance of transport to firms can only be properly recognised if due recognition is given to the contribution of logistics to corporate competitiveness and its high status in corporate strategic decision-making (McKinnon, 1996, pp. 10-11).
5.23 McKinnon supports his view on the relative unimportance to firms of changes in transport costs due to infrastructure improvements in two other ways.
• In the case of road haulage operations, terminal and vehicle standing costs can account for a significant element of total transport costs (McKinnon, 1996, p2). Ernst and Young (1996, p.6) cite other studies which support this view. These points further reduce the importance to firms of the savings in transport costs brought about by infrastructure improvements.
• Within a product's total logistical cycle time - the time elapsing between the arrival of inbound supplies and the delivery of the finished product - the proportion accounted for by time taken to transport goods "can be very small indeed" (McKinnon, 1996, p12).
5.24 The 'service opportunities' which are argued by McKinnon (1995, pp.3-5) to be more influential for businesses can be categorised in three broad types of re-organisational benefits:
• market expansion, where a new link enables a firm to widen the search for more efficient, higher quality suppliers and to win additional sales from more distant customers;
• spatial concentration, whereby firms which can supply markets from fewer, larger locations as a result of transport improvements can benefit from both lower unit costs of production and from lower stock levels; and

Transport and the economy: full report (SACTRA)
88
• tighter scheduling, which enables firms to apply just-in-time principles in manufacturing and adopt 'quick response' in retail distribution, helping to cut inventory levels, releasing working capital for investment in more productive activities and reducing stockholding costs.
5.25 Evidence submitted to SACTRA by the Freight Transport Association (1997, pp27-8) also supports this view. Citing the impact on different firms of improvements to the A55 in North Wales, the FTA points to benefits in terms of wider sourcing of inputs, increased vehicle utilisation, better predictability of journey times and improved product quality (in the case of a seafood processing firm, where freshness is paramount).
5.26 The complexity of the relationship between transport and the economy at a micro-level indicated by the above references further manifests itself by the fact that different firms respond in different way to changes in the quality of the transport system. For example, of the three case studies undertaken by Mackie and Tweddle (1993), the optimal number of depots falls for only one of the firms, but in the case of the other two (and of one firm in particular), there would be a change in the optimal location of the depots (for example, by moving depots closer to market).
5.27 A survey of 88 large British based manufacturers (McKinnon and Woodburn, 1996) also shows that transport costs can differ in importance between firms, and can lead to different responses to changes in transport costs. Significant amongst a range of responses to a hypothetical 50% increase in road transport costs included passing the cost increases on to customers, absorbing the costs/reducing profits, improving efficiency of current operations and considering alternative modes.
5.28 Just over 20% of the firms surveyed by Ernst and Young (1996, p18) reported that changes in their use of transport as a result of new or improved transport had led (with varying degrees of significance) to wider business benefits. Benefits claimed varied between:
• ability to access new markets;
• increased sales;
• relocated activities;
• improved staff punctuality;
• increased size of labour catchment areas; and
• a decrease in stock held.
5.29 Mackie and Simon (1986), in examining the industrial impacts of the Humber Bridge, state that three quarters of the firms in their study claimed they were able to utilise their savings productively. The cited operational effects of the bridge were:
• vehicle re-routing;
• increased vehicle utilisation;
• improved market penetration;
• increased market area; and
• internal rationalisation (ie, changes to the number or size of depots).

Transport and the economy: full report (SACTRA)
89
5.30 This study highlights another aspect of transport improvements - that some firms stand to benefit more from reductions in the costs of staff movement than in goods transport (eg, service companies compared with manufacturing firms). Employers' business travel is a seriously under-researched area and includes such travel as that by sales staff (which may be seen as more akin to the physical distribution which will typically be its outcome) and that by executives which is likely to be less predictable or regular and to display characteristics more similar to leisure travel although with rather different values attached to time savings, etc.
5.31 While the survey revealed that very few firms could quantify the cost of non-productive staff travelling time, it reported that the recognition of the cost of travel was widespread among the companies interviewed (Ernst and Young, 1996, p.5). The survey suggests that this may become more of an issue for some firms, either as they become more aware of the direct travel costs incurred by their staff, or due to the increasing costs of individuals' time as real wage levels rise (Ernst and Young, 1996, pp.5-7). The survey implies that there is much scope to improve understanding of the relationship between transport and labour productivity. We address this issue in more detail in the following section of this chapter.
5.32 A further dimension to the complexity of the micro-level relationship between transport and firms is the dynamic nature of that relationship. McKinnon (1995, pp.6-7) suggests that the development of the trunk road network over the last 30 years has "undoubtedly made a large contribution to economic growth, much of it from the restructuring of firms' logistical systems". New road construction projects, however, are likely to make a much smaller contribution, partly because much of the earlier benefit was network related, but also because the restructuring process has largely run its course.
5.33 Improvements which maintain and enhance reliability of journey times are claimed to have become much more important to firms which, through logistical re-organisation, have reduced inventory levels (McKinnon, 1995, pp.4-5; 1997, p.38). This point is also made by Quarmby, supported by figures in a Sainsbury's case study quoted by the CBI (1994). McKinnon (undated, pp. 9-10) has identified that there is in fact still much that firms themselves can do to improve operational efficiency and so reduce costs. The implication is that, without appropriate measures to deliver journey time reliability in the face of growing congestion, the wider organisational benefits made possible by development of the road network will begin, in time, to be eroded.
5.34 The proposition that the most important benefits to firms arising from transport improvements might be changing in nature as the network nears maturity should not mask the fact that there may remain schemes or programmes which could make more than a marginal difference to the quality of the network. Major improvements to the A55 and A14 - quoted by the FTA and the Ernst and Young study - have only recently been completed, yet are claimed to have returned major reductions in journey times: other schemes of a similar nature could also have comparable effects. Taken in aggregate, proposed investment programmes in the strategic road network, the railway infrastructure and in London Underground represent significant expenditures on well-developed networks, yet could make substantial improvements to the efficiency of the UK's transport system.
5.35 Furthermore, the proposition that logistical re-organisation may have run its course may need to be treated with some caution. McKinnon and Woodburn (1996) quote conflicting views on likely future trends in European logistics. This includes a survey of one hundred large British manufacturers who had indicated that they would be cutting warehouse numbers
Transport and the economy: full report (SACTRA)
90
in the UK by 15% in the period 1992-95, while anticipating a 40% reduction in their warehouse numbers across the Continent.
5.36 Evidence from the European Logistics Comparative Survey 1998 (quoted in DETR, 1999) shows that the level of stockholding in the UK is one of the lowest in Europe and has shown one of the greatest reductions in recent years. The same source cites comparative data which shows that warehousing costs represent a higher proportion of total logistics costs than in any other EU country surveyed.
5.37 The problem is that much of this evidence remains only claims, albeit based on a range of valuable survey evidence. They have not been subjected to a consistent and rigorous economic analysis. The complexity of the responses identified begs questions about whether investment appraisal is itself sufficiently refined to capture the diversity of potential business benefit from transport improvements. There is, however, sufficient evidence of discontinuity and threshold effects to suggest that we cannot simply rely on the law of large numbers averaging these out, especially at the more local level.
How Labour and Housing Markets Respond to Transport Changes
5.38 In the previous section we looked at the response of firms in terms of output and logistics. In this section we look in more detail at how individuals respond to changes in transport provision. In particular this occurs through the labour market and the housing market. Our concern is those benefits which will not be captured in the standard assessment of transport benefits as we shall discuss in more detail in Chapters 8 to 10. Each of these market responses will have further implications for firms through the impact on wages and on the price of land/housing.
5.39 This section deals essentially with the personal trip purposes which have formed the basis for most travel demand modelling and appraisal in the past, journeys to and from work and (given the impact on housing location choice) home-based non-work travel. Our concern here is not with the travel choices as such, but the link between these and the location decisions (workplace and home) which conventional transport models assume as given.
5.40 The links through both labour and land/property markets also give us a link back to the firm-based production decisions considered in the previous section. Firms have to determine the availability of a labour force at an appropriate cost as part of their location decisions. As we have already seen, other transport related decisions of the firm may be traded off against the cost of labour.
Labour markets
5.41 Transport interacts with the labour market in two major ways for our analysis:
• labour is a major input to all activities and is locationally specific in that it has to be physically present for the activity to take place in most cases; and
• transport affects not just labour as an input to production (commuting), but also labour as an input to other activities (social, leisure, etc.) which constitute the final demand for activities.
5.42 Considering labour as an input takes us back to the concepts lying behind the Aschauer-type study, but with a much more explicit account taken of the mechanism by which this feeds through. The argument here is that improved transport has a direct impact on the productivity of labour by reducing the time spent travelling, both for those travelling in the

Transport and the economy: full report (SACTRA)
91
course of work and for those commuting to and from work. This productivity gain leads to lower labour costs which ultimately leads to a growth in employment.
5.43 Figure 5.1 summarises the possible influences from a transport scheme on labour and housing markets and their consequences. If we consider a transport scheme which has impacts on commuting costs, the diagram illustrates two complementary streams of response. For ease of exposition we assume that the scheme in question reduces commuting costs.
5.44 On the one hand there is a commuting response which causes labour markets to increase in size. As transport costs fall the search area for jobs increases and workers are prepared to make longer journeys for the same generalised cost (ie, money price plus the cost of time spent in commuting). Labour market areas thus tend to become larger. This introduces more competition from outside a given region for jobs inside, which would have the effect of depressing wages, but also opens up opportunities in other regions to workers from within the region, which could have the effect of bidding up wages as firms seek to retain staff. The impact on unemployment and on nominal wages is thus ambiguous depending on the relative characteristics of workers and jobs in the different regions. For example, major improvements to the rail network serving London might result in a reduction in wages in Central London by expanding the pool of qualified labour, but a corresponding rise in wages in other centres in the South East in response to stronger competition for local labour from Central London.
Figure 5.1 Labour and housing market interactions

Transport and the economy: full report (SACTRA)
92
5.45 The impact on any one region may be ambiguous depending on the relative size of these effects, whether the region is a net importer or exporter of labour. Reductions in transport costs may be expected to lead generally to a reduction in both intra- and inter-regional variations in wage levels if labour markets are assumed to be reasonably perfect. Where there is persistent stickiness in wages (the failure of wages to adjust quickly and fully to a shift in demand or supply), eg, through big variations in skill availability, in union power, or the monopsony power (that exercised by a sole purchaser) of certain employers this may be less true. The overall effect could be ambiguous in a way analogous to the behaviour of product markets.
5.46 A simple analysis of the way in which freeing up the spatial constraints on labour markets may affect wages and employment is shown in Figure 5.2. Here, in the initial situation, with the demand for labour DL and labour supply L1, the local labour market is assumed to clear at a wage w1 and employment level e1. The removal of the spatial constraint on the labour market leads to an effective increase in the supply of labour in the local market from L1 to L2 and this both reduces the equilibrium wage to w2 and increases employment to e2.
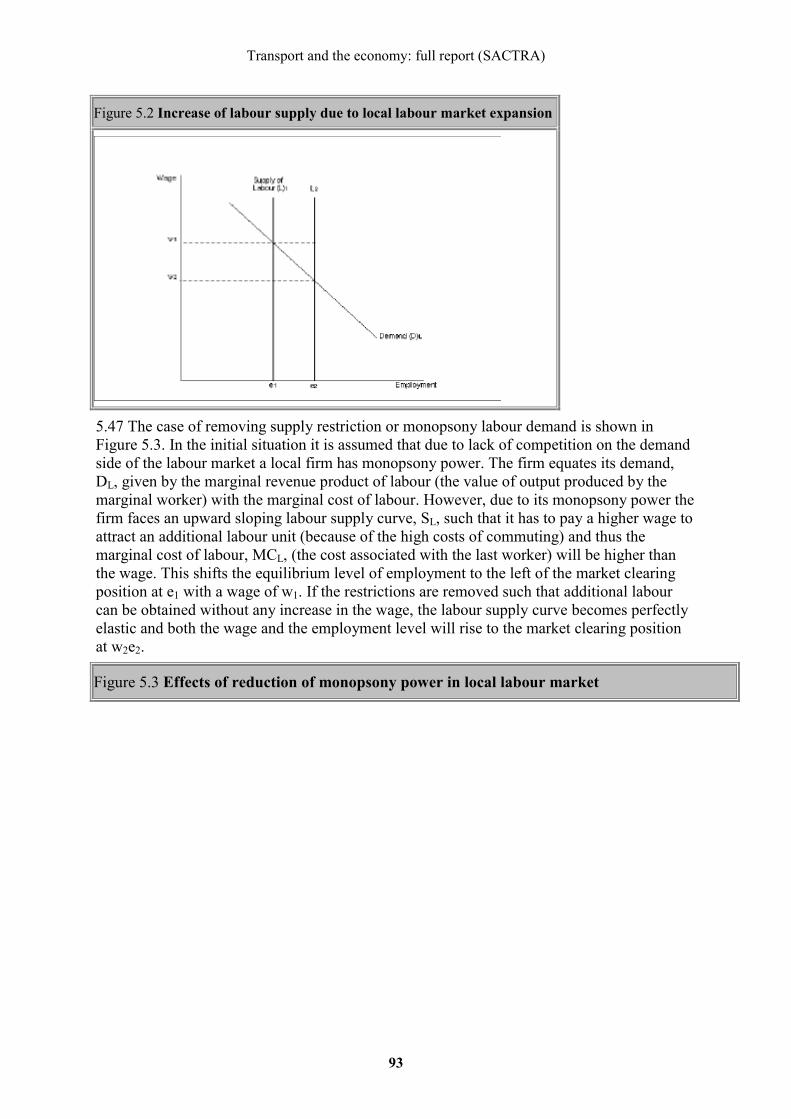
Transport and the economy: full report (SACTRA)
93
Figure 5.2 Increase of labour supply due to local labour market expansion
5.47 The case of removing supply restriction or monopsony labour demand is shown in Figure 5.3. In the initial situation it is assumed that due to lack of competition on the demand side of the labour market a local firm has monopsony power. The firm equates its demand, DL, given by the marginal revenue product of labour (the value of output produced by the marginal worker) with the marginal cost of labour. However, due to its monopsony power the firm faces an upward sloping labour supply curve, SL, such that it has to pay a higher wage to attract an additional labour unit (because of the high costs of commuting) and thus the marginal cost of labour, MCL, (the cost associated with the last worker) will be higher than the wage. This shifts the equilibrium level of employment to the left of the market clearing position at e1 with a wage of w1. If the restrictions are removed such that additional labour can be obtained without any increase in the wage, the labour supply curve becomes perfectly elastic and both the wage and the employment level will rise to the market clearing position at w2e2.
Figure 5.3 Effects of reduction of monopsony power in local labour market

Transport and the economy: full report (SACTRA)
94
5.48 The second response is a migration response. The impact of lower commuting costs may cause migration into the region from those employed in other regions searching for lower house prices or improved living conditions. This increased local labour supply may also put pressure on wages and/or unemployment in the local labour markets, whilst at the same time placing upward pressure on local house prices which will have a downward impact on real wages. This may or may not outweigh any increase in nominal wages from the increased competition for local labour from outside the region. Falling real wages may lead to outmigration and counter balance the increased labour supply.
5.49 We can use Figure 5.2 to illustrate the main effect again here. The initial impact on the local labour market from in-migration is an increase in the labour supply from L1 to L2 and hence there is downward pressure on wages. If these wages are sticky downwards, then firms will not increase their demand for labour and the effect is an increase in unemployment by e1e2 rather than the increase in employment discussed previously.
5.50 A critical issue here is how far migrants will respond to differences in nominal or real wages. If potential migrants perceive that higher nominal wages in a region may be eroded by higher housing and other living costs, they may be more reluctant to move. On the other hand, there could be strong speculative effects in advance of improvements in transport anticipating future rises in house prices.
5.51 Any change in real wages may impact on firms' unit labour costs and their competitiveness which impacts on labour demand which through interaction with labour supply feeds back to nominal wages. The final feedback loop is that increased commuting may lead to congestion effects and this will reduce the benefits of the initial transport
Transport and the economy: full report (SACTRA)
95
improvement. This complex set of interactions shows clearly how the actual outcome may involve a balance of different responses to any given initial change working through parallel responses in both the labour and housing markets. In particular much will depend on the degree of slack in both of these markets which will determine whether prices change rapidly or slowly.
Modelling Labour Market Impacts on Transport and the Economy 5.52 Two related approaches have been used to measure the scale of these effects. One attempts to measure the productivity gain in terms of the use of labour within the production process, greater productivity implies either or both higher wages and increased aggregate demand and lower unit labour costs which causes an increase in the demand for labour. The other looks at the impact on the size of labour markets, lower transport costs imply larger labour markets implying greater competition and lower wages.
5.53 The key relationship here is that between wages and the level of employment. This is an important, but complex, issue which has only recently been started to be looked at seriously at a sectoral level (Lee and Pesaran, 1993). In this approach the wage set in any sector depends on expectations of relative real consumption wages and the related level of employment, subject to the labour demand constraint of firms. Wages in a sector rise if there are shocks within the sector which cause revenue per worker to rise, such as a gain in productivity, or if employment levels are rising, or if there are changes in the real wage elsewhere in the economy. The model can also allow for specific regional effects (Barker and Lewney, 1997).
5.54 If transport improvements can be represented as time savings, the value of these time savings can be regarded as equivalent to a gain in productivity from the labour employed. The key issue then is whether this potential output gain is turned into higher wages for the employee or increased output and hence increased employment. Either way there is a welfare gain from the transport improvement, but the impact on economic growth will be less if the increased productivity is simply absorbed into higher wages.
5.55 From evidence presented to us, it seems likely that the impact of specific transport projects, even quite large projects, on the real wage or on employment will be very small (Barker and Lewney, 1997). However, the question remains whether major programmes of work which affect entire networks, such as the roads programme as a whole, or the EU's Trans-European Networks, can have a significant shift effect on the supply side of the economy.
5.56 This argument of time savings leading to productivity gains leading to enhanced growth has been used in studies on the impact of infrastructure spending on the London Underground and roads in the UK and on the impact of the TENs in the EU (CEBR, 1993a, 1994; European Commission, 1997). In each of these cases an aggregate relationship has been used to generate the link between a given level of transport expenditure and the implied productivity gain and then between this productivity gain and the growth of output or employment. The elasticities assumed for each of these links will be critical in determining the overall outcome.
5.57 The estimates which have been made are of potentially very substantial output/employment gains from major investment projects. The London Underground investment study suggests a boost to London's GDP of 3.8 times the direct passenger benefits, a net addition of 0.06% per annum to UK GDP growth over the period to 2003 and a reduction of UK unemployment by over 41,000.

Transport and the economy: full report (SACTRA)
96
5.58 Similar substantial effects are also identified from varying expenditure on the roads programme. A 50% increase in expenditure over the 1994 planned levels would result in GDP being 0.73% higher and employment nearly 92,000 higher by 2010, a 50% reduction in expenditure would produce a level of GDP 1.1% lower and a loss of nearly 125,000 jobs by the same date.
5.59 The study for the European Commission on the impact of the TENs is based on aggregation from an earlier detailed study of the PBKAL (Paris-Brussels-Köln-Amsterdam-London) high speed rail project. This again produces high values for the total impact with EU GDP 0.25% higher and employment 0.11% higher by 2025 from the priority TEN projects and even greater employment gains (800,000 jobs or a 0.49% increase) from the full network.
5.60 The precise nature of the critical linkages between various components of the model used in the European Commission report is not fully clear from the information made available to us, especially the link between the transport elements and the macroeconomic model. We have not been able to validate the performance of the macroeconomic model against that of other models, although the EU study has used the European Commission's QUEST II model. There is some concern that all the studies show continuing (explosive) growth emanating from the initial shock. It is not clear how far this results from assuming a continuing programme of investment or from some property of the model itself. We would need to see further validation before we can be confident about the size of the impacts.
5.61 In a further study, CEBR and OEIL (1997) have compared the performance of London and Paris. This study too takes as its basic premise the fact that transport costs will help determine the size of labour markets. The assumption is again that the larger a local labour market, the more efficient it will be and thus improvements to transport which enlarge a labour market will increase productivity. In the comparison between London and Paris, the latter is shown to have a much larger labour market based within a given distance of the market centre and has higher revealed productivity. Further analysis suggests that the larger Paris labour market depends partly on higher densities of population in inner areas and partly on transport which is more efficient in terms of average speeds and accessibility.
5.62 Whilst this is an attractive proposition which accords with a number of our hypothesised linkages, we are concerned that such an approach does not allow for the interaction of a number of other differences between the two cities. One of these is simply the cumulative historical development of job and housing markets, the time dependence of linkages, which will make it less feasible to use transport as a policy instrument to effect change. Secondly, there is the critical issue of the link between labour and the housing markets.
Housing and land markets
5.63 The increased size of labour markets is a natural parallel in the input market to the normal market size effect in output markets claimed for transport improvements. This again raises a number of complex issues. First, labour markets cannot be treated independently of other markets, particularly that for housing. The housing market is known to display fairly close relationships with transport improvements and it may be that much of the potential gain is captured in the housing market rather than in the labour market. Secondly, labour markets overlap, not least in the increasing importance of the multi-worker household. Although there are studies of the link between labour and housing markets, the general conclusion is that job change is not a primary determinant of housing re-location. Factors such as family circumstances and changing housing needs are much more important. Transport changes have minimal effects, at least in the short-run, on either employment or residential location. They

Transport and the economy: full report (SACTRA)
97
may influence the final choice of location once a decision to move has been made, but they are much less important as a primary determinant of the decision to move.
5.64 Much of the work which has been carried out in this area has concentrated on the link between the housing and the labour market decisions, in which transport factors appear just as a linking mechanism (for a recent review see Crampton, 1998). In most of the work which has been carried out, transport factors appear not to have been a major influence in causing people to move either employment or residential locations, though once the decision to move one or the other has been taken transport may influence final choices.
5.65 It may be that the constraints of the housing market are a more serious determinant of commuting change as a substitute for migration even in the longer term. Recent evidence by Cameron and Muellbauer (1998) suggests that the housing market has a strong effect on decisions to migrate between regions. High relative house prices discourage in-migration, though expectations of future house price rises may encourage it. Increasing owner occupation has reinforced this effect. Because of this, differential labour market effects in contiguous regions lead to commuting being substituted for migration, and for nearby regions there is a stronger labour market effect on commuting decisions and a stronger housing market effect on migration decisions (see also Gordon, 1975; Molho, 1982; Jackman and Savouri, 1992).
5.66 These findings are important since they suggest that improvements to transport between labour market areas may have both commuting and migration impacts which could work differently according to the existing relative states of the labour and housing markets in the regions affected. In some circumstances attempts to use transport to open up labour markets may have perverse effects if the housing market is not flexible.
5.67 This suggests a need to look more closely at the workings of the land market. There is a long tradition in urban economics of relating land values to transport costs. Dating right back to the early work of von Thünen (1826) this 'trade-off' approach shows how the increased costs of access as one moves further from a market centre lead to a reduction in the price which potential users will bid for the use of land at a particular location. In equilibrium the total value of land rents in a market will equal the sum of all the transport costs such that there is a clear link between the quality of an area's transport and the total price of land.
5.68 If transport is improved, the value of land at a particular location will rise and since there is an incentive, both for individuals to move outwards looking for cheaper land and for more land to be converted to urban use at the margin, the urban area will increase in size. It is also suggested in such urban models that, if the transport costs fall faster than the costs for the use of land rise (eg, because land can be developed at increasing densities), the overall urban cost of living will fall (ie, real wages rise) and workers will be induced to move into the city. Thus transport improvements can be seen as an agent of urban growth. Although this is an accepted theoretical proposition, it has been difficult to produce convincing empirical evidence, in particular it is difficult to ascribe specific impacts to specific transport improvements.
5.69 CEBR (1993b) have investigated the link between aspects of the journey to work (quality and time taken) and rates of pay. Evidence is brought forward of variations in property prices, and secretaries' salaries, both of which fall with increasing journey time from central London. There is also some evidence of a positive link between these indicators and improvements in journey times, which is argued to be evidence of the value of the utility from shorter journey times.

Transport and the economy: full report (SACTRA)
98
5.70 The empirical models on which this research is based are principally simple bi-variate regressions which do not capture accurately the true partial effect of the journey time or quality relative to the many other influences on property prices and salaries, nor even the joint relationship between property values and wages. It is clear that this is an important area for research development, but we have not seen sufficient corroborating evidence for us to be in a position to accept the estimated elasticities as a basis for evaluating transport improvements.
5.71 This leaves us with the consumption effects of improved transport. Individuals turn transport improvements into increased leisure time and/or increased income to spend on consumption activities. This implies transport change as a stimulus, not to productivity growth, but rather to demand-led growth with individuals able to access a wider range of destinations and activities for a given resource cost (time and money). Casual empiricism suggests that it is this effect which may have dominated; the time individuals spend on travel has, for example, remained remarkably stable over long periods of time despite enormous increases in incomes and the average speed of transport. (SACTRA, 1994; Goodwin, 1994)
5.72 The empirical evidence in this area has to be treated cautiously. There is clearly some prima facie evidence of important links between transport improvements and wider labour market effects which has an intuitive appeal, but so far lacks both rigorous theoretical and econometric support. We do, however, feel that this is an important area which should not be underestimated.
Agglomeration and Geography
5.73 This section aims to explain the way in which agglomeration effects can affect the spatial development of the economy and the consequent implications of transport changes for the development of market areas and regions, especially in a general equilibrium context.
Agglomeration and urbanisation externalities
5.74 The role of agglomeration effects - scale economies and urbanisation - has assumed a new role in recent work in determining the location of activities and the concentration of economic activity. Essentially the recognition is that, in a world of imperfect competition, where scale economies have a basic role in justifying minimum plant size and therefore minimum size of a market area, there are forces which will lead to the concentration of industries in specific locations. Once this happens internally to the firm, there are additional economies external to the firm or industry which reinforce this process.
5.75 One of the main factors external to the firm is the specialisation of labour and various business services which provide a pool of efficient inputs to other firms in the same industry locating in that area.
5.76 External to the industry are those actors relating to the process of urbanisation in which certain services assume the role of public good inputs to the production process. Thus an efficient local public transport system, along with other local services, can lead to increased efficiency (lower costs) of local firms and, moreover, because of the increased profitability of activities lead to the development of a tax base which can be used to finance the provision of such public goods.
5.77 Such urbanisation economies are not always positive. It is increasingly recognised that the main constraints on the growth of cities arise from external diseconomies such as the
Transport and the economy: full report (SACTRA)
99
impact of congestion, environmental degradation and such features as the incidence of crime (see Glaeser, 1998).
5.78 There is now a substantial literature, especially in the US, on the costs of urban sprawl and the case for what is known as "SMART growth" (for example, Bank of America and others, 1995). Work for the World Bank by Newman, Kenworthy et al (1997) produces data to support the hypothesis that "after a certain point the diseconomies associated with car use growth and low density suburban sprawl are draining cities of wealth compared to cities with more balanced transport systems and less dispersed land use". This hypothesis has been challenged, notably by Gordon and Richardson (1993), on the grounds that the data do not in fact support the hypothesis.
5.79 In the UK, there has been considerable discussion of the virtues or otherwise of "compact cities", stimulated by the debate on household growth and housing location (see Jenks, Burton and Williams, 1996). Evans (1998) has drawn attention to the way in which land use policy designed in principle to produce higher densities and limit urban sprawl, in particular greenbelts, and the 1994 PPG13, may actually be leading to more, and less efficient, patterns of travel. He refers to both aggregate statistical evidence from Gordon (1997) and survey evidence from Headicar and Curtis (1998) in support of this premise.
5.80 Central to both the US and UK debates has been the question of whether lower density development leads to large scale environmental externalities through increased car dependence. However, for our purposes we should note that much of the debate is more about rival solutions (eg, higher residential densities versus development along public transport corridors); there is common ground between most of the protagonists that completely uncontrolled or unplanned urban sprawl imposes external costs, in areas such as water resources as well as transport.
5.81 As a result of these forces, we can see that the development of market areas for firms will depend on their ability to achieve internal scale economies, on the external factors such as agglomeration and urbanisation economies, and on the costs of transport and trade. The larger the scale economies and the smaller the transport costs the larger will be the effective market for a firm.
Spatial competition
5.82 The existence of scale economies, internal and external, affects the development of spatial competition. One of the earliest treatments of this was in the work of Hotelling (1929). Hotelling posed the question of how the market would develop if consumers were distributed along a line (Hotelling actually quotes the examples of a Main Street in a town or a transcontinental railroad, but the example has become popularly known as the problem of the ice cream seller on a linear beach). If products are identical and all consumers have similar elasticities of demand then price and transport costs will determine which seller is chosen by which consumer. It can easily be shown, not only how the market will be divided between the two sellers aiming to maximise their own profits, but also that there is an incentive for the sellers to move to a situation which is non-optimum with respect to maximising total welfare of both consumers and producers. Only if there is a very large number of sellers in the market will the situation approximate to an optimum in which the sellers are equally distributed and the transport costs are minimised.
5.83 What does this tell us about the situation in a competitive market where transport costs are, for example, reduced? It suggests that, if transport costs are reduced equally to all, any

Transport and the economy: full report (SACTRA)
100
increase in sales will be equally distributed between all sellers, since all consumers have similar elasticities of demand. This can be characterised as the problem of the two way road. If two sellers are located initially at each end of the road, any fall in transport costs will affect them equally. Many claims for the development of new transport facilities are based on the presumed impact on a location at one end of the proposed new or improved facility. This ignores the competitive impact on other regions served.
5.84 Because of this, if we consider the sellers in any one market, they may actually be better off by not seeing the road improved. Hotelling recognised this problem and argued that: "The profits as well as prices depend on the unit cost of transportation. These particular merchants would do well, instead of organising improvement clubs and booster associations to better the roads, to make transportation as difficult as possible. Still better would be their situation if they could obtain a protective tariff to hinder the transportation of their commodity between them ... the object of each is merely to attain something approaching a monopoly.".
5.85 We can extend this argument to consider the case in which the sellers are not selling identical products, or where scale economies provide some further advantage. Where scale economies are strong, firms can enjoy a degree of protection from new entrants. Where transport costs are high, firms will be protected from competition from firms in other locations, which may enjoy greater scale or agglomeration economies. But there is no automatic tendency for lower transport costs to ensure larger markets; lower transport costs may benefit firms with the potential to achieve larger scale economies, but they may also benefit firms which have lower input costs and can thus use this to undercut the costs of larger firms. The overall impact may be indeterminate depending on the relative configuration of scale economies, the size of the local market, local labour and land market conditions, the nature and scale of backward and forward linkages in local sectors, and the nature and scale of the transport improvements.
5.86 This process can have ambiguous effects on the relative development of different regions. Where scale economies dominate, any reduction in transport costs may lead to greater concentration of economic activity in larger core regions up to the point where diseconomies of agglomeration set in. Where lower input costs, such as wages or rents, dominate there may be a deconcentration of economic activity. However, large changes in transport costs may produce indeterminate effects as a result of the existence of a 'U' shaped relationship (see Krugman, 1998a). Evidence for the US suggests that recent decades have seen a decrease in industry concentration and regional specialisation. However, this is not inconsistent with a continuing process of agglomeration in industries, just that the pole of that agglomeration has been shifting geographically through time, with new firms setting up and developing in new areas. Brülhart (1998) presents evidence which suggests a rise in industrial concentration and specialisation within the EU, but there is insufficient evidence to conclude that EU industry has, in general, become more localised.
5.87 It is this issue which is usefully developed in the various models of the "new economic geography" (see Krugman, 1998a, b). The report produced for SACTRA by Venables and Gasiorek (1998) contains some extensions to deal with these issues. These divide into two cases:
• the extension of the model from a partial equilibrium to a general equilibrium framework; and
• the consideration of the spatial or regional consequences of changes in the context of a simple geography.
Transport and the economy: full report (SACTRA)
101
General equilibrium
5.88 The general equilibrium case enables consideration of what happens to other imperfectly competitive sectors when one sector expands (or contracts) as a result of transport changes and allows for regional variations in the supply price of factor inputs. In the partial equilibrium model discussed in Chapter 4 other sectors and inputs are assumed to be in perfect competition such that their prices are given rather than determined by the model.
5.89 In the general equilibrium case the linkages between sectors, as given by input-output coefficients, become critical. Transport is not modelled as a separate sector and is considered as a derived demand from the inter-regional trade flows.
5.90 In the case of symmetric (identical) regions, the benefits from transport improvements increase because of the linkages between sectors, but the ratio of total economic benefits to transport benefits is rather smaller than in the partial equilibrium case because it reflects a weighted impact on different sectors with different degrees of imperfect competition.
5.91 The general equilibrium case also allows for the further analysis of industrial agglomeration. If the linkages between sectors are strong, the regions will retain a balance of sectors; if, however, the linkages between sectors are much weaker than they are within sectors, there is the increased probability of agglomeration of each sector in a single region. Thus a given change in transport costs beyond a certain level may lead to an asymmetric result with one region gaining welfare at the (relative) expense of the other.
Spatial consequences of change
5.92 The spatial consequences of change can depend on a number of circumstances. We demonstrate this using the model developed by Venables and Gasiorek (1998). This assumes a simple stylised model of geography with two or three regions. Each region has two transport-using sectors, one of which typically displays imperfect competition, the other is perfectly competitive. The labour markets in each region are assumed to be perfectly competitive and to clear. The transport sector benefits from an improvement which reduces the costs of transport between the regions. We can consider four cases which summarise the main types of differential regional effects of interest:
• the centre-periphery case;
• the production diversion case;
• the three region centre-periphery case; and
• the three region network case.
5.93 The centre-periphery case considers the consequences of an improvement between a large central region and a smaller more peripheral region. Such a case typically starts with a concentration of activity in the central region because of the scale economies. Except in the case of very high initial transport costs, improvements tend to reduce the output and wage differentials between the regions. There is a theoretical case for an inverse U-shaped relationship between transport costs and regional inequalities such that from a situation of very high transport costs, a reduction can initially lead to increases in inequalities as the scale economies in the central region overcome the initially prohibitive transport costs, but further reductions beyond a certain level would lead to the expected reduction in inequality. Very large reductions in transport costs from a high initial level could lead to either increases or reductions in inequality. This is an unlikely case in the UK where there are relatively few

Transport and the economy: full report (SACTRA)
102
areas with such relatively high initial transport costs. The welfare gains are proportionately larger for the smaller region and the overall effect on welfare is consistent with the general case discussed in Chapter 4.
5.94 The production diversion case considers the case of three initially identical regions in which there is an improvement of transport between any two, but not with the third. Starting from a position where the three regions have identical levels of output and wages, the improvement between the two regions gradually concentrates more activity in these at the expense of the third with substantial wage differentials opening up. The welfare gains in the benefiting regions more than outweigh the much smaller reductions in the third region and there remain ratios of total benefits to transport benefits substantially greater than one.
5.95 The three region centre-periphery case considers the case of three regions lying along a single corridor, where an improvement takes place between two of the regions, one central and the other peripheral, but not between the centre and the third region. In such a case the locational advantage of the centrally located region would have led to a greater share of regional production and higher wages at any reasonable level of transport costs. The effect of reducing transport costs between one peripheral region and the centre is to shift production towards, and increase wage rates in, that peripheral region at the expense of the other peripheral region. There is little effect on the central region. However, in this case, all regions make a welfare gain, most for the peripheral region whose transport connections are improved, rather less for the central region and less again (but still positive) for the non-connected region which clearly benefits from the overall reduction in transport costs in the network. The ratios of total benefits to transport benefits are larger than in previous cases, where there was no such network of regions, and consistent with the general level of such values.
5.96 The three region network case considers the same geography as the previous example, but in the case where both links are improved. In this case, for similar reasons as in the previous case, both peripheral regions benefit at the expense of the centre region for which the initial dominant position is reduced. Both peripheral regions make substantial welfare gains and rather higher ratios of total benefits to transport benefits are achieved. The overall improvement in welfare from improving both links is greater than the sum of the improvements associated with each link independently as the effect is to enlarge the total market - ie, super additivity.
5.97 The overall conclusion of this consideration of geographical effects is that transport improvements may generate either increases or decreases in regional inequalities depending on their incidence on particular regions and on the initial level of transport costs. Transport improvements may be a way of reducing inequalities, but the effects do depend on other factors leading to agglomeration; stable regional industrial structures can become suddenly unstable at critical levels of transport costs. Again this suggests that there is no simple rule which can be applied to predict the regional outcomes of transport projects; the outcome will depend on a particular set of regional and sectoral circumstances. There do, however, seem to be quite strong grounds for expecting substantial effects from the development of networks, so-called super-additivity effects.
5.98 These results are derived from a set of simple numerical models. It is more difficult to generate empirically testable models from the computable general equilibrium framework discussed above due to the paucity of data on inter-regional flows and regional input-output structures. In evidence we have seen so far some of these relationships have to be imputed.
Transport and the economy: full report (SACTRA)
103
The value of the ratio of total economic benefits to transport benefits is highly dependent on both the geographical and sectoral context of the transport improvement in question. It depends on the relationship between prices and marginal social costs in affected sectors and between transport prices and marginal social costs of transport on the affected links or in the relevant regions. There is no single value or set of values which can be calculated and applied according to a simple set of rules. The data requirements in order to move forward from the framework offered by this model to a useable tool of policy assessment are likely to be substantial.
Region and cohesion effects
5.99 The previous section has considered essentially theoretical models, and some numerical simulations of these, to demonstrate the possible impacts of transport changes on regions. This section aims to widen the discussion to assess the empirical evidence on the impacts of transport on regional development.
5.100 We need to distinguish carefully in these approaches between ex-ante appraisals (those undertaken before a change) and ex-post evaluations (those undertaken after the event). Most of the modelling approaches discussed above are ex-ante appraisals. In these the aim is to predict what will happen as a result of a specific change in transport provision, on the basis of estimated existing relationships. Most of the evidence on the effects of transport change relates to ex-post evaluations. In ex-post evaluations the approach is to identify the contribution of the transport change to observed changes which have already occurred. Whilst the formulation of the key relationships involved in a model of behaviour is essentially the same in both cases, there is a particular danger in ex-post studies of not being able to identify clearly the impact of the transport change from all the other changes which have occurred and particularly where there are strong concurrent growth trends in all the main variables. This is often referred to as the problem of the counterfactual, modelling what would have happened if the change being investigated had not taken place. Ex-post evaluations face the particular danger of spurious correlations which are taken as indicating stronger causal links than actually exist.
5.101 The real need is for a theoretical approach which can be applied in both the before and after cases so that both prediction and evidence can be clearly related to a consistent set of models. See paragraph 10.208 et seq for further thoughts on ex-post evaluations.
Input-Output Models
5.102 One way of attempting this would be through the use of regional input-output analysis. Input-output analysis (see Armstrong and Taylor, 1993, for a straightforward presentation of the technique) involves setting out the interactions between the various sectors of the economy in terms of a matrix which shows the sectoral destination, plus exports and final demand, of each unit of output from a sector and the sectoral origin, plus labour and imports, of each unit of input. Transport is one sector in the economy. These interactions are expressed in terms of a set of so-called technical coefficients which express the relative importance of each sector as a supplier and demander of each other sector.
5.103 The advantage of the input-output approach is that it enables us to trace the impact of a change in the final demand for one sector on the demand and output of each other sector, or the impact of a change in the cost of supplying one input on all the using sectors. Such input-output frameworks lie behind both the analysis of linkages which are important in the

Transport and the economy: full report (SACTRA)
104
computable general equilibrium models discussed above and the development of Land-Use/Transport Interaction Models which we discuss in more detail below.
5.104 The disadvantages are of two main types. First, from a modelling point of view, it is difficult to make input-output frameworks sufficiently flexible to allow for changing technology, because they tend to assume fixed technical coefficients (although this is not essential). Secondly, and more importantly, they are very demanding in terms of data. To construct inter-regional models which would be needed to explore some of the relationships identified above, would involve a considerable exercise. To date in the UK, only Scotland has a completely developed regional input-output model, although a partial one has been developed for Wales.
5.105 We are aware of some work which has been carried out in Denmark using a multi-region input-output model to assess the impact of the Great Belt link (eg Jensen-Butler and Madsen, 1996). This uses 12 regions, six productive sectors (aggregated from 21 sectors) and seven categories of final demand in a broadly Keynesian, ie, demand determined, structure. Regional technical coefficients and final demand are estimated from national figures. Location quotients are used to adjust the national coefficients. The results suggest that distributional effects dominate generation effects, but the impact on the service sector is rather stronger (typically between 2-3% increase or decrease in trade flows) than on industry or agriculture (typically between -0.2% and +0.6%). Total employment generation is, however, very modest at around 0.1%, with the strongest effects in Copenhagen at 0.14%. The authors acknowledge that the demand based structure cannot predict long run supply side induced changes, but the fairly simple structure does suggest that some progress can be made with this type of approach.
5.106 It may be possible to use a basic input-output structure to identify key linkages in regional economies which can be used for simulation exercises and which would assist the understanding of the impacts of changes in transport provision. We recommend that further work be devoted to research on the use of input-output models in helping determine and measure the key linkages through which transport affects regional economies.
Regional aggregate productivity models
5.107 The aggregate impacts of infrastructure on economic growth following the work of Aschauer have been discussed in Chapter 4 in the context mainly of time series analysis of national data. Although this has not generated convincing results, there remains the possibility that the regional distribution of economic activity may be significantly affected by variations in infrastructure provision.
5.108 Munnell (1990), in an Aschauer-type framework, identified significant variations in regional output in the United States associated with variations in public capital provision. Aggregate estimates suggest an output elasticity with respect to all public capital of 0.15. However, disaggregation of public capital into different types suggested that water supply and treatment infrastructure was much more significant as a determinant of regional output variations than roads infrastructure for which the estimated elasticity was only 0.04.
5.109 Work at the regional level by Holtz-Eakin (1993), Holtz-Eakin and Schwartz (1995) and Holtz-Eakin and Lovely (1996) (and see Hulten and Schwab, 1991) has not confirmed these strong regional effects, with public capital proving to be an insignificant determinant of regional variations in output or even significantly negative. Holtz-Eakin in particular has

Transport and the economy: full report (SACTRA)
105
noted how there may be significant region specific characteristics which may explain the apparent importance of public infrastructure.
5.110 In Europe there have been relatively fewer studies. Fritsch and Prud'homme (1997) have attempted different means of measuring public capital from physical indicators and have used measures of infrastructure relative to population or area of the region to capture differences in presumed infrastructure needs between sparsely and heavily populated areas. These suggest a significant positive rate of return to public capital, but interestingly suggest little or no influence on the location of private capital.
Other regional studies
5.111 UK studies on the impact of transport interventions on regional development have used different approaches, ranging from the quantitative to the qualitative to a mixture of the two. However, these studies have not proved a clear causal relationship and they highlight a range of shortcomings and caveats regarding our current ability to understand properly how transport interventions affect development.
5.112 Dodgson's (1974) modelling of the possible economic impact of the M62 suggests that there is a relationship, albeit limited, between transport costs and employment growth. The maximum increases in employment generated by the M62 in the model are small compared with the total employed population of the areas affected by the motorway. Dodgson also notes that the weakness of the relationship in his model between changes in transport costs and local employment growth rates may in part be due to the likelihood that employment growth is influenced by many factors other than simply improved transport.
5.113 Botham (1983), in his work on the potential spatial redistribution of economic activity arising from the national roads programme up to the early 1970s, underlines that the results of modelling can be very sensitive to the specifications of the model itself. In particular, Botham shows that the results can also vary significantly depending on the assumptions made about the counterfactual (ie, what might have happened in the absence of the roads programme). Notwithstanding the range of figures on redistributed employment (c 20,000 - 162,000), Botham notes that the impact is relatively small compared with the overall changes in the UK over the period.
5.114 Halden and Sharman's (1994) study of transport and development changes around Inverness adopts a more qualitative approach. The report identifies changes within the study area in employment and residential patterns alongside changes in accessibility (by car, bus and rail), and then attempts to establish theoretical relationships between the two. While the report suggests that the changes in accessibility have had both positive and negative impacts on economic development, there is no quantitative evidence of causation. The authors concede the difficulty of isolating transport effects on the economy from other effects and identify a need, not only for better data, but also for better measurement and valuation techniques so that transport appraisal can better reflect planning, environmental and regional development objectives.
5.115 Recent work by the Welsh Economy Research Unit of Cardiff Business School has examined the economic impacts of the A55 in North Wales (1996) and of road improvements in Merthyr (1997). In the Merthyr study, the authors claim that the direct benefits of the road improvements in strictly cost terms have been marginal, but that the indirect effects arising from increasing the location and commercial competitiveness of a previously disadvantaged area are much more important. Both studies combine essentially qualitative material (eg,
Transport and the economy: full report (SACTRA)
106
from surveys of local businesses) with some quantitative evidence drawn from the Welsh input-output tables to model the regional or sub-regional economic effects of better accessibility on competitiveness (via reduced transport costs). The basic approach used allows for both potentially positive and negative regional development impacts arising from transport improvements. However, the authors concede that there is no general analytical framework which deals adequately with the full dynamics of improving access; and neither study appears to identify the extent to which the net positive impacts are genuinely additional, rather than displacement from outside the study economies.
5.116 We have also seen a number of more local studies of the impact of transport improvements, but none of these has a sustainable, objective and challengeable analytical framework which can point to clear evidence either way. A particular objective would be to undertake as a matter of routine consistent 'before and after' studies. These would need to establish a modelling framework to predict impacts which could then be used to measure observed impacts after the event, having taken account of other parallel determinants of the key impact measures. We have not seen evidence of studies which have done this consistently and rigorously. Since studies are typically undertaken by or for scheme promoters, there appears to have been little incentive to undertake the follow up studies.
5.117 Our conclusion from the available evidence is that only with much more formal modelling can any clear conclusions on the likely wider net economic effects of transport improvements be drawn. See paragraph 10.208 et seq.
The Role Of Land-Use/Transport Interaction Models
5.118 One formal modelling approach which has been suggested is through the use of comprehensive Land-Use/Transport Interaction (LUTI) models. These have a long history in the development of the modelling of urban transport, but have only more recently been developed to deal with inter-regional issues. We commissioned a review of recent developments from two of the major UK developers of such models, the David Simmonds Consultancy and Marcial Echenique and Partners. We asked them specifically to review the ways in which such models are able to capture the effects of imperfectly competitive markets and general equilibrium issues. Their full report (David Simmonds Consultancy, 1998) gives a comprehensive summary of the types of models available and makes certain evaluations of both the way in which changes in transport provision can affect the wider economy of regions and the usefulness of LUTI models in capturing and measuring these. We do not review these models in detail here, but aim just to distil the salient features of the approach. We return to consider the value of such models in appraisal in more detail in Chapter 10.
5.119 The basic structure of these models is summarised in Figure 5.4. This is a stylised representation of the various linkages developed in Figures 4.1 to 4.3 and 5.1. These consist of a number of 'economic agents' such as producers, investors, developers, residents and transport suppliers, who interact with each other through 'markets'. Some markets involve the interaction of more than two agents, some agents have more than one function in the model. For example, residents have functions in the property, product and transport markets as consumers and in the labour market as suppliers.
5.120 The interaction through markets is shown to produce both economic flows of outputs and inputs and the corresponding transport demands derived from these. For example, the labour market requires residents to supply labour to firms at some location which generates commuting flows.

Transport and the economy: full report (SACTRA)
107
5.121 The modelling of this system requires three key sets of assumptions.
• Assumptions concerning the boundaries of the markets to be modelled. These will typically be spatial boundaries such as the region or the traffic zone, but will also be affected by the degree of disaggregation, for example, by industrial sector, skills etc.
• Those concerning the extent to which individual markets clear. The typical assumption will be that markets are in equilibrium, they will search for conditions which optimise the system and this will typically imply, for example, full employment.
• Assumptions concerning the ways in which the 'economic flows' are translated into traffic flows. This is partly about the efficiency of the transport system, thus if this improves a given flow of goods in terms of tonnes may generate less traffic. However, it also needs to make presumptions about the responsiveness of individuals to changes in the conditions under which transport is supplied. Thus, for example, it needs to consider some of the implications discussed in connection with Figure 5.1 where changes in commuting costs were shown to be able to lead to either increases or decreases in total travel according to changes in working practices and/or residential location preferences.
Figure 5.4 Structure of LUTI models Source: David Simmonds Consultancy, 1998
5.122 Despite the value of LUTI models in being able to distil extremely complex relationships into tractable models which have some use in planning and forecasting procedures, we do have some reservations about their use as evaluation tools. Our reservations fall into four main areas:
• market mechanisms;
• consistency;
• equilibrium and dynamics; and

Transport and the economy: full report (SACTRA)
108
• data and estimation problems.
5.123 There are key issues in the way in which each of the markets works. LUTI models tend to assume competitive market clearing. We have already explored in detail, through the models developed by Venables and Gasiorek (1998), what happens when there is imperfect competition in the product markets, those which use transport. We have also shown how there is a major need for further understanding of the operation of labour markets. A third concern is the assumption of the way in which land markets operate. There is an underlying assumption that land markets operate competitively such that land rents will always reflect the value of a given location, which will in turn be related to the cost of access to that location, ie, transport costs. Where competitive markets do not operate this basic link will not apply.
5.124 LUTI models were developed with an initial concentration on the forecasting of physical flows, tonnes of goods, flows of commuters, numbers of vehicles. This causes some problems in the consistent treatment of markets in economic welfare terms, since it may not allow the full representation of the trade-off between factors which is the essence of the decision-making of economic agents within markets. This leads to problems in tracing the full impact of changes throughout the economic system.
5.125 LUTI models are by their nature extremely large and complex and thus pose problems in achieving convergence to equilibrium. Whilst the increasing power of computation has enabled the development of much more efficient algorithms, these almost always require some sacrifice of complexity. Examples of complexity reduction include the use of higher levels of aggregation, and reducing the number of endogenous variables, those determined within the model. Some claims have been made that LUTI models can provide a dynamic solution. However, in practice most models do not have genuinely dynamic relationships embedded within them. Quasi-dynamics is achieved by the use of lagged relationships and iterating the model forward period-by-period. Even analytical models have great difficulty in dealing with spatial dynamics since this involves models having to optimise through two dimensions, space and time.
5.126 Perhaps the greatest concern is the extent to which, first, data can be produced to calibrate large scale LUTI models and, secondly, the models can be calibrated. Calibration typically implies importing parameters from outside in order to maximise the amount of information which can be obtained from limited data. This is a respectable procedure, but does leave some problems of interpretation of the results which are not always fully understood.
5.127 We are aware of some current work within the EU research programme which is aiming to bring together the detailed transport and regional economic models of the LUTI framework such as MEPLAN, with the macroeconomic model of the type used by CEBR and a detailed environment model. The Assessment of Transport Strategies framework (ASTRA) concentrates on the development of the linkages between these four model elements within a system dynamics model (IWW, TRT, ME&P, CEBR, 1998). This promises to be an interesting development because of its concentration on the behaviour of the system as a whole. We have not, however, had an opportunity to evaluate the overall performance of this approach to date.

Transport and the economy: full report (SACTRA)
109
Conclusions: Implications for Research and Appraisal
5.128 This chapter has considered an extremely wide range of implications from the development of the standard model of linkages presented in Chapter 4. It is appropriate to present a short summary of the salient issues which we need to take forward. Some of these represent an agenda for the research effort, the rest represent the key requirements of any appraisal process and which we take forward to the assessment of appraisal in Part 4 of this Report.
Research agenda
5.129 We identify five main research issues from this chapter:
• the sectoral use of transport;
• the need for detailed analysis of local labour markets;
• the need for careful modelling of land and property markets;
• the need to model inter-regional interactions; and
• the need for careful representation of both equilibrium and dynamics in any appraisal methodology.
5.130 It is necessary to look carefully at the way in which transport is used within individual sectors, both freight transport and personal travel on employers' business. This is the key link between transport and the product market and it is clear we cannot rely on assumptions of simple continuous relationships between transport provision, transport costs and firms' total transport demands. There is a need for more consistent research evidence on the use of transport and transport costs by sector to inform appraisal practice. We recommend detailed discussion with ONS to define improvements in data collection which will, in particular, allow for better assessment of the role of employers' business travel.
5.131 Perhaps even more surprising is the lack of reliable empirical evidence on the links between transport and the operation of local labour markets. It is clear that spatial labour markets cannot be assumed to coincide conveniently with other spatial markets, nor that they are independent of skill or occupation. It seems logical to assume that changes in transport will affect wages and hence firms' costs and the economic growth of a region, but we have identified a number of conflicting pressures which show the net effect of this to be essentially an empirical question depending on the relative size of different influences and responses. The relationship between wages and employment (the wage equation) in local labour markets, how this is affected by the costs of transport (both into and out of a region and within it) is a major question for further research. We recommend a detailed study of the commuting response to a substantial change in transport provision which examines not just changes in commuting patterns, but also the impact on wages and employment levels in adjacent areas.
5.132 Similarly, there are important questions for land and property markets. In a perfectly competitive economy we can expect the total value of rents (payment for the use of land at a given location) in the local economy to equal the total cost of transport. Any variation in the cost of transport will have an immediate and opposite effect on land rents. Thus it is reasonable to ignore property related issues in a transport appraisal on the assumption of perfect competition. In an imperfectly competitive world this relationship will cease to hold and there will be important changes in welfare which are not measured by the transport
Transport and the economy: full report (SACTRA)
110
benefits. This is compounded by the further linkage between the labour market and property market through home ownership and potential migration. Thus a more careful representation of the land and property markets, especially the link between property prices, home ownership, commuting and migration, is a further major requirement. This could be a further development of the labour market study recommended above.
5.133 Where there is more than one region, a given change in transport costs between them (or between either or both of them and a third region) can have a variety of effects. Better information on inter-regional input-output and inter-regional flows is a pre-requisite for any serious improvement in modelling and appraisal practice. We return to consider how this can be done in Chapter 10 (paragraph 10.136).
5.134 The assumption of equilibrium is a convenient one in economic analysis, but it does present particular difficulties when the required model depends critically on interactions between different markets, each of which may not be in full equilibrium. The dynamics of such a system can be very complex. Whilst it may not be feasible to move directly to a fully dynamic disequilibrium modelling framework, it is important to recognise the way in which disequilibrium and dynamics can impact on each element of the framework. Further research on disequilibrium and dynamic models is a further important requirement for improvements in appraisal practice as discussed further in Chapter 10 (paragraph 10.219 et seq).
Modelling implications for appraisal
5.135 In Chapter 8 we shall set out a series of Appraisal Requirements. The discussion of this chapter has, however, identified a series of rather different modelling approaches to the question of how we identify the wider economic benefits from transport changes where the traditional assumptions of perfect competition in both transport and transport-using sectors do not hold. The choice between these different approaches will depend to a large extent on the type of change being proposed, but we can summarise the approaches in three broad categories of model:
• aggregate productivity models: - single equation models; - multi-equation models;
• computable general equilibrium models; and
• land-use/transport interaction models.
5.136 Aggregate productivity models, such as those following Aschauer (1989), started with extremely simple sets of econometric relationships which aimed to show the way in which transport improvements, treated as improvements in productivity, affect the aggregate level of economic activity in an economy. These typically use single equation models of either an aggregate production function or its dual cost function to estimate the linkages. The aggregate nature of these models, and the serious econometric problems associated with them, lead us to the conclusion that such models do not have a role to play in the appraisal of the impacts of transport changes.
5.137 However, there have been developments of such models which aim to explore the nature of these aggregate relationships in more detail, for example those developed by CEBR (1994). These use multi-equation models, often of considerable sophistication, especially to deal with the linkages in the macro-economy. The weak link of these models is typically that between the transport demand elements and the labour market and production sectors of the
Transport and the economy: full report (SACTRA)
111
macro-economic model. They also tend to treat markets as competitive and do not explore sufficiently the way decisions are taken by agents within such markets. We are not convinced that the very substantial additional economic benefits from transport changes implied by some applications of such models can be fully justified on the basis of the evidence available to us. We believe that such aggregate multi-equation models may prove too difficult to elaborate for many local transport changes, and that whilst they may have a role for the appraisal of transport at the national or EU level, the current applications are too simplistic or unspecific for immediate application. There is a substantial need for further research on the key linkages before such models can be treated with any confidence as appraisal tools.
5.138 Computable general equilibrium models, such as that developed by Venables and Gasiorek (1998), enable us to go one step further. They deal explicitly with imperfect competition in constituent markets and enable specification of the ways decisions are taken by agents in such markets. To date such models have concentrated on such markets in an aspatial way and have not specified the transport sector in sufficient detail for us to be fully confident of the implications. However, such models have demonstrated that there could be deviations, in either direction, from the simple evaluation of the conventional transport appraisal model and that the local and regional impacts of transport changes could be the reverse of that intended. We need to consider carefully how such models could be taken forward as the basis for appraisal. We shall consider practical ways of using such models as the basis of appraisal in more detail in Chapter 10 (paragraph 10.137).
5.139 We have looked in some detail at the approach taken by LUTI models as these are already being advocated for use in the wider appraisal of transport changes. While we have some reservations about the assumptions made in terms of the operation of markets in such models as well as the data and estimation implications, we believe that the land-use/transport interaction models are worthy of further development and discuss the possible elements of this in more detail in Chapter 10 (paragraph 10.100 et seq).

Transport and the economy: full report (SACTRA)
112
Chapter 6 - Transport Intensity
The Potential for 'Decoupling' Economic Growth from Traffic Growth
Introduction
6.01 As discussed in Chapter 2, there has been a long term growth in the number of vehicles, the length of trips and the volume of traffic, and these trends have taken place at the same time as more or less steady growth in national and individual incomes. The discussion in Chapter 4 and Chapter 5 focuses on the extent to which provision of facilities for efficient movement of people and goods may contribute positively to the growth of national income. However, we note that as incomes grow, this will itself to some extent encourage a growth of traffic; if that in turn causes additional congestion or environmental damage, the overall performance of the economy may then be dampened or harmed by the side effects of the traffic growth.
6.02 Thus, given a long term positive correlation between national income and the volume of traffic, it is necessary to distinguish between two alternative chains of cause and effect: first, the contribution of transport to economic growth; secondly, the effect of economic growth on stimulating movement.
6.03 So our terms of reference ask us to consider whether there is scope for restraining the growth in traffic, in order to reduce some of its undesirable side-effects, but without damaging the prospects for economic growth. This objective is now included in the Government's sustainable distribution strategy, and has been widely discussed by the Royal Commission on Environmental Pollution, the CBI, and others, in terms of 'reducing the transport intensity of the economy'.
6.04 There are two necessary conditions for such a strategy to be successful. First, it must actually be feasible - there must exist measures which will reduce the volume of traffic and transport for a given level of national income. Second, if such measures do succeed in reducing traffic and transport demand, it is necessary to assess what will be their net effect on economic welfare or in terms of the productive potential of the economy. We consider the first question in this chapter and the second question in Chapter 7.
Transport Intensity
Basic influences on travel demand
6.05 While income level must inherently be important as an enabling factor in any travel choice involving money expenditure, and is also indirectly important in conditioning tastes and lifestyle which have a bearing on travel, it is certainly not the only influence. Among others are:
• natural features such as the geography of the country, barriers or aids to movement including rivers, estuaries, mountains, etc;
• environmental factors including land-use patterns such as the size, relative location and density of settlements;
• social and demographic factors including age, sex, family size and structure, and household size;

Transport and the economy: full report (SACTRA)
113
• transport opportunities, including the inheritance of previous infrastructure developments, the cost and quality of methods of transport available; and
• changing consumer preferences and attitudes, and tastes for different methods of transport.
6.06 At the risk of some simplification, it is possible to divide the various influences on travel into three classes. One class is the effect of external factors which are either substantially immutable (eg, the country's location and physical geography) or cannot readily themselves be considered as potential direct or indirect instruments of transport policy. The most important of these is income itself, and fundamental demographic trends such as mortality and life-expectancy. The second class is the effect on movement of overt transport policy instruments, most obviously those which affect price, speed and quality of travel. A third class are influences on the demand for travel, such as land-use patterns or the supply and cost of housing, which are susceptible to other government policies but have traditionally been treated as being mainly outside transport policy considerations. Some are now seen as having potentially significant interdependencies with transport policy and we return to this below.
6.07 The relative significance of these different classes of influence is a highly relevant question because it bears on the scope and role of policy in this area. If we conclude that income is overwhelmingly the most important influence on the volume of travel, and price and other factors susceptible to policy have little or no influence, then extra movement is a more-or-less inevitable consequence of economic growth, and there is little we can do to avoid it. The role of policy is then restricted to alternative ways of satisfying a given demand for transport and travel (mode choice, etc.). On the other hand, if we conclude that cost (including both price and other cost-factors, such as travel time) and other policy-sensitive factors do have an appreciable impact on the volume of movement, then it is possible to conceive policies whereby economic growth does not also produce growth in traffic to the same extent.
6.08 This chapter does not seek to review all the evidence on all the complex factors which influence the growth of traffic. Rather, we take as given the geographical, environmental and social influences on travel, and focus on the relative importance of income on the one hand (as the key measure of the effect of economic growth on movement), and price, with its associated effects of speed, on the other (as the key measures of the effects of transport policies).
Income growth and transport intensity
6.09 This issue has been highlighted in recent years by an important discussion on 'transport intensity', which is discussed in summary below, and in more detail in Appendix D.
6.10 As defined in Chapter 3, transport intensity is an aggregate measure of the resource importance of transport in the national economy. The term was suggested by Peake (1994) as an analogy with the energy sector, where 'energy intensity' had been found a useful broad-brush indicator of how efficiently energy was being used in production and consumption. Peake defined the concept of gross mass movement, adding together both passenger and freight mobility into a single index expressed in terms of tonne kilometres. Transport intensity is then the ratio of gross mass movement to GDP. Ideally, the intensity should be computed for all modes (land, sea and air) and for national and international travel. In practice, much of the policy discussion has focused on road traffic intensity (the ratio of vehicle kilometres to GDP). It is also possible to separate passenger and freight movement
Transport and the economy: full report (SACTRA)
114
into different intensity indices, by using car vehicle kilometres (or passenger kilometres), and freight vehicle kilometres (or tonne kilometres) respectively.
Issues of definition and interpretation
6.11 Before considering trends and forecasts for transport intensity, as variously defined, there are a number of caveats to be borne in mind, particularly in interpreting the ratios and drawing lessons for policy:
• the measure itself, being based on physical output measures, does not necessarily reflect the differences in the cost of resources which different modes of transport or different journey conditions may require for a given output;
• as discussed in Chapter 3, not all economic activity is measured in GDP, and this is especially important in transport because many of the estimated economic benefits of transport improvements, notably accident reductions and time savings, do not appear directly in GDP; and
• the observation of any particular ratio of transport activity to GDP does not necessarily demonstrate either that this amount of transport or road traffic was 'necessary' to produce a unit of GDP, or that a unit of GDP inevitably generates this amount of transport or traffic (and it certainly cannot do both, though the same data are often marshalled in analyses to calculate both potential cause-and-effect relationships).
6.12 Finally, we comment that it will not always follow that either an increase or a reduction in transport intensity is of itself a definite policy objective. Thus, when reducing road traffic is an explicit objective of policy, as reflected for example in the Road Traffic Reduction Acts and the sustainable distribution strategy for freight, this is not usually described as an end in itself, but as deriving from the underlying rationale to reduce the problems to which road traffic currently gives rise. Ideally, therefore, one would measure the intensity, relative to GDP, of the individual problems (congestion, pollutants, etc.). This point lends weight to the suggestion we make in the following chapters, on the need for cost benefit analysis of measures designed to restrain the growth of traffic. The context must be considered before the desired direction of movement of intensity can be defined.
Trends in transport intensity
6.13 In spite of these caveats, there has been a considerable degree of interest in the behaviour of transport intensity in recent years, in which a recurrent theme has been Peake's observation that transport intensity has been increasing systematically over a period of 40 years or more. In a policy context where there are reasons for increasing national income but reducing traffic, the measure of traffic intensity has been felt to be an indicator of progress in doing so, and observation that it has been increasing has been treated as a matter for concern.
6.14 An observation of Peake therefore appeared of great significance. He noticed that after a long period of increasing intensity, the 1989 DETR traffic forecasts (the most up to date then available) implied that traffic intensity would turn and start decreasing around the turn of the century. He pointed out that this could not have been due to assumed successful implementation of policies intended to procure such an outcome, because there were neither mechanisms nor assumptions in the forecasting methods used.
6.15 The Committee wished to check whether the implications of the 1989 forecasts were indeed as Peake had suggested, and the DETR was able to make the detailed figures available, updating them so that actual data could be used up to 1995, together with the 1989
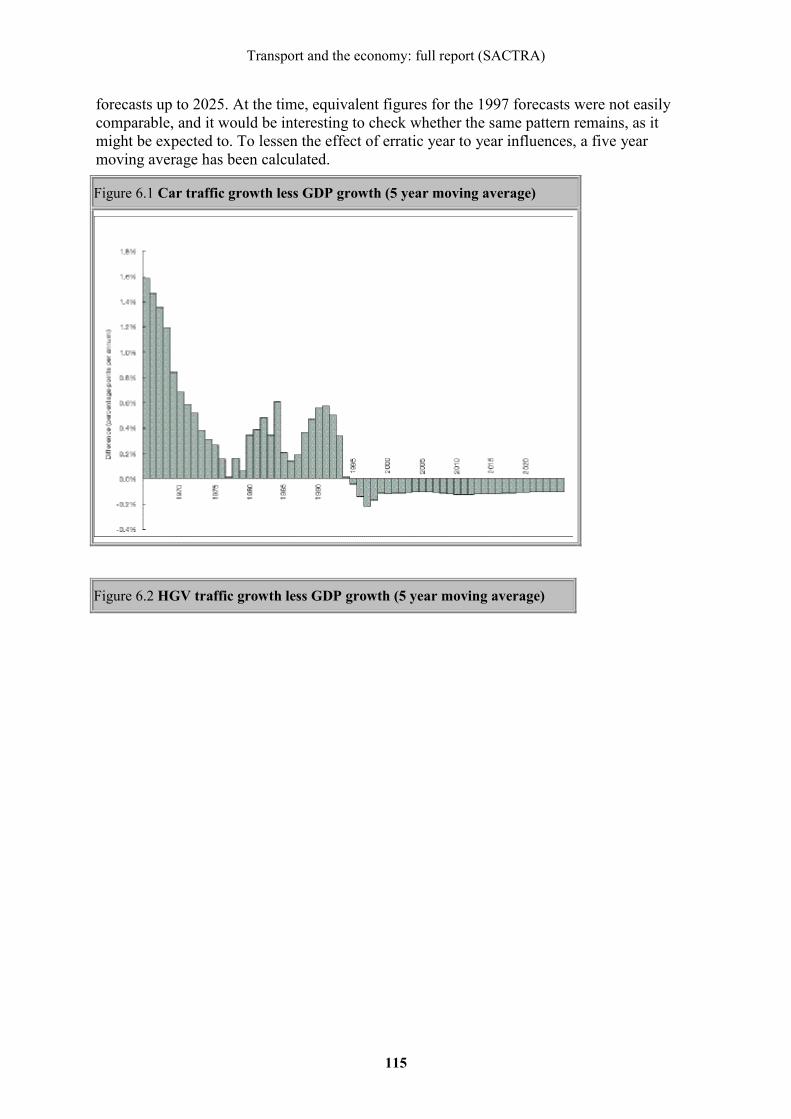
Transport and the economy: full report (SACTRA)
115
forecasts up to 2025. At the time, equivalent figures for the 1997 forecasts were not easily comparable, and it would be interesting to check whether the same pattern remains, as it might be expected to. To lessen the effect of erratic year to year influences, a five year moving average has been calculated.
Figure 6.1 Car traffic growth less GDP growth (5 year moving average)
Figure 6.2 HGV traffic growth less GDP growth (5 year moving average)
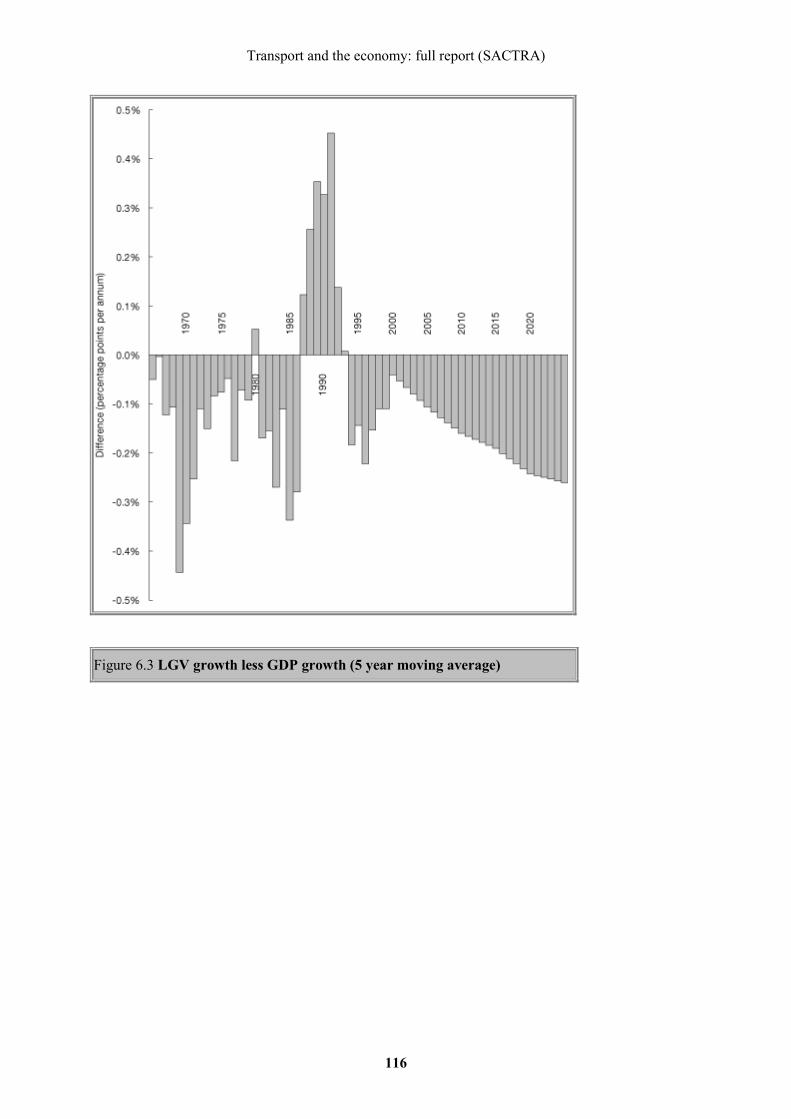
Transport and the economy: full report (SACTRA)
116
Figure 6.3 LGV growth less GDP growth (5 year moving average)
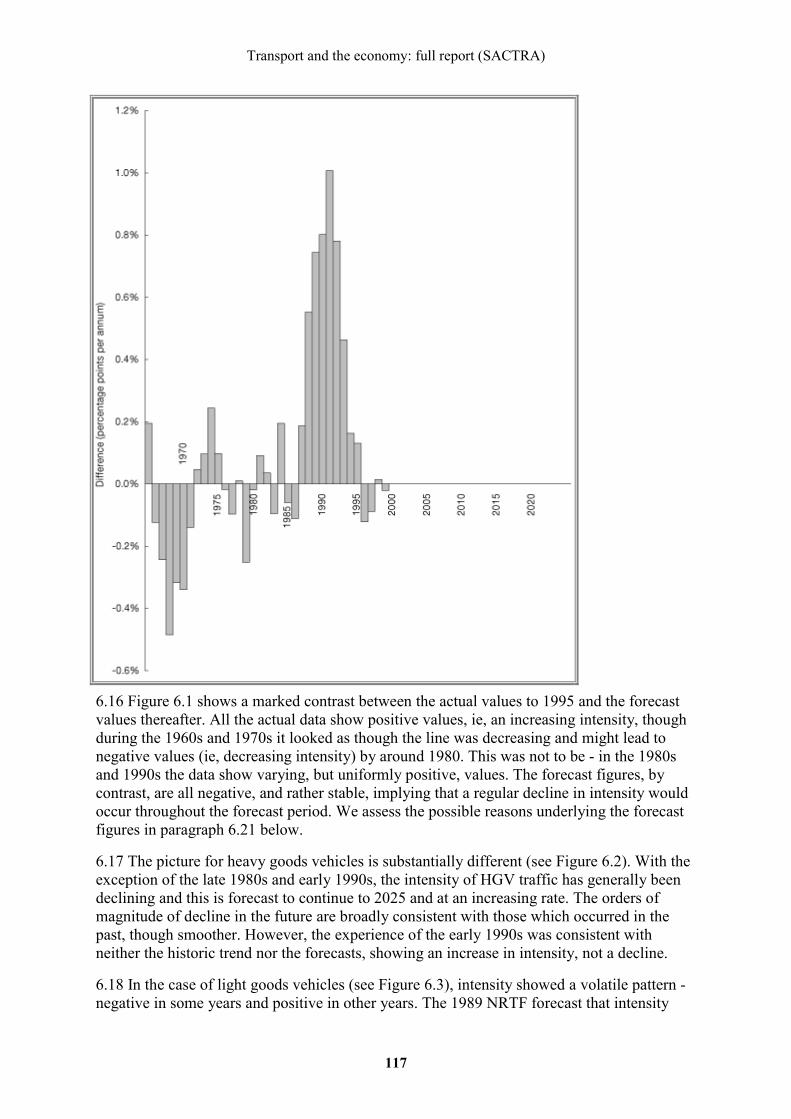
Transport and the economy: full report (SACTRA)
117
6.16 Figure 6.1 shows a marked contrast between the actual values to 1995 and the forecast values thereafter. All the actual data show positive values, ie, an increasing intensity, though during the 1960s and 1970s it looked as though the line was decreasing and might lead to negative values (ie, decreasing intensity) by around 1980. This was not to be - in the 1980s and 1990s the data show varying, but uniformly positive, values. The forecast figures, by contrast, are all negative, and rather stable, implying that a regular decline in intensity would occur throughout the forecast period. We assess the possible reasons underlying the forecast figures in paragraph 6.21 below.
6.17 The picture for heavy goods vehicles is substantially different (see Figure 6.2). With the exception of the late 1980s and early 1990s, the intensity of HGV traffic has generally been declining and this is forecast to continue to 2025 and at an increasing rate. The orders of magnitude of decline in the future are broadly consistent with those which occurred in the past, though smoother. However, the experience of the early 1990s was consistent with neither the historic trend nor the forecasts, showing an increase in intensity, not a decline.
6.18 In the case of light goods vehicles (see Figure 6.3), intensity showed a volatile pattern - negative in some years and positive in other years. The 1989 NRTF forecast that intensity

Transport and the economy: full report (SACTRA)
118
would stay stable (ie, LGV traffic would grow at the same rate as GDP). In the event, the early 1990s showed growth of LGV traffic at a faster rate than that of GDP, and intensity increased.
6.19 The Committee spent some time investigating these trends, together with international data using statistical analyses carried out by the DETR. The analysis and interpretation is reported in Appendix D. We formed two main conclusions.
6.20 First, traffic intensity, however measured, shows very considerable variation from country to country, and even within countries shows substantial variation from year to year. These variations are not explained solely by the prevailing income levels - income does seem to have some effect, as expected, but this relationship also must vary from country to country and from time to time. There is no overwhelming evidence that 'efficient' countries are consistently marked by high, low, increasing or decreasing levels of traffic intensity.
6.21 Second, there is a rational explanation for the fall in future traffic intensity predicted from the 1989 traffic forecasts. The forecast decline in intensity arose because of the assumptions made about the mathematical form of the estimated relationship between car ownership and income, which dominated the forecasts. For other classes of traffic the argument is not so clear cut. In essence, as car ownership approached saturation, its elasticity with respect to income was forecast to fall below one, and this meant that intensity as measured would fall. Even with intensity forecast to decline, however, the actual traffic level and the implied level of congestion would continue to rise. This observation exemplifies the limitation, discussed above, of transport intensity ratios as an indicator of the effectiveness of transport policies.
6.22 Thus, our review of trends in transport intensity highlights the importance of considering the relative effect of income and other factors which influence traffic growth.
Price and other Policy-related Influences on Traffic Volumes
6.23 In this section, we briefly summarise available empirical knowledge on the size and nature of impacts that changes in price (and travel time) have on traffic levels.
Sources
6.24 There is a large and long-standing literature on the estimation of demand elasticities, and several literature reviews have been published which synthesise or comment on this literature. Reviews which, between them, cover most of the UK and foreign work of which we are aware, include Harbour (1987), Oum, Waters & Yong (1992), Goodwin (1992), Luk and Hepburn (1993), Lee (1998) and Glaister and Graham (forthcoming). Altogether, in excess of 300 references are included in these reviews, together with a number of recent studies made available to us but which have not yet found their way into literature reviews.
6.25 The core of this work consists of econometric analysis of aggregate time series data on various measures of transport demand related to prices, income, sometimes service levels, and other socio-economic variables. In the best cases, methods are used which take account of non-instantaneous processes (thus allowing distinction between short and long run effects), and, by simultaneously including most influences of importance, reduce the danger that effects are wrongly attributed.
6.26 A somewhat separate literature relates to the effects of changing travel conditions, primarily speeds, which result from changes in the actual or effective capacity of road
Transport and the economy: full report (SACTRA)
119
networks. The two key references (each of which also synthesise a range of other evidence amounting to several hundred source references) are SACTRA (1994), which considered the case of the effects of increasing transport infrastructure (especially road capacity), and Cairns, Hass-Klau & Goodwin (1998), which considered the case of reducing road capacity. Both strands of work have now become part of an emerging research literature extending and updating their results, notably including ECMT (1998). In these, the core methods were based on before-and-after observation of traffic counts and other indicators influenced by implemented changes, although surveys and other sources were also used which helped to give understanding of the behavioural mechanisms, in the short and long run, which underpin the empirical estimates.
6.27 In addition to the above two main classes of evidence, there are elasticities calculated using stated preference methods, in which behavioural responses are inferred from questions about preferences in hypothetical situations. Elasticities are also often quoted which are inferred by analysing the predictions of transport models, giving useful insights into the performance of the models. We have not relied on these sources for this report.
6.28 The general caveat needs to be made (as always) that demand elasticities are by their nature aggregate and averaged indicators of the sensitivity of demand to various influences. However, they are built up from very many different decisions made by very many different individuals and institutions; a real understanding of the underlying decisions helps to inform interpretation of the overall elasticities. Where such understanding and information is available, it will also help to provide forecasts which are much more detailed, and relate much more closely to local context and conditions, than overall elasticities. Thus, the discussion of modelling improvements in Chapters 9 and 10 reflects this commitment to detailed decomposition of market responses into the separate parts where it is feasible to do so. But for this chapter, we are more concerned with identifying the overall patterns and sensitivities, and for this purpose demand elasticities represent the most widely-available, empirically-based, evidence.
6.29 Overall, we judge that this is a field richly provided with empirical evidence, of varying quality, but including some excellent state of the art research, and with some still unresolved issues.
Methodological problems
6.30 It is common for definitions of the dependent and independent variables, and of elasticity, to vary from study to study, in accordance with their objectives and the availability of data. Elasticities derived from time series estimation usually produce the sensitivity of points on an explicitly defined demand curve, whereas those based on before and after studies usually relate to a discrete, perhaps large, change. Incomes, prices, service levels and other influences are rarely statistically completely independent of each other, so that when one important factor is omitted, the effects of others tend to be biased, and even when all are included there remains a degree of uncertainty about estimation of their relative importance. There is a particular problem in analysing the effects of some transport costs, in that consumers may not know precisely what the costs are, due to inaccurate perception. Econometric analysis tends to assume that, at least in the long run, consumers behave as though they accurately perceive the costs facing them. However, this is difficult to justify in the short run, and the pace and path of transition from short to long run effects may be very different when comparing the effects of changes in fixed and variable costs.
Transport and the economy: full report (SACTRA)
120
6.31 In addition, there are important theoretical and/or empirical relationships among the effects, some of which may not be explicit in any particular study. Many of these complications relate to behavioural responses which may be different in the short and long run, and studies which do not take account of this may produce elasticities which are not directly comparable with other studies which do allow for such responses, even where the definitions and data are compatible.
6.32 It is notable, however, that different reviews of the literature, taking account of these difficulties as far as is practical, have tended to come to rather similar overall conclusions. Overall, therefore, we judge that our conclusions below are relatively well supported by the literature. We emphasise, however, that variations in local circumstances &- and the irreducible complexity of human behaviour &- will inevitably mean that demand effects can only be roughly approximated by aggregate measures such as elasticities, and detailed study will usually be necessary for specific applications.
Main results
6.33 For reasons of space, and because the literature is largely in the public domain, we do not here reproduce the detailed summaries and analysis that have led to our conclusions and recommendations. Readers wishing to pursue this further are referred initially to the reviews cited. However, we judge that, with the usual caveats, the conclusions are robust, and consistent with the body of available evidence as a whole. Our discussions on the Committee, with the authors of some of the studies, and with the Department, lead us to the view that these interpretations will not be controversial.
The Importance of Income 6.34 A reading of the literature as a whole does confirm that the size of the income effect on traffic growth is large, and can be the most important single factor. The elasticity of traffic volumes with respect to personal income growth, of course, varies in different studies, but can often be close to one, ie, ignoring other effects, traffic can grow in proportion to income. For personal travel (for reasons discussed above in the context of transport intensity), this elasticity tends to decline over time, primarily because of the approach to saturating levels of car ownership, and this effect seems to be strong and important; for example, estimated elasticities in some countries declines from 1.5 to less than half that in recent years. For freight traffic, such a decline in elasticity has not been established, and such evidence as exists is more limited.
6.35 We recommend that research into the effect of income growth on freight traffic should include consideration of any potential factors which might increase or reduce the strength of this relationship as it develops, as well as the non-income effects (price, speed, quality, etc.) as discussed below.
The Importance of Price 6.36 The general pattern of estimated elasticities confirms that price effects are usually smaller than income effects, but are still large enough to have significant, different (though connected) effects on car ownership, traffic volumes, and fuel consumption. There is strong evidence that car prices affect vehicle ownership, and that fuel prices affect traffic volumes and fuel consumption. Evidence also exists that vehicle running costs affect car ownership as well as use. To give an idea of the order of magnitudes concerned, several reviewers of the field as a whole (see references in paragraph 6.24 above) have come to their own conclusion that a 10% change in fuel price will lead to around a 1.5% effect on total vehicle kilometres in the short run (one year) and around 3% in the long run (typically found to be 5-10 years).
Transport and the economy: full report (SACTRA)
121
The effects on fuel consumption in the short and long run are suggested to be about twice as great as this. The reason why the effect on fuel consumption is substantially greater than the effect on traffic is not well-established, but is thought to be due to consequent changes in the efficiency and size of vehicle in the longer run, and possibly effects on driving styles and differential impacts on more and less fuel efficient journeys in the short run.
6.37 As a committee, we do not endorse, or dissent from, these summaries of average values from the literature as a whole, partly because all reviewers comment that such magnitudes are subject to a range; for example, recent work by Dargay and Gately (1997) finds elasticities rather higher than this for both vehicle ownership and use, while work used by the DETR for the National Road Traffic Forecasts was based on substantially lower figures. The Department has suggested that a likely reason for this discrepancy is that in recent years they have assumed that prices have no effect on vehicle ownership. However, for other exercises (notably calculation of the impact of policies such as the fuel price escalator) they have used a range of elasticities including estimates higher than those used for NRTF. Further research is planned, which we support.
6.38 We recommend that the DETR reviews the consistency of its price elasticities used in different forecasting and appraisal exercises, particularly (though not only) in relation to longer term behavioural responses including car ownership effects, and especially their consistency with the large body of non-DETR literature.
The Importance of Other Influences Subject to Policy Intervention 6.39 Using the framework of generalised cost widely applied in travel demand modelling, any price elasticity directly implies also a corresponding travel time elasticity (and, in principle, distinct elasticities for speed, walking time, waiting time, etc.) because by definition the values of time used in demand forecasts to convert time effects into money effects or vice versa are those which imply equal effects on behaviour.
6.40 This gives two different routes into the calculation of the size of such effects &- either indirectly by inference from combining empirical studies of price elasticities and empirical studies of values of time, or directly by observation of changing infrastructure provision, speeds, etc, as was done by SACTRA (1994) and Cairns, Hass-Klau & Goodwin (1998). Both methods have been used widely in the literature, and while again the results are subject to a spread, there has been no evident tendency for the two different approaches to be inconsistent with each other. Since non-price components of generalised cost, primarily journey time, tend in many circumstances to be larger than price components, the elasticities are then also proportionally larger.
6.41 At the overall level, as a result, estimated overall elasticities of traffic levels with respect to a conventionally defined generalised cost as a whole tend to be of the order of minus one, or more negative, or in other words the long run price effects cited above might be of the order of a third as great as the effect of generalised cost taken together. Even if we were to take a very cautious view of the range of accuracy and local variation around these average figures &- say from half to double the values mentioned &- it is clear that the combined influence of generalised cost factors on traffic levels is large enough to have an appreciable impact on an income-driven traffic growth trend.
6.42 However, detailed knowledge about possible interaction effects among different components of generalised cost (which might be important when considering packages of related policy interventions) is not well established, and nor is the potential effect on the elasticities (or direct effects on behaviour) of influences such as comfort, image, cleanliness,

Transport and the economy: full report (SACTRA)
122
changes in accuracy of perception, or reliability which are more complicated to include within the standard generalised cost formulations.
6.43 We recommend that methods used for forecasting traffic and appraisal of policy interventions should continue to be constructed around the concept of generalised cost, aiming at consistent treatment of both price and travel time effects, direct and indirect, in the short and long run.
6.44 At the same time, we also recommend that consideration be given to incorporating (or making separate direct allowance for) interaction and quality effects which are not so easily handled in a generalised cost framework.
Separation of Income and Price Effects 6.45 It is of great importance that empirical results of the relative importance of income (and related variables) on the one hand, and price (and related variables) on the other, should be derived from methods in which both types of variable are simultaneously taken into account. This is important because unless it is done, there is a danger that effects which are truly due to price, for example, will be wrongly attributed to income, or vice versa. Policy or project appraisal would then be in danger of systematic bias. This is particularly important when the effects may be indirect, or take place mainly in the medium or longer term, where there is some evidence that effects which should be attributed to price and/or time, may have been treated as being only influenced by income.
6.46 We note in the literature that methods for distinguishing such effects are widespread and well-established, albeit always with some range of uncertainty. The Department has reported to us the results of their own in-house research work which had had some problems in successfully distinguishing income and price (and related) effects, and their intention to develop this further taking into account the methods and results of non-DETR researchers.
6.47 We recommend that explicit separation of income, price and associated effects should be a high priority for the Department's forecasting and appraisal methodology, especially in effects on the bigger behavioural decisions which may take some time to be fully reflected in traffic levels.
Special features relating to the growth of freight traffic
6.48 Although some of the results discussed above are based on empirical analysis of measured traffic flows (which therefore implicitly include freight movement in proportion to its share of the market), most of the theoretical underpinning and survey-based empirical analysis is focused on passenger traffic. In practical forecasting exercises, freight traffic is typically handled using much simpler assumptions than those needed for passenger traffic, and sometimes the assumption is made that policy-related influences (price, etc.) have no effect at all on the volume of goods movement.
6.50 For traffic appraisals, forecasting of freight vehicle movement, differentiated by vehicle size, is often adequate, though even for this purpose we consider that significant improvements in forecasting will be necessary in order to allow for the effect of the policy-related influences. In addition, assessment of the wider economic implications will need a more differentiated approach. A recent European research project, REDEFINE (Netherlands Economic Institute, 1997) has surveyed evidence from four European countries. We summarise its main conclusions here in relation to the underlying components of the growth in freight traffic.
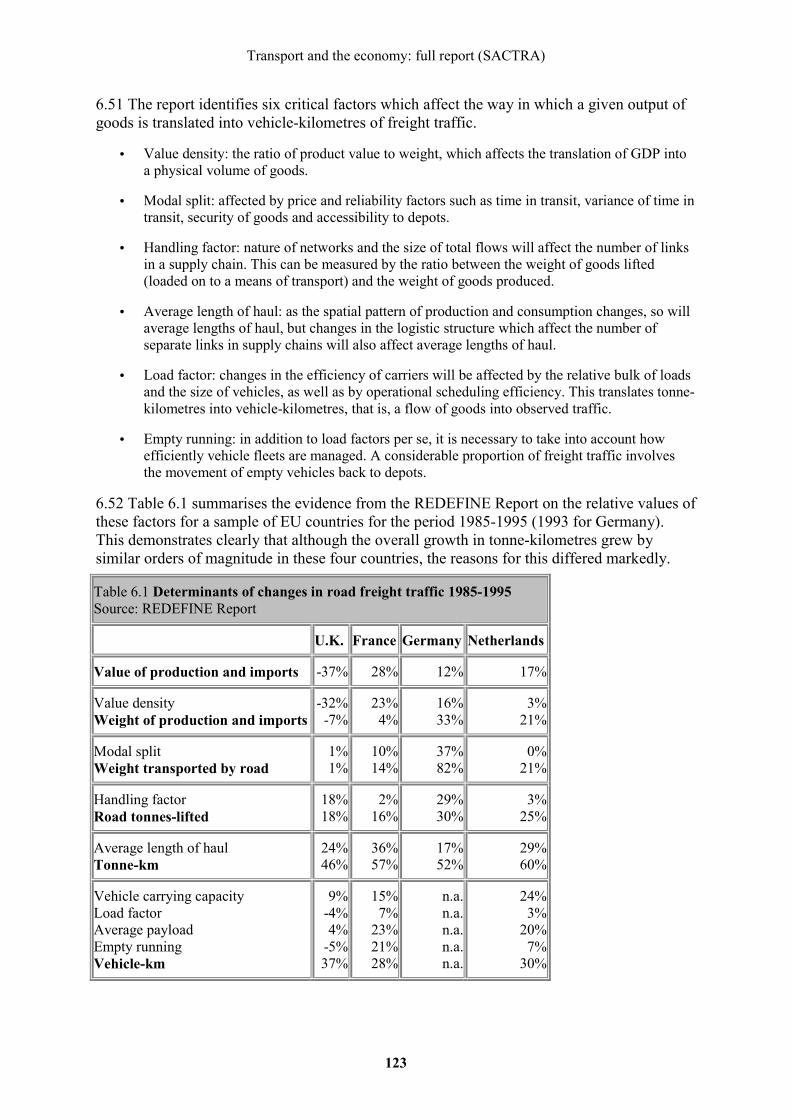
Transport and the economy: full report (SACTRA)
123
6.51 The report identifies six critical factors which affect the way in which a given output of goods is translated into vehicle-kilometres of freight traffic.
• Value density: the ratio of product value to weight, which affects the translation of GDP into a physical volume of goods.
• Modal split: affected by price and reliability factors such as time in transit, variance of time in transit, security of goods and accessibility to depots.
• Handling factor: nature of networks and the size of total flows will affect the number of links in a supply chain. This can be measured by the ratio between the weight of goods lifted (loaded on to a means of transport) and the weight of goods produced.
• Average length of haul: as the spatial pattern of production and consumption changes, so will average lengths of haul, but changes in the logistic structure which affect the number of separate links in supply chains will also affect average lengths of haul.
• Load factor: changes in the efficiency of carriers will be affected by the relative bulk of loads and the size of vehicles, as well as by operational scheduling efficiency. This translates tonne-kilometres into vehicle-kilometres, that is, a flow of goods into observed traffic.
• Empty running: in addition to load factors per se, it is necessary to take into account how efficiently vehicle fleets are managed. A considerable proportion of freight traffic involves the movement of empty vehicles back to depots.
6.52 Table 6.1 summarises the evidence from the REDEFINE Report on the relative values of these factors for a sample of EU countries for the period 1985-1995 (1993 for Germany). This demonstrates clearly that although the overall growth in tonne-kilometres grew by similar orders of magnitude in these four countries, the reasons for this differed markedly.
Table 6.1 Determinants of changes in road freight traffic 1985-1995 Source: REDEFINE Report
U.K. France Germany Netherlands
Value of production and imports -37% 28% 12% 17%
Value density Weight of production and imports
-32%-7%
23%4%
16%33%
3%21%
Modal split Weight transported by road
1%1%
10%14%
37%82%
0%21%
Handling factor Road tonnes-lifted
18%18%
2%16%
29%30%
3%25%
Average length of haul Tonne-km
24%46%
36%57%
17%52%
29%60%
Vehicle carrying capacity Load factor Average payload Empty running Vehicle-km
9%-4%4%
-5%37%
15%7%
23%21%28%
n.a.n.a.n.a.n.a.n.a.
24%3%
20%7%
30%

Transport and the economy: full report (SACTRA)
124
6.53 In all countries, an increase in the average length of haul was the single most important determinant of the increase in traffic. In the UK, the main factor was a 24% increase in the average length of haul and an 18% increase in the handling factor, so that there were more links of greater average length in the supply chain associated with a very small change in the overall volume of goods transported. In the Netherlands, the main factor was again average length of haul, but here combined with a large increase in the total volume of goods to be handled. Increases in vehicle carrying capacity and reduced empty running ameliorated the impact on total traffic. In Germany, the main factor was a substantial increase in road's modal share plus, again, an increase in average lengths of haul, but here the handling factor (average number of links in the supply chain) fell substantially. In France, as well as the increased average length of haul, there was also a substantial increase in the modal share of road. Substantial increases in efficiency in terms of both average payload and reductions in empty running had an ameliorating effect on the total traffic increase.
6.54 It is therefore essential to understand what lies behind these changes in the organisation of logistics and the supply chain to be able to model and predict the key drivers in Table 6.1. These can be summarised under four main headings.
• Restructuring of logistical systems - the spatial concentration of production or inventories.
• Realignment of supply chains - vertical disintegration of production, changing patterns of sourcing, changing markets.
• Rescheduling of product flow - use of just-in-time, etc.
• Management of transport resources - changes in vehicle size, increasing efficiency of vehicle utilisation, handling systems, etc.
The first two of these are the main drivers behind changes in handling and average lengths of haul. Changes in the latter two are the main factors affecting carrying capacity and load factors.
6.55 This evidence confirms the view that the estimation of freight elasticities is both complex and likely to be subject to changes through time. However, understanding these issues is a key element in predicting future trends in freight traffic as the structure of the economy continues to change. We recommend therefore that substantial new research effort is devoted to the development of more robust freight forecasting models which take account of the factors identified in the previous paragraph.
Second round effects
6.56 The discussion in the earlier part of this chapter focused on the direct relationship of prices and costs with road traffic levels. We noted also that other factors susceptible to government policies can influence the demand for travel, particularly land use patterns and the supply of housing, and that these are now seen as having potentially significant interdependence with transport policy. We have already noted in Chapters 4 & 5 that transport prices can have important indirect impacts on travel and indeed road traffic through the operation of labour and land markets. A number of submissions to SACTRA have suggested that changes in price and in road capacity generate second round effects, notably on land use. As noted in Chapter 5, there has been considerable discussion in the US and in the UK about the economies of urbanisation and low density sprawl. For example, Headicar's work on the M40 corridor (1996) has noted the link between transport impacts and land use planning. This body of work as a whole suggests that changes in transport prices can affect

Transport and the economy: full report (SACTRA)
125
elasticities indirectly as well as directly, by influencing land use patterns to make them more or less car dependent (especially over the longer term) and hence can further influence road traffic levels and the propensity to use cars.
6.57 While accepting that some of these second-round responses are elusive and difficult to establish clearly with empirical research, nevertheless their existence and importance should not be discounted, either in the long or short term. Better understanding of these factors would make it easier to ensure that:
• the effects on travel and road traffic of policies designed to influence land use patterns can be properly assessed; and
• the full longer term effects from transport pricing and infrastructure policies and schemes can be recognised and considered in appraisal.
6.58 We recommend that the Department review existing research on the mechanisms, scale and time-horizon of the second round effects (on, for example, land use) as discussed here, and on this basis consider the feasibility of further research aimed at quantified usable results.
Conclusion
6.59 Observation of trends in transport intensity demonstrates that it has been increasing, but, at least for some classes of traffic, it can be expected to decrease, even as the volume of traffic continues to grow. For this reason, it may be more revealing to discuss the effects of policy on the volume of traffic, and the effects it gives rise to, rather than on intensity itself. In this respect, we judge that empirical research has clearly established that changes in prices and travel times have appreciable effects on the total volume of traffic and its growth over time, via more and less complex chains of behavioural response.
6.60 While this conclusion may appear self-evident to many readers, we consider it worth stressing because it is critical to two aspects of our terms of reference. First, this is a necessary condition if, for any given level and rate of growth of income, a policy or infrastructure intervention is to have an effect on traffic volumes. Thus, when discussing policies intended to decouple income growth from traffic growth, the research establishes that a degree of decoupling is indeed empirically possible. Second, it is important to assess the relevance of imperfect competition theory, which requires the possibility of behavioural responses by economic actors for its linkages to be brought into play.
6.61 However, whether doing so has net economic costs or benefits is not demonstrated by this argument, and we proceed to discuss that in Chapter 7.

Transport and the economy: full report (SACTRA)
126
Chapter 7 - The Economic Impacts of Reducing Traffic
Introduction
7.01 Chapter 6 addressed the issue of how far road traffic growth in particular may be influenced by factors other than income, as the starting point for establishing in principle whether it is possible to 'decouple' traffic growth from economic growth. We now turn to address the following question: can those measures, which are effective in reducing traffic, be implemented without damaging the prospects for economic growth?
7.02 At first sight, this question appears to confront us with a paradox. Chapter 4 and Chapter 5 discussed several ways in which transport interventions which reduced costs might lead to higher productivity and economic growth. The most obvious impact would come from a reduction in costs for the private sector arising from the provision of more infrastructure, raising the return to private investment along the lines of the Aschauer hypothesis (1989).
7.03 In addition, better integration of markets, leading to more competition, economies of scale and benefits of agglomeration were among the other influences identified. For the individual business, Chapter 5 emphasised that there would be re-organisational benefits in terms of a wider search for quality suppliers, greater opportunity for just-in-time operations and, in some cases, the chance to supply markets from fewer locations, so economising on inventories.
7.04 By contrast, traffic reduction measures tend to raise the generalised cost of travel. Similarly, choking off traffic growth by failing to expand transport infrastructure and allowing congestion in effect to ration scarce road space raises transport costs compared with continuing to provide. How is it, then, that policies to reduce traffic would be consistent with sustaining economic growth?
7.05 The discussion in Chapter 3 of efficient allocation of resources provides us with a way of resolving this paradox. Where market failure means there is an inefficient allocation of resources through a divergence of marginal social cost and benefit, traffic levels may be either higher or lower than is economically optimal. This could justify intervention by government, for example, through regulation or economic instruments, provided that such intervention improves economic efficiency, after taking account of any associated administrative and distortionary costs.
7.06 In this chapter, we examine the instances of market failure which, in principle, would justify intervention to reduce traffic levels. In general, the presence of external costs arising from road transport can provide such justification. Congestion costs which are an externality felt by transport users might be reduced by reduction measures. There is a gain from faster and more reliable journeys, to be set against the extra costs of any charges or taxes that might be levied as a way of reducing traffic. Further, some traffic reduction measures raise revenue and, in principle, this can be used to offset extra costs felt by road transport users.
7.07 However, we stress the importance when considering whether to adopt measures to reduce traffic (as indeed with other forms of transport intervention) that the net benefits of any action must exceed the costs for there to be a gain in economic welfare. We recall the discussion in Chapter 4 on the conditions under which transport appraisal will correctly identify the economic impacts of such measures, as illustrated by our three-by-three matrix in Table 4.2.

Transport and the economy: full report (SACTRA)
127
7.08 In terms of economic welfare, net benefits may arise from measures to reduce both congestion costs and environmental costs. However, this might also involve adverse effects on GDP, particularly in the case of action to reduce environmental costs. This can be critically dependent on how the disbenefits arising from reducing traffic can be offset, particularly where revenue is generated. The design of compensatory measures can shape the final distribution of costs and benefits of traffic reduction and we explore some of the implications of different approaches to compensation.
7.09 We then look at the range of possible interventions and indicate where possible their likely economic impact, including their distributional consequences (ie, who might be the winners and losers, socially or geographically, from an intervention). While there is little empirical evidence, particularly in the UK, of the effect of traffic reduction measures, we are able to draw upon analyses based on models, extrapolation from official data and some empirical research.
7.10 Finally, we consider the implications for transport appraisal which arise from our examination of market failures, compensation measures and the impacts of traffic reduction measures. These will inform our discussion of current appraisal techniques and our recommendations for appraisal practice which follow in later chapters.
Market Failures in Road Transport
7.11 In Chapter 3, the conditions for an efficient allocation of resources in the economy were explored. It was established that this required that the marginal benefit (MB) of road transport be equal to its marginal social cost (MSC), taking into account all external costs. A distinction was made between marginal social cost in the short run where the capacity of the road network is taken to be fixed (its capital costs are unavoidable and thus not part of marginal cost) and in the long run where investment or disinvestment in roads is possible (capital costs are variable and are part of marginal cost).
7.12 The implications of this were analysed in Chapter 3 in the context of Figure 3.1. It was shown that an efficient outcome would result if charges or taxes were imposed such that MB = MSC with current capacity and that if MB then exceeded long run MSC this would signal the need for further investment.
External costs
7.13 In the case of road transport, external costs are important. These are real resource costs but are not faced by the individual motorist and thus do not affect his/her demand for road travel. As the analysis of Chapter 3 showed, a failure to take into account marginal external costs leads to volumes of traffic which exceed the efficient level and thus to market failure.
7.14 The most important of these external costs concern congestion - where one user's travel slows down another's and raises their generalised cost - and air pollution, where the use of motor vehicles causes damage to other people's health. The former externality is imposed on other transport users, while the latter affects both travellers and the general public. Other external costs identified for road transport include accidents; noise; road damage; contributions to global warming; and severance (for example, of communities or areas divided by a road or railway line).
7.15 Quantification of the external costs of road transport is very difficult. It should also be noted that DETR does not yet use monetary values for environmental impacts. There are no up to date official estimates of the relationship between the price (including tax) and the
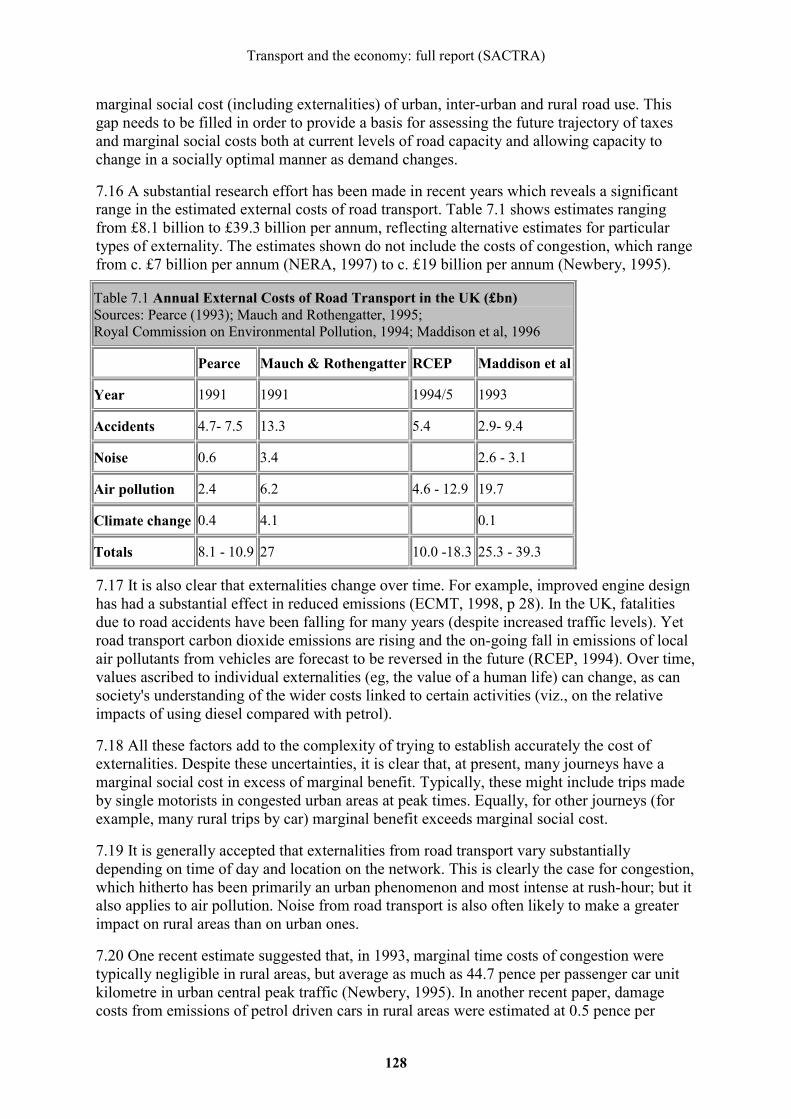
Transport and the economy: full report (SACTRA)
128
marginal social cost (including externalities) of urban, inter-urban and rural road use. This gap needs to be filled in order to provide a basis for assessing the future trajectory of taxes and marginal social costs both at current levels of road capacity and allowing capacity to change in a socially optimal manner as demand changes.
7.16 A substantial research effort has been made in recent years which reveals a significant range in the estimated external costs of road transport. Table 7.1 shows estimates ranging from £8.1 billion to £39.3 billion per annum, reflecting alternative estimates for particular types of externality. The estimates shown do not include the costs of congestion, which range from c. £7 billion per annum (NERA, 1997) to c. £19 billion per annum (Newbery, 1995).
Table 7.1 Annual External Costs of Road Transport in the UK (£bn) Sources: Pearce (1993); Mauch and Rothengatter, 1995; Royal Commission on Environmental Pollution, 1994; Maddison et al, 1996
Pearce Mauch & Rothengatter RCEP Maddison et al
Year 1991 1991 1994/5 1993
Accidents 4.7- 7.5 13.3 5.4 2.9- 9.4
Noise 0.6 3.4 2.6 - 3.1
Air pollution 2.4 6.2 4.6 - 12.9 19.7
Climate change 0.4 4.1 0.1
Totals 8.1 - 10.9 27 10.0 -18.3 25.3 - 39.3
7.17 It is also clear that externalities change over time. For example, improved engine design has had a substantial effect in reduced emissions (ECMT, 1998, p 28). In the UK, fatalities due to road accidents have been falling for many years (despite increased traffic levels). Yet road transport carbon dioxide emissions are rising and the on-going fall in emissions of local air pollutants from vehicles are forecast to be reversed in the future (RCEP, 1994). Over time, values ascribed to individual externalities (eg, the value of a human life) can change, as can society's understanding of the wider costs linked to certain activities (viz., on the relative impacts of using diesel compared with petrol).
7.18 All these factors add to the complexity of trying to establish accurately the cost of externalities. Despite these uncertainties, it is clear that, at present, many journeys have a marginal social cost in excess of marginal benefit. Typically, these might include trips made by single motorists in congested urban areas at peak times. Equally, for other journeys (for example, many rural trips by car) marginal benefit exceeds marginal social cost.
7.19 It is generally accepted that externalities from road transport vary substantially depending on time of day and location on the network. This is clearly the case for congestion, which hitherto has been primarily an urban phenomenon and most intense at rush-hour; but it also applies to air pollution. Noise from road transport is also often likely to make a greater impact on rural areas than on urban ones.
7.20 One recent estimate suggested that, in 1993, marginal time costs of congestion were typically negligible in rural areas, but average as much as 44.7 pence per passenger car unit kilometre in urban central peak traffic (Newbery, 1995). In another recent paper, damage costs from emissions of petrol driven cars in rural areas were estimated at 0.5 pence per

Transport and the economy: full report (SACTRA)
129
vehicle kilometre, compared with 2.7 pence for diesel cars in urban areas (Eyre, Ozdemiroglu, Pearce and Steele, 1997).
7.21 In order to move towards a more efficient allocation of resources in the economy, using, where appropriate, measures to reduce traffic, it is important to have a robust understanding of the size of the external costs of road transport, where these arise. Given the range of estimates which currently exist, we do not underestimate the difficulty in securing a consensus on this matter. However, we recommend that the Department takes steps towards providing official estimates of the relationship between the prices and marginal social costs of different classes of journey by road transport.
internalising external costs
7.22 It was noted in Chapter 3 that, in the event of market failure, there is a prima facie case for government to seek to correct it, but any intervention must improve economic efficiency after accounting for any administrative and distortionary costs that it imposes. The external costs arising from road transport provide a rationale for traffic reduction, insofar as this arises from the alignment of marginal benefit with marginal social cost.
7.23 As Figure 7.1 shows, this would entail the imposition of charges or taxes less than the current estimated difference between marginal social cost and current marginal private cost. The diagram reminds us that imposing a high tax or charge, which reduces volume below Q*, is suboptimal because it removes traffic for which marginal benefit exceeds marginal social cost. In principle, quantity restraint measures could also achieve the reduction on traffic volume to Q*. However, the use of pricing measures has the advantage that it raises revenue and minimises the loss of consumer surplus for a given volume reduction.
7.24 Different measures will vary in their effectiveness in internalising costs. Imposing regulatory standards, such as requirements to fit catalytic converters, can help tackle emissions. Economic theory suggests that this approach is inferior to taxation, though for practical or political reasons regulation could offer a second-best solution. The advantages of taxes over the use of regulatory standards are well-known. They would minimise the costs of achieving a given reduction in emissions, provide incentives to find ways of reducing emissions further, raise revenue and make transparent to drivers the marginal social cost of air pollution. There is obviously a big problem in estimating the optimal tax rate, but a further advantage of taxes is that they are relatively easier to change.
Figure 7.1 The optimal level of taxation
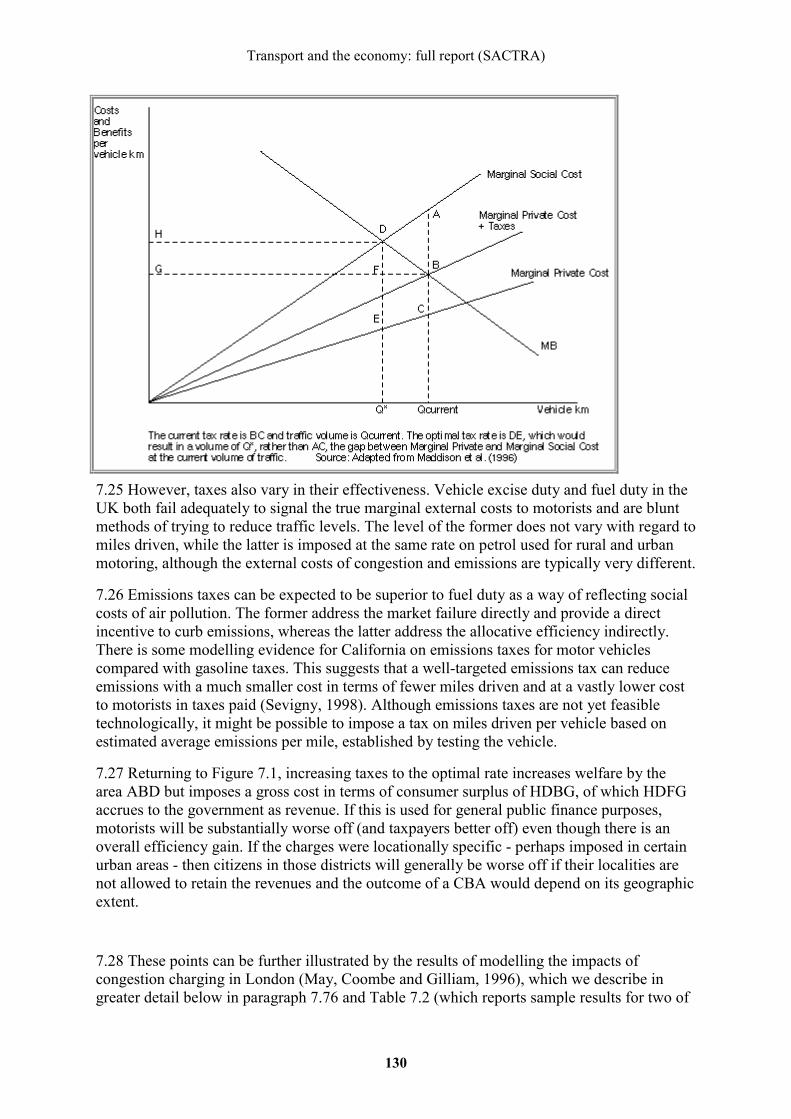
Transport and the economy: full report (SACTRA)
130
7.25 However, taxes also vary in their effectiveness. Vehicle excise duty and fuel duty in the UK both fail adequately to signal the true marginal external costs to motorists and are blunt methods of trying to reduce traffic levels. The level of the former does not vary with regard to miles driven, while the latter is imposed at the same rate on petrol used for rural and urban motoring, although the external costs of congestion and emissions are typically very different.
7.26 Emissions taxes can be expected to be superior to fuel duty as a way of reflecting social costs of air pollution. The former address the market failure directly and provide a direct incentive to curb emissions, whereas the latter address the allocative efficiency indirectly. There is some modelling evidence for California on emissions taxes for motor vehicles compared with gasoline taxes. This suggests that a well-targeted emissions tax can reduce emissions with a much smaller cost in terms of fewer miles driven and at a vastly lower cost to motorists in taxes paid (Sevigny, 1998). Although emissions taxes are not yet feasible technologically, it might be possible to impose a tax on miles driven per vehicle based on estimated average emissions per mile, established by testing the vehicle.
7.27 Returning to Figure 7.1, increasing taxes to the optimal rate increases welfare by the area ABD but imposes a gross cost in terms of consumer surplus of HDBG, of which HDFG accrues to the government as revenue. If this is used for general public finance purposes, motorists will be substantially worse off (and taxpayers better off) even though there is an overall efficiency gain. If the charges were locationally specific - perhaps imposed in certain urban areas - then citizens in those districts will generally be worse off if their localities are not allowed to retain the revenues and the outcome of a CBA would depend on its geographic extent.
7.28 These points can be further illustrated by the results of modelling the impacts of congestion charging in London (May, Coombe and Gilliam, 1996), which we describe in greater detail below in paragraph 7.76 and Table 7.2 (which reports sample results for two of

Transport and the economy: full report (SACTRA)
131
many schemes that the authors investigated). The model finds that money costs to travellers are raised considerably, against which there are partially offsetting gains for travellers in terms of enhanced reliability and time savings. For non-travellers, there are large gains, in particular on account of the very large revenue that the charges would produce. Traffic with marginal social costs in excess of marginal benefits would be considerably reduced and economic benefits would be obtained. The revenues are greatly in excess of the net benefits (especially with a higher charge) and it might be argued that London would lose from the imposition of the charges unless it were able to retain at least a substantial proportion of the revenues.
Table 7.2 Economic benefits of 1991 Inbound Cordon Charging for Central London (£m pa)Source: May, Coombe and Gilliam (1996)
£4 Charge £8 Charge
Car
Time 65.4 89.2
Reliability 19.5 26.1
Costs -114.9 -242.7
Total -30 -127.4
Public Transport
Time 13.8 20.9
Reliability 0.2 0.4
Costs 0 0
Total 14 21.3
Freight & Taxis
Time 74 99.1
Reliability 23 30.5
Costs -109.9 -217.9
Total -12.9 -88.3
Travellers Total -29 -194.5
Non-Travellers
Congestion Charge 246.6 437.1
Other -79.2 -109.5
Non-Travellers Total 167.4 327.6
Accidents 20.3 26.1

Transport and the economy: full report (SACTRA)
132
Net Economic Benefits 158.7 159.2
7.29 Another point is noteworthy in the context of Table 7.2. Almost all the net economic benefits are obtained with the lower charge. But at the higher charge, while traveller losses and revenue are both much higher, there is a substantially lower ratio of non-traveller revenue gains to net traveller losses, because the additional traveller gains (from faster and more reliable journeys) increase only a little compared with the money costs. As this comparison hints, pushing the charge up a great deal higher would reduce net economic benefits, as the costs to travellers exceed the gains to non-travellers. Setting congestion charges that are too high may continue to reduce traffic volumes, but is counterproductive. It should be noted that the analysis does not include environmental externalities which were treated separately.
7.30 We return later in this chapter to the question of precisely how revenue raised from restraint measures might be used, and to what effect. At this point, it is worth making one further broad but important observation, which is also linked to Figure 7.1 above.
7.31 An efficient allocation of resources would be attained where price equals marginal social cost. This would then provide a basis for assessing the optimal level of capacity of the road network. In general, when the congestion cost element of this charge is greater than the marginal social cost of additional road space, this would mean that congestion is a signal to invest in measures which increase the capacity of the network. Starting from a situation of a partly congested network, it is consistent with economic efficiency to be in favour of congestion charges but also to recognise the need to address congestion by appropriate investment in infrastructure and other transport measures. However, the specific transport improvements that would give the best return if external costs have been fully internalised are likely to be different in scale, mode and location from those which would be favoured in the situation where such costs are not included in transport prices. This is because the patterns of demand will themselves be different.
7.32 The discussion above has highlighted the difficulties in estimating external costs, the varying effectiveness of measures to internalise those costs, and the dangers in using traffic reduction measures which set taxes or charges too highly. This is not intended to suggest that a more efficient allocation of resources would not result from better targeted reduction measures. Far from it: there is a strong case for correcting market failures in road transport, given the likely size of external costs.
7.33 However, the discussion is intended to stress that welfare losses from choosing inappropriate reduction measures can be substantial. It is important, not only to avoid crude and unnecessarily costly measures, but also to recognise that traffic reduction and investment in measures which increase the capacity of the transport network can be consistent with economic efficiency. We recommend that all interventions intended to reduce traffic are subjected to cost benefit analysis. This proposal is considered in more detail in Chapter 10.
Double-Dividends and Economic Growth
7.34 The possible existence of revenues from optimal reduction measures raises the issue of whether a 'double-dividend' can be realised as is often claimed in the context of green tax reform. It is important to pay careful attention to what is meant by the term. Goulder (1995) contains an excellent overview of the literature and offers the following definitions. A 'weak double-dividend' is when gross costs of taxation in terms of individual welfare are lower if

Transport and the economy: full report (SACTRA)
133
the proceeds of the green tax (tE) are used to finance reductions of distortionary taxation ( tX) elsewhere in the economy rather than returned to consumers as a lump sum ( tL), ie,
C(tE , tX ) < C(tE , tL )
7.35 A 'strong double-dividend' is when the gross costs of the environmental tax are more than offset by reductions in the costs imposed on economic efficiency by distortionary taxes elsewhere in the economy, ie,
C(tE , tX ) < 0
7.36 A 'weak double-dividend' can certainly be expected if revenues are realised from traffic reduction measures and, as is always true in practice, government is currently raising revenue through the use of distortionary taxes, ie, taxes that cause prices to diverge from opportunity costs. This implies that the net loss to consumers of the additional environmental taxation imposed (as in paragraph 7.27 and Figure 7.1) is DFB if the revenue HDFG is returned as a lump sum but less than DFB if it is used for cuts in distortionary taxes.
7.37 A 'strong double-dividend' would be particularly attractive because it implies that there is no need to engage in the difficult business of measuring environmental costs when formulating reduction measures. This is due to the fact that consumers gain more than HDBG from the distortionary tax reductions that can be financed. Unfortunately, the empirical evidence is that, although possible, this outcome is unlikely (Goulder, 1995).
7.38 The most popular suggestion in the double-dividend literature is that green taxes can finance cuts in national insurance contributions (payroll taxes) or employment subsidies. For example, it has been claimed that recycling the revenues from a British carbon tax and fuel duty escalator in this way could create of the order of a million jobs without inflation through increases in the equilibrium level of employment (Barker, 1996). This result depends crucially on how the labour market is modelled and on the assumptions made on the incidence of the payroll tax. The balance of evidence suggests that, in the long run, this is entirely shifted onto wages and thus, in equilibrium, employment is invariant with regard to payroll taxes (Nickell, 1997); and that obtaining a long run double-dividend in this way is very doubtful.
7.39 A more promising possibility of reaping a double-dividend may come through lowering taxes on capital, especially if the distortionary effects are large relative to those from taxes on labour. If reduced capital taxation was financed by green taxes, there is a possibility that the long run growth rate could be increased, if it is endogenous.
7.40 SACTRA commissioned a careful review of the recent literature on taxation and growth (Myles, 1998). The review concluded that there is as yet no firm evidence to support this proposition and that the implications for growth of using revenue from optimal congestion charges to reduce direct taxes remain obscure.
7.41 Action to reduce traffic flows will improve the allocation of resources where the marginal benefit of traffic is less than marginal social cost. Measured GDP may be reduced because the money costs of transport to business have increased. This will generally be the case where action is taken to reduce air pollution, as has been confirmed in a variety of American studies, although the impact on green net national product (cf. paragraph 3.14) might be rather different. For example, Jorgensen and Wilcoxsen (1990) estimated that motor vehicle emissions controls had reduced the American growth rate by 0.05 percentage points during 1974-1985.
Transport and the economy: full report (SACTRA)
134
7.42 In the case of congestion charging, the implication for GDP is less clear because business gains from more reliable and faster journeys. Table 7.2 showed that, in the London congestion charging study, the impact on freight and taxis was finely balanced (although the demand for these modes was assumed to be insensitive to the charges). An econometric re-investigation of the Aschauer hypothesis based on the counties of California found no significant effect of the road infrastructure stock on GDP, but did find that reducing congestion on a given road network can in fact increase GDP (Boarnet, 1997). This indicates that peak hour time savings are valuable to employers and can be put to productive use.
7.43 The preceding argument very much focuses on levels effects on economic activity, but leaves open the question of growth rate effects. Current studies argue that fiscally neutral internalisation of transport costs would have negligible impacts on rates of growth (Bleijenberg, Velthuyzen and Oegema, 1990). It should be recognised, however, that these studies do not incorporate endogenous growth modelling assumptions that would allow for feedback effects working through induced innovation or investment. More generally, to over-rule the results of a static analysis, it would need to be shown that adjusting traffic to its optimal volume had adverse impacts on incentives to invest and innovate by leading to a negative growth rate effect. This seems unlikely with a well-designed tax reduction package.
7.44 This argument can be extended to consider impacts on competitiveness (ECMT, 1998). Consider the impact on business of policies to internalise transport costs imposed in a fiscally neutral manner, such that the revenue raised is offset by tax reductions. In general, business will find that charges for the use of transport increase while congestion costs and general taxation fall. Some industries or regions may lose, but the European Ministers' report concludes that it is unlikely that European competitiveness will be harmed (though see paragraphs 7.98-7.100 below on this point).
7.45 This appears to suggest that, where revenue raising forms of reduction are applied, policymakers should not worry too much if policy errs on the side of reduction that is excessive (ie, by pushing price above marginal social cost). This can be seen as a variation on the standard argument for raising tax revenue from final goods with inelastic demand as is the case with road travel, which we noted earlier in Chapter 3. However, this standard argument for relatively heavy taxation of consumer goods that are inelastic in demand is made without reference to its implications for long run growth.
7.46 To the best of our knowledge, this ramification has yet to be dealt with in the academic literature. When models of endogenous growth are considered, it seems that the design of an optimal structure of taxes to raise a given amount of revenue would need to trade-off the benefits of exploiting inelastic demand against any impact on the factors that cause growth, such as investment in physical and human capital, innovation etc. (Myles, 1998). We suspect that the standard argument for taxing final commodities with inelastic demand is probably valid with regard to road traffic, although it certainly would be desirable for economists to give more explicit consideration to its growth implications.
7.47 Nevertheless, insofar as improved transport provision is good for competitiveness and growth for the reasons outlined in Chapter 4, then a cumulative failure to invest will presumably have adverse implications, albeit not nearly so dramatic as claimed by Aschauer (1989). The claim that optimal reduction measures based on charges and taxes, and accompanied by other tax reductions, are unlikely to have adverse effects on growth should not be equated with a view that choking off traffic growth by merely ceasing to invest in expanding the road network is costless in terms of growth.

Transport and the economy: full report (SACTRA)
135
7.48 This points up a danger in introducing policies of road pricing. It has been suggested that optimal congestion charging in current circumstances might produce national revenues as high as £18bn per year, equal to about 6 per cent of total fiscal receipts (Smith, 1998). This might give governments a vested interest in sustaining these revenues (Roth, 1998) and lead both to a failure to finance infrastructure projects to alleviate congestion with high CBA*** scores and some adverse growth impacts.
7.49 In sum, it appears likely that a weak double-dividend is probably available where traffic reduction measures yield revenue. This could be used to offset adverse implications for growth. It is much less likely, though it is no more than conjecture in the present state of knowledge, that a strong double-dividend can be realised in the sense that revenues from traffic reduction measures could actually finance policy actions that would raise the growth rate. In any event, it should be recognised that any kind of double-dividend relies on using reduction measures such as charges and taxes that raise revenue rather than prohibitions or quantitative restrictions that do not.
Compensation
7.50 It is frequently argued that the implementation of reduction measures, especially those that raise revenue, will potentially create losers and will only be feasible and/or desirable if policy packages are designed in such a way as to ensure that there are few, if any, net losers (Goodwin, 1989 and Thomson, 1998). The issue of compensation has indeed loomed large in recent discussions of the internalisation of the external costs of transport (ECMT, 1998).
7.51 In circumstances where there is an overall welfare gain from traffic reduction, in principle, it will be possible to compensate any losers from the reduction measures while still leaving gainers at least somewhat better off. Indeed, a standard idea in welfare economics is that of a compensation test in which a policy is acceptable if, hypothetically, the gainers could fully compensate the losers and still come out ahead. This is effectively the question which is answered by CBA***.
7.52 Actual payment of compensation to losers would be required to achieve a Pareto improvement, ie, a situation where at least one person was better off as a result of the intervention and no-one was worse off. This is generally regarded as too demanding a criterion and would not generally be adopted in policymaking. It requires knowledge of the full incidence of costs and benefits and would be impossibly data demanding.
7.53 It would, however, be practical to use fiscal policy to achieve a less well-defined compensation to general classes of losers. It might be argued that this is desirable on grounds of equity if the distributional impacts are thought to be serious and unacceptable. A more pragmatic reason for seeking to compensate losers is that this will be necessary to overcome political opposition to reduction measures.
7.54 The evidence on the distributional implications of charges and taxes designed to reduce traffic is somewhat limited but it suggests that, on the whole, low income groups are unlikely to suffer any serious adverse effects and/or that implementing a policy package to protect these households is feasible. Most work has been done on the implications of fuel duties and it is generally agreed that across the income distribution as a whole higher petrol taxes raise no obvious distributional issues (Crawford and Smith, 1995).
7.55 Reducing vehicle excise duty while raising fuel duty offers one option to achieve a fiscally neutral change in the balance of road transport taxation, consistent with adjusting

Transport and the economy: full report (SACTRA)
136
taxes to address marginal external costs more directly and improve price signals to motorists. Analysis of the distributional effects of such a switch suggests that both rural and low income households would benefit (Skinner and Fergusson, 1998).
7.56 It is less clear what might be the distributional effects of road pricing. It seems unlikely that these would be serious for low income earners as a group but the appropriate level of charges to reflect marginal social costs could bear heavily on some low income commuters. The maximum number that could be affected in London has been estimated at about 300,000 (Skinner and Fergusson, 1998). However, the assessment of London congestion charging (May, Coombe and Travers, 1996) did identify some distributional impacts, though it was also noted that use of some of the revenues to improve public transport might leave relatively few losers among travellers as a whole.
7.57 There are other sensitive issues with regard to compensation that concern revenue recycling. These include the impact of reduction measures on motorists as whole and on particular localities. Here it may be important to distinguish between different types of externality: those which are essentially confined to costs felt among road transport users and those which impact more widely. Congestion costs belong to the former and air pollution to the latter category.
7.58 It might be argued that, as a matter of fairness and/or political expediency, revenue from congestion charges should be recycled to travellers and that, since these would generally be levied in well-defined urban areas, they should also be recycled locally to the travellers of each local charging authority. From the national perspective, provided the revenues are retained within the UK, this is essentially an equity issue. From the local perspective, it is an efficiency issue in that the leakage of the revenues out of the area will typically mean that the costs to its citizens exceed the benefits.
7.59 A proposal that would appear to meet both the above objectives is to hypothecate the revenue to be used either for transport purposes and/or for lump sum rebates to all drivers in the affected area (thereby still allowing the marginal cost of driving to increase, which would be necessary to bring about a reduction in traffic). The Government's recent consultation paper proposed that "local authorities which bring forward pilot road user charging schemes should be able to retain 100 per cent of the net revenue generated for at least 10 years from the implementation of a scheme - provided that there are worthwhile transport-related projects to be funded" (our emphasis: DETR, 1998, p. 16).
7.60 There clearly could be problems with this proposal. Critics have suggested that "Local authorities with state of the art public transport systems and shoddy schools could emerge. This is not sensible". (Tindale and Holtham, 1996). A further issue is that, in the case of urban congestion charging, which can be well-aimed at a particular area, it is fairly clear where revenues might be directed. However, in the case of motorway charging, it is far less clear where the revenues should be recycled, given the very wide spread of traffic affected by the policy.
7.61 More generally, the obvious point is that the revenue from charges may be subject to several competing claims and that the use to which the revenue is put will influence the net economic benefits from reduction measures. The more it is desired to compensate losers among travellers and/or low income groups, the less revenue will be available to offset any adverse growth effects through general reductions in distortionary taxation and the more likely it is there may be some adverse effects on either the level or the growth of GDP (unless
Transport and the economy: full report (SACTRA)
137
there are greater economic benefits from expenditure on the complementary measures which would not otherwise be affordable, as discussed below).
Measures to Reduce Traffic and their Economic Impact
7.62 The preceding sections of this chapter have identified some of the broad issues of importance relating to the economic impact of measures to reduce traffic. Cost benefit analysis will clearly be needed to establish more precisely the impacts of any particular measure.
7.63 In this section, we look more closely at the sort of specific economic impacts one might expect to arise from a range of measures explicitly aimed at reducing road traffic. The range considered is not exhaustive, but serves to illustrate the main issues of substance, while covering some of the options of current interest to policy makers:
• road user charges (eg urban congestion charging and motorway tolls);
• fiscal measures, such as changes in fuel duty and company car taxation reform;
• parking controls (eg through changes in the costs of parking or in the amount of space available);
• reallocation of road space (eg pedestrianisation and bus or/and lorry lanes); and
• land use changes.
7.64 It is important to underline that the precise balance of benefits and disbenefits, and the transitional impacts as users adjust to the new circumstances, will vary according to type of measure used, the context in which it operates and the way in which it is implemented. It is also worth noting that the analysis below concentrates very much on the possible economic impacts of measures and does not try to establish their relative merits as ways of reducing road traffic.
7.65 It is also important to note that we do not consider here the non-monetised and/or environmental impacts of traffic reduction measures. These impacts may actually be very important in justifying such measures.
7.66 We begin by considering the main types of monetised costs and benefits arising from measures to reduce traffic. These are the focus of conventional transport cost benefit analysis and - as we have seen earlier in the report - are taken to represent the total impact of a measure on the economy, although there may be instances where this assumption will misrepresent the total economic impacts. We then go on to consider issues concerning the incidence of costs and benefits, by place, socio-economic group and economic sector. Finally, we look at some of the broader economic implications of measures taken to cut traffic.
7.67 In considering the economic impacts of measures, it is worth noting the relative lack of empirical analysis of reduction measures in the UK. This is partly due to the recent appearance of such measures, although an extensive review of the literature for the DETR revealed little evidence concerning the economic impact of parking policies, which have been in use for many years (MVA and David Simmonds Consultancy, 1998). However, we have been able to draw upon some empirical work, for example, on the effects of pedestrianisation, on modelling exercises on the effects of various economic instruments, such as congestion charging and on analysis based on existing data about, for example, household incomes and travel patterns.

Transport and the economy: full report (SACTRA)
138
Monetised impacts
7.68 Road users who continue to travel by road after the imposition of traffic reduction measures would receive benefits arising from reduced congestion, such as quicker journeys and increased reliability. Continuing users could also receive either benefits or disbenefits in terms of changed vehicle operating costs arising from different traffic patterns.
7.69 Where road space has been re-allocated, the benefits to continuing users would accrue to those users who are given higher priority (for example, buses, taxis and goods vehicles). Such benefits might also include increased protection (and so fewer accidents) and increased amenity for more 'vulnerable' users, such as cyclists and pedestrians, where they are given a higher priority.
7.70 In addition, where congestion charging is used, some users who benefit from reduced congestion may not actually pay a charge where it is decided to exempt certain categories of user. Similarly, in the case of parking controls, only some of the beneficiaries have to pay a charge given that the controls only bear on those travellers terminating in the controlled area and do not bear upon those passing right through the controlled zone.
7.71 Where measures to reduce traffic encourage a transfer to public transport, this could lead either to increased revenues to operators or to operators providing more frequent public transport services and/or lower public transport fares. As a consequence, either the operators or continuing users of public transport (or to some extent both) would benefit.
7.72 Charging authorities, in the case of congestion charging or motorway tolls, would also benefit to the extent that their revenues (from both charges and penalties for infringement) exceed the costs of operation, maintenance and enforcement. Car park operators may also suffer either disbenefits or benefits from parking controls to the extent that they experience either reduced revenue which cannot be matched by reduced costs or increases in revenues without disproportionate increases in costs.
7.73 Those road users who are restrained from travelling as they wish would incur a disbenefit. This would apply equally to those who are discouraged from travelling either through increased costs (through the imposition, say, of road user charges or higher taxes) and or through other forms of control (such as parking restrictions or assigning a higher priority to other road users). It would also apply to continuing users who re-route from using charged roads to those which are free at the point of use (as might happen, say, in the case of motorway tolls).
7.74 Some users who continue to travel will also suffer disbenefits. Where congestion charging or motorway tolls are implemented (or, to a lesser extent, where fuel duties are increased), disbenefits will take the form of charges (or higher duties) which users have to pay to the extent that their benefits from the resulting relief of congestion may be outweighed. In the case of parking controls, some may also experience disbenefits in the form of increased time spent searching for an acceptable space and also possibly increased time spent walking to their final destination.
7.75 Where traffic diverts from charged routes to routes free at the point of use (eg, motorway tolling, but also potentially in the case of congestion charging) or away from routes where there has been a reallocation of priority between users, continuing users on the alternative routes could receive disbenefits due to extra congestion.

Transport and the economy: full report (SACTRA)
139
7.76 Modelling carried out for the Government Office for London to establish the impacts of congestion charging in London (May, Coombe and Gilliam, 1996) examined the potential incidence of monetised impacts. The study considered various possible charging structures, ranging from a daytime inbound cordon charge for entering Central London (known as Structure A) through to more complex bi-directional charging across three cordons, including the use of screenlines within cordons (known as Structure W). For each structure, the effects of different levels of charge were considered, as were the effects of complementary measures (such as improving alternative modes to private motoring).
7.77 The general conclusion was that while both commercial vehicles and continuing car-users would obtain benefits through reduced travel times and improved reliability, travellers would suffer net disbenefits as the payment of congestion charges would offset the benefits of reduced congestion. Nevertheless, there would be overall net economic benefits due to the generation of significant amounts of revenue. In addition, the following points were noted:
• The size of the economic benefits was dependent on the nature of the charging structure implemented; Structure W generated benefits three times larger than Structure A (which covered a smaller area of London).
• The most complex charging structure (Structure W) generated much smaller disbenefits to travellers in relation to economic benefits. The use of bi-directional charging (rather than simply inbound charging) and screenlines within cordons were particularly important in generating higher benefits and smaller traveller benefits.
• All charging structures exhibited a lower increase in benefits from charge increases beyond the medium charge level, and in some cases, the benefits fell at the highest charge levels.
7.78 There was little evidence of synergy where congestion charging was implemented in conjunction with complementary strategies. However, the benefits of the combination of measures were higher than for congestion charging alone and there was some evidence that benefits could be achieved at lower levels of charge. In particular, there was evidence that complementary measures which involved public transport improvements were able more than to offset the net traveller disbenefits of congestion charging.
7.79 Other modelling work by MVA (MVA 1997 and 1998) examined the impacts of parking controls in Bristol. The modelling considered three scenarios - a do-minimum, a do-something and a do-maximum strategy - with the latter including radical control measures, some of which would require new legislation. The do-something strategy was tested both in isolation and together with capacity-reducing complementary measures, aimed mainly at deterring through traffic in the Central Area and providing extra protection from congestion for buses.
7.80 The general conclusion was that the controls tested would achieve worthwhile reductions in traffic levels, with benefits to travellers in the form of reduced congestion and benefits for the local and global environments, but in a way which was poor value for money in economic terms. Packages of parking controls and complementary measures would result in an overall disbenefit to society, mainly due to the extra time spent by drivers searching for a parking space and the extra charges they would have to pay, with only a modest increase in net parking revenues (insufficient to offset the disbenefits). The more severe packages of control would result in a much larger disbenefit to society, due to longer search times and increased parking charges, together with substantial losses in overall parking revenue.

Transport and the economy: full report (SACTRA)
140
7.81 Another study is currently being finalised for the Department of Environment, Transport and the Regions into the effect of different parking policies implemented by local authorities (W S Atkins, 1995/6). Data gathered in Stage 1 of the study suggested that there was no direct causal link between whether an authority operated a permissive or a restrictive parking policy, and the economic performance of the area. Local perceptions of such a link sometimes prompted relaxations of parking controls, in the belief that this would help the local economy: but no evidence was found that this was the case.
7.82 A further study commissioned in 1995 by the Department of Transport modelled the transport effects of different land use patterns in and around Bristol (Simmonds and Coombe, 1997). This examined the effects of so-called 'Compact City' scenarios, which were mainly variations on a central theme where forecast increases in population and employment in the Bristol area as a whole were contained within the city itself. The authors noted that a review of other studies generally estimated the impact of 'Compact City' policies on traffic or on transport-related atmospheric emissions to be in the range of 2 -12% reduction.
7.83 The modelling showed that the total costs to transport users would be less under the core 'Compact City' scenario compared with trend. In some scenarios, further savings would be produced, but others would create greater costs for users. It was noted that the changes in costs would not be evenly distributed between travellers and some travellers might be worse off, even in a scenario where total costs fall.
Distributional impacts
7.84 The London congestion charging study indicates that the overall impacts on travellers can mask significant differences of impact between and within income groups. The modelling suggested that while there may be net benefits for some groups for different levels of charge for Structure A, within any group there were likely to be both gainers and losers. At the highest charge for Structure A, for example, only travellers from low income households would experience a small benefit (May, Coombe and Gilliam, 1996, p 26). The more complex Structure W, while adding to the disbenefits to high income travellers, would introduce modest benefits for medium and low income travellers (ibid, p 28). The modelling also suggested that different charging structures would lead to changes in the composition by income group of households in London, although the overall changes in the level and distribution of population were likely to be very small (ibid, p 30).
7.85 Particular attention has been paid to the potential distributional impacts of policies on fuel duty. Skinner and Fergusson (p 17-18, 1998), in a report for the Institute for Public Policy Research, draw upon data from the Office for National Statistics and the National Travel Survey to consider the possible impacts of a revenue neutral reduction in vehicle excise duty (VED) offset by an increase in fuel duties.
7.86 They suggest that lower income car owners would be relatively better off if the burden of motoring taxation shifted from ownership to use, since these owners spend proportionately less on fuel than VED than richer owners, who tend to drive further. However, Skinner and Fergusson add that, because car journeys made by low income households are likely, in their view, to be 'more important' than those made by richer ones (to ensure that their limited resources are spent as efficiently as possible), lower income households may be adversely affected at the margin, even though on the whole they would be better off.
7.87 The ECMT report (p118-119, 1998), drawing on data from the Netherlands, would appear to support the Skinner and Fergusson approach, noting that fuel charges have less
Transport and the economy: full report (SACTRA)
141
impact (in terms of percentage of net income) on low income groups than middle or high income groups. It also notes by contrast that charges per car-kilometre would affect low and middle income groups more than households with higher incomes.
7.88 Analysis has also been carried out, again by Fergusson and Skinner for Transport 2000 (1998), to establish the possible distributional impacts of changes to the pre-1999 Budget structure of company car taxation. Their research suggested that removing tax discounts for higher business mileages and including incentives to reduce private mileage could cut the equivalent of 2.4% of all UK car traffic.
7.89 Focusing on the effects of introducing tax discounts for lower private mileage, Fergusson and Skinner conclude that the vast majority of standard rate taxpayers would experience quite modest changes of up to plus or minus £250 per annum. The biggest winners would be higher rate taxpayers doing low business and low private mileage. The biggest losers would be very high private and business mileage drivers, accounting for 2% of all company car drivers and less than 2,000 of which would come from the poorest 40% of households. In their report for the IPPR, Skinner and Fergusson also note that commuters from low income groups are less likely to use parking spaces provided by employers, and so potentially would be less adversely affected from controls on such parking provision.
Locational impacts
7.90 The effects of traffic reduction measures on different areas have also been addressed by some of the analysis which we have examined. The relative impact of fuel duty policies on rural and urban areas has been an issue of particular contention. Boardman (1998) argued that increases in the price of petrol impact more on the rural poor than the urban poor who at least have the option of more realistic public transport alternatives to the car. She also points out the average rural household spends more on car travel than a non-rural household on the same income, since more rural households own a car and spend weekly on average 10% more than other households on fuel.
7.91 However, Skinner and Fergusson, in their report for the IPPR (1998), argue that the adverse impact on rural communities can be overstated. They note that drivers in rural areas make slightly fewer trips than average, but that they cover significantly higher mileages than their non-rural counterparts (17% higher on average and 22% for low income groups). On average, a shift of the tax burden from ownership to use (equivalent to reducing VED by £50 or abolishing it all together) would indeed leave the average rural car owner relatively worse off. However, low income car owners in all areas would benefit (though not by as much in rural areas as elsewhere), with only the richer rural households as losers in absolute terms.
7.92 Skinner and Fergusson also note that residents and commuters in rural areas should remain less affected than others by the implementation of road pricing in London and other conurbations. However, the analysis of congestion charging in London indicated that the various charging structures could have different impacts on different parts of the capital. While there is evidence to suggest that the resulting employment and population changes in London would be very small, the authors conclude that congestion charging would be likely to strengthen Central London, while reducing employment within Inner London (May, Coombe and Travers, 1996). The authors also note that with charging Structure A, radial route improvements would be to some extent offset by traffic increases on orbital roads in Inner London (though the use of screenlines in more complex charging structures can mitigate this) (1996, p 28).
Transport and the economy: full report (SACTRA)
142
7.93 The problem of traffic diversion appears to be particularly acute in the case of motorway tolling. Studies on inter-urban road charging (MVA, 1993) indicate that motorway tolls would result in diversion off the motorways, leading to more congestion, more accidents and a worse environment on alternative routes. While the net revenues generated by tolls might mean that tolling schemes could yield a net benefit to society as a whole, recycling revenues into the affected areas might in practice prove difficult.
7.94 The ECMT flag up the concern that higher user charges could penalise the economic development of peripheral regions, given their distance from markets compared with core regions. However, the ECMT also note that lower transport costs could actually strengthen core regions rather than peripheral ones (for example, by allowing the former to exploit scale economies), reflecting the discussion earlier in this report in Chapter 4. This underlines the need to understand the particular circumstances of regional economies first before being able to judge the likely impact on them of changes in transport costs.
7.95 There also exists some empirical evidence on the effect of pedestrianisation and traffic-calming schemes. Comparing indicators of town centre commercial activity before, during and after imposition of substantial traffic restraint town centres in Germany and the UK, Hass-Klau (1993) reached the following conclusions:
• A well designed pedestrianisation scheme results in a substantial increase in the number of pedestrians visiting the pedestrianised area (20-40% in the first year is not uncommon).
• There is not usually an immediate large increase in trade, and there may even be a small drop which can last for about a year, depending on the circumstances and after accounting for the economic cycle. After the transitional period, retail turnovers may be expected to increase, showing growths which are greater than those seen previously, and greater than those in other shopping centres which have not been similarly developed.
• Not all of the increased financial benefits go the retailers. Profits can increase, but by less than the increase in turnover. This may be because some increased revenue is absorbed in higher rental values that typically result from pedestrianisation; and some of the increased revenue is allocated to the costs of improving the town centre and providing better public transport to it.
• Retailers virtually never campaign for the abandonment of a scheme once it has come into operation and are often the main people to voice a desire to extend its boundaries or period of operation.
7.96 Carley with Donaldsons (1997) carried out a literature review on retailing and transport measures. The findings on pedestrianisation and retailing mostly show similarly positive local economic impacts to those of Hass-Klau, although it is noted that the verdict in a more recent study is more mixed, suggesting "the average economic impact may be one of neutrality when set against national rental performance before and after pedestrianisation".
7.97 One caveat which should perhaps be made about these studies is that we are not aware of any study, or indeed claim, that the benefits to the treated area are necessarily net benefits to the economy as a whole. In fact, most discussions either ignore this issue entirely (treating a benefit to the treated area as sufficient justification on its own), or are explicitly based on an intention to capture a proportion of tourist or shopping trade from a neighbouring competitor.
Impacts on competitiveness and sectors
7.98 The London congestion charging study (May, Coombe and Travers, 1996) concludes that, with possibly some specific exemptions, the impacts of charging on businesses would be
Transport and the economy: full report (SACTRA)
143
unlikely to be sufficiently severe, alone, to cause firms to cease to be viable. However, it notes that the impact might be enough to tip the balance in some cases between marginal viability and inviability. The exemptions might include transport-intensive businesses who do not have the ability to pass on costs or make offsetting productivity gains.
7.99 The ECMT report reached a similar conclusion with regard to transport-intensive companies (1998, p 115). The report argues that, for Europe as a whole, the external costs of transport need to be internalised through a combination of higher user charges, lower fixed taxes (at least for many countries) and lower rates of general taxation. It suggested that, over the medium term, internalisation would cut traffic levels by 10-15% against current trends, as annual growth rates were halved for ten years before returning to trend (ECMT, 1998, p. 114).
7.100 Under these assumptions, argued the ECMT, the net effect on the commercial sector could be expected to be positive, as the user charges would be "fully compensated" by lower taxes. In addition, although end-use transport prices might rise by about 20-30%, transport costs are said to make up only a small proportion of total production costs and companies would probably adapt their logistics operations.
7.101 It is worth noting that the ECMT assumptions about the level and composition of both transport taxation and general taxation across Europe mask considerable variation between member states. In addition to the likelihood that there would be winners and losers among economic sectors (European and national), it is not clear that higher user charges would be fully offset by reductions elsewhere in all countries.
7.102 Empirical work carried out by McKinnon and Woodburn (1996) provides additional insights into the possible effects on firms of increases in freight transport costs. In a survey of 88 large British-based manufacturers, firms were asked how they might respond to a sharp increase (50%) in road freight costs. Just over half of the manufacturers envisaged modifying their logistical operations in some way. Almost 40%, however, believed that they would have to pass on the transport increases to customers in higher prices.
7.103 The proportion of firms who claimed they would react in this way did not vary significantly in relation to the proportion of sales revenue spent on transport. Roughly 20% of the firms reckoned they would be able to recover the full cost of the increase in higher prices, and most would thus have to absorb some or all of it at the expense of profit margins. This might have adverse effects on investment and competitiveness.
7.104 Where firms varied in transport intensity (expressed in terms of transport costs as a proportion of sales revenue), there were differing responses. Of those for whom transport costs represented less than 4% of sales revenue, 17% said a 50% cost increase would be of little consequence. However, of those whose transport operations absorbed 10% or more of revenue, one in twelve suggested that they might go out of business as a result of the cost increase.
Macro-economic impacts
7.105 ECMT (1998) also conclude (on the basis of work done by the Dutch Government and the OECD) that the macro-economic impact of internalisation policies in general (rather than just those seeking to reduce traffic, and assuming some form of compensation) is likely to be very small. The impact on GDP growth may be slightly negative or slightly positive while the impact on employment is most likely to be positive. These changes might again mask
Transport and the economy: full report (SACTRA)
144
significant changes, for example, in consumption patterns, as households shift expenditure away from transport to other goods and services.
7.106 Barker and Kohler (1998) have modelled the macro-economic impact of charges introduced over the period 2001-2010 and based on the quantity of freight carried by heavy goods vehicles throughout the EU, measured in tonne-kilometres. The scale of the charges was calculated to cover ECMT estimates of the future average external costs of road freight (excluding congestion), while the charge revenues were assumed to be recycled via reductions in employers' contribution to social security.
7.107 The modelling indicated, against a baseline without the extra road charges, slight increases in GDP and employment by 2010 (0.3% and 0.5% respectively). Industrial output increased 0.21% above the baseline, with the biggest increases in output of textiles and clothing, general manufactures and distribution. The only sectors showing a decline in output are inland transport, agriculture, and coal and coke. Agriculture actually also shows the largest increase in employment, with other large increases in the labour-intensive and construction sectors.
7.108 Distribution of income is only slightly changed by the introduction of the charges with recycling. Each socio-economic group distinguished in the model enjoys an increase in real personal disposable income compared to baseline. It is perhaps also worth noting that the changes in GDP against baseline differ according to country, with the UK benefiting from a larger than average increase.
7.109 Several caveats about the Barker and Kohler results should be noted. The authors acknowledge major uncertainty regarding the estimates of some of the externalities for which the charge is made and assume that infrastructure costs are external (which could be debatable at least in the UK). The GDP results are sensitive to assumptions about the modal shift which might take place as a result of the charge and no allowance appears to have been made for any efficiency improvements in freight operations which might be stimulated. The claim that the UK has lower vehicle fuel duties than many countries in the EU also seems highly questionable.
7.110 In modelling the possible impacts of congestion charging in London, (May, Coombe and Travers, 1996) note that the estimates of charge revenues (between £150 million and £1 billion per year in 1991) equate to between 0.2% and less than 1.5% of London's GDP in that year. While a proportion of the revenue raised through charges could add to the costs of doing business in London, there would also be benefits through reduced congestion, improved journey time reliability and an enhanced environment.
7.111 The implication of the study is that the effect of charges would be small, particularly compared with the growth in the London economy in the preceding decade. The modelling of possible employment impacts also suggests that congestion charging would have only very small effects. However, the report stresses that the impacts would be very different depending on how and where the revenues from charging were spent.
Implications for Appraisal
7.112 We have now considered the circumstances in which, theoretically, it would be sensible to reduce traffic as a way of correcting market failure. We have identified the sorts of impacts one might expect to arise when implementing some of the potential measures to
Transport and the economy: full report (SACTRA)
145
reduce traffic. However, robust cost-benefit analysis of restraint measures is vital to ensure that the circumstances are right for there to be a welfare gain.
7.113 The fundamental point of importance here is that in considering whether to adopt measures to reduce traffic, the net benefits of any action must exceed the costs for there to be a gain in economic welfare. It is not sufficient simply for there to be benefits; the benefits must not only exceed the disbenefits, but also the resulting net benefit must exceed the costs for there to be any gain in welfare. Any measure under consideration must clearly be assessed therefore in terms of its potential effectiveness and administration costs. This should require a number of things to be done.
7.114 First, it needs to be established clearly that cutting traffic compares well with other potential action to reduce the external costs of road transport. Traffic reduction is not an end in its own right, but potentially one of several means to achieve the aim of aligning marginal social cost with marginal benefit. In the case of air pollution caused by road transport, for example, fiscal incentives to use cleaner fuels may be a better way of reducing those costs than trying specifically to cut road traffic, for practical or political reasons. However, in other cases - for example, where there is severance - traffic reduction is likely to be the most practical proxy for internalising external costs.
7.115 Where traffic reduction is identified as a cost-effective option, we have already indicated that some measures are blunter than others in addressing the external costs of road transport. Measures can also be taken nationally (eg, fuel duty), and/or locally (eg, congestion charging), and/or in combination (eg, user charges with additional spending on public transport). Appraisal should, of course, seek to compare different options and to take account of the combined effects of such measures, where that is appropriate.
7.116 Second, where traffic reduction does make sense, it is also critical to establish how far traffic should be cut. From earlier sections, it is clear in principle that there will be a point beyond which reducing traffic levels will harm economic welfare - that is, when marginal social costs begin to exceed marginal benefit.
7.117 However, in practice, it will be extremely difficult to identify the optimum volume of traffic (given the problems in quantifying the external costs of road transport highlighted earlier) and thus the degree to which measures should be implemented to achieve that volume. There is, of course, a danger of the perfect being the enemy of the good, but at the very least there seems to be a case for establishing official estimates of external costs, as we have already recommended in paragraph 7.21.
7.118 Targets for traffic reduction do have the merit, even where expressed as aspirations, in focusing discussion about potential scenarios and measures to achieve policy goals. However, in the absence of generally accepted estimates of the external costs of road transport, there is a danger that arbitrary targets for traffic reduction will be adopted and so of pursuing economically suboptimal policies. We recommend that, where road traffic reduction targets are used, they should be reviewed regularly, subjected to CBA and pursued through the use of instruments which can be adapted according to circumstances.
7.119 Third, any measure to cut traffic, as with other transport interventions, will create winners and losers, and different measures will lead to different profiles of winners and losers. Policy makers need to understand the distributional consequences of proposals on different sectors (eg, between different industries or between producers and consumers), socio-economic groups and regions or localities. The question of how far action might be
Transport and the economy: full report (SACTRA)
146
taken to compensate losers is also an important one which we addressed earlier in this chapter.
7.120 Conventional CBA obviates the need to investigate the detailed impact of transport schemes by taking the transport benefits as an estimate of economic benefits. Although, as was established in Chapter 3 and Chapter 4, this is not strictly valid under conditions of imperfect competition, it will often be an acceptable approximation, except where distributional weighting is desired.
7.121 In the case of infrastructure schemes, the financing costs are typically opaque to the individual taxpayer and the distributional issues arise both from identifying likely losers, both local and elsewhere, and the relative size of benefits to different groups of gainers. In the case of restraint measures, there are likely to be both gainers and losers to whom the costs are readily apparent. We recommend the use of appraisal to identify winners and losers for schemes, whether to reduce traffic or to increase capacity, and that the Department takes appropriate steps to promote this.
7.122 There may be wider economic effects arising from traffic reduction measures than the direct impacts on transport users conventionally measured by transport CBA. This discussion can usefully be related to the three by three matrix of Table 4.2. If prices are set correctly to reflect long run MSC and optimal capacity has been achieved, with no externalities, we are on the middle row of the matrix and a CBA will give the correct evaluation.
7.123 However, in cell 6 of the matrix, reduction is excessive, while in cell 2 congestion and/or adverse externalities would mean that user charges are too low and a CBA without monetised environmental costs will tend to exaggerate the true value of the project. Incorrect user charges are associated with misleading signals with regard to capacity in the top and bottom rows. In principle, therefore, as with measures to increase capacity, it would be appropriate to appraise traffic reduction measures by using CBA***, to allow both for externalities and complications arising from imperfect competition and imperfect labour markets. In practice, however, as we explore in Chapter 8, the best we are likely to be able to do in the foreseeable future is to conduct an improved version of CBA, with the environmental externalities handled separately.
7.124 Finally, some traffic reduction measures (eg, user charges) will generate revenue which can be used to offset disbenefits. Nationally, this might occur through reducing general taxation or payroll costs; locally, options might include increasing non-transport expenditure (for example, on education) or reducing local taxes (for example, council charges). We have already identified that different effects can be expected from different forms of recycling or compensation. Ensuring that the revenue is used to best effect will entail some comparison of the impacts of these different options. Where the options include transport projects, the approach to appraisal which we set out in Chapter 10 should be applied, as with any other transport project. However, we have not considered the appraisal of more general policies such as reducing taxation. We recommend that appraisal should assess the impacts of recycling revenues raised by traffic reduction measures.
Conclusions
7.125 The external costs arising from road transport provide a rationale for traffic reduction, insofar as this arises from the alignment of marginal benefit with marginal social cost. However, quantification of the external costs of road transport is very difficult and it would

Transport and the economy: full report (SACTRA)
147
be infeasible to implement full social cost pricing because estimates of the relevant social costs are imprecise.
7.126 Nevertheless, a more efficient allocation of resources might result from well-targeted reduction measures. There is a strong case for correcting market failure since marginal social costs appear to exceed marginal benefit on many journeys.
7.127 In deciding whether to pursue road traffic reduction, robust cost-benefit analysis needs to be carried out to establish that the circumstances are right for a welfare gain to ensue. It is essential that the net benefits of any action exceed the costs for there to be a gain in economic welfare.
7.128 As with measures to increase capacity on the transport network, traffic reduction measures ideally should be appraised using CBA*** to account for any potentially wider economic impacts which might arise due to market imperfections. In practice, the best that may be possible certainly in the short run is to use improved cost-benefit analysis. This is considered further in Chapter 10.
7.129 Economic theory suggests that some measures are better than others at internalising the external costs of road transport. For example, economic instruments such as charges or taxes are likely to be superior to regulatory measures, as they would minimise the costs of achieving a given reduction in emissions and provide incentives to find ways of reducing emissions further. The use of pricing measures also has the advantage that it raises revenue and minimises the loss of consumer surplus for a given volume reduction.
7.130 While there is a strong case for correcting market failures in road transport, given the likely size of external costs, it is important to avoid crude and unnecessarily costly measures. Setting congestion charges too high, for example, may continue to reduce traffic volumes but is economically counterproductive. Where it is appropriate to adopt traffic reduction targets, these should be implemented where possible through flexible instruments and reviewed regularly.
7.131 While reducing the costs of congestion can benefit the economy as measured by GDP, there is a danger that internalising the environmental costs of road transport can reduce measured GDP. The empirical evidence suggests that a strong double dividend, while possible, is unlikely, although a weak double-dividend may be available with price-based traffic reduction measures.
7.132 It is quite possible that economic efficiency will be enhanced, both by measures to reduce road traffic, and also by further investment in the transport network to alleviate congestion. The pattern of investment may differ from historical trends of investment, given user responses to traffic reduction measures.
7.133 The evidence on the distributional implications of charges and taxes to reduce traffic is somewhat limited, but it suggests that, on the whole, low income groups are unlikely to suffer serious adverse effects, provided that a well-designed package of measures is introduced. Nevertheless, there will be winners and losers among road users and different sectors of the economy.
7.134 Politically, there is often considerable pressure to compensate losers. The more it is desired to compensate losers among road users and/or low income groups, the less revenue will be available to offset any adverse economic growth effect, through general tax reductions.

Transport and the economy: full report (SACTRA)
148
7.135 Appraisal of traffic reduction measures (as with measures to increase capacity) needs to identify the winners and losers arising from such measures. Consideration also needs to be given to the appraisal of the impacts of different forms of compensation.
7.136 It is worth noting the relative lack of empirical analysis of traffic reduction measures in the UK. We recommend that the Department consider identifying opportunities for monitoring the impacts of a large-scale traffic reduction measure which is due to be implemented in a relatively short period of time, and that it commissions research accordingly.

Transport and the economy: full report (SACTRA)
149
Chapter 8 - Implications For Appraisal
Introduction
8.01 In simple terms, we see the problem put to us in our remit as: what is the relationship between transport and the economy, and what are the implications of that relationship for appraisal? The key point is that measures which either increase or decrease the supply of transport may affect the level of economic activity, and, conversely, the level of economic activity will govern the amount of traffic which occurs, subject to supply constraints and policy levers designed to decouple the relationship. In our view, it is crucial to remember the two-way nature of the relationship between transport and the economy when considering questions of appraisal practice.
8.02 We inject here a reminder of what we mean by 'increases or decreases in transport supply'. The most literal interpretation is the physical one - either road capacity, for example, is increased or decreased, either by traffic management measures, or by changes in the amount of infrastructure available for traffic. But, in appraisal terms, 'increases in transport supply' may also be equivalent to reductions in transport costs, while the converse, 'decreases in transport supply' may be equivalent to increases in costs.
8.03 In more specific terms, that part of our remit concerned with appraisal can be summarised by the following questions.
• Does conventional cost benefit analysis omit significant elements of the relationship between changes in transport supply and growth in GDP?
• If so, is it practicable to modify current conventional cost benefit analysis practice so as to include these missing elements, or provide a supplementary measure?
• How should the economic impacts of traffic reduction measures be appraised?
• How might the regeneration impacts of individual road schemes be captured in appraisal?
8.04 In Chapter 3, we have explained how, on the assumption of perfect competition in the transport-using sectors of the economy, a correctly specified and executed benefit estimation will capture the effects on the economy.
8.05 We also noted in Chapter 3 that there are differences between 'the economy' as expressed in GDP (which measures transactions in markets) and a wider view of economic welfare which includes activities not necessarily traded in a market. This has an effect on the distinction between 'productive' and 'non-productive' travel. Some journeys, such as goods transport and travel on employers' business, fit clearly into both definitions, but others, such as leisure journeys, can produce economic welfare for the individual without a product or a transaction. We came to the view that there is a spectrum of more and less obviously productive journeys, but with no clear dividing line, and considerable difficulties in actually being able to say how productive any particular journey might be. Nevertheless, business travel is clearly more directly related to the productive process and therefore our recommendations concentrate on improvements to its treatment in appraisal, as will become clearer in Chapter 10 (in paragraph 10.38 for business travel, and in paragraph 10.47 for freight).

Transport and the economy: full report (SACTRA)
150
8.06 In Chapter 4 and Chapter 5, we have explained how the supply of transport affects economic activity. These chapters lead to some important conclusions, including that: (a) under conditions of imperfect competition in the transport-using sectors, even otherwise correctly specified and calculated benefits/disbenefits may either over-estimate or under-estimate the true effects on the economy; and (b) target areas may either gain or lose from a transport investment depending on the nature of the markets affected.
8.07 In Chapter 6, we describe various influences on traffic - that is, the reverse of the focus of Chapter 4 and Chapter 5. A key implication from Chapter 6 is that we need to understand properly all the influences on the demand for transport and for road traffic in particular, so that we can correctly specify our appraisal process.
8.08 In Chapter 7, we argue that reducing traffic may increase economic welfare, and in this sense improve the overall performance of the economy, in certain circumstances (where prices are below marginal social costs). In addition, some of the increases in welfare accrue to travel which is productive in the narrower sense of being a component of GDP. A key implication from this section is that we need to be able to identify the circumstances when traffic reduction would be beneficial, which leads to the need for cost benefit analysis of traffic reduction measures.
8.09 In this present chapter, we bring all these various strands together. We started by considering the appraisal of the effects on the economy arising from changes in the transport system, as this lies at the heart of our brief. However, we came to two important conclusions which shaped our recommendations quite strongly.
• Models for appraising the wider impacts on the economy, both in total at a national level and in terms of the distribution of the impacts between localities, involve many difficult questions, the answers to all of which are not obvious or capable of resolution in the foreseeable future through research and development, although some important and potentially useful relationships and linkages have been identified.
• At this stage, the evidence available to us suggests that a fully-specified and properly executed cost benefit analysis, of the kind traditionally undertaken for transport projects, will often provide a sufficiently good approximation for the size of the total economic impacts, under the conditions we set out in this chapter.
8.10 As we have progressed through this inquiry, an increasingly central question for us became: what constitutes a fully-specified and properly executed conventional transport cost benefit analysis? The considerations here are both theoretical and practical in nature and, inevitably, we found the need to compromise between the two. Thus, many of our recommendations relate to changes which we would like to see made in conventional cost benefit analysis so that these analyses then become better proxies for the appraisal of the wider or total economic impacts.
8.11 However, this focus to our recommendations does not mean that all an appraiser needs to do is undertake a transport cost benefit analysis of the conventional kind, and that all attempts to estimate the wider impacts on the economy can be abandoned. As will be explained below, the wider impacts should be considered for two reasons:
• because there will be cases when a conventional transport cost benefit analysis may be seriously in error; and

Transport and the economy: full report (SACTRA)
151
• because it will be necessary to examine the changes in the distribution of economic activity, especially in terms of changes in employment, even if the total can be reasonably estimated by the conventional transport cost benefit analysis.
8.12 We also consider the implications of the issues raised in Chapter 6 by making the distinction between income effects and price effects. And finally, we go on to consider the special case of cost benefit analysis of traffic reduction measures recommended in Chapter 7, as this is needed to determine when traffic reduction could have a beneficial effect on the economy and when it could be harmful.
The Context For Our Considerations
8.13 In A New Deal for Transport (DETR, 1998a), the DETR has set out its five main criteria for transport. Couched as objectives, these are:
• environmental impact - to protect the built and natural environment;
• safety - to promote safety;
• economy - to support sustainable economic activity and get good value for money;
• accessibility - to improve access to facilities for those without a car and to reduce severance; and
• integration - to ensure that all decisions are taken in the context of the Government's integrated transport policy.
8.14 We note that our remit concerns the first of these objectives. We note also that, while these objectives are central to the appraisal of transport interventions, they may, in practice, be supported by analyses of other issues, such as:
• distribution and equity;
• affordability and financial sustainability; and
• practicality and acceptability.
8.15 Note that, in terms of these objectives, a 'sustainable' transport system can be viewed as one which promotes economic efficiency and accessibility, whilst also maximising the safety of travellers and protecting and enhancing the environment, and which is equitable, financially sustainable and publicly acceptable. However, a definition of sustainable transport would need to consider other broader issues, such as depletion of resources and reduction of choice for future generations, all of which is outside our remit.
8.16 Our focus is on public sector appraisal of projects - that is, the appraisal of projects by and for the public sector, irrespective of whether or not the project is ultimately provided and funded, either in part or in total, by either a private sector company or by a publicly-owned organisation which operates on commercial lines. This kind of appraisal essentially first focuses on the worth or value of a change in the transport system to society as a whole, with questions about its fundability being an important second question. It may be that the project of most benefit to society cannot be funded, in which case some iteration between the two stages of appraisal - 'worth to society' and 'fundability' - may take place. It is generally accepted that, while private sector contributions should be sought and are generally welcome, they should not be allowed to distort to an undue degree the selection of what is best for
Transport and the economy: full report (SACTRA)
152
society. The aim is to identify projects which are both in the general interests of society and fundable, either from the public purse or by private interests.
8.17 Once the question is resolved of whether a project is beneficial to society, and the private sector then becomes involved in its provision, the appraisal emphasis changes to analyses of flows of revenues and costs, with social impacts being disregarded (by the private sector, although the public sector body initiating the project is still likely to wish to ensure that the public gets appropriate value for money). We do not deal with this kind of private sector analysis in our report.
8.18 Of course, if private sector promoters need public sector contributions to funding, or require permission under planning or Transport and Works Act legislation in order to proceed, they will naturally need to conduct the public sector appraisals necessary to their aims.
8.19 Much of this chapter is couched in terms which relate to the appraisal of schemes or projects because that is the level at which appraisal has been focused in the past. Some change of emphasis is now evident in that the Department is about to embark on a series of multi-modal corridor studies. In the last section of this chapter, therefore, we review the appropriateness of the requirements for other levels of appraisal; regional or corridor strategy and national policy.
8.20 It should also be noted that we see the whole process of the development and appraisal of transport interventions as involving the continuous sifting of ideas, from the broad policy options to increasingly specific propositions, until a range of detailed options emerge. This sifting process is particularly applicable to consideration of regeneration initiatives, where transport improvements are likely to be only one of a whole battery of policies which could be pursued. While we do not wish to understate the importance of this broad sifting process, we did not consider that we could address the process in this report. In particular, we did not consider that our remit required us to address either the whole planning process in general or the process of developing transport strategies and plans within overall planning policies. We leave these matters for others to consider.
8.21 The Department developed a New Approach to Appraisal (NATA - DETR, 1998b) for the conduct of the recent Roads Review (A New Deal for Trunk Roads in England, DETR, 1998c). A multi-modal version of the NATA Appraisal Summary Table (AST) is currently being developed, for inclusion in general guidance on the methodology for the conduct of the multi-modal studies, which is also being prepared as we write. We have more to say about the NATA later, but it is important to note here that our recommendations are designed to build on and fit within the NATA framework.
Implications for Appraising the Effects of Transport Interventions on the Economy
8.22 We recommend that the appraisal process be structured so as to include the following questions:
1) What is the rationale for the intervention?
2a) What are the benefits/disbenefits of the intervention, calculated using conventional transport cost benefit analysis (using best practice and on the assumption of a perfectly competitive economy outside the transport sector)?
2b) What are the total economic impacts of the intervention?
Transport and the economy: full report (SACTRA)
153
3) What is the pattern of gains and losses, in both economic activity and jobs, which will arise from the intervention?
8.23 These appraisal requirements are largely re-statements of the diagnostic tests which we suggested in our Interim Report (SACTRA, 1997) should be answered in the course of an appraisal of effects on the economy. We now discuss each in turn.
Appraisal Requirement 1: What is the Rationale for the Intervention?
8.24 The answer to this test should be an explanation of the intended or expected effects of the intervention, so drawing out the purpose or aims or rationale of the proposal in question. In particular, it is important to explain why a transport intervention is the most appropriate way of achieving the desired aims.
8.25 There are two reasons for such an analysis:
• to lay bare at the outset what the promoters of interventions intend, with the aim of focusing their minds on how the declared aims may best be achieved; and
• to suggest the type of appraisal, particularly modelling, which should be used for the particular intervention under consideration.
8.26 The crucial point we wish to emphasise here is that none of the Government's objectives (economy, safety, accessibility, environment and integration) should be ignored at this stage. They all have to be considered, including the effects on economic activity, whether or not the intervention is intended specifically to stimulate economic activity. This is because impacts under all five objectives may be negative as well as positive, and any tendency to include impacts only when they are positive should be avoided. We have argued in Chapter 4 that the effects on the economy may be negative (in relation to the conventional transport appraisal) as well as positive and may detract as well as add to an area's well-being (depending on the circumstances).
Appraisal Requirement 2A: What are the Benefits/Disbenefits of the Intervention Calculated Using Conventional Transport Cost Benefit Analysis (Using Best Practice and on the Assumption of a Perfectly Competitive Economy outside the Transport Sector)?
8.27 In Chapter 3, we explained that, under the assumption of perfect competition in the transport-using sectors of the economy, cost benefit analysis which took account of the responses of all economic agents would capture the total economic impacts. While it would be expected that these benefits/disbenefits would be transferred and transmitted to other activities which follow from the use of transport, it is generally accepted that cost benefit analysis based on consumer surplus theory will provide a good estimate of the total benefits/disbenefits. This is a convenient argument which has a practical outcome, because it is easier to identify and estimate the benefits/disbenefits accruing directly to travellers rather than search for their more elusive manifestations further along the chains of reactions.
8.28 In Chapter 4 and Chapter 5, we have explained the consequences of relaxing the assumption of perfect competition in the transport-using sectors. In simple terms, our conclusions were as follows:
• conventional cost benefit analysis conducted on the assumption of perfect competition may either over-estimate or under-estimate benefits/disbenefits;

Transport and the economy: full report (SACTRA)
154
• while, typically, we think that the error introduced by making the assumption about perfect competition is likely to be small, especially in relation to the general level of accuracy with which cost benefit analysis can be conducted, there may be cases where the errors are more significant, although we cannot offer much guidance on either the incidence or scale of these errors in the real world; and
• the current state of the art of appraisal modelling does not account adequately for all the important responses in the product, labour, land and property markets, and the transport system, and we consider that it will not be easy to amend current models to include such responses (as there is still a need for basic research on some of the key linkages).
8.29 Given these conclusions, we have adopted, as the foundation stone of appraisal, a form of cost benefit analysis which we think is attainable in practice in the relatively near future. This is a transport cost benefit analysis, which we denote by 'CBA*', in which all traveller responses are accounted for except changes in land use, and which would be undertaken in conjunction with an environmental impact assessment of the kind currently undertaken (all of which information would be drawn on in completing a NATA Appraisal Summary Table). Our aim in taking this line is simply to provide a practical way forward from today's state of the art.
8.30 The different forms of cost benefit analysis may be categorised as shown in Table 8.1.
Table 8.1 Forms of cost benefit analysis
Forms of analysis Inclusion of allowance for
transport market responses
land use responses
imperfect responses
environmental impacts
COBA/URECA FTM
no no no no
COBA/URECA VTM plus transport model
yes no no no
COBA/URECA VTM plus GIT
yes yes no no
CBA* yes no no no and yes
CBA** yes yes no no and yes
CBA*** yes yes yes no and yes
8.31 These categories need some elaboration, as follows. (Information on COBA can be found in Volume 13 of the Department's Design Manual for Roads and Bridges, and on URECA in the manual published separately by the Department.)
8.32 COBA and URECA FTM - fixed trip matrix - appraisals were the norm prior to acceptance by the Department of the 1994 SACTRA Report. No traveller responses were allowed to change the trip matrix, which was assumed to be fixed between the without and with scheme cases.

Transport and the economy: full report (SACTRA)
155
8.33 COBA and URECA VTM - variable trip matrix - appraisal may be undertaken using either a conventional transport model or an elasticity model as defined in the Department's Guidance on Induced Traffic (GIT, which is Volume 12.2.2 of the Design Manual for Roads and Bridges - DMRB). In either case, the transport market responses are represented, up to a point. Traveller responses and the impacts of, for example, congestion are included, but the responses which privately-owned providers of transport will make to changes in circumstances, including changes of demand, are generally not included. In the latter case, the elasticities given in GIT include some, but not all, land-use effects. COBA and URECA make no attempt to include the environmental impacts; these are appraised by an entirely separate process, as defined in DMRB Volume 11.
8.34 Our CBA* specifically does not include the land-use responses and imperfect market effects. Our intention is that this form of cost benefit analysis should do what COBA plus a transport model currently seeks to do, but in a significantly better way.
8.35 As discussed in Chapter 5, transport changes stimulate reorganisation and rationalisation of the production and logistics process, which lead to output effects, and which are manifested in part in land-use changes. So, our CBA**, as defined in Chapter 3, specifically does include the land-use responses, but still does not include the imperfect markets effects. This case is the central one shown earlier in the three-by-three matrix in Table 4.2.
8.36 Our CBA*** relaxes the assumption of perfect markets in the transport-using sectors. Now externalities are allowed, and so too are price-marginal cost differences in product and factor markets. This case relates to the other eight cells in Table 4.2.
8.37 Lastly, we need to consider the question of how environmental impacts are treated. As noted above, environmental impacts are currently analysed or appraised quite separately from the cost benefit analysis. One view takes the line that the environmental impacts should be included in the cost benefit analysis, whether or not they are monetised. Another view is that only those environmental impacts which can be valued in money terms should be included. This is not central to the current terms of reference, though a previous SACTRA set out its views in 1992. All that needs to be noted here is that a good practice transport appraisal will include either within or outside the formal CBA a full account of the transport-related environmental externalities. When we come to CBA***, we need in addition the induced environmental externalities in the transport-using sectors. The problems of forecasting and appraising these are not discussed further in this report.
8.38 Under Appraisal Requirement 2a, our concern is a perfectly-specified transport cost benefit analysis, CBA*. We accept that there may be a difference between this ideal and what can be achieved in reality, even by following best practice. The question of how current practice should be improved will be dealt with in later chapters, so we concentrate here on simply the principles, which should underpin a fully-specified transport cost benefit analysis.
8.39 In principle, we consider that a CBA* should:
• include all travel costs and benefits/disbenefits; and
• in deriving those costs and benefits/disbenefits, account should be taken of all traveller responses, given fixed patterns of land-use.
8.40 The costs should include due allowances for design and preparatory work, land and property purchase, construction and supervision of construction, operation, maintenance and enforcement.
Transport and the economy: full report (SACTRA)
156
8.41 Benefits and disbenefits should include changes in travel time, vehicle operating costs, reliability, and accidents, all valued in money terms.
8.42 For pragmatic reasons alone, we have not defined CBA* as incorporating any environmental impacts. However, we would welcome their inclusion, in monetised units, but do not want to risk our desire to improve cost benefit practice in its most basic form becoming compromised or confused by arguments about the inclusion of environmental impacts. Current practice is to conduct an environmental impact assessment separately from the cost benefit analysis and to consider the results of the two appraisals in the Department's new Appraisal Summary Table developed in its New Approach To Appraisal (which is explained in more detail in Chapter 10).
8.43 The main traveller responses which should be taken into account should include changes in route, time of travel, destination, mode and frequency of travel. However, as we pointed out in Chapter 6, there is evidence in the literature of some considerable variety in observed elasticities of demand with respect to either cost or time of travel. The implication of this evidence is that there is a need to understand which elasticities best represent real world behaviour and to ensure that the transport models reflect that understanding.
8.44 Apart from this general statement, the only other issues we need to note in this chapter relate to two specific issues, one from Chapter 6 and one from Chapter 7.
The implications of separating income and price effects on travel demand
8.45 In Chapter 6, we explored the differences between the effects of changes in income and price on the demands for travel. The methods currently used by the Department in the National Road Traffic Forecasts (DETR, 1997) relate car ownership to income but make no allowance for changes in the purchase costs of cars or the costs of using cars to influence ownership forecasts, although the effects of fuel price on car use is, however, included. We are aware that the Department has recently commissioned work to investigate the inclusion of income effects in its Vehicle Market Model. If the distinction between income and price effects is accepted as being useful from a policy analysis point of view, and feasible in practice, the implication would be that the current structure of the NRTF car ownership model ought to be reconsidered.
Cost benefit analysis of traffic reduction mechanisms
8.46 In principle, the requirements for a transport cost benefit analysis, CBA*, are no different whether the intervention being appraised is an increase in infrastructure or a means of reducing traffic.
8.47 To recap, we consider that a transport CBA* should include all travel costs and benefits/disbenefits and, in deriving those costs and benefits/disbenefits, account should be taken of all traveller responses, given fixed patterns of land-use.
8.48 The costs should include allowances for design and preparatory work, land and property purchase, construction and supervision of construction, operation, maintenance and enforcement. Quite naturally, there will be a different emphasis within these categories of cost depending on whether a new road or a congestion charging system, for example, is being appraised, but there are no issues of principle here.
8.49 Again, there are no issues of principle as far as the benefits and disbenefits are concerned - they should include changes in travel time, vehicle operating costs, reliability,
Transport and the economy: full report (SACTRA)
157
and accidents, all valued in money terms. With some traffic reduction mechanisms, there may be some effects which are less than fully obvious but which may nevertheless have an important bearing on the overall benefits/disbenefits and which therefore need to be taken into account. An example would be changes in search time which may arise from changes in parking controls. This implies that it is important to appreciate all the main effects of the particular traffic reduction mechanism and to ensure that the transport model is capable of providing estimates of those effects.
8.50 As with all transport interventions, the main traveller responses which should be taken into account in the appraisal of traffic reduction mechanisms should include changes in route, time of travel, destination, mode and frequency of travel. However, some evidence suggests that some other responses may also be relevant in the case of some traffic reduction mechanisms, including changes in driving behaviour, vehicle ownership, vehicle occupancy, rearrangement of travel tasks among members of households, and sequences and chaining of trips. While it is generally accepted that the first group of responses (change of route, time of travel, destination, mode and frequency of travel) should be taken into account and modelling procedures are available which enable them to be included in appraisals, there is much less experience of the second group of responses. Very little is known about their scale or importance and, therefore, whether it is important to model them and, if so, how they should be taken into account in modelling work.
8.51 One response which may require different treatment in the appraisal of traffic reduction mechanisms is the choice of when to travel. Many interventions, including new infrastructure provision, may have some influence on the time at which people travel. However, traffic reduction mechanisms can be designed specifically to encourage time-shifting, notably by use of charges or traffic regulations which vary according to time of day, and, as a result, may have more substantial effects on time of travel than many other interventions. This requires an important change of emphasis in the modelling of certain traffic reduction mechanisms compared to infrastructure measures. In the case of infrastructure schemes, the main question is to what extent will micro-time-shifting or peak contraction or spreading occur. We are aware that techniques to represent this kind of effect are under-developed and that the Department currently has research into them in hand. In the case of some traffic reduction measures, however, the issue is more likely to be macro-time-of-day choice - that is, the choices which people may make between distinctly different times of the day, such as whether to travel in the morning peak or during the off-peak period in response to distinctly different charging regimes (for example). While the modelling of this kind of effect is better developed, it does lead to a considerable increase in complexity which is, nevertheless, tractable (up to a point). The extra complexity arises from the increased need, when considering macro-time-shifting, to relate shifts in the outward journey to corresponding shifts in (at least) the return journey. This means that models need to deal in linked pairs of trips (although, more ideally, complete trip chains). This requirement to deal with linked pairs of trips arises, in principle, with micro-time-shifting too, but is generally ignored in practice without, it is thought, unacceptable loss of accuracy.
8.52 In conclusion, providing that Appraisal Requirement 1 is answered properly, that the mechanisms are fully understood, and appropriate modelling tools are employed, a cost benefit analysis of a traffic reduction mechanism raises no special issues which should not be addressed for all other kinds of transport intervention. The key step is to estimate the demand and cost changes - once that can be done satisfactorily, the economic appraisal is straightforward.

Transport and the economy: full report (SACTRA)
158
Appraisal Requirement 2B: What are the Total Economic Impacts of the Intervention?
8.53 The requirement here is to make as complete an estimate as possible of the total economic benefits/disbenefits, taking account of the effects of imperfect competition and, as far as possible, environmental effects too. As explained earlier, we term this CBA***.
8.54 We consider it important that some attempt is made to gauge the scale of the error which may be introduced by focusing on the transport benefits/disbenefits alone, as for Appraisal Requirement 2A. We envisage that this analysis may take a number of forms, such as:
• a reasoned argument that the total economic impacts are not likely to be significantly different from the transport benefits/disbenefits, in which case no further analysis would be required;
• an estimate of the benefits/disbenefits which are extra to the transport benefits/disbenefits using methods which involve a mixture of surveys, analysis of existing information, and judgement; or
• an estimate of the total benefits/disbenefits as may be derived, at least in principle, from some modelling approach which accounts for responses in some or all of the land and property, labour, and product markets, and which is therefore more elaborate than a transport model.
8.55 In principle, we consider that a CBA*** should:
• include all costs and benefits/disbenefits; and
• in deriving those costs and benefits/disbenefits, account should be taken of the responses of all economic agents.
8.56 As defined for CBA*, the costs should include allowances for design and preparatory work, land and property purchase, construction and supervision of construction, operation, maintenance and enforcement, and the benefits and disbenefits should include changes in travel time, vehicle operating costs, reliability and accidents.
8.57 However, so that the difference between CBA* and CBA*** will show the economic impacts, CBA*** should exclude any environmental impacts, although, in principle, we consider that fully-specified CBA*** should include them. The reason for excluding environmental impacts from CBA*** is a pragmatic one and lies with the definition of CBA*. Earlier, for pragmatic reasons alone, we took the line that, for the moment, CBA* should exclude environmental impacts. If and when agreement is reached on the inclusion of environmental impacts in cost benefit analysis, they may then be included in both CBA* and CBA***. An appraisal or assessment of the environmental impacts would therefore be carried out in parallel with the CBA.
8.58 In addition to the main traveller responses of changes in route, time of travel, destination, mode and frequency of travel, the responses should also include reactions in the product, labour and land and property markets.
8.59 We accept that CBA*** is a challenging requirement which cannot be met at the present time. We also accept that, in some circumstances, modelling which is more elaborate than transport modelling may be warranted and feasible, whereas in other circumstances, it may only be sensible to undertake transport modelling, and possibly even simplified transport modelling at that. In other words, we recognise that different degrees of modelling sophistication will apply in different cases.

Transport and the economy: full report (SACTRA)
159
8.60 But the key point is that some analysis of the total economic benefit, as opposed to simply the transport benefit, should be mandatory for all interventions: no escape should be possible from this requirement. Our reasoning for adopting this stance is that a comparison of the total economic benefits/disbenefits and the transport economic benefits/disbenefits will reveal something about whether the intervention is especially good or less good for the economy. We do not accept that these extra benefits/disbenefits can only be brought into the appraisal at the discretion of appraisers when they think their interventions may yield economic development benefits. We think that some effort should be made in all cases to establish whether there are likely to be benefits or disbenefits in relation to the transport benefits/disbenefits, because proposals can, unwittingly, have effects on the overall level of economic activity which reduce the measured transport benefits.
8.61 We need to digress a little at this point to consider how these benefit estimates should be used in the appraisal. As we have said in Chapter 7, it is not sufficient for an intervention simply to yield net benefits - that is, benefits which exceed the disbenefits. The net benefits must exceed the costs for an intervention to be considered worthwhile. Given that the costs in both CBA* and CBA*** would be the same, it will be safe to focus on the differences in net benefits under Appraisal Requirement 2B.
Appraisal Requirement 3: What is the Pattern of Gains and Losses, in both Economic Activity and Jobs, which will arise from the Intervention?
8.62 This Appraisal Requirement is designed to address the following questions.
• Where and to whom do the benefits/disbenefits and costs accrue and, more specifically, does the intervention have the intended effects in the target area, however loosely defined, or are the effects likely to occur elsewhere? (The two-way road question.)
• If there are likely to be beneficial effects in the target area, are they at the expense of activity in other areas and, if so, which ones?
8.63 Both questions can be neatly answered by assessing the pattern of gains and losses, both in terms of economic activity and in jobs.
8.64 A policy question of particular importance to our inquiry relates to whether the intervention being appraised would result in a change in economic activity which accords with Government's regional policies. In order to answer this kind of question, one needs to know whether the economic activity being forecast to result in an area is activity which has simply been moved from elsewhere or whether it is truly additional. A second question which then arises is whether, if the activity is simply being moved, that is a good thing or not. This is the thinking behind the two questions above.
8.65 The extent to which a proposal meets the Government's aims to reduce social exclusion is an important question about distribution which appraisers should address, but that is not our concern here. Nor are we concerned here with the distribution of effects between the various actors in the various markets, although, again, we consider that this is an important question which the appraiser should address.
8.66 We have articulated earlier in our report the differences between 'economic activity' and 'jobs'. While the more fundamental indicator is the change in economic activity, changes in employment are of interest in their own right, particularly for politicians.
Transport and the economy: full report (SACTRA)
160
8.67 Again, it is crucial that this appraisal requirement is met for all proposals; otherwise those interventions not aimed specifically at adding jobs to a target area could, unwittingly and undetected, have the effect of reducing jobs in certain areas. In our view, it is important to identify distributional effects whether or not there are any significant benefits/disbenefits additional to the transport benefits/disbenefits.
Relationship with our Interim Report Diagnostic Tests
8.68 These appraisal requirements cover all the diagnostic tests on page 12 of our Interim Report (SACTRA, 1997), except the fifth one: "is there any national or regional advantage in redistributing economic activity to the locations which are forecast to benefit?". We have not accorded this issue the status of an 'appraisal requirement' because we are uncertain how it should be handled.
8.69 There are a number of overlapping designations of areas which it is deemed would benefit from some degree of economic regeneration. If an intervention were to move economic activity from an area of well-being to one in need of regeneration, one could argue that this would be a benefit, simply by being in accord with regeneration policies.
8.70 However, there are several difficulties with this, including:
• how to account for the disbenefits which the area of well-being would experience arising from its loss of economic activity; and
• the question of whether the designations are appropriate and justified.
8.71 The first issue amounts to: does a job gained in a depressed area have the same value as a job lost in a well-off area? We have no answer to this question because it seems to us to involve political judgement.
8.72 Turning to the second issue, it seems to us that designations of areas in need of regeneration may be based either on objective analyses or political judgement or some mixture of the two. Again, we cannot comment on the process of making political judgements about which areas should receive priority status over others, but we recommend that the Department considers whether it is satisfied that the basis for designating areas for economic regeneration is sufficiently rational and that politicians, in making their judgements, are appropriately informed.
Interventions: Schemes and Projects, Regions and Corridor Strategies, and National Policies
8.73 We do not see that any differences of principle should apply to the various levels at which appraisal might take place. The Appraisal Requirements should be addressed for all levels.
8.74 We also do not see any differences of principle relating to the costs and benefits/disbenefits which should be included in the cost benefit analyses at the different levels of appraisal. There will be issues of accuracy, with less detailed estimates being more acceptable at the more strategic levels of appraisal, but none of principle.
8.75 The main differences and difficulties will arise with the modelling which underpins the appraisals. We deal first with transport models (in paragraphs 8.76 to 8.79) and secondly with land-use models (in paragraph 8.80).

Transport and the economy: full report (SACTRA)
161
8.76 Consider transport modelling. As the area to be covered increases, so the number of spatial units on which the model is based should also desirably increase. In broad terms, the computing time of a transport model is related to the square of the number of spatial units. The point can be reached when it is no longer feasible to achieve the desired degree of spatial detail within reasonable run times on commonly available computers. Thus, for the larger areas, such as some regions and corridors, and certainly for the nation as a whole, some simplification of the spatial detail is required. Moreover, transport models are required nowadays to deal with an increasingly wide range of policy instruments which generally leads to greater complexity in the modelling of traveller responses. This pressure for greater complexity in the demand modelling adds to the need for simplification in the supply modelling and the level of spatial detail.
8.77 New ground may need to be broken for regional and corridor appraisal. We note that the Department has commissioned consultants to develop guidance on the conduct of their planned multi-modal corridor studies and we expect that this will naturally embrace advice on modelling and appraisal.
8.78 At the national level, however, the situation is different. We are aware that the Department has investigated the feasibility of developing a national transport model and concluded that it is feasible to do so, albeit through use of some innovatory and untried techniques. However, we understand that no decision has yet been taken to develop a national transport model.
8.79 We are also aware of some attempts, both in the UK and at the EU level, to link fairly aggregate transport models to macro-economic models, typically through the productivity gains implied by time savings, as discussed in Chapter 5. Although we have not seen how these linkages actually operate in the models, we believe that these still require substantial work on developing the key interface between the transport and macro-economic models before they can be seen as reliable predictors of the wider economic effects.
8.80 Turning now to the question of models of the land and property markets, and the labour and product markets, we see the position as follows. In broad terms, land-use/transport interaction (LUTI) models which deal with these markets to some extent, some in greater detail than others, are in their element at the regional or corridor level. And, data permitting, the approach researched for us by Venables and Gasoriek (1997) is, in principle, applicable at the large regional and national levels, although as yet untried in this country for the practical appraisal of programmes of investment or other policy interventions.
8.81 We do not propose to dwell on these matters any further in this chapter. Our purpose has been simply to give a flavour of the main differences which would apply to the different levels of appraisal. We will return to our recommendations on modelling at the various levels of appraisal in later chapters.

Transport and the economy: full report (SACTRA)
162
Chapter 9 - Current Appraisal Practice
Introduction
9.01 Our objective in this chapter is to outline current practice in the appraisal of transport system interventions, noting changes which are currently emerging, so that we can:
• appreciate current best practice in transport cost benefit analysis;
• identify how the wider effects of transport provision on the economy are currently taken into account - that is, how the total economic impacts are dealt with; and
• see how the appraisal of the regeneration or impacts on economic development of transport interventions currently fits within the overall appraisal process.
9.02 Having described current practice in this chapter, we then consider in the next chapter what is wrong with current practice and how improvements can be made. This is done in the light of the implications, summarised in the previous chapter, of the analyses of the relationship between transport and the economy explored in Chapters 2 to 7.
An Overview Of Current Appraisal Practice
9.03 This is a time of great change in the Department's appraisal practice. Some very significant changes were made last year in connection with the publication of A New Deal for Transport and A New Deal for Trunk Roads in England (DETR, 1998a and 1998b), and some further significant changes are currently in hand in connection with the Multi-Modal Studies announced in A New Deal for Trunk Roads in England. The changes which are being developed as we write make it very difficult, if not impossible, to set down an exact and fully up-to-date description of current appraisal procedures.
9.04 At the time of writing, some of our Committee are aware of the changes being considered in the development of Guidance on Methodology for Multi-Modal Studies through their involvement in that work as consultants to the Department. However, the Committee as a whole has not been involved in that work, although we understand that our report will form an input to the current deliberations on the specific issue of how to appraise the wider economic impacts. We felt that we had no choice, therefore, but to take 'current practice' to mean 'practice at the time of writing and prior to the publication of Guidance on Methodology for Multi-Modal Studies'.
The new approach to appraisal
9.05 The New Approach to Appraisal (NATA - DETR, 1998c) was developed by the DETR during the 1998 Roads Review for two purposes:
• choosing between different options for solving the same problem; and
• prioritising between proposals.
9.06 NATA includes the identification and assessment of problems, the identification of options, and the assessment of those options. Throughout this process, the approach works within the framework provided by the five objectives of environment, safety, economy, accessibility and integration reproduced in Chapter 8 (page 64) from A New Deal for Transport.
Transport and the economy: full report (SACTRA)
163
9.07 An important element of NATA is the inclusion of an Appraisal Summary Table (AST). In the case of the Roads Review, this was a one page tabular summary of the main economic, environmental and social impacts of a road scheme. An AST was produced for each option and set out, simply and concisely, the key consequences of different options for tackling a particular problem using the five objectives, some of which were divided into sub-objectives.
9.08 It was not intended that the AST would automatically provide a mechanistic way of reaching a decision. It summarises the effects in each area so that decision takers have a clearer and more transparent basis on which to make those judgements.
9.09 The information presented in the AST is, where possible, based on the results provided by established techniques to assess the environmental, economic and social consequences of options. The approach is largely based on the Cost Benefit Analysis (CBA) and the Environmental Impact Assessment (EIA). The AST brings information from these together to give a fair and unbiased overall description, without giving prominence to any one type of effect or to benefits/disbenefits expressed in money terms compared with those which cannot be monetised.
9.10 The main impacts in relation to each of the sub-objectives are summarised in text, together with any relevant quantified information. A summary assessment is then given to indicate whether the impact in each category is generally beneficial or adverse, and how large it is. Where monetary values can be derived, as in the case of construction and maintenance costs or road user time savings, the summary assessment uses those values. Where impacts can be quantified but not monetised, the summary assessment is quantitative. Impacts that cannot be quantified are assessed on a (usually) seven point scale (note that these scales are not necessarily cardinal in nature). Because each seven point scale measures a very different objective, they cannot be compared with each other.
9.11 The contents of the Roads Review AST are:
• a statement of the problems which the scheme aims to resolve;
• a note of the other options for dealing with the problems;
• safety effects;
• integration effects; and
• results of the cost benefit analysis.
Changes to the roads review appraisal summary table
9.12 As noted earlier, the AST developed for the Roads Review is now being reworked so as to be more applicable to the Multi-Modal Studies which the Department is about to undertake. We understand the following:
• the five main Government objectives will remain unchanged;
• some of the sub-objectives are being reconsidered;
• cost benefit analysis will remain the cornerstone of the appraisal under the economy objective; and
• our recommendations will contribute to the revised methodology for the sub-objective currently labelled 'regeneration'.
Transport and the economy: full report (SACTRA)
164
Changes in cost benefit appraisal practice
9.13 Since the 1970s, the Department has been using its COBA program to undertake appraisals of road schemes. Although the COBA Manual acknowledges that traffic may change in response to increases in road capacity, demand was taken to be fixed in all but a very few instances.
9.14 Following the recommendations of the 1986 SACTRA report, Urban Road Appraisal, the Department developed URECA. Whereas COBA takes only traffic flows from the traffic model and calculated its own travel times, URECA takes both traffic flows and travel times from the traffic model.
9.15 Following the recommendations of the 1994 SACTRA Report, Trunk Roads and the Generation of Traffic, URECA was developed to work in the case where travel demand changed in response to the change in road capacity being appraised. A method of using COBA in this variable demand case was also developed at about the same time.
9.16 The Department introduced the Package Approach to local transport funding in the early 1990s. The idea was that local authorities could bid for funds from the Department for a package of transport measures, but that the precise allocation of funds to individual elements of the package would be for the local authorities to decide. Packages for urban areas were to contain demand management measures and means of improving public transport as well as proposals for the road system. To deal with the new appraisal requirements of multi-modal packages, the Common Appraisal Framework (CAF - see MVA et al, 1994) was developed. Unlike COBA and URECA which performed their calculations on a link by link basis, the CAF approach was to be undertaken on an origin-destination movement basis and the programs TREVAL and PTEVAL were developed for this purpose. The theory underlying the CAF approach was no different from that on which COBA and URECA was based; however, the CAF paid particular attention to the treatment of money and tax transfers so that full account of the financial flows could be output from the calculations. The CAF also included a way of treating the benefits/disbenefits to those who change their travel between the base case and the with-scheme case.
9.17 The Department recently commissioned a review of cost benefit analysis for transport appraisal from Professor Robert Sugden (Sugden, 1999). His report advocated a number of changes to current practice, including:
• a change from factor prices to market prices;
• a different way of treating the benefits/disbenefits associated with those who change their travel between the base case and the with-scheme case; and
• a change to values of time based on willingness to pay principles for all journey purposes.
9.18 At the time of writing, the Department has decided to adopt much of the Sugden approach. Changes are currently being made to COBA and URECA, so that they deal with market prices. The Sugden approach to the attribution of benefits/disbenefits to those who change their travel is preferred to the CAF approach, and the Sugden cost benefit analysis results sheet is now the proposed approach (although it should be noted that there is very little difference in the algebra underlying the CAF and Sugden approaches). However, we understand that the third of Sugden's changes listed above, the change to values of time based on willingness to pay research for all journey purposes, is still being considered.

Transport and the economy: full report (SACTRA)
165
9.19 In describing current practice on cost benefit analysis, it is therefore quite difficult to be definitive about all aspects at the present time, as several important issues are under active consideration as part of the work associated with the development of Guidance on the Methodology for the Multi-Modal Studies. In our description of cost benefit analysis, set out in this chapter, we have concentrated on the quite basic underlying principles which apply, irrespective of the changes now being considered.
The Content of this Chapter
9.20 In the remainder of this chapter, we concentrate on the methods used to appraise interventions under the economy objective. We deal first with cost benefit appraisal practice and secondly with the appraisal of regeneration impacts. We then deal, very briefly, with the methods for appraising impacts under the environmental impact, safety, accessibility and integration objectives. For further information, the reader should refer to the Department's Guidance on the New Approach to Appraisal (GNATA - DETR 1998c).
9.21 Many of the principles set out in this chapter are of a general nature and apply to the appraisal of transport interventions of all kinds. However, there is a tendency in some instances, such as when we refer to the Department's Guidance on Induced Traffic (in Volume 12.2.2 of the Design Manual for Roads and Bridges, DMRB) or the National Road Traffic Forecasts (DETR, 1997), for our discussion to focus more on the appraisal of road projects. The reasons for this are simply practicality and convenience in attempting to produce a fairly clear and not too lengthy text. It should not be inferred that the Committee has any misplaced concern for one mode or another. However, we thought that an explanation in detail of all the various issues which need to be considered in the appraisal of all modes would have consumed an unwarranted amount of space in our report and would have obscured the thrust of our arguments. Nevertheless, we do make some brief remarks in the last section of this chapter about the appraisal of public transport and traffic reduction schemes, although we draw the line at other types of projects, such as airports and ports.
Cost Benefit Analysis
General principles
9.22 In principle, CBA includes:
• travel demand and cost forecasting, without and with the intervention being appraised;
• the method of calculating user benefits/disbenefits from the changes in travel demand and costs; and
• the process of valuing the changes in user benefits/disbenefits in money terms and comparing them with the costs of implementation, maintenance and operation.
9.23 From this it can be seen that the following concepts are fundamental to a CBA:
• the concept of travel 'cost', usually called 'generalised cost';
• the shape of the travel demand curve which relates the amount of travel to the cost of travelling;
• the transport supply curve which derives the cost of travel from the amount of travel made (or demanded) on the transport system; and

Transport and the economy: full report (SACTRA)
166
• the point at which travel demand is consistent, or in balance with, the costs of travel (called the 'equilibrium' point).
9.24 Consider the well-known diagram which shows these features, Figure 9.1. This is the base year, base case situation.
9.25 If it is desired to appraise an intervention in the base year, which could be appropriate for interventions which can be implemented in a short timescale, such as traffic management measures, the problem to be faced is shown in Figure 9.2. If the intervention reduces road capacity or increases travel costs, the supply curve for the with-scheme case will lie above the base case curve; conversely, if the intervention increases road capacity or decreases costs, the new supply curve will lie below the base case curve. The task is to move from the base case equilibrium point A to the new equilibrium point B.
9.26 Over time, exogenous factors - such as changes in economic growth and income, changes in the price of car ownership and travel, and changes in the numbers and disposition of people, households, jobs, and other activities - will change the level of demand. This shift in the demand curve is shown in Figure 9.3. The task at this stage is to forecast that shift in the demand curve caused by the exogenous factors and to find the new equilibrium point C.
Figure 9.1 Demand/Supply equilibrium
Figure 9.2 Scheme appraisal in the base year
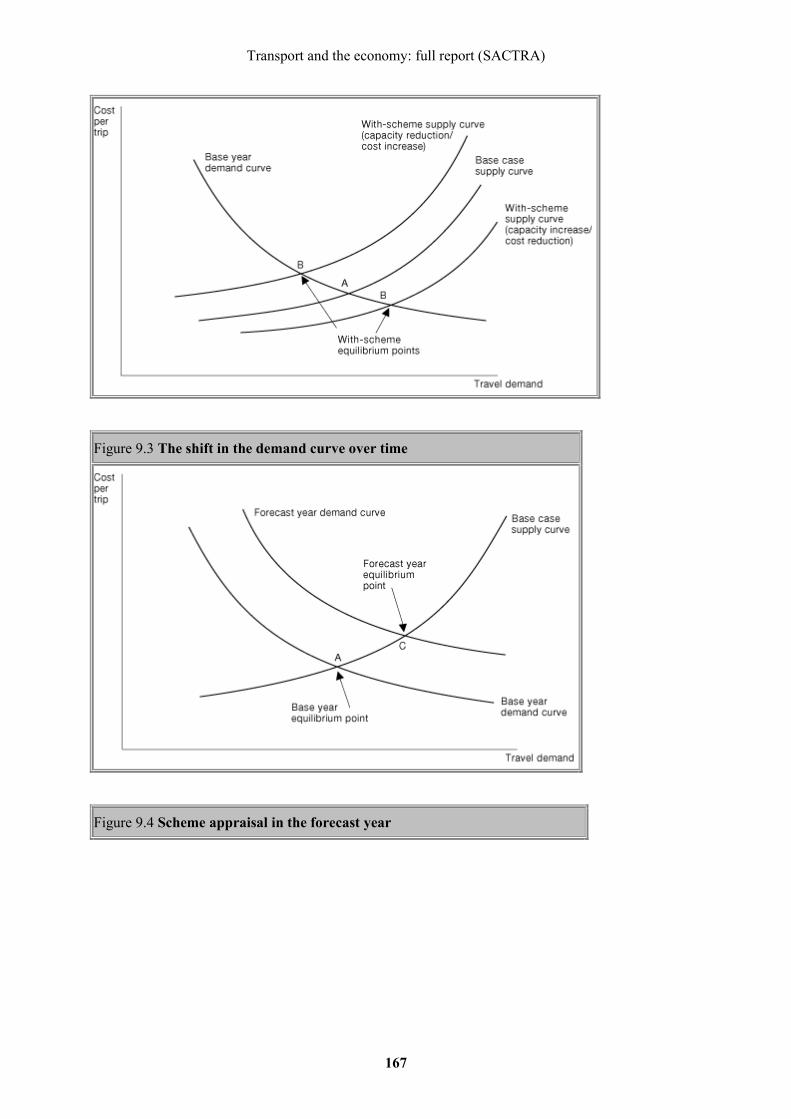
Transport and the economy: full report (SACTRA)
167
Figure 9.3 The shift in the demand curve over time
Figure 9.4 Scheme appraisal in the forecast year
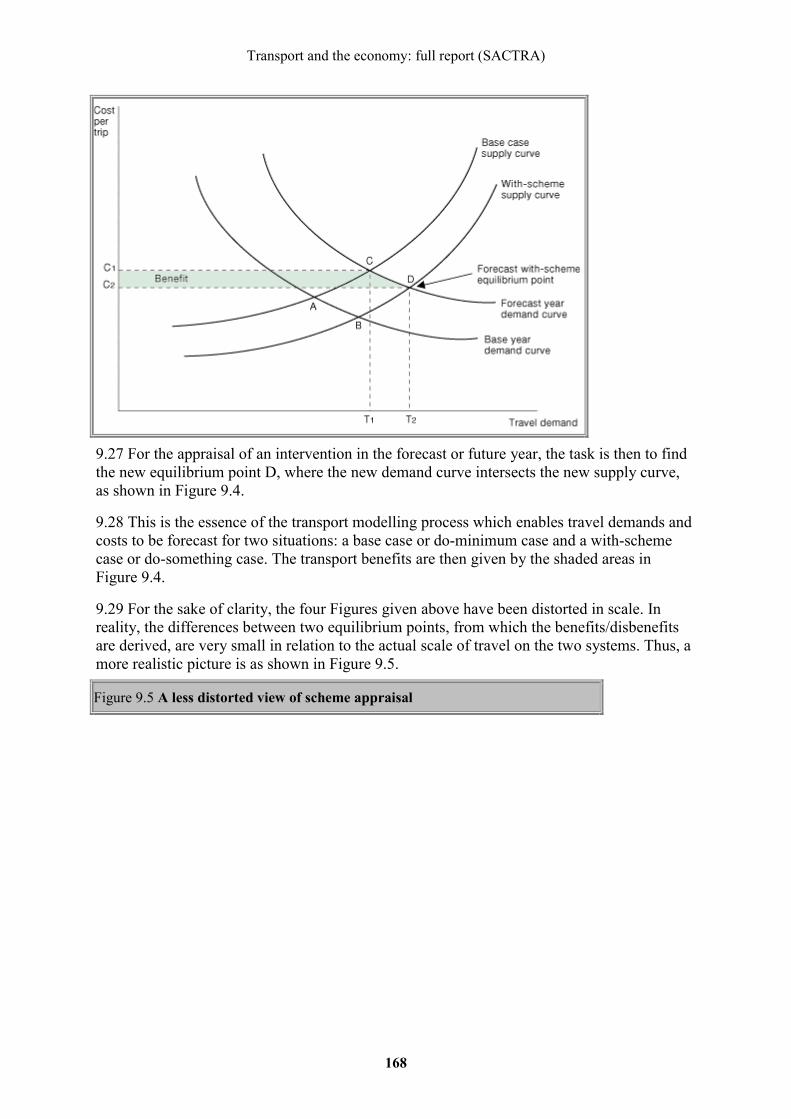
Transport and the economy: full report (SACTRA)
168
9.27 For the appraisal of an intervention in the forecast or future year, the task is then to find the new equilibrium point D, where the new demand curve intersects the new supply curve, as shown in Figure 9.4.
9.28 This is the essence of the transport modelling process which enables travel demands and costs to be forecast for two situations: a base case or do-minimum case and a with-scheme case or do-something case. The transport benefits are then given by the shaded areas in Figure 9.4.
9.29 For the sake of clarity, the four Figures given above have been distorted in scale. In reality, the differences between two equilibrium points, from which the benefits/disbenefits are derived, are very small in relation to the actual scale of travel on the two systems. Thus, a more realistic picture is as shown in Figure 9.5.
Figure 9.5 A less distorted view of scheme appraisal
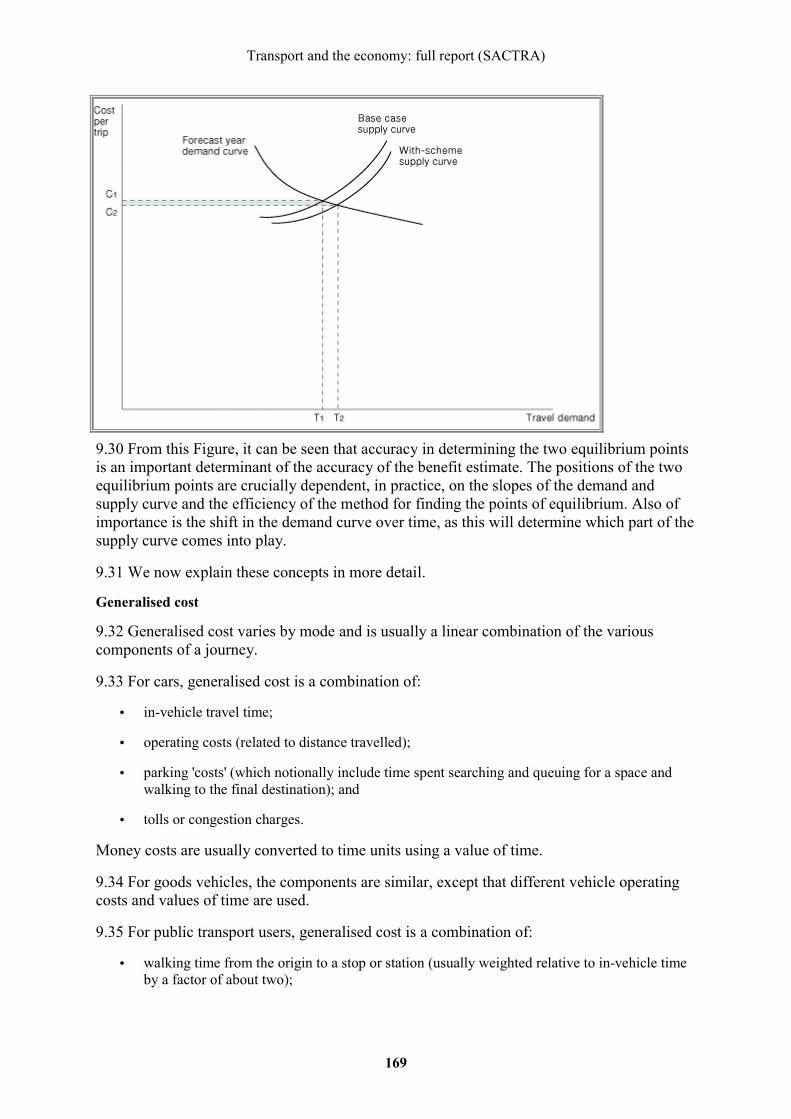
Transport and the economy: full report (SACTRA)
169
9.30 From this Figure, it can be seen that accuracy in determining the two equilibrium points is an important determinant of the accuracy of the benefit estimate. The positions of the two equilibrium points are crucially dependent, in practice, on the slopes of the demand and supply curve and the efficiency of the method for finding the points of equilibrium. Also of importance is the shift in the demand curve over time, as this will determine which part of the supply curve comes into play.
9.31 We now explain these concepts in more detail.
Generalised cost
9.32 Generalised cost varies by mode and is usually a linear combination of the various components of a journey.
9.33 For cars, generalised cost is a combination of:
• in-vehicle travel time;
• operating costs (related to distance travelled);
• parking 'costs' (which notionally include time spent searching and queuing for a space and walking to the final destination); and
• tolls or congestion charges.
Money costs are usually converted to time units using a value of time.
9.34 For goods vehicles, the components are similar, except that different vehicle operating costs and values of time are used.
9.35 For public transport users, generalised cost is a combination of:
• walking time from the origin to a stop or station (usually weighted relative to in-vehicle time by a factor of about two);

Transport and the economy: full report (SACTRA)
170
• waiting time for the service (again, usually weighted relative to in-vehicle time by a factor of about two);
• fare;
• in-vehicle time;
• penalty representing the inconvenience of changing between services; and
• walking time to the destination (again, usually weighted relative to in-vehicle time by a factor of about two).
Again, money costs are converted to time units using a value of time.
9.36 For transport modelling purposes, the components are those perceived by travellers, often referred to as 'behavioural' values. Thus, car operating costs are usually taken as fuel costs, and car parking costs and public transport passenger interchange penalties may contain elements to ensure that the model better reflects actual behaviour. Goods vehicle operating costs, by contrast, are likely to include all resource costs, including the time costs of the driver valued at an average wage, although variations may be adopted to reflect, in effect, drivers' perceptions of their resource costs.
9.37 For cost benefit analysis purposes, resource values (see 9.56 below) are used for working time and vehicle operating costs, and standard appraisal values for non-working time. Complications arise with respect to the treatment of payments which represent transfers between the traveller and the transport provider and the elements of such transfers which are tax.
9.38 It can be seen that most elements of generalised cost will vary with the levels of service offered by the transport system and, in particular, that the values of some elements will be dependent on the degree of congestion on the transport system. The most obvious example is the familiar effect of road traffic slowing down as demand increases; thus, as the traffic demand on the road system increases, so travel times will increase. A similar effect can be experienced with respect to parking: as demand for parking space increases, so it takes longer to find a place and so 'costs' of parking increase. In some urban transport models, overcrowding on the public transport system is allowed to result in higher generalised costs, usually by applying a factor (which varies with the degree of overloading) to the in-vehicle time (and possibly the waiting time too).
travel demand curve
9.39 The travel demand curve is an integral part of a transport model and its structure varies with the complexity of the model. In theory, it should represent all the responses which travellers may make to changes in travel costs. Although the evidence is far from conclusive about the relative importance of the individual demand responses, current understanding is that the main responses are:
• change in trip frequency;
• change in mode of travel;
• change in destination;
• change in time of travel; and
Transport and the economy: full report (SACTRA)
171
• change of route or service.
9.40 From the limited evidence available, it seems clear that the most important of these responses is change of route, followed by change of time of travel (SACTRA, 1994). The relative magnitudes of the other responses are under-researched, but the common current view is that they are small relative to change of route and time of travel, and that change in trip frequency is the smallest of them all. We note that the Department is currently researching this issue.
9.41 A fully-specified transport model will include mechanisms for representing each of these choices in a theoretically supportable manner. Some models, however, treat the first four - that is, all except change of route - in an approximate manner using an all-embracing demand elasticity (as given in the Department's current Guidance on Induced Traffic, in Volume 12.2.2 in the DMRB). Both the fully-specified and the elasticity methods are 'variable demand' or 'variable trip matrix' methods. The assumption commonly made (until recently) for the use of COBA in 'fixed demand' or 'fixed trip matrix' mode was that the only response of significance in response to a road scheme was change of route.
9.42 SACTRA (1994) also acknowledged that, in the longer term, the locations of activities may change and where people live may also change in response to transport system changes. In order to account for changes of this kind, a land-use/transport interaction model is required. These models are much more complex than the more sophisticated transport models and are rarely used in project appraisal, although their use is not unknown. Importantly, however, there is as yet no proven method of deriving comprehensive and internally consistent estimates of benefits/disbenefits from these models, although some hold out more potential than others so that, with some further development, they may be used for this purpose.
9.43 Also relevant here is the issue of the shape of the demand curve for business traffic in general and goods vehicle traffic in particular.
9.44 Much of personal business traffic (as opposed to goods vehicle traffic) falls into what is known as the 'non-home-based' category - that is, trips which have both ends at places other than the homes of those making the trips. Most transport models treat this category of trip in a simplified fashion compared to the treatment of 'home-based' trips - that is, trips which either start or end at the homes of those making the trips. The traditional approach has been along the following lines. An estimate is made of the numbers of non-home-based trip 'creations' which each household will undertake, based on the characteristics of the household. These estimates are summed across all households in the study area to yield the total number of non-home-based trips. Estimates are then made of the numbers of non-home-based trips 'allocated' to each zone based on various attraction parameters, typically the numbers of jobs by type in each zone. These allocations are then factored so that they match the total number of creations. The assumption is then made that the number of non-home-based trips starting in any one zone is the same as the number terminating, and both numbers are given by the number of 'allocations' estimated for each zone.
9.45 Some more sophisticated models relate the numbers of non-home-based trips starting in a zone to the number of home-based trips ending there. This enables a more realistic pattern of non-home-based trips to be modelled. However, even in models of this type, further simplifications are made by not subjecting the resulting non-home-based trips to the full range of traveller choices (time of travel, mode, frequency, etc).
Transport and the economy: full report (SACTRA)
172
9.46 Strictly, in order to model non-home-based trips correctly, one would need to model complete trip chains - for example, outward from home to work, from work to shop, from shop to the theatre, and from the theatre back to home. Trip chains can vary from two legs (outward and inward) up to some considerable number and can be even more complex than the example just given. Some models do use what are known as 'primary tours' (that is, the combination of the outward trip from home and the inward trip to home) rather than individual trips (that is, legs of trip chains) as their basis. But even this requires a considerable increase in model complexity and is only adopted in certain more complex policy analysis models.
9.47 In the transport models generally used for project appraisal today, goods vehicle demands are very often treated as being fixed and unresponsive to changes in supply. The usual approach to forecasting goods vehicle demands is as follows:
• create a matrix of trips in the base year from roadside interview data;
• factor this by the growth in goods vehicle-kilometres given by the National Road Traffic Forecasts; and
• assume the resulting matrix of trips of the forecast year is inelastic to the changes in transport supply brought about by the scheme being appraised.
9.48 The last point is often the case in some of the more sophisticated models, such as the typical 'four-stage' model in which person traveller responses are treated individually. Paradoxically, however, adopting a simplified approach to person travel demand forecasting by using an elasticity model of the kind suggested in the Department's Guidance on Induced Traffic may entail applying an elasticity to goods vehicle trips as well as car trips. While the Guidance does not make it clear whether the elasticities quoted in that document apply to cars, goods vehicles or both, we understand that the Department's view is that the elasticities quoted may be applied to all trips taken together, but that modellers are expected to use their judgement to decide whether or not that is appropriate. We suspect that it is quite common for the elasticties to be applied to total trips without distinction. Where this is the case, although, goods vehicle demand, implicitly, is not assumed to be inelastic, it is assumed to have the same elasticity as personal travel.
9.49 We will return to these issues in Chapter 10, as they are potentially important to the validity of estimating the transport benefits/disbenefits as the foundation for an estimate of the total economic impacts.
Transport supply curve
9.50 As already noted, supply-side effects include the familiar congestion effects on roads, as well as the effects of overcrowding on public transport and searching for a parking space when supply is limited relative to demand.
9.51 To represent road traffic congestion effects, a transport model of a congested area will usually include processes for:
• selecting routes through the transport network;
• loading (or 'assigning') the travel demand to the transport network; and
• adjusting the travel 'costs' in response to the travel demand loaded.
Transport and the economy: full report (SACTRA)
173
9.52 The process of loading and cost adjustment is repeated until an equilibrium position is reached. Most methods seek a solution to the so-called 'Wardrop's First Principle' which says, in essence, that drivers select their routes in such a way that no driver can switch to a faster route or, in other words, all selected routes (between any given origin and destination) have equal travel times while all unselected routes have longer times. Public transport and parking supply curves are less well-developed than the road supply curve, although the relationship between traffic speed and flow is not fully understood in spite of decades of research.
Equilibrium
9.53 As noted above, the process of adjusting some of the elements of generalised cost in response to the demand loaded will result in changed total generalised costs and, in turn, changed travel demands. Transport models of areas where congestion is likely to exist and where, therefore, travel demands and costs are inter-related, often include procedures for seeking the equilibrium position between supply and demand. As noted earlier, adequate convergence is essential so that the differences between the without-scheme and with-scheme cases - the travel times savings, principally - can be distinguished from the variations in travel times between iterations.
9.54 It is increasingly acknowledged that equilibrium is an elusive concept in the real world. People are continually adjusting their patterns of behaviour in response to factors which often have nothing to do with the transport system, as well as to the changing levels of service offered by the transport system. These exogenous changes are a cause of inherent instability. Thus, while it is recognised that the concept of equilibrium is flawed, it is currently not at all easy to represent the way in which behaviour evolves over time in practical project appraisal models, and the concept of equilibrium is adopted because it allows tractable solutions to modelling the transport system.
9.55 One response to this problem has been to make increasing use of land-use/transport interaction models mentioned earlier. These often involve lagged responses of the locations of activities to changes in accessibility provided by the transport system. However, this innovation leads to other, as yet unsolved, problems for appraisal, which will be considered further in Chapter 10.
Values of time
9.56 As will be evident from the above, values of time play a role in both modelling and appraisal. Behavioural values are used in the modelling process to ensure that people's perceptions are correctly represented. For appraisal purposes, however, 'resource' values are used for working time and 'standard appraisal' values for non-working time. Resource values measure actual resources consumed in travelling during working time and are related to market wage rates. For non-working time, no market exists and the values reflect people's willingness to trade time for money (as determined from both revealed and stated preference data). 'Standard appraisal' values (that is, national 'average' values) are used, rather than values which vary according to the local levels of income. This has been the practice in the UK since the earliest transport cost benefit analyses in the 1960s.
Comparing costs and benefits/disbenefits
9.57 The derivation of the benefits/disbenefits in a cost benefit analysis involves the calculation of the user or traveller costs in both the without-scheme and with-scheme cases. The difference between these two user costs is the 'benefit' or 'disbenefit'. The difference between the benefits and disbenefits is termed the 'net benefits', and these are usually
Transport and the economy: full report (SACTRA)
174
estimated for each year of a 30-year appraisal period and discounted to some 'present' year. Streams of costs of implementation, maintenance and operation are also estimated for the 30-year period and also discounted to the present year. The ratio of the discounted net benefits to the discounted costs is referred to as the 'Benefit/Cost Ratio' and the difference between the discounted benefits and the discounted costs is the 'Net Present Value'.
Cost benefit analysis and the economy objective
9.58 These calculations of the time and money costs and savings yield measures which enable a partial assessment to be made of the extent to which an intervention would achieve the economy objective. The assumption is made, often implicitly rather than explicitly, that perfect competition exists in the markets being served by the transport system under investigation. This assumption allows the contention to hold that the user benefits of time and vehicle operating cost savings represent the savings to business and industry. This means that the measure of achievement of the objective to promote the economic efficiency of transport can also be used to assess the degree of achievement of the objective to promote the efficiency of economic activities.
Regeneration or Economic Development Impacts 9.59 The methods used for estimating the wider economic effects of projects beyond the straightforward transport benefits/disbenefits lie at the centre of our inquiry. While there are standard codified methods for the appraisal of the direct benefits/disbenefits of transport projects and policies, there is no equivalent standardised approach to the assessment of the wider economic impacts. Practice varies widely from decision-taker judgement based on informal analysis and subjective assessment of the situation right up to the use of land-use transport interaction methods which seek to predict the land-use and economic development consequences of transport changes within formal models. For this reason, we commissioned a review of a range of studies from David Simmonds Consultancy (1997).
9.60 Before considering some examples of practical methods used, it is worth redefining what SACTRA, on behalf of the Government, is interested in. The proposition is that, at least under some circumstances, there are some wider or additional economic impacts, which need to be taken into account in the overall assessment of the project. We have seen in earlier chapters that while, under the assumption of perfect competition in the non-transport sectors of the economy, the direct transport benefits/disbenefits are an accurate measure of the final economic impacts (ie, there is no additionality), as soon as the assumption of perfect competition is relaxed, this correspondence ceases to hold. Wider benefits (positive or negative) may then flow through the labour, land and property and product markets (see Chapter 4). From the Government's perspective, the interest is in the total economic impacts of projects and policies, and in the spatial distribution of these impacts. However, in an appraisal context, these may be approached by considering the direct transport benefits/disbenefits (through formal economic appraisals) plus the wider economic impacts not counted in the transport appraisal.
9.61 The procedure can lead to three difficulties of principle:
• Which wider impacts are relevant?
• Which is the relevant decision-taker, and for whom is the analysis being undertaken?
• Is there double-counting between the transport benefits/disbenefits and the wider economic impacts?

Transport and the economy: full report (SACTRA)
175
Table 9.1 David Simmonds Consultancy - impact table
Main category
Sub-category Examples of impact
Direct Direct economic impacts
Additional employment for transport systems (eg LRT staff)
Multiplier effects of direct impacts Induced effects
Retail sales migrate to new LRT lines Firms move location to London Regional Transport line taking advantages of greater accessability
Retail and service multipliers from these relocations
Additional development to accommodate changed demands
Indirect
9.62 In his report for SACTRA, upon which much of what follows relies, Simmonds identified a range of direct and indirect impacts, set out in Table 9.1.
9.63 The wider economic impacts map on to the induced effects in this table. The treatment of the direct employment effects from the construction and operation of any scheme, and any multipliers associated with them, are a matter of general relevance across the whole of public expenditure rather than being specific to transport, and are dealt with in the HM Treasury Green Book (1997). Our scope is that of the induced effects in the transport-using sectors.
9.64 The issue of who the appraisal is for is a real problem. As Simmonds points out, relevant parties to an investment decision may include the EU, Central Government and its Agencies, the regional tier (through RPG and the regional transport strategy), local government and the private sector. A local authority may legitimately, in the context of a prospective public inquiry, commission a study on the economic development impact of project X on local authority Y. Such a study, however well undertaken in relation to its terms of reference, will not answer the question SACTRA is interested in - namely the additional wider economic impacts from the perspective of the UK as a whole - for the following reasons. Firstly, some of the benefits of the scheme to local authority Y may be transferred from elsewhere and are not net national additions. Secondly, some of the economic development benefits to area Y may be the transport benefits transmitted through the accessibility mechanisms into economic development on the ground. Thus, although there is great potential interest in the fact that transport benefits will transmit into economic development and jobs, there is a real concern from an appraisal point of view that unwarranted double-counting is being introduced into the appraisal process. Given that experience suggests such impacts will be considered anyway though the political process, it is arguable that the real risk is of treble-counting. At the very least, scrupulous care and health warnings are required to ensure that at Government decision stage, the focus is on the legitimate additional wider economic impacts when viewed from a national perspective.
9.65 Surprisingly few economic impact studies have been undertaken with this perspective in mind, and therefore considerable issues of overlap and potential for double-counting are

Transport and the economy: full report (SACTRA)
176
inevitably present in the studies reviewed for SACTRA by Simmonds. This is not a criticism of the consultants undertaking the studies, but a reflection of the perspective and terms of reference of the clients for whom they were working.
Table 9.2 Simmonds' five economic impact studies
Category Description Examples
Local economic framework
A set of calculations based upon professional judgement, focusing upon the corridor of the transport improvement
Dearne Towns Link RoadStrathclyde Tram
Regional economic framework
A set of calculations based upon professional judgement, focusing upon thewider regional implications of the scheme
Midland Main Line
Regional framework andsupporting economic models
As above, but making use of wider economic growth or input/output models
M74
Behavioural modelling A model representing the location or economic behaviour of firms/households,coupled with supporting economic growthor input/output models
A7/A68
9.66 Simmonds reviewed five economic impact studies which are presented in increasing order of complexity in the Table 9.2.
9.67 The methods used in these five core studies can be very briefly summarised as follows:
A) Dearne Towns Link Road Study - uses professional judgement as to the improvement in prospects for development on specific sites, and of the employment that these might accommodate. Impacts are related to the presence of the scheme rather than to the level of improvement provided.
B) Strathclyde Tram - same as A.
C) Midland Main Line study - estimates increases in exports and inward investment, associated employment and increase in population, retail activity and associated development. All estimates are based on interpretation of surveys of businesses and developers and on additional judgements. Impacts are related to the presence of the scheme rather than the level of improvement provided.
D) M74 - conversion of business-related transport cost savings (freight and passenger) into a change in the differential between regional and UK economic growth, taking account of the importance of road transport for each sector. The multiplier effects of these changes and increased demand for development are also considered.
E) A7/A68 - spatial input-output model predicting a (slightly) different equilibrium pattern of employment and household location, of labour and service flows and of demand for housing and commercial floorspace. This is modelled over time as a result of each alternative transport supply. Location is influenced by time and cost of passenger travel.

Transport and the economy: full report (SACTRA)
177
9.68 Simmonds then identified a further set of methods of which he was aware:
F) Dodgson's analysis of the impact of the M62 on Huddersfield - measurement of changes in freight access costs, used in a model of employment growth by area.
G) Computable general equilibrium models - such as the Venables and Gasiorek model described in Chapter 4 - these predict a new equilibrium pattern of values of production by sector and region as a function of changes in the cost of moving goods and services between or within regions (no feedback to transport cost conditions). Focus is usually on freight costs only.
H) Macroeconomic models (including both the Merseyside and CEBR analyses) calculate impacts over time of general changes in total transport costs (freight and possibly passenger) for the regional or national economy concerned, in terms of GDP, employment, etc (with the possibility of feedback to transport demand). They consider only money costs, of all transport or just of freight.
I) Regional spatial input-output models: similar to G (CGE models), but with interaction over time between economy and transport (hence also similar to E (MEPLAN), but with more detail of economic sectors and less or no detail of population and of physical land-use). Can consider freight and passengers.
J) SETEC model: calculates increased regional employment as a function of the collective time savings enjoyed by residents of a region as the result of a new high-speed train service.
K) Economic potential models (as represented by the DSCMOD European application) calculate changes in employment (or of production) by sector and area in responses to changing accessibility to markets; accessibility may take into account both passenger and freight movement.
9.69 Simmonds then drew upon his reading of these studies and methods to give his assessment of the state of the art of economic impact studies by addressing the following issues:
Q1. To what extent is there a common method, or at least common elements, in different methods?
A1. The approaches applied in the five case studies have, overall, very little in common. The first two (Dearne Towns and Strathclyde Tram) share the view that developers' direct responses to transport changes are the main effect of interest, whilst the last two (M74 and A7/A68) share the opposite view that land-users' (i.e. business and household) responses are the key effect. The Midland Main Line study steers a middle course between these two views. The additional more formal methods F-K above have more in common with each other, but there are some very marked differences in approach within these models.
Q2. What outputs from transport analysis are used and how do these influence economic variables, at what spatial scale?
A2. The linkage between transport and economic change differs mostly between the case studies and methods. At one extreme, the Dearne Towns and Strathclyde Tram studies appear

Transport and the economy: full report (SACTRA)
178
to have assessed the scope for development effect simply from a description of the transport project. At the other, estimates of change in transport times and costs or of change in accessibility are used in the various models to drive changes in activity.
Q3. To what extent are the economic impacts contingent upon other actions in transport in other sectors?
A3. With one partial exception, none of these studies identified the outcome as contingent upon other actions involving public expenditure. However, they were contingent upon private investment either in property or in businesses taking place, and tacitly assumed that public action in the form of planning permission would be supportive of this.
Q4. How, if at all, are increased employment and other economic impacts valued?
A4. The first four of the five case studies predict net economic impacts for particular areas, but none of these directly puts a value on the impact. The fifth case study method, the MEPLAN package applied to the A7/A68, does not predict a net economic impact, but predicts what is intended to be a comprehensive appraisal of the welfare changes induced within the Study Area. Some of the other models (F-K above) produce indicators of economic impact instead of or as well as employment impacts.
Q5. Is there a problem of double-counting between the economic impacts (whether explicitly or implicitly valued) and the conventionally measured transport benefits/disbenefits?
A5. There is discussion in some of the reports about the possibility that consideration of employment impacts, or of both employment and development impacts, may imply a degree of double-counting of effects which have already been counted as transport savings. In the majority of cases, there is no attempt at valuation of the economic impacts, and therefore no attempt to quantify and cancel out the double-counting effects. However, in SACTRA's view, this still leaves open the possibility of double &- counting at the decision stage, when the apples of the transport assessment come to be aggregated with the pears of the wider economic impacts.
9.70 In summary, we make the following general points here about the way in which the wider economic impacts of projects are often appraised:
• little of what is done can be described as standard practice;
• the estimates that are made are often best characterised as 'the best that can be done with the data available and the current state of knowledge';
• little attention is paid, in most cases, to double-counting with other aspects of the appraisal and to phenomena such as the two-way road effects; and
• these benefits are usually only brought into play when the promoter wishes to use them in favour of the project, never in the reverse case.
9.71 We now turn, very briefly, to the appraisal of impacts under the Government's other four objectives: environmental impact, safety, accessibility and integration.
Environmental impact
9.72 The Government's current method of appraising the environmental impacts of road schemes is set out in Volume 11 of the Design Manual for Roads and Bridges. The impacts taken into account are the effects on:
Transport and the economy: full report (SACTRA)
179
• air quality;
• heritage;
• ecology and nature conservation;
• landscape;
• land-use;
• traffic noise and vibration;
• pedestrians, cyclists, equestrians and community effects;
• vehicle travellers;
• water quality and drainage;
• geology and soils; and
• impacts on policies and plans.
Disruption during construction is also included. Of these impacts, those on pedestrians, cyclists and communities are entered in the Roads Review AST under the accessibility heading, and those relating to impacts on policies and plans under the integration heading.
9.73 While some of these environmental effects are quantified, others are treated only in descriptive terms. None, at present, are valued in monetary units. Although there is a large body of research to suggest that environmental impacts like noise and air quality can be valued, the Department's own research undertaken following the recommendations of SACTRA's (1992) report has not so far been sufficiently convincing for the Department to recommend values. While the DMRB relates specifically to road schemes, it is, in practice, used to appraise other kinds of transport project and policy, albeit with some modifications.
9.74 The environmental appraisal or assessment is therefore undertaken separately from the cost benefit analysis, although the travel-related environmental impacts are clearly derived from the transport model output which also provides the information required for the cost benefit analysis. The environmental information is summarised in an Environmental Statement, backed up by Environmental Impacts Tables and displayed on maps and graphs to give the all-important geographical dimensions to the assessment. The process of arriving at an overall assessment, taking account of both the cost benefit analysis and the environmental assessment, is one in which judgement plays a central role.
Safety
9.75 Assessment of the achievement of the safety objective is conventionally included in the cost benefit analysis, but is also entered separately in the AST. Changes in personal injury accidents are derived from estimated changes in vehicle-kilometres run on different types of road and changes in flow patterns at junctions. They are valued using standard values which include allowances for the number and severity of casualties, damage to property, insurance administration, police costs and damage only accidents. Individual casualty costs include medical costs, lost output, and human costs, for example, pain, grief and suffering based on the willingness to pay principle.
Accessibility

Transport and the economy: full report (SACTRA)
180
9.76 We note that 'accessibility' has been used in the past in several different, often overlapping ways, including the following:
• measurement of ease of access to the transport system itself in terms of, for example, the proportion of homes within x minutes of a bus stop or the proportion of buses which may be boarded by a wheel-chair user;
• measurement of ease of access to facilities, with the emphasis being on the provision of the facilities necessary to meet people's needs within certain minimum travel times, distances or costs;
• measurement of the value which people place on having an option available which they might use only under unusual circumstances (such as when the car breaks down) - 'option value' - or even the value people place on simply the existence of an alternative which they have no real intention of using - 'existence value'; and
• measurement of ease of participation in activities (for personal travel) or delivery of goods to their final destination (for goods travel), provided by the interaction of the transport system, the geographical pattern of economic activities, and the pattern of land-use as a whole.
9.77 Planners of public transport systems often focus on the first of these, while land-use planners often concentrate on the second. It is possible to argue that the first three views of accessibility are particular views within the general framework provided by the fourth. Thus, the fourth use may be regarded as the all-embracing measure of accessibility.
9.78 Recent work by David Simmonds Consultancy et al for the DETR (1998) has shown that system-wide accessibility benefits/disbenefits are, to a very large extent, subsumed in a fully-specified cost benefit analysis. The Department's Roads Review Appraisal Summary Table (AST) accepts that motorised accessibility benefits/disbenefits are largely covered by the economic appraisal and instead uses the accessibility heading to deal with three non-motorised issues:
• effects on pedestrians and others;
• access to public transport; and
• community severance.
Integration
9.79 A New Deal for Transport: Better for Everyone (DETR, 1998a) defines an 'integrated' transport policy as one in which there is:
• integration within and between different types of transport;
• integration with the environment;
• integration with land-use planning; and
• integration with policies for education, health and wealth creation.
9.80 Methods of assessing the extent to which the integration criterion is met have been developed for use in preparing an AST. The Department expects that reasoned argument and judgement will be used, based on factual evidence.
Transport and the economy: full report (SACTRA)
181
Appraisal at Different Levels
9.81 Interventions in the transport system may apply at varying scales or levels. At the broadest level, interventions would be considered as either policies which apply across the nation as a whole and have a national effect (for example, the fuel duty escalator), or national policies which apply locally but sum up to have a national effect (for example, land-use policies such as those relating to out-of-town shopping). At the most detailed level, they would constitute specific schemes, and it is at this level where, in practice, much appraisal activity takes place. We start by considering schemes first and then move on to consider the higher levels of appraisal.
Road schemes
9.82 Scheme appraisal procedures are most clearly defined for trunk road schemes. Local authority road schemes which require financial contributions from central government (as most of the more substantial schemes do) are usually subjected to similar appraisal procedures, although sometimes less rigorously executed. The Government's traffic modelling and forecasting advice is contained in Volume 12 of the DMRB, and the advice on economic appraisal is contained in Volume 13 (COBA), Volume 14 (QUADRO) and Volume 15 (NESA), and in the separately published URECA Manual. The main thrust of the current advice is to consider first whether the scheme being appraised is likely to induce extra traffic. For 'simple' schemes which are unlikely to induce much extra traffic, a conventional fixed trip matrix appraisal is recommended. For other schemes where induced traffic is a possibility, it is recommended that either responses are separately modelled or the case is made for adopting a simplified procedure, such as the use of elasticity models.
9.83 In practice, the case is often made for adopting the elasticity approach on the grounds that suitably specified models which represent all the main traveller responses separately are either not available or too costly to develop. Advice has been issued by the Government on the use of elasticity methods, including recommendations about the elasticity values which should be used in response to SACTRA's (1994) report. Comparably definitive advice about the development and use of fully-specified transport demand models is not yet available, although there a number of good practice texts available on the subject (see, for example, the Institution of Highways and Transportation's Guidelines on Developing Urban Transport Strategies, Chapter 6), and the Guidance on the Methodology for Multi-Modal Studies will also help to fill the gap.
9.84 Forecasting methods vary according to the structure of the traffic or transport model being used. The central tenet, however, is that there should be some form of central oversight and control of the forecasts to ensure that the same growth is not being claimed and used to justify projects in different parts of the country (as happened in the 1970s). Chapter 6 of SACTRA's (1994) report provides an outline of how central oversight is achieved through the National Road Traffic Forecasts, although procedures have changed slightly with the 1997 NRTF (DETR, 1997).
9.85 As noted in the early sections of this chapter, fixed trip matrix economic appraisals are usually undertaken using either COBA or URECA (or NESA in Scotland). Whereas COBA takes only traffic flow information from the traffic model and computes its own estimates of travel time changes, URECA takes both flows and times from the traffic model (following the recommendation of SACTRA's 1986 report). Both these programs undertake their calculations on a link by link basis, rather than a matrix cell by cell basis as does TREVAL,
Transport and the economy: full report (SACTRA)
182
for example. It can be shown that the link-based calculations are equivalent to the matrix-based calculations, that is, the consumer surplus formula given in Chapter 3.
9.86 Following SACTRA's 1994 report, the URECA software has been developed to enable variable trip matrix appraisals to be undertaken, and a method of using the current version of COBA (COBA10) to approximate variable trip matrix appraisals has been defined. The values of time and vehicle operating costs used in these programs are specified in the DMRB.
9.87 In the case of the more complex transport models, often multimodal, a different approach to economic appraisal is necessary which takes account of all cost and demand changes across all modes, including those who change mode as a result of the scheme being assessed. The general consumer surplus theory provides the foundation for these calculations, conducted on a matrix cell by cell basis. A certain amount of rigour is needed in performing these calculations to ensure the correct treatment of those changing mode and tax payments.
Public transport schemes
9.88 Major public transport infrastructure projects are treated somewhat differently from road schemes. In general, appraisal procedures are less well codified, although the Office of Passenger Rail Franchising (OPRAF, 1999) for example, has recently published guidance on appraisal procedures.
9.89 In general, the principles of consumer surplus cost benefit analysis can be applied in an identical fashion to both road and public transport schemes. Indeed, the Common Appraisal Framework was developed to enable schemes for the two modes to be evaluated on a common basis. In practice, a special kind of cost benefit analysis, called a 'restricted cost benefit analysis' is required for public transport schemes if funding is to be sought from central government (as would be the case with a new light rail scheme, for example). The premise behind the restricted CBA is that the benefits to public transport users can, and should, be captured through the farebox. The appraisal should include an exploration of the fare level which maximises revenue, and this revenue is then taken as a measure of the benefits to public transport users. The appraisal includes the following tests:
• Operating costs must be covered by revenues from passengers and advertising;
• The present value of the total scheme cost should be covered by: -the revenue from passengers; - contributions from developers; - direct savings in the costs of existing public transport provision; plus - the benefits to non-users of public transport, principally in the form of reduced road traffic congestion.
• The public sector grant contribution should be exceeded by the non-user benefits.
9.90 These stringent requirements have become even more difficult to meet since the publication of SACTRA's Report (1994) which drew attention to the extent to which non-user benefits can be reduced by induced traffic.
9.91 It is also worth noting here that, because some public transport schemes are inherently difficult to justify in terms of the restricted CBA, attempts are often made to include the economic development impacts, expressed in terms of numbers of jobs created, in the appraisal. The Department's stance, however, has been that these benefits, although of interest, do not add to the benefits formally included in the restricted CBA.
Transport and the economy: full report (SACTRA)
183
9.92 In the case of the environmental assessment, the procedures developed for road schemes are adopted, somewhat informally and with some modifications, for public transport scheme appraisal.
Traffic reduction schemes
9.93 The appraisal of traffic reduction schemes is much less well codified than either road or public transport schemes. The principles which should underpin the appraisal of a traffic reduction measure are exactly the same as those described earlier in this chapter, and reproduced below:
• the travel demand curve should encapsulate all likely responses to the traffic reduction measure;
• the transport supply curve should take account of the effect of the traffic reduction measure on both the capacity available, the level of service offered, and the cost of travel; and
• the new equilibrium between demand and supply should be established, especially as the whole point of a traffic reduction scheme is to shift the point of equilibrium.
9.94 Traveller responses to traffic reduction measures typically require greater complexity of treatment in transport models. For example, traffic reduction measures are often intended to encourage significant shifts in the time at which people travel, moving them from peak periods to off-peak periods. This requires careful treatment of the choice of when to travel. More specifically, parking controls often result in less supply being available at a given price or in a given locality, which means that it is important to model the trade-off which people make between time spent searching for a space, the charge they would have to pay, and the time they would have to spend walking to their final destination.
9.95 In recent years, some sophisticated policy analysis models have been developed for the appraisal of congestion charging and parking - see, for example, Bates, Williams, Coombe and Leather (1996) for a description of APRIL (Assessment of the Pricing of Roads in London) and Bates, Skinner, Scholefield and Bradley (1997) for a description of TRAM (Traffic Restraint Analysis Model). Typically, models of this type treat demand in some detail, and supply with considerable simplification. They do, however, pay considerable attention to seeking the point of balance between demand and supply. Our impression, however, is that these complications are rarely recognised in the appraisal of traffic reduction measures, especially parking controls which are often modelled in a very simple manner.
9.96 As noted in Chapter 8, the economic and financial appraisals of traffic reduction measures involve no difficulties of principle. (In saying this, we are assuming the economic appraisal is restricted, as at present, to those effects which can be monetised and that environmental impacts are appraised separately, as at present, although we recognise that all impacts, monetised and non-monetised, quantified and non-quantified, are brought together in the AST). The key requirement is to derive accurate estimates of the changes in travel demand and cost of travel. Once these have been calculated, the consumer surplus calculations may then be carried out in the usual fashion (as in the Common Appraisal Framework approach, for example).
Appraisal at the national and regional levels
9.97 We now briefly consider current practice at levels of appraisal other than the scheme or project level.

Transport and the economy: full report (SACTRA)
184
9.98 At the national level, the nearest we come to an appraisal process across the country as a whole is the appraisal of the fuel duty escalator and the reviews which are carried out from time to time of the Roads Programme resulting in last year's Targeted Programme of Improvements (DETR, 1998b). This programme contains only trunk road schemes, of course. It was for this purpose that the Appraisal Summary Table was first developed (see GNATA - DETR, 1998c).
9.99 The other form of national transport proposal appraisal is that carried out by the Department of the submissions made by local authorities for funding local transport. A New Deal for Transport (DETR, 1998a) changed the form of these applications by announcing that local authorities in England will be required to submit Local Transport Plans with five-year expenditure plans set within the context of a longer-term strategy. We expect that the DETR will exercise their judgement about the worth of these Plans to share out the available funds between the most deserving bids.
9.100 Although the Government's Integrated Transport Policy for the nation as a whole has now been published (DETR, 1998a), there exist only limited facilities for the appraisal of such national policies at the national level. The DETR has investigated the feasibility of constructing a National Transport Model and has concluded that it would be possible to do so. There is, however, no commitment as yet to develop such an analysis tool. All that exists at the national level are the National Road Traffic Forecasts (NRTF - DETR, 1997), to which some approximate methods of policy analysis have been added for the analysis of national air quality strategy. The NRTF have a role to play in the appraisal of individual road schemes but do not, in themselves, provide a means of appraising the national Roads Programme as a whole.
9.101 At the regional level, various kinds of appraisal are undertaken. In many urban areas, appraisals are carried out to determine the most appropriate transport strategy. In recent years, these have taken the form of so-called 'integrated transport strategies', with the emphasis on policies rather than individual infrastructure projects. In other instances, 'master plan' studies have been carried out in which the focus is much more on identifying programmes of infrastructure improvements. By definition almost, studies of this kind are multi-modal.
9.102 In inter-urban areas, 'scheme identification studies (SIS)' have sometimes been undertaken on whole routes or corridors. Examples include the A30/A303 route from London to Penzance, and the M6 SIS in which ways of increasing road capacity between Birmingham and Manchester were investigated. In these instances, the models used were almost invariably confined to road traffic movements only and the form of the economic appraisals, if undertaken, is unclear.
9.103 A New Deal for Trunk Roads in England (DETR, 1998b) proposed 26 studies of areas and corridors where the Government is unclear that a new or improved road is the most appropriate solution to environmental, congestion and safety problems on the trunk road. Following consultation with regional planning bodies on the proposed study programme, in March 1999 the Government confirmed a final programme of 27 studies to begin over the next two years. Of these, 10 will look mainly at roads-based modes, the remainder will be fully multi-modal in scope.
9.104 An emerging form of regional transport appraisal is the 'strategic environmental assessment (SEA)'. The term 'strategic environmental assessment' is used by the Department to describe any kind of environmental assessment conducted at a broader level than the
Transport and the economy: full report (SACTRA)
185
individual project level. As promoted by the European Commission in connection with the development of the Trans-European Transport Networks, the term has a more specific meaning. The EC intends the assessments to be strategic in scale of analysis, to include all modes of transport, and to give emphasis to environmental issues in identifying problems and needs and in the kinds of solutions included in the strategies ultimately proposed. Despite the emphasis indicated by their name, these studies also include cost benefit analyses and assessments of impacts on economic activity.
9.105 As noted above, local authorities may also now seek funding for their transport initiatives through the local transport plan process. This method replaces the package bid approach, for which the Common Appraisal Framework (CAF) noted above was originally developed. The main output of the CAF development work was a series of assessment tables which, in the early years of the package approach, local authorities were required to complete. These tables fell into disuse, however, partly because the Department never made it clear whether they were to apply to the whole strategy or package or individual initiatives. At any level, they proved onerous to complete, requiring much rigorous modelling and appraisal work, which was often beyond the resources available to local authorities. The appraisal elements of a local transport plan have much in common with those of a package bid, although the funding elements are clearly different.

Transport and the economy: full report (SACTRA)
186
Chapter 10 - Recommendations for an Improved Appraisal Practice
Introduction
10.01 In Chapter 8, we set out the requirements for appraisal of transport strategies, policies and projects which follow from the analysis in Chapters 4 to 7 of our report, and against the background of the Government's New Approach To Appraisal. In Chapter 9, we described current appraisal practice. In this chapter, we provide a critique of current practice in the light of the requirements set out in Chapter 8 and make recommendations for improvement.
10.02 This particular inquiry concerns the interrelationship between transport and the economy and this is reflected in the balance of the content which follows. Our overall perspective is that circumstances have changed in many respects, so that the tools of appraisal which may have been adequate, say, twenty years ago are in need of progressive development. Among the new circumstances are the overall policy context laid down in the New Deal for Transport (DETR, 1998a), the New Approach To Appraisal (NATA - DETR, 1998b) in which the five appraisal objectives, including the impacts of policy initiatives on the economy, are made explicit, and the intended application of the new approach at the regional or corridor level as well as the scheme level, as announced in the New Deal for Trunk Roads (DETR, 1998c). Thus, this critique is intended to form the basis for practical and progressive recommendations for development.
Emphasis and Structure of this Chapter
10.03 Having considered in some detail whether and in what circumstances economic impacts additional to those normally captured in conventional cost benefit analysis actually occur, and the practicality of calculating any additional impacts, we have come to the following important conclusions:
• there are some significant imperfections in the practice of conducting conventional transport cost benefit analysis; and
• there are some circumstances when a perfectly specified and properly executed transport cost benefit analysis will be significantly in error and, depending on which of the eight non-central cells in Table 4.2 apply, the errors may be positive or negative;
• however we consider that the former imperfections are more tractable than the latter ones.
10.04 In addition, there may be circumstances where the wider economic impacts and their distribution by location, industrial sectors and/or social group may be relevant to the appraisal and the decision. A multi-track approach is therefore required, so as to improve the following:
• the estimation of the transport costs and benefits/disbenefits (Appraisal Requirement 2a);
• the assessment of the wider economic impacts additional to the transport benefits/disbenefits (Appraisal Requirement 2b); and, in addition,
• the distributional impacts, whether or not there are any wider economic impacts which either add to or subtract from the total transport benefits/disbenefits (Appraisal Requirement 3).
We structure our comments under these Appraisal Requirements. First, however, we report some comments from respondents to our consultation.

Transport and the economy: full report (SACTRA)
187
Observations from the Consultees
10.05 A useful starting point is the evidence received on the subject of appraisal. This is interesting because it reflects a deep division between those coming from a transport economics focus and those with a planning background.
10.06 The prevailing transport economists view among our respondents (Bates, 1999; Evans, 1997; Lowe, 1997) is that the position is essentially unchanged since the review undertaken by our predecessors ACTRA in 1977. Their review concluded that, except in rare cases such as estuary crossings, there is no evidence that additional benefits/disbenefits over those within the transport cost benefit analysis need to be taken into account. The conclusion to be drawn from this position is that scarce appraisal resources are best spent on getting the direct transport and environmental assessment as correct as possible.
10.07 A number of respondents (Nash, 1997; Plowden, 1997; Tyler, 1997) point to the dangers of allowing economic growth or regeneration benefits into the analysis. Their arguments include the tendency of transport investment to centralise rather than decentralise economic activity, the need to consider a wide range of policy measures for supporting peripheral regions, the sheer difficulty of forecasting the economic impacts, and the need to avoid confusing the claims of proponents operating from a local perspective with real benefits from a national perspective.
10.08 However, a number of respondents consider that current appraisal techniques are not, in practice, a complete account of the economic impacts. Evans states that a full assessment of the benefits/disbenefits must incorporate land-use effects which are difficult to predict. He considers there are no robust and fully quantified approaches to assessing the development or regeneration effects of transport infrastructure.
10.09 Robertson and Wharton (1997) discuss a number of the mechanisms which we have reviewed in Chapters 4 and 5. They consider that there might be a case for changing appraisal methods provided that there was good evidence that existing methods resulted in a serious underestimation and there was a well-established method for relating GDP impacts to scheme outcomes (as opposed to inputs). However, their hunch is that the net industry reorganisation and rationalisation effects of transport infrastructure may be relatively small.
10.10 Wenban-Smith (1997) adopts a much broader approach. He contends that there are significant gaps in our understanding of the larger and longer-term effects of transport in the economy requiring further research. He claims that transport appraisals are increasingly required to focus on competitiveness and sustainability, yet that there is very little in the armoury of conventional forecasting and appraisal techniques to meet these needs; "The extraordinary consequence is that the largest and most important effects of transport play little or no part in the appraisal of transport projects."
10.11 Turning to the evidence from Government departments, the Treasury evidence (1997a) said little about appraisal issues beyond confirming that "Cost benefit analysis should be used to measure changes in welfare from the point of view of the whole economy, which may not be synonymous with GDP growth. Any research which leads to improvements in this whole economy measure would be welcome."
10.12 The Scottish Office (1997), in a detailed and carefully argued review, reached three conclusions concerning appraisal:
Transport and the economy: full report (SACTRA)
188
• given a theoretical, fully specified demand function, it is difficult to think of any factors that are not wholly captured;
• however, there is little prospect of making such a model operational - "the acid test of current modelling techniques is how accurately the slopes of these (transport demand and cost) curves can be measured in practice";
• therefore there may well be "potential for systematic underestimation of economic benefits of transport schemes".
They consider that the key issue is whether impacts over and above the direct transport benefits/disbenefits are sufficient in either magnitude or variability to make it essential to take the wider economic impacts into account on a case by case basis.
10.13 The Government Regional Offices (Government Office for Eastern England, 1997; Government Office for the North West, 1997; Government Office for the South East, 1997) make few points which bear directly on appraisal, but their general approach is interesting. First, and not surprisingly, their focus is the region which they represent, and the problems within it. Second, given that focus, they strongly believe that roads and transport schemes contribute to the achievement of regeneration and competitiveness objectives, particularly in combination with other programmes. Transport cost benefit analysis is seen as a hurdle which schemes must jump; once they have done so, issues like contribution to regional planning and regeneration come into the picture and involve a degree of judgement.
10.14 It is fair to say, therefore, that there is a spectrum of opinion among transport appraisal professionals. It should be mentioned that these responses were written before the publication of the New Approach To Appraisal (DETR, 1998b). We have considered all the evidence carefully, and put forward our own assessment against that background.
10.15 In Chapter 4, we have also developed a more formal classification of the various cases in which some of these wider economic effects may arise (Table 4.2). This identifies clearly the way in which such effects arise in the sectors of the economy which are affected by the levels of service provided by the transport system (the 'transport-using' sectors), assuming land-use remains unchanged, but not the local, regional or national economy as a whole. A single change in the conditions in the transport sector could therefore have both positive and negative effects on different sectors in the same economy being considered. Even assuming no land use effects, the impact will differ case by case according to the structure of the local, regional economy in question, the structure of competition in the various sectors in both that area and other areas affected by the scheme, and the existence of imperfections in the transport sector itself.
10.16 We now turn to our three Appraisal Requirements.
Appraisal Requirement 1: What is the Rationale for the Intervention?
10.17 We are concerned only with the economy heading in this report - that is, we leave on one side the objectives of safety, accessibility, environment and integration.
10.18 Where transport proposals are made primarily for transport-related reasons - that is, reasons such as reducing congestion on the roads, reducing travel times by public transport, or removing traffic from environmentally sensitive areas - it may be argued that the economic development impacts of this kind of intervention are not central to the case being made.
Transport and the economy: full report (SACTRA)
189
Nevertheless, we think that there are many instances where the translation of these transport benefits into economic development benefits are considered, both as a means of boosting the case for an intervention and as an aid to setting priorities between interventions.
10.19 There are, however, many other instances where the primary motivation of a transport intervention is to stimulate economic activity, such as roads which unlock land for development. In this kind of instance, appraisal of the economic development impacts takes centre stage, and it is important that the reasons why a transport intervention is being preferred to other kinds of policy are fully exposed.
10.20 We have argued in Chapter 8 for greater consistency - we consider that economic development impacts should be considered in all cases, whether or not they are thought at the outset to be important or central to the case for an intervention.
10.21 So, Appraisal Requirement 1 means that the mechanisms at work, from the changes in travel costs which the proposal would bring about to the effects on economic activity, should be articulated. While we do not have prescriptive views about the way in which the arguments should be set out, we can point to the following examples in our report, and reports which we have commissioned from others, as shown below:
• Chapters 4 and 5 explain the forces at work. Chapter 5 also draws on the work we commissioned from David Simmonds Consultancy (1998) to explain the relationships between the transport market and system, and the land and property, labour and product markets;
• the report commissioned from Dodgson (1997) also contains some considerations of the way in which transport changes work through into the economy; and
• the report commissioned from Barrett (1998) describes (in his Chapter 2) the linkages between transport and the economy in a way which he relates (in his Chapter 5) directly to methods of appraising the effects of the forces at work in particular circumstances.
10.22 General Treasury guidance (1997b) on economic appraisal of public interventions argues for an explicit statement of the rationale in terms of a statement of the problem and reasons for believing that the intervention will satisfactorily address the problem. This rationale should be couched in terms of a demonstrable need to correct or compensate for some form of market failure or to achieve some public good. For example, if the argument were that a new road would unlock land for economic development, it would need to be shown that there was some impediment to this development taking place through the working of the market. As we argued in Chapter 8, this process should focus the scheme promoters' minds on how the declared aims may best be achieved, including the possibility of non-transport alternatives, and suggest the type of appraisal which should be used.
10.23 Appraisal Requirement 1 should be applied at an early stage in the development and appraisal of an intervention and certainly before an intervention enters any kind of programme of implementation, such as the Department's Roads Programme.
10.24 We recommend that the Department prepares and issues advice on the kinds of arguments which should be considered in developing the rationale for a transport intervention, along with advice on the ways in which the rationale should be articulated.

Transport and the economy: full report (SACTRA)
190
Appraisal Requirement 2A: What are the Benefits/Disbenefits of the Intervention Calculated using Conventional Transport Cost Benefit Analysis (Using Best Practice and on the Assumption of a Perfectly Competitive Economy outside the Transport Sector)?
10.25 Our comments under this Appraisal Requirement fall into two groups: those relating to transport modelling and forecasting, and those relating to the estimation of transport benefits/disbenefits.
Issues relating to transport modelling and forecasting
10.26 We start here by considering some general modelling and forecasting principles, building on paragraphs 9.22 to 9.30. We then turn to modelling reliability and traffic reduction measures.
10.27 We have argued in Chapter 8 that a fully specified and properly executed transport cost benefit analysis, CBA*, is a prime requirement for transport project appraisal. We have also explained in Chapter 9 the primary requirements for CBA* and, broadly, what constitutes current best practice. It will be clear from all this that, leaving aside issues of valuation which we will address in the next section, there are a number of fundamental requirements for CBA*:
• a realistic demand curve;
• a realistic supply curve; and
• an efficient means of finding the equilibrium point with appropriate accuracy.
By 'realistic', we mean curves which represent reality with a degree of accuracy sufficient for the purposes of the appraisal in question.
10.28 With respect to the demand curve, there are two issues to consider:
• the structure and slope of the demand curve; and
• forecasting how the demand curve will shift over time.
10.29 The significance of these elements was explained in the text surrounding Figures 9.1 to 9.5. There it was explained that the accuracy of the benefit estimates will depend on:
• the relative slopes of the demand and supply curves;
• the accuracy with which the shift in the demand curve can be forecast over time;
• the accuracy with which the change in transport costs can be predicted by the supply curve; and
• the accuracy with which the equilibrium positions can be found.
10.30 In commenting on these four issues, we deal first with the structure and slope of the demand curve for car travel, followed by similar considerations of the goods vehicle travel demand curve. We then turn to the question of forecasting the shift in the demand curves over time, again for cars first, followed by goods vehicles. Lastly, we make some very brief notes on the supply curve and the process of finding equilibrium.
Transport and the economy: full report (SACTRA)
191
10.31 Our discussion focuses on the Department's practice in the appraisal of road schemes which increase capacity for general traffic - the conventional road project. However, the appraisal of road capacity reductions or reallocations requires consideration of exactly the same issues (MVA, 1998), as does the appraisal of public transport schemes. We deal with the more demanding requirements of some traffic restraint policies after the discussion on road scheme appraisal.
The Structure and Slope of the Car Travel Demand Curve 10.32 We are aware that, following from the recommendations of our 1994 Report, the Department has some important and fundamental research in hand into the structure of travel demand curves. The Department's Guidance on Induced Traffic, originally published at the same time as our 1994 Report and since updated, contains some overall elasticities of travel demand. We are aware that these elasticities are currently being reviewed, and that, as a result of that review, procedures are being researched in which each of the main elements of demand are represented by a separate demand curve. We are also aware that the Department is about to embark on a major programme of surveys conducted before and after the opening of the last section of the Manchester Motorway Box. These data will provide a unique opportunity to research the forms of each of the demand curves for each of the main traveller responses. We support the Department's efforts in this general research area, including investigation of the impacts of other types of intervention, including packages of measures.
10.33 We recognise that it will be a few years before this work can be expected to result in new advice and so we expect that the current Guidance on Induced Traffic, with its reliance on elasticity methods, will continue to play an important role in project appraisal in the meantime. These elasticities are overall elasticities which purport to capture a number of traveller responses in a single elasticity - that is, in a single demand curve. It should be emphasised that the Department, like SACTRA in its 1994 Report, takes the view that, wherever induced traffic effects are considered likely to be important, separate modelling of the individual traveller responses is to be preferred. Both the Department and SACTRA recognised that this might be neither possible nor warranted in all cases, which is why the simplified elasticity approach was put forward and is often adopted.
10.34 However, the Guidance is unclear as to whether the quoted elasticities should be applied to cars not being used on employers' business, to all cars, to goods vehicles, or to all vehicles. It is not clear to us whether:
• the elasticities are some kind of average elasticities which should be applied to all vehicles taken together; or
• whether they apply to one category of road user alone.
As a minimum, the Guidance should state clearly what vehicle categories the elasticities should be applied to and what assumptions are implied by that advice.
10.35 We recommend that the Department clarifies its current Guidance on Induced Traffic especially in respect of the elasticities to be applied to business and goods vehicle trips.
10.36 The arguments set out in Chapters 4 and 5 emphasise the importance of the effects on business traffic in general to the accuracy of the estimate of the total economic impacts of a transport intervention. We leave on one side, for the moment, the freight element of business travel and focus on personal travel on business.

Transport and the economy: full report (SACTRA)
192
10.37 A significant proportion of business trips fall into the non-home-based category of travel. As evidenced by the description in Chapter 9 of the way they are often handled in transport models, their treatment is an area of particular weakness in conventional transport modelling. We note that their correct treatment is important to the accuracy of the economic benefit estimate; business trips have a high value of time and, even though they typically constitute less than 20% of the total number of trips, they contribute much more than that to the total benefit estimate.
10.38 We recommend that the Department undertakes research to ensure that business trips are modelled appropriately and specifically to develop better ways of modelling non-home-based trips, especially the business element.
10.39 More broadly, we have commented in Chapter 6 on the variety of elasticities of demand to be found in the literature. The general point made was that there seems to be some evidence that the Department's elasticities may be too low.
10.40 We recommend that the Department reviews the evidence in the literature about elasticities of demand, and issues advice designed to ensure that the modelling practices adopted by practitioners properly reflect reality.
10.41 The travel demand curve is an integral part of a transport model and its structure varies with the complexity of the model. In theory, it should represent all the responses which travellers may make to changes in travel cost. Transportation modelling practice has tended to rely on a framework in which four main responses are identified - trip frequency, mode of travel, destination and route. In some more recent and advanced models, a fifth response is recognised, time of travel. In addition, other responses have been identified in research carried out for the Department (Cairns, Hass-Klau and Goodwin, 1998), such as the effects on driver behaviour, vehicle ownership (which would then feed into trip frequency and mode), vehicle occupancy, chaining, and the allocation of travel within households. Such evidence which is available on the relative sizes of these responses is not all consistent - it seems likely that this is highly context-dependent - but changes of route are often the easiest to make, and therefore can dominate the short term responses. Changes of destination take longer, and their importance is underlined by the substantial trends in journey length. While we are aware that the Department is currently researching some of the responses which travellers may make to changes in the transport system, we are unsure whether any research is in hand to address the less conventional responses.
10.42 We recommend that the Department reviews the recent evidence on less conventional or well-established traveller responses, and initiates research to identify their importance and to develop ways in which they may be included in transport models.
The Goods Vehicle Travel Demand Curve 10.43 At various points in our report, we have presented arguments and evidence about freight travel:
• in Chapter 4, we pointed out that any additionality to conventional transport benefits/disbenefits calculated under the assumption of perfect competition would, to some extent, arise from commuters and more especially from business travel, of which freight travel is a major component;
• in Chapter 5, we discussed the very detailed ways in which the movements of freight could be affected by changes in transport costs, subject to the logistics of the industry concerned;
Transport and the economy: full report (SACTRA)
193
• in Chapter 6, we cited some evidence which suggests that freight movements can be influenced by a number of factors; and
• in Chapter 9, we explained the quite simplistic manner in which freight movements are currently handled in conventional transport models.
10.44 From all this, our general view is as follows:
• it is particularly important for the accuracy of the economic benefit estimate that the responses of freight operators to transport interventions are properly taken into account;
• however, the current practice of modelling freight operator responses in general and the responses of goods vehicle movements in particular is relatively primitive and unsatisfactory.
10.45 Note that by 'responses of freight operators' we include any reactions of firms and activities which generate demand for the movement of freight. Note also that here we are considering the responses of freight operators to changes in the supply of transport, as opposed to the change (growth) in the demand for the movement of freight over time, which we come to below.
10.46 We are aware that, at various times during the last 30 years, efforts have been made to develop methods of modelling the way in which commerce and industry, and therefore goods vehicles, respond to changes in the transport system. This is a difficult area, for the reasons explained earlier in Chapter 4, Chapter 5 and Chapter 6, and only limited progress has been made, as borne out by the current practice explained in Chapter 9. Encouragingly, we note that the Department is actively considering developing its freight forecasting procedures by taking into account the way in which business logistics respond to transport changes.
10.47 We recommend that the Department conducts a thorough review of past work in the modelling of freight responses to changes in the transport system and initiates research to develop sound techniques for modelling goods vehicle responses.
Forecasting the Shift in the Car Travel Demand Curve 10.48 We are aware that the Department is currently refining its advice in Guidance on Induced Traffic on how the shift in the demand curve for car travel should be forecast, and we support the initiative. (Note that the slope of the demand curve is governed by the model parameters established in the base year which are assumed to remain unchanged in the forecast years.)
Forecasting the Shift in the Goods Vehicle Travel Demand Curve 10.49 We are concerned about some aspects of the Department's practice for dealing with goods vehicle traffic in trunk road appraisal. As with non-home-based trips on employers' business, goods vehicle trips form a modest proportion of the total traffic but typically account for a much more significant proportion of the benefits/disbenefits. As noted in Chapter 9, the usual approach to forecasting is as follows:
• create a matrix of trips in the base year from roadside interview data;
• factor this by the growth in goods vehicle-kilometres given by the National Road Traffic Forecasts (DOT, 1989; DETR, 1997); and
• assume the resulting matrix of trips of the forecast year is inelastic to the changes in transport supply brought about by the scheme being appraised.

Transport and the economy: full report (SACTRA)
194
10.50 We think that this approach is seriously deficient in the following ways. The growth factors have two faults. First, they are national growth factors which are applied locally, whatever the local circumstances. Second, they are fundamentally flawed in that the factors relate to the growth in traffic and they are applied to a matrix of trips.
10.51 We recommend that the Department initiates research to develop better procedures for forecasting the growth in the demand for goods vehicle movements.
The Slope of the Supply Curve 10.52 We recognise that a properly specified congested assignment model is currently the best way of achieving a realistic representation of the road supply curve. It is generally accepted that the important features are that junctions are modelled explicitly and that the interactions between junctions are also represented realistically.
Finding the Point of Equilibrium between Demand and Supply 10.53 We are aware that the Department is currently researching this area and we support the initiative.
Modelling Reliability 10.54 The Department has explained to us its current work on developing guidance on how to estimate changes in reliability. Current work is focused on the increases in unreliability which are caused by incidents. While we support, in principle, the work being undertaken, we are concerned that unreliability stems from other causes, as well as from incidents. For example, as traffic flows increase, so smoothly flowing traffic conditions break down and queues propagate quite quickly upstream from the initial point of overload.
10.55 Also, certain kinds of traffic reduction mechanism will have quite different effects in terms of reliability. For example, measures to reduce or reallocate road capacity seem likely to increase unreliability for certain classes of vehicle (those not accorded priority) while improving reliability for other classes (those receiving priority). Measures which price demand off the network would have the opposite effect as they would generally reduce congestion levels. We note that traffic reduction measures are generally considered where conditions are congested and where unreliability is likely to be a key issue.
10.56 We recognise that the estimation of changes in reliability is a very difficult area, but we recommend that the Department takes a wider view of reliability and invests resources to develop appropriate techniques.
Modelling the Effects of Traffic Reduction Measures 10.57 In Chapter 7, we gave some brief ideas of the kinds of benefits and disbenefits which would arise from a selection of traffic reduction measures. Our view is that the appraisal process should be designed to assess and quantify all the significant sources of benefit and disbenefit. To amplify our point, we have listed in Appendix E the main benefits and disbenefits from four selected traffic reduction mechanisms:
• urban congestion charging;
• parking controls;
• road capacity reductions and roadspace reallocations; and
• motorway charging.

Transport and the economy: full report (SACTRA)
195
10.58 Drawing on the information presented in Appendix E and Chapter 7, we note the following points:
• the precise balance of benefits and disbenefits will vary with the type of the traffic reduction mechanism, the way in which it is implemented, and the specific context in which it operates;
• those mechanisms that work by charging provide some opportunities at least for redressing any adverse effects on local economies by recycling the net revenues into the affected areas; and
• some charging policies, such as urban congestion charging, would enable adverse effects on economies to be redressed better than others, such as motorway charging.
10.59 We recommend that, in considering any traffic reduction measure, the benefits and disbenefits are carefully identified, quantified and weighed to determine both the overall benefits and disbenefits as well as their distribution. Special attention should be given to identifying the areas whose economies may suffer as a result of the traffic reduction measure and to means of redressing the effects by recycling revenues in a targeted fashion.
10.60 At the end of Chapter 8, regarding the appraisal of traffic reduction policies, we highlighted the importance of ensuring that the model being used is fit for the purpose - that is, it represents all the main traveller responses likely to result from the mechanism being appraised. Significant strides have been taken in this general area in the last few years. If we consider the traffic reduction mechanisms discussed, we can point to the following.
10.61 Congestion charging. For the appraisal of congestion charging in London, a model called APRIL (Assessment of the Pricing of Roads in London) was developed (Bates et al, 1996). Our view is that this model is generally well-specified for the purpose, but we are concerned about the simplified treatment of both non-home-based trips, many of which are in the course of business, and goods vehicle trips. A later model, called TRAM (Traffic Restraint Analysis Model), has since been developed for the appraisal of congestion charging in Bristol (Bates et al, 1997). However, this suffers from similar general deficiencies in the treatment of goods vehicle and non-home-based trips.
10.62 Parking. TRAM was primarily developed for the appraisal of parking policies and has been applied to date in Bristol (MVA, 1997). This model represents a very significant step forward in the way parking is treated. The important points about modelling parking are that:
• the ease of finding a space at any one time requires the modelling of the history of parking throughout the day up to that point;
• all the main types of parking are distinguished (which is not normally the case in conventional transport models); and
• the trade-offs between parking charge, time spent searching for a space, and walk time to final destination are properly represented. However, for parking appraisals, the deficiencies in the treatment of goods vehicle and non-home-based trips are thought to be less serious than they are for congestion charging appraisal, as parking policies are generally aimed at commuters rather than business traffic.
10.63 Road capacity reductions or reallocations. Recent work by MVA (1998) for London Transport and DETR has provided advice on how these proposals should be modelled.
Transport and the economy: full report (SACTRA)
196
Interim procedures have been defined, pending completion of research into micro-time-shifting and variable demand modelling which the Department currently has in hand.
10.64 Motorway charging. We are aware that the Department has commissioned the TRL to undertake some appraisals of motorway charging and that these investigations are continuing (TRL, 1999).
10.65 We recommend that the Department reviews past practice in the appraisal of traffic reduction measures and issues advice on best practice for their modelling.
Issues relating to the estimation of transport benefits/disbenefits
10.66 For the reasons explained at the outset of Part Four, the report attaches great importance to the correct enumeration and valuation of the direct transport benefits/disbenefits of transport measures as an important and powerful indicator of the total economic impacts. Robust assessment of the direct impact on transport users, operators and infrastructure providers remains the cornerstone of economic assessment.
10.67 In this section, we discuss vehicle operating costs, values of time, the valuation of changes in travel time reliability, and the validity of the 'rule of a half'. Valuing safety benefits/disbenefits, though important, is not considered in this report.
Vehicle Operating Costs 10.68 There is relatively little to be said about the valuation of vehicle operating costs. Provided the engineering cost models are kept up to date, this is straightforward; however, it is some years since the Department reviewed its vehicle operating cost models. The use of variable demand models has placed renewed emphasis on the acceptability of the perceived cost and non-resource correction terms in the calculation.
10.69 We recommend that the Department reviews and updates as necessary the vehicle operating costs used for appraisal purposes.
Values Of Time 10.70 Travel time savings are the single most important component in the measured transport benefits/disbenefits of most schemes and policies. Hence the methods of valuing them critically affect the measurement of the economic impact of schemes.
10.71 In Chapter 3, the question of the GDP effects of transport schemes versus broader measures of economic performance was discussed. It is in the treatment of the valuation of travel time savings that the issues arising from this distinction become acute. In GDP narrowly measured, certain non-marketed services of value to consumers are not measured - these include household services, the services of unpaid carers, and the value of leisure in general. In valuing the benefits/disbenefits of road and transport changes, the convention used is to adopt a broad measure of economic performance including the value of non-marketed services. So values for travel time savings, whether in the course of employers' business, or commuting, or leisure time, are included in cost benefit analysis. We endorse this approach. The alternative of restricting the value of time savings to those which appeared within the GDP accounts is wrong in principle. It would also raise practical issues of the boundaries between those time savings which go through into the final prices and outputs of goods and services and factor inputs, and those which do not. The different social values of business and non-working time is reflected in the different money values attributed to these categories of time savings. There is enhanced public interest in broader social accounting measures of
Transport and the economy: full report (SACTRA)
197
economic welfare, and we would support the need for further research work on the economic valuation of non-market activities.
10.72 We endorse the following aspects of the Department's policy towards the valuation of travel time savings:
• the principle of valuing both time savings in case of employers' business (working time savings) and commuting and leisure time (non-working time savings) in monetary terms;
• the valuation of working time savings according to the wage rate of the relevant class of labour plus labour-related overheads;
• ensuring that any standard or average value of non-working time savings which is used is based securely on evidence from a range of empirical studies; and
• valuing all time savings and losses, large or small, at the same unit value.
10.73 The last two points merit further comment. It has been long-standing policy to apply a single standard value of non-working time savings to all such savings, irrespective of the values of the particular recipients of the benefits/disbenefits. Although this does create issues of consistency within appraisal, there are pragmatic arguments of data availability in its favour. Above all, however, the use of values differentiated by region and mode rather than a standard value would have significant equity implications. Such a proposal would therefore raise a mixture of technical, practical and political issues.
10.74 The treatment of small time savings is also a contentious issue. It is current practice that all time changes, both increases and decreases, whatever their size, are included in the appraisal.
10.75 Opponents of the practice argue that small time savings cannot be used for any useful purpose and should therefore have no value in appraisal; reliability is more important. It is also argued that, in congested conditions, small time savings can be easily eroded by induced traffic and by minor changes to traffic conditions, and are therefore discounted by drivers, and so are not significant.
10.76 Proponents argue along several lines. One line is that small time savings are valuable in just the same way as small money savings: observation of human behaviour in choosing travel routes or supermarket checkouts confirms this. A second line is that, although people build slack time into their schedules so that small savings or losses are absorbed within the slack, progressively over time, small savings or losses can aggregate to the point at which they become valuable. On average, across the population of users, there will always be a subset for whom a small time saving or loss tips them across a threshold. This raises an interesting analogy in personal travel with the arguments about freight travel put forward in Chapter 5 concerning the non-continuous or threshold effects in the organisation of logistics. Thirdly, and more pragmatically, a key requirement within appraisal is the ability to compare many alternative scheme designs, and to assess the contributions of individual elements to an overall strategy. If the unit value of time savings is not constant, the value of individual elements may depend upon the sequence in which they are considered, and may not sum to the overall strategy value. Like the Leitch Committee (ACTRA, 1977), we therefore endorse the constant unit time value approach.

Transport and the economy: full report (SACTRA)
198
10.77 Although we reject fundamentalist criticisms of the broad principles behind the UK approach to travel time valuation, we do have reservations about some aspects of current practice. The current values of travel time used in road appraisal are based on studies undertaken fifteen years ago. Many things have changed since then - incomes, tastes, travel costs, analysis methods, experimental design. We do not think it is satisfactory that current appraisal values should be relying on such old research work. The Department commissioned a further suite of Value of Travel Time studies (Accent Marketing & Research and Hague Consulting Group, 1994; 1996) in the early 1990s (although we have not considered that report as a Committee). We understand that some of the findings are controversial and that the Department is considering whether or not to accept these new results.
10.78 Deriving from our deliberations set out in earlier in this report, we think that there are a number of issues relating to the value of time which need consideration by the Department. These issues are centrally concerned with the value of time saved by business and non-business traffic and by freight traffic, with the aim of ensuring that the impacts on the economy of a transport intervention are properly valued.
10.79 We recommend that the Department audit and update its current practice in relation to the values of time used in appraisal, including the following issues:
• the values of employers' business time savings, including wage-related overheads;
• the value of time savings for the freight carried by goods vehicles (as opposed to the value of the time savings of vehicles and driver) - this could usefully be addressed within the Department's programme of logistics research;
• the acceptability of continuing to use a standard value of non-work time savings for all locations and modes within the context of the NATA;
• if accepted, the appropriate up-to-date standard appraisal value of non-working time savings;
• the boundaries between work and non-work time, and the practice of attaching the same unit value to all non-work savings regardless of journey purpose;
• the significance to the economy of journeys currently classified as 'leisure' (such as those involved with caring for relatives); and
• the assumed elasticity of the value of time with respect to income.
Valuation of Changes in Travel Time Reliability 10.80 There is an entry in the NATA Appraisal Summary Table (explained in Chapter 9) for journey time reliability. This raises both modelling issues (see above) and valuation issues. It is clear that a range of policy interventions in the road network - for example, variable speed limits and other traffic calming measures, provision of traveller information, reallocation of road space to give priority to buses - are designed to reduce travel time variability and thereby achieve greater dependability and certainty of arrival time. Whereas it has been reasonable in the past to assume that the travel time savings calculated for road schemes were correlated with improved reliability, the range of policies now being planned by the Highways Agency may yield reliability benefits with little or no average travel time savings.
10.81 Currently, the reliability benefits are incorporated into the appraisal by means of crude proxy indicators such as changes in highway stress levels and qualitative assessment of their likely significance. The Department acknowledges that this is only a first step and that there

Transport and the economy: full report (SACTRA)
199
is a need to move forward both in the modelling and in the valuation of reliability benefits. This implies deriving the values of the variance of travel times as well as the mean. This would allow, for example, a proper appraisal of the benefits to bus passengers of a set of bus priority measures which reduces the variance of travel time on an average 20 minute journey by three minutes.
10.82 We recommend that the Department revisits the work on the valuation aspects of reliability undertaken in the past by Bates, Pells and others in the 1980s, and issues advice on the valuation of reliability.
10.83 It is likely that these reliability benefits are of particular significance for commerce and industry. Journeys which are undertaken with scheduled arrival times mean that the schedule must be drawn up, not in relation to the average journey time, but in relation to what can be achieved on a high proportion - say 90, 95 or 99 per cent - of occasions. Policy interventions which cut off the tail of very bad journey times, or at least make possible closer advance prediction of them, are likely to be of particular worth to high value activities such as business travel and just-in-time physical distribution. An ability to model and evaluate these benefits properly would make the appraisal regime much more relevant to the range of policies under consideration by the Government and the Highways Agency.
10.84 The Department has told us in evidence that, on the basis of research previously undertaken for it, "by ignoring travel time variability, the economic benefits of (trunk road) schemes are likely to be underestimated by 5% to 50%", and that they have commissioned research to investigate the robustness of the upper bound which is expected to lead to Departmental advice on the topic.
10.85 There is also the question of the impact of unreliability on the magnitude of stock inventories held by firms. This raises even more difficult questions for appraisal, such as the value of the resources consumed by the extra inventory held to cover unreliability in the transport system.
10.86 We agree with the Department that the potential magnitude of the reliability benefits warrants further work, both on methods of predicting changes in variability for different types of policy interventions, and on valuing the resulting benefits. We recommend that the Department gives this area some priority.
Validity of the Rule of a Half 10.87 One last point here concerns the so-called 'rule of a half' used to calculate benefits/disbenefits in the cost benefit analysis. The point was made in Chapter 9 that the rule of a half assumes that the demand curve is linear over the section being used to estimate changes in demand and cost. This is generally satisfactory for the levels of change normally brought about by new infrastructure projects. However, for measures which can result in large changes in demand, such as some traffic reduction measures, the rule of a half can lead to significant errors.
10.88 We recommend that the Department issues advice on the correct estimation of transport benefits/disbenefits under conditions of substantially changed demand.
Transport and the economy: full report (SACTRA)
200
Appraisal Requirement 2B: What are the Total Economic Impacts of the Intervention?
10.89 We need to be clear about our terminology here. By 'total' economic impacts, we mean the 'transport' benefits/disbenefits derived from the transport market plus any 'wider' benefits/disbenefits arising from impacts in both intermediate and final output markets due to an intervention in an input market.
10.90 The state of the art of assessing the total economic impacts of transport projects and policies is not well developed and lacks standardisation. Whereas the Design Manual for Roads and Bridges (Highways Agency et al) lays down ground rules for assessing transport and environmental impacts of schemes, there are no equivalent ground rules for the assessment of total economic impacts. It is therefore not altogether surprising that no common approach to the problem exists. Methods vary as to their focus on the behaviour of developers or final users, a range exists from very informal to highly formalised approaches, and the position on double-counting between the transport benefit and the total economic impacts is opaque. Nor do all studies focus on the question of particular interest to central Government, namely, the total economic impacts of the scheme and policy from a national perspective. This is because the commissioning agents of some studies are local government or economic development agencies rather than national Government.
10.91 The conclusion which we reached is that there are two possible ways forward. One is to confirm the judgement of the Leitch Committee twenty years ago (ACTRA, 1977) that the wider economic impacts are elusive, difficult to measure, subject to double-counting, and should therefore be omitted from the assessment of schemes except where there is an overwhelming case for including them. The alternative is to move towards a much more careful and codified approach to the assessment of these impacts, recognising that they can be negative as well as positive.
10.92 The first option has some attractions. It is low cost, and it encourages the Department to focus on measuring the direct transport and environmental impacts, which are important. But it also has weaknesses - it fails to help Ministers quantify the impacts of schemes on economic competitiveness, and it fails to improve upon the regeneration indicator which is currently used in the New Approach To Appraisal (GNATA - DETR, 1998b). It is also widely believed that many transport benefits/disbenefits are in fact transmitted, by the mechanisms discussed earlier in the report, into impacts which may accrue to different economic agents, or different locations, from the initial beneficiaries - and that this might matter for policy (strictly, a matter for Appraisal Requirement 3, which we come to later). Moreover, we have collected evidence which suggests that there are substantial differences in price/cost margins in a number of key sectors which are significant users of transport and that these differ significantly from unity. This gives clear evidence that there could be cases where the impact of a particular scheme would have significant impacts on the wider economy. We therefore concluded that we should explore two possible ways of improving on the status quo. One approach, for schemes and policies of regional or national importance, would be to make greater use of formal modelling approaches. The other, more appropriate at the scheme level, would be to produce a codified approach to the qualitative assessment of wider economic impacts.
10.93 We now discuss these two possibilities in more depth in the following way:
Transport and the economy: full report (SACTRA)
201
• first, we discuss formal modelling approaches, generally applicable to area-wide appraisals - macro-models of transport and the economy, land-use/transport interaction models, and computable general equilibrium models;
• second, we discuss the estimation of benefits/disbenefits at the individual scheme level where formal modelling approaches are generally not appropriate (except in the case of very large projects such as the Channel Tunnel).
Formal modelling approaches for area-wide appraisals
10.94 Models are attempts to represent the relationships within a system (such as an economic or activity system) in a coherent and quantified manner. As such, modelling approaches start out with a great potential strength - they provide a means of quantifying the relationships between transport improvements and final economic activity via the linking mechanisms, represented for example through the effects of changes in accessibility on the product, labour and property markets, disaggregated by location.
10.95 At the risk of simplification, there are three relevant modelling traditions. Two of these concentrate on the behaviour of individual economic agents, albeit often aggregated into flows, the third adopts a much more macro approach to the link between the transport system and the economy. We look briefly at this macro approach before looking in more detail at the two key individual based approaches.
10.96 The macro approach has been discussed in detail in Chapter 4 and Chapter 5. It embraces both the highly aggregated production function-based models following Aschauer's work (1989) and the more detailed attempts to link aggregate transport models to standard macroeconomic models. In Chapter 4, we have already concluded that the highly aggregated production function-based model is of extremely limited use in understanding the linkages between transport and the economy, and we see no role for this in the appraisal process. We are not yet convinced that the alternative approach (linking aggregate transport models to standard macroeconomic models) can be implemented in such a way as to provide an immediate solution to the modelling and appraisal problem, but feel that it may offer some scope for further development in considering the impact of regional or national level policies.
10.97 The approach has been developed furthest in a series of studies conducted by the Centre for Economics and Business Research (CEBR, 1993; 1994; European Commission, 1997) as discussed in Chapter 5. The essence of the approach is to try and capture the impact of improvements in the transport sector in a single economic variable which can be input into a standard macroeconomic model. This is typically done by estimating the time savings from a network improvement and treating these as productivity gains which impact on both wage rates and employment levels through the labour market. We believe the underlying hypothesis is of interest, but not yet developed sufficiently robustly to provide a sound basis for appraisal. The model is typically not spatially differentiated so does not easily predict where such impacts will be felt. We have already recommended that some further research be undertaken into the underlying labour market links between transport time savings, wages and employment (see paragraph 5.131).
10.98 We understand that some further work at the European level is currently being undertaken in the ASTRA project (IWW et al, 1998). This aims to provide links between transport network models, regional economic models of the type discussed below, and standard macroeconomic models (such as the EU's QUEST model), but bringing them together (with an environmental model) in a systems dynamics framework which models explicitly the critical inter-relationships between the various modules.

Transport and the economy: full report (SACTRA)
202
10.99 Of the two approaches based more on the actions of individual economic agents, the older one focuses on the interactions between economic units (producers, consumers, etc.) located in specific places (zones) and on the effects of changes in the transport costs (impedance) between these zones. This type of model, generally referred to as the spatial interaction model, forms the basis of the land-use/transport interaction (LUTI) model. The newer model, which has its origins in economic models of trade, is that of the computable general equilibrium model, of which the Venables and Gasoriek model described earlier is an example. These models take spatially differentiated firms and markets, rather than places, as the basic units of analysis.
10.100 The state of the art of land-use/transport interaction modelling is an important issue for SACTRA. Are such models useful assessment tools? Do they have the potential to be useful aids, and in what policy contexts? Are they intelligible and do their results command confidence? We thought it was important to commission a review from two leading exponents in the UK, David Simmonds and Ian Williams (David Simmonds Consultancy, 1998), and then to subject their report to peer review. Much of what follows are key points from the report, and our assessment of the position on those points.
10.101 The starting point is the economy/activity/transport flow diagram shown in Figure 5.4. This diagram is an extensive representation of the five markets shown in the central column of that figure. The outcome of these market processes, and the interactions between them, are determined by the behaviour of the key agents - investors, residents, producers, property developers and transport suppliers. Each agent group has key decisions to make, some requiring transport - for example, residents choose where to live, whether and where to work, how much to spend/save, how much training to acquire, how to allocate time between leisure activities, and so on. The price, quality and availability of transport will influence some or all of these decisions.
10.102 Since the diagram in Chapter 5 is, in principle, a comprehensive representation of the spatial economy, involving many possible interactions, it follows that a degree of selectivity and simplification is required in order to build an operational model. Differences between models involve one or more of the following:
• different decisions about which relationships are important and need to be incorporated within the model;
• differences in the coefficients or elasticities or functional forms by which particular relationships are represented;
• differences in the equilibration rules which are followed - in particular, whether the model is of comparative static or dynamic form;
• differences in the outputs of the model, including the benefit indicators which are used; and
• differences in the level of spatial resolution at which the model operates.
10.103 It is also worth saying that different modelling contexts face the modeller with different challenges, so that the framework needs to be adaptable according to the circumstances. In an urban context, for example, when predicting the likely response to a programme of works by a development corporation, the emphasis is on representing the attractiveness and accessibility of the development area relative to the competing locations. In a regional, sub-regional or city-wide application, there will be less emphasis on the
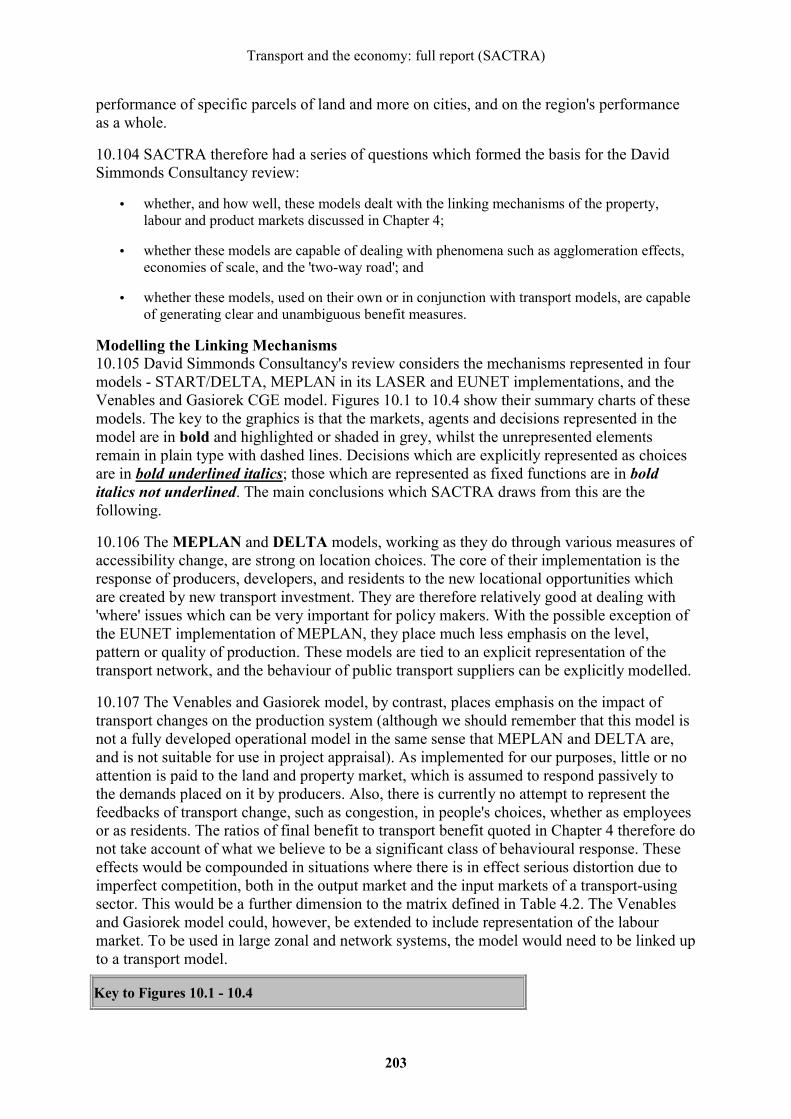
Transport and the economy: full report (SACTRA)
203
performance of specific parcels of land and more on cities, and on the region's performance as a whole.
10.104 SACTRA therefore had a series of questions which formed the basis for the David Simmonds Consultancy review:
• whether, and how well, these models dealt with the linking mechanisms of the property, labour and product markets discussed in Chapter 4;
• whether these models are capable of dealing with phenomena such as agglomeration effects, economies of scale, and the 'two-way road'; and
• whether these models, used on their own or in conjunction with transport models, are capable of generating clear and unambiguous benefit measures.
Modelling the Linking Mechanisms 10.105 David Simmonds Consultancy's review considers the mechanisms represented in four models - START/DELTA, MEPLAN in its LASER and EUNET implementations, and the Venables and Gasiorek CGE model. Figures 10.1 to 10.4 show their summary charts of these models. The key to the graphics is that the markets, agents and decisions represented in the model are in bold and highlighted or shaded in grey, whilst the unrepresented elements remain in plain type with dashed lines. Decisions which are explicitly represented as choices are in bold underlined italics; those which are represented as fixed functions are in bold italics not underlined. The main conclusions which SACTRA draws from this are the following.
10.106 The MEPLAN and DELTA models, working as they do through various measures of accessibility change, are strong on location choices. The core of their implementation is the response of producers, developers, and residents to the new locational opportunities which are created by new transport investment. They are therefore relatively good at dealing with 'where' issues which can be very important for policy makers. With the possible exception of the EUNET implementation of MEPLAN, they place much less emphasis on the level, pattern or quality of production. These models are tied to an explicit representation of the transport network, and the behaviour of public transport suppliers can be explicitly modelled.
10.107 The Venables and Gasiorek model, by contrast, places emphasis on the impact of transport changes on the production system (although we should remember that this model is not a fully developed operational model in the same sense that MEPLAN and DELTA are, and is not suitable for use in project appraisal). As implemented for our purposes, little or no attention is paid to the land and property market, which is assumed to respond passively to the demands placed on it by producers. Also, there is currently no attempt to represent the feedbacks of transport change, such as congestion, in people's choices, whether as employees or as residents. The ratios of final benefit to transport benefit quoted in Chapter 4 therefore do not take account of what we believe to be a significant class of behavioural response. These effects would be compounded in situations where there is in effect serious distortion due to imperfect competition, both in the output market and the input markets of a transport-using sector. This would be a further dimension to the matrix defined in Table 4.2. The Venables and Gasiorek model could, however, be extended to include representation of the labour market. To be used in large zonal and network systems, the model would need to be linked up to a transport model.
Key to Figures 10.1 - 10.4
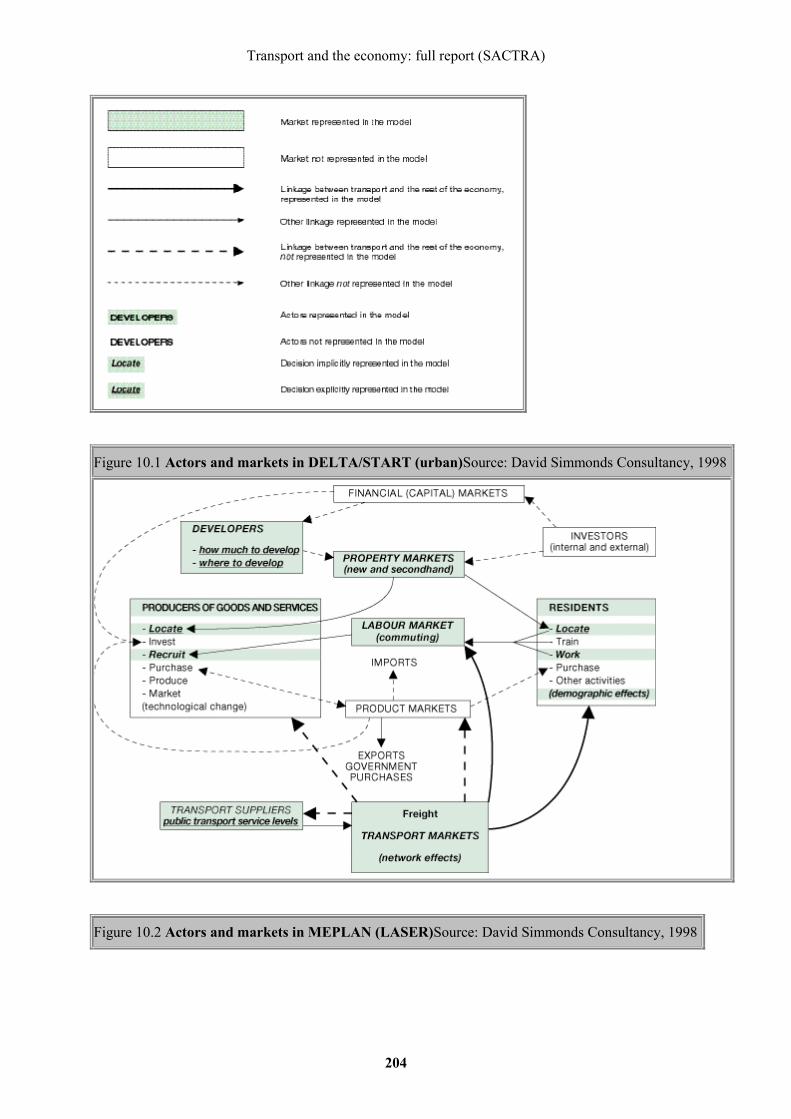
Transport and the economy: full report (SACTRA)
204
Figure 10.1 Actors and markets in DELTA/START (urban)Source: David Simmonds Consultancy, 1998
Figure 10.2 Actors and markets in MEPLAN (LASER)Source: David Simmonds Consultancy, 1998
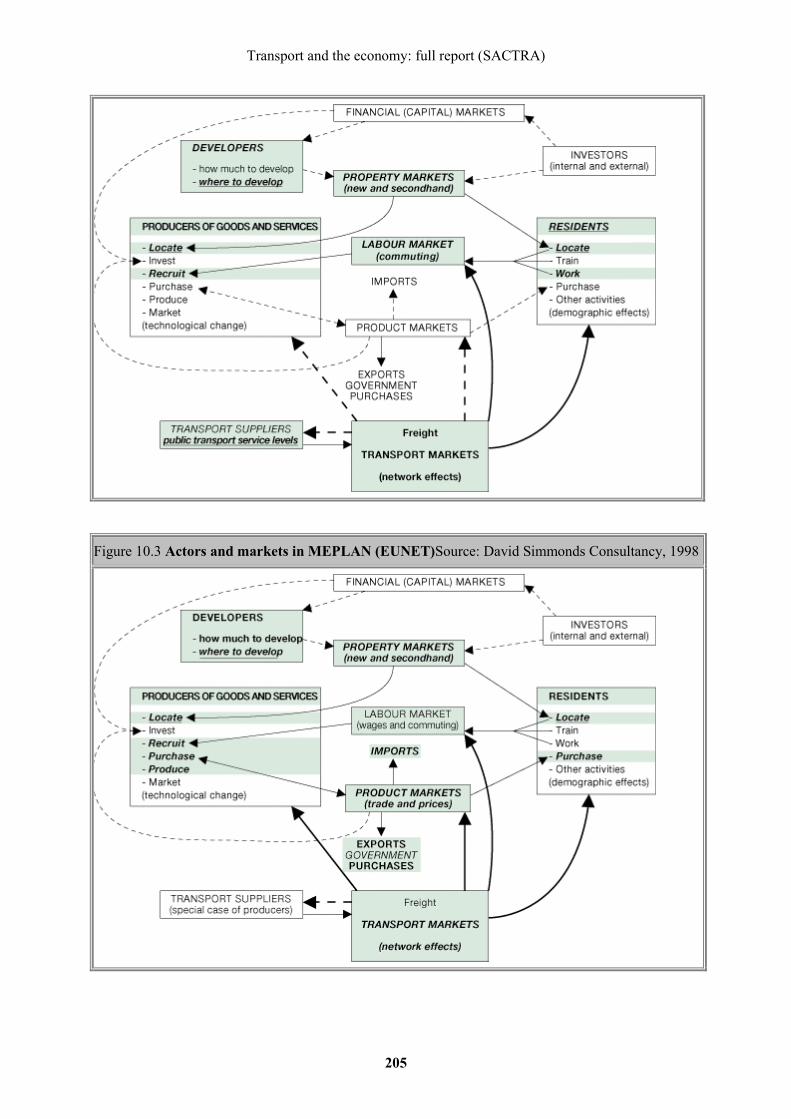
Transport and the economy: full report (SACTRA)
205
Figure 10.3 Actors and markets in MEPLAN (EUNET)Source: David Simmonds Consultancy, 1998

Transport and the economy: full report (SACTRA)
206
Figure 10.4 Actors and markets in Venables and GasiorekSource: David Simmonds Consultancy, 1998
10.108 None of the models gives explicit attention to the process of investors' choices. Capital is assumed to be freely mobile and to migrate to the places where rates of return are best. We consider this to be an acceptable simplification, although there are certain classes of decision (eg, location of government offices) which are not made in this way. However, only unusually would such decisions be linked to or influenced by transport investment decisions.
10.109 Finally, the models are to a degree, flexible, being capable of modification in structure according to the problem being tackled. David Simmonds Consultancy points out that some of the apparent differences between the LUTI models and the Venables and Gasiorek model are in fact due to the different contexts in which they are applied, " ... in particular, most land-use models have been applied at the urban scale where passenger rather than freight traffic is the main problem. For this reason, the concentration is on the markets for land, transport and service industries rather than manufacturing industries.".
10.110 Having discussed whether particular relationships are present in LUTI models, a deeper question is how well these relationships are represented. This is mainly an issue of empirical evidence rather than model capability. No model is capable of complete validation; all models rely on untested but arguably plausible assumptions, and especially in this type of application, modellers rely on often incomplete or inadequate evidence with which to work.
10.111 The critical issue for the impact of transport projects/policies on the economy is the treatment of the key linking mechanisms. If these channels are assumed to be blocked, then the impacts will stop in the transport market; if they are open, they will flow through into the wider economy.
Transport and the economy: full report (SACTRA)
207
10.112 In the labour market, an important question is whether traveller benefits/disbenefits for commuters are assumed to be passed on partly or wholly to employers in the form of lower real wages or higher quality for a given real wage. This is the wage equation issue discussed in Chapter 5 (paragraph 5.29 et seq). The David Simmonds Consultancy report concludes that there is not a uniform approach to this across models. In some cases, this mechanism is not included; in others, the benefits/disbenefits can be assumed to accrue partially or wholly to the employer.
10.113 In the land market, one of the mechanisms identified in evidence was the 'unlocking' effect when parcels of land become available as a result of building a new transport link. Here the LUTI models are capable of representing the impact of enhanced accessibility on activities already existing in particular zones. But they do not generally work well when the zone contains no existing floorspace of a particular kind.
Representing the Phenomena 10.114 A key difference between the Venables and Gasoriek model and the LUTI models is the focus of the former on imperfect competition and increasing returns to scale. We therefore asked David Simmonds Consultancy whether LUTI models were capable of handling scale economies in production and distribution, and the resulting relocation/concentration/ agglomeration effects in response to transport improvements. They report that relocation effects are certainly handled in many of the existing models, together with agglomeration responses in the service and retail sectors. Most of the models operate by redistributing production and employment among zones rather than by directly generating productivity gains. Scale economies do not appear to be explicitly included in existing models. They conclude that this is an area in which the existing models could be greatly improved by bringing in elements from the Venables and Gasiorek approach. However, the big challenge lies with collecting the data, not the lack of a suitable package with which to model them.
10.115 It follows from the above that LUTI models are capable of representing the fact that in some circumstances transport schemes may bring added economic benefits to an area, while in other circumstances the opposite may occur - the two-way road argument. This behaviour is embedded in the relationships of many of the existing models when representing the zone growth or decline of the use of retail and other services catering for a local market. The inclusion of economies of scale in production would further strengthen this representation.
10.116 A further issue is whether LUTI models are capable of representing net additional economic activity as opposed to displacement of economic activity and jobs. With one exception (the EUNET application of the MEPLAN model), the models reviewed by David Simmonds Consultancy take aggregate economic activity in the area as a whole as fixed and concentrate on the benefits/disbenefits arising from the redistribution/displacement of that activity. For that reason, the use of a 'large' study area relative to the area of policy interest is recommended. Similarly, LUTI models will show changes in the distribution of jobs between zones, but the simplified assumptions concerning total output, economies of scale and the wage equation rule out some of the responses which would trigger changes (positive or negative) in aggregate employment.
10.117 An additional point is that gains in employment in a particular area cannot be assumed to map simply on to reductions in unemployment in that area, because part of the employment gains may be met from migration. We are unclear how LUTI models deal with

Transport and the economy: full report (SACTRA)
208
differential labour quality in forecasting the balance between take-up of existing labour and net in-migration. This issue can be important for policy-makers in a regeneration context.
Computation of Benefit Measures from Land-Use/Transport Interaction Models 10.118 This is a technical issue, but an important one. If they are to be used for the assessment of transport policies/projects, LUTI models must be capable of generating consistent measures of benefit preferably with an assignment of those benefits/disbenefits between the groups of agents in the figures above (producers, consumers, residents, developers, transporters, investors, etc.). Otherwise one cannot move from prediction to assessment of the forecast outcome.
10.119 In their report, David Simmonds Consultancy list six requirements which need to be satisfied:
• the model should contain an appropriate representation of behavioural response in the land-use and transport sectors;
• it should adopt an adequate level of segmentation;
• the strength/elasticity of each behavioural response should be calibrated;
• the model should respond to money and non-money impacts such as time;
• the model should link together the full set of behaviour responses in a way that reflects their real world interrelatedness; and
• the responses should be represented in incremental form starting from the base situation.
10.120 These requirements are onerous, and most models, including transport models, would fall on many of these hurdles. However, if they can be met to an acceptable extent, then procedures for computing benefit measures can be put in place. Versions of these have been known in principle for many years (Neuburger, 1971; Williams, 1977) but operationalising them in comprehensive land-use models is in its infancy.
10.121 There are two areas of difficulty, one relating to modelling and one relating to appraisal. Clearly, a regional model with variable land-use will not be expected to predict the same level of benefits/disbenefits from a given transport initiative as with land-use fixed. Just as the net benefits under variable trip matrices may be either higher or lower than those under fixed trip matrices, so too will net benefits be different under fixed and variable land-use. This means that the elasticity values which drive the land demand and supply functions at all locations are potentially important as are the feedback effects and interactions between zonal accessibility and zonal attractiveness. But these parameters are also difficult to determine.
10.122 The main issue, however, concerns the consistency between the measure of benefit which can be obtained from the transport model under variable land-use with the benefit measure from the land-use model. The classical view is that the benefits/disbenefits derived from transport investments are identical whether they are measured in the transport or in the land market, that is, that any changes in land rents are pure transfers and are not additional to the transport benefits/disbenefits. Therefore, the aggregate benefit should be equal whether measured as benefits/disbenefits to transport users or as the sum of benefits/disbenefits to land owners and users.
10.123 The paper by Jara-Diaz (1986) referred to in Chapter 3 argues that this equivalence only holds under conditions of perfect competition. A recent paper by Martinez and Araya

Transport and the economy: full report (SACTRA)
209
(1998) concludes similarly that the two measures will be equal only under "certain very restricted circumstances" and that the land-use measure of benefit is the more appropriate to use. It is clear that imperfections in the transport-using sectors and in the market for land would be sufficient to breach these 'restricted circumstances'.
10.124 There is, therefore, a conflict. On the one hand, it appears that economic appraisal of transport projects where there are imperfectly competitive markets will require benefits/disbenefits to be calculated after allowing for land-use effects. This is because it needs to take into account the changes in output and organisation of production both directly and indirectly resulting from the transport change. Such changes will have their most direct impact on land-use. The expectation is that, subject to assumptions about the degree of imperfect competition in the land and property markets, changes in the level of benefit experienced by firms will be reflected in the changing value of the use of land. The degree of imperfect competition in the transport-using sectors does, however, break the direct link conventionally assumed to exist between the direct transport benefits/disbenefits and changing land values or rents. This suggests the benefits/disbenefits should be computed from a land-use model which can allow for such factors. On the other hand, however, there is considerably more experience in obtaining benefit measures from the transport model. The danger in moving to a land-use model basis is that we give up a rigorous and tested procedure, but one which may introduce certain biases, for an unknown procedure which needs further development and so far has proved difficult to implement in practice.
10.125 In response to questions from the Committee, Williams explained that some progress has been made with the use of MEPLAN to provide an estimate of the total economic impacts. This uses the 'compensating variation' approach to valuing changes in economic welfare by calculating the income equivalent to the amount of utility which would have to be taken from/given to recipients so as to leave them no worse or better off than before the change being evaluated. This is clearly the correct approach to the measurement of the economic value of the change, but we remain sceptical about how wide a definition of change has been allowed for in the application of such models. The calculation of all the benefits/disbenefits in this way has not yet been operationalised.
10.126 Simmonds acknowledged that the calculation of the total economic benefit using DELTA (with any transport model) would be difficult and had not yet been developed. The difficulties stem from the model's approach, in which some responses to changes in transport are captured immediately in the transport model and others are captured gradually in the land-use model. Thus, DELTA's strengths in providing a more realistic model of changes over time are a weakness in relation to existing methods of economic appraisal, because the latter are applicable only to systems in equilibrium and not to situations of continuing change.
10.127 Both Simmonds and Williams explained to the Committee that the main interest of their clients in the past had been on what the models could say about impacts and their disposition, with little or no interest being shown in monetised benefits/disbenefits in the formal sense of a cost benefit analysis. Thus, they both took the view that the estimation of benefits/disbenefits using LUTI models was an under-researched area and that with more resources progress could be made.
Discussion
10.128 In order to help us assess the David Simmonds Consultancy report, we sought commentaries from a number of experts, though with differing backgrounds, experiences and

Transport and the economy: full report (SACTRA)
210
perspectives. Our assessment of the relevance of LUTI models to the assessment of the wider economic impacts of transport projects and policies is as follows.
10.129 LUTI models do provide a coherent framework within which to assess the economic impacts of transport projects and policies. They provide a basis for quantifying the transport change - accessibility - land-use change systems within a model framework, therefore enabling extravagant claims to be scrutinised. This is a very important plus point.
10.130 But a number of the questions raised by SACTRA seem to us to drive the modellers close to the present limits of their art.
10.131 Labour market. It appears to us that an important question in relation both to projects (such as Crossrail, etc.) and policies (such as road pricing, etc.) is the way in which the transport change impacts on employees and employers, the so-called wage equation issue. This we see as a critical question where more empirical research is required, regardless of the modelling framework used.
10.132 Property market. The representation of the land market is adequate as long as one is dealing with relatively continuous functions. If the impact of a project is to enhance the accessibility of a zone with vacant land, resulting in increased economic activity of similar kinds to the pre-existing activity, the model is capable of handling this adequately. However, the zone-based land-use/transport interaction models we have considered will not deal effectively with responses that relate to individual sites (such as the planning authority allowing development which, in the absence of the project, they would have rejected on traffic impact grounds) or to the possibility of very major developments (such as Canary Wharf and regional shopping centres) which can significantly change the structure of the whole area.
10.133 Product market. The LUTI models do not have a strong tradition of incorporating product differentiation, agglomeration effects and scale economies in their systems. What they tend to do, rather, is to redistribute production and employment among zones, which is why David Simmonds Consultancy recommends the use of a large study area relative to the target area in question. We think that incorporating scale economies in production into LUTI models poses significant conceptual, empirical and practical challenges.
10.134 At the 'competitiveness' end of our brief, the issues are very often whether infrastructure investment or transport policy will consolidate firms in their existing locations, or encourage reorganisation or restructuring. For this type of question, the spatially differentiated production model seems to us to be inherently attractive. Given that the basic units in the LUTI models are zones with mixes of economic activity, we remain unclear how this type of effect can be satisfactorily incorporated within these models. To some extent, it may be possible to increase the degree of segmentation, so that more sectors of economic activity are treated individually, but we doubt that it will be feasible to treat firms individually other than perhaps the very large ones.
10.135 This causes us to think that a range of approaches is likely to be useful according to the questions which are being asked.
10.136 Suppose the questions are at the most strategic level, and are ones where the location of economic activity is not critical for example, "what will be the impact on the competitiveness of the UK economy within Europe of various alternative transport scenarios?". Here we would favour a model representing the interaction between transport

Transport and the economy: full report (SACTRA)
211
and the economy, perhaps of the CGE style, and sacrificing spatial representation. In principle, it would be useful to extend a CGE style model to include a model of the transport system. However, some issues of practicality arise. We have argued in Chapter 4 that the Venables and Gasoriek approach is most useful at the large regional or national level. Assuming that the data are available to support such a model, the adoption of such a large area would pose particular problems for transport modelling. Application of the approach to England would encounter the twin difficulties of lack of input/output data and a suitable national transport model. However, we believe that suitable data are available for Scotland for the Venables and Gasoriek model. We are also aware that a multi-modal transport model, called the 'Central Scotland Transport Model', exists and is owned by The Scottish Executive, which in fact covers much of Scotland. It seems possible that this model could be extended relatively simply to cover the whole of Scotland in a manner that would make it suitable for linking with a CGE model. (See paragraph 5.106.)
10.137 We recommend that the Department considers setting up a computable general equilibrium (CGE) model of the type developed by Venables and Gasiorek for Scotland. This should be used in tandem with an extended Central Scotland Transport Model with the aim of further understanding what the CGE approach has to offer for appraisal in a real life context in the UK. This will obviously require the co-operation and support of The Scottish Executive.
10.138 Suppose, however, that the emphasis is on the economic impact of a major piece of transport infrastructure such as the Mersey Crossing, or on the impact of a road pricing system on economic activity within a city. Then a land-use/transport interaction model would be more suitable. However, as noted above, adequate representation of the three key markets within these models requires further model development and, just as importantly, further empirical research on the economic functions which drive them.
10.139 The conclusion we have reached on the basis of the evidence is that the interaction between transport, land-use and the economy is likely to become an increasingly important issue for public policy. It is an issue for which the methodological tools are in need of development and for which empirical questions need to be resolved. It is clear to us that both the CGE approach and the LUTI models need to be taken forward (as suggested in Chapter 4 and Chapter 5 in the case of the former and below in the case of the latter); they are to a degree complementary, and each has its potential role.
10.140 The role of land-use/transport interaction models in the multi-modal studies currently being embarked upon by the Department is an urgent issue. We think that the Department needs to undertake an audit to determine what is the capability of the available models for the contexts in which they might be used, and then that the Department needs to consider the case for investment in model development. We are also concerned that the Department has very few trained personnel with operational knowledge of these models at a time when interaction between transport and location of economic activities is a live issue in the strategic policy context. As noted at the beginning of Chapter 9, the Department has commissioned the development of guidance on the methods to be adopted in the multi-modal studies and this will include some advice on the role of LUTI models.
10.141 This leaves, however, the problem of appraising the individual highway or public transport scheme, where David Simmonds Consultancy concludes that "these are generally of a size and cost that does not merit the development of a large scale model, even of traffic alone.". So unless a regional LUTI model happened to be available and even then there are

Transport and the economy: full report (SACTRA)
212
reservations the formal model does not seem to be the answer to the problem of assessing wider economic impacts at the scheme level.
10.142 In summary, we consider that land-use/transport interaction models have a potentially important role to play in meeting Appraisal Requirement 2b, in some circumstances. We are aware that the Department has commissioned several appraisals of transport projects using the LASER application of MEPLAN in South-East England. These appraisals include congestion charging in London and new Thames crossings east of London. We understand that a detailed review of this application has also been carried out for the Department. We are also aware that the Department is a part sponsor of both the EUNET application of MEPLAN in the Trans-Pennine Corridor, and the START/DELTA applications in both Greater Manchester and the Trans-Pennine Corridor. The Department therefore has access to a considerable amount of information about the performance of the current generation of land-use/transport interaction models.
10.143 We recommend that the Department:
• pulls together its knowledge about land-use/transport interaction models as applied in this country and elsewhere in the world;
• considers its stance about the usefulness of land-use/transport interaction models;
and, on the assumption that the Department will share our views that these models have a role:
• instigates a programme of research and development designed to improve their treatment of the different markets influenced by transport, including an investigation into methods of extracting measures of total economic benefit;
• issues advice on the circumstances in which they should be used and practical guidance on their application to the appraisal of transport proposals; and
• considers arrangements for training some of the Department's staff in the theory and use of these models.
10.144 While the outcome of this research may be one way of meeting Appraisal Requirement 2b, the need to meet Appraisal Requirement 2a should not be overlooked. This means that, in addition to an estimate of the total economic impacts, such as might be derived from using a land-use/transport interaction model, appraisers would still have to derive an estimate of the transport benefits/disbenefits. We note that, in principle, this is likely to be easier with the linked land-use and transport models than with the integrated land-use and transport models. In the former type, the transport and land-use elements are separate and are run iteratively, while in the latter type the land-use and some of the transport modelling elements, notably trip distribution, are intertwined and not separable. Thus, while it is possible to run the transport element of a linked LUTI model alone to derive an estimate of transport benefits/disbenefits, it is not so easy to achieve the same end with an integrated LUTI model. Usually, only parts of the transport model can be disentangled from the land-use elements, with the result that the transport benefits/disbenefits which result are based on an incomplete set of traveller responses.
10.145 Out of this comes the following broad conclusion:
• the integrated LUTI models offer more hope than the linked models that an estimate of the total economic benefit can be derived in a rigorous and satisfactory manner; but

Transport and the economy: full report (SACTRA)
213
• the linked LUTI models offer more flexibility than the integrated models so that an estimate of the transport benefits/disbenefits can be derived from the transport elements of the model alone.
10.146 We recommend the Department builds on the research recommendations in Chapter 5 for the further development of LUTI models, to examine in more detail whether it is feasible to derive robust estimates of total economic impacts as well as transport benefits/disbenefits from the same land-use/transport interaction modelling system.
10.147 Even if progress can be made towards resolving some of the problems with land-use/transport interaction models, we are clear that they are only likely to be suitable for assessing strategic policies or very large projects. For the general run of transport infrastructure projects, a different approach is needed. In essence, this involves estimating the benefits/disbenefits, which are additional to the transport benefits/disbenefits, rather than trying to make two separate estimates of benefit/disbenefit, one of the transport (Appraisal Requirement 2a) and one of the total benefits/disbenefits (Appraisal Requirement 2b). Thus, Appraisal Requirement 2b to estimate the total economic impacts would be met by adding the additional benefits/disbenefits to the transport benefits/disbenefits derived under Appraisal Requirement 2a.
Estimating the benefits/disbenefits additional to the transport benefits/disbenefits at the scheme level
10.148 Now we turn to scheme-level appraisals where formal modelling approaches are unlikely to be appropriate (except for very large projects such as the Channel Tunnel). We start by taking stock of the position. We then go on to consider the various categories of effect reorganisation effects, output effects, imperfect product market effects, imperfect factor market effects, and dynamic interactions and discuss all of these in some detail except the last.
10.149 So far, we have established that in a notional all-round perfectly competitive economy, the measured transport benefits/disbenefits flow through into lower prices of goods and lower travel costs for consumers. Relative to a 'correct' transport cost benefit analysis, there are no net additional wider economic impacts in this case. Therefore, such additional benefits/disbenefits can only come either in the case where the transport CBA is 'incorrect' or 'incomplete' in relation to CBA* or in the case where there are market imperfections and the perfect competition assumptions do not hold.
10.150 In Chapter 4, we used the Venables and Gasiorek model to give some illustrative indication of the economic impacts, additional to the measured transport benefits/disbenefits, due to market imperfections in the transport-using sector. The ratio of total net benefits to transport net benefits shows considerable variation as assumptions about competitive conditions in the transport-using sector are varied. On average, the ratio appears unlikely to differ from unity by a very large margin, but there is sufficient variance, and sufficient lack of predictability in the ratio, for us not to be able to ignore it. Moreover, there are omissions from the model used in Chapter 4 (such as imperfections in the labour or property markets) which would lead to even greater variation.
10.151 The question for this part of our report, therefore, is what conceptual or practical advice can be given regarding the assessment of additional wider economic impacts at scheme level. This is a very particular and testing question. It is not the same question as the one addressed by economic impact studies. These studies attempt to measure the impact of a

Transport and the economy: full report (SACTRA)
214
scheme or policy on the economic performance of an area or corridor. Therefore, they will consider all effects on the economy to be relevant whether transmitted from the transport market or additional. The focus will typically be on the impact on a defined area, such as the Jubilee Line corridor (University of Westminster, 1997), Skye and Wester Ross (PACEC, 1995). Attention will be paid to displacement effects within the study area, but often no clear distinction will be drawn between displacement from elsewhere in the UK and additionality at the national level. For appraisal of national government expenditure on the transport programme, this distinction is crucial.
10.152 However, additionality is not the only relevant issue for decision-making. The distribution of the total economic impacts, and the contribution of schemes to goals such as economic regeneration and competitiveness is also relevant, and are considered under Appraisal Requirement 3 below. So economic impact studies might be useful in principle both to identify any sources of additional benefits/disbenefits and to help assess the broader policy relevance of schemes. But the two concepts should be kept analytically separate.
10.153 The state of the art of assessing the wider economic impacts of transport projects is patchy and not well codified. On the other hand, there is increasing interest in the role of transport infrastructure and policy actions in promoting or supporting economic activity, both at national level where the issue can arise in terms of competitiveness impacts and at regional/local level where the concern can be that of economic regeneration. Regional policy analysis is generally becoming more formalised; our attention has been drawn for example, to the EGRUP Guidelines (HM Treasury, 1995), the latest version of the 'Green Book' (HM Treasury, 1997b) and relevant aspects of the Commission's guidance on cost benefit analysis of projects assisted through EC regional policy (CEC (DGXVI), 1997).
10.154 The central dilemma for the Committee in giving guidance for scheme appraisal, therefore, was as follows. There are two credible choices. The first is to recommend concentrating on better assessment of the transport benefits/disbenefits, with very limited resources, and correspondingly limited credibility attached to the assessment of the wider economic impacts. If this were to be the Government's preferred option, it would certainly be necessary to make clear to relevant parties, such as Public Inquiry Inspectors and their participants in the decision-making process, the pitfalls associated with any evidence received on wider economic impacts, together perhaps with advice on the tests to which such evidence needs to be subjected. The option of allowing parties to bring such evidence as they choose, either to support or oppose a scheme, in the absence of a codified set of rules or guidance for its assessment, does not seem to us to be an acceptable one.
10.155 The second option is to turn the problem on its head and require that every project be assessed in terms of its wider economic impacts, within a defined framework. This takes appraisal into more difficult areas, but is, conceptually at least, a more satisfying way of dealing with Appraisal Requirements 2b and 3 and does address head-on some central political concerns of the day, namely the impact of transport investment and policy upon economic performance. We therefore thought we should explore the feasibility of this option.
10.156 As explained in Chapter 1, at the outset of our work, we invited a wide range of organisations and individuals to submit evidence which they thought might be useful to us in our enquiries. Having received only a limited amount of evidence from economic development consultants, we approached a number of these firms again for assistance with our terms of reference. This elicited some useful material which aided our thinking. At this stage, we commissioned David Simmonds Consultancy (1997) to review a range of economic
Transport and the economy: full report (SACTRA)
215
development impact studies. We then sent Simmonds' report, which is summarised in Chapter 9, to a number of economic development consultancies to seek their views on whether the studies which Simmonds had reviewed were representative of general practice and whether they thought that Simmonds' comments were reasonable. We received a number of responses, most, but not all, of which agreed that the range of studies examined by Simmonds was typical and that his findings were broadly sound. We then engaged in a dialogue with ECOTEC and ERM and eventually commissioned a report from ECOTEC (1999) and some additional material from ERM (1999) to provide answers to questions raised in our minds by ECOTEC's report.
10.157 It will be apparent from this that we have made considerable efforts to seek views from the economic development consultants about what they regard as best practice. Our general aim was to assess whether there was scope for recommending development and codification of the analytical techniques used to assess the wider economic impacts. What follows is the Committee's interpretation of ideas submitted to us.
10.158 Earlier in the report, we identified the following five issues which ought to feature in a properly specified appraisal.
• Reorganisation effects input substitution within the production system and logistics of the firm to take advantage of lower transport costs.
• Output effects the excess value to consumers of increases in final output over the costs of production.
• Imperfect product market effects benefits/disbenefits due to divergences between prices and marginal costs in markets where outputs expand.
• Imperfect factor market effects for example, benefits/disbenefits due to divergences between wages and the marginal resource cost of labour.
• Dynamic interactions between sectors not capable of representation in scheme appraisal at the current or likely future state of the art.
10.159 There may be some overlap between these issues, and therefore some potential for double-counting of impacts. We also noted the need to allow for any externalities associated with these effects. We now consider the feasibility of incorporating some of these in scheme appraisal reorganisation effects, product market effects, and land and labour factor market effects.
Reorganisation Effects 10.160 Several respondents to our consultation considered that reorganisation effects were a potential source of additionality to the conventionally measured transport benefits/disbenefits. Some attention has been devoted to the interaction between transport and non-transport inputs in the logistics and distribution sector by McKinnon and others. Very little attention has been given to the role of transport conditions for the organisation of employers' business trips by workers, such as travelling salesmen.
10.161 Our view, as stated earlier in this chapter, is that the requirement here is for a set of studies which enable the derived demand for freight and employers' business trips to be better represented within economic appraisal. We do not think that past studies have identified clearly whether the transport benefits equal the total logistics system benefits. Most of these are based on case studies and have not formalised the appraisal implications. For the moment, we see the way forward in continuing to improve the methods for estimation of the transport

Transport and the economy: full report (SACTRA)
216
benefits rather than separate estimation of the reorganisation benefits as an additional impact. We do, however, believe that further studies of the logistics and other transport-using industries may have more to offer in advancing our understanding of this issue than economic impact studies of transport infrastructure. We therefore welcome the Department's recent strategy document Sustainable Distribution: A Strategy (1999) which recognises more clearly than hitherto the importance of considering the total logistics of freight distribution. However, this continues to imply monitoring at a rather aggregated national level and leaves unresolved the major problem of modelling and forecasting future freight transport movements in a way that can be used at the local or scheme level.
Product Market Effects 10.162 We said in Chapter 4 and Chapter 5 that we see better understanding of the relationship between transport costs/quality and economic performance as a key issue for the future. The CGE model of the style developed by Venables and Gasiorek is a useful tool, and we would like to see this linked up to a conventional transport model (as suggested earlier in paragraph 10.137). We see this as the best tool for getting a handle on the output/transport cost relations at the regional or national level. As also discussed earlier, a programme of development of the LUTI models could also assist in addressing this issue at corridor and major scheme level.
10.163 At the scheme level, the ECOTEC report states that, perhaps surprisingly, rather little attention is given to output effects per se in economic development studies: "The argument is that the impact on the firm's total costs of any particular project is likely to amount to only a fraction of 1% of total costs and, whatever the elasticity of product demand, the impacts on sales and employment are not likely to be very great. Any effect is likely to be concentrated on sectors where transport costs are relatively high, such as distribution itself, and the construction aggregates industry. No doubt for this reason, most economic development assessments seem to have given little attention to this mechanism and those which have considered it (eg, ECOTEC, 1993b) have tended to conclude that it is not particularly important in relation to the projects under assessment.".
10.164 However, there are arguments in favour of placing greater weight on implied transport cost savings. Despite being a small proportion of total costs or value added, transport costs are a much larger proportion of profits. Since transport costs may be able to be varied more easily than other costs, this may make firms more responsive to changing costs through changing output. Furthermore, there are threshold effects if transport improvements bring major centres of population or gateways such as Channel Ports within, say, a day's drive. Reliability also attracts a substantial premium. Unfortunately, however, the currently available information from sources, such as the Census of Production, is not sufficiently detailed on the question of the true costs of transport to firms nor are output elasticities sufficiently reliable to enable general recommendations to be made.
10.165 Although this does not seem a very satisfactory state of affairs, since what is true at the regional or national scale should also be true on a proportional basis at the individual project scale, it is accepted that, pending the results of the higher level studies, it is not sensible in general to attribute any product market benefits, and hence any price/cost margin benefits to individual road and transport schemes. We now focus on the exceptions to this.
10.166 The first class of exception concerns cases where the new link opens up the possibility of undertaking economic activities which are by their nature fixed in location and for which transport costs are a significant proportion of total costs. These could include extractive
Transport and the economy: full report (SACTRA)
217
industries such as mining, quarrying, forestry and fishing, where reductions in transport costs might open up the possibilities of profitable exploitation of resources.
10.167 We have some evidence from the study, The Incidence of Imperfect Competition in UK Sectors and Regions discussed in Chapter 4 (Harris, 1998). This produced estimates, on the basis of the 1989 Census of Production, of the deviation of price from marginal costs (the price/marginal cost ratio) in different sectors and regions as an indicator of the existence of monopoly power. Harris estimates that, with the exception of coal, extraction industries had above average price/cost margins (typically 1.7 to 1.8 compared with an average for all industry of nearer 1.4). Average transport costs per employee were also substantially above average (with the exception of metal ore extraction). The extraction of mineral oil and gas and of other non-metalliferous minerals had two of the highest levels of transport costs per employee, in the latter case more than 12 times the average for all industries. This evidence supports the view that there is significant imperfect competition in these sectors.
10.168 A particularly interesting industry in this connection is tourism. In this case, many of the conditions for a positive result would seem to be present natural assets are fixed in location, transport costs are a significant proportion of total costs and tourism is a mainstay of the economy of many peripheral regions. Transport costs are, however, largely borne directly by the consumer and not the producer. Furthermore, it is difficult to derive data directly for tourism as a single sector in order to conduct simple studies revealing the degree of imperfect competition, for example through price/cost margins.
10.169 We recommend that the Department commissions research into the effects of transport interventions on the tourism sector, in particular because of the importance placed on improving transport for tourism by many regions. These should, however, be placed in the context of the overall structure of any local economy, as transport improvements which benefit tourism may be at the cost of negative impacts on other sectors.
Factor Market Effects: Land 10.170 A rather different case is that of unlocking land. In general, changes in land values are to be regarded as a pecuniary externality, reflecting the capitalisation of some or all of the user benefits in enhanced land rents. Though this process affects the pattern of final benefits and disbenefits (see later) and may affect the fundability of schemes if the enhanced land values can somehow be captured and made available to the public agency, the general rule is that changes in land values are not additional to the primary transport benefits/disbenefits.
10.171 The main exception of which we have become aware during the course of this enquiry is the case in which the scheme 'unlocks' previously inaccessible land for development. Clearly, if the market for land were in perfectly elastic supply, there would still be no argument for additionality since any newly attractive sites becoming available would simply displace others in the pecking order. But it has been put to us that this is not the case that because of a mixture of planning restrictions, imperfect markets and longevity of investment decisions, cases arise in which there are few or no available sites for particular sorts of investment and that transport investments can, as a by-product, create genuinely new opportunities which could not otherwise be satisfied. This is a point which has been put particularly strongly by the Government's Regional Office representative.
10.172 This is a case where additionality is conceptually possible, but where any claims which are made must be assessed within the property market context. The ECOTEC report suggests that this will typically involve consideration of:

Transport and the economy: full report (SACTRA)
218
• the supply of potentially competing sites (and vacant premises);
• the extent to which there is an unmet demand for sites, either currently or in prospect; and
• the rentals likely to be available and typical land prices, and thus how far the development would be likely to be viable in the light of these, where viability would normally be tested through some form of 'residual value' calculation comparing the costs of potential development projects with the capital value of the expected rental stream this is an imperfect proxy for the present value of the output net of its costs.
10.173 The case for unlocking land must anyway be judged in the context of Government planning policy, which currently gives priority to development on the most accessible sites in existing urban areas, and only permits edge of town and out of town development where such sites are not available (the sequential test).
10.174 The above is written for the case in which the developer is different from the producer or occupier of the development. A special case is that of the large inward investor requiring 'bespoke' premises. Their decisions may be influenced both by site availability and by broader level changes in patterns of regional accessibility. Again, a basically similar analytical approach will be appropriate, with the key starting point being evidence that issues of accessibility are the key constraint on securing such developments and a realistic assessment of how far the scheme concerned addresses the issues concerned. The null hypothesis must be that the land development market is capable of providing good quality locations for development, so that solid evidence of 'unlocking' effects is required, remembering that for additionality the perspective is a national one.
10.175 Another case which is sometimes proposed is that of foreign direct investment, where a choice of European location is being made. Our view is that, whereas from the local perspective of attracting the development to a particular location, roads and transport may be critical, from the national perspective it will rarely be possible to attribute solely the benefits/disbenefits of such decisions in advance to particular major road or transport schemes. Where, exceptionally, a decision to come to the UK is contingent upon the provision of transport infrastructure, such schemes should be viewed as regeneration schemes with a transport benefit component rather than the other way round.
Factor Market Effects: Labour 10.176 The scope for genuinely additional benefits/disbenefits at scheme level is potentially greatest through labour market effects. However, even here, it is crucial to note that such benefits/disbenefits depend on there being a divergence between wages and the marginal resource cost of labour. As the ECOTEC report says, "assuming a competitive labour market in which workers are paid their marginal products, the benefit of the employment accrues to the workers concerned and the only effect which needs to be taken into account in the appraisal is the user benefit." We believe that this should be the default assumption and that positive evidence should be required in order to override it.
10.177 Before considering the evidential requirements, it is worth rehearsing a number of possible cases described by ECOTEC. It is impossible to avoid overlap between issues relating to levels, ie, additionality, and issues relating to patterns of economic activity, so there is some overlap in what follows with Appraisal Requirement 3. ECOTEC identify a number of possible scenarios, as follows.
• Displacement is less than 100% at the national level, so that employment creation in a particular area is less than fully offset by employment losses elsewhere. The classic example

Transport and the economy: full report (SACTRA)
219
is that where a package of measures, including transport infrastructure, stimulates inward investment, generating employment, which would not otherwise come to the UK.
• Displacement is 100% at the national level, so that employment creation in one area is fully offset by employment losses elsewhere. Here there may be additional economic efficiency benefits if the redistribution results in more efficient use of social overhead capital and/or a more satisfactory economic balance in overheating terms, and therefore the possibility of running the economy at a marginally higher level of employment consistent with a given inflation target.
• The breaking down of local labour market barriers reducing or eliminating local labour market monopolies, thereby improving supply-side efficiency.
10.178 It is not sufficient to claim that one or more of these conditions applies to a particular investment case evidence will be required that the relevant conditions are present and that poor accessibility is the effective labour market constraint rather than, say, skills availability. Relevant sources of evidence might include:
• local studies, in particular based on household surveys and focus group discussions;
• the experiences of the Employment Services and of employers in seeking to recruit and retain staff;
• cross-sectional statistical analysis of participation and unemployment rates; and
• labour-market data on vacancies in relation to unemployment.
10.179 In practice, many such accessibility related constraints are likely to be concentrated in areas with low car ownership and which are peripheral to the built-up areas. They are likely to be primarily an issue in relation to public transport appraisals, though they may also arise in the context of interventions in rural areas, too.
10.180 Supposing that, in a particular case, the argument for beneficial labour market effects can be sustained; how are the resulting benefits to be accounted for in appraisal? Treasury Guidance (HM Treasury, 1995; 1997b) precludes the incorporation of any specific monetary values for job creation in the appraisal process. Our understanding, following discussions with DETR officials, is that there is an objection to the use of shadow prices for labour on the grounds that such prices are properly context-dependent, but all too easily come to be exported between studies and misused. The preference, therefore, is for a specific assessment of the value of induced economic output net of the marginal resource cost of labour to be made on a case by case basis.
10.181 The procedures used for estimating these values should, of course, be consistent between transport and other sectoral expenditures. In that connection, a recent paper (Swales, 1997) analyses the criteria for granting regional selective assistance, noting that the Treasury's criteria together make up a coherent cost benefit analysis. One of the criteria is effectively a cost per job limit. Swales notes the apparent inconsistency between the Treasury view that market wages provide the best measure of the opportunity cost of labour and the implicit rationale for regional selective assistance, namely market failure, and particularly labour market failure. It may be, however, that the Treasury concern is with the validity of the values and rigour of the analysis rather than the concept.
10.182 We recommend that the Department seeks clarification from the Treasury on the valuation of employment gains in areas where regeneration is a key policy objective.

Transport and the economy: full report (SACTRA)
220
10.183 If arguments for additionality due to labour market imperfections are to be entertained, it will be essential to consider within the appraisal the impact on employment in the transport sector, which may be positive or negative, as well as the impact in the transport-using sectors.
10.184 In the case where additional benefits due to labour market effects exist, the issue of second round multiplier effects is likely to arise. We think it reasonable to assume that any multiplier effects associated with the construction of the project should be disregarded on the grounds that the project is displacing alternative construction projects with broadly similar multiplier effects. However, multiplier effects may arise either through supply linkages as firms which increase their outputs purchase additional intermediate inputs from their local firms, and so on down the supply chain, or through local expenditure by those whose incomes rise as a direct or indirect result of the project.
10.185 The logic of applying demand-related multipliers sits slightly uneasily with other aspects of Treasury guidance. However, EGRUP (HM Treasury, 1995) suggests that regional or local supply linkage multipliers will typically lie in the range 1.05 to 1.11, with income multipliers perhaps around 1.1 at a travel-to-work area level, increasing to 1.2 to 1.5 at a regional level. Clearly, multipliers need to be assessed and justified on the basis of factors such as the size and structure of the economy considered, as well as the extent of under-utilised resources which will affect the likely extent of resource 'crowding-out' (ECOTEC, 1999).
10.186 We do not think that in the context of roads and transport schemes, any of the scenarios identified above will be particularly common. But we do expect such cases will occur from time to time, as they have in the past for some urban public transport schemes. In such cases, the Department should work towards specific assessment of the net value of economic output, and this should appear in the appraisal. Clear guidance to analysts and very careful policing of appraisals will be required to ensure that the conditions for additionality set out above have been met (see the recommendation below).
10.187 Our overall conclusion is that in satisfying Appraisal Requirement 2b at the scheme level, the emphasis should be on the direct transport and environmental costs and benefits of the project. Additionality resulting from property and labour market processes may occur and may be capable of demonstration in particular cases, but is unusual. For many projects, we believe it will be impossible in practice to demonstrate that the wider economic impacts not already counted in the transport benefits/disbenefits are significantly different from zero.
10.188 In spite of the arguments put to us by economic development consultants that standard procedures are not applicable, given the widely varying circumstances in which appraisals have to be undertaken and the variability of the data available, we believe that some standard procedures would make appraisals easier to understand and compare. We recommend, therefore, that the Department undertakes research to develop codified guidance as to how the appraisal of the benefits/disbenefits additional to the transport benefits/disbenefits should be assessed. We have in mind here a guidance note which parallels, and is broadly as prescriptive as, those which the Department has developed for cost benefit analysis and environmental appraisal.

Transport and the economy: full report (SACTRA)
221
Appraisal Requirement 3: What is the Pattern of Gains and Losses, in both Economic Activity and Jobs, which will arise from the Intervention?
10.189 Historically, the main emphasis of transport appraisal has been on measuring the size of the benefits and disbenefits of projects and policies so that they could be compared with the cost. That is Appraisal Requirement 2. However, an equally important consideration is the incidence of the benefits and disbenefits, implying a need to assess where and to whom the economic impacts accrue as well as their magnitude. This is Appraisal Requirement 3, and it represents a challenge for the transport appraisal community.
10.190 This section is structured as follows:
• first, we consider the appraisal of regeneration in the NATA;
• second, we discuss regeneration objectives and areas;
• third, we consider the market conditions and mechanisms at work which should form the cornerstone of the analyses to meet this appraisal requirement; and
• fourth, we discuss ways of measuring the impacts.
10.191 Within the New Approach To Appraisal (NATA DETR, 1998b), schemes may be designated as economic regeneration schemes, and one of the assessment criteria within the NATA is "serves regeneration area". This confirms that the question 'will a scheme actually succeed in assisting area X to regenerate?' has become much more relevant to decision-takers.
10.192 We have concerns about the use of the indicator "serves regeneration area" for the following reasons:
• there is no attempt to quantify numerically the economic impact of the project on the area concerned;
• no account is taken of the two-way road argument;
• we are unclear whether consistent definitions and prioritisation of regeneration target areas are used;
• no account is taken of displacement from other areas, and hence of whether these are higher or lower order problem areas; and
• no account is taken of the effect of projects in non-regeneration areas on the local economies in regeneration areas in other words, it is currently not possible to score negative on this indicator.
10.193 We think these weaknesses mean that the current indicator needs to be replaced by something better.
10.194 In order to improve the status quo and meet Appraisal Requirement 3 more satisfactorily, we recommend that there should be:
• a consideration of the economic and market conditions in the relevant areas and the mechanisms likely to be activated by the scheme;
• an assessment of the size of the expected impact on economic activity and jobs in the target area, and of the balance of take-up between existing residents and inward migration; and

Transport and the economy: full report (SACTRA)
222
• an assessment of the extent of displacement both within the target area and between the target and other areas.
Regeneration objectives and areas
10.195 A complication to be faced in the appraisal of the regenerative impacts of a transport intervention is that regeneration can be broadly defined. Regeneration policy may seek to achieve economic goals (eg, job creation) but it may also try to achieve social aims (eg, reduction of crime or improved educational standards) and environmental ones (eg, reclamation of degraded land). While regeneration policy frequently focuses on local areas (rather than, say, a sub-region or region), the circumstances where it applies can also vary from, for example, relatively isolated under-performing economies to those situated in an otherwise buoyant area.
10.196 The variety of circumstances covered by regeneration policy is emphasised by the different programmes by which areas are officially designated worthy of priority treatment: Structural Funds, Single Regeneration Budget, Assisted Areas, Education Action Zones, and Rural Development Areas, to name but a few. These programmes often seek to achieve different things and so the criteria used to identify areas in need of assistance also vary. It is not the job of this Committee to comment on the variety or objectivity of these initiatives. However, we do believe that appraisal of the regeneration impacts of a transport intervention must establish clearly that the intervention is relevant to an officially designated area and that it is complementary to, and consistent with, the objectives of that regeneration initiative.
Market conditions and mechanisms
10.197 A cornerstone of the argument for regeneration effects must be a thorough assessment of the base economic conditions in the target area. Are the problems structural? Is accessibility the constraining factor? Which of the mechanisms may reasonably be expected to be activated as a result of the project/policies? Answering these questions requires a dispassionate approach, and not an approach based on the need, wishes or claims of the promoter.
10.198 We have already reviewed the linking mechanisms. Although the ECOTEC review did not cover the relative significance of these in detail, they reported as follows: "Our strong impression is that in relation to the more localised schemes on which SACTRA was seeking inputs, arguments about unlocking development potential and drawing in mobile investment tend to predominate. In relation to wider schemes, arguments about overall effects on patterns of mobile investment and perhaps sometimes tourism have typically been the dominant concern. Arguments about the efficiency of the labour market and serving the needs of the deprived areas have primarily been important in appraisals of public transport schemes, although some of these also give weight to development effects, particularly at nodes in the network. Prospective impacts on the operation of existing firms tend to figure only as a relatively minor issue, if at all." (ECOTEC, 1999).
10.199 The practice described in the last sentence is particularly worrying, since it is contrary to the basic expectation that the overall economic impact will be dominated by impacts both positive and negative on activities that already take place. It may be that, in some instances (such as following industry closures), there is very little economic activity left in the area targeted for regeneration. In general, however, we take the view that attention should always be given to prospective impacts on existing enterprises.

Transport and the economy: full report (SACTRA)
223
10.200 We recommend that, as a matter of standard appraisal practice, specific attention be paid to the effects of an intervention on activities pre-existing in the area targeted for regeneration.
Measuring the impacts
10.201 As the Department wishes to include in its appraisal criteria the regeneration impact of schemes, it is going to be necessary to measure the impact of the scheme on economic activity and jobs in the target area. This will require the assembly of relevant data, and some form of method quantitative or qualitative of predicting the scheme impact. Chapter 5 of the ECOTEC report provides a review of the data sources and qualitative approaches to assessing the impacts on the local economy and on jobs of the various mechanisms. This is a very useful overview which we think should be the Department's starting point in considering the style of work which will be required. Here we draw attention to a few salient points.
10.202 ECOTEC consider that, as well as considering the economic impact on areas with priority status under domestic regional policy, "It will be necessary to consider the extent of displacement of activity from assisted areas elsewhere. This issue, which is not typically covered in most appraisals, is unavoidable if regional development benefits are to be given weight in the appraisal of schemes at a national level. It implies that attention has to be given to such questions as where firms might come to an area would relocate from, and where they would go in the absence of the scheme, as well as issues about the location of their competitors and markets.". We agree the pattern of displacement and relocation is an essential appraisal issue.
10.203 ECOTEC also make the point that their assessment has had to deal with some significant limitations:
• "the majority of ex-ante assessments of transport projects are undertaken on a commercial basis for scheme promoters and are not typically in the public domain;
• "the extent to which such studies document details of their assessment techniques is variable but is typically limited;
• "there have been relatively few detailed ex-post studies of the impacts of particular schemes in practice and none of these with which we are familiar have sought to relate the details of the impacts which they identify to the prior assessments which were undertaken of the project concerned.".
10.204 So, implementing Appraisal Requirement 3 will involve significant new expenditures on appraisal, including new data collection. This is what will be required in order to link transport appraisal more securely in to overall economic assessment, although there is clearly a cost-effectiveness issue for the Department here.
Concluding comment on appraisal requirement 3
10.205 The process of assessing regional development impacts will often be to a large extent judgmental. The approach needs to focus on the specific mechanisms which are believed to be important, with a pragmatic approach to developing a systematic base of relevant evidence on which the necessary judgement can draw. Experience from regeneration appraisal in other sectors will be helpful in that regard. However, we do not believe that assessment of the economic regeneration effects of schemes can be left to judgement alone. If such impacts are to be admitted into the appraisal process, they will require evidential support.

Transport and the economy: full report (SACTRA)
224
10.206 We recommend that the Department investigates further ways in which changes in the pattern of economic activity can be assessed without recourse to a formal model, and issues advice on the analysis of changes in the distribution of economic activity and jobs.
10.207 Before concluding this chapter, we consider two other issues: ex-post evaluation studies and equilibrium modelling.
Ex-Post Evaluation Studies
10.208 ECOTEC (1999) suggested that more resources be allocated to ex-post evaluation of transport interventions so that some empirical evidence of the impacts on the economy can be derived. This is strongly supported in ERM's commentary (1999). We comment here on the practicality and likely value of such exercises.
10.209 The two key issues with this type of evaluation seem to us to be:
• the measurement of changes in the level and pattern of economic activity as a result of the intervention; and
• the comparison of the actual level and pattern of economic activity after the intervention with the level and pattern which would have occurred had the intervention not taken place (the 'counterfactual').
10.210 Two steps are required: first, to identify where changes occur and, secondly, to measure the level of change. In essence, changes in the level and pattern of economic activity may fall into three classes:
• new development on previously undeveloped sites;
• vacation of existing development; and
• change in intensity of use of existing development.
10.211 New developments may be identified quite easily, by direct observation and through inspection of planning permissions. However, buildings which become empty, especially only partially empty, may be more difficult to identify, and many changes in the intensity of use of existing development may well be undetectable except by intensive survey. Once the locations where change have taken place have been identified, the magnitude of the change may be determined by targeted and direct survey.
10.212 A further complication is the period over which changes occur. If the 'before' situation is in equilibrium, and the 'after' situation rapidly finds a new equilibrium, then conducting two surveys, one before and the other after the intervention, will be able to identify the changes in economic activity (subject to the usual caveats about taking account of other simultaneous changes which may have taken place). However, both theory and evidence indicate that responses build up over a prolonged period after the intervention, and in some cases may actually occur in anticipation of it. This implies that considerable care is necessary in choosing the best time to carry out the surveys, and it may be necessary to carry out more than two surveys (ie, to capture short, medium and longer term effects), or to use continuous monitoring procedures.
10.213 Straightforward before and after surveys are unlikely to be useful for another, more fundamental reason. Between the before and after surveys, there is the question of how to
Transport and the economy: full report (SACTRA)
225
disentangle the general trends in economic activity from the effects of the intervention itself. In some instances of general rapid change, it may be that the effects of the intervention are swamped by the general economic trend, either recession or growth. This is the argument for some means of establishing the counterfactual the position which would have occurred if the general economic trends had not taken place or, indeed, if any other exogenous change had not taken place.
10.214 We are aware of the large scale resources which the Department is devoting to the assessment of the induced traffic effects of the completion of the Manchester Motorway Box. Deriving estimates of the overall scale of the extra traffic induced by the scheme and disaggregating the overall estimates into their constituent parts requires large-scale before and after surveys of all movements by all modes in the area likely to be affected by the scheme. It has been argued that the calibration of a transport model on the two sets of data will also avoid the need to forecast the counterfactual and also avoids the problems of comparing a synthesised counterfactual case with an observed after case.
10.215 We understand that this approach is thought to be feasible because there is a well-established tradition and theory of modelling the responses of travellers to changes in the transport system. The problem is made tractable by viewing the task as simply calibrating models that is, hypotheses which theoretical work and experience over many years have shown to be plausible representations of the real world. In the case of changes in economic activity, however, we are not so fortunate in that no convenient and well-established modelling framework exists to enable us to analyse the differences between before and after data and separate out the effects of exogenous factors from the effects of the intervention. The LUTI models probably come nearest to what we require, but we know from our earlier discussions that their representation of all the factors at work in the real world is somewhat limited and Simmonds and Williams have explained to us the difficulties of calibrating all the very many relationships embodied in these models.
10.216 We think that it is for these reasons that there are few good examples of ex-post evaluation studies which would reveal the economic impacts of transport interventions. Such studies would need to identify carefully the structure of business in the economy under consideration and any particular features of market structure in the sectors represented and in the local labour market. It is not sufficient simply to examine the scale of transport cost changes and assume that this has a pro rata impact on costs and prices in those sectors, and hence on the aggregate level of economic activity.
10.217 We support further work to identify both the relative importance of the various cases, and the way in which such incidences will have an effect on the impact of individual schemes. Substantial claims for regional competitiveness or economic development impacts are being made for all types of transport intervention which we do not find can be supported. We do not believe, however, that further study of these impacts should only be made where such claims are included in the case for a scheme. Best practice requires that it becomes a matter of routine. Furthermore, we do not believe that a simple table of impacts can be drawn up which is universally applicable and which can be used to justify a set of automatic adjustments to the correctly estimated transport benefits/disbenefits. As the discussion of Table 4.2 has shown, a careful and case by case approach will be needed, taking into account the sectoral and competitive structure of all the areas affected.
10.218 We recommend that the Department considers the methods available for investigating the effects on economic activity of all types of transport interventions

Transport and the economy: full report (SACTRA)
226
(including infrastructure schemes, traffic reduction measures and improvements to public transport) and, if considered practical and affordable, conducts some case studies to enable the development of a better understanding of all the economic development impacts of transport interventions.
Equilibrium Modelling
10.219 At a number of points in this Report, the argument has depended on the assumption that economies in general, and travel choices in particular, are in equilibrium with the factors that influence them. We have also had occasion to draw attention to the problem that this assumption may not always be true, or that such equilibrium may take some time to be achieved, or may not be unique, in which case the interpretation of the evidence may be flawed, and our conclusions about appraisal may not be robust.
10.220 It is recognised that a full-scale movement from equilibrium to dynamic methods of analysis and forecasting would certainly be expensive, and may not be feasible. We consider that the subject should be researched. This research should include the following:
• a critical review of available empirical evidence about the existence of dynamic dimensions to travel choice in the passenger and freight sectors (eg, lags in response, imperfectly reversible relationships, differences between short and long run effects, and the time scales associated with each);
• a theoretical analysis of which of these effects might cause appreciable bias in appraisal quantities if they are omitted (including discounted flows of costs and benefits/disbenefits, and possible dependence of appraisal outcomes on the sequence of implementation); and
• feasibility and research requirements to take account of such effects by explicit modelling, at the aggregate or disaggregate level, or alternative more pragmatic methods of assessing and compensating for the risk of bias in using equilibrium methods.
While we envisage that this research would focus mainly on the more tractable problem of dynamic issues within the transport sector itself, it may also be useful at least to identify key literature which has emerged in relation to wider issues of the dynamic properties of economies as a whole.
10.221 We recommend that the Department undertakes research to establish the scale, scope and implications of the 'equilibrium versus dynamics' discussion, and assess what improvements may be feasible.
Concluding Remarks
10.222 Our general stance is that more rigour is required in the appraisal of the impacts of transport interventions on the economy. Having considered in some detail whether and in what circumstances economic impacts additional to those normally captured in conventional cost benefit analysis actually occur, and the practicality of calculating any additional benefits/disbenefits, we have come to the following important conclusions:
• there are some significant imperfections in the practice of conducting conventional transport cost benefit analysis;
• there are some circumstances when a perfectly specified and properly executed transport cost benefit analysis will be significantly in error;

Transport and the economy: full report (SACTRA)
227
• but we consider that the former imperfections are more tractable than the latter ones.
10.223 In addition, there may be circumstances where the distributional impacts by location and/or social group may be relevant to the appraisal and the decision. A multi-track approach is therefore required, so as to improve:
• the estimation of the transport costs and benefits/disbenefits (Appraisal Requirement 2a);
• the assessment of the wider economic impacts additional to the transport benefits/disbenefits (Appraisal Requirement 2b); and
• the distributional impacts, whether or not there are any wider economic impacts which either add to or subtract from the total transport benefits/disbenefits (Appraisal Requirement 3).
10.224 We reiterate here our recommendation from Chapter 8 that the appraisal process be structured so as to include the following questions:
1 What is the rationale for the intervention?
2a What are the benefits/disbenefits of the intervention calculated using conventional transport cost benefit analysis (using best practice and on the assumption of a perfectly competitive economy outside the transport sector)?
2b What are the total economic impacts of the intervention?
3 What is the pattern of gains and losses, in both economic activity and jobs, which will arise from the intervention?
10.225 We recommend that an Economic Impact Report be produced for all schemes, to go alongside the traffic and environmental appraisals currently undertaken. This report should include all the considerations under Appraisal Requirements 1, 2b and 3 which are relevant to the appraisal of the total economic impacts of an intervention and their distribution. The Department should issue advice on the content of the Economic Impact Report at the same time as advice to adopt the new Appraisal Requirements. Clearly, the content of the Economic Impact Report may need to evolve as new methods are developed, along the lines of our other recommendations.

Transport and the economy: full report (SACTRA)
228
Chapter 11 - List of Recommendations
Introduction
11.01 In Chapter 1 we identified the main strands of our terms of reference:
• What is the nature and significance of the relationship between transport provision and economic growth?
• Is there scope to reduce the transport 'intensity' of the economy?
• What are the implications for the appraisal of individual transport schemes - both of schemes which seek to meet the demand for movement and of those which seek to reduce road traffic growth?
• What recommendations follow from our analysis of conventional transport appraisal for the Department's procedures and practice?
11.02 The terms of our remit indicate a primary focus of interest on the national (i.e. UK) economy. They do, however, also ask us to consider what can be said in general about regional and local impacts.
11.03 Our list of recommendations follows. It represents our view of the research and improvements to appraisal practice which we believe should be pursued in relation to the topics covered by our remit. It comprises a challenging agenda, not all of which may be achievable in the short term. We have not explicitly ranked our recommendations in priority order, as we believe that it is for the Department to consider their relative importance and feasibility.
The Nature and Significance of the Relationship between Transport and the Economy
11.04 We recommend that the Department undertakes further development of CGE modelling of the total economic impacts of transport schemes with particular emphasis on incorporating endogenous growth, alternative assumptions as to the behaviour of the labour market and better representations of the transport system. (Paragraph 4.58)
11.05 We recommend that the Department investigates the use of CGE modelling in conjunction with a transport model, to explore the size of the discrepancies between total economic impacts and transport impacts in the cells of Table 4.2. (Paragraph 4.76)
11.06 We recommend that further work be devoted to research on the use of input-output models in helping determine and measure the key linkages through which transport affects regional economies. (Paragraph 5.106)
11.07 There is a need for more consistent research evidence on the use of transport and transport costs by sector to inform appraisal practice. We recommend detailed discussion with ONS to define improvements in data collection which will, in particular, allow for better assessment of the role of employers' business travel. (Paragraph 5.130)
11.08 The relationship between wages and employment (the wage equation) in local labour markets, how this is affected by the costs of transport (both into and out of a region and within it) is a major question for further research. We recommend a detailed study of the commuting response to a substantial change in transport provision which examines not just
Transport and the economy: full report (SACTRA)
229
changes in commuting patterns, but also the impact on wages and employment levels in adjacent areas. (Paragraph 5.131)
The Scope to Reduce the Transport 'Intensity' of the Economy
11.09 We recommend that research into the effect of income growth on freight traffic should include consideration of any potential factors which might increase or reduce the strength of this relationship as it develops, as well as the non-income effects (price, speed, quality, etc). (Paragraph 6.35)
11.10 We recommend that the DETR reviews the consistency of its price elasticities used in different forecasting and appraisal exercises, particularly (though not only) in relation to longer term behavioural responses including car ownership effects, and especially their consistency with the large body of non-DETR literature. (Paragraph 6.38)
11.11 We recommend that methods used for forecasting traffic and appraisal of policy interventions should continue to be constructed around the concept of generalised cost, aiming at consistent treatment of both price and travel time effects, direct and indirect, in the short and long run. (Paragraph 6.43)
11.12 At the same time, we also recommend that consideration be given to incorporating (or making separate direct allowance for) interaction and quality effects which are not so easily handled in a generalised cost framework. (Paragraph 6.44)
11.13 We recommend that explicit separation of income, price and associated effects should be a high priority for the Department's forecasting and appraisal methodology, especially in effects on the bigger behavioural decisions which may take some time to be fully reflected in traffic levels. (Paragraph 6.47)
11.14 We recommend that substantial new research effort is devoted to the development of more robust freight forecasting models which take account of the factors identified in Chapter 6. (Paragraph 6.55)
11.15 We recommend that the Department review existing research on the mechanisms, scale and time-horizon of the second round effects (on, for example, land use), and on this basis consider the feasibility of further research aimed at quantified usable results. (Paragraph 6.58)
11.16 We recommend that the Department takes steps towards providing official estimates of the relationship between the prices and marginal social costs of different classes of journey by road transport. (Paragraph 7.21)
11.17 We recommend that all interventions intended to reduce traffic are subjected to cost benefit analysis. (Paragraph 7.33)
11.18 We recommend that, where road traffic reduction targets are used, they should be reviewed regularly, subjected to CBA and pursued through the use of instruments which can be adapted according to circumstances. (Paragraph 7.118)
11.19 We recommend the use of appraisal to identify winners and losers for schemes, whether to reduce traffic or to increase capacity, and that the Department takes appropriate steps to promote this. (Paragraph 7.121)

Transport and the economy: full report (SACTRA)
230
11.20 We recommend that appraisal should assess the impacts of recycling revenues raised by traffic reduction measures. (Paragraph 7.124)
11.21 We recommend that the Department consider identifying opportunities for monitoring the impacts of a large-scale traffic reduction measure which is due to be implemented in a relatively short period of time, and that it commissions research accordingly. (Paragraph 7.136)
Improvements to Current Appraisal Practice
11.22 We recommend that the appraisal process be structured so as to include the following questions:
1 What is the rationale for the intervention?
2a What are the benefits/disbenefits of the intervention calculated using conventional transport cost benefit analysis (using best practice and on the assumption of a perfectly competitive economy outside the transport sector)?
2b What are the total economic impacts of the intervention?
3 What is the pattern of gains and losses, in both economic activity and jobs, which will arise from the intervention? (Paragraphs 8.22 and 10.225)
11.23 We recommend that the Department considers whether it is satisfied that the basis for designating areas for economic regeneration is sufficiently rational and that politicians, in making their judgements, are appropriately informed. (Paragraph 8.72)
11.24 We recommend that the Department prepares and issues advice on the kinds of arguments which should be considered in developing the rationale for a transport intervention, along with advice on the ways in which the rationale should be articulated. (Paragraph 10.24)
11.25 We recommend that the Department clarifies its current Guidance on Induced Traffic especially in respect of the elasticities to be applied to business and goods vehicle trips. (Paragraph 10.35)
11.26 We recommend that the Department undertakes research to ensure that business trips are modelled appropriately and specifically to develop better ways of modelling non-home-based trips, especially the business element. (Paragraph 10.38)
11.27 We recommend that the Department reviews the evidence in the literature about elasticities of demand, and issues advice designed to ensure that the modelling practices adopted by practitioners properly reflect reality. (Paragraph 10.40)
11.28 We recommend that the Department reviews the recent evidence on less conventional or well-established traveller responses, and initiates research to identify their importance and to develop ways in which they may be included in transport models. (Paragraph 10.42)
11.29 We recommend that the Department conducts a thorough review of past work in modelling of freight responses to changes in the transport system and initiates research to develop sound techniques for modelling goods vehicle responses. (Paragraph 10.47)

Transport and the economy: full report (SACTRA)
231
11.30 We recommend that the Department initiates research to develop better procedures for forecasting the growth in demand for goods vehicle movements. (Paragraph 10.51)
11.31 We recognise that the estimation of changes in reliability is a very difficult area, but we recommend that the Department takes a wider view of reliability and invests resources to develop appropriate techniques. (Paragraph 10.56)
11.32 We recommend that, in considering any traffic reduction measure, the benefits and disbenefits are carefully identified, quantified and weighed to determine both the overall benefits and disbenefits as well as their distribution. Special attention should be given to identifying the areas whose economies may suffer as a result of the traffic reduction measure and to means of redressing the effects by recycling revenues in a targeted fashion. (Paragraph 10.59)
11.33 We recommend that the Department reviews past practice in the appraisal of traffic reduction measures and issues advice on best practice for their modelling. (Paragraph 10.65)
11.34 We recommend that the Department reviews and updates as necessary the vehicle operating costs used for appraisal purposes. (Paragraph 10.69)
11.35 We endorse the following aspects of the Department's policy towards the valuation of travel time savings:
• the principle of valuing both time savings in case of employers business (working time savings) and commuting and leisure time (non-working time savings) in monetary terms;
• the valuation of working time savings according to the wage rate of the relevant class of labour plus labour-related overheads;
• ensuring that any standard or average value of non-working time savings which is used is based securely on evidence from a range of empirical studies; and
• valuing all time savings and losses, large or small, at the same unit value. (Paragraph 10.72)
11.36 We recommend that the Department audit and update its current practice in relation to the values of time used in appraisal, including the following issues:
• the values of employers business time savings, including wage-related overheads;
• the value of time savings for the freight carried by goods vehicles (as opposed to the value of the time savings of vehicles and driver) - this could usefully be addressed within the Department's programme of logistics research;
• the acceptability of continuing to use a standard value of non-work time savings for all locations and modes within the context of the NATA;
• if accepted, the appropriate up-to-date standard appraisal value of non-working time savings;
• the boundaries between work and non-work time, and the practice of attaching the same unit value to all non-work savings regardless of journey purpose;
• the significance to the economy of journeys currently classified as 'leisure' (such as those involved with caring for relatives); and
• the assumed elasticity of the value of time with respect to income. (Paragraph 10.79)
Transport and the economy: full report (SACTRA)
232
11.37 We recommend that the Department revisits the work on the valuation aspects of reliability undertaken in the part by Bates, Pells and others in the 1980s and issues advice on the valuation of reliability. (Paragraph 10.82)
11.38 We agree with the Department that the potential magnitude of the reliability benefits warrants further work, both on methods of predicting changes in variability for different types of policy interventions, and on valuing the resulting benefits, and we recommend that the Department gives this area some priority. (Paragraph 10.86)
11.39 We recommend that the Department issues advice on the correct estimation of transport benefits/disbenefits under conditions of substantially changed demand. (Paragraph 10.88)
11.40 We recommend that the Department considers setting up a computable general equilibrium (CGE) model of the type developed by Venables and Gasiorek for Scotland and using it in tandem with an extended Central Scotland Transport Model with the aim of further understanding what the CGE approach has to offer for appraisal in a real life context in the UK. This will obviously require the co-operation and support of the Scottish Excutive. (Paragraph 10.137)
11.41 We recommend that the Department:
• pulls together its knowledge about land-use/transport interaction models as applied in this country and elsewhere in the world;
• considers its stance about the usefulness of land-use/transport interaction models;
and, on the assumption that the Department will share our views that these models have a role,
• instigates a programme of research and development designed to improve their treatment of the different markets influenced by transport, including an investigation into methods of extracting measures of total economic benefit;
• issues advice on the circumstances in which they should be used and practical guidance on their application to the appraisal of transport proposals; and
• considers arrangements for training some of the Department's staff in the theory and use of these models. (Paragraph 10.143)
11.42 We recommend the Department builds on the research recommendations in Chapter 5 for the further development of LUTI models, to examine in more detail whether it is feasible to derive robust estimates of total economic impacts as well as transport benefits/disbenefits from the same land-use/transport interaction modelling system. (Paragraph 10.146)
11.43 We recommend that the Department commissions research into the effects of transport interventions on the tourism sector, in particular because of the importance placed on improving transport for tourism by many regions. These should, however, be placed in the context of the overall structure of any local economy as transport improvements which benefit tourism may be at the cost of negative impacts on other sectors. (Paragraph 10.169)
11.44 We recommend that the Department seeks clarification from the Treasury on the valuation of employment gains in areas where regeneration is a key policy objective. (Paragraph 10.182)
Transport and the economy: full report (SACTRA)
233
11.45 In spite of the arguments put to us by economic development consultants that standard procedures are not applicable, given the widely varying circumstances in which appraisals have to be undertaken and the variability of the data available, we believe that some standard procedures would make appraisals easier to understand and compare. We recommend, therefore, that the Department undertakes research to develop codified guidance as to how the appraisal of the benefits/disbenefits additional to the transport benefits/disbenefits should be assessed. We have in mind here a guidance note which parallels, and is broadly as prescriptive as, those which the Department has developed for cost benefit analysis and environmental appraisal. (Paragraph 10.188)
11.46 In order to improve the status quo and meet Appraisal Requirement 3 more satisfactorily, we recommend that there should be:
• a consideration of the economic and market conditions in the relevant areas and the mechanisms likely to be activated by the scheme;
• an assessment of the size of the expected impact on economic activity and jobs in the target area, and of the balance of take-up between existing residents and inward migration; and
• an assessment of the extent of displacement both within the target area and between the target and other areas. (Paragraph 10.194)
11.47 We recommend that, as a matter of standard appraisal practice, specific attention be paid to the effects of an intervention on activities pre-existing in the area targeted for regeneration. (Paragraph 10.200)
11.48 We recommend that the Department investigates further ways in which changes in the pattern of economic activity can be assessed without recourse to a formal model, and issues advice on the analysis of changes in the distribution of economic activity and jobs. (Paragraph 10.206)
11.49 We recommend that the Department considers the methods available for investigating the effects on economic activity of all types of transport interventions (including infrastructure schemes, traffic reduction measures and improvements to public transport) and, if considered practical and affordable, conducts some case studies to enable the development of a better understanding of all the economic development impacts of transport interventions. (Paragraph 10.218)
11.50 We recommend that the Department undertakes research to establish the scale, scope and implications of the 'equilibrium versus dynamics' discussion, and assess what improvements may be feasible. (Paragraph 10.221)
11.51 We recommend that an Economic Impact Report be produced for all schemes, to go alongside the traffic and environmental appraisals currently undertaken. This report should include all the considerations under Appraisal Requirements 1, 2b and 3 which are relevant to the appraisal of the total economic impacts of an intervention and their distribution. The Department should issue advice on the content of the Economic Impact Report at the same time as advice to adopt the new Appraisal Requirements. Clearly, the content of the Economic Impact Report may need to evolve as new methods are developed, along the lines of our other recommendations. (Paragraph 10.225)
Transport and the economy: full report (SACTRA)
234
Appendix A - List of Members and Terms of Reference
List of Members
Chairman
Eileen Mackay CB Formerly Principal Finance Officer at The Scottish Office
Members
Dr Denvil Coombe Director, MVA Limited
Professor Nicholas Crafts FBA Professor of Economic History London School of Economics & Political Science
Professor Phil Goodwin Professor of Transport Policy University College London
Stephen Joseph OBE Director, Transport 2000 Limited
Professor Peter Mackie Professor of Transport Studies University of Leeds
Michael Roberts Head of Industrial Policy Group Confederation of British Industry
Professor Roger Vickerman Jean Monnet Professor of European Economics Centre for European, Regional and Transport Economics University of Kent
Members of the SACTRA Secretariat
Rachel Chandler Richard Batley Anita Chandler David Gott Aidan Grisewood Mark Levy Rose Nwoko Ben Ridehalgh Jill Skilton

Transport and the economy: full report (SACTRA)
235
Terms of Reference for SACTRA
A background
Transport and Economic Growth 1 Work by certain academics on the causes of economic growth has pointed to a close correlation between investment in transport infrastructure and national economic growth. Further studies have questioned both the direction of the causation and the strength of the observed relationship and have acknowledged the very real difficulty in establishing the extent to which investment in transport and infrastructure is a cause of economic growth or the extent to which it is a consequence of a fast growing economy. The analysis of these relationships is made more difficult by the lack of comprehensive data on infrastructure investment, either in terms of the adequacy of the existing stock or additions to that stock, and by differences in definitions between countries.
2 Analysis of the relationship between infrastructure investment and economic growth has tended to focus on national aggregate measures. There is no general agreement about what method might be used to explain how the benefits of individual transport project might contribute to economic growth.
Appraisal Techniques 3 Highway schemes in the UK are appraised using a version of cost benefit analysis which quantifies and values the effects of the scheme on transport users. This is complemented by an assessment of the environmental impacts of the scheme.
4 The use of cost benefit analysis provides an assessment of the contribution of the scheme to a measure of society's overall economic well-being. A consideration arising from the macro-economic studies of the link between transport investment and GDP growth is the question of whether the cost benefit methodology covers all the consequences of transport investment for economic growth or whether there are significant effects which are omitted. A subsidiary question is whether the assessment of these effects makes it possible to derive a quantitative or qualitative measure of the effects of individual transport investment projects on GDP growth.
Transport Intensity 5 There has always been a close correlation between the growth in GDP and growth in road transport. Several commentators on transport policy have raised questions about the extent to which this relationship is necessary, and can or should continue. There are many measures which could reduce the rate of growth of the demand for transport and some of these have been adopted at a national or local level or are proposed as options in the Government's Green Paper on Transport.
6 A policy which further encouraged the adoption of such measures would reflect increasing concern about the environmental consequences of road traffic. The effects of such policies will be to increase the direct and/or indirect costs faced by road users. The extent and incidence of these changes on road users are likely to vary according to the nature and level of environmental benefits delivered and the type of measure adopted.
B. The committee's tasks
Transport and the economy: full report (SACTRA)
236
7 The Committee is invited to consider the literature on the links between transport infrastructure and economic growth. In particular, the Committee will seek to develop an understanding of the underlying factors which contribute towards that relationship. It will review the question of whether the benefits which form part of the conventional cost benefit appraisal of transport schemes are the same as or are related to those factors which explain the relationship between transport investment and economic growth. The Committee should consider whether the conventional appraisal methods omit certain benefits which have an impact on economic growth. The Committee should consider ways of measuring any omitted benefits and the strength of their contribution to economic growth. The Committee is also invited to consider what information would be needed to construct a measure of the effect of individual transport infrastructure projects on GDP growth and whether such a measure could be made operational.
8 The analysis required is likely to have two strands. The first relates to the micro-underpinnings &- the way in which changes in transport costs for industry and individuals feed through into industrial and other production costs. The Department's cost benefit techniques aim to cover many of the effects: the Committee should consider whether these estimates are adequate in the context of this remit or, if not, what additional data or analysis would be necessary. The analysis should cover the responses of the users and operators of goods and commercial vehicles and of business travellers. It should address the way in which these responses feed through into the costs of output. Improved transport infrastructure may have an effect on labour market efficiency or on service sector productivity. Infrastructure changes might serve to widen an employer's labour market catchment area and result in other indirect effects as a consequence of reduced journey to work times on productivity. Cost savings on journeys made for other purposes are less likely to be linked to GDP but the Committee should assess any theoretical basis for such a link and any evidence that might support it.
9 The Committee should consider the likely consequences of measures specifically aimed at reducing transport intensity on the costs faced by users of the transport network. Given that possible measures range from raising the price of travel to physical regulations, the effectiveness of different policies is likely to vary both with respect to impact on transport demand and with respect to its implications for economic efficiency.
10 The second element of the analysis is likely to address the question of how the cost changes resulting from investment in infrastructure or policies such as those aimed at reducing transport intensity influence GDP and sharpen competitive pressures in an open economy. The Committee should assess whether any general conclusions might be drawn about the incidence by region and by country of these cost changes and the impact of these changes on output. If this is a matter that can be established only through empirical analysis, the Committee should consider what data would be required to fulfil this task.
11 The structure set out above for the analysis would logically require a third strand to encompass a comparison of the 'do-something' and 'do-nothing' transport alternatives in the context of the public expenditure requirements of these options. This would be necessary because the level of public spending has broad implications for growth related economic objectives at the macro-economic level.
12 Questions concerning the optimal level and composition of public expenditure go well beyond the terms of this remit. The Committee is not expected to provide any assessment of

Transport and the economy: full report (SACTRA)
237
these issues or of the merits of alternative macro-economic models. They should, however, be aware of the wider context of their study, of which this constitutes an important aspect.
Transport and the economy: full report (SACTRA)
238
Appendix B - Evidence Supplied to the SACTRA Committee
Section One the committee's request for evidence
1) Chairman's letter of 3 march 1997
Dear Sir/Madam,
Transport investment, transport intensity and economic growth
The Department of Transport has asked SACTRA to examine:
• the relationship between improvements in transport provision and economic growth;
• the effectiveness of conventional appraisal methods in measuring the economic growth effects of improvements in transport provision; and
• the appraisal of the economic growth effects of measures to reduce transport intensity.
The Committee wishes to review the evidence comprehensively and has decided to carry out a consultation exercise so as to enable those with interests and expertise to contribute to the inquiry. (In the case of "umbrella" organisations, we would be grateful if this letter could be circulated to members where appropriate.) The deadline for submissions is 31st May 1997.
SACTRA's latest terms of reference are attached at Annex E and our present thinking on the general questions to be addressed is set out in Annex A. Annexes B to D provide some detail of the three main themes of the inquiry and include more in-depth questions.
We invite you to contribute relevant evidence on any form of improvement in transport provision, any mode and any "conventional appraisal technique". Please feel free to focus your contribution solely on those aspects where you have knowledge and expertise. Should you wish to draw our attention to particular evidence, a brief summary note explaining why it is relevant would be welcome, especially if the volume of material is large. We are happy to receive photocopies of excerpts from existing reports, suitably annotated and referenced if this reduces your workload.
When writing our report we may want to quote from the submissions made, and it would be helpful if you could give permission to use any of the material contained in your submission. Material sent "in confidence" should be clearly marked as such.
Although the deadline for submissions is 31st May 1997, it would be helpful if summary or initial information could be provided much sooner. This would allow us to provide feedback on where we might like more detail.
Please send any contribution to Mrs Rachel Chandler, Technical Secretary, SACTRA, Great Minster House, 76 Marsham Street, London SW1P 4DR.
Yours sincerely,
EILEEN MACKAY CB Chairman, SACTRA

Transport and the economy: full report (SACTRA)
239
Annexes A-D appear below. Annex E (Terms of reference) appears as Appendix A of this Report.
2) Annex a of the Chairman's letter General Issues
The Committee's tasks
1 These can be summarised as follows:
• examination of the relationships between improvements in transport provision, user costs and economic growth;
• identification of: - any omissions from conventional appraisal techniques with respect to the impacts, of road schemes and other improvements in transport provision, related to the level and rate of growth of economic activity, and - ways of measuring any omitted benefits and the strength of their contribution to economic growth;
• examination of the scope for developing separate qualitative or quantitative measures of the effect of improvements in transport provision on economic growth;
• examination of the impact of measures to reduce transport intensity on user costs and economic growth;
• a general consideration of the incidence (of the effects under examination) by region/country with a focus on measuring the net effect on economic growth at a national level; and
• identification of data needs, as necessary.
Definitions
2 Economic growth - The primary focus of the Committee's investigation will be on the impact of improvements in transport provision on economic activity as conventionally measured, ie Gross Domestic Product (GDP).
3 Transport intensity - This is a relatively new concept. In broad terms it can be described as the relationship between the volume of transport use and the level of economic activity.
General questions
A1 What is your assessment of the relationship (if any) between improvements in transport provision and national economic activity/growth? Please indicate and comment on the evidence (theoretical, empirical, qualitative) you find most influential in making your assessment.
A2 What is your assessment of the relationship (if any) between improvements in transport provision and local economic activity/growth. In responding, please indicate and comment on:
• the evidence that influences your assessment;
• whether most local economic development is displaced from other locations rather than being a net addition to national economic activity; and,
Transport and the economy: full report (SACTRA)
240
• the significance of inward/mobile investment from abroad.
A3 In what ways is the concept of transport intensity useful or relevant to the appraisal of transport policy measures?
A4 What policy measures are you aware of that would reduce transport intensity (as defined above)? What impact would these measures have on transport user costs and local/regional/national economic growth? In responding, please indicate and comment on the evidence that influences your assessment.
A5 How well do present road and transport appraisal techniques deal with the relationship between transport provision and economic growth? Please indicate and comment on:
• what might be necessary and, if appropriate, what might be done to improve these techniques with regard to the impact on economic growth;
• what supplementary measures (qualitative or quantitative) might be developed to provide a separate indicator of the impact on economic growth; and
• how well do these appraisal techniques deal with the impact on economic growth of measures which reduce transport intensity.
3) Annex B of the Chairman's letter The Relationship Between Improvements In Transport Provision And Economic Growth
Background
4 Recent developments in economic thinking make it opportune to reconsider the links between investments in transport provision and the rate of economic growth of the national economy. For example, both the so-called 'new growth economics'1 and 'new economic geography'2 may have important theoretical insights to offer in this area, while new and controversial empirical results have been reported concerning the growth-promoting effects of infrastructure investment.
5 The committee is already familiar with the main strands of these literatures. It now wishes to probe deeper into their implications for the assessment of improvements in transport provision in the UK. In particular, the committee wishes to clarify the main ways in which impacts on economic growth can occur and to ascertain whether such effects can be quantified reliably.
SACTRA's remit
6 The Committee is requested to:
• "consider the literature on the links between transport infrastructure and economic growth"; and,
• "seek to develop an understanding of the underlying factors which contribute towards that relationship, including the way in which changes in transport costs for industry and individuals feed through into industrial and other production costs".
(See paragraph 7 of the terms of reference).
7 The Committee wishes to examine therefore:

Transport and the economy: full report (SACTRA)
241
• estimates of 'spillover' i.e. wider effects of improved transport provision in terms of induced investment and innovation at the macroeconomic level;
• evidence regarding influences on economic activity through individual decision-making behaviour.
8 Thus, for example, reduced freight costs may affect location decisions of firms, might facilitate the achievement of economies of scale or promote foreign direct investment, and quantification of any such linkages would be of great interest.
Questions
B1 Are there reasons to believe that improvements in transport provision will affect the rate of economic growth? If so, is there reliable evidence on the magnitude of the effects?
B2 What evidence is there that private sector investment decisions are sensitive to public infrastructure investment and what are the implications for our investigation?
B3 In what circumstances, if any, do improvements in transport provision generate 'spillover' effects through promoting changes in costs and associated investment decisions of the business sector?
B4 To what extent do microeconomic and macroeconomic analyses of the relationships between improvements in transport provision and the level and rate of growth of economic activity produce similar conclusions?
B5 What additional empirical analysis of the links between infrastructure investments and economic growth might usefully be carried out?
4) Annex c of the Chairman's letter Conventional Cost Benefit Appraisal Methods For Transport
BACKGROUND
9 Cost benefit analysis provides a framework for assessing the contribution of a improvement in transport provision to society's overall economic well-being by measuring and comparing all significant costs and benefits. It includes benefits, such as savings in leisure time travel, which are not included in conventional measures of economic activity (i.e. GDP). For road schemes, it includes benefits to users in terms of time, accident and vehicle operating cost savings. These savings have an impact on economic activity to the extent they reduce the costs of freight and business-related travel, i.e. the transport element of the cost of producing goods and services is reduced. Many economists would argue that if the savings are correctly measured, and if the impact of the improvement on traffic is correctly forecast, the impact on economic growth should be fully measured.
SACTRA's remit
10 The Committee has been asked to examine the extent to which conventional cost benefit appraisal techniques may omit some of the impact of improvements in transport provision on economic growth. It has also been asked to examine the scope for developing a separate measure of the economic growth effects of improvements in transport provision. (For both tasks see paragraph 7 of the terms of reference).
11 The Committee is already aware of much of the literature on conventional cost benefit appraisal techniques. However, we would be pleased to receive details of any other relevant
Transport and the economy: full report (SACTRA)
242
papers, along with your brief assessment of why you think they are relevant to our investigation. Note also that the Committee is interested in the appraisal of all modes of transport.
Questions
C1 In what respects, and to what extent, might conventional cost benefit appraisal techniques omit some of the effect of improvements in transport provision on the level and rate of economic activity?
C2 What, if any, implications would this have for the current traffic, economic and environmental appraisal methodology? What changes would you suggest:
• in the appraisal of road schemes (using, for example, the COBA methodology);
• in the appraisal of public transport schemes (using, for example, the restricted cost benefit analysis employed in some public transport appraisals); and
• in the appraisal of local transport packages (using, for example, the Common Appraisal Framework).
C3 Have you any suggestions on how the economic growth benefits of improvements in transport provision might be captured in a single measure (quantitative or qualitative) which could supplement the transport cost benefit analysis?
5) Annex D of the chairman's letter The Impact On Economic Growth Of Measures To Reduce Transport Intensity
Background
12 'Transport intensity' is a relatively new concept. In broad terms it can be described as the relationship between the volume of transport use and the level of economic activity.
13 The transport aspect of economic activity is of interest because of growing concern about the environmental impacts of traffic, about the use of scarce resources, and about congestion. This concern is prompting a search for measures which would reduce the volume of transport use relative to the level of economic activity. Reducing transport intensity is not an end in itself; its reduction (it is argued) could be a means to the end of abating the environmental impacts of traffic, reducing the pressure on the transport system (when the option of increasing capacity may be too expensive in either environmental or public expenditure terms), and reducing congestion. An approach which led to more resource-efficient ways of meeting the economy's transport needs could in theory also have a positive impact on economic growth.
14 The request to SACTRA to look at the links between measures which reduce transport intensity and economic growth reflect an assumption that:
• measures which reduce the use of transport are likely to be ones which increase the costs (broadly defined) to transport users; and
• that increases in the costs of transport use could reduce the rate of growth in the economy and more specifically reduce the UK's competitiveness. There is a requirement for methods of appraisal which will allow these factors to be taken into account in making decisions on policies.
Transport and the economy: full report (SACTRA)
243
SACTRA's remit
15 Paragraphs 9 and 10 of the terms of reference specify SACTRA's remit on transport intensity. These can be interpreted as requiring:
• examination of the relationships between various types of measures which reduce transport intensity, and transport users costs, and economic growth/competitiveness at the national level;
• consideration of methodologies for appraising the effects of transport intensity-reducing measures on national economic growth.
Issues/questions
D1 Whether or not a particular measure is categorised as transport intensity-reducing depends on how transport intensity is defined. Since the reduction of transport intensity is not an end in itself, is it necessary to develop both a working definition and a measurable indicator of transport intensity, or would it be sufficient to adopt a simple working definition such as that used above?
D2 There is a range of existing or potential interventions in the transport system whose effect would be both to reduce the environmental impacts and to reduce transport intensity (as broadly defined above). The Committee has identified the following types of measures:
• Pricing measures, such as fuel taxes, motorway tolls, vehicle taxation, parking charges, congestion taxes, etc;
• Subsidies which would, for example, encourage the use of public transport, increase vehicle occupancy, etc; and
• Regulatory measures, such as those which ban specific vehicles in certain circumstances, land use planning restrictions, etc.
We would be interested to receive your views about types of measures not included above but which you consider relevant to our remit.
D3 We are not aware of a great deal of literature on the appraisal (of the economic growth effects) of measures which reduce transport intensity; however, literature focusing on concepts such as "town centre vitality", "peripherality", etc. may have relevance to this issue (and also the rest of the remit). We would be interested to receive contributions covering any of the following:
• information about methodologies which have been, or could be, used to assess the economic growth effects of any of the above-mentioned measures, including your views on the appropriateness of the methodology used;
• evidence, from the UK or abroad, of measures whose impacts on economic development (local, regional or national) have been subject to evaluation;
• evidence of any comparisons between different measures and their impact on economic growth;
• examples of specific measures currently being contemplated, on which the adequacy of conventional cost benefit appraisal methods could be tested; and

Transport and the economy: full report (SACTRA)
244
• suggestions as to how appraisal methods might be improved with regard to identifying the economic growth effects of transport intensity-reducing measures, and views on any further data requirements.
Section Two Responses & contributions
6) Written Evidence
Government departments
Department of the Environment (now part of DETR) Department of Trade & Industry Department of Transport (now part of DETR) Government Office for London Government Office for the Eastern Region Government Office for the North West Government Office for the South East Highways Agency HM Treasury Office of Passenger Rail Franchising Office of the Rail Regulator Planning Inspectorate Scottish Office Welsh Office
Local authorities
Aberdeenshire Council Barnsley Metropolitan Borough Council Cambridgeshire County Council Cheshire County Council Cumbria County Council Dumfries & Galloway Council East Midlands Regional Planning Forum Fife Council Glasgow City Council Kirklees Metropolitan Borough Council London Borough of Barnet London Planning Advisory Committee Norfolk County Council North Lanarkshire Council North of England Assembly North West Regional Association SCEALA &- Standing Conference of East Anglian Local Authorities South Lanarkshire Council Tees Valley Joint Strategy Unit West Sussex County Council
International government organisations
Bundesministerium fur Verkehr, Germany Bureau of Transport and Communications Economics, Canberra, Australia

Transport and the economy: full report (SACTRA)
245
European Commission, Directorate-General II European Commission, Directorate-General VII European Commission, Directorate-General XI Queensland Department of Main Roads, Australia
Interested organisations
Association of Train Operating Companies Automobile Association Babtie Group Bedford Commuters Association Black Country Development Corporation British Property Federation British Airports Authority British Airways British Road Federation British Waterways CAG Consultants Cambridge Econometrics Confederation of British Industry Confederation of Passenger Transport Conseil General des Ponts et Chaussees, France Cooper & Lybrand Council for the Protection of Rural England Countryside Council for Wales Cowie Leaside (now Arriva London North) David Simmonds Consultancy Derek Halden Consultancy Development Board for Rural Wales Dorset Chamber of Commerce Economics-Plus Ltd ECOTEC English Nature English Welsh & Scottish Railway ERM Economics Freight Transport Association Friends of the Earth Friends of the Earth Cornwall Transport Group Friends of the Earth South Dorset Friends of the Earth Wiltshire Network Greater Manchester Public Transport Executive Hague Consulting Group, Netherlands Halcrow Fox Inland Waterways Association Institute for Public Policy Research Institute for Transport Studies, University of Leeds Institution of Civil Engineers Institution of Highways & Transportation John Bates Services KPMG Lincolnshire Training and Enterprise Council Limited

Transport and the economy: full report (SACTRA)
246
Liverpool Chamber of Commerce London Docklands Development Corporation London Transport Planning Marcial Echenique & Partners MVA Consultancy Napier University, Edinburgh National Economic Research Associates National Institute of Economic & Social Research North Staffordshire Chamber of Commerce Northamptonshire Chamber of Commerce Norwich and Norfolk Transport Action Group Passenger Transport Networks Permaculture Association (Britain) Planning Officers Society Rail Freight Group Railtrack Railway Forum Road Haulage Association Royal Commission on Environmental Pollution Royal Society for the Protection of Birds Rural Development Commission Scottish Association for Public Transport Segal Quince Wickstead Society of Motor Manufacturers and Traders Limited South Coast Against Roadbuilding SPOKES &- The Lothian Cycle Campaign Steer Davies Gleave Symonds Travers Morgan Transport 2000 Transport 2000 North Lancs Transport Research Laboratory UK Round Table on Sustainable Development Union Internationale des Transport Publics, Belgium United Kingdom Major Ports Group Limited University of Newcastle, Centre for Urban and Regional Development Studies University of Oxford, Transport Studies Unit West Sussex Economic Forum
Individuals
F A Andrews Professor D Banister Dr. John Bates Professor Michael Carley Peter Champion Professor Michael Chisholm Professor P J Hills Dr. Douglas Holt-Eakin Dr. Simone J Langeweg Professor Nathaniel Lichfield Professor Roger Mackett
Transport and the economy: full report (SACTRA)
247
Brian Parker Stephen Plowden Professor Piet Rietveld David Spaven Peter Stoney Eric van Drunen
7) SACRA research
1The Welfare Implications of Transport Improvements in the Presence of Market Failure by Professor Anthony Venables and Dr. Michael Gasiorek. "The Welfare Implications of Transport Improvements in the Presence of Market Failure"- Reviews by Professor Peter McGregor; Professor Richard Harris (of Simon Fraser University). The Incidence of Imperfect Competition in UK Sectors and Regions by Professor Richard Harris (of Portsmouth University). Review of Evidence on Incidence of Imperfect Competition Margins by Professor Steve Davies.
2Analysis of transport schemes: economic impact studies by David Simmonds Consultancy.
3Review of Methodology for Assessing the Economic Development Impacts of New Highway Infrastructure by George Barrett of ECOTEC; "Review of Methodology for Assessing the Economic Development Impacts of New Highway Infrastructure" - Review by David Walker, ERM Economics.
4Review of Land-Use/Transport Interaction Models by David Simmonds Consultancy in collaboration with Marcial Echenique and Partners. "Review of Land-Use/Transport Interaction Models"- Reviews by Dr. John Bates, Professor Jan Oosterhaven.
5A Framework for Assessing Studies of the Impact of Transport Infrastructure Projects on Economic Activity by John Dodgson, National Economic Research Associates.
6Taxation, Economic Growth and the Double Dividend by Professor Gareth Myles.
8) Miscellaneous consultancy
Professor Alan McKinnon: Responses to follow-up questions from SACTRA.
Dr. John Bates: Seminar on the Common Appraisal Framework.
9) Other submissions to SACTRA
Professor Alan Carruth, Economic Impact of Investments in Trans-European Networks.
Professor Francisco Martinez, "Review of Land-Use/Transport Interaction Models" by David Simmonds Consultancy et al &- Review.
Professor David Newbery, Measuring the Indirect Benefits from Transport Cost Reductions.
Professor Michael Wegener, "Review of Land-Use/Transport Interaction Models" by David Simmonds Consultancy et al &- Review.
Transport and the economy: full report (SACTRA)
248
10) Attendees at seminar on the implications of imperfect competition for transport appraisal
Ms. Elke Amend, University of Kent Dr. John Bates Professor Johannes Broecker, Technische Universitat, Dresden Professor Gordon Clark, University of Oxford John Dodgson, NERA Professor Peter McGregor, University of Strathclyde Professor David Newbery, University of Cambridge Professor Werner Rothengatter, IWW, Universitat Karlsruhe Professor Anthony Venables, London School of Economics Ian Williams, Marcial Echenique & Partners
Representatives of: Department of Environment, Transport & The Regions Department of Trade & Industry Government Office for London HM Treasury Scottish Office
11) Attendees of special meetings and/or additional advice to SACTRA
Professor Alan McKinnon, Heriot-Watt University Douglas McWilliams, CEBR Dr. Stephen Peake
Representatives of: Department of the Environment, Transport & The Regions Government Office for the North West
1 "New growth economics" refers to recent theoretical and empirical work by Paul Rom and others emphasising economic growth as endogenous to an economic system, rather than as the result of outside forces.
2 "New economic geography" refers to recent work by Paul Krugman and others analysing industry's location decisions in the context of imperfect competition and economies of scale.
Transport and the economy: full report (SACTRA)
249
Appendix C - Economic Effects of Transportation Activities For copyright reasons, Appendix C is not available on the internet.
Copies of the report, 'Transport and the Economy', including Appendix C, ISBN 0 11 7535079, price £30, are available from:
The Stationery Office, Publication Centre PO Box 276, London SW8 5DT
Tel: 0870 600 5522 Fax: 0870 600 5533
Transport and the economy: full report (SACTRA)
250
Appendix D - Interpretation and Analysis of Transport Intensity 1 As summarised in Chapter 6, Peake noticed that after a long period of increasing intensity, the 1989 DETR traffic forecasts implied that transport intensity would turn and start decreasing around the turn of the century. He pointed out that this was very odd. It could not have been due to assumed successful implementation of policies intended to procure such an outcome, for which there were neither mechanisms nor assumptions in the forecasting methods used. To discover whether the evidence reveals an answer, this appendix presents an analysis of transport intensity, followed by a comparison of international data.
Analysis of Transport Intensity
2 The Committee decided it was necessary to seek answers to the following questions about transport intensity.
• Is it true that transport intensity has been systematically increasing for a long period, but is expected to start decreasing in the near future?
• If so, what is the assumed or revealed mechanism which was expected to bring this about?
• Are traffic levels tightly influenced by GDP alone, or is it subject to influence from other factors, especially policy intervention?
Is it true that transport intensity has been systematically increasing for a long period, but is expected to start decreasing in the near future?
3 The Committee spent some time in discussion with DETR officials, concerning analysis of the 1989 forecasts, updating them to take account of the 1997 forecasts which became available during our inquiry.
4 Figure D1 below shows that between 1965 and 1995 there was a positive correlation between traffic growth and economic growth. Over this period car traffic grew faster than LGV traffic, and LGV traffic grew at a faster rate than HGV traffic. Compared to GDP growth over the period, car and LGV traffic have grown at a faster rate, whilst HGV traffic has grown at a slightly slower rate.
Figure D1 Road Traffic and GDP: UK 1965-1995 Source: Transport Statistics Great Britain, ONS

Transport and the economy: full report (SACTRA)
251
5 Thus, prima facie, the first conclusion is that the intensity of car and LGV traffic has been increasing over the period, and the intensity of HGV traffic has been decreasing. This can now be tested in greater detail.
6 Formally, measures of intensity are defined as a ratio of some indicator of the volume of traffic or transport, to some indicator of national income. When traffic growth is greater than GDP growth, intensity is increasing, and when traffic growth is less than GDP growth, intensity is decreasing (though the actual volume of traffic will still, in that case, be increasing). In order to compare trends when using different indicators, it is useful to convert the actual units into a dimensionless measure which focuses on growth trends rather than the level of the physical quantities concerned. One way of depicting this is to subtract the percentage GDP change from the percentage traffic change: then a positive value shows increasing intensity and a negative value shows decreasing intensity.
7 These figures are shown separately for cars, LGVs and HGVs, in Figures 6.1 - 6.3 of the main text. To lessen the effect of erratic year to year influences, each year's value is calculated as a five year moving average. Values have been calculated using actual data to 1995 and GDP and traffic forecast values from the 1989 NRTF to 2025.
8 Looking first at Figure 6.1, depicting car traffic intensity, there is a clear contrast between the actual and forecast values. The actual values, to 1995, are all positive, whilst the forecast values thereafter are all negative, and are stable.
9 The intensity for heavy goods vehicles, shown in Figure 6.2 of the main text, is quite different. Intensity has been generally declining, apart from a period covering the late 1980s and early 1990s, and is forecast to decline in the future at an increasing rate.
Transport and the economy: full report (SACTRA)
252
10 In the case of light goods vehicles, intensity showed a volatile pattern - negative some years and positive in other years. The 1989 NRTF forecast that intensity would stay stable (ie, LGV traffic would grow at the same rate as GDP). In the event, the early 1990s showed a growth of LGV traffic faster than GDP, and intensity increased.
Conclusion 11 This discussion establishes that changes in transport intensity are quite a volatile indicator: there is considerable variation not only in size, but also in direction of movement, from period to period and even from year to year. But overall, Peake's observation (1994) was correct - the 1989 national road traffic forecasts did predict a decline in intensity, in spite of a long period where it had shown a generally increasing trend. Further, for all classes of traffic the forecasts failed to predict the substantial increases in intensity which occurred in the early 1990s. Thus the implied intensity forecast was consistent neither with its historic behaviour, nor with events for the first few years after the forecasts were made. This was true to a varying extent for cars, LGVs and HGVs.
12 However, if the late 1980s and early 1990s are ignored, then there appears to be less discrepancy on the diagrams. For car traffic (which is the largest component of all traffic) in particular, there does seem to have been an indication that traffic intensity, though increasing, was doing so at a declining rate, and might start to turn down soon.
What is the assumed or revealed mechanism which was expected to bring about this decrease in transport intensity?
13 In the short term, developments in each class of traffic may be discussed with reference to specific changes in the economy, structures of production and tastes, industrial activities, variations in economic optimism, etc. However, examination of Figures 6.1 - 6.3 in the main text shows that the biggest discrepancy between performance and forecast is in relation to car traffic - which is also the largest class of traffic, and its growth has been, and is expected to remain, the largest contributor to overall traffic growth.
14 For this reason, the forecast decline in intensity noted by Peake seems to have been dominated by the forecast decline in intensity of car traffic. Here we may make three important observations about the way in which car traffic forecasting was done for the 1989 NRTF (which remain broadly true for the 1997 NRTF).
• The forecast growth in traffic is largely determined by the forecast growth in car ownership: factors which might make the mileage travelled per car change, in the NRTF, are assessed to be fairly small by comparison.
• The forecast growth in car ownership is largely determined by the forecast growth in incomes (hence GDP): other factors which might influence car ownership are assessed to be fairly small by comparison.
• The nature of the relationship between car ownership and income is assumed to lead to an eventual saturation level, and to increase more and more slowly as this is approached.
15 These three features together determine that the intensity of car traffic is certain to decline in the forecasts. This is shown mathematically below.
16 Thus under the assumptions of the 1989 forecasts, traffic intensity must inherently, after a certain level of car ownership, start to decline of its own accord. This process is quite independent of policy initiatives.

Transport and the economy: full report (SACTRA)
253
Assume an S-shaped (saturating) curve such as is in use for car ownership forecasting, ie
Y = f(X)
so dY/dX =f'(X)
& E, the elasticity of traffic with respect to income, is
E = f'(X) X/Y
Transport intensity Z= Y/X
and dZ/dX = d/dX {f(X)/X}
which is negative when E<1
It is in the nature of an S-shaped growth curve that E>1 at low levels, and E<1 at high levels as saturation is approached. So transport intensity will grow during the first 'half' (approximately) of the growth curve, when E > 1, and decline during the second half, when E < 1.
Conclusion 17 One consequence of this discussion was to convince us that the measure 'transport intensity' may not be so revealing either of underlying trends in the economy, or of the effectiveness of transport policies, as had been assumed. To the extent that the underlying relationships in the forecasts are correct, the difference between periods of increasing and reducing intensity will be indications of the maturity of the car ownership growth curve rather than the success or otherwise of policies intended to influence traffic growth. Such success would be reflected in the measured traffic intensity, but more indirectly, as a curve which moved (upwards or downwards) at a lower level than would otherwise have happened, requiring a judgement which is not readily shown simply by empirical analysis.
18 We are therefore able to discount fears that there may have been some form of 'wishful thinking' in the 1989 forecasts' treatment of policy initiatives, which led to the expected fall in transport intensity. For car traffic, the forecast arose because of assumptions about the mathematical form of the estimated relationship between car ownership and income, which dominated the forecasts. For other classes of traffic, the argument is not so clear cut.
Are traffic levels tightly influenced by gdp alone, or is it subject to influence from other factors, especially policy intervention?
19 Even apart from the long-run car ownership effect, the above discussion shows that the UK experience includes periods when the measure of transport intensity rises or declines, and behaves differently for car use, light and heavy goods vehicles. Simply the observation of such differences is of importance, since they raise the possibility that other factors affecting traffic levels are at work besides economic growth itself. However, that is a different question from identifying what these other factors might be, and their respective strengths.
20 Therefore the discussion in Chapter 6 about the evidence on effects on traffic levels of changes in price, infrastructure provision, etc, is directly relevant to the interpretation of changes in intensity. At one extreme, if traffic growth is fuelled only by income and is of a saturating form, then intensity will show a growth, then decline, which is as smooth as the
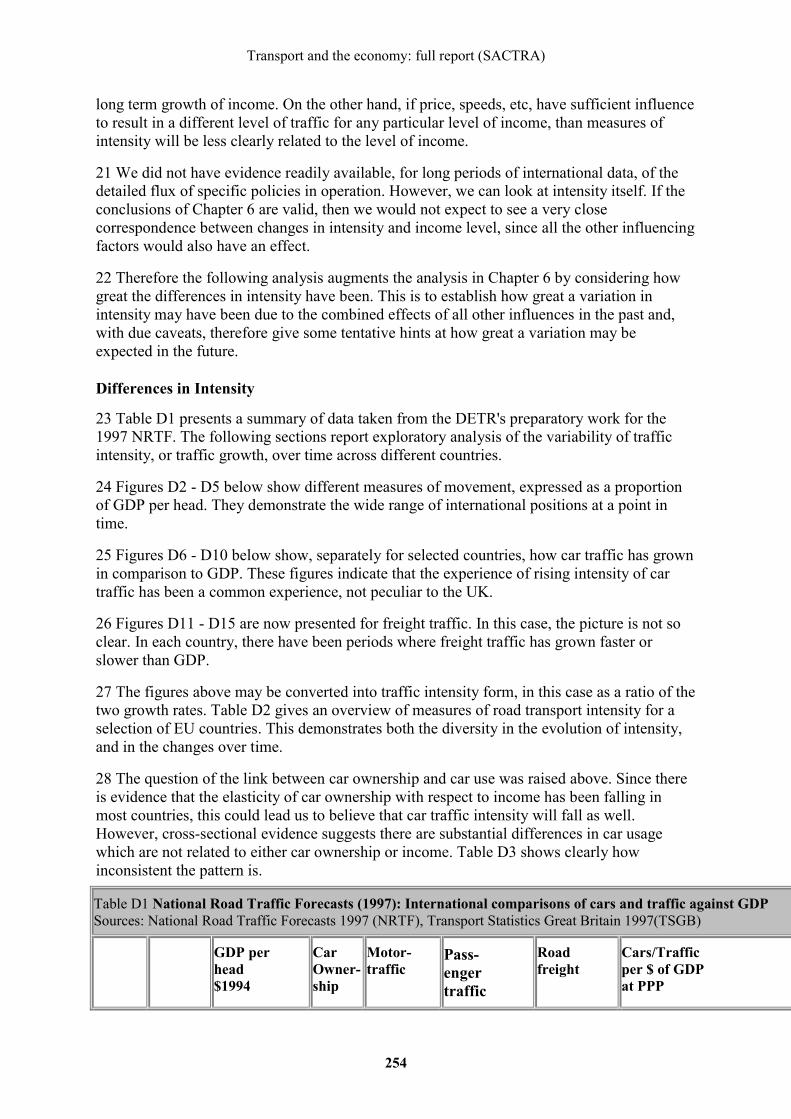
Transport and the economy: full report (SACTRA)
254
long term growth of income. On the other hand, if price, speeds, etc, have sufficient influence to result in a different level of traffic for any particular level of income, than measures of intensity will be less clearly related to the level of income.
21 We did not have evidence readily available, for long periods of international data, of the detailed flux of specific policies in operation. However, we can look at intensity itself. If the conclusions of Chapter 6 are valid, then we would not expect to see a very close correspondence between changes in intensity and income level, since all the other influencing factors would also have an effect.
22 Therefore the following analysis augments the analysis in Chapter 6 by considering how great the differences in intensity have been. This is to establish how great a variation in intensity may have been due to the combined effects of all other influences in the past and, with due caveats, therefore give some tentative hints at how great a variation may be expected in the future.
Differences in Intensity
23 Table D1 presents a summary of data taken from the DETR's preparatory work for the 1997 NRTF. The following sections report exploratory analysis of the variability of traffic intensity, or traffic growth, over time across different countries.
24 Figures D2 - D5 below show different measures of movement, expressed as a proportion of GDP per head. They demonstrate the wide range of international positions at a point in time.
25 Figures D6 - D10 below show, separately for selected countries, how car traffic has grown in comparison to GDP. These figures indicate that the experience of rising intensity of car traffic has been a common experience, not peculiar to the UK.
26 Figures D11 - D15 are now presented for freight traffic. In this case, the picture is not so clear. In each country, there have been periods where freight traffic has grown faster or slower than GDP.
27 The figures above may be converted into traffic intensity form, in this case as a ratio of the two growth rates. Table D2 gives an overview of measures of road transport intensity for a selection of EU countries. This demonstrates both the diversity in the evolution of intensity, and in the changes over time.
28 The question of the link between car ownership and car use was raised above. Since there is evidence that the elasticity of car ownership with respect to income has been falling in most countries, this could lead us to believe that car traffic intensity will fall as well. However, cross-sectional evidence suggests there are substantial differences in car usage which are not related to either car ownership or income. Table D3 shows clearly how inconsistent the pattern is.
Table D1 National Road Traffic Forecasts (1997): International comparisons of cars and traffic against GDP Sources: National Road Traffic Forecasts 1997 (NRTF), Transport Statistics Great Britain 1997(TSGB)
GDP per head $1994
Car Owner-ship
Motor- traffic
Pass- enger traffic
Road freight
Cars/Traffic per $ of GDP at PPP

Transport and the economy: full report (SACTRA)
255
Population (millions)
At market exchange rates
At PPP
Cars per 000 pop 1994
Car traffic per head 1994 (km 000)
All motor traffic per head 1994 (km 000)
Cars and taxis: bn. passngr km 1994
Cars and taxis: passngr km per head
Goods moved bn tonne km 1994
Goods moved bn tne km per head
Car Ownership per $000 of GDP
Car traffic km per $000 of GDP
All motor traffic km per $000 of GDP
Passngr traffic km per $000 of GDP
OaR
UK 58.4 17443 17621 372 6.1 7.4 590.0* 10103 140.7 2409 21 346 420 573 1
Belgium 10.1 22687 20314 416 5.4 89.5 8861 41.6 4119 20 266 436 1
Denmark 5.2 28043 20438 309 6.2 7.7 59.1 11365 9.5 1827 15 303 377 556 1
France 57.9 22987 19232 430 6.1 8.4 654.9 11311 122.1 2109 22 317 437 588 1
Germany 81.4 25133 19671 488 6.2 7.2 741.9 9114 163.8 1889 25 315 366 463 1
Greece 10.4 9388 11582 188 14 1346 16
Ireland 3.6 15099 15794 263 6.4 7.9 5.2 1444 17 405 500
Italy 57.2 17768 18648 532 5.6 6.8 624.1 10911 187.5 3278 29 300 365 585 1
Lux. 0.4 36089 30198 567 8.2 0.7 1750 19 272
N'lands 15.4 21896 18723 383 5.8 7.1 146.9 9539 25.7 1669 20 310 379 509 1
Portugal 9.9 8575 12027 263 3.7 75.8 7657 10 1010 22 308 637 2
Spain 39.2 12337 13596 343 2.9 3.8 205.2 5235 172.3 4395 25 213 279 385 1
Finland 5.1 19186 16274 368 7 8.4 49.6 9725 24.8 4863 23 430 516 598 1
Norway 4.3 28423 21956 381 5.4 6.5 41.8 9721 8.9 2070 17 246 296 443 1
Sweden 8.9 22598 17583 409 6.2 6.9 81.9 9202 25.9 2910 23 353 392 523 1
Switz. 7.0 36669 23860 450 6.3 7.5 75.1 10729 11.1 1586 19 264 314 450 1
Australia 17.9 18187 18517 460 6.9 25 373
Japan 125.0 37509 21171 344 3.3 591 4728 275.9 2207 16 156 223 1
USA 260.7 25512 25512 514 9.8 14.6 4440.1 17034 1403 5382 20 384 572 668 1
Average: 394 6 7.7 564.5 9682 146.3 2570 21 309 401 509 1
Note: * Great Britain 573.0bn passenger km + estimate for Northern Ireland
29 Countries with high income and car ownership such as Italy and Germany have lower actual car use than countries such as Ireland and Finland with much lower car ownership, where presumably spatial structure and the supply of alternative transport forms are less. The UK displays rather a high level of car usage for its level of car ownership with similar levels of usage to France and Germany, despite car ownership levels only 75 per cent of the German
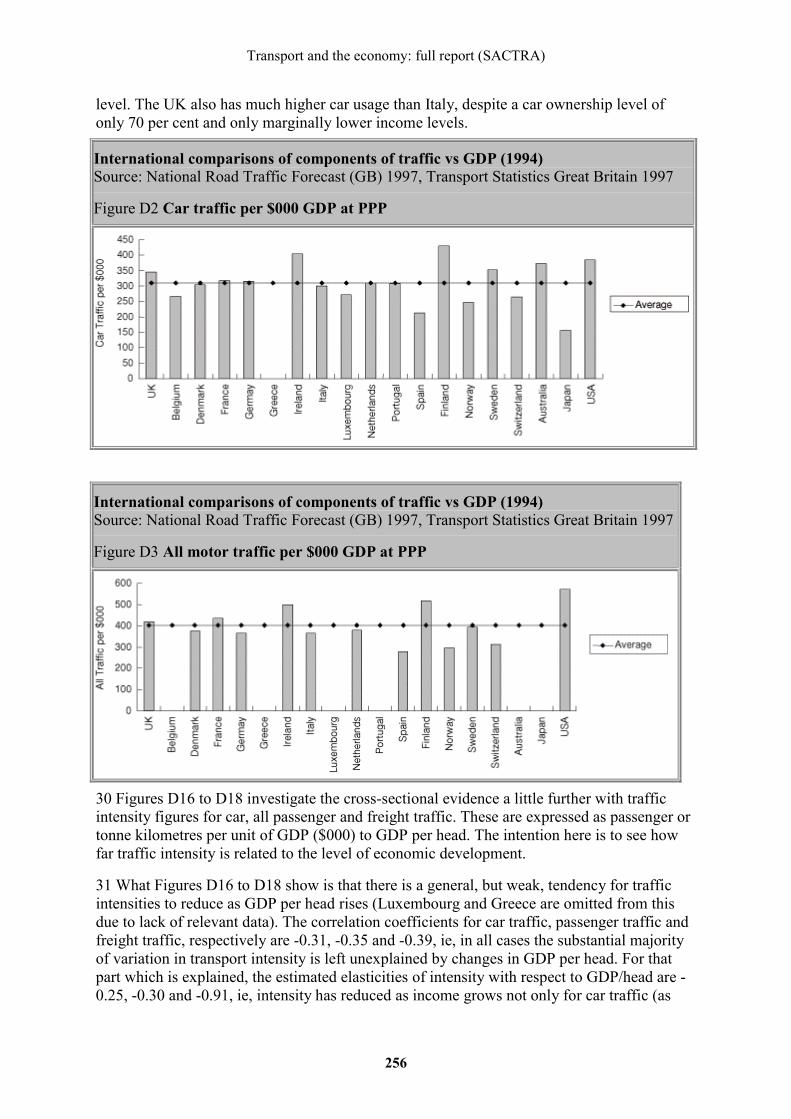
Transport and the economy: full report (SACTRA)
256
level. The UK also has much higher car usage than Italy, despite a car ownership level of only 70 per cent and only marginally lower income levels.
International comparisons of components of traffic vs GDP (1994) Source: National Road Traffic Forecast (GB) 1997, Transport Statistics Great Britain 1997
Figure D2 Car traffic per $000 GDP at PPP
International comparisons of components of traffic vs GDP (1994) Source: National Road Traffic Forecast (GB) 1997, Transport Statistics Great Britain 1997
Figure D3 All motor traffic per $000 GDP at PPP
30 Figures D16 to D18 investigate the cross-sectional evidence a little further with traffic intensity figures for car, all passenger and freight traffic. These are expressed as passenger or tonne kilometres per unit of GDP ($000) to GDP per head. The intention here is to see how far traffic intensity is related to the level of economic development.
31 What Figures D16 to D18 show is that there is a general, but weak, tendency for traffic intensities to reduce as GDP per head rises (Luxembourg and Greece are omitted from this due to lack of relevant data). The correlation coefficients for car traffic, passenger traffic and freight traffic, respectively are -0.31, -0.35 and -0.39, ie, in all cases the substantial majority of variation in transport intensity is left unexplained by changes in GDP per head. For that part which is explained, the estimated elasticities of intensity with respect to GDP/head are -0.25, -0.30 and -0.91, ie, intensity has reduced as income grows not only for car traffic (as
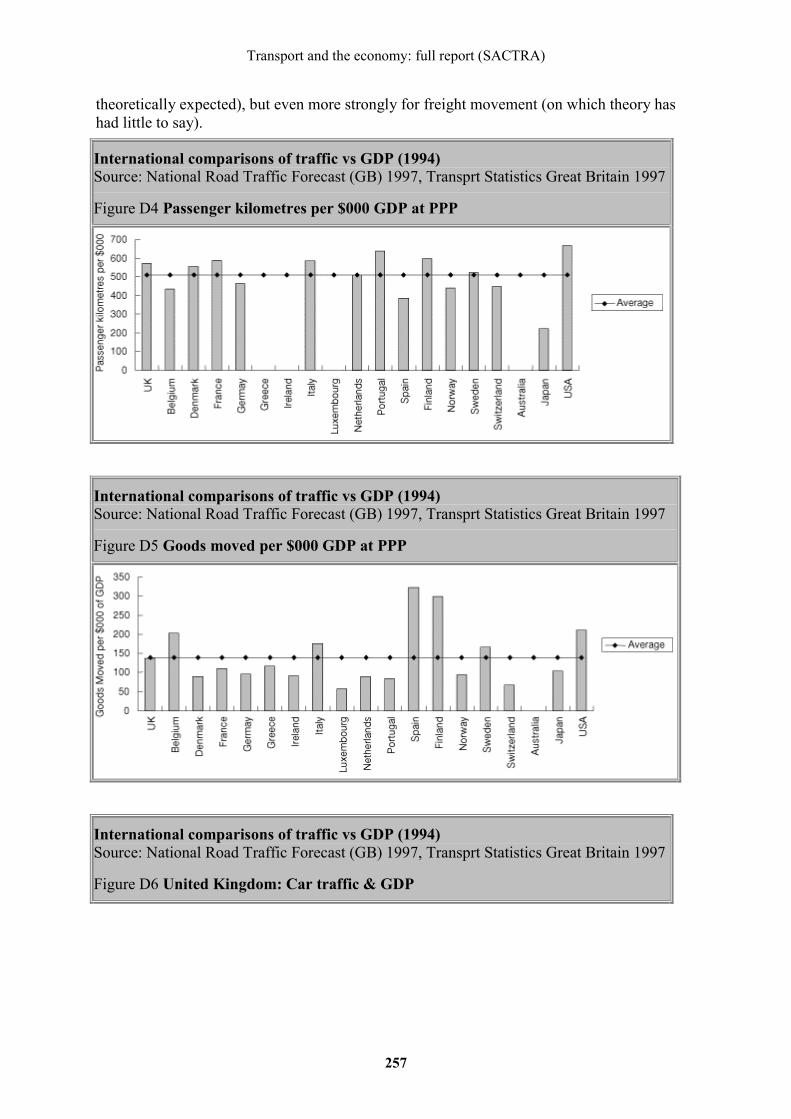
Transport and the economy: full report (SACTRA)
257
theoretically expected), but even more strongly for freight movement (on which theory has had little to say).
International comparisons of traffic vs GDP (1994) Source: National Road Traffic Forecast (GB) 1997, Transprt Statistics Great Britain 1997
Figure D4 Passenger kilometres per $000 GDP at PPP
International comparisons of traffic vs GDP (1994) Source: National Road Traffic Forecast (GB) 1997, Transprt Statistics Great Britain 1997
Figure D5 Goods moved per $000 GDP at PPP
International comparisons of traffic vs GDP (1994) Source: National Road Traffic Forecast (GB) 1997, Transprt Statistics Great Britain 1997
Figure D6 United Kingdom: Car traffic & GDP
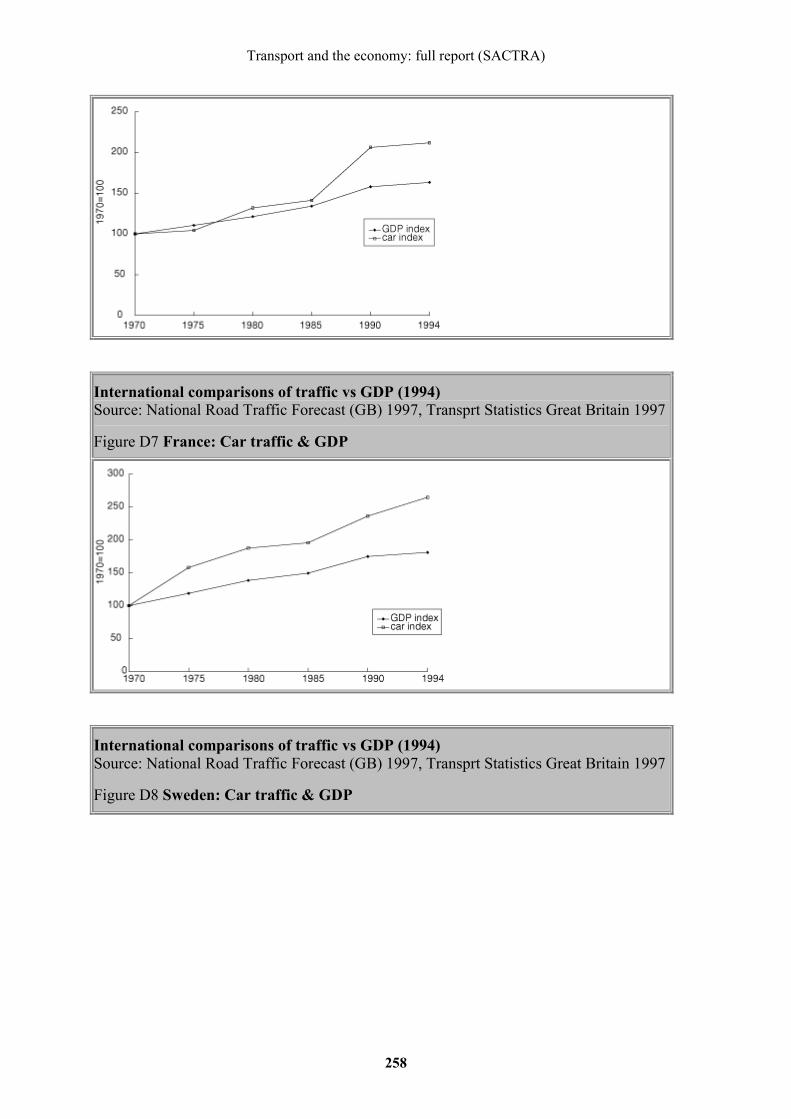
Transport and the economy: full report (SACTRA)
258
International comparisons of traffic vs GDP (1994) Source: National Road Traffic Forecast (GB) 1997, Transprt Statistics Great Britain 1997
Figure D7 France: Car traffic & GDP
International comparisons of traffic vs GDP (1994) Source: National Road Traffic Forecast (GB) 1997, Transprt Statistics Great Britain 1997
Figure D8 Sweden: Car traffic & GDP

Transport and the economy: full report (SACTRA)
259
International comparisons of traffic vs GDP (1994) Source: National Road Traffic Forecast (GB) 1997, Transprt Statistics Great Britain 1997
Figure D9 Netherlands: Car traffic & GDP
International comparisons of traffic vs GDP (1994) Source: National Road Traffic Forecast (GB) 1997, Transprt Statistics Great Britain 1997
Figure D10 Italy: Car traffic & GDP
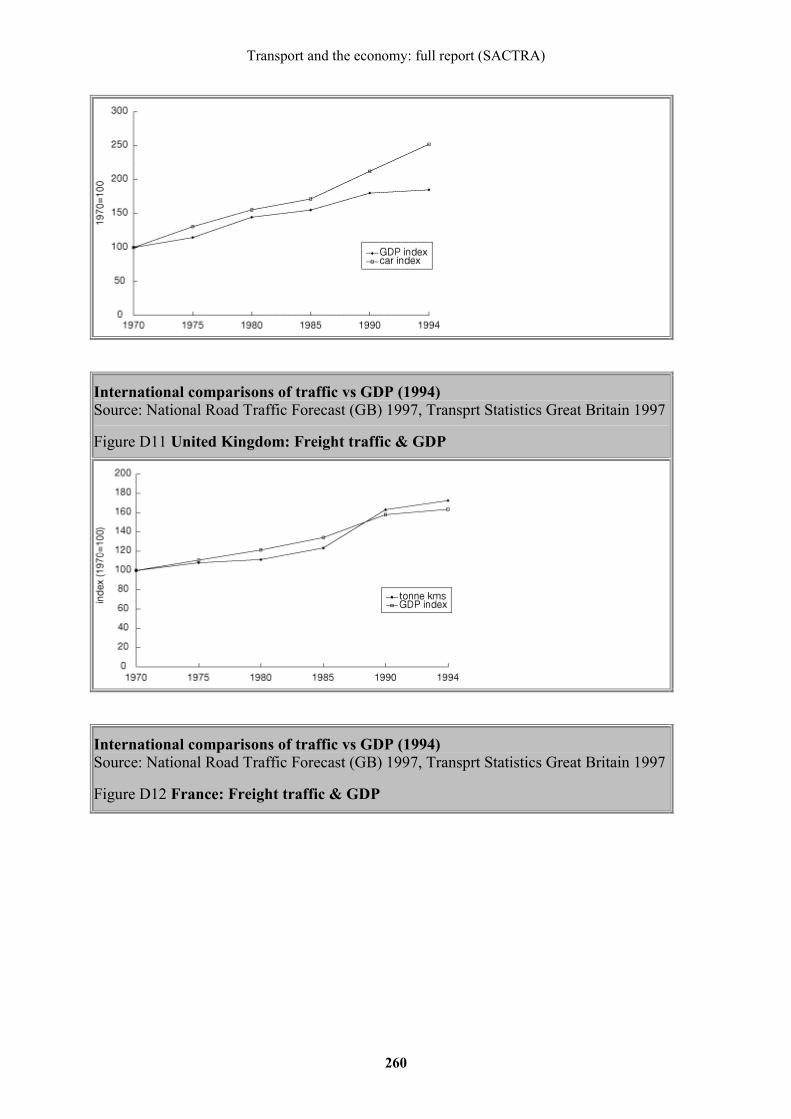
Transport and the economy: full report (SACTRA)
260
International comparisons of traffic vs GDP (1994) Source: National Road Traffic Forecast (GB) 1997, Transprt Statistics Great Britain 1997
Figure D11 United Kingdom: Freight traffic & GDP
International comparisons of traffic vs GDP (1994) Source: National Road Traffic Forecast (GB) 1997, Transprt Statistics Great Britain 1997
Figure D12 France: Freight traffic & GDP
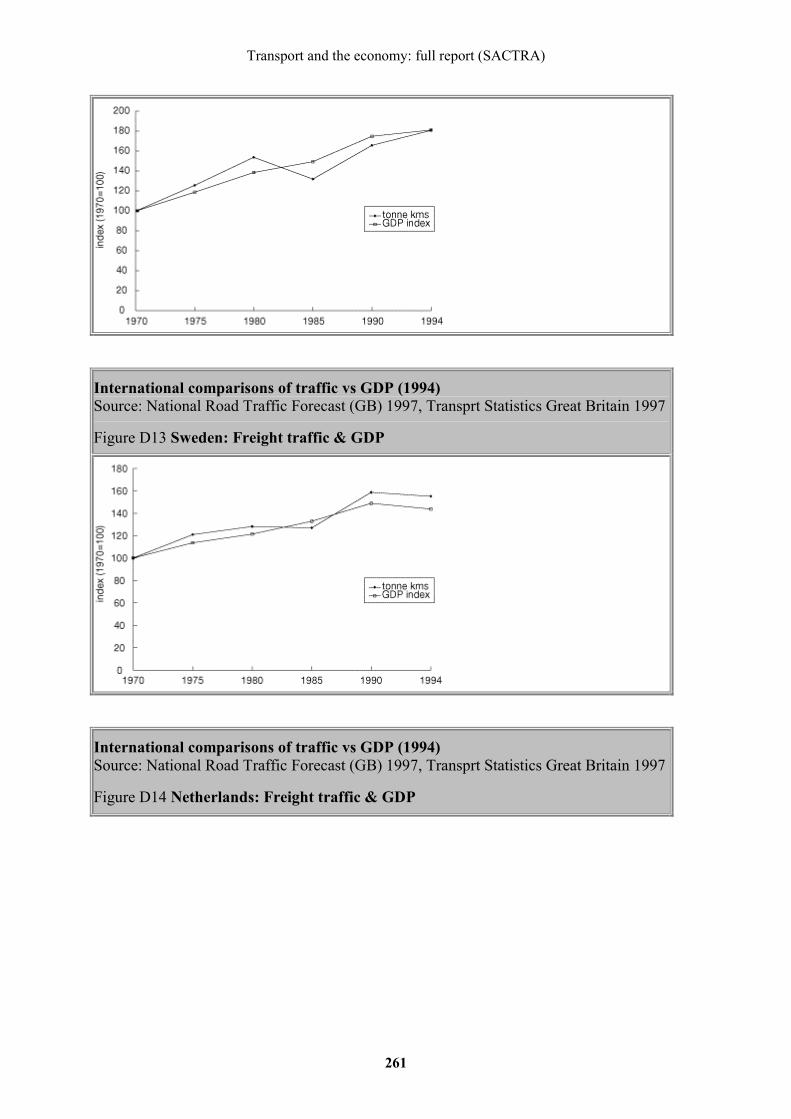
Transport and the economy: full report (SACTRA)
261
International comparisons of traffic vs GDP (1994) Source: National Road Traffic Forecast (GB) 1997, Transprt Statistics Great Britain 1997
Figure D13 Sweden: Freight traffic & GDP
International comparisons of traffic vs GDP (1994) Source: National Road Traffic Forecast (GB) 1997, Transprt Statistics Great Britain 1997
Figure D14 Netherlands: Freight traffic & GDP

Transport and the economy: full report (SACTRA)
262
International comparisons of traffic vs GDP (1994) Source: National Road Traffic Forecast (GB) 1997, Transprt Statistics Great Britain 1997
Figure D15 Italy: Freight traffic & GDP
Table D2 Traffic intensity measures
Car traffic growth (pkm)/GDP growth Freight traffic growth (tkm)/GDP growth
1970-1985 1985-1994 1970-1985 1985-1994
UK 1.05 1.23 0.92 1.15
France 1.31 1.21 0.88 1.13
Sweden 1.06 1.12 0.96 1.13
Netherlands 1.26 0.98 1.06 1.11
Italy 1.11 1.23 1.58 1.09
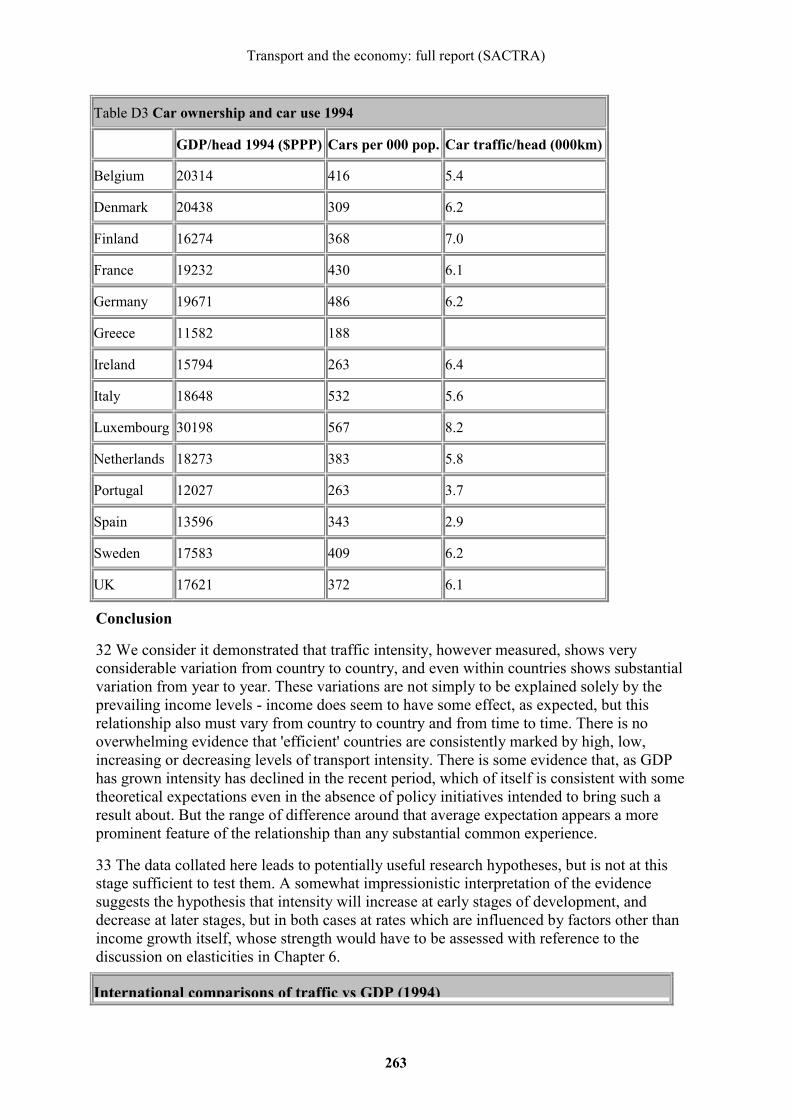
Transport and the economy: full report (SACTRA)
263
Table D3 Car ownership and car use 1994
GDP/head 1994 ($PPP) Cars per 000 pop. Car traffic/head (000km)
Belgium 20314 416 5.4
Denmark 20438 309 6.2
Finland 16274 368 7.0
France 19232 430 6.1
Germany 19671 486 6.2
Greece 11582 188
Ireland 15794 263 6.4
Italy 18648 532 5.6
Luxembourg 30198 567 8.2
Netherlands 18273 383 5.8
Portugal 12027 263 3.7
Spain 13596 343 2.9
Sweden 17583 409 6.2
UK 17621 372 6.1
Conclusion
32 We consider it demonstrated that traffic intensity, however measured, shows very considerable variation from country to country, and even within countries shows substantial variation from year to year. These variations are not simply to be explained solely by the prevailing income levels - income does seem to have some effect, as expected, but this relationship also must vary from country to country and from time to time. There is no overwhelming evidence that 'efficient' countries are consistently marked by high, low, increasing or decreasing levels of transport intensity. There is some evidence that, as GDP has grown intensity has declined in the recent period, which of itself is consistent with some theoretical expectations even in the absence of policy initiatives intended to bring such a result about. But the range of difference around that average expectation appears a more prominent feature of the relationship than any substantial common experience.
33 The data collated here leads to potentially useful research hypotheses, but is not at this stage sufficient to test them. A somewhat impressionistic interpretation of the evidence suggests the hypothesis that intensity will increase at early stages of development, and decrease at later stages, but in both cases at rates which are influenced by factors other than income growth itself, whose strength would have to be assessed with reference to the discussion on elasticities in Chapter 6.
International comparisons of traffic vs GDP (1994)
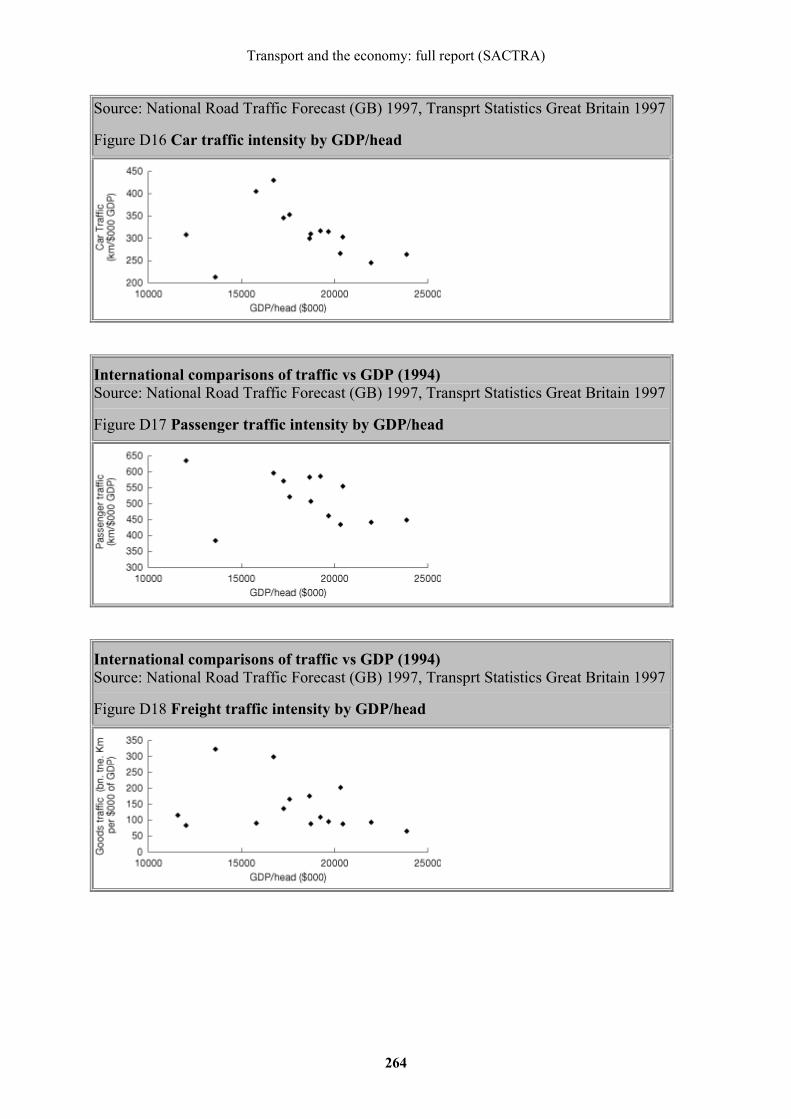
Transport and the economy: full report (SACTRA)
264
Source: National Road Traffic Forecast (GB) 1997, Transprt Statistics Great Britain 1997
Figure D16 Car traffic intensity by GDP/head
International comparisons of traffic vs GDP (1994) Source: National Road Traffic Forecast (GB) 1997, Transprt Statistics Great Britain 1997
Figure D17 Passenger traffic intensity by GDP/head
International comparisons of traffic vs GDP (1994) Source: National Road Traffic Forecast (GB) 1997, Transprt Statistics Great Britain 1997
Figure D18 Freight traffic intensity by GDP/head

Transport and the economy: full report (SACTRA)
265
Appendix E - Benefits and Disbenefits of Traffic Reduction Measures
General Appraisal Issues with respect to Traffic Reduction Measures
1 Few transport interventions, if any at all, have wholly, or even largely, beneficial effects. For an intervention to be justified, there is always a need to assess the overall worth of the project - that is, the extent to which the benefits exceed the disbenefits and the relationship of the net benefits to the costs of implementation, operation and maintenance. By 'benefits' and 'disbenefits' we include here all impacts, whether they are normally monetised, or quantified in some other units, or dealt with qualitatively.
2 The first general point to make is that, for there to be a gain in welfare, the net benefits must exceed the costs. It is not sufficient simply for there to be benefits; the benefits must not only exceed the disbenefits but also the resulting net benefit must exceed the costs for there to be any gain in welfare.
3 When considering charging mechanisms aimed at reducing traffic demand, this requirement that benefits exceed costs is likely to be met where current prices of travel paid by travellers are less than marginal social costs, including all externalities, such as the extra congestion caused by the marginal traveller on congested road systems and the environmental impacts most road traffic causes.
4 The second general point concerns the relationship between a change in welfare and a change in economic performance. It can be argued that as long as the welfare of an area increases as a result of traffic reduction measure, the local economy can be expected to be unharmed and may gain.
5 The third general point relates to the revenue streams derived from some traffic reduction mechanisms and the distribution of these benefits. Some mechanisms can be shown to yield substantial benefits (as will be seen below), the main component of which is formed by the revenues, net of operating costs, which would accrue to the authority implementing the charges. The charged area will only benefit from charging if two conditions are met:
• that the net revenues are spent in the affected area; and
• that the revenues are spent wisely so that they produce a net welfare gain.
6 The fourth general point concerns the nature of the overall appraisal process. The Government's objectives for transport - economy, accessibility, safety, environment and integration- can be argued to encapsulate most of the effects of a transport intervention. In effect, all these objectives are covered by two main analyses: a cost benefit analysis in which all user and operator costs and benefits are converted into money terms, and an environmental impact analysis in which no money values are used. Safety benefits are normally monetised and included in the cost benefit analysis, and it can be argued that the total accessibility benefits are subsumed by the user benefits included in the cost benefit analysis. The overall appraisal process therefore amounts to balancing the outputs from the monetised cost benefit analysis and the non-monetised environmental impact analysis. The advent of the DETR's New Approach to Appraisal (NATA - DETR 1998) has meant that the information from the two main analysis strands are presented for the decision-maker in a much more balanced and open way in the Appraisal Summary Table (AST).

Transport and the economy: full report (SACTRA)
266
7 In an ideal world, it would be convenient if all impacts could be monetised and included in the cost benefit analysis. Note that this would not contravene the aims of the AST; it would simply make the trade-off between all the entries easier to make. If all effects could be monetised, then one could search for the economically optimum level of charging - that is, the charge level which maximised the total economic benefits - in a systematic and mechanised manner. Given that we cannot monetise all the impacts, the process of searching for an optimum level of charging has to involve making a judgement about the balance of monetised and non-monetised effects for a range of charging levels.
8 We now turn to four selected traffic reduction measures - urban congestion charging, parking controls, motorway charging and road capacity reductions or roadspace reallocations, and we concentrate in what follows on the monetised benefits.
Urban Congestion Charging
9 Urban congestion charging schemes may take many forms, including:
• Congestion Metering - The charge levied would reflect the congestion caused by each driver, and would vary according to traffic conditions, both across the charged area and by time;
• Time-Based Charging - A version of congestion metering, where the charge would be directly proportional to the time spent travelling within the charged area;
• Distance-Based Charging - Drivers would be charged directly for the distance travelled within the charged area;
• Point-Based or Cordon Charging - Drivers are charged when they pass a point which forms part of a continuous boundary, with charge levels potentially varying by direction; and
• Supplementary Licences - A charge is levied to either enter an area (an entry permit) or to be within an area (an area licence).
10 The monetised benefits and disbenefits of urban congestion charging systems may include the following:
• those road users who are restrained from travelling as they wish would incur a disbenefit;
• transfers to public transport as a result of the charges could lead to either increased revenues to the operators or to the operator providing more frequent public transport services and/or lower public transport fares, and, as a consequence, either the operators or continuing users of public transport (or to some extent both) would benefit;
• continuing travellers by road would receive benefits arising from reduced congestion, which would mean quicker journeys and increased reliability, with only some of these travellers having to pay a charge under systems which do not charge everyone who would experience reduced congestion;
• continuing travellers by road could receive either benefits or disbenefits in terms of changed vehicle operating costs arising from reduced congestion;
• some continuing road travellers would incur disbenefits in the form of the charges they would have to pay, to the extent that, in the case of low income travellers, their benefits from congestion relief may be outweighed, whereas in the case of high income travellers the reverse could be true, depending on the level of charge applied; and

Transport and the economy: full report (SACTRA)
267
• the charging authority would benefit to the extent that its revenues (from both charges and penalties for infringements) exceed its costs of operation, maintenance and enforcement, although car park operators may suffer disbenefits to the extent that they experience reductions in revenues which cannot be matched by reduced costs.
11 In addition to the monetised benefits and disbenefits noted above, there would be the environmental impacts to consider. Generally, there would be environmental gains, certainly at the global level, with the distribution of the local impacts being a matter which would depend on the local circumstances and the intrusiveness of the charging system itself. In total terms, accessibility benefits are likely to be much the same as the user benefits. Whether any safety benefits actually accrue would depend on the specific circumstances, with lower traffic levels leading to fewer accidents but higher speeds potentially increasing accidents. There may also be benefits to pedestrians and cyclists from reduced traffic. For pedestrians, the benefits may be manifest as safer and quicker crossings of roads, while for cyclists the main benefits may be in the form of fewer accidents.
Parking Controls
12 Parking controls may take several forms, including:
• Better Enforcement of existing or modified controls, either directed at the driver or the supplier of parking;
• Changes in the Cost of Parking, which may be diluted if enforcement is ineffective, and noting that the 'cost' may be the charge for proper use of space or the penalty cost of misuse; and
• Changes in the Amount of Space Available, either in absolute terms or through restrictions at certain times or to types of parker, or some combination.
13 The monetised benefits and disbenefits of parking controls may include:
• those road users who are restrained from travelling as they wish would incur a disbenefit;
• transfers to public transport as a result of the controls could lead to either increased revenues to the operators or to the operator providing more frequent public transport services and/or lower public transport fares, and, as a consequence, either the operators or continuing users of public transport (or to some extent both) would benefit;
• continuing travellers by road would receive benefits arising from reduced congestion which would mean quicker journeys and increased reliability, with only some travellers having to pay a charge given that parking controls bear only on those travellers terminating in the controlled area and do not bear on those who pass right through the controlled zone;
• continuing travellers by road could receive either benefits or disbenefits in terms of changed vehicle operating costs arising from reduced congestion;
• some continuing road travellers - that is, the parkers - would incur disbenefits in the form of the charges they would have to pay, to the extent that, in the case of low income travellers, their benefits from congestion relief may be outweighed, whereas in the case of high income travellers the reverse could be true, depending on the level of charge applied;
• to the extent that parkers trade-off time and money costs, some parkers would experience disbenefits in the form of increased time spent searching for an acceptable space and also possibly increased time spent walking to their final destination; and

Transport and the economy: full report (SACTRA)
268
• parking authorities and car park operators may suffer either disbenefits or benefits to the extent that they experience either reductions in revenues which cannot be matched by reduced costs or increases in revenues without disproportionate increases in costs.
14 The issues of environmental, safety and accessibility benefits, and the benefits to pedestrians and cyclists, which arise from parking controls are much the same as described earlier in relation to congestion charging.
Motorway Charging
15 Motorway charging was originally conceived primarily as a means of raising revenues for improvements to the road system. The measure was also seen by some as a means of managing peak demands on the motorways.
16 The monetised benefits and disbenefits of motorway charging may include:
• continuing users of the motorways would receive benefits arising from reduced congestion which would mean quicker journeys and improved reliability;
• continuing users of the motorways could receive either benefits or disbenefits in terms of changed vehicle operating costs;
• road users who are restrained from travelling as they wish, including those who re-route from motorways to all-purpose roads, would incur a disbenefit;
• continuing users of all-purpose roads could receive a disbenefit as a result of extra congestion caused by the diversion of traffic off the motorways leading to slower and less reliable journeys;
• continuing users of all-purpose roads could receive either benefits or disbenefits in terms of changed vehicle operating costs;
• transfers to public transport as a result of the charges could lead to either increased revenues to the operators or to the operator providing more frequent public transport services and/or lower public transport fares, and, as a consequence, either the operators or continuing users of public transport (or to some extent both) would benefit;
• continuing motorway users would incur disbenefits in the form of the charges they would have to pay, to the extent that, in the case of low income travellers, their benefits from congestion relief may be outweighed, whereas in the case of high income travellers the reverse could be true, depending on the level of charge applied; and
• the charging authority would benefit to the extent that its revenues (from both charges and penalties for infringements) exceed its costs of operation, maintenance and enforcement.
17 While motorway charging could generate net revenues which could mean that the scheme could, in overall terms, yield a net benefit to society as a whole, recycling these revenues into the affected areas so as to ensure an economic gain is more problematic than in the case of urban congestion charging, for two reasons:
• the adverse impacts caused by traffic diverting off the motorways onto the less suitable all-purpose roads could be quite widespread and affect many travellers; and
• the origins and destinations of the motorway traffic which would pay the charges are likely to be very widespread and not confined to an easily identifiable target area.
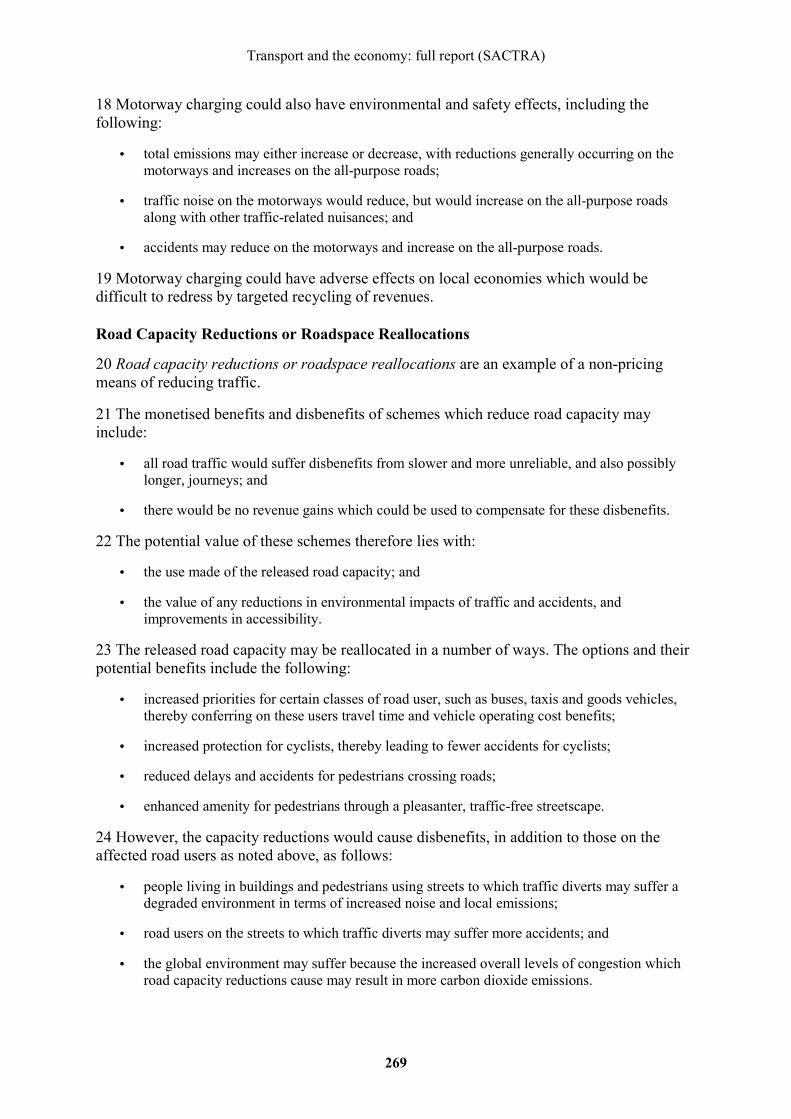
Transport and the economy: full report (SACTRA)
269
18 Motorway charging could also have environmental and safety effects, including the following:
• total emissions may either increase or decrease, with reductions generally occurring on the motorways and increases on the all-purpose roads;
• traffic noise on the motorways would reduce, but would increase on the all-purpose roads along with other traffic-related nuisances; and
• accidents may reduce on the motorways and increase on the all-purpose roads.
19 Motorway charging could have adverse effects on local economies which would be difficult to redress by targeted recycling of revenues.
Road Capacity Reductions or Roadspace Reallocations
20 Road capacity reductions or roadspace reallocations are an example of a non-pricing means of reducing traffic.
21 The monetised benefits and disbenefits of schemes which reduce road capacity may include:
• all road traffic would suffer disbenefits from slower and more unreliable, and also possibly longer, journeys; and
• there would be no revenue gains which could be used to compensate for these disbenefits.
22 The potential value of these schemes therefore lies with:
• the use made of the released road capacity; and
• the value of any reductions in environmental impacts of traffic and accidents, and improvements in accessibility.
23 The released road capacity may be reallocated in a number of ways. The options and their potential benefits include the following:
• increased priorities for certain classes of road user, such as buses, taxis and goods vehicles, thereby conferring on these users travel time and vehicle operating cost benefits;
• increased protection for cyclists, thereby leading to fewer accidents for cyclists;
• reduced delays and accidents for pedestrians crossing roads;
• enhanced amenity for pedestrians through a pleasanter, traffic-free streetscape.
24 However, the capacity reductions would cause disbenefits, in addition to those on the affected road users as noted above, as follows:
• people living in buildings and pedestrians using streets to which traffic diverts may suffer a degraded environment in terms of increased noise and local emissions;
• road users on the streets to which traffic diverts may suffer more accidents; and
• the global environment may suffer because the increased overall levels of congestion which road capacity reductions cause may result in more carbon dioxide emissions.

Transport and the economy: full report (SACTRA)
270
25 Importantly, it should also be noted that, among those who experience increased congestion away from the capacity reduction may be buses and other economically important traffic.
26 The crucial point to note about the effects of road capacity reallocations is that whether or not there is an overall net benefit will depend on the use made of the released capacity. If the balance of direct benefits and disbenefits is adverse, there will be no revenues which can be used to compensate.

Transport and the economy: full report (SACTRA)
271
Bibliography
Summary Report
Standing Advisory Committee on Trunk Road Assessment, 1992, Assessing the Environmental Impact of Road Schemes, HMSO London.
Standing Advisory Committee on Trunk Road Assessment, 1997, Transport Investment, Transport Intensity and Economic Growth: Interim Report.
Chapter 1 Introduction
Department of the Environment, Transport and the Regions, 1998a, A New Deal for Transport: Better for Everyone.
Department of the Environment, Transport and the Regions, 1998b, A New Deal for Trunk Roads in England.
Standing Advisory Committee on Trunk Road Assessment, 1997, Transport Investment, Transport Intensity and Economic Growth: Interim Report.
Chapter 2 The Debate about Transport and the Economy
Aschauer, DA, 1989, 'Is Public Expenditure Productive?', Journal of Monetary Economics 23.
Automobile Association and Confederation of British Industry, 1998, Transport Links and the Economy.
Barker, T and Lewney, R, Cambridge Econometrics, 1998, submission to SACTRA.
Biehl, D (ed), 1986, The Contribution of Infrastructure to Regional Development, Office for Official Publications of the European Communities, Luxembourg.
Biehl, D, 1991, 'The Role of Infrastructure in Regional Development', in Vickerman, RW (ed), Infrastructure and Regional Development, Pion, London.
Black Country Development Corporation, 1997, submission to SACTRA.
Centre for Economic and Business Research, 1994, Roads and Jobs: The Economic Impact of Different Levels of Expenditure on the Roads Programme.
Confederation of British Industry, 1997, Regions for Business.
Coopers and Lybrand, 1995, for British Airways, Heathrow Airport Terminal 5 - Assessment of Wider Economic Benefits, summaries of BA13, BA14 and BA40.
Department of Environment, Transport and the Regions, 1997a, note to SACTRA re Spine Roads.
Department of Environment, Transport and the Regions, 1997b, note to SACTRA re regeneration.

Transport and the economy: full report (SACTRA)
272
Department of Environment, Transport and the Regions, 1998, Coalfields Task Force, Making the difference - a new start for England's Coalfield Communities.
Diamond, D and Spence, NA, 1989, Infrastructure and Industrial Costs in British Industry, Research conducted for the Department of Trade and Industry.
Dodgson, J, 1974, 'Motorway Investment, Industrial Transport Costs and Sub-Regional Growth', Regional Studies 8.
Emerson, M, 1998, The Economics of 1992, Oxford, Oxford University Press.
Ernst and Young, 1996, Transport Infrastructure, Business Costs and Business Location, report for Department of Transport.
Fogel, RW, 1964, Railroads and American Economic Growth: Essays in Econometric History, Baltimore, John Hopkins University Press.
Freight Transport Association, 1997, The Case for Investment in Transport Infrastructure, submission to SACTRA.
Friends of the Earth (Cornwall Transport Group), 1997, submission to SACTRA.
Friends of the Earth (Wiltshire Network), 1997, submission to SACTRA.
Government Office for the Eastern Region, 1997, Transport Investment, Transport Intensity and Economic Growth, submission to SACTRA.
Government Office for the North West, 1997, Transport Investment, Transport Intensity and Economic Growth, submission to SACTRA.
Government Office for the South East, 1997, Transport Investment, Transport Intensity and Economic Growth, submission to SACTRA.
Halden, D and Sharman, K for Transport Research Laboratory, 1994, A Study of Transport and Development Changes around Inverness.
Hawke, GR and Higgins, JPP,1981, 'Transport and social overhead capital', in Floud, R and McCloskey, D (eds), The Economic History of Britain since 1700, vol 1, 1700-1860, Cambridge, Cambridge University Press.
Hilling, D, 1996, Transport and Developing Countries, Routledge, London.
Jenkins, T, for Friends of the Earth, 1997, Less Traffic More Jobs: The Direct Employment Impacts of Developing a Sustainable Transport System in the UK.
JMP Consultants, 1989, Dearne Towns Link Road Study, Final Report.
Lawson, I, for North Lanarkshire Council, 1997, submission to SACTRA.
Mackie, P and Simon, D, 1986, Do Road Projects Benefit Industry? A Case Study of the Humber Bridge.
Mackie, P and Tweddle, G, 1993, Measuring the Benefits Gained by Industry from Road Network Improvements.
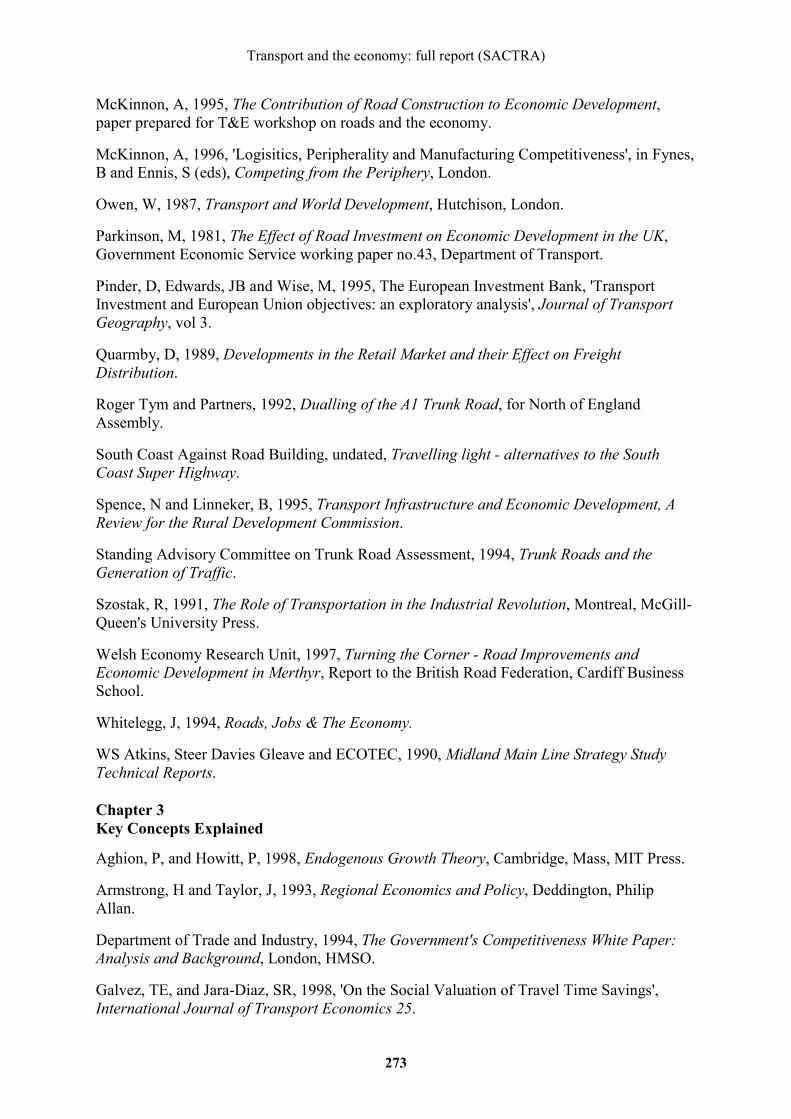
Transport and the economy: full report (SACTRA)
273
McKinnon, A, 1995, The Contribution of Road Construction to Economic Development, paper prepared for T&E workshop on roads and the economy.
McKinnon, A, 1996, 'Logisitics, Peripherality and Manufacturing Competitiveness', in Fynes, B and Ennis, S (eds), Competing from the Periphery, London.
Owen, W, 1987, Transport and World Development, Hutchison, London.
Parkinson, M, 1981, The Effect of Road Investment on Economic Development in the UK, Government Economic Service working paper no.43, Department of Transport.
Pinder, D, Edwards, JB and Wise, M, 1995, The European Investment Bank, 'Transport Investment and European Union objectives: an exploratory analysis', Journal of Transport Geography, vol 3.
Quarmby, D, 1989, Developments in the Retail Market and their Effect on Freight Distribution.
Roger Tym and Partners, 1992, Dualling of the A1 Trunk Road, for North of England Assembly.
South Coast Against Road Building, undated, Travelling light - alternatives to the South Coast Super Highway.
Spence, N and Linneker, B, 1995, Transport Infrastructure and Economic Development, A Review for the Rural Development Commission.
Standing Advisory Committee on Trunk Road Assessment, 1994, Trunk Roads and the Generation of Traffic.
Szostak, R, 1991, The Role of Transportation in the Industrial Revolution, Montreal, McGill-Queen's University Press.
Welsh Economy Research Unit, 1997, Turning the Corner - Road Improvements and Economic Development in Merthyr, Report to the British Road Federation, Cardiff Business School.
Whitelegg, J, 1994, Roads, Jobs & The Economy.
WS Atkins, Steer Davies Gleave and ECOTEC, 1990, Midland Main Line Strategy Study Technical Reports.
Chapter 3 Key Concepts Explained
Aghion, P, and Howitt, P, 1998, Endogenous Growth Theory, Cambridge, Mass, MIT Press.
Armstrong, H and Taylor, J, 1993, Regional Economics and Policy, Deddington, Philip Allan.
Department of Trade and Industry, 1994, The Government's Competitiveness White Paper: Analysis and Background, London, HMSO.
Galvez, TE, and Jara-Diaz, SR, 1998, 'On the Social Valuation of Travel Time Savings', International Journal of Transport Economics 25.
Transport and the economy: full report (SACTRA)
274
Highways Agency, Scottish Office, Welsh Office, Northern Ireland Department of the Environment, Design Manual for Roads and Bridges. Volume 13: COBA.
Jara-Diaz, SR, 1986, 'On the Relation between Users' Benefits and the Economic Effects of Transportation Activities', Journal of Regional Science, 26(2).
Murgatroyd, L and Neuburger, H, 1997, 'A Household Satellite Account for the UK', Economic Trends, 527, 63-71.
Neuburger, H, 1996, 'Time Use from a National Accounts Perspective', Economic Trends, 513.
Nordhaus, WD and Tobin, J, 1972, Is Growth Obsolete? New York, Columbia University Press.
Peake, S and Hope, C, 1994, 'Sustainable Mobility in Context', Transport Policy, 1(3).
Standing Advisory Committee on Trunk Road Assessment, 1994, Trunk Roads and the Generation of Traffic.
Swales, JK, 1997, 'A Cost-Benefit Approach to the Evaluation of Regional Selective Assistance', Fiscal Studies, 18(1).
Usher, D, 1980, The Measurement of Economic Growth, Oxford: Blackwell.
Wardman, M, 1998, A Review of British Evidence on the Valuations of Time and Service Quality, University of Leeds Institute of Transport Studies Working Paper No. 525.
Overview of Chapters 4 and 5
Aschauer, DA, 1989, 'Is Public Expenditure Productive?', Journal of Monetary Economics, 23.
Highways Agency, Scottish Office, Welsh Office, Northern Ireland Department of the Environment: Design Manual for Roads and Bridges. Volume 13: COBA.
Venables, AJ and Gasiorek, M, 1998, The Welfare Implications of Transport Improvements in the Presence of Market Failure, report to SACTRA.
Chapter 4 The Linking Mechanisms: An Outline
Aschauer, DA, 1989, 'Is Public Expenditure Productive?', Journal of Monetary Economics, 23.
Baldwin, R, 1989, 'The Growth Effects of 1992', Economic Policy, 9.
Barrell, R, and Pain, N, 1997, 'Foreign Direct Investment, Technological Change and
Economic Growth within Europe', Economic Journal, 107.
Crafts, NFR, 1996, 'Post Neo-Classical Endogenous Growth Theory, What are its Policy Implications?', Oxford Review of Economic Policy, 12(2).
Transport and the economy: full report (SACTRA)
275
Davies, SW, 1998, Review of the Incidence of Imperfect Competition in the UK, report to SACTRA.
Department of Trade and Industry, 1998, The Government's Competitiveness White Paper: Analysis and Background, London, HMSO.
Duffy-Deno, KT, and Eberts, RW, 1991, 'Public Infrastructure and Regional Economic Development: A Simultaneous Equations Approach', Journal of Urban Economics, 30.
Edwards, S, 1998, 'Openness, Productivity and Growth: What do we Really Know?', Economic Journal, 108.
Emerson, M, 1988, The Economics of 1992, Oxford University Press.
Ford, R, and Poret, P, 1991, 'Infrastructure and Private Sector Productivity', OECD Economic Studies, 17.
Geroski, P, 1994, Market Structure,Corporate Performance and Innovative Activity, Oxford, Clarendon Press.
Gramlich, E, 1994, 'Infrastructure Investment: A Review Essay', Journal of Economic Literature, 32.
Harris, RID, 1998, Incidence of Imperfect Competition in UK Sectors and Regions, report to SACTRA.
HM Treasury, 1998, Pre-Budget Report, Cm 4076, London.
Hurst, C, 1995, Infrastructure and Growth: A Literature Review.
Krugman, P, 1989, 'Income Elasticities and Trends in Real Exchange Rates', European Economic Review, 33.
Levin, RC, Klevonick, AK, Nelson, RR and Winter, SG, 1987, 'Appropriating the Returns from Industrial R & D', Brookings Papers on Economic Activity, 3.
Lau, SHP and Sin, CY, 1997, 'Public Infrastructure and Economic Growth: Time Series Properties and Evidence', Economic Record, 73.
Lynde, C and Richmond, J, 1993, 'Public Capital and Long Run Costs in UK Manufacturing', Economic Journal, 103.
Nadiri, MI and Mamuneas, TP, 1994, Infrastructure and Public R & D Investments, and the Growth of Factor Productivity in US Manufacturing Industries, National Bureau of Economic Research Working Paper No. 4845.
Newbery, DM, 1998, Measuring the Indirect Benefits of Transport Costs Reductions, report for MEP.
Oulton, N, and Young, G, 1996, 'How High is the Social Rate of Return to Investment?', Oxford Review of Economic Policy, 12(2).
Solow, RM, 1956, 'A Contribution to the Theory of Economic Growth', Quarterly Journal of Economics, 70.

Transport and the economy: full report (SACTRA)
276
Transportation Research Board, 1997, 'Macroeconomic Analysis of the Linkages between Transportation Investments and Economic Performance', NCHRP Report No. 389, Washington DC: National Academy Press.
Venables, AJ and Gasiorek, M, 1998, The Welfare Implications of Transport Improvements in the Presence of Market Failure, report to SACTRA.
Chapter 5 Linkages In A Spatial Economy
Aschauer, DA, 1989, 'Is Public Expenditure Productive?', Journal of Monetary Economics, 23.
Armstrong, H and Taylor, J, 1993, Regional Economics and Policy, 2nd ed, Harvester Wheatsheaf, Hemel Hempstead.
Bank of America and others, 1995, Beyond Sprawl: New Patterns of Growth to Fit the New California.
Barker, T and Lewney, R, Cambridge Econometrics, 1997, submission to SACTRA.
Botham, R, 1983, 'The Road Programme and Regional Development: The Problem of the Counterfactual', in Button, KJ and Gillingwater, D, eds. Transport, Location and Spatial Policy, Gower, Aldershot.
Brülhart, M, 1998, 'Economic Geography, Industry Location and Trade: The Evidence', The World Economy, 21.
Cameron, G and Muellbauer, J, 1998, The Housing Market and Regional Commuting and Migration Choices, CEPR Discussion Paper 1945.
Centre for Economics and Business Research, 1993a, The Economic Impact of the London Underground Core Investment Programme.
Centre for Economics and Business Research, 1993b, Journey Duration, the Cost of Living and Wages.
Centre for Economics and Business Research, 1994, Roads and Jobs: The Economic Impact of Different Levels of Expenditure on the Roads Programme.
Centre for Economics and Business Research and Observatoire de l'Economie et des Institutions Locales, 1997, Two Great Cities: A Comparison of the Economies of London and Paris, Corporation of London.
Confederation of British Industry, 1994, The economic benefits of road schemes: improving current DoT investment appraisal.
Crampton, G, 1998, Urban Labour Markets, draft, University of Reading, January.
David Simmonds Consultancy (in collaboration with Marcial Echenique and Partners Ltd), 1998, Review of Land-Use/Transport Interaction Models, Report to SACTRA.
Department of the Environment/Department of Transport, 1994, Planning Policy Guidance Notes 13 - Transport, HMSO, London.

Transport and the economy: full report (SACTRA)
277
Department of the Environment, Transport and the Regions, 1999, Sustainable Distribution: A Strategy, DETR, London.
Dodgson, J, 1974, 'Motorway investment, industrial transport costs and sub-regional growth', Regional Studies, 8.
Ernst and Young, 1996, Transport Infrastructure, Business Costs and Business Location, report for Department of Transport.
Evans, AW, 1998, 'Dr. Pangloss Finds His Profession: Sustainability, Transport Land Use Planning In Britain', Journal of Planning Education and Research, 18.
European Commission, 1997, The Likely Macroeconomic and Employment Impacts of Investments in Trans-European Transport Networks, Commission Staff Working Paper, SEC(97)10, January.
Freight Transport Association, 1997, The Case for Investment in Transport Infrastructure, Submission to SACTRA.
Fritsch, B and Prud'homme, R, 1997, 'Measuring the Contribution of Road Infrastructure to Economic Development in France', in Quinet, E and Vickerman, RW (eds.) The Econometrics of Major Transport Infrastructures, Macmillan, London.
Glaeser, E, 1998, 'Are cities dying?', Journal of Economic Perspectives, 12, 139-60.
Goodwin, P, 1994, Traffic Growth and the Dynamics of Sustainable Transport Policies, Linacre Lectures 1994-5, ESRC Transport Studies Unit, University of Oxford.
Gordon, I, 1975, 'Employment and housing streams in British inter-regional migration', Scottish Journal of Political Economy, 22, 161-177.
Gordon, I, 1997, 'Densities, Urban Form and Behaviour', Town and Country Planning 66.
Gordon, P, and Richardson, HW, 1993, 'Market Planning: Oxymoron or common sense?', Journal of American Planning Association, 1993.
Halden, D and Sharman, K, 1994, A Study of Transport and Development Changes around Inverness, Transport Research Laboratory Scotland.
Headicar, P and Curtis, C, 1998, 'The Location of New Residential Developments: Its Influence on Car Based Travel', in Banister, D (ed), Transport Policy and the Environment, E&FN Spon, London.
Holtz-Eakin, D, 1993, 'State Specific Estimates of State and Local Government Capital', Regional Science and Urban Economics, 23.
Holtz-Eakin, D and Lovely, ME, 1996, 'Scale Economies, Returns to Variety and the Productivity of Public Infrastructure', Regional Science and Urban Economics, 26.
Holtz-Eakin, D and Schwartz, A, 1995, 'Infrastructure in a structural model of economic growth', Regional Science and Urban Economics, 25.
Hotelling, H, 1929, 'Stability in competition', Economic Journal, 39.
Transport and the economy: full report (SACTRA)
278
Hulten, C, and Schwab, R, 1991, 'Public Capital Formation and the Growth of Regional Manufacturing Industries', National Tax Journal, 44.
IWW, TRT, ME&P, CEBR, 1998, Assessment of Transport Strategies Deliverable D2, Design and Specification of a Systems Dynamics Model, Project ST-97-SC, 1049, DGVII - Transport, Commission of the European Communities.
Jackman, R, and Savouri, S, 1992, 'Regional Migration versus Regional Commuting: The Identification of Housing and Employment Flows', Scottish Journal of Political Economy, 39.
Jenks, M, Burton, E and Williams, K, (eds), 1996, The Compact City: A Sustainable Urban Form?, E & FN Spon, London.
Jensen-Butler, C, and Madsen, B, 1996, 'Modelling the Regional Economic Effects of the Danish Great Belt Link', Papers in Regional Science, 75.
Krugman, P, 1998a, 'Space: the Final Frontier', Journal of Economic Perspectives,12.
Krugman, P, 1998b, 'What's New about the New Economic Geography?' Oxford Review of Economic Policy 14(2).
Lee, KC and Pesaran, MH, 1993, 'The Role of Sectoral Interactions in Wage Determination in the UK Economy', Economic Journal, 103.
Mackie, P and Simon, D, 1986, Do Road Projects Benefit Industry? A Case Study of the Humber Bridge.
Mackie, P and Tweddle, G, 1993, Measuring the Benefits Gained by Industry from Road Network Improvements.
McKinnon, A, 1995, The Contribution of Road Construction to Economic Development.
McKinnon, A, 1996, Logistics, Peripherality and Manufacturing Competitiveness.
McKinnon, A, 1997, The Road Freight Requirements of Scottish Industry: A Logistical Perspective.
McKinnon, A, undated, The Effect of Logistical Restructuring on the Growth of Lorry Traffic.
McKinnon, A and Woodburn, A, 1996, 'Logistical Restructuring and Road Freight Traffic Growth', Transportation 23.
Molho, I, 1982, 'Contiguity and Inter-Regional Migration Flows in Great Britain', Scottish Journal of Political Economy, 29.
Munnell, AH, 1990, 'How does Public Infrastructure affect Regional Economic Performance?', in Munnell, A.H. (ed.) Is there a shortfall in public capital investment, Conference Series 34, Federal Reserve Bank of Boston.
Newman, PWG, Kenworthy, JR, (eds.) 1997, Indicators of Transport Efficiency in 37 Global Cities, Murdoch University, Australia.
Quarmby, D, 1989, Developments in the Retail Market and their Effect on Freight Distribution.
Transport and the economy: full report (SACTRA)
279
Standing Advisory Committee on Trunk Road Assessment, 1994, Trunk Roads and the Generation of Traffic, HMSO, London.
Venables, A, and Gasiorek, M, 1998, The Welfare Implications of Transport Improvements in the Presence of Market Failure, report to SACTRA.
von Thünen, JH, 1826, Der Isolierte Staat in Beziehung auf Landwirtschaft und Nationalökonomie, Hamburg.
Chapter 6 Transport Intensity and the Potential for 'Decoupling' Economic Growth from Traffic Growth
Cairns, S, Hass-Klau, C and Goodwin, P, 1998, Traffic Impact of Highway Capacity Reductions: Assessment of the Evidence, Landor Publishing, London.
Dargay, J and Gately, D, 1997, 'The demand for Transportation fuels: Imperfect Price reversibility?', Transport Research 31B, 1.
Department of Transport, 1989, National Road Traffic Forecasts 1989.
European Conference of Ministers of Transport, 1998, Infrastructure-induced Mobility, Round Table Conference, European Conference of Ministers of Transport, Paris.
Glaister, S & Graham, D, forthcoming, The Effect of Fuel Prices on Motorists, Imperial College of Science, Technology and Medicine, London.
Goodwin, PB, 1992, A Review of New Demand Elasticities with Special Reference to Short and Long Run Effects of Price Changes, Journal of Transport Economics and Policy, XXVI (2).
Harbour, G, 1987, 'An Overview of Academic Research on Vehicle Demand Modelling', in Rhys, G & Harbour, G (eds), Modelling vehicle demand: alternative views.
Headicar, P, 1996, 'The Local Development Effects of Major New Roads: The M40 Case Study', Transportation, 23(1).
Lee, D, 1998, 'Estimation of short and long run travel demand elasticities', draft, US Department of Transportation Volpe National Transportation Systems Center, Cambridge MA.
Luk, J and Hepburn, S, 1993, New Review of Australian Travel Demand Elasticities, Victoria, Australian Road Research Board.
Netherlands Economic Institute, 1997, Relationship between Demand for Freight-transport and Industrial Effects, (REDEFINE), NEI, Rotterdam.
Oum, TH, Waters, WG II & Yong, JS, 1992, 'Concepts of Price-Elasticity of Demand and Recent Empirical Estimates', Journal of Transport Economics and Policy, XXVI (2).
Peake, S, 1994, Transport in transition - lessons from the history of energy, RIIA Energy and Environment Programme, Earthscan.
Standing Advisory Committee on Trunk Road Assessment, 1994, Trunk Roads and the Generation of Traffic.
Transport and the economy: full report (SACTRA)
280
Chapter 7 The Economic Impacts of Reducing Traffic
Aschauer, DA, 1989, 'Is Public Expenditure Productive?', Journal of Monetary Economics, 23.
Barker, T, 1996, 'Taxing pollution instead of jobs: towards more employment without more inflation through fiscal reform in the UK', in Carraro, C, and Siniscalco, D, (eds.), Environmental Fiscal Reform and Unemployment, Dordrecht, Kluwer.
Barker, T, and Kohler, J, 1998, Charging for Road Freight in the EU: Macro-Economic Implications of a Weigh-in-motion Tax, report for DG VII (transport) of the Commission of the European Communities.
Bleijenberg, AN, Velthuyzen, JW, and Oegema, T, 1990, Economische Gevolgen van Mobiliteitsbeheersing, Amsterdam, CE, Delft and SEO.
Boardman, B, 1998, Rural transport policy and equity, Council for the Protection of Rural England, Countryside Commission and Rural Development Commission.
Boarnet, MG, 1997, 'Infrastructure services and the productivity of public capital: the case of streets and highways', National Tax Journal, 50.
Carley, M with Donaldsons, 1997, Sustainable Transport and Retail Vitality: State of the Art for Towns and Cities, Historic Burghs Association of Scotland with Transport 2000.
Crawford, I, and Smith, S, 1995, 'Fiscal Instruments for Air Pollution Abatement in Road Transport', Journal of Transport Economics and Policy, 29.
Department of the Environment, Transport and the Regions, 1998, Breaking the Logjam, London.
European Conference of Ministers of Transport, 1998, Efficient Transport for Europe: Policies for Internalisation of External Costs, Paris.
Eyre, NJ, Ozdemiroglu, E, Pearce, DW and Steele, P, 1997, 'Fuel and Location Effects on the Damage Costs of Transport Emissions', Journal of Transport Economics and Policy, 31.
Fergusson, M and Skinner, I, 1998, Winners and Losers: Company Car Tax Reform, report for Transport 2000.
Goodwin, PB, 1989, 'The Rule of Three: A Possible Solution to the Problem of Competing Objectives for Road Pricing', Traffic Engineering and Control, 30 (10).
Goulder, LH, 1995, 'Environmental Taxation and the Double Dividend: A Reader's Guide', International Tax and Public Finance,2.
Hass-Klau, C, 1993, 'Impact of Pedestrianisation and Traffic Calming on Retailing', Transport Policy 1 (1).
Jorgensen, DW and Wilcoxsen, PJ, 1990, 'Environmental Regulation and US Economic Growth', Rand Journal of Economics, 21.
McKinnon, A and Woodburn, A, 1996, 'Logistical Restructuring and Road Freight Traffic Growth: An Empirical Assessment', Transportation 23, The Netherlands.
Transport and the economy: full report (SACTRA)
281
Maddison, D, Pearce, D, Johansson, O, Calthorp, E, Litman, T and Verhoef, E, 1996, Blueprint 5, London, Earthscan Publications.
Mauch, SP and Rothengatter, W, 1995, External Effects of Transport, Paris: Union Internationale des Chemin de Fer.
May, AD, Coombe, D and Gilliam, C, 1996, 'The London Congestion Charging Research Programme: 3: The Assessment Methods', Traffic Engineering and Control, 37.
May, AD, Coombe, D and Travers, T, 1996, 'The London Congestion Charging Research Programme: 5: Assessment of the Impacts', Traffic Engineering and Control, 37.
Ministry of Transport, 1964, Road Pricing: The Economic and Technical Possibilities.
MVA, 1993, Inter-urban Charging: Case Studies: Summary Report and Stage Two Summary Report, report to Department of Transport.
MVA, 1997, Study of Parking and Traffic Demand: Stage Two: Bristol Case Study: Parking Control Strategies: Assessment of Demand Changes, report to Department of Transport.
MVA and David Simmonds Consultancy, 1998, Study of Parking and Traffic Demand: Stage Two: Bristol Case Study: Parking Control Strategies: Detailed Assessment of Parking Control Strategies, report for Department of Transport.
MVA Limited & David Simmonds Consultancy, 1998, Study of Parking and Traffic Demand: Stage Two, Further Analysis of Land-Use Effects, Report for the Department of the Environment, Transport and the Regions.
Myles, GD, 1998, Taxation, Economic Growth and the Double Dividend, report for SACTRA.
National Economic Research Associates (NERA), 1997, The Costs of Road Congestion in Great Britain.
Newbery, DM, 1995, 'Royal Commission Report on Transport and the Environment: Economic Effects of Recommendations', Economic Journal, 105.
Nickell, S, 1997, 'Unemployment and Labor Market Rigidities: Europe versus North America', Journal of Economic Perspectives, 11(3).
Pearce, DW, 1993, Blueprint 3: Towards Sustainable Development, London Earthscan Publications.
Roth, G, 1998, 'Road Pricing in a Free Society', Economic Affairs, 18(4).
Royal Commission on Environmental Pollution, 1994, Eighteenth Report: Transport and the Environment, London, HMSO.
Sevigny, M, 1998, Taxing Automobile Emissions for Pollution Control, Cheltenham, Edward Elgar.
Simmonds, D and Coombe, D, 1997, 'Transport Effects of Urban Land Use Change', Traffic Engineering and Control, Vol 38 (12).
Transport and the economy: full report (SACTRA)
282
Skinner, I and Fergusson, M, 1998, Transport Taxation and Equity, Institute for Public Policy Research.
Smith, S, 1998, 'Environmental and Public Finance Aspects of the Taxation of Energy', Oxford Review of Economic Policy, 14(4).
Thomson, JM, 1998, 'Reflections on the Economics of Traffic Congestion', Journal of Transport Economics and Policy, 32.
Tindale, S and Holtham, G, 1996, Green Tax Reform, London, IPPR.
WS Atkins (1995-6), Effect of Parking Policies, research for Department of Transport.
Chapter 8 Implications For Appraisal
Department of the Environment, Transport and the Regions, URECA Manual.
Department of the Environment, Transport and the Regions, 1997, National Road Traffic Forecasts (Great Britain) 1997.
Department of the Environment, Transport and the Regions, 1998a, A New Deal for Transport: Better for Everyone.
Department of the Environment, Transport and the Regions, 1998b, A New Deal for Trunk Roads in England: Guidance on the New Approach to Appraisal.
Department of the Environment, Transport and the Regions, 1998c, A New Deal for Trunk Roads in England.
Highways Agency, Scottish Office, Welsh Office, Northern Ireland Department of the Environment, Design Manual for Roads and Bridges. Volume 11: Environmental Assessment. Volume 12.2.2: Guidance on Induced Traffic. Volume 13: COBA.
Standing Advisory Committee on Trunk Road Assessment, 1992, Assessing the Environmental Impact of Road Schemes, HMSO, London.
Standing Advisory Committee on Trunk Road Assessment, 1994, Trunk Roads and the Generation of Traffic, HMSO, London.
Standing Advisory Committee on Trunk Road Assessment, 1997, Transport Investment, Transport Intensity and Economic Growth: Interim Report.
Venables, AJ and Gasiorek, M, 1998, The Welfare Implications of Transport Improvements in the Presence of Market Failure, report to SACTRA.
Chapter 9 Current Appraisal Practice
Bates, J, Williams, I, Coombe, D and Leather, J, 1996, 'The London Congestion Charging Research Programme: 4. The Transport Models', Traffic Engineering and Control, Vol 37.
Bates, J, Skinner, A, Scholefield, G and Bradley, R, 1997, Study of Parking and Traffic Demand: 2. A Traffic Restraint Analysis Model (TRAM).

Transport and the economy: full report (SACTRA)
283
David Simmonds Consultancy, 1997, Analysis of Transport Schemes: Economic Impact Studies, report to SACTRA.
David Simmonds Consultancy, ITS University of Leeds, MVA and Oxford Brookes University, 1998, Accessibility as a Criterion for Project and Policy Appraisal, report to the Department of Environment, Transport and the Regions.
Department of the Environment, Transport and the Regions, URECA Manual.
Department of the Environment, Transport and the Regions, 1997, National Road Traffic Forecasts (Great Britain) 1997.
Department of the Environment, Transport and the Regions, 1998a, A New Deal for Transport: Better for Everyone.
Department of the Environment, Transport and the Regions, 1998b, A New Deal for Trunk Roads in England.
Department of the Environment, Transport and the Regions, 1998c, A New Deal for Trunk Roads in England: Guidance on the New Approach to Appraisal.
Department of the Environment, Transport and the Regions, 1999, Forthcoming, Guidance on the Methodology for Multi-Modal Studies.
Highways Agency, Scottish Office, Welsh Office, Northern Ireland Department of the Environment, Design Manual for Roads and Bridges. Volume 11: Environmental Assessment. Volume 12.2.2: Guidance on Induced Traffic. Volume 13: COBA.
HM Treasury, 1997, Appraisal and Evaluation in Central Government, (aka 'The Green Book') HMSO.
Institution of Highways and Transportation, 1996, Guidelines on Developing Urban Transport Strategies.
The MVA Consultancy, Oscar Faber TPA and ITS, Leeds, 1994, Common Appraisal Framework for Urban Transport Projects, report to Birmingham City Council and the Department of Transport.
Office of Passenger Rail Franchising, 1999, Planning Criteria - A Guide to the Appraisal of Support for Passenger Rail Services.
Standing Advisory Committee on Trunk Road Assessment, 1986, Urban Road Appraisal, HMSO.
Standing Advisory Committee on Trunk Road Assessment, 1992, Assessing the Environmental Impact of Road Schemes, HMSO.
Standing Advisory Committee on Trunk Road Assessment, 1994, Trunk Roads and the Generation of Traffic, HMSO.
Sugden, R, 1999, Developing a Consistent Cost-Benefit Framework for Multi-modal Transport Appraisal, Economics Research Centre, University of East Anglia, report to the Department of the Environment, Transport and the Regions.

Transport and the economy: full report (SACTRA)
284
Chapter 10 Recommendations for an Improved Appraisal Practice
Accent Marketing & Research, and Hague Consulting Group, 1994, Willingness to Pay Tolls.
Accent Marketing & Research, and Hague Consulting Group, 1996, The Value of Time on UK Roads.
Advisory Committee on Trunk Road Assessment, 1977, Report.
Aschauer, DA, 'Is public expenditure productive?', Journal of Monetary Economics, 23, 1989, 177-200.
Barrett, G, 1998, Review of Methodology for Assessing the Economic Development Impacts of New Highway Infrastructure, report to SACTRA.
Bates, J, 1999, Peer Reviews of "Review of Land-Use/Transport Interaction Models".
Bates, J, Williams, I, Coombe, D and Leather, J, 1996, 'The London Congestion Charging Programme: 4, The Transport Models', Traffic Engineering and Control, Vol 37 (5).
Bates, J, Skinner, A, Scholefield, G and Bradley, R, 1997, Study of Parking and Traffic Demand: 2. A Traffic Restraint Analysis Model (TRAM).
Cairns, S, Hass-Klau, C and Goodwin, P, 1998, Traffic Impact of Highway Capacity Reductions: Assessment of the Evidence, report to London Transport and the Department of the Environment, Transport and the Regions. This work is summarised in two papers published in Traffic Engineering and Control in June and July/August 1998.
Centre for Economics and Business Research, 1993, The Economic Impact of the London Underground Core Investment Programme.
Centre for Economic and Business Research, 1994, Roads and jobs: the economic impact of different levels of expenditure on the roads programme.
David Simmonds Consultancy, 1997, Analysis of Transport Schemes: Economic Impact Studies, report to SACTRA.
David Simmonds Consultancy in collaboration with Marcial Echenique and Partners, 1998, Review of Land-Use/Transport Interaction Models, report to SACTRA.
Department of Transport, 1989, National Road Traffic Forecasts, 1989.
Department of the Environment, Transport and the Regions, 1997, National Road Traffic Forecasts (Great Britain), 1997.
Department of the Environment, Transport and the Regions, 1998a, A New Deal for Transport: Better for Everyone.
Department of the Environment, Transport and the Regions, 1998b, A New Deal for Trunk Roads in England: Guidance on the New Approach to Appraisal.
Department of the Environment, Transport and the Regions, 1998c, A New Deal for Trunk Roads in England.

Transport and the economy: full report (SACTRA)
285
Department of the Environment, Transport and the Regions, 1999, Sustainable Distribution: A Strategy.
Dodgson, J, 1997, A Framework for Assessing Studies of the Impact of Transport Infrastructure Projects on Economic Activity, National Economic Research Associates.
ECOTEC, 1999, Review of Methodology for Assessing the Economic Development Impacts of New Highway Infrastructure.
ERM Economics, 1999, "Review of Methodology for Assessing the Economic Development Impacts of New Highway Infrastructure" - Review.
European Commission, 1997, The Likely Macroeconomic and Employment Impacts of Investments in Trans-European Transport Networks, Commission Staff Working Paper, SEC(97)10, January.
Evans, RC, 1997, submission to SACTRA.
Government Office for the Eastern Region, 1997, Transport Investment, Transport Intensity and Economic Growth, submission to SACTRA.
Government Office for the North West, 1997, Transport Investment, Transport Intensity and Economic Growth, submission to SACTRA.
Government Office for the South East, 1997, Transport Investment, Transport Intensity and Economic Growth, submission to SACTRA.
Harris, R, 1998, The Incidence of Imperfect Competition in UK Sectors and Regions, Portsmouth University.
HM Treasury, 1995, A Framework for the Evaluation of Regeneration Projects and Programmes - Report of the Evaluation Group on Regional and Urban Programmes, HMSO.
HM Treasury, 1997a, evidence to SACTRA.
HM Treasury, 1997b, Appraisal and Evaluation in Central Government (aka 'The Green Book'), HMSO.
Highways Agency, Scottish Office, Welsh Office, Northern Ireland Department of the Environment, Design Manual for Roads and Bridges. Volume 11: Environmental Assessment. Volume 12.2.2: Guidance on Induced Traffic. Volume 13: COBA.
IWW, TRT, ME&P, CEBR, 1998, Assessment of Transport Strategies Deliverable D2, Design and Specification of a Systems Dynamics Model, Project ST-97-SC. 1049, DGVII - Transport, Commission of the European Communities.
Jara-Diaz, SR, 1986, 'On the Relation between Users' Benefits and the Economic Effects of Transportation Activities', Journal of Regional Science vol.26, 2.
Lowe, S, 1997, submission to SACTRA.
Martinez, F and Araya, C, 1998, Land-use Impacts of Transport Projects: User Benefits, Rents and Externalities, World Conference on Transport Research, Antwerp.

Transport and the economy: full report (SACTRA)
286
MVA, 1993, Inter-Urban Charging: Case Studies: Summary Report and Stage 2 Summary Report, reports to the Department of Transport.
MVA, 1995, The London Congestion Charging Research Programme, report for the Department of Transport. This work is summarised in a series of six papers published in Traffic Engineering and Control in February to July/August 1996.
MVA, 1997, Study of Parking and Traffic Demand: Stage Two: Bristol Case Study: Parking Control Strategies: Assessment of Demand Changes, report for the Department of Transport. This work is summarised in a series of three papers published in Traffic Engineering and Control in February to April 1997.
MVA, 1998, Study of Parking and Traffic Demand: Stage Two: Bristol Case Study: Detailed Assessment of Parking Control Strategies, report for the Department of Environment, Transport and the Regions.
Nash, CA, 1997, submission to SACTRA.
Neuberger, HLI, 1971, 'User Benefit in the Evaluation of Transport and Land-Use Plans', Journal of Transport Economics and Policy, Vol. 5 no. 1.
Oosterhaven, J, 1999, "Review of Land-Use/Transport Interaction Models"- Review, report to SACTRA.
PA Cambridge Economic Consultants and Transport Research Laboratory, 1995, Skye Bridge Socio-Economic Impact Study, Final Report to Scottish Office.
Plowden, S, 1997, submission to SACTRA.
Robertson, J and Wharton, R, 1997, submission to SACTRA.
Scottish Office , 1997, submission to SACTRA.
Standing Advisory Committee on Trunk Road Assessment, 1994, Trunk Roads and the Generation of Traffic, HMSO, London.
Swales, K, 1997, 'A Cost Benefit Approach to the Evaluation of Regional Selective Assistance', Fiscal Studies, vol 18, no 1, 73-85.
Transport Research Laboratory, forthcoming.
Tyler, J, 1997, submission to SACTRA.
Venables, AJ and Gasiorek, M, 1998, The Welfare Implications of Transport Improvements in the Presence of Market Failure, report to SACTRA.
University of Westminster, 1997, Jubilee Line Extension Impact Study - Towards a Methodology, Report to London Transport Planning.
Wenban-Smith, A, 1997, submission to SACTRA.
Williams, HCWL, 1977, 'On the formation of Travel Demand Models and Economic Evaluation Measures of user Benefit', Environment and Planning A, vol 9, no 3.

Transport and the economy: full report (SACTRA)
287
Appendix C
Jara-Diaz, SR, 1986, 'On the Relation between Users' Benefits and the Economic Effects of Transportation Activities', Journal of Regional Science, vol 26, 2.
Appendix D
Department of Transport, 1989, National Road Traffic Forecasts, 1989.
Department of the Environment, Transport and the Regions, 1997, National Road Traffic Forecasts (Great Britain), 1997.
Department of the Environment, Transport and the Regions, 1998, Transport Statistics.
Peake, S, 1994, Transport in Transition - Lessons from the History of Energy.
Appendix E
Department of the Environment, Transport and the Regions (1998): A New Deal for Trunk Roads in England: Guidance on the New Approach to Appraisal.
Glossary
Peake, S and Hope, C, 1994, 'Sustainable Mobility in Context', Transport Policy, 1(3).
Standing Advisory Committee on Trunk Road Assessment, 1994, Trunk Roads and the Generation of Traffic.
World Commission on Environment & Development, 1987, Our Common Future: Report of the Brundtland Commission.

Transport and the economy: full report (SACTRA)
288
Glossary
Accessibility Defined in various ways in transport (see paragraph 9.76).
Additionality (1) Where revenue raised from transport charges funds transport expenditure genuinely additional to other spending. (2) Used sometimes as shorthand for additional economic benefits or costs (see economic benefits).
Agglomeration The process whereby industries concentrate in specific locations in order to gain economies of scale (qv) or to take advantage of specialised labour and business services (see Chapter 5).
Appraisal The process of assessing projects or policies, including defining objectives, examining options and weighing up the costs, benefits, risks and uncertainties, before a decision is taken.
Comparative Advantage The idea that resources are best employed in activities in which they are relatively more efficient. Often used to identify potential areas of economic strength for firms or regions.
Competitiveness Defined in paragraph 3.18.
Computable General Equilibrium (CGE) A method of numerical calibration of general equilibrium analysis (qv).
Consumer Surplus The amount by which consumers value a product over and above what they pay for it (or, more technically, the extent to which the sum of marginal benefits exceeds the sum of marginal costs, qv).
Consumption The use of resources to satisfy current needs and wants.
Cost Benefit Analysis (CBA) Sometimes called 'social cost benefit analysis', this is an appraisal technique intended to aid decision-making in the public sector, in which welfare costs and benefits over the life of the project or policy are quantified in money terms, with future costs and benefits expressed in present values using a discount rate. Depending on context, a CBA may include all welfare costs and benefits, or all those terms which affect GDP, or all those which can be valued in money terms. A transport CBA calculates the net economic value of a transport project or policy. The DETR uses a form of cost benefit analysis, COBA, to appraise road projects; this includes the time saved or lost by travellers, and deaths and injuries in road accidents, which are given a monetary value.
Counterfactual A statement of what would have happened without a policy intervention, or with a different but specified intervention.

Transport and the economy: full report (SACTRA)
289
Deadweight Welfare Loss The welfare value of the output lost as a result of distortions from taxation or market imperfections (see paragraph 3.32).
Demand Curve The curve on a graph representing the relationship between price and the quantity demanded, showing what quantity a consumer will buy of something at various prices. The curve usually slopes downwards from left to right, reflecting the fact that the higher the price of a commodity, the lower the demand for it, but the slope will depend on the response of demand to price or elasticity (qv). A travel demand curve represents the amount of travel at a given price and hence the responses which travellers may make to changes in travel costs (see paragraphs 9.23 and 9.32 et seq).
Demand Management Policies or techniques which reduce levels or growth of traffic.
Derived Demand The demand for a product, or factor of production, (qv) which is derived from the demand for the finished product. Demand for transport is said to be derived from the demand for the goods or services which transport helps to produce.
Displacement The degree to which activity promoted by Government policy is offset by reductions in activity elsewhere.
Double-Dividend Used in the context of environmental taxes, where revenue from these is used to reduce other taxes. A weak double-dividend is where the costs of environmental taxes to individual welfare are lower if the proceeds from the taxes are used to finance reductions in distortionary taxation. A strong double-dividend is where the costs of the environmental taxes are more than offset by reductions in distortionary taxation (see paragraph 7.34 et seq).
Econometrics Quantitative models describing economic relationships.
Economic Agents Those taking decisions in businesses, households, Government agencies, etc, which affect the economy.
Economic Benefits/Costs See also Cost Benefit Analysis. Beneficial/detrimental impacts of a scheme or intervention. Detrimental impacts are sometimes termed disbenefits. This report uses a number of other terms:
• Transport Benefits/Costs: benefits or costs arising from impacts on the transport market of a scheme or intervention.
• Final Economic Benefits/Costs: benefits or costs arising from impacts on the final output markets as a result of an intervention in an input market (inputs are factors of production, qv).
• Wider Economic Benefits/Costs: benefits or costs arising from impacts in both intermediate and final output markets as a result of an intervention in an input market.

Transport and the economy: full report (SACTRA)
290
• Additional Economic Benefits/Costs: any wider benefits or costs which are not included in the benefits/costs arising in the market where the intervention took place.
• Total or Overall Economic Benefits/Costs: transport benefits/costs plus additional economic benefits/costs.
Economic growth See Gross Domestic Product.
Economies of Scale Factors which cause the average cost of producing something to fall as the numbers produced rise. A firm which doubled its output without doubling its costs would enjoy economies of scale. Returns to scale describes the proportionate increase in outputs resulting from the proportionate increase in all inputs. If a firm doubled its workforce, its raw materials and its machinery, it would achieve decreasing returns to scale if output less than doubled, constant returns to scale if output exactly doubled and increasing returns to scale if output more than doubled.
Economy See Gross Domestic Product.
Elasticity The measure of the sensitivity of one thing to another. Price elasticity is the sensitivity or proportional change in demand in response to a given proportional increase or decrease in price. Demand for goods which changes less than proportionally when people's income or the price of goods changes is said to be inelastic. Income elasticity is the reaction in total demand after an increase or decrease in income. Elasticity of substitution measures the degree to which two commodities or factors of production can be substituted for one another.
Endogenous Growth Models of economic growth where all the factors affecting the growth rate, including technical innovation, are determined within the model (as opposed to exogenous growth, qv).
Environmental Impact Analysis A statement of the environmental impact of a project or policy. Sometimes referred to as Environmental Assessment (EA), such a statement is now required under EU and UK law for most transport projects, and increasingly for programmes through 'Strategic Environmental Assessment' (SEA).
Equilibrium Where the forces determining the behaviour of some variable are in balance so there is no pressure for change. In this report, equilibrium is often used to describe a point where the demand for travel is equal to the supply of transport.
Evaluation Analysis, usually retrospective, of a project, programme or policy to assess how successful or otherwise it has been, and what lessons can be learnt from the future.
Ex ante Expected or intended before the event. Used in this report to describe analysis of proposed transport schemes or policies which set out the effects expected from those schemes or policies (see ex post).

Transport and the economy: full report (SACTRA)
291
Exogenous Growth Models of economic growth where factors external to the model, such as technological innovation, determine the growth rate (as opposed to endogenous growth, qv).
Ex post The result after the event, used here to describe analysis of transport schemes or policies once built or implemented (see ex ante).
External Costs Also known as social costs, those costs which do not fall on those individuals or agencies whose choices have caused them but on other individuals or agencies or on society as a whole, for example pollution, congestion and road casualties. Measures to bring these external costs into prices are described as internalisation. The term externalities covers external benefits as well as costs.
Factors of Production The inputs or resources used in the process of production, usually defined as land (and other natural resources), labour and capital.
Feedback Effects See Linkages.
Fiscal To do with public finances - taxation and spending by the Government.
Fiscal Revenue Neutral See Revenue Neutral.
Fixed Trip Matrix When the matrix of origins and destinations used in modelling traffic on a road network is assumed to be fixed. Under this assumption, demand is fixed and does not respond to new roads or other changes in transport, so the fixed trip matrix, unlike the variable trip matrix (qv), does not allow for any induced traffic(qv).
General Equilibrium Analysis This approach takes account of the interaction between different economic variables and the rest of the economy, in order to bring all markets into equilibrium, as opposed to partial equilbrium analysis which ignores the indirect effects that changes in one market have on the rest of the economy. For example, a general equilibrium analysis of waiters' wages would look at effects of wages or unemployment in other markets as well as demand and supply in the market for waiters.
Generalised Cost The cost of transport to the user, including operating costs, fares or tolls (including parking fees) paid and the cost of time in making the journey (see paragraph 9.32 et seq).
Gross Domestic Product (GDP) The usual measure for assessing the performance of the economy (see 3.10). The rate of economic growth is usually defined as the percentage change in GDP per head per year. When measured in constant prices (excluding inflation), this is described as real GDP. GDP statistics which only measure transactions where money changes hands are known as measured GDP; other statistics, known as true GDP, aim to include non-monetary production such as housework or childcare (see Chapter 3).
Transport and the economy: full report (SACTRA)
292
Growth Effects Policies or circumstances that change the long run rate of growth of GDP (as opposed to levels effects, qv).
Hypothecation The practice of tying or ringfencing revenues received from a charge or tax to a specific use.
Imperfect Competition A market where there is some competition, but also some firms large enough to influence prices and hence keep them higher than they would be under perfect competition (qv).
Induced Traffic Traffic induced or generated as the result of changes in the extent or management of the road network.
Infrastructure The structures (roads, railways, etc) on which transport services run.
Input See Factors of Production.
Input-Output Analysis The analysis of an economy in terms of the relationships between all inputs and outputs. This allows the measurement of the linkages between, and impacts on, other industries from a change in output or demand for particular goods or services.
Intermediate Goods or Products Something used in the production of other goods (transport is an example of an intermediate good).
Internalisation See External Costs.
Land-use/Transport Interaction Model (LUTI) A computer-based model which aims to predict the effects on land uses of (among other things) changes in the price, quality and availability of transport brought about by transport schemes or policies, and also the effect of land-use changes on transport networks.
Levels Effects Changes in policies or circumstances that have a once and for all effect on the level of GDP.
Linkages The effects of changes in one market on others. For example, a change in transport costs may change where people live or where businesses are based, thus affecting labour, housing and land markets (see Chapter 4 and Chapter 5).
Logistics The planning and organisation of the movement and supply of goods and intermediate products (qv).
Macroeconomics The study of whole economic systems such as national economies, as opposed to microeconomics (qv).
Transport and the economy: full report (SACTRA)
293
Marginal Benefit The benefit to a consumer of an individual item or service.
Marginal Cost The increase in the total cost of a firm caused by increasing its output by one extra unit. Marginal cost pricing is where the price of an item is equal to the cost of producing one extra unit of the item.
Marginal Social Cost Marginal costs only measure the private value to individuals of an extra unit being produced. Marginal social costs also include the cost of producing the unit to society as a whole, through externalities (qv).
Market Failure (also Market Imperfection) Where a market is not economically efficient in some way, and hence some form of Government intervention is justified. A market failure might come about because of poor information, monopoly (qv), externalities (qv) or some other reason. Market clearing is where markets operate efficiently to ensure demand equals supply. Market integration is the linking up of previously distinct markets, for example, where trade barriers are lifted or the costs of trade reduced.
Microeconomics The study of economics at the level of individual consumers, firms or industries.
Modal Split The share taken by different modes of transport for a particular type of journey.
Monetisation The process of giving a monetary value to something (eg, pollution) which is not traded or priced.
Monopoly A market with only one supplier, the opposite of perfect competition(qv). In economic theory, monopolies tend to be characterised by higher prices and lower consumer surpluses (qv) than markets with perfect competition.
Monopsony A market in which there is only one buyer of the item sold, who will then influence the market price for the item.
Multiplier The total effects on the level of economic activity (output, income or employment) associated with a policy intervention, expressed relative to the immediate direct effects, allowing for second and subsequent rounds of impact: for example, the impact of a transport policy or scheme on the economy once the effects on all markets and responses have been considered.
Net Present Value 'Present value' is the capitalised value of a stream of future costs or benefits; net present value describes the difference between the present value of a stream of costs and a stream of benefits.

Transport and the economy: full report (SACTRA)
294
Opportunity Cost The value of that which must be given up to acquire or achieve something - the opportunity foregone by consuming an item instead of using the resources to make something else.
Partial Equilibrium See General Equilibrium.
Perfect Competition A model of industrial structure or the economy where there is free entry to and exit from the market, full distribution of information about the market and where no one firm or buyer has any dominant role. Monopoly, (qv) where there is only one firm or buyer in the market, is at the other end of the spectrum; in between lie degrees of imperfect competition(qv) or oligopoly where a few firms or buyers dominate the market. In economic theory, any move away from perfect competition and towards monopoly will tend to increase prices and rigidities in the market.
Price-Cost Margins The difference between the price a firm charges for a product and the cost to that firm of making that product.
Price Elasticity See Elasticity.
Productivity The volume of output obtained per unit of input (often of labour). See total factor productivity.
Programme A policy intervention or group of interventions or schemes.
Project A discrete one-off form of activity or expenditure, often of a capital nature such as a new road.
Rationale The justification of a policy intervention, in terms of the market failures (qv) it aims to correct, and how it is designed to correct them.
Regeneration The process of improving the environmental, economic or social characteristics of a given geographical area, generally used in this report to describe urban or regional regeneration.
Returns to Scale See Economies of Scale.
Revenue Neutral Used in discussion of taxation where revenues from a new tax or charge are used to reduce others so that overall tax revenues stay the same.
Resources Usually defined as land, labour and capital, the factors of production (qv) which economic theory and policy aims to allocate efficiently. This term is distinct from natural resources or commodities which exist without any effort by humankind and which when used or exploited
Transport and the economy: full report (SACTRA)
295
can form one factor of production. 'Resources' is also used by Government departments as a term for funding or spending.
Rule of a Half A convention in transport appraisal used to value the changes in travel costs. When demand changes in response to changes in costs, half the change in cost is attributed to the trips lost or gained, and this is added to the changes of costs experienced by existing and continuing travellers to get the consumer surplus (qv) for the transport scheme (see Chapter 3).
Second-Best Option One that does not correspond to the theoretically optimum solution but is the best of the available non-optimal policies or measures.
Sensitivity Analysis Analysis of the effects on an appraisal (qv) of changing the values of important factors.
Severance Separation of adjacent areas by road or rail infrastructure or heavy traffic, causing negative impact on human beings ('community severance') or flora and fauna.
Shadow Price The opportunity cost (qv) to society of engaging in some economic activity, used when actual prices cannot be charged. For example, when there is unemployment, the shadow price - the cost to society of using that labour - will be zero because no sacrifice is made in terms of other goods foregone.
Social Exclusion The exclusion of groups or classes of people from participation in society.
Social Costs See Externalities.
Stated Preference Willingness to pay for something which is not marketed, such as future policy or scheme options, derived from questionnaires and/or controlled discussion groups. Sometimes used to produce a 'contingent valuation' of environmental quality.
Sustainable Development "Development that meets the needs of the present without compromising the ability of future generations to meet their own needs" (Report of the World Commission on Environment & Development, 1987). Used by the Government and others to include and integrate economic, environmental and social development.
Total Factor Productivity (TFP) Output measured relative to a weighted sum of all factors of production (qv) ie, land, labour and capital.
Traffic The extent of movement, expressed as the total distance covered by vehicles (vehicle kilometres) or by passengers (passenger kilometres) or freight (tonne kilometres). In this report, 'traffic' refers to road traffic unless otherwise qualified.

Transport and the economy: full report (SACTRA)
296
Traffic Reduction The reduction of (usually road) traffic levels using traffic restraint (qv) or demand management (qv) techniques, often as a package which includes provision of alternatives to car use such as improved public transport. The Road Traffic Reduction Act 1997 requires local authorities to consider setting targets for traffic reduction.
Traffic Restraint A restriction on the level or movement of traffic, which may or may not lead to traffic reduction.
Transport The function which allows movement of goods or persons from one physical location to another, or the access by people to other people, or to goods and services.
Transport Improvement Defined in this report as any intervention - including infrastructure investment and demand management - which reduces transport costs or improves services.
Transport Intensity Proposed by Peake and Hope (1994) as an aggregate measure of the importance of transport in the economy, measured as a ratio of 'gross mass movement' to GDP. Freight transport intensity measures tonne-kilometres as a ratio of GDP. Distinct from traffic intensity, which measures the ratio of vehicle kilometres to GDP.
Transport Mode Category of the means of transport (road, rail, bus, aviation, walk, shipping, etc).
Transport Model A computer model of a transport system which aims to predict the impact of changes in that system, or of policies affecting the use made of the network.
Travel People's use of the transport system, measured in trips or journeys.
Utility The pleasure or satisfaction derived by an individual from being in a particular situation, or from consuming something. Used by economists as the ultimate goal of economic activity.
Values of Time The monetary valuation of transport users' time is used to calculate benefits from transport schemes in cost benefit analysis (qv). Different values are given for different journey purposes; the value of time for journeys in the course of work is derived from wage rates, while non-work journey time values are derived from studies showing people's willingness to trade time for money (see paragraph 9.56).
Variable Trip Matrix A matrix of origins and destinations used in modelling traffic which (unlike the fixed trip matrix, qv) allows for changes in those origins and destinations in response to changes in the road network. Widely adopted following SACTRA's last report in 1994.
Welfare Human well-being: 'economic welfare' implies a broader measure than Gross Domestic Product (qv) of well-being.

Transport and the economy: full report (SACTRA)
297
These documents are made available in Adobe Acrobat format for downloading. The Adobe Acrobat Reader can be freely downloaded.
Analysis of Transport Schemes: Economic Impact Studies
• Analysis of Transport Schemes: Economic Impact Studies (591kb)
A Framework for Assessing Studies of the Impact of Transport Infrastructure Projects on Economic Activity
• A Framework for Assessing Studies of the Impact of Transport Infrastructure Projects on Economic Activity (262kb)
Review of Land-Use / Transport Interaction Models
• Review of Land-Use / Transport Interaction Models: Part 1 (714kb)
• Review of Land-Use / Transport Interaction Models: Annexes (683kb)
• Review of Land-Use / Transport Interaction Models: Part 2 (291kb)
Review of the Methodology for Assessing the Economic Development Impacts of New Highway Infrastructure
• Review of the Methodology for Assessing the Economic Development Impacts of New Highway Infrastructure (including a Review of the Report) (448kb)
Taxation, Economic Growth and the Double Dividend
• Taxation, Economic Growth and the Double Dividend (153kb)
The Welfare Implications of Transport Improvements in the Presence of Market Failure
• The Welfare Implications of Transport Improvements in the Presence of Market Failure: Part 1 (883kb)
• The Welfare Implications of Transport Improvements in the Presence of Market Failure: Part 2 (726kb)
Analysis of Transport Schemes: Economic Impact Studies (ISBN 1-851123-51-6 - £30.00) Review of Land-Use / Transport Interaction Models (ISBN 1-851121-95-1 - £40.00) Review of the Methodology for Assessing the Economic Development Impacts of New Highway Infrastructure (including a Review of the Report) (ISBN 1-851121-95-1 - £25.00) The Welfare Implications of Transport Improvements in the Presence of Market Failure (ISBN 1-851121-94-3 - £35.00) A Framework for Assessing Studies of the Impact of Transport Infrastructure Projects on Economic Activity (ISBN 1-851123-35-0 - £25)
The publications home page contains information on how and where you can obtain publications produced by the Department for Transport.
Taxation, Economic Growth and the Double Dividend (free)
David Gott DETR

Transport and the economy: full report (SACTRA)
298
3/08, Great Minster House 76 Marsham Street London, SW1P 4DR