
Transport and storage industry, 2013 - Statistics … South Africa Transport and storage industry,...
30
Transport and storage industry, 2013 Statistics South Africa Pali Lehohla Statistician-General Report No. 71-02-01 (2013)
Transcript of Transport and storage industry, 2013 - Statistics … South Africa Transport and storage industry,...
Transport and storage industry, 2013
Statistics South Africa
Pali Lehohla Statistician-General
Report No. 71-02-01 (2013)
Statistics South Africa
Transport and storage industry, Report No. 71-02-01 (2013)
ii
Transport and storage industry, 2013 / Statistics South Africa Published by Statistics South Africa, Private Bag X44, Pretoria 0001 © Statistics South Africa, 2015 Users may apply or process this data, provided Statistics South Africa (Stats SA) is acknowledged as the original source of the data; that it is specified that the application and/or analysis is the result of the user's independent processing of the data; and that neither the basic data nor any reprocessed version or application thereof may be sold or offered for sale in any form whatsoever without prior permission from Stats SA. Stats SA Library Cataloguing-in-Publication (CIP) Data Transport and storage industry, 2013/ Statistics South Africa. Pretoria: Statistics South Africa, 2015 [Report No. 71-02-01 (2013)] 30 pp ISBN: 978-0-621-44098-0 A complete set of Stats SA publications is available at Stats SA Library and the following libraries:
National Library of South Africa, Pretoria Division National Library of South Africa, Cape Town Division Library of Parliament, Cape Town Bloemfontein Public Library Natal Society Library, Pietermaritzburg Johannesburg Public Library Eastern Cape Library Services, King William’s Town Central Regional Library, Polokwane Central Reference Library, Nelspruit Central Reference Collection, Kimberley Central Reference Library, Mmabatho
This report is available on the Stats SA website: www.statssa.gov.za Copies are obtainable from: Printing and Distribution, Statistics South Africa Tel: (012) 310 8093 (012) 310 8251 (012) 310 8358 (012) 310 8161 Fax: (012) 321 7381 Email: [email protected]
Statistics South Africa
Transport and storage industry, Report No. 71-02-01 (2013)
iii
Table of Contents 1. Introduction ................................................................................................................................................................................................................................................ 1 1.1 Scope and coverage .................................................................................................................................................................................................................................... 1 1.2 Data items .................................................................................................................................................................................................................................................... 2 1.3 Reference period .......................................................................................................................................................................................................................................... 2 1.4 Current prices ............................................................................................................................................................................................................................................... 2 1.5 Reliability of data .......................................................................................................................................................................................................................................... 2 1.6 Confidentiality ............................................................................................................................................................................................................................................... 2 1.7 Reporting unit ............................................................................................................................................................................................................................................... 2 2. Summary of findings for the year 2013.................................................................................................................................................................................................... 3 Figure 1 − Income by type of service in the transport and storage industry, 2013................................................................................................................................................ 3 Figure 2 − Composition of expenditure in the transport and storage industry, 2013 ............................................................................................................................................ 3 Figure 3 – Employment in the transport and storage industry, 2013 ..................................................................................................................................................................... 4 Figure 4 – Gender ratios in the transport and storage industry, 2013 ................................................................................................................................................................... 4 3. Tables .......................................................................................................................................................................................................................................................... 5 Table 1 – Principal statistics in the transport and storage industry, 2010 and 2013 ............................................................................................................................................. 5 Table 2 – Principal statistics in the transport and storage industry, 2013 ............................................................................................................................................................. 5 Table 3 – Income by type of service in the transport and storage industry, 2010 and 2013 ................................................................................................................................. 6 Table 4 – Income in the transport and storage industry, 2013 .............................................................................................................................................................................. 7 Table 5 – Concentration ratios (relative contribution of large enterprises) in the transport and storage industry, 2013 ....................................................................................... 8 Table 6 – Expenditure items in the transport and storage industry, 2010 and 2013 ............................................................................................................................................. 9 Table 7 – Expenditure in the transport and storage industry, 2013 ..................................................................................................................................................................... 10 Table 7 – Expenditure in the transport and storage industry, 2013 (concluded) ................................................................................................................................................. 11 Table 8 – Employment in the transport and storage industry at the end of June 2013 ....................................................................................................................................... 12 Table 9 – Details of employment in the transport and storage industry at the end of June 2010 and June 2013 .............................................................................................. 13 Table 10 – Details of employment in the transport and storage industry at the end of June 2013 ..................................................................................................................... 14 Table 11 − Railway passenger transport: income by type of service, 2010 and 2013 ........................................................................................................................................ 14 Table 12 − Railway freight transport: income and volume by type of freight, 2010 and 2013 ............................................................................................................................ 15 Table 13 – Road freight transport: income by type of freight, 2010 and 2013 .................................................................................................................................................... 16 Table 14 – Pipeline freight transport: income and volume by type of freight, 2010 and 2013 ............................................................................................................................ 16 Table 15 − Air transport: income by type of service, 2010 and 2013 .................................................................................................................................................................. 17 Table 16 − Income from supporting and auxiliary transport services, 2010 and 2013 ........................................................................................................................................ 18 Table 17 – Fuel purchases for selected activities, 2010 and 2013 ..................................................................................................................................................................... 19 Table 18 – Geographical distribution in the transport and storage industry, 2013 .............................................................................................................................................. 20 Table 19 – Information and communication technology usage in the transport and storage industry at the end of June 2013 ......................................................................... 21
Statistics South Africa
Transport and storage industry, Report No. 71-02-01 (2013)
iv
Table 20 – Information and communication technology usage in the transport and storage industry by size group at the end of June 2013 .................................................. 21 Explanatory notes .............................................................................................................................................................................................................................................. 22 Table 21 – Size groups for the transport and storage industry ........................................................................................................................................................................... 22 Glossary .............................................................................................................................................................................................................................................................. 24 General information ........................................................................................................................................................................................................................................... 26
Statistics South Africa
Transport and storage industry, Report No. 71-02-01 (2013)
1
Transport and storage industry, 2013
1. Introduction
This publication presents estimates in respect of the 2013 transport and storage large sample survey (LSS). This is a periodic survey based on a census of private and public enterprises operating in the transport and storage industry. The reporting period was the financial year ended on any date between 1 July 2012 and 30 June 2013. The data for the number of employees were provided for the last pay period ended on or before 30 June 2013. The last transport and storage LSS was conducted in 2010 (Report No. 71-02-01 (2010)).
1.1 Scope and coverage
The 2013 transport and storage LSS covers enterprises registered for value-added tax (VAT) that are mainly engaged in the following activities classified according to the January 1993 edition of the Standard Industrial Classification of all Economic Activities (SIC), Fifth edition, Report No. 09-09-02:
Railway transport SIC 7111
Other scheduled passenger land transport SIC 7121
Other non-scheduled passenger land transport SIC 7122
Freight transport by road SIC 7123
Transport via pipelines SIC 7130
Sea and coastal water transport SIC 7211
Inland water transport SIC 7220
Air transport SIC 7300
Cargo handling SIC 7411
Storage and warehousing SIC 7412
Other supporting transport activities SIC 7413
Travel agencies and related activities SIC 7414
Activities of other transport agencies SIC 7419 The following activities are excluded:
Enterprises for which transport is a secondary or auxiliary activity were excluded.
Municipal bus services. The activities of municipalities are included in SIC 9130 Local authority activities.
Bus companies which are not registered for VAT.
Rental of private cars/buses without drivers.
Rental of trucks without drivers.
Minibus taxis.

Statistics South Africa
Transport and storage industry, Report No. 71-02-01 (2013)
2
1.2 Data items
The following categories of data items were collected: industrial classification, information and communication technology (ICT), details of employment, trading income, expenditure, details of services rendered and purchases.
1.3 Reference period
The questionnaires were completed for the financial year of the enterprise which ended on any date between 01 July 2012 and 30 June 2013, according to the usual reporting schedule of the enterprise. Example
o 01 October 2011 – 30 September 2012 o 01 January 2012 – 31 December 2012 o 01 February 2012 – 31 January 2013 o 01 March 2012 – 28 February 2013 o 01 April 2012 – 31 March 2013
1.4 Current prices
The rand values are at current prices.
1.5 Reliability of data
All estimates compiled for this industry are subject only to non-sampling errors because a census of the industry was conducted. The following are some of the likely sources of non-sampling errors: sampling frame not up to date, wrong definitions and classification, phrasing of questions, non-response, processing and estimation. Every effort is made to minimise non-sampling errors by the careful design of questionnaires, testing them in pilot studies, editing reported data and implementing efficient operating procedures. Non-sampling errors occur in both sample surveys and censuses.
1.6 Confidentiality
According to section 17 of the Statistics Act, 1999 (Act No. 6 of 1999), completed questionnaires remain confidential to Statistics South Africa (Stats SA). Individual business information is never disclosed. Results are presented in aggregated form only.
1.7 Reporting unit
The statistical unit for the collection of information is an enterprise. An enterprise is a legal unit (or a combination of legal units) that includes and directly controls all functions necessary to carry out its activities. Each industry is classified to an industry that reflects its predominant activity.

Statistics South Africa
Transport and storage industry, Report No. 71-02-01 (2013)
3
2. Summary of findings for the year 2013
Figure 1 − Income by type of service in the transport and storage industry, 2013
Figure 2 − Composition of expenditure in the transport and storage industry, 2013
The total income for the transport and storage industry in 2013 was R401 869 million. The largest contributor to the total income was ‘activities of other transport agencies’ (R132 618 million or 33%), followed by ‘freight transport by road’ (R87 857 million or 22%) (Figure 1 and Table 2, page 5). The total income represents an increase of 10,7% per annum over the income reported in the corresponding survey of 2010 (R296 025 million).
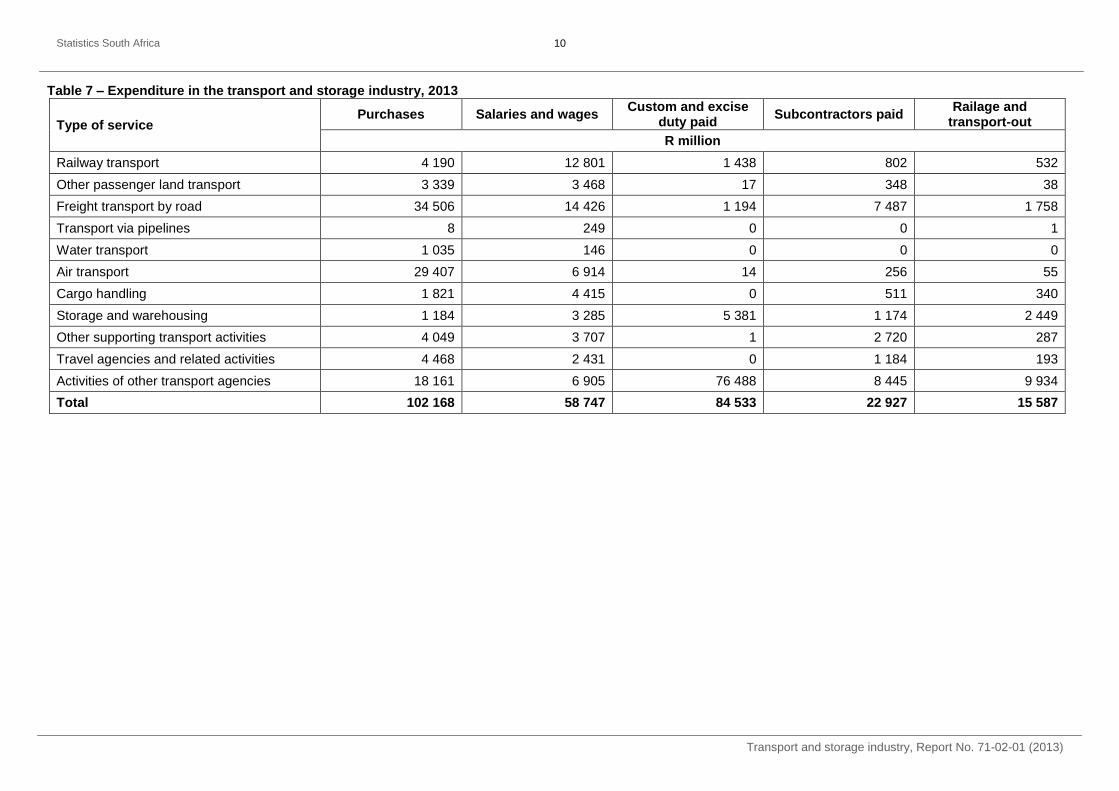
Expenditure in the transport and storage industry in 2013 amounted to R381 919 million. The expenditure consisted mainly of ‘purchases’ (R102 168 million or 27%), ‘custom and excise duty paid’ (R84 533 million or 22%), ‘salaries and wages’ (R58 747 million or 15%) and ‘subcontractors paid’ (R22 927 million or 6%) (Figure 2 and Table 7, pages 10 - 11).

Statistics South Africa
Transport and storage industry, Report No. 71-02-01 (2013)
4
Figure 3 – Employment in the transport and storage industry, 2013
Figure 4 – Gender ratios in the transport and storage industry, 2013
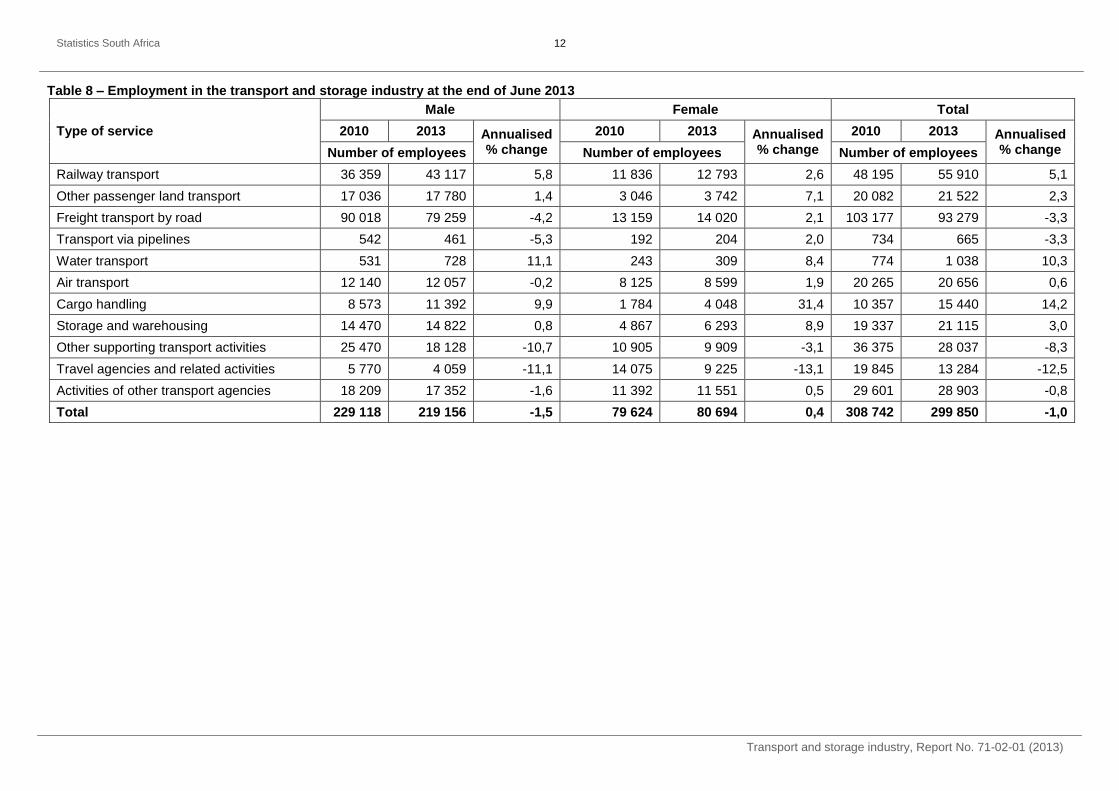
The total number of persons employed in the transport and storage industry at the end of June 2013 was 299 850. ‘Freight transport’ had the largest number of employees (93 279 or 31%), followed by ‘railway transport’ (55 910 or 19%) and ‘activities of other transport agencies’ (28 903 or 10%) (Figure 3 and Table 8, page 12). The total number of persons employed represents a decrease of 1,0% per annum over the number of persons employed reported in the corresponding survey of 2010 (308 742).
The proportion of females out of the total persons employed was 27%. The industry with the highest proportion of females employed was ‘travel agencies and related activities’ (69%), while ‘freight transport by road’ had the highest proportion of males employed (85%) (Figure 3 and Table 8, page 12).
PJ Lehohla Statistician General

Statistics South Africa
Transport and storage industry, Report No. 71-02-01 (2013)
5
3. Tables
Table 1 – Principal statistics in the transport and storage industry, 2010 and 2013
Item
2010 2013
Annualised % change R million
Total income 296 025 401 869 10,7
Total expenditure 280 689 381 919 10,8
Total value of opening inventories 3 091 3 202 1,2
Total value of closing inventories 2 553 3 772 13,9
Net profit or loss before tax 14 798 20 520 11,5
Table 2 – Principal statistics in the transport and storage industry, 2013
Type of service Total income
Total expenditure
Total value of opening
inventories
Total value of closing inventories
Net profit or loss before tax
R million
Railway transport 44 154 38 620 929 1 078 5 682
Other passenger land transport 11 461 10 807 231 229 654
Freight transport by road 87 857 84 050 593 676 3 886
Transport via pipelines 2 949 1 862 230 423 1 280
Water transport 1 798 1 583 33 37 219
Air transport 52 986 52 843 342 392 192
Cargo handling 14 235 13 306 243 247 934
Storage and warehousing 19 104 17 872 263 220 1 189
Other supporting transport activities 23 008 19 408 222 300 3 677
Travel agencies and related activities 11 699 10 866 17 19 835
Activities of other transport agencies 132 618 130 702 99 151 1 968
Total 401 869 381 919 3 202 3 772 20 516

Statistics South Africa
Transport and storage industry, Report No. 71-02-01 (2013)
6
Table 3 – Income by type of service in the transport and storage industry, 2010 and 2013
Type of service 2010 2013
Annualised % change R million
Railway transport 28 976 44 154 15,1
Other passenger land transport 9 051 11 461 8,2
Freight transport by road 59 426 87 857 13,9
Transport via pipelines 1 257 2 949 32,9
Water transport 1 832 1 798 -0,6
Air transport 44 386 52 986 6,1
Cargo handling 7 520 14 235 23,7
Storage and warehousing 12 253 19 104 16,0
Other supporting transport activities 22 965 23 008 0,1
Travel agencies and related activities 12 326 11 699 -1,7
Activities of other transport agencies 96 033 132 618 11,4
Total 296 025 401 869 10,7

Statistics South Africa
Transport and storage industry, Report No. 71-02-01 (2013)
7
Table 4 – Income in the transport and storage industry, 2013
Type of service Sales and services Other income Total income
R million
Railway transport 34 869 9 285 44 154
Other passenger land transport 8 601 2 860 11 461
Freight transport by road 85 414 2 443 87 857
Transport via pipelines 2 801 148 2 949
Water transport 1 736 62 1 798
Air transport 50 530 2 456 52 986
Cargo handling 14 025 210 14 235
Storage and warehousing 13 221 5 883 19 104
Other supporting transport activities 20 779 2 229 23 008
Travel agencies and related activities 10 993 706 11 699
Activities of other transport agencies 63 879 68 739 132 618
Total 306 848 95 021 401 869
Statistics South Africa
Transport and storage industry, Report No. 71-02-01 (2013)
8
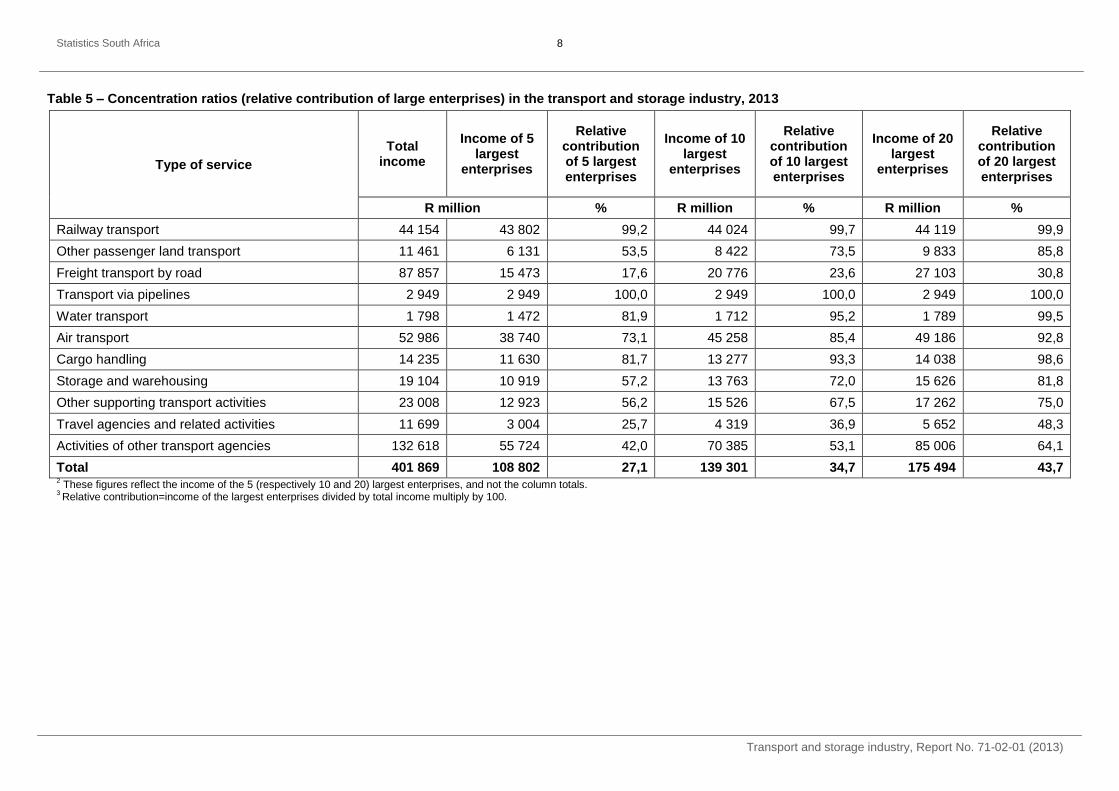
Table 5 – Concentration ratios (relative contribution of large enterprises) in the transport and storage industry, 2013
Type of service
Total income
Income of 5 largest
enterprises
Relative contribution of 5 largest enterprises
Income of 10 largest
enterprises
Relative contribution of 10 largest enterprises
Income of 20 largest
enterprises
Relative contribution of 20 largest enterprises
R million % R million % R million %
Railway transport 44 154 43 802 99,2 44 024 99,7 44 119 99,9
Other passenger land transport 11 461 6 131 53,5 8 422 73,5 9 833 85,8
Freight transport by road 87 857 15 473 17,6 20 776 23,6 27 103 30,8
Transport via pipelines 2 949 2 949 100,0 2 949 100,0 2 949 100,0
Water transport 1 798 1 472 81,9 1 712 95,2 1 789 99,5
Air transport 52 986 38 740 73,1 45 258 85,4 49 186 92,8
Cargo handling 14 235 11 630 81,7 13 277 93,3 14 038 98,6
Storage and warehousing 19 104 10 919 57,2 13 763 72,0 15 626 81,8
Other supporting transport activities 23 008 12 923 56,2 15 526 67,5 17 262 75,0
Travel agencies and related activities 11 699 3 004 25,7 4 319 36,9 5 652 48,3
Activities of other transport agencies 132 618 55 724 42,0 70 385 53,1 85 006 64,1
Total 401 869 108 802 27,1 139 301 34,7 175 494 43,7 2 These figures reflect the income of the 5 (respectively 10 and 20) largest enterprises, and not the column totals.
3 Relative contribution=income of the largest enterprises divided by total income multiply by 100.

Statistics South Africa
Transport and storage industry, Report No. 71-02-01 (2013)
9
Table 6 – Expenditure items in the transport and storage industry, 2010 and 2013
Item 2010 2013
Annualised % change R million
Purchases 49 022 102 168 27,7
Subcontractors paid and railage and transport-out 33 667 38 514 4,6
Salaries and wages 46 947 58 747 7,8
Repair and maintenance 8 250 11 714 12,4
Custom and excise duty paid 52 242 84 533 17,4
Motor vehicle running expenditure 3 125 8 510 39,6
Total telecommunication 1 491 2 485 18,6
Other expenditure 85 945 77 920 -3,2
Total expenditure 280 689 381 919 10,8
*Subcontractors and railage were reported as one variable in 2010 *Custom and excise duties paid were reported as one variable in 2010
Statistics South Africa
Transport and storage industry, Report No. 71-02-01 (2013)
10
Table 7 – Expenditure in the transport and storage industry, 2013
Type of service Purchases Salaries and wages
Custom and excise duty paid
Subcontractors paid Railage and
transport-out
R million
Railway transport 4 190 12 801 1 438 802 532
Other passenger land transport 3 339 3 468 17 348 38
Freight transport by road 34 506 14 426 1 194 7 487 1 758
Transport via pipelines 8 249 0 0 1
Water transport 1 035 146 0 0 0
Air transport 29 407 6 914 14 256 55
Cargo handling 1 821 4 415 0 511 340
Storage and warehousing 1 184 3 285 5 381 1 174 2 449
Other supporting transport activities 4 049 3 707 1 2 720 287
Travel agencies and related activities 4 468 2 431 0 1 184 193
Activities of other transport agencies 18 161 6 905 76 488 8 445 9 934
Total 102 168 58 747 84 533 22 927 15 587

Statistics South Africa
Transport and storage industry, Report No. 71-02-01 (2013)
11
Table 7 – Expenditure in the transport and storage industry, 2013 (concluded)
Type of service
Repair and maintenance
Motor vehicle running expenditure
Total telecommunication
Other expenditure Total expenditure
R million
Railway transport 1 604 427 191 16 637 38 620
Other passenger land transport 315 884 42 2 357 10 807
Freight transport by road 2 430 5 754 400 17 311 84 050
Transport via pipelines 49 7 21 1 527 1 862
Water transport 10 3 3 390 1 583
Air transport 5 504 30 991 8 849 52 843
Cargo handling 489 123 48 5 003 13 306
Storage and warehousing 172 305 69 3 853 17 872
Other supporting transport activities 625 259 321 7 455 19 408
Travel agencies and related activities 60 64 114 2 352 10 866
Activities of other transport agencies 456 654 285 9 396 130 702
Total 11 714 8 510 2 485 16 637 381 919
Statistics South Africa
Transport and storage industry, Report No. 71-02-01 (2013)
12
Table 8 – Employment in the transport and storage industry at the end of June 2013
Type of service
Male Female Total
2010 2013 Annualised % change
2010 2013 Annualised % change
2010 2013 Annualised % change Number of employees Number of employees Number of employees
Railway transport 36 359 43 117 5,8 11 836 12 793 2,6 48 195 55 910 5,1
Other passenger land transport 17 036 17 780 1,4 3 046 3 742 7,1 20 082 21 522 2,3
Freight transport by road 90 018 79 259 -4,2 13 159 14 020 2,1 103 177 93 279 -3,3
Transport via pipelines 542 461 -5,3 192 204 2,0 734 665 -3,3
Water transport 531 728 11,1 243 309 8,4 774 1 038 10,3
Air transport 12 140 12 057 -0,2 8 125 8 599 1,9 20 265 20 656 0,6
Cargo handling 8 573 11 392 9,9 1 784 4 048 31,4 10 357 15 440 14,2
Storage and warehousing 14 470 14 822 0,8 4 867 6 293 8,9 19 337 21 115 3,0
Other supporting transport activities 25 470 18 128 -10,7 10 905 9 909 -3,1 36 375 28 037 -8,3
Travel agencies and related activities 5 770 4 059 -11,1 14 075 9 225 -13,1 19 845 13 284 -12,5
Activities of other transport agencies 18 209 17 352 -1,6 11 392 11 551 0,5 29 601 28 903 -0,8
Total 229 118 219 156 -1,5 79 624 80 694 0,4 308 742 299 850 -1,0

Statistics South Africa
Transport and storage industry, Report No. 71-02-01 (2013)
13
Table 9 – Details of employment in the transport and storage industry at the end of June 2010 and June 2013
Item 2010 2013
Annualised % change Number
Permanent employees
Male 212 385 196 624 -2,5
Female 75 874 74 105 -0,8
Total 288 256 270 729 -2,1
Temporary employees
Male 11 183 18 490 18,2
Female 2 863 4 934 19,9
Total 14 048 23 424 18,6
Casual employees
Male 5 550 3 940 -10,8
Female 890 1 757 25,5
Total 6 443 5 697 -4,0
Total employees
Male 229 118 219 054 -1,5
Female 79 624 80 796 0,5
Total 308 742 299 850 -1,0

Statistics South Africa
Transport and storage industry, Report No. 71-02-01 (2013)
14
Table 10 – Details of employment in the transport and storage industry at the end of June 2013
Type of service
Permanent employees Temporary employees Casual employees
Male Female Total Male Female Total Male Female Total
Number of employees
Railway transport 35 141 12 434 47 575 7 939 2 118 10 058 0 0 0
Other passenger land transport 16 248 3 300 19 563 1 462 390 1 852 51 23 74
Freight transport by road 74 060 13 415 87 511 2 606 695 3 302 2 359 1 052 3 412
Transport via pipelines 442 195 637 19 5 24 0 0 0
Water transport 694 296 989 22 6 28 12 5 17
Air transport 11 726 8 484 20 209 261 70 331 50 22 72
Cargo handling 10 410 3 569 13 979 926 247 1 174 55 25 80
Storage and warehousing 13 094 5 592 18 687 1 404 375 1 778 305 136 441
Other supporting transport activities 14 402 6 808 21 279 2 795 746 3 541 711 317 1 028
Travel agencies and related activities 3 620 8 771 12 442 196 52 249 174 78 252
Activities of other transport agencies 16 226 10 857 27 107 859 229 1 088 222 99 321
Total 196 063 73 721 269 977 18 490 4 934 23 424 3 940 1 757 5 697
Table 11 − Railway passenger transport: income by type of service, 2010 and 2013
Type of service 2010 2013
Annualised % change R million
Commuter rail services (suburban) 970 1 698 20,5
Inter-city and cross-border (long distance) 975 1 123 4,8
Total railway passenger transport 1 945 2 821 13,2
Statistics South Africa
Transport and storage industry, Report No. 71-02-01 (2013)
15
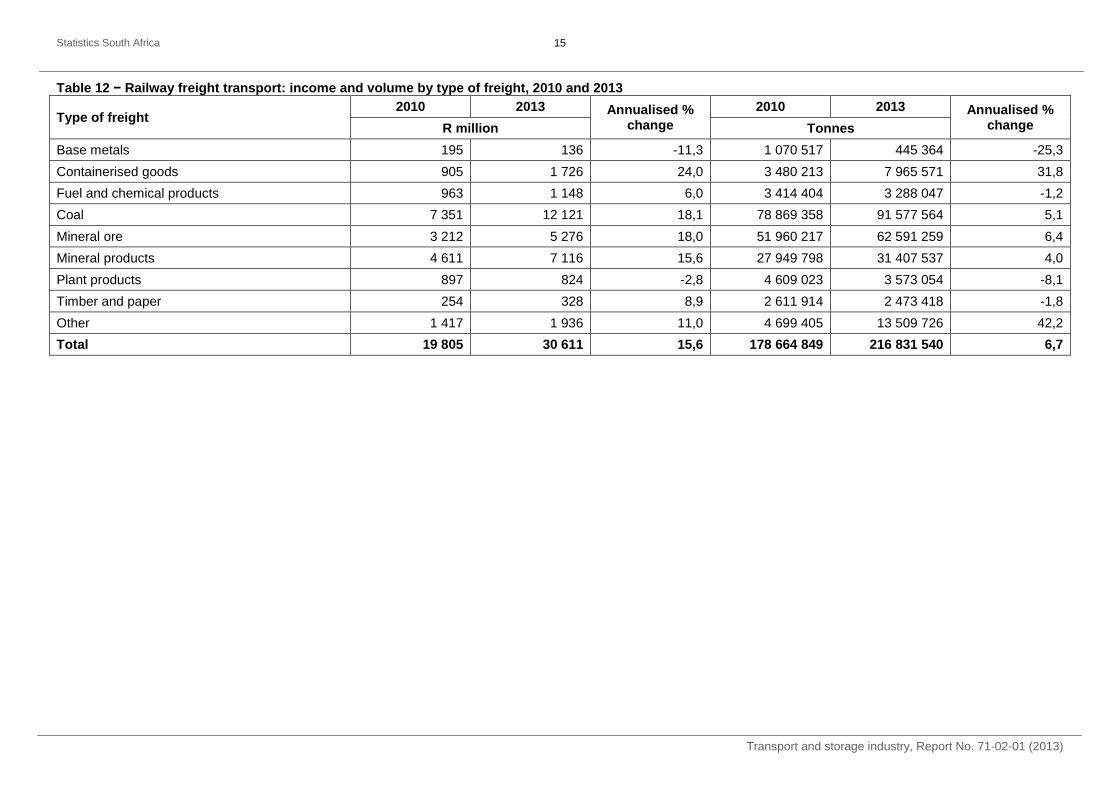
Table 12 − Railway freight transport: income and volume by type of freight, 2010 and 2013
Type of freight 2010 2013 Annualised %
change
2010 2013 Annualised % change R million Tonnes
Base metals 195 136 -11,3 1 070 517 445 364 -25,3
Containerised goods 905 1 726 24,0 3 480 213 7 965 571 31,8
Fuel and chemical products 963 1 148 6,0 3 414 404 3 288 047 -1,2
Coal 7 351 12 121 18,1 78 869 358 91 577 564 5,1
Mineral ore 3 212 5 276 18,0 51 960 217 62 591 259 6,4
Mineral products 4 611 7 116 15,6 27 949 798 31 407 537 4,0
Plant products 897 824 -2,8 4 609 023 3 573 054 -8,1
Timber and paper 254 328 8,9 2 611 914 2 473 418 -1,8
Other 1 417 1 936 11,0 4 699 405 13 509 726 42,2
Total 19 805 30 611 15,6 178 664 849 216 831 540 6,7
Statistics South Africa
Transport and storage industry, Report No. 71-02-01 (2013)
16
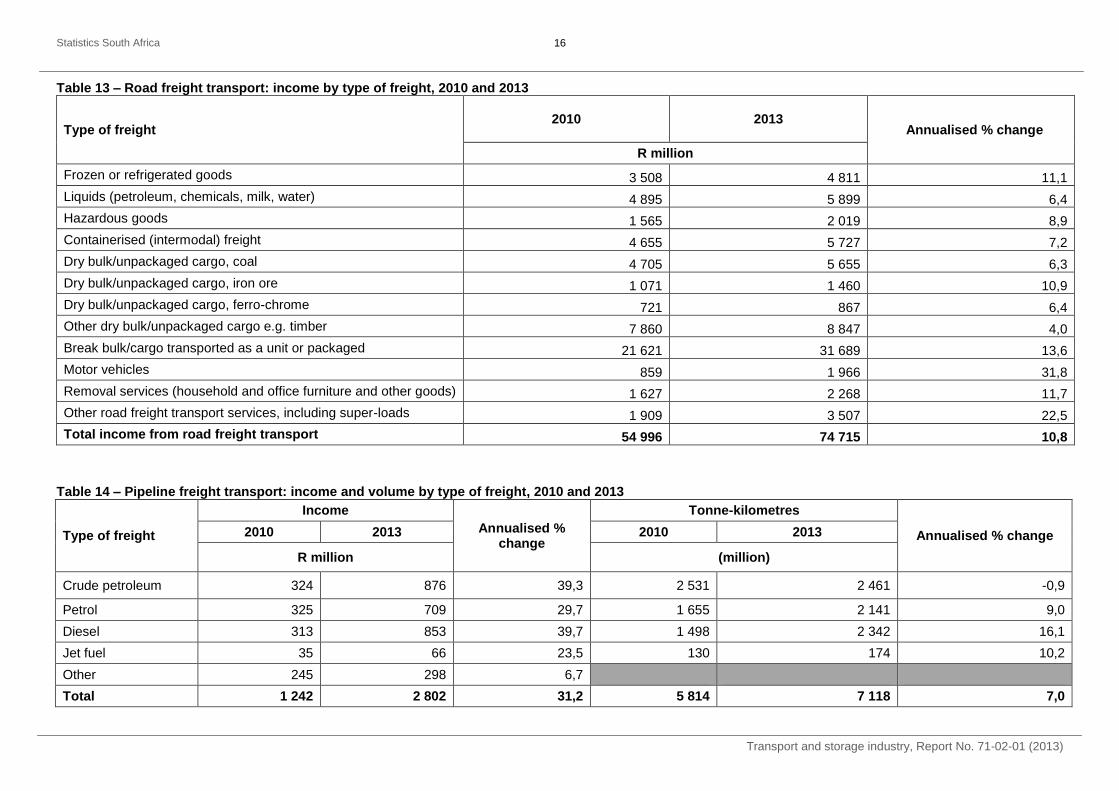
Table 13 – Road freight transport: income by type of freight, 2010 and 2013
Type of freight 2010 2013
Annualised % change
R million
Frozen or refrigerated goods 3 508 4 811 11,1
Liquids (petroleum, chemicals, milk, water) 4 895 5 899 6,4
Hazardous goods 1 565 2 019 8,9
Containerised (intermodal) freight 4 655 5 727 7,2
Dry bulk/unpackaged cargo, coal 4 705 5 655 6,3
Dry bulk/unpackaged cargo, iron ore 1 071 1 460 10,9
Dry bulk/unpackaged cargo, ferro-chrome 721 867 6,4
Other dry bulk/unpackaged cargo e.g. timber 7 860 8 847 4,0
Break bulk/cargo transported as a unit or packaged 21 621 31 689 13,6
Motor vehicles 859 1 966 31,8
Removal services (household and office furniture and other goods) 1 627 2 268 11,7
Other road freight transport services, including super-loads 1 909 3 507 22,5
Total income from road freight transport 54 996 74 715 10,8
Table 14 – Pipeline freight transport: income and volume by type of freight, 2010 and 2013
Type of freight
Income
Annualised % change
Tonne-kilometres
Annualised % change 2010 2013 2010 2013
R million (million)
Crude petroleum 324 876 39,3 2 531 2 461 -0,9
Petrol 325 709 29,7 1 655 2 141 9,0
Diesel 313 853 39,7 1 498 2 342 16,1
Jet fuel 35 66 23,5 130 174 10,2
Other 245 298 6,7
Total 1 242 2 802 31,2 5 814 7 118 7,0
17
Transport and storage industry, Report No. 71-02-01 (2013)
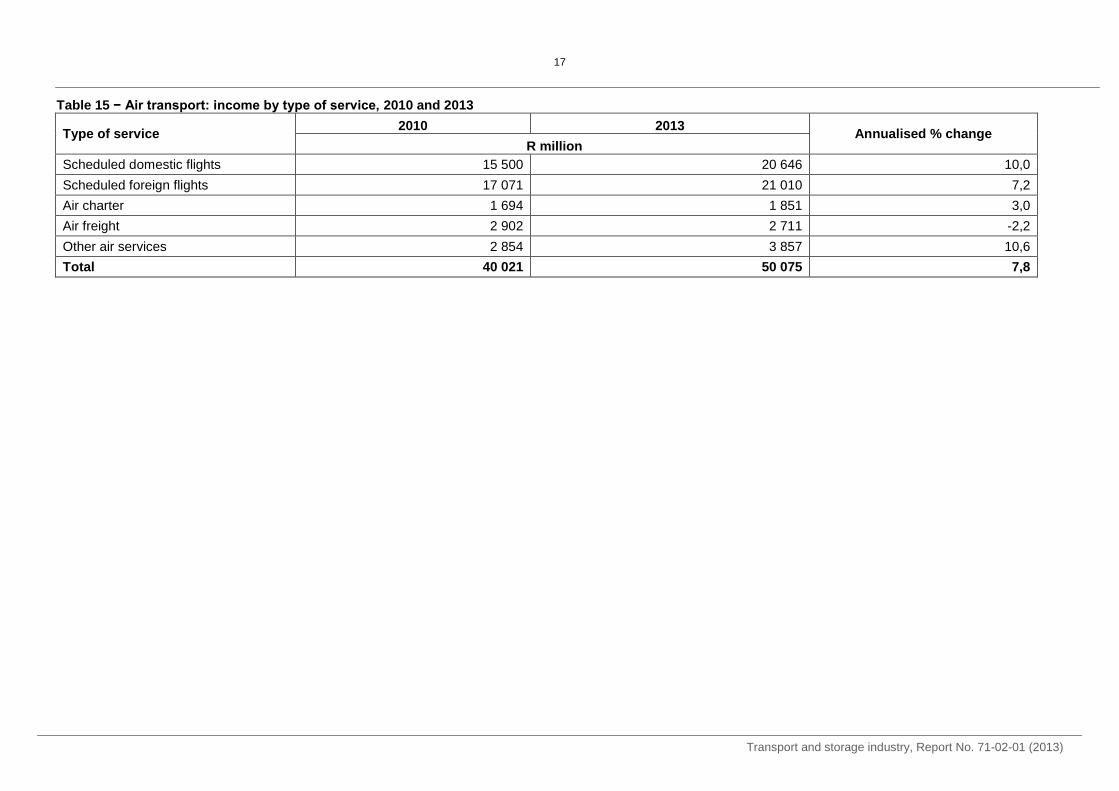
Table 15 − Air transport: income by type of service, 2010 and 2013
Type of service 2010 2013
Annualised % change R million
Scheduled domestic flights 15 500 20 646 10,0
Scheduled foreign flights 17 071 21 010 7,2
Air charter 1 694 1 851 3,0
Air freight 2 902 2 711 -2,2
Other air services 2 854 3 857 10,6
Total 40 021 50 075 7,8
18
Transport and storage industry, Report No. 71-02-01 (2013)
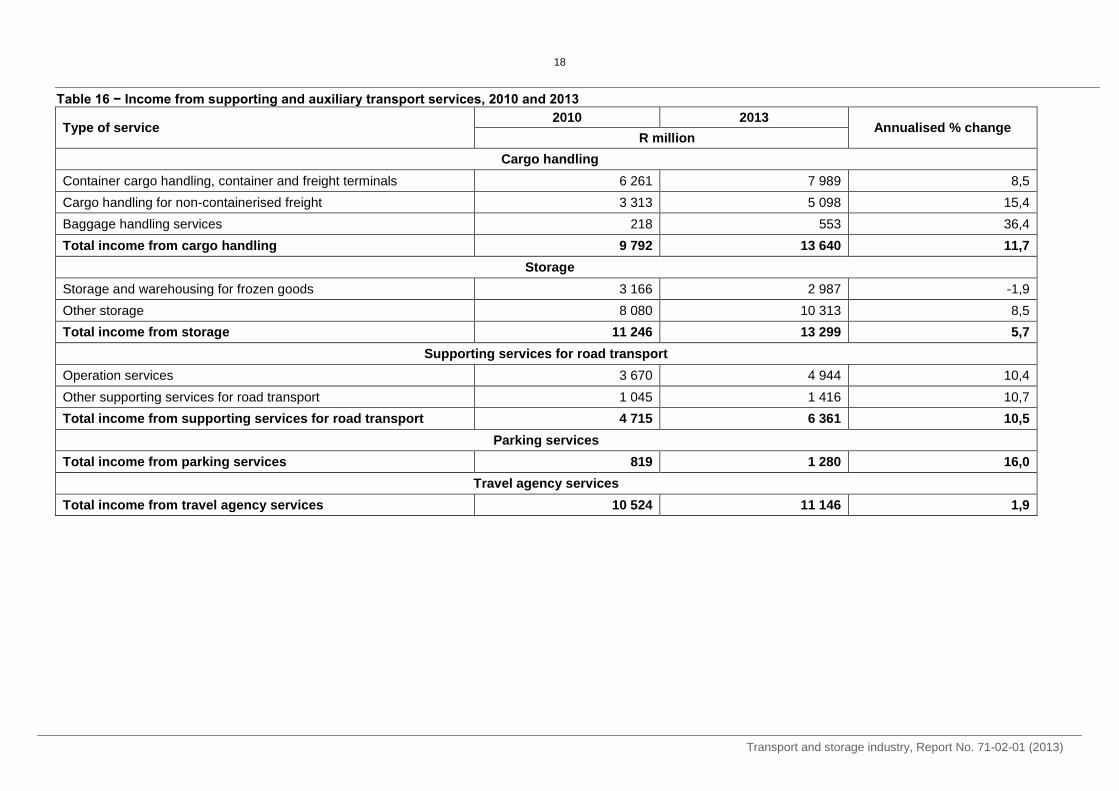
Table 16 − Income from supporting and auxiliary transport services, 2010 and 2013
Type of service 2010 2013
Annualised % change R million
Cargo handling
Container cargo handling, container and freight terminals 6 261 7 989 8,5
Cargo handling for non-containerised freight 3 313 5 098 15,4
Baggage handling services 218 553 36,4
Total income from cargo handling 9 792 13 640 11,7
Storage
Storage and warehousing for frozen goods 3 166 2 987 -1,9
Other storage 8 080 10 313 8,5
Total income from storage 11 246 13 299 5,7
Supporting services for road transport
Operation services 3 670 4 944 10,4
Other supporting services for road transport 1 045 1 416 10,7
Total income from supporting services for road transport 4 715 6 361 10,5
Parking services
Total income from parking services 819 1 280 16,0
Travel agency services
Total income from travel agency services 10 524 11 146 1,9
19
Transport and storage industry, Report No. 71-02-01 (2013)
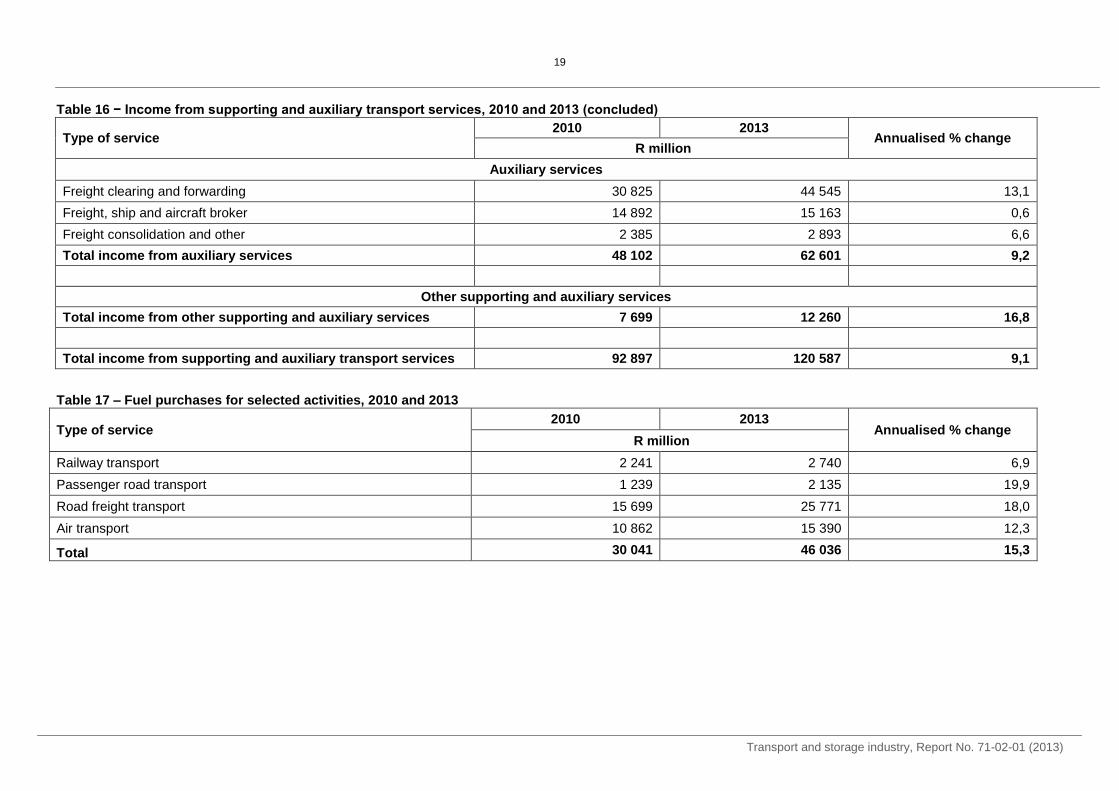
Table 16 − Income from supporting and auxiliary transport services, 2010 and 2013 (concluded)
Type of service 2010 2013
Annualised % change R million
Auxiliary services
Freight clearing and forwarding 30 825 44 545 13,1
Freight, ship and aircraft broker 14 892 15 163 0,6
Freight consolidation and other 2 385 2 893 6,6
Total income from auxiliary services 48 102 62 601 9,2
Other supporting and auxiliary services
Total income from other supporting and auxiliary services 7 699 12 260 16,8
Total income from supporting and auxiliary transport services 92 897 120 587 9,1
Table 17 – Fuel purchases for selected activities, 2010 and 2013
Type of service 2010 2013
Annualised % change R million
Railway transport 2 241 2 740 6,9
Passenger road transport 1 239 2 135 19,9
Road freight transport 15 699 25 771 18,0
Air transport 10 862 15 390 12,3
Total 30 041 46 036 15,3
20
Transport and storage industry, Report No. 71-02-01 (2013)
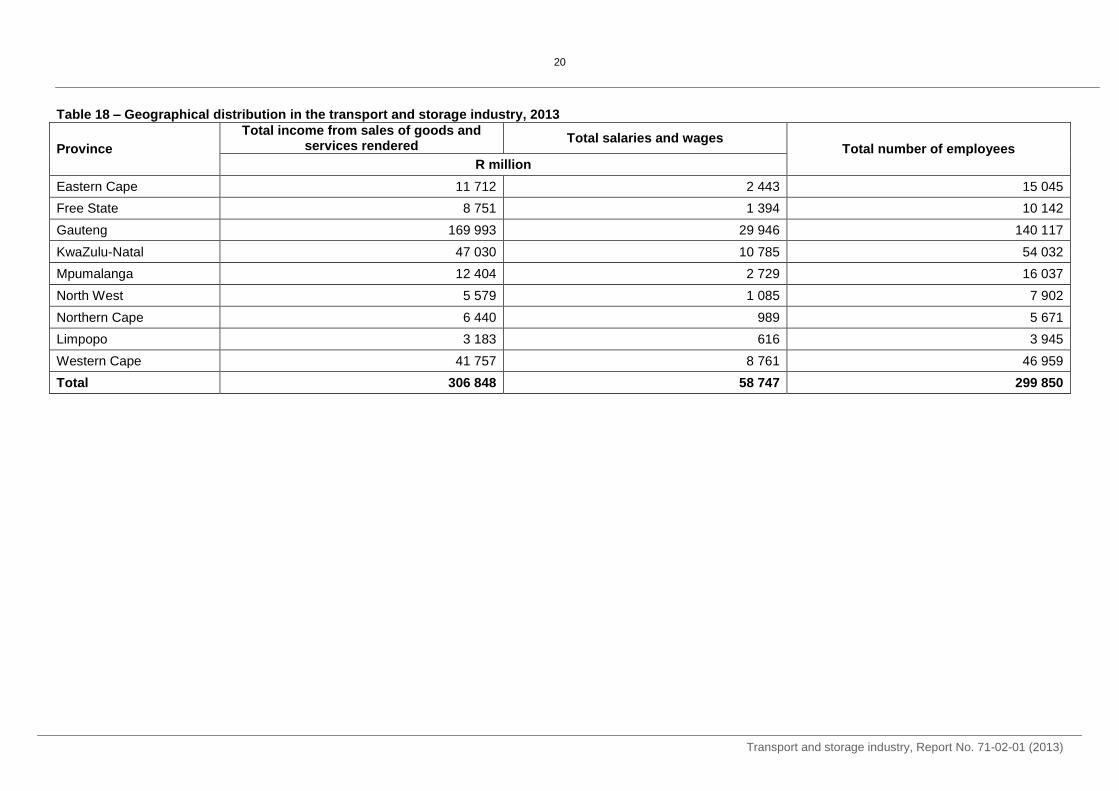
Table 18 – Geographical distribution in the transport and storage industry, 2013
Province
Total income from sales of goods and services rendered
Total salaries and wages Total number of employees
R million
Eastern Cape 11 712 2 443 15 045
Free State 8 751 1 394 10 142
Gauteng 169 993 29 946 140 117
KwaZulu-Natal 47 030 10 785 54 032
Mpumalanga 12 404 2 729 16 037
North West 5 579 1 085 7 902
Northern Cape 6 440 989 5 671
Limpopo 3 183 616 3 945
Western Cape 41 757 8 761 46 959
Total 306 848 58 747 299 850

21
Transport and storage industry, Report No. 71-02-01 (2013)
Table 19 – Information and communication technology usage in the transport and storage industry at the end of June 2013
Type of service
Use computer
Use internet Use internet banking
Have web page
Receive orders over
internet
Place orders over internet
IT outsourced
%
Railway transport 100,0 100,0 100,0 63,5 36,4 27,3 27,3
Other passenger land transport 98,4 98,4 86,4 39,0 30,5 23,7 47,3
Freight transport by road 97,1 97,1 85,6 21,5 28,8 22,8 46,7
Transport via pipelines 100,0 100,0 100,0 100,0 0,0 50,0 50,0
Water transport 100,0 100,0 92,3 27,0 30,8 23,1 73,1
Air transport 96,9 96,9 86,6 50,5 34,0 33,0 53,6
Cargo handling 96,9 96,9 84,4 49,9 37,5 31,3 46,8
Storage and warehousing 99,2 99,2 87,9 43,5 26,6 21,8 51,6
Other supporting transport activities 100,0 100,0 90,3 39,7 19,3 26,9 49,4
Travel agencies and related activities 98,5 98,5 92,9 67,7 59,4 59,1 62,8
Activities of other transport agencies 97,2 97,2 88,4 50,2 31,5 31,8 60,5
Total 97,5 97,5 87,4 36,5 32,9 29,5 52,0
Table 20 – Information and communication technology usage in the transport and storage industry by size group at the end of June 2013
Enterprise size
Use computer Use internet Use internet banking
Have web page Receive orders over internet
Place orders over internet
IT outsourced
%
Large enterprises 97,4 97,4 91,7 82,1 54,5 53,5 50,4
Medium enterprises 99,3 99,3 92,0 49,5 36,8 31,4 63,2
Small enterprises 99,5 99,5 90,1 39,2 35,8 32,8 58,7
Micro enterprises 97,0 97,0 86,4 21,9 30,0 26,3 46,2
Total 97,5 97,5 87,4 36,5 32,9 29,5 52,0

22
Transport and storage industry, Report No. 71-02-01 (2013)
Explanatory notes Background The results presented in this publication have been derived from the 2013 transport and storage large sample survey. This is a periodic
survey which measures economic activity in the transport and storage industry of the South African economy. This survey is based on a census of private and public enterprises operating in the transport and storage industry. The census was conducted from Stats SA’s business register, based on the units registered for value added tax (VAT). All figures exclude VAT.
Reference period The information was collected from enterprises for their financial year which ended on any date between 01 July 2012 and 30 June 2013. Purpose of the survey Results of the survey are used within Stats SA for compiling the gross domestic product (GDP) and its components. These statistics are also
used by government policy advisers in monitoring the performance and contribution of individual industries to the South African economy and the effectiveness of industry policies, and by private sector users in analyses of comparative business and industry performance.
Classification by industry
The 1993 edition of the Standard Industrial Classification of all Economic Activities (SIC), fifth edition, Report No. 09-09-02, was used to classify the statistical units in the survey. The SIC is based on the 1990 International Standard Industrial Classification of all Economic Activities (ISIC) with suitable adaptations for local conditions. Statistics in this publication are presented at 4-digit SIC level (group). Each enterprise is classified to an industry which reflects its predominant activity.
Statistical unit The statistical unit for the collection of the information is an enterprise. An enterprise is a legal unit (or a combination of legal units) that includes and directly controls all functions necessary to carry out its activities.
Size groups The enterprises are divided into four size groups according to the value of turnover recorded for them on the Stats SA business register.
Large enterprises are enterprises with an annual turnover of R78 million and more. Table 21 presents the size groups defined using the Department of Trade and Industry (DTI) cut-off points multiplied by three.
Table 21 – Size groups for the transport and storage industry
Size group Turnover
Large > R78 000 000
Medium R39 000 000 < VAT turnover ≤ R78 000 000
Small R9 000 000 < VAT turnover ≤ R39 000 000
Micro ≤ R9 000 000
23
Transport and storage industry, Report No. 71-02-01 (2013)
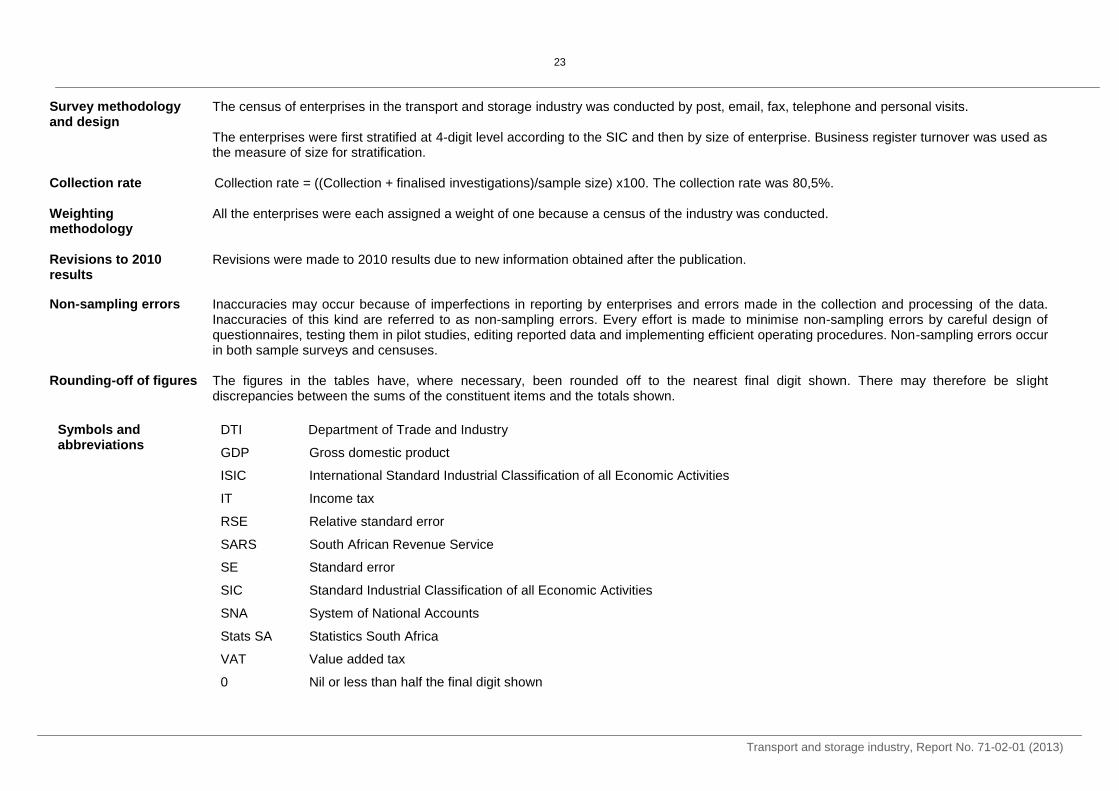
Survey methodology and design
The census of enterprises in the transport and storage industry was conducted by post, email, fax, telephone and personal visits. The enterprises were first stratified at 4-digit level according to the SIC and then by size of enterprise. Business register turnover was used as the measure of size for stratification.
Collection rate Collection rate = ((Collection + finalised investigations)/sample size) x100. The collection rate was 80,5%.
Weighting methodology
All the enterprises were each assigned a weight of one because a census of the industry was conducted.
Revisions to 2010 results
Revisions were made to 2010 results due to new information obtained after the publication.
Non-sampling errors Inaccuracies may occur because of imperfections in reporting by enterprises and errors made in the collection and processing of the data. Inaccuracies of this kind are referred to as non-sampling errors. Every effort is made to minimise non-sampling errors by careful design of questionnaires, testing them in pilot studies, editing reported data and implementing efficient operating procedures. Non-sampling errors occur in both sample surveys and censuses.
Rounding-off of figures
The figures in the tables have, where necessary, been rounded off to the nearest final digit shown. There may therefore be slight discrepancies between the sums of the constituent items and the totals shown.
Symbols and abbreviations
DTI Department of Trade and Industry
GDP Gross domestic product
ISIC International Standard Industrial Classification of all Economic Activities
IT Income tax
RSE Relative standard error
SARS South African Revenue Service
SE Standard error
SIC Standard Industrial Classification of all Economic Activities
SNA System of National Accounts
Stats SA Statistics South Africa
VAT Value added tax
0 Nil or less than half the final digit shown

24
Transport and storage industry, Report No. 71-02-01 (2013)
Glossary
Base metals Base metals includes: Iron, steel, copper and tin.
Casual employees Casual employees are employees who fall neither within the ‘permanent employees’ category nor the ‘temporary employees’ category. Such employees are typically working daily or hourly.
Employees Employees are those people employed by the business or organisation who received payment (in salaries, wages, commission, piece rates or payments in kind) for the last pay period ended on or before 30 June 2013.
Industry An industry consists of a group of enterprises engaged in the same or similar kinds of economic activity. Industries are defined in the System of National Accounts (SNA) in the same way as in the Standard Industrial Classification of all Economic Activities, fifth edition, Report No. 09-90-02 of January 1993 (SIC).
Labour brokers Agents who recruit and administer workers on behalf of the enterprise. They do not provide any other service. Mineral ore Mineral ore includes:
Magnesium; Chrome; and Ferro-chrome.
Mineral products Mineral products includes:
Cement and sand.
Other expenditure Other expenditure includes:
bank charges;
bursaries;
containers and packaging materials;
donations, sponsorships and social investment;
entertainment;
losses on foreign exchange;
mineral rights leases;
paper, printing and stationery;
postal and courier services;
property tax;
research and development;
royalties;
security services (including IT security services);
severance, termination and redundancy payments;
skills development levy;
staff training;
subscriptions; and
other expenditure.
25
Transport and storage industry, Report No. 71-02-01 (2013)
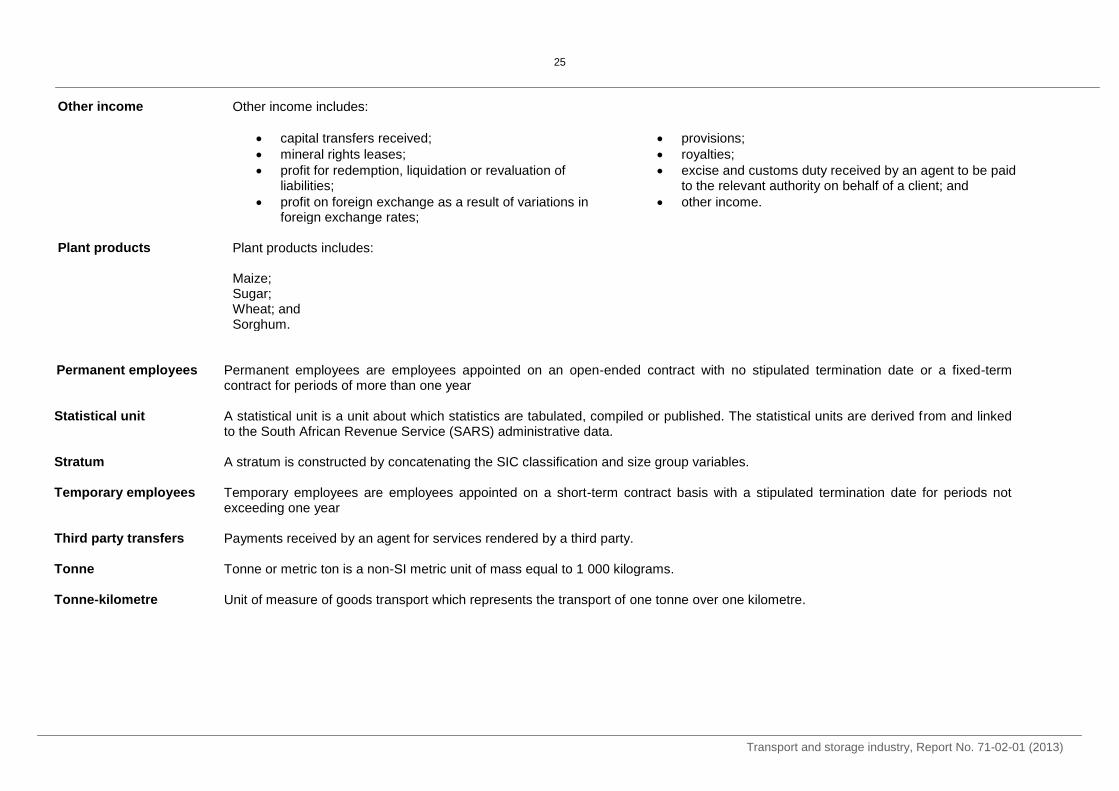
Other income Other income includes:
capital transfers received;
mineral rights leases;
profit for redemption, liquidation or revaluation of liabilities;
profit on foreign exchange as a result of variations in foreign exchange rates;
provisions;
royalties;
excise and customs duty received by an agent to be paid to the relevant authority on behalf of a client; and
other income.
Plant products Plant products includes:
Maize; Sugar; Wheat; and Sorghum.
Permanent employees Permanent employees are employees appointed on an open-ended contract with no stipulated termination date or a fixed-term contract for periods of more than one year
Statistical unit A statistical unit is a unit about which statistics are tabulated, compiled or published. The statistical units are derived from and linked
to the South African Revenue Service (SARS) administrative data. Stratum A stratum is constructed by concatenating the SIC classification and size group variables. Temporary employees Temporary employees are employees appointed on a short-term contract basis with a stipulated termination date for periods not
exceeding one year Third party transfers Payments received by an agent for services rendered by a third party. Tonne Tonne or metric ton is a non-SI metric unit of mass equal to 1 000 kilograms. Tonne-kilometre Unit of measure of goods transport which represents the transport of one tonne over one kilometre.
26
Transport and storage industry, Report No. 71-02-01 (2013)
General information
Stats SA publishes approximately 300 different statistical releases each year. It is not economically viable to produce them in more than one of South Africa's eleven official languages. Since the releases are used extensively, not only locally but also by international economic and social-scientific communities, Stats SA releases are published in English only.
Stats SA has copyright on this publication. Users may apply the information as they wish, provided that they acknowledge Stats SA as the source of the basic data wherever they process, apply, utilise, publish or distribute the data; and also that they specify that the relevant application and analysis (where applicable) result from their own processing of the data.
Stats SA products
A complete set of Stats SA publications is available at the Stats SA Library and the following libraries: National Library of South Africa, Pretoria Division National Library of South Africa, Cape Town Division Natal Society Library, Pietermaritzburg Library of Parliament, Cape Town Bloemfontein Public Library Johannesburg Public Library Eastern Cape Library Services, King William’s Town Central Regional Library, Polokwane Central Reference Library, Mbombela Central Reference Collection, Kimberley Central Reference Library, Mmabatho Stats SA also provides a subscription service.
Electronic services
A large range of data are available via on-line services, diskette and computer printouts. You can visit us on the Internet at: www.statssa.gov.za Enquiries
Telephone number: (012) 310 8600/ 8390/ 8351/ 4892/ 8496/ 8095 (user information services) (012) 310 2660/ 8191 (technical enquiries) (012) 310 8161 (orders) (012) 310 4883/4885/8018 (library) Fax number: (012) 310 2121 (technical enquiries) email address: [email protected]/ [email protected] (technical enquiries) [email protected] (user information services) [email protected] (orders) Postal address: Private Bag X44, Pretoria, 0001
Produced by Stats SA