TRANSPORT and ROAD RESEARCH LABORATORY …semi-elliptical leaf springs semi-elliptical leaf springs...
32
TRANSPORT and ROAD RESEARCH LABORATORY Department of the Environment Department of Transport SUPPLEMENTARY REPORT 560 ROAD SURFACE IRREGULARITY AND VEHICLE RIDE PART 3 - RIDING COMFORT IN COACHES AND HEAVY GOODS VEHICLES by D R C Cooper M Phil and J C Young MIOA Any views expressed in this Report are not necessarily those of the Department of the Environment or of the Department of Transport Construction and Maintenance Division Highways Department Transport and Road Research Laboratory Crowthorne, Berkshire 1980 ISSN 0305- 1315
Transcript of TRANSPORT and ROAD RESEARCH LABORATORY …semi-elliptical leaf springs semi-elliptical leaf springs...
TRANSPORT and ROAD RESEARCH LABORATORY
Department of the Environment Department of Transport
SUPPLEMENTARY REPORT 560
ROAD SURFACE IRREGULARITY AND VEHICLE RIDE PART 3 - RIDING COMFORT IN COACHES AND HEAVY GOODS VEHICLES
by
D R C Cooper M Phil and J C Young MIOA
Any views expressed in this Report are not necessarily those of the Department of the Environment or of the Department of Transport
Construction and Maintenance Division Highways Department
Transport and Road Research Laboratory Crowthorne, Berkshire
1980 ISSN 0305- 1315
Ownership of the Transport Research Laboratory was transferred from the Department of Transport to a subsidiary of the Transport Research Foundation on 1 st April 1996.
This report has been reproduced by permission of the Controller of HMSO. Extracts from the text may be reproduced, except for commercial purposes, provided the source is acknowledged.
Abstract
1.
2.
.
4.
.
CONTENTS
Introduction
Design of experiment
2.1 Test sites
2.2 Test sections
2.3 Measurements in coaches
2.3.1 Details of coaches
2.4 Measurements in lorries
2.4.1 Details of lorries
Experimental equipment
Procedure
4.1 Coach experiment
4.1.1 Objective measurements of ride
4.1.2 Subjective assessment of ride
4.1.3 Classifications of ride assessments
4.2 Lorry experiment
4.3 Analysis procedure
Results and discussion
5.1 Numbers of measurements
5.2 Coach results
5.3 Discussion of coach results
5.3.1 Response of coach occupants to ride
5.3.2 Travel characteristics of coach passengers
5.3.2.1 The difference between the public and TRRL assessment of ride
5.3.2.2 The difference between ride assessments in cars and coaches
5.3.3 Coach seat location and ride
5.3.4 Coach vibration levels and ISO standards
Page
1
1
2
2
2
2
2
2
2
6
6
6
6
6
6
7
7
8
8
8
10
10
10
10
11
11
11
.
7.
8.
9.
10.
5.3.5 The effect of load on coach vibration
5.3.6 The effect of speed on coach vibration
5.4 Lorry results
5.5 Discussion of lorry results
5.5.1 Response to ride o f lorry occupants
5.5.2 Lorry driver and passenger seats
5.5.3 Lorry vibration levels and ISO standards
5.5.4 The effect of load and speed on lorry vibration
5.6 Comparison of car, coach, and lorry vibration
Summary of results
Conclusions
Future work
Acknowledgements
References
Page
12
12
12
12
12
14
14
14
15
15
16
17
17
18
(C) CROWN COPYRIGHT 1980 Extracts from the text may be reproduced, except for
commercial purposes, provided the source is acknowledged
ROAD SURFACE IRREGULARITY AND VEHICLE RIDE PART 3 - RIDING COMFORT IN COACHES AND HEAVY GOODS VEHICLES
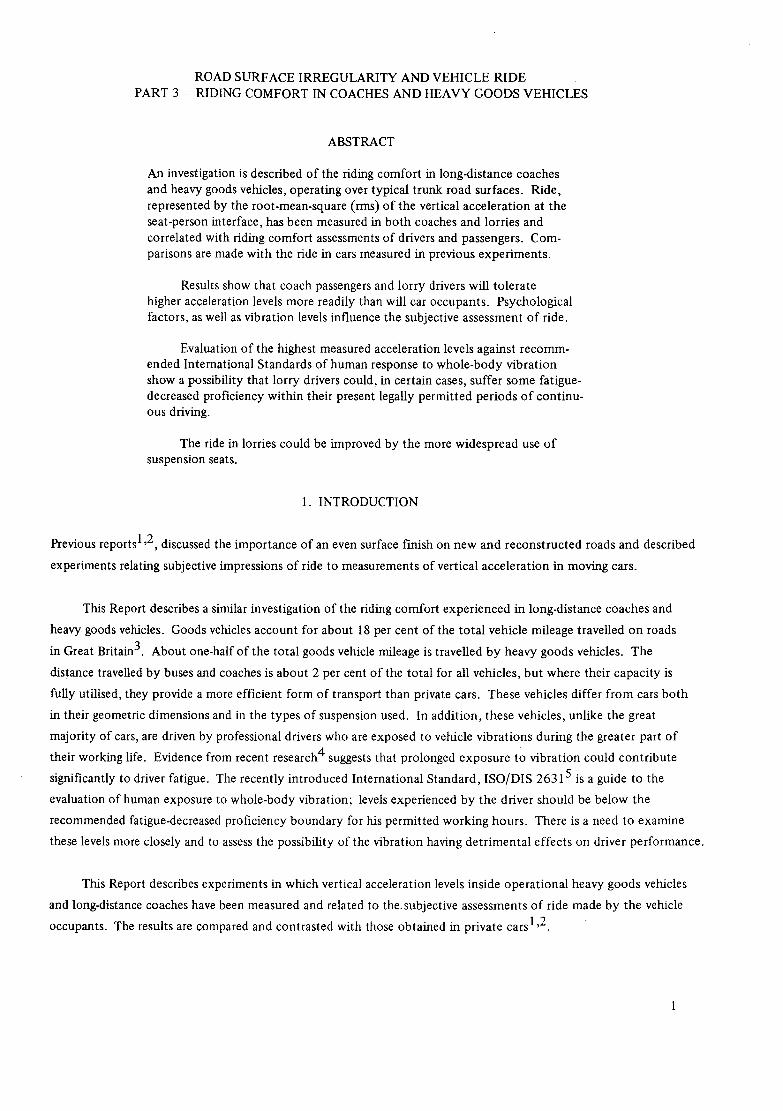
ABSTRACT
An investigation is described of the riding comfort in long-distance coaches and heavy goods vehicles, operating over typical trunk road surfaces. Ride, represented by the root-mean-square (rms) of the vertical acceleration at the seat-person interface, has been measured in both coaches and lorries and correlated with riding comfort assessments of drivers and passengers. Com- parisons are made with the ride in cars measured in previous experiments.
Results show that coach passengers and lorry drivers will tolerate higher acceleration levels more readily than will car occupants. Psychological factors, as well as vibration levels influence the subjective assessment of ride.
Evaluation of the highest measured acceleration levels against recomm- ended International Standards of human response to whole-body vibration show a possibility that lorry drivers could, in certain cases, suffer some fatigue- decreased proficiency within their present legally permitted periods of continu- ous driving.
The ride in lorries could be improved by the more widespread use of suspension seats.
1. INTRODUCTION
Previous reports 1,2, discussed the importance of an even surface finish on new and reconstructed roads and described
experiments relating subjective impressions of ride to measurements of vertical acceleration in moving cars.
This Report describes a similar investigation of the riding comfort experienced in long-distance coaches and
heavy goods vehicles. Goods vehicles account for about 18 per cent of the total vehicle mileage travelled on roads
in Great Britain 3. About one-half of the total goods vehicle mileage is travelled by heavy goods vehicles. The
distance travelled by buses and coaches is about 2 per cent of the total for all vehicles, but where their capacity is
fully utilised, they provide a more efficient form of transport than private cars. These vehicles differ from cars both
in their geometric dimensions and in the types of suspension used. In addition, these vehicles, unlike the great
majority of cars, are driven by professional drivers who are exposed to vehicle vibrations during the greater part of
their working life. Evidence from recent research 4 suggests that prolonged exposure to vibration could contribute
significantly to driver fatigue. The recently introduced International Standard, ISO/DIS 26315 is a guide to the
evaluation of human exposure to whole-body vibration; levels experienced by the driver should be below the
recommended fatigue-decreased proficiency boundary for his permitted working hours. There is a need to examine
these levels more closely and to assess the possibility of the vibration having detrimental effects on driver performance.
This Report describes experiments in which vertical acceleration levels inside operational heavy goods vehicles
and long-distance coaches have been measured and related to the.subjective assessments of ride made by the vehicle
occupants. The results are compared and contrasted with those obtained in private cars 1,2
2. DESIGN OF EXPERIMENT
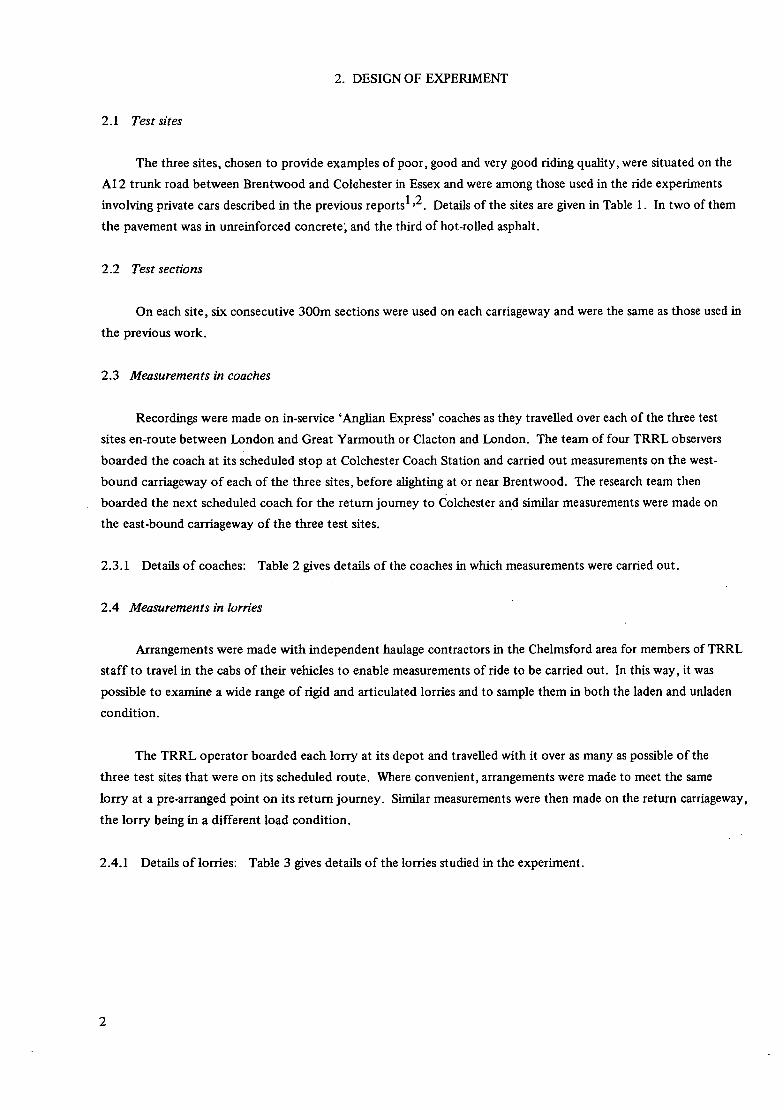
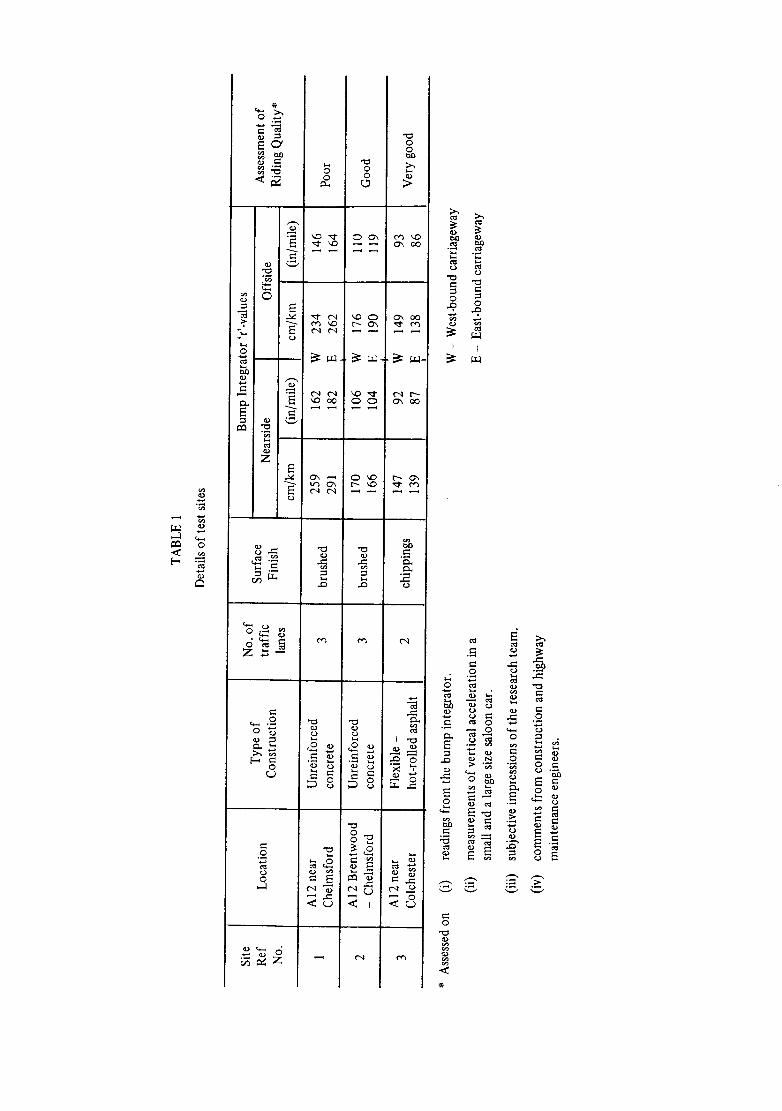
2.1 Test sites
The three sites, chosen to provide examples of poor, good and very good riding quality, were situated on the
A12 trunk road between Brentwood and Colchester in Essex and were among those used in the ride experiments
involving private cars described in the previous reports 1,2. Details of the sites are given in Table 1. In two of them
the pavement was in unreinforced concrete; and the third of hot-rolled asphalt.
2.2 Test sections
On each site, six consecutive 300m sections were used on each carriageway and were the same as those used in
the previous work.
2.3 Measurements in coaches
Recordings were made on in-service 'Anglian Express' coaches as they travelled over each of the three test
sites en-route between London and Great Yarmouth or Clacton and London. The team of four TRRL observers
boarded the coach at its Scheduled stop at Colchester Coach Station and carded out measurements on the west-
bound carriageway of each of the three sites, before alighting at or near Brentwood. The research team then
boarded the next scheduled coach for the return journey to Colchester and similar measurements were made on
the east-bound carriageway of the three test sites.
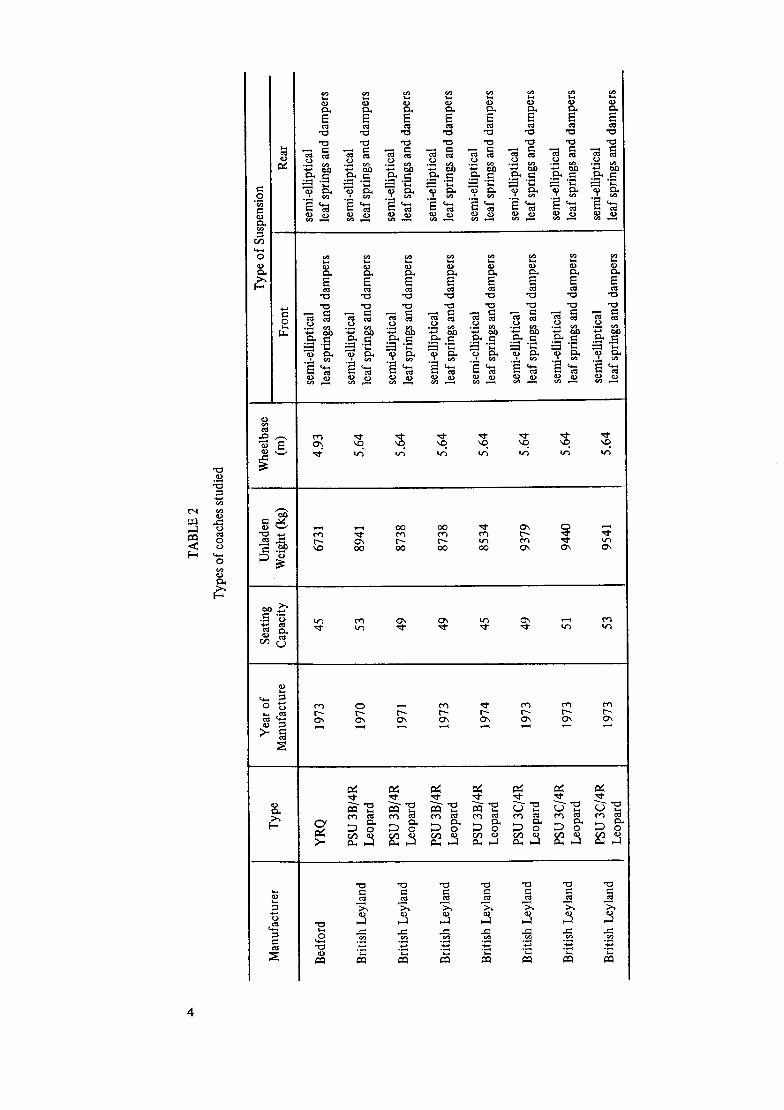
2.3.1 Details o f coaches: Table 2 gives details of the coaches in which measurements were carried out.
2.4 Measurements in lorries
Arrangements were made with independent haulage contractors in the Chelmsford area for members of TRRL
staff to travel in the cabs of their vehicles to enable measurements of ride to be carded out. In this way, it was
possible to examine a wide range of rigid and articulated lorries and to sample them in both the laden and unladen
condition.
The TRRL operator boarded each lorry at its depot and travelled with it over as many as possible of the
three test sites that were on its scheduled route. Where convenient, arrangements were made to meet the same
lorry at a pre-arranged point on its return journey. Similar measurements were then made on the return carriageway,
the lorry being in a different load condition.
2.4.1 Details o f lorries: Table 3 gives details o f the lorries studied in the experiment.
2
o
. ~
cy
o
~ ° ~
o
• E .~
o
0 , .~ 0
,
I I
Z
0
o ~
e"
.£
o 0
.o o :2
= ~ ~ , = .~ o ~
~ ° ~ ~ ~ .~,.-, o o = l:m
o =-- ._ ~ ~ , , , ~ ~ " ~ = ~ . ~
0 .~ o ~ ,"a ~ = .~ ~ ~
,.., o E ~ o °
- - i~ ._
r-,
o
0
[-~ 0
. ~ c~ ~.~ o ~ ~ . ~ c~ . ~ c~ o ~ ~ . ~
0
~ ~ ~ ~ ~ ~ ~ ~ |
. ~ ~ O 0 O 0 O 0 O 0 O~ O ~ O ~
.~ "ra
o * 6
¢tl
O ~ O ~ 0"~ 0 ~. O~ 0 ~. O ~ O~
O' ~ o ~ o ~ ~ o ~ o ~ o ~ o ~ o
~o
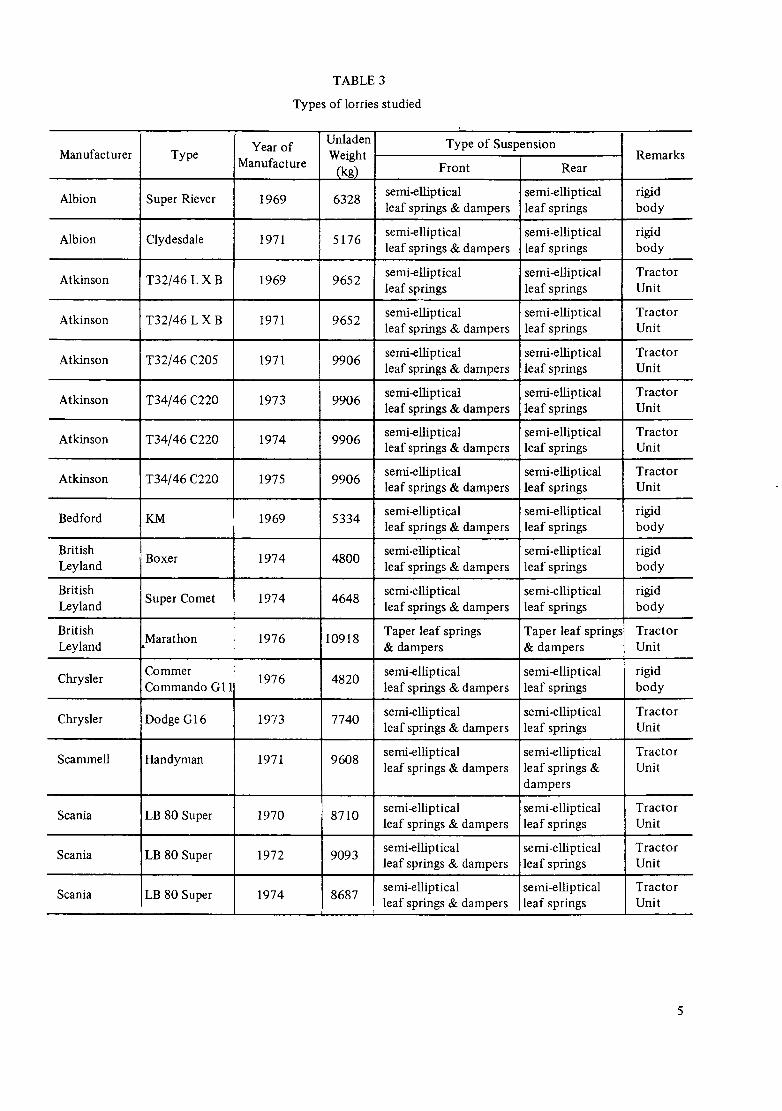
TABLE 3
Types of lorries studied
Year of Manufacturer Type Manufacture
Albion Super Riever 1969
Albion Clydesdale 1971
Atkinson T32/46 L X B 1969
Atkinson T32/46 L X B 1971
Atkinson T32/46 C205 1971
Atkinson T34/46 C220 1973
Atkinson T34/46 C220 1974
Atkinson T34/46 C220 1975
Bedford KM 1969
British Boxer 1974 Leyland
British Leyland Super Comet 1974
British Marathon 1976
Leyland
Commer Chrysler Commando G11i 1976
Chrysler Dodge G16 1973
Scammell Handyman 1971
Scania LB 80 Super 1970
Scania LB 80 Super 1972
Scania LB 80 Super 1974
Unladen Weight
(kg)
6328
5176
9652
9652
9906
9906
Type of Suspension Remarks
Front Rear
semi-elliptical leaf springs & dampers
semi-elliptical leaf springs & dampers
semi-elliptical leaf springs
semi-elliptical rigid i leaf springs body
semi-elliptical rigid i leaf springs body
semi-elliptical leaf springs
Tractor Unit
semi-elliptical semi-elliptical Tractor leaf springs & dampers leaf springs Unit
semi-elliptical semi-elliptical Tractor leaf springs & dampers leaf springs Unit
semi-elliptical semi-elliptical Tractor leaf springs & dampers leaf springs Unit
9906 semi-elliptical leaf springs & dampers
semi-elliptical leaf springs
semi-elliptical leaf springs
8687
semi-elliptical leaf springs & dampers
Tractor Unit
Tractor Unit 9906
5334 semi-elliptical semi-elliptical rigid leaf springs & dampers leaf springs body
4800 semi-elliptical semi-elliptical rigid leaf springs & dampers leaf springs body
4648 semi-elliptical semi-elliptical rigid leaf springs & dampers leaf springs body
10918 Taper leaf springs Taper leaf springs Tractor & dampers & dampers Unit
4820 semi-elliptical semi-elliptical rigid leaf springs & dampers leaf springs body
7740 semi-elliptical semi-elliptical Tractor leaf springs & dampers leaf springs Unit
9608 semi-elliptical semi-elliptical Tractor leaf springs & dampers leaf springs & Unit
dampers
8710 semi-elliptical semi-elliptical Tractor leaf springs & dampers leaf springs Unit
9093 semi-elliptical semi-elliptical Tractor leaf springs & dampers leaf springs Unit
semi-elliptical leaf springs
semi-elliptical leaf springs & dampers
Tractor Unit
3. EXPERIMENTAL EQUIPMENT
Two sets of self-contained portable cassette recording systems, described in the previous report 1 , were used to
record vertical accelerations at the seat-person interface and other information relating to these measurements.
Checks on equipment functions were made and recordings monitored on a replay system mounted within a mobile
laboratory stationed at a convenient base depot. The cassette records were returned to TRRL for subsequent
processing and analysis.
4. PROCEDURE
4.1 Coach experiment
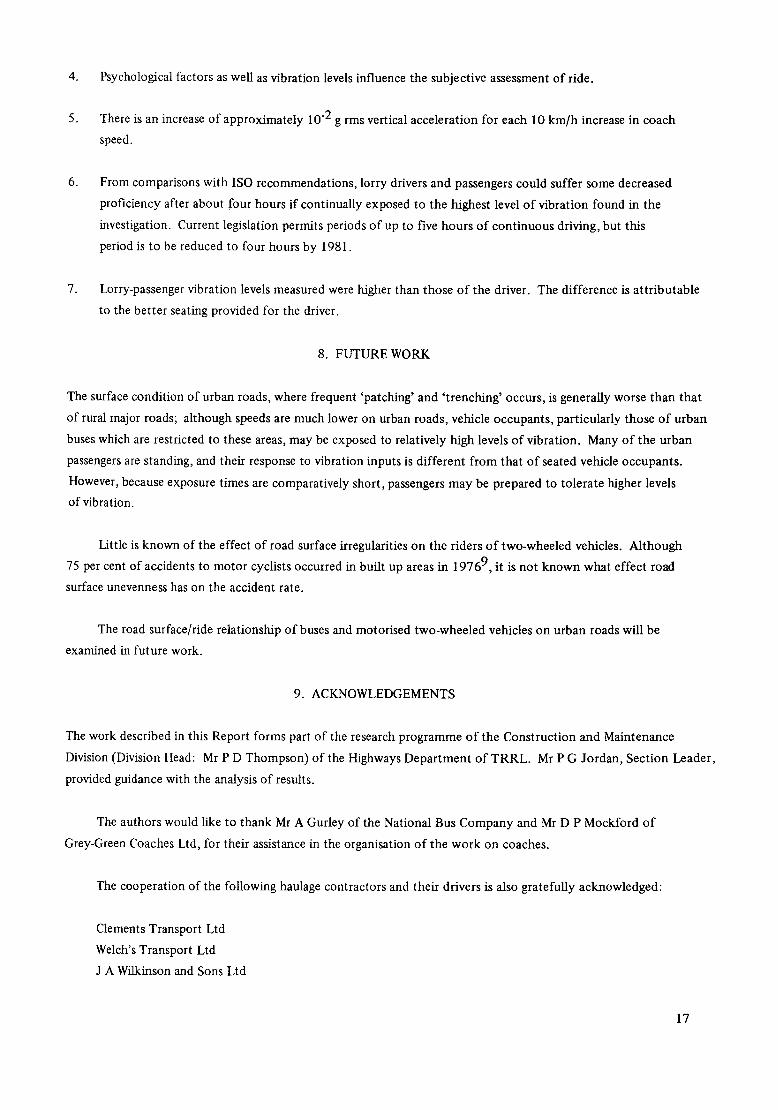
4.1.1 Objective measurements of ride: The two portable recording systems were used on each coach to record
vertical accelerations at four different seating positions, as shown in Figure 1. The first system was used to record
the input to the coach driver and also to the TRRL team member (A), normally seated at the front nearside of the
coach. At the same time, the second system recorded the vertical accelerations experienced by the TRRL members
at the mid-coach (B) and rear seat (C) positions. This arrangement enabled subsequent comparisons to be made of the
ride experienced throughout the coach.
4.1.2 Subjective assessment of ride: Coded information relating to the experiment, such as the type of coach,
identification number of the test site, direction of travel and measurement point, was recorded as the coach
approached the marked test lengths o f road. After passing over the test length, the subjective impressions of
riding comfort o f the driver and T R R L staff seated on accelerometers at the four measurement points in the coach
were recorded onto the tape cassette in a coded form. The TRRL observer (D) who also sat at the mid-point of
the coach,documented each run and also recorded the assessments of the passengers seated nearest to each measure-
ment position.
4.1.3 Classifications of ride assessments: Subjects were asked to classify the ride over a particular test length
into one of the four categories:-
1) Comfortable
2) Acceptable
3) Uncomfortable
4) Very uncomfortable
The subjects were also asked, where appropriate, to classify their reasons for rating a ride 'uncomfortable or
worse ' into one of the following three categories:-
1) Noise
2) Vibration
3) Bumpiness
In addition, the coach driver was asked for his opinion on a fourth category:-
4) Vehicle handling
The subjects were also asked how often they travelled by coach, and by car, and why they chose to travel by coach.
It was thought possible that some people travelling on coaches may never have ridden in a car and they might
assess the ride differently from those passengers whose normal means of transport was a car.
4.2 Lorry experiment
For each of the lorries included in the survey, a member of TRRL staff carried out the ride assessment sitting
in the passenger seat of the lorry cab as it travelled over the test lengths of road.
Vertical accelerations at the seat-driver and seat-passenger interfaces were recorded in each lorry as it passed
over the test sites. Coded information on lorry type, state of loading, etc was recorded as described in Section 4.1.2.
As in the case of the coach study, the driver's and the passenger's classification of the ride and comments on poor
ride assessments were recorded for subsequent analysis.
On a selected number of test runs, noise levels inside the vehicle cab were measured using a Bruel and Kjaer
Type 2203 Sound Level Meter.
The siting of the transport depots was such that it was not possible for the TRRL staff to monitor ride over
more than two test sites on one run with a particular lorry. Because the transport operators scheduled most of their
runs at very short notice, some lorries were missed. Although this reduced the size of the sample, a sufficient
number of lorries were included to give a representative cross-section of their ride levels.
In both the coach and lorry experiments, the drivers were asked to drive normally. They were free to choose
their own speed and traffic lane when travelling over the test sites. Any changes in lane were logged on a separate
data track of the tape recorder.
4.3 Analysis procedure
Completed cassettes were initially processed using a mini-computer to produce punched paper tapes which
were corrected for any obvious errors. Further analysis 1 of the paper tapes was then carried out on the TRRL
ICL 4-70 computer.
For each test section, a listing was obtained, of the vehicle average speed and the calculated root-mean-square
(rms) vertical acceleration within the frequency band of 0.2 Hz to 20 Hz experienced by each test subject. The
coded associated information for each test run was also listed.
5. RESULTS .AND DISCUSSION
5.1 Numbers o f measurements
Of the total o f 324 recordings made in coaches, only twelve were found unsuitable for analysis because of
operator error or equipment malfunction. Ten different coaches were sampled on 27 runs, resulting in 312 valid
recordings with corresponding assessments of ride from four TRRL staff, eight drivers, and over 300 different
fare-paying passengers.
The lorry experiment resulted in 126 valid recordings of vertical acceleration and corresponding assessments
of ride given by 12 drivers and four TRRL staff from a total of 67 runs using 18 different lorries. An equal number
of recordings were obtained for both driver and passenger. Of the total of 134 recordings, eight were unsuitable for
analysis.
5.2 Coach results
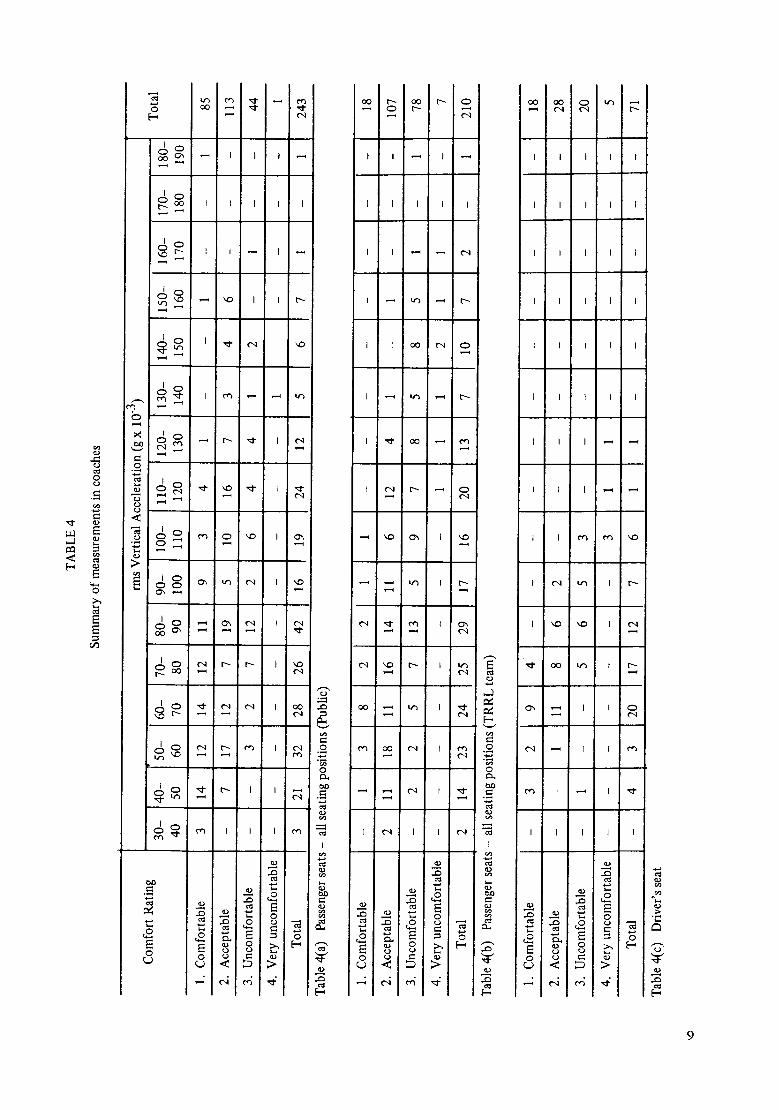
The coach results are summarised in Tables 4(a), 4 (b) and 4 (c). Tables 4(a) and 4(b) show combined results
from the three passenger-seating positions monitored in the coach experiment. Table 4(a) shows results given by
the fare-paying passengers, Table 4(b) gives those results obtained from the TRRL team. The total number of
assessments f rom the public given in Table 4(a) exceeds that of the TRRL team given in Table 4(b) because at
times more than one passenger seated on the long rear bench seat of the coach was asked for an assessment of
comfort . Table 4(c) shows the results from the coach driver's seat. In each of these three tables, values of the
calculated rms vertical acceleration are classified into bands of 10 x 10"3g. Each number entered in the Table
gives the number of times an acceleration level within a band was rated comfortable, acceptable, uncomfortable
or very uncomfortable.
Results given in Table 4(a) are for those members of the public seated nearest to the measurement position
(see Section 4.1.2). It is assumed that the same accelerations were experienced by both the fare-paying passenger
and the member o f TRRL staff. Normally, the passenger was seated next to the TRRL operator on the same
bench seat.
Results for the driver are considered separately in Table 4(c) because the driver's seat differed from the bench
seats fitted in the rest of the coach; also, the periods of exposure to the coach vibration of the driver were longer
than those o f the passengers.
The data given in Tables 4(a), 4(b) and 4(c) show trends similar to those in previous experiments 1,2, in that
increasing levels of acceleration increase the probability of a ride being assessed as uncomfortable, and there is a
large variation in levels of acceleration associated with any one of the four possible ratings of comfort. The
results have therefore again been interpreted in probabilistic terms as 'comfort characteristic' curves.
8
0
0
~ 0
,..-i
,,--i
C) I 0
i i i i | i
~ o'o~ I
o .<
~ o l 2 r,,.,, o ,,c. i o,,
f i l i i i
I
oO
C)I (..4 ~.~ L"-- ' , 0 L ~ ~ ~ ( ' ~
/ A _ _
~ 0
( ~ i 0 ~ . [.... I
c~
E 0
( _ )
¢ )
. . o
. . o
,.£ ~, E = "5 E ~ 8 b [ "
I I I I I
0 0 ( "4
I ! I I I I
I I I I I
I I I I I
I I I I
I
",4D ' , .0
0 , , ~ I 0
I I I I
t-.,
[ . - ,
5.3 Discussion of coach results
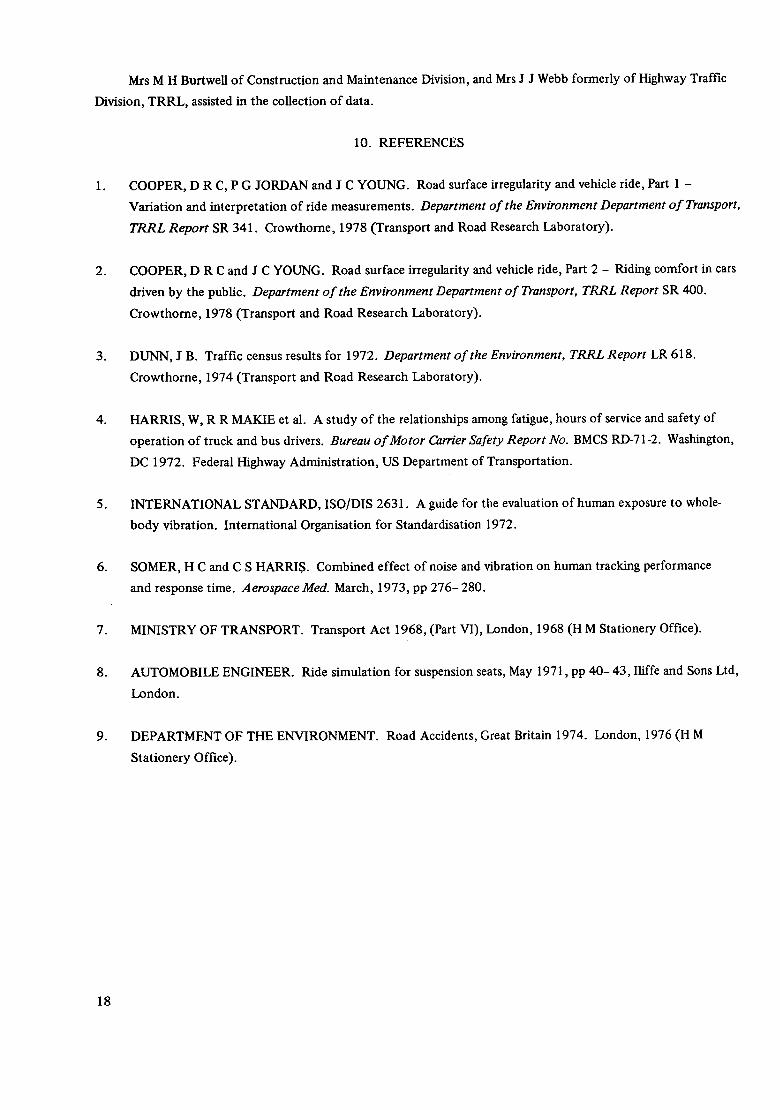
5.3.1 Response of coach occupants to ride: Results given in Table 4 are shown in the form of 'comfort
characteristic' curves in Figures 2 and 3. Figure 2 shows the probability of a member of the public seated in any of
the measurement positions rating the ride as acceptable or better. The 'comfort characteristic' curve obtained in the
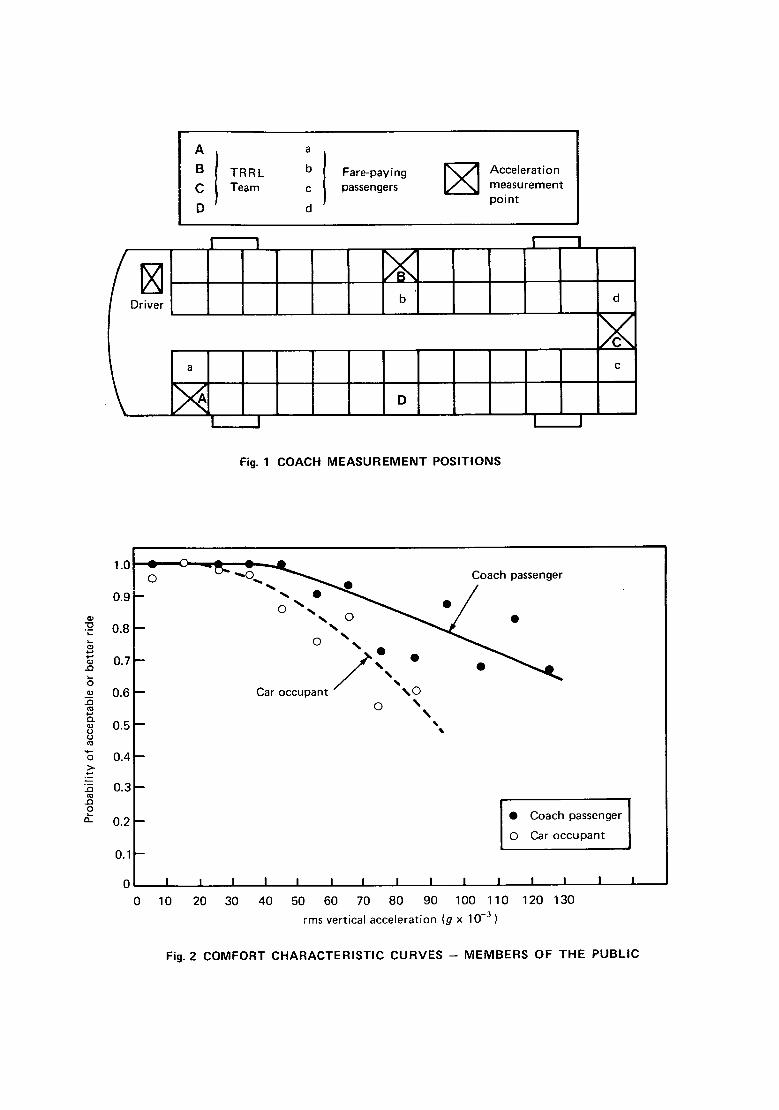
previous work 2 for members of the car-driving public is also shown in Figure 2. Similarly, in Figure 3, the 'comfort
characteristic' curves giving the assessments of ride by the TRRL team in coaches and in private cars 1 are compared.
The corresponding curve for the coach driver is also plotted in Figure 3; this curve, because of the fewer observations
(71), is less reliable than the curves for the public (243 observations) and for the TRRL staff (210 observations).
Figure 2 shows that there is a 94 per cent probability that an acceleration level less than 60 x 10 -3 g rms
would be rated as acceptable by a member of the public travelling in the coach. However, it also shows that there is
only an 83 per cent probabili ty of this rating when the same level of acceleration was experienced by the public in
cars. Figure 3 shows that the corresponding probabilities of the TRRL team giving the same rating are 82 per cent
and 55 per cent respectively.
It is apparent f rom Figures 2 and 3 that factors other than the rms acceleration affect individual judgements
of ride. Although the overall characteristics remain the same, both the TRRL team and the public were less critical
of ride in coaches than in private cars. It is also clear that the TRRL team were generally more critical of ride than
the public. Possible reasons for these differences in 'comfort characteristic' curves are examined in the following
sections.
5.3.2 Travel characteristics o f coach passengers: Of over 300 passengers questioned on the coaches during the
experiment, about 40 per cent travelled by coach at least once per month and nearly 70 per cent used the coach at
least once every three months. Roughly half the sample never travelled by car. Half the total sample travelled by
coach because it cost less than other forms of public transport. Nearly 40 per cent preferred to travel by coach
because it was more convenient and 10 per cent thought it was more comfortable in coaches than in other modes
of public transport. It is possible that this feeling of comfort was helped by the courteous manner of the drivers,
especially when dealing with elderly passengers who made up over half the total carried.
In the light of this information the differences in assessments of ride, depicted in Figures 2 and 3, may now
be examined.
5.3.2.1 The differences between the public and TRRL assessment of ride: The TRRL team were probably more
critical o f the ride generally because they were aware of the purpose of the experiment and had carried out similar
work in private cars and so were more 'expert ' in assessing ride. During the course of the experiments they
travelled over each test length 28 times, and therefore had many more opportunities to judge the ride than the
public. Also, because almost half the sample o f the public never travelled by car, this section of the public sample
had no other standard by which to judge the ride and were much more likely to be satisfied by the ride in the coach.
An analysis o f assessments given by the two groups of coach passengers showed a slight, but significant, bias towards
a more critical judgement o f ride by those who did travel by car. Also some members of the public chose to travel
by coach because it was economic. Consequently, the psychological factors influencing the judgements of the public
and the TRRL team were quite different.
10
5.3.2.2 The difference between ride assessments in cars and coaches: The difference is probably due to the different
environments experienced when travelling by coach and by car. The coach is likely to produce more favourable
travelling conditions, providing more space, a better view and more distractions. These aspects of coach travel may
also serve to enhance feelings of safety in coaches as against cars. The traveller, therefore, may not notice, or may be
prepared to accept, a higher level of rms acceleration in coaches than in cars.
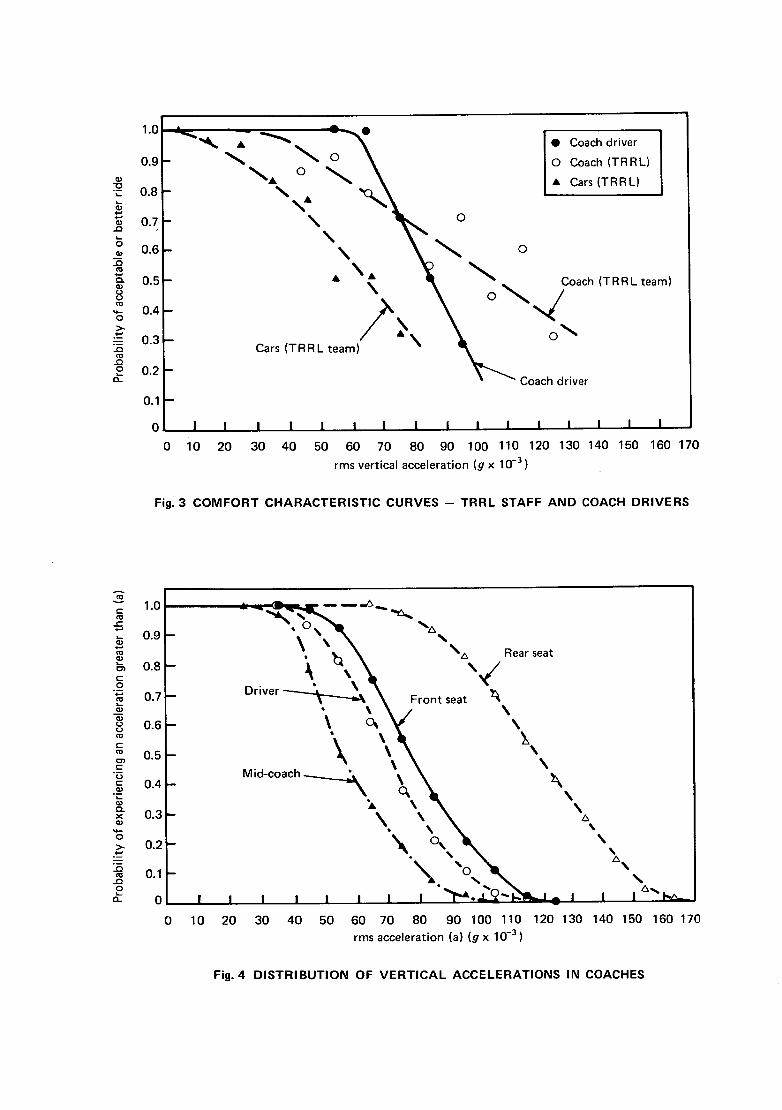
5.3.3 Coach seat location and ride: Figure 1 shows the four seating positions in the coach at which acceleration
levels were measured:- driver seat; mid-coach; rear-seat; front-seat. From the 'comfort characteristic' curve for
the public in coaches, Figure 2, it can be seen that arms vertical acceleration of 70 x lO'3g corresponds approx-
imately to a 90 per cent probability of the ride being assessed as 'acceptable or better ' . The probability of
experiencing an acceleration exceeding this level at each of the four seating positions, is shown in Figure 4, which
indicates: a) the driver has a 50 per cent probability of exceeding 70 x lO'3g and therefore experiencing a standard
of ride which is less than acceptable, b) mid-coach, a 25 per cent probability, c) rear-seat, a 99 per cent probability
and d) front-seat, a 65 per cent probability. The ride experienced by the driver and the front-seat passenger are
similar to each other, the driver experiencing a slightly lower level of acceleration than the passenger, probably
because of the superior design of his bucket-type seat. The rear-seat, as would be expected, is the worst position of
all, because of the pitching motion of the coach and the fact that the seat is located on an overhang, behind the
rear wheels, which amplifies the vertical movement. The mid-coach seating position located at or near the centre
of mass of the vehicle provides the best standard of ride comfort least affected by any pitching motion.
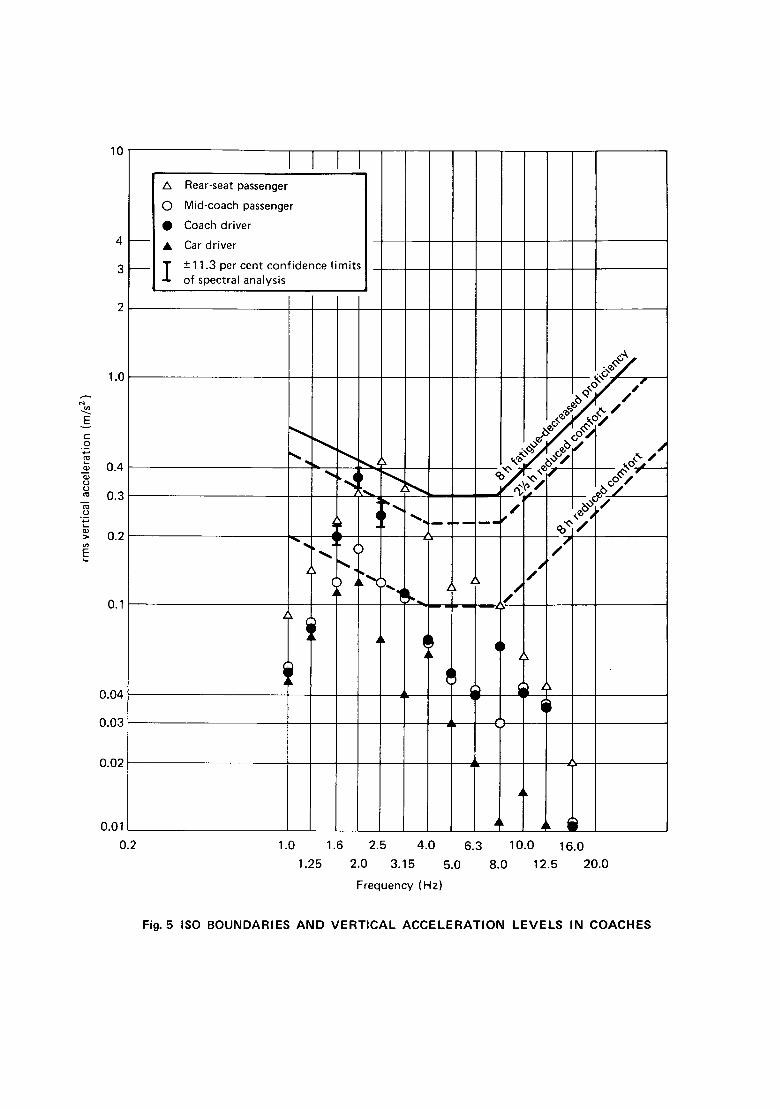
5.3.4 Coach vibration levels and ISO standards: Figure 5 shows the proposed boundaries 5 for the effect o f whole-
body vibration on 'reduced comfort ' and 'fatigue-decreased proficiency'. Such limits are difficult to apply because
they are based upon continuous steady exposure to a single-frequency sinusoidal vibration. A coach driver seldom
experiences any particular level of vibration for a long period, except perhaps on motorways, and so comparison
with the ISO boundaries can only be made with the following assumptions:
(1) the spectral estimate, computed from a 90 second recording, remains constant over the
whole period specified in the ISO limits.
(2) for the narrow-band vibration, analysed with a 0.5 Hz bandwidth, the rms value of
acceleration within the bands is evaluated separately with respect to the appropriate
ISO limit at the centre frequency of that band.
Levels of rms acceleration measured at the site giving the worst ride, have been taken from frequency spectra
and plotted in Figure 5 at the 1/3-octave centre frequencies. When compared with the ISO boundaries these show
that a coach driver could expect to feel uncomfortable after about 2 hours driving, provided the measured level o f
acceleration remained constant throughout this period. In a similar manner, coach passengers, if continually
exposed to the measured level of acceleration, might experience discomfort in the mid-coach position after about
7 hours, and in the rear seat after about 1½ hours. Figure 5 also shows that car drivers would only experience
discomfort after a period of continuous exposure greater than 8 hours.
11
5.3.5 The effect of load on coach vibration: The effect of the degree of loading on ride was examined by plotting,
for each site, measured values of rms vertical acceleration against corresponding load factors for each seating position.
To eliminate the effect of speed, only those test runs where the measured speed was less than 10 per cent different
f rom the mean speed were used. The load factor L is detained as the ratio of the number of seats occupied to the
total seating capacity of each coach. Values of L encountered during the experiment ranged from 0.25 to 0.8.
The results showed little relationship between load and rms acceleration; there was a trend for the rms acceleration
to decrease slightly with load in the rear seating position, but linear and logarithmic least squares regression analysis
showed this trend to be significant only at the five per cent level.
5.3.6 The effect of speed on coach vibration: The variation of rms vertical acceleration with speed was examined
for each of the measured seating positions in the coach, on each of the three test sites. The best correlation was
found in the front seat position on Site 2 (with significance at the 1 per cent level) and the driver and front seat
positions on Site 3 (with significance at the 1 per cent and 5 per cent levels respectively). The regression lines
showed an increase of approximately 10 -2 g rms for each 10 km/h increase in coach speed over the range of speeds
considered.
5.4 Lorry results
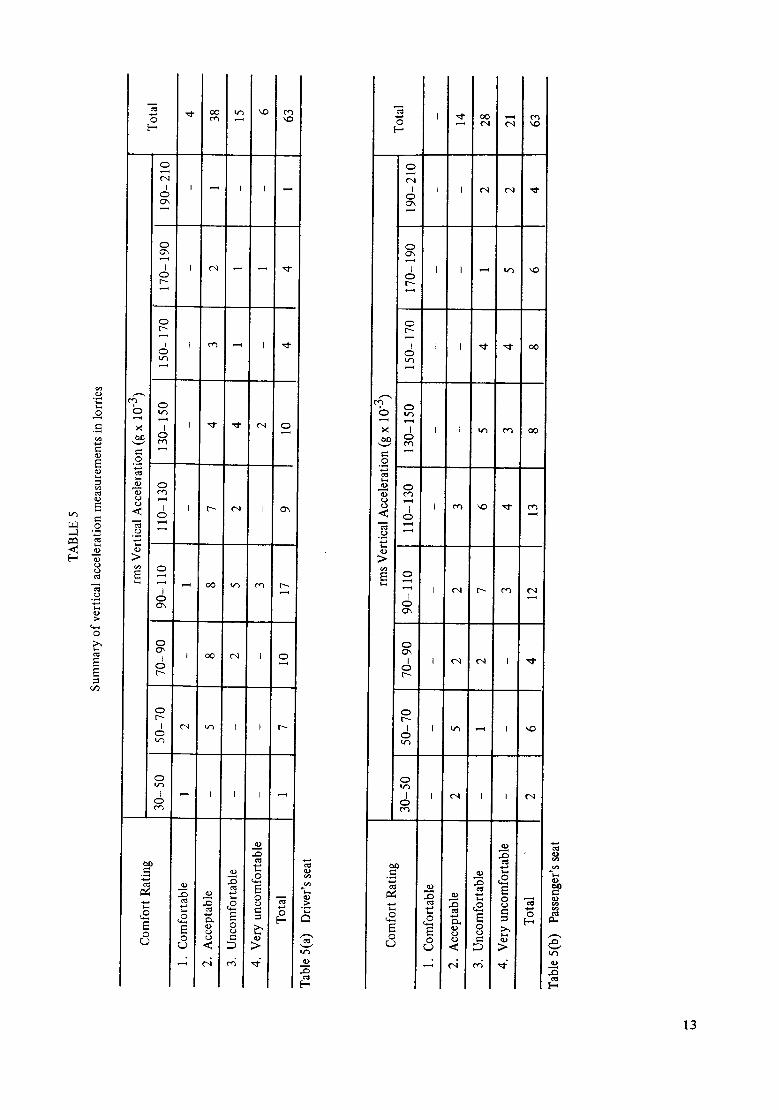
Acceleration measurements are summarised in Tables 5(a) and 5(b) where values of rms vertical acceleration
are classified into band widths of 20 x 10 -3 g. There were a total of 63 recordings for the driver and the passenger
compared with over 200 for coach passengers and over 600 for the public in private cars 2. Estimation errors are
therefore larger for the lorries than for the coaches and cars, influencing any comparisons between the three
different types of vehicles. The lorry results, however, do contain a sufficiently large and representative sample to
permit an examination of the likely trends in the ride characteristics of operational lorries on typical British
trunk roads.
5.5 Discussion o f lorry results
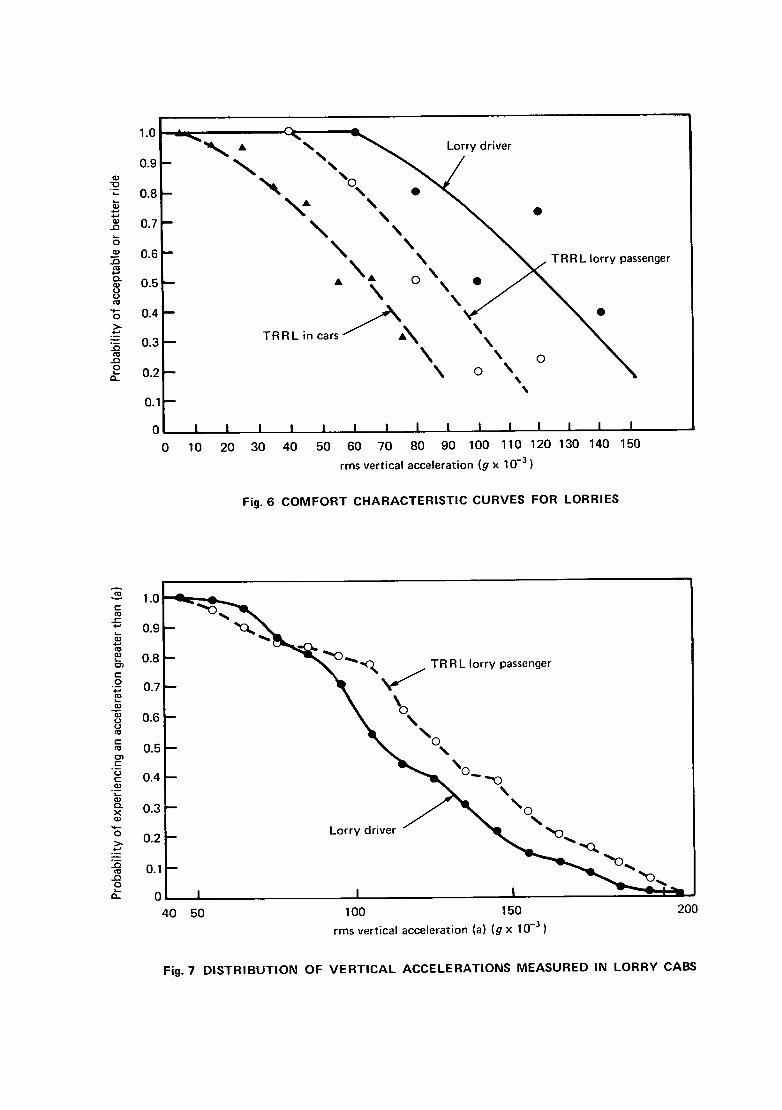
5.5.1 Response to ride of lorry occupants: The 'comfort characteristic' curves plotted in Figure 6 show that the
lorry drivers were much less critical of the ride than the TRRL passenger; Figure 7 shows that drivers were more
likely to experience a lower level of acceleration than the passenger. The 'comfort characteristic' curve of Figure 6
shows that there was a 90 per cent probability of the driver rating the ride favourably if he experienced an
acceleration o f less than 75 x 10 -3 g rms ; the probability of a TRRL passenger rating the same level of acceleration
favourably was only 65 per cent in the lorry and 35 per cent in a car. Thus the TRRL team were prepared to accept
a higher level o f acceleration in the lorry before rating the ride uncomfortable than they were when travelling in
cars. The probable reasons for these differences in assessments are the same as those discussed in Section 5.3.1
for the coach experiment, in that the ride environment is very different in coaches and lorries from that experienced
in cars. I t is also possible that the judgement of ride in the lorry is influenced by noise. It has been shown 6 that
human tolerance to vibration in the presence of a high level of noise can be increased and a higher level of vibration
is more acceptable when combined with noise than without. Noise levels measured inside lorry cabs during test
runs were between 85 dbA and 95 dBA compared with levels o f about 75 dBA measured inside a medium-sized
saloon car. The predominant source of lorry noise was the engine. There was no perceptible difference in noise
levels measured inside the vehicle whilst travelling over the asphalt and concrete surfaces of the test roads.
12
e-.
o
m ~
o
o
>
0
E E
0
I 0
0
I 0
0 t " -
I 0
o
~ I / 0 i "~ '" ~ ~ 0 ,,-.,,
0 I • ~ | l I l I I
o I I t ~ ~ I ~ < o
-i~ | | | | | i _
> '
0
| n i | n i
i
o l I I ~ : ) t"-I I 0
0
I ~ ~ ! I I C"- 0
0 '
0
,..C) a3
= E ~ 0
..~ ~ o
o :>,
.......
[ . .
[ . , .
0
I 0 ,,,-,
0
I
t ' -
0 :
I I I ~ "d" 0
~, ! o 0 I u"~
0
0
0
0 i I r '~ ' . 0 ",d" ¢",
>
] , 0 ,
0 , Oh
C"-
0 (-....
0
0
0
,..C}
ad [ . .
13
5.5.2 Lorry driver and passenger seats: Drivers of 66 per cent of the lorry sample were equipped with some form
of variable suspension seat, which could be adjusted to compensate for the driver's weight. Though this gave the
driver a ride that was different from that o f the passenger, spectra plotted in Figure 11 show the frequency content
to be basically the same for both seats.
The cumulative distribution of measured rms accelerations, plotted in Figure 7, shows that the input to the
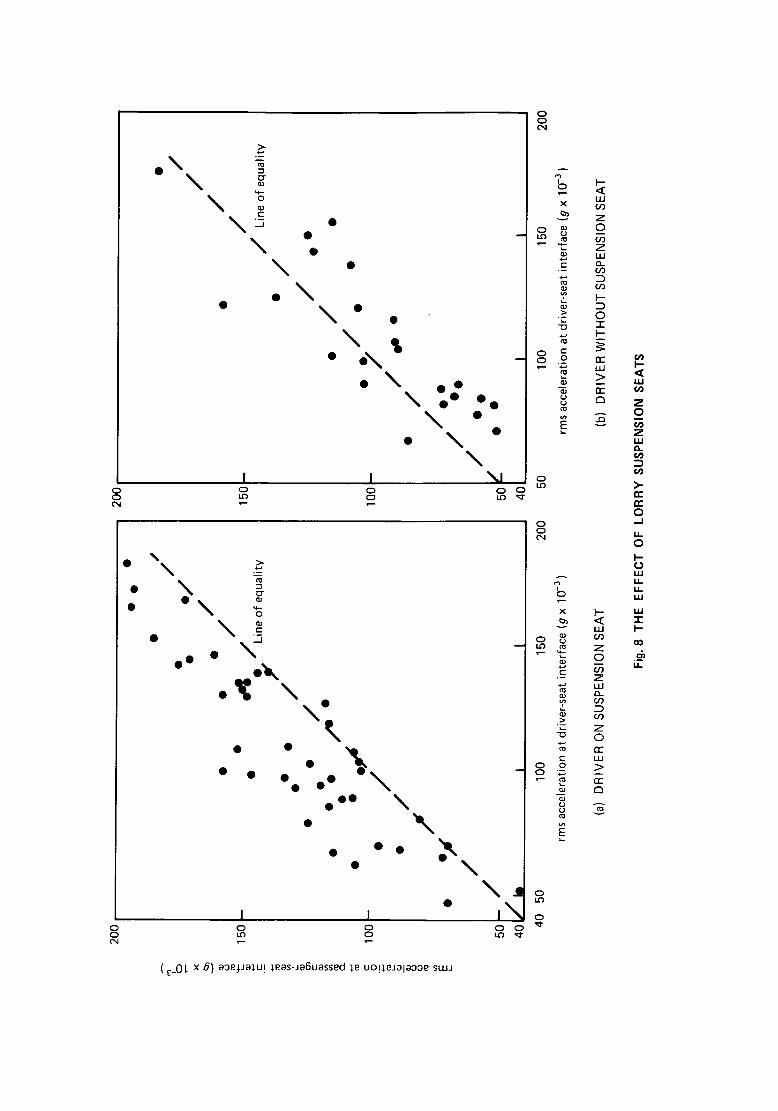
driver is less than that to the passenger. A comparison is made in Figure 8 of rms levels of acceleration experienced
by driver and passenger. Driver rms accelerations with and without suspension seat are plotted against the correspond-
ing passenger rms accelerations. Figure 8(a) shows that, in the majority of test runs, the suspension seat reduced the
rms acceleration to the driver compared with that experienced by the passenger. The converse is true as shown in
Figure 8(b) when the driver is not using a suspension seat; in this case the passenger experiences a slightly better
ride than the driver possibly because, in general, the driving seat has had more wear than the passenger seat.
The use of a suspension seat effectively reduces the level of the vibration input to the driver and should
improve his riding comfort , although those used in the lorries sampled did not appreciably alter the vibration
frequency content.
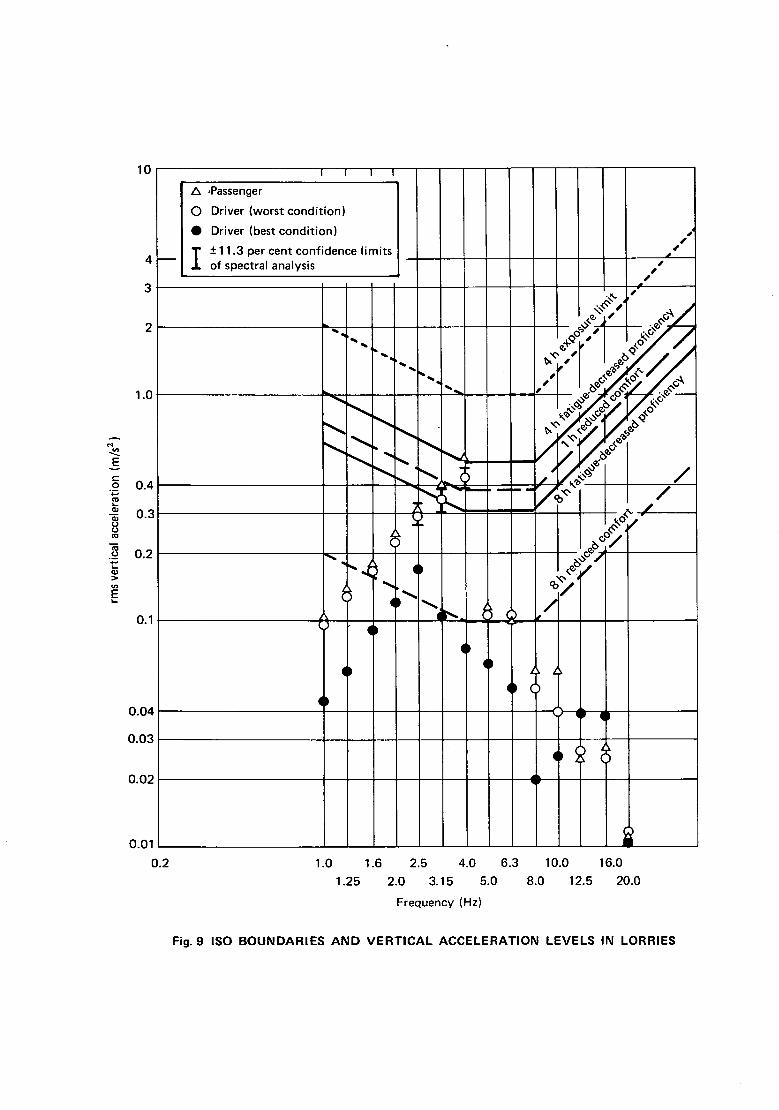
5.5.3 Lorry vibration levels and ISO standards: Figure 9 shows points plotted at the 1/3-octave centre
frequencies for driver and passenger of a lorry, together with the ISO boundaries for exposure to whole-body vibration.
The points plotted represent the highest and lowest levels of acceleration recorded during the experiment. Under
the worst conditions, the lorry driver might be expected to reach the 'reduced comfort' boundary within his first
hour of continuous exposure as a result of the effect of vibration within the 3Hz to 4.5Hz frequency range. The
passenger would in fact reach these levels before the driver. The driver could reach the 'fatigue-decreased
proficiency' boundary after about 4 hours travel with possible impairment of driving performance. Current
legislation 7 permits continuous driving for up to 5 hours (4½ hours from 1 July 1979 and 4 hours from 1 January
1981 under EEC Regulations). It is interesting to note that the lorry passenger (possibly a co-driver) may reach
the limits slightly earlier, becoming 'vibration-fatigued' more quickly. It is therefore perhaps to be recommended
that the passenger should also be provided with the same type of adjustable-suspension seat as used by the driver.
For the I s o recommendation to be used as a guide in this manner, the same assumptions must be made as
those in Section 5.3.5 for the coaches. It is however apparent that, if the driver continuously experienced vibration
o f a magnitude corresponding to the worst case, he could exceed or approach the 'fatigue-decreased proficiency'
boundary during his legal continuous driving period. A relatively economic improvement in lorry ride can be
obtained by the more widespread adoption of suspension seats 8 in lorries. Research being carried out by several
lorry manufacturers on separate cab suspensions should also further reduce the vibration input to the driver and
passenger.
5.5.4 The effect of load and speed on lorry vibration: It was not possible to examine the effect of load and speed
on the vibration because the data was insufficient to provide a basis for analysis.
14
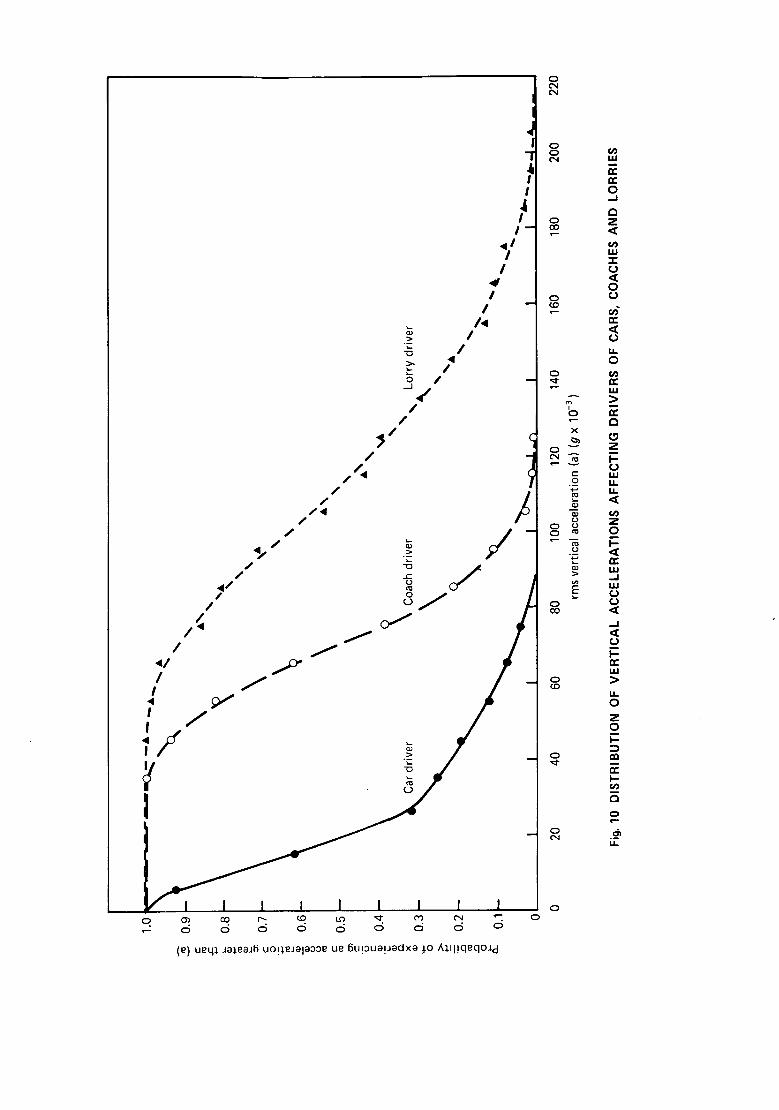
5.6 Comparison of car, coach, and lorry vibration
Figure 10 shows the cumulative distribution of rms vertical acceleration for the drivers of each of the two
types of vehicle examined in this Report, and of the cars reported in reference 2, based upon the combined data
from the three test sites. It can be seen that there are considerable differences in the ranges of rms acceleration
experienced in the three types of vehicle.
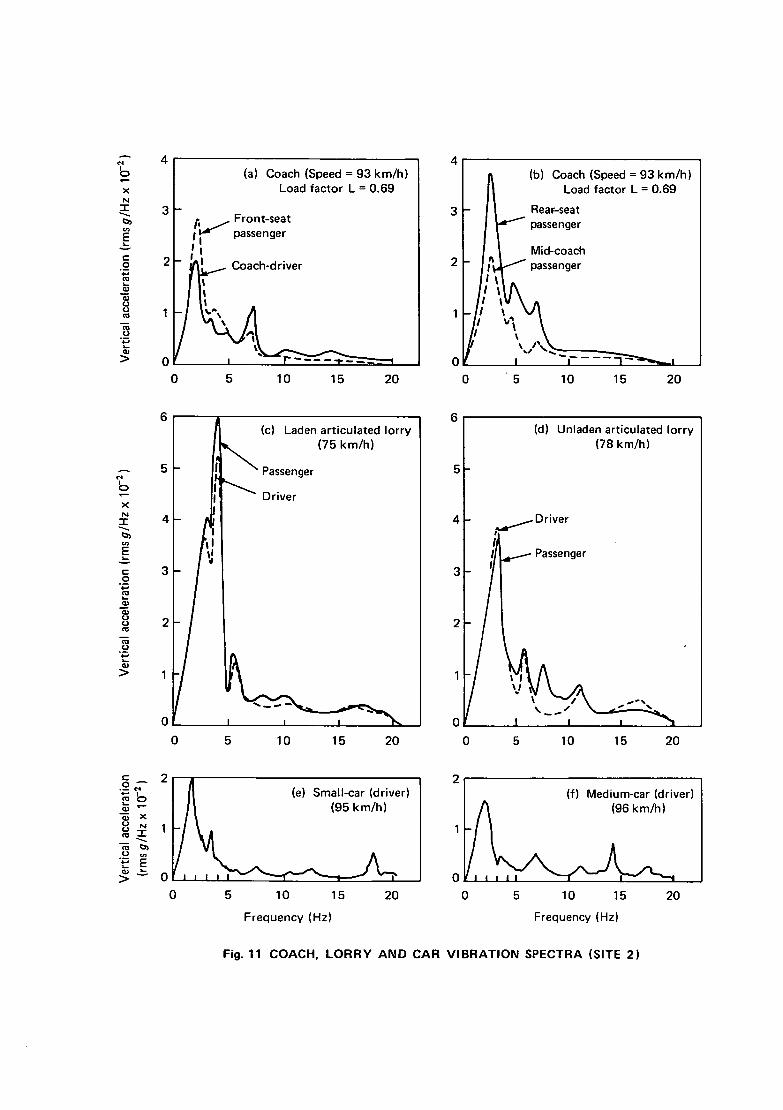
Frequency spectra for the car, coach and lorry are compared in Figures 11 (a) to (f). All spectra are of a
similar shape and show the differences in vehicle response when travelling over the total combined length of the six
test sections of Site 2 which had a good riding quality (see Table 1). The spectra were obtained using a 0.5Hz
constant bandwidth 'real-time' analyser and have an accuracy of + 11.3 per cent.
A comparison of coach, car and lorry spectra in Figure 11 shows that, of the three types of vehicle, least
energy is transmitted by the car seat and suspension system and that the coach suspension is better at attenuating
frequencies in the range 5Hz to 20Hz than the lorry. It can also be seen that the ride in the coach at certain seating
positions approaches that of a car.
The main suspension resonance of the vehicle body on its road springs ('heave') appears to be about 2.5Hz
for the coach, 1.5Hz to 2Hz for the car, and at about 3Hz for the lorry. A loaded articulated lorry produces a large
second resonant peak at about 5.5Hz which is absent in the spectrum of the unladen lorry (Figure 11 (c) (d)).
There is also a higher vibration energy content in the frequencies above 5Hz in the spectrum of the unladen lorry.
These differences in the frequency response for the two conditions of load must be due to interaction between
the trailer and the tractor unit. A loaded trailer does not bounce as much as an unloaded trailer, thereby reducing
the high frequency vibration. But when loaded, some flexing and pitching of the trailer may occur which can
influence the vibratory motion of the tractor unit.
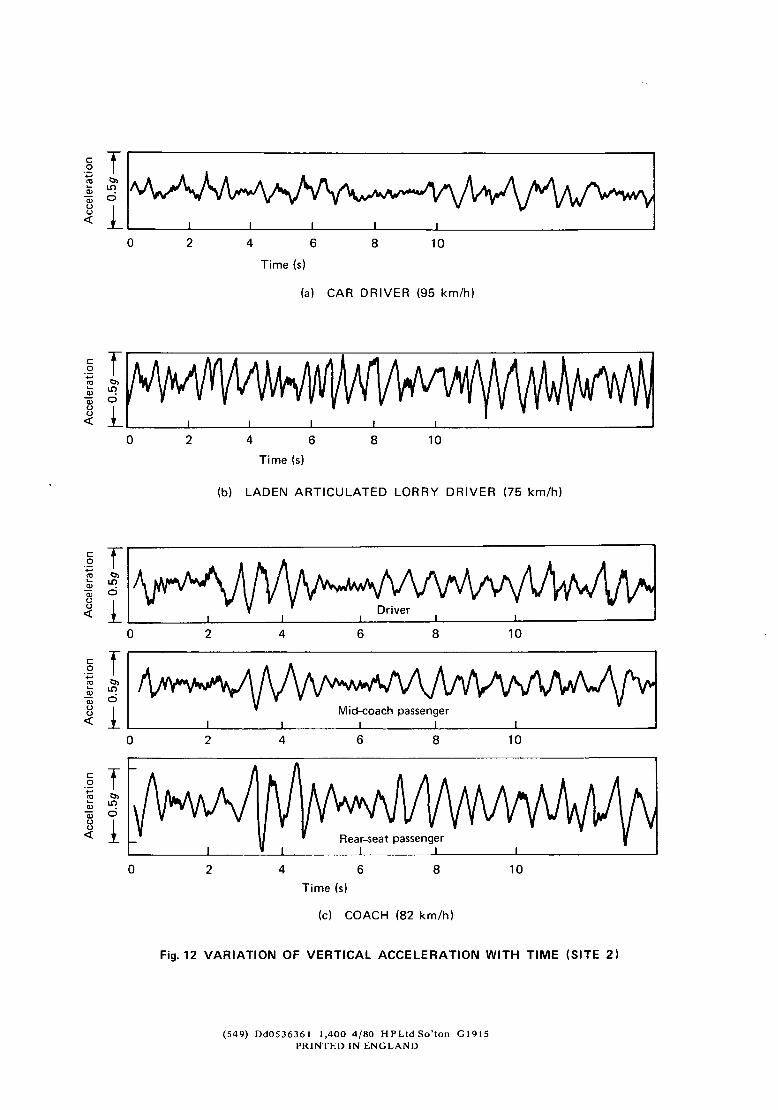
Time histories of vertical acceleration at the seat-person interface produced on Site 2 for a typical medium-
sized car, a coach and a loaded articulated lorry are shown in Figure 12. These traces corroborate information given
in the frequency spectra in that waveforms of recordings from the coach and the lorry have a greater high frequency
content than those from the car. The waveforms shown indicate that peak-to-peak acceleration levels in the car
seldom exceed 0.25g at the seat-person interface; coach and lorry occupants frequently experience peak-to-peak
accelerations of around 0.5g.
Crest factors (the ratio of peak to rms acceleration) for the waveforms illustrated in Figure 12 are about 1.6
for the car and 2.0 for the coach and lorry. The exposure limits recommended by the ISO are not reliable for
vibrations of crest factor greater than 3.
6. SUMMARY OF RESULTS
From the sample of long-distance coaches examined, the levels of rms vertical acceleration were higher than those
previously recorded in private cars 1 travelling over the same sections of road. However, coach passengers appear
to tolerate higher levels more readily than car occupants. In coaches, the mid-coach position gave the most
acceptable ride, and the rear seat gave the least acceptable ride. Coach drivers were found to be less critical of ride
than car drivers for a similar level of vertical acceleration but more critical than coach passengers.
15
A comparison of measured levels with ISO recommended limits showed that, even at the highest measured
acceleration level, the coach driver would not exceed the recommended limits within the legal period of continuous
driving. However, some reduced comfort could be expected after about 2_hours driving. For the coach passengers,
reduced comfort at the mid-coach position would not be expected for some 7 hours of continuous exposure at this
level although at the rear-seat position some discomfort could be expected after only 1½ hours or so.
The vertical acceleration levels in lorry cabs were found to be higher than those in both coaches and cars,
although the drivers were less critical o f the ride than the car and coach drivers for similar levels of acceleration.
At the highest level of acceleration, the lorry drivers could be expected to suffer some decreased proficiency after
about 4 hours continuous exposure, this period being just permissible under current driving hours regulations.
Reduced comfort could be expected within the first hour of exposure. In many of the lorries examined, lorry
passengers, possibly co-drivers, could reach the ISO limits in a shorter time than the drivers, because of the
difference in design of the passenger and driver seats.
Vertical acceleration levels in cars, coaches and lorries ranged up to 0.12 g rms for the car driver, 0.13 g rms
for the coach driver and 0.22 g rms for the lorry driver. The 'comfort characteristic' curves for cars, coaches and
lorries suggest that environmental and psychological factors as well as vibration levels influence the subjective
assessment of ride. For example, vehicle size, spaciousness and noise level together with the expectation and
motivation of the vehicle occupants may be of importance.
The poorer standard of ride in coaches and lorries can be influenced by such factors as vehicle wheelbase
length, and suspension characteristics, as well as the geometrical characteristics of the road profile, in terms of the
amplitude and wavelengths of road surface irregularities. The effect of the latter, with increasing vehicle speed is
generally an increase in rms acceleration level as found in the car experiment 1 , but for the coaches and lorries
insufficient data and a limited range of speeds did not permit any significant correlation to be established.
7. CONCLUSIONS
An investigation has been made of the riding comfort in long-distance coaches and heavy goods vehicles operating
over a variety of typical trunk road surfaces. Ride, represented by the rms vertical acceleration at the seat-person
interface, has been measured in bo th coaches and lorries and correlated with riding comfort assessments of drivers
and passengers. The main conclusions o f the investigation are : -
. The largest acceleration levels measured were nearly twice as high in lorries and on the rear seat of coaches
as those measured in cars.
. Coach passengers and lorry drivers will tolerate higher levels of vertical acceleration more readily than
car occupants.
. The most acceptable ride in a coach is at the mid-point of its wheelbase, where it can be similar to that
experienced in a car. The least acceptable ride is in the rear seat of a coach, where it can be worse than
that experienced by a lorry driver.
16
4. Psychological factors as well as vibration levels influence the subjective assessment of ride.
. There is an increase of approximately 10 -2 g rms vertical acceleration for each 10 km/h increase in coach
speed.
. From comparisons with ISO recommendations, lorry drivers and passengers could suffer some decreased
proficiency after about four hours if continually exposed to the highest level of vibration found in the
investigation. Current legislation permits periods of up to five hours of continuous driving, but this
period is to be reduced to four hours by 1981.
7. Lorry-passenger vibration levels measured were higher than those of the driver. The difference is attributable
to the better seating provided for the driver.
8. FUTURE WORK
The surface condition of urban roads, where frequent 'patching' and ' trenching' occurs, is generally worse than that
of rural major roads; although speeds are much lower on urban roads, vehicle occupants, particularly those of urban
buses which are restricted to these areas, may be exposed to relatively high levels of vibration. Many of the urban
passengers are standing, and their response to vibration inputs is different from that of seated vehicle occupants.
However, because exposure times are comparatively short, passengers may be prepared to tolerate higher levels
of vibration.
Little is known of the effect of road surface irregularities on the riders of two-wheeled vehicles. Although
75 per cent of accidents to motor cyclists occurred in built up areas in 19769 , it is not known what effect road
surface unevenness has on the accident rate.
The road surface/ride relationship of buses and motorised two-wheeled vehicles on urban roads will be
examined in future work.
9. ACKNOWLEDGEMENTS
The work described in this Report forms part of the research programme of the Construction and Maintenance
Division (Division Head: Mr P D Thompson) of the Highways Department of TRRL. Mr P G Jordan, Section Leader,
provided guidance with the analysis of results.
The authors would like to thank Mr A Gurley of the National Bus Company and Mr D P Mockford of
Grey-Green Coaches Ltd, for their assistance in the organisation of the work on coaches.
The cooperation of the following haulage contractors and their drivers is also gratefully acknowledged:
Clements Transport Ltd
Welch's Transport Ltd
J A Wilkinson and Sons Ltd
17
Mrs M H BurtweU of Construction and Maintenance Division, and Mrs J J Webb formerly of Highway Traffic
Division, TRRL, assisted in the collection of data.
10. REFERENCES
1. COOPER, D R C, P G JORDAN and J C YOUNG. Road surface irregularity and vehicle ride, Part 1 -
Variation and interpretation of ride measurements. Department of the Environment Department o f Transport,
TRRL Report SR 341. Crowthorne, 1978 (Transport and Road Research Laboratory).
. COOPER, D R C and J C YOUNG. Road surface irregularity and vehicle ride, Part 2 - Riding comfort in cars
driven by the public. Department of the Environment Department of Transport, TRRL Report SR 400.
Crowthorne, 1978 (Transport and Road Research Laboratory).
. DUNN, J B. Traffic census results for 1972. Department of the Environment, TRRL Report LR 618.
Crowthorne, 1974 (Transport and Road Research Laboratory).
4. HARRIS, W, R R MAKIE et al. A study of the relationships among fatigue, hours of service and safety of
operation of truck and bus drivers. Bureau o f Motor Carrier Safety Report No. BMCS RD-71-2. Washington,
DC 1972. Federal Highway Administration, US Department of Transportation.
. INTERNATIONAL STANDARD, ISO/DIS 2631. A guide for the evaluation of human exposure to whole-
body vibration. International Organisation for Standardisation 1972.
. SOMER, H C and C S HARRIS. Combined effect of noise and vibration on human tracking performance
and response time. Aerospace Med. March, 1973, pp 276-280.
7. MINISTRY OF TRANSPORT. Transport Act 1968, (Part VI), London, 1968 (H M Stationery Office).
. AUTOMOBILE ENGINEER. Ride simulation for suspension seats, May 1971, pp 40 -43 , Iliffe and Sons Ltd,
London.
. DEPARTMENT OF THE ENVIRONMENT. Road Accidents, Great Britain 1974. London, 1976 (H M
Stationery Office).
18
A a
B I ~.~, ~ F~re~io~ ~] C Team c passengers
D d
Acceleration measurement point
Driver b
a
L_>4 D
d
X C
Fig . 1 C O A C H M E A S U R E M E N T P O S I T I O N S
1.0
0.9
0.8 .;-
_~ 0.7
0.6 ¢o
E 8 0.5 U
"~ 0 .4 - -
23 0 . 3 - -
£ a_ 0 .2 - -
0.1--
0
0
~ = ~ ~ " = ~ = = ~ = -- Coach passenger
- o - . - _ ~ o / - - - " % % 0 ~ •
% •
---- Car occup t % O %
• Coach passenger
O Car occupant
I I I I I I I I I I I I I
10 20 30 40 50 60 70 80 90 100 110 120 130
rms vertical acceleration (g x 10 -3 )
I I
Fig. 2 COMFORT CHARACTERISTIC CURVES -- MEMBERS OF THE PUBLIC
1.0' ~ . ~ k ~ ~ ~ O ~ O Coach driver
-~ 0 . 9 - ~ • 0 ~ k 0 Coach (TRRL)
., o.8- \ , , ,%, \
0.7
o.6
0.5 8
.5 o.4
"- 0.3
~ 0.2 m 0.1 0
• Cars (TRRL)
~'\ ~ o
• ~ • ~ . Coach > ~ A O ~ % ~ (TRRL team)
Cars (TRR L team) " ~
Coach driver
I I I I I I I I I I I I I I I I
0 i0 20 30 40 50 60 70 80 90 100 110 120 130 140 150 160 170
rms vertical acceleration (g x 10 -3 )
Fig. 3 COMFORT CHARACTERISTIC CURVES -- TRRL STAFF AND COACH DRIVERS
A 00
v 1.0 t - ¢o
0.9
0.8 O ° ~
*~ 0.7
u 0.6 ¢.)
m
r -
0.5 e--
~- 0.4 o )
x 0.3 Q )
0.2 o _
.~ o.~
Q _
\ \ ~ X - - ~Z~ Rear seat
\
Mid-coach
\ z~
% \
%
0 ! t t t t ! I I "'r "~. ¢ i I IA"I "/~-
0 10 20 30 40 50 60 70 80 90 100 110 120 130 140 150 160 170 rms acceleration (a) (g x 10 -3)
F ig . 4 D I S T R I B U T I O N O F V E R T I C A L A C C E L E R A T I O N S I N C O A C H E S
E"
E ¢ -
O
¢.) ( . }
co
10
4
3 m
1.0
0.4
0.3
0.2
0.1
0.04:
0.03 ]
A Rear-seat passenger
O Mid-coach passenger
• Coach driver
• Car driver
I + 11.3 per cent confidence limits of spectral analysis
0~,"~'/ , f
.,,~,,4" ~.~°t, I /
• /¢ \~ / I J,°~'"
() /
~-_2. /
k
= = •
t
c)
0.02
0.01
0.2 1.0 1.6 2.5 4.0 6.3 1.25 2.0 3.15 5.0
Frequency (Hz)
Ji. ,~k 1 10.0 16.0
8.0 12.5 20.0
Fig. 5 ISO BOUNDARIES AND VERTICAL ACCELERATION LEVELS IN COACHES
1.0
0.9
"c. 0.8
_8 0.7
0.6
~ 0.5
~ 0.4
~ 0.3
m 0.2
0.1
0 0
. I . ~ , ~ • , 0 % ~ Lorry driver
- \ ".._
X X x ~ TRRL lorry passenger
\ \ o \ \ o
I I
10
I t t t I I I I I I I I I
20 30 40 50 60 70 80 90 100 110 120 130 140 150
rms vertical acceleration (g x 10 -3 )
Fig. 6 COMFORT CHARACTERISTIC CURVES FOR LORRIES
A ¢O
v
e" oO
¢ b
t -
O
O.}
¢J
c-
¢-. (M
Q . X
..Q
o
1.0
0.9
0.8
0.7
0.6
0.5
0.4
0.3
0.2
°iF, 0,
40 50
\ ~o
Lorry driver
TR R L lorry passenger
~O,, "O
~o "o~
1 l 100 150
rms vertical acceleration (a) (g x 10 -3 )
" o ~
200
Fig. 7 DISTRIBUTION OF VERTICAL ACCELERATIONS MEASURED IN LORRY CABS
0 0
O
• =
E
\
0
I 0
\ .\
\ -
• .\ • \
I o o
\
O O O O
\
o o
0 0
A
b X
E
- 0
° o = o
O~
U U
0
\ +
•
e ° o ~
• •
"k O O O O
o ° ° \ • \
• • • 0 ~ • \
I I o o o o L.O 0
O O
I \ o
rn
b ,e-
X
t "
E o o o ,~
cJ
I--
LIJ
z O
Z W
D
D 0 "I"
LLI
IT" 123
I--
U.I
Z O
z w
Z O rr" uJ >
123
I--
1,1,1
Z 0
Z U.I e l .
D
>- ne nr" 0 .,.I
1.1.
0
I - (J UJ LI . LI .
W ..r
i -
oo
._~
(E_O L x B) a:)e~Ja:~u! leas-Jal~uassEd ~.R uo! : leJala0ae swJ
10
4 m
3
1.0
A o~
E c - o 0.4
--~ 0.3 ¢J
._ 0.2
0.1
0.04
0.03
0.02
0.01
0.2
c~ lit
I I I I
Z~ ,Passenger
0 Driver (worst condition)
• Driver (best condition) o d S
I + 11.3 per cent confidence l imits _ • of spectral analysis .S SS~
; ~ ,~'
, /
'--" . . . . / ~ ' 1 I / - - ~,o?) /
I<,~)o,°;I '
<'>W' a %-___~ 0 •
I t
I i tl
, , 2 8
1.0 1.6 2.5 4.0 6.3 10.0
1.25 2.0 3.15 5.0 8.0 12.5
Frequency (Hz)
I I 16.0
20.0
Fig. 9 ISO B O U N D A R I E S A N D V E R T I C A L A C C E L E R A T I O N LEVELS IN LORRIES
0
/
/ !
! I . / I
t
0
/ l
l
l /
l l
/
/
/
1 /
l . ¢
/ /
/
' 1 "t3
o / - J
4' 1
1 1
w-
° / c"
8 / o, /
:>
.-Q
( J
7
I
.I I
I - -
/ 4 I
I I I I I I I I I {5 (5 d d d d d c5 d
(e) ueq~ Ja]eaJ6 uo!;eJalaoae ue 6u!aua!Jadxa J.O A~!l!qeqoJ d
I /
/ -
0
0 0
0 CO
0 ( .0
0
A
b X
0 v
c- O . _
(1) I
g ~ . I
0 O0
0
0
0
r ,n I L l
r r
0 .--I
a z <
( n
o <~ 0 o
r~ <C 0 I J .
0 ( n r r
I.U > n-
z
o UJ U . U . .<
( n z 0 I - <~ n- I L l ...J I L l
o <~
i i < o I - r r
u J > I t .
0 z 0 I -
r r
u )
0
._~ IJ .
A
b X
N -1-
t -
O
¢.) co
4-a
>
4 (a) Coach (Speed = 93 km/h)
Load factor L = 0.69
3 Front-seat passenger
I
2 ~ C~ach-driver
0 I ~ ~
0 5 10 15 20
4
/
0
(b) Coach (Speed = 93 km/h) Load factor L = 0.69
Rear-seat passenger
Mid-coach passenger
5 10 15 20
A
E~ X
N I
t -
O
co ¢.)
>
6 (c) Laden articulated lorry
(75 km/h)
5 - It! ~ Passenger
4 -
Driver
0 I = I
0 5 10 15 20
6 (d) Unladen articulated lorry
(78 kin/h)
, ~ Driver #1
II II iI
/ d~--Passenger
s ~* " ~ ' % % o j
5 10 15 20
t - ._o
x
¢o
> 0
0
(e) Small-car (driver)
i , I I I - ~ ' l " - - Y - l"
5 10 15 20
Frequency (Hz)
0
0
(f) Medium-car (driver)
5 10 15 20
Frequency (Hz)
Fig. 11 COACH, LORRY AND CAR VIBRATION SPECTRA (SITE 2)
Time (s)
(a) CAR DRIVER (95 km/h)
~:[ I I
0 2 4 6 8 10
Time (s)
- i <
(b) LADEN ARTICULATED LORRY DRIVER (75 km/h)
~ Driver < : I I I I I
0 2 4 6 8 10
0
LR. O
l
I I I I I 2 4 6 8 10
t - O
¢J o <
0 2 4 6 8 10
Time (s)
< I I I I
0 2 4 6 8 10
(c) COACH (82 km/h)
Fig. 12 VARIATION OF VERTICAL ACCELERATION WITH TIME (SITE 2)
(549) D d 0 5 3 6 3 6 1 1 ,400 4 / 8 0 H P L t d S o ' t o n G 1 9 1 5 P R I N T E D IN E N G L A N D
ABSTRACT
ROAD SURFACE IRREGULARITY AND VEHICLE RIDE. PART 3 - RIDING COMFORT IN COACHES AND HEAVY GOODS VEHICLES: D R C Cooper M Phil and J C Young MIOA: Department of the Environment Department of Transport, TRRL Supplementary Report 560: Crowthorne, 1980 (Transport and Road Research Laboratory). An investigation is described of the riding comfort in long-distance coaches and heavy goods vehicles, operating over typical trunk road surfaces. Ride, represented by the root-mean-square (rms) of the vertical acceleration at the seat-person interface, has been measured in both coaches and lorries and correlated with riding comfort assessments of drivers and passengers. Comparisons are made with the ride in cars measured in previous experiments.
Results show that coach passengers and lorry drivers will tolerate higher acceleration levels more readily than will car occupants. Psychological factors, as well as vibration levels influence the subjective assessment of ride.
Evaluation of the highest measured acceleration levels against recommended International Standards of human response to whole-body vibration show a possibility that lorry drivers could, in certain cases, suffer some fatigue- decreased proficiency within their present legally permitted periods of continuous driving.
The ride in lorries could be improved by the more widespread use of suspension seats.
ISSN 0305- 1315