Analysis of Public Transport Service Accessibility in the ...
Transport accessibility and social exclusion: a better way to evaluate public transport investment?
BOCAREJO, Juan; OVIEDO, Daniel
12th WCTR, July 11-15, 2010 – Lisbon, Portugal 1
TRANSPORT ACCESSIBILITY AND SOCIAL EXCLUSION: A BETTER WAY TO EVALUATE PUBLIC TRANSPORT
INVESTMENT?
Juan Pablo Bocarejo Suescún, PhD. Grupo de Estudios en Sostenibilidad Urbana y Regional Universidad de los Andes, Bogotá (Colombia) [email protected]
Daniel Ricardo Oviedo Hernández, Msc. Grupo de Estudios en Sostenibilidad Urbana y Regional Universidad de los Andes, [email protected]
ABSTRACT
The project starts from traditional definitions and measurements of transport accessibility and establishes a methodology that enables policy evaluators to involve income levels, primarily of the poorest segment of population, in the assessment of transport-related projects in developing countries. Social Utility evaluation is also suggested to analyze different alternatives of public transport fare structures. The proposed method will be applied to the case study of Bogotá (Colombia). Public transport and road supply are going to be evaluated in areas of the city served by different transportation systems, including local BRT Transmilenio in certain cases. Traditional accessibility is measured using Hansen´s gravity indicator and Job market measurements. It is then applied to determine accessibility levels related to activity clusters from each of the selected zones. Keywords: Accessibility, Social Exclusion, Urban Transport, Developing countries
INTRODUCTION
In transport policy formulation, attributes that give value to transport systems have been progressively changing. While in the past speed and reduced travel times were given too much importance; currently the relevance of characteristics such as system reliability, low environmental impact, provided accessibility and equality contribution have constantly increased. For example, the 1982 LOTI Transport Act of France defined the necessity to strengthen mobility in terms of reasonable access, quality, and price for the individual. The United Kingdom’s DfT has complemented development procedures in mobility plans, which should

Transport accessibility and social exclusion: a better way to evaluate public transport investment?
BOCAREJO, Juan; OVIEDO, Daniel
12th WCTR, July 11-15, 2010 – Lisbon, Portugal 2
be implemented by all municipalities, with an accessibility plan. This initiative was produced as a result of research performed on social exclusion and equity issues. Although the concept of social equity seems to be ubiquitous in most mobility plans of major Latin American cities, when evaluating transport projects for financing and prioritization there are no specific and solid indicators to measure social impacts and how they can contribute to promote better access to opportunities, particularly for the most vulnerable segments of population. Transport demand is derived from people’s needs to reach activities and accessing to opportunities that are not available at their trip origin. In that order, social and economical benefits depend directly on the number of opportunities accessible from a given location. Accessibility measures focus on estimating the availability of opportunities generated as a result of both transportation supply and land use characteristics. Accessibility can also be used as an indicator of social inclusion and the potential of economical development at the individual level (Scottish executive, 2000). At the moment, in many developing countries there is an obvious problem of accessibility to transport, and therefore to opportunities. The capacity of individuals to travel in the poorest segment of the population of cities such as Bogotá is reduced to less than 1.5 trips per day. The corresponding percentage of their total income spent on transport, however, exceeds 20%, even for this low trip rate. In other words, given the characteristics of the transport supply, the poorest people in Bogotá spend the same portion of their income making 1.5 trips per day than paying for all of the other basic services. Earlier studies suggest that most people have a travel budget strongly related to their income level. Zahavi (1981) argues that, depending on certain characteristics of individuals, such as level of income or car ownership, travel money budget remains stable, oscillating between 7% and 9% of individual income. Contrary to this theory, the poorest population of Bogotá spends more than 20% of their income on transport, evidencing a serious inequity problem. On the other hand, there is a permanent allusion to urban "productivity" and "equity" in transport policy documents (Plan Maestro de Movilidad de Bogotá, 2006; Plan de Transporte Urbano de Santiago, 2003). However, a clear strategy to achieve these primary objectives has not been defined yet. One of the primary purposes of our research is associated with the development of innovative tools for local policy, and this paper represents the first step in the achievement of defined goals for the research project. An overview of the wide range of definitions, measurement techniques, and applications linked with the concept of transport accessibility, shows that including this concept in a broader optic can help to the development of more equitable urban transport projects. Consequently, the research focuses on the construction and application of a series of indicators linked with the different components of accessibility in the urban transport domain, particularly those that cover the relationships between transport costs and income level.

Transport accessibility and social exclusion: a better way to evaluate public transport investment?
BOCAREJO, Juan; OVIEDO, Daniel
12th WCTR, July 11-15, 2010 – Lisbon, Portugal 3
Affordability should be one main aspect to consider when formulating public policies in developing cities in order to provide better accessibility.
ACCESSIBILITY AND INEQUALITY ON DEVELOPING CITIES
Among other strategies to improve public transport in developing cities of certain importance, the possibility of developing BRT systems has proven to be an efficient solution for public transport requirements. These systems are proficient in transporting medium to high passenger volumes, which are one of the most relevant characteristics of main arteries that connect residential areas with employment centers. This type of projects has focused on improving efficiency, providing transport supply and technology according to existing and expected demand. In Colombia, seven cities over 700.000 inhabitants have implemented BRT projects, following the success of TransMilenio in Bogota. The development of these projects includes the application of ex ante cost-benefit assessments, and financial structuring of projects involving an interesting component of public-private participation. As usual, the main benefits of the projects were considerable reductions in travel times according to economic evaluation; while the financial structuring sought at all costs that transport operating costs would be paid using fare revenues. The calculation of the equilibrium rate of the system should cover the payment of the purchase and operation of vehicles, fare collection technology, control and monitoring of buses, compensation to former operators of the previous public transport system and, in some cases, part of the infrastructure. All of these costs were covered by the fare paid by the users, sadly, mainly the poorest of each city. Unquestionably, the new systems’ user saves time. However, increased fare can be a strong limitation for its use. Thus somehow the policy of improving the system by increasing its price could adversely affect individual mobility, which as described above is quite low in Colombian cities. In addition, a relocation of activities in the city can make more difficult their access to employment, education, health and recreation. It is possible to speculate about a possible slowdown of individual mobility in certain low income sectors of the city, which spend a significant percentage of their income in transportation, approximately 20% (Bocarejo, 2007). Consequently, it is possible that the traditional evaluation of these projects could have ignored the negative effect of increased fare costs on transport demand. Therefore, by introducing the concept of accessibility in the evaluation of urban transport projects, it will be possible to consider not only an indicator that relates the transport system and land use, but the real possibility of transport use and ease of access to the city depending on individual purchase power. This tool can be used to evaluate different types of policies related to relocation of activities, improvements in public transport, changes on physical access to transport systems and fare structures. Consequently, it is expected that the statements of mobility plans in developing cities will progressively grant more value on

Transport accessibility and social exclusion: a better way to evaluate public transport investment?
BOCAREJO, Juan; OVIEDO, Daniel
12th WCTR, July 11-15, 2010 – Lisbon, Portugal 4
matters as equity and productivity as well as indicators and methodologies needed to verifying the achievement of these objectives.
ACCESSIBILITY CONCEPT AND MEASURES
The study of transport accessibility has produced a large amount of research and working papers over the years. New studies and practical approaches are emerging continuously on this subject; however, most of them apply the existing methodologies to the contexts and data previously studied. This section presents a compilation of the most representative methodological approaches to the study of transport accessibility, and an overview of relevant concepts directly and indirectly related to the study topic that can contribute to the study of accessibility in developing countries as a tool for evaluating transport investment.
Accessibility Definitions
The concept of accessibility has been frequently used in a diversity of scientific studies focused on mobility issues, and represents a fundamental tool in the definition of public policies. Nevertheless, many methods of defining and putting into practice the notion of accessibility have been developed over the years, and the quantity of studies centring on this topic has provoked the use of the concept in several ways. Interpretations of accessibility generated within the scientific community include the definition of accessibility as: the potential opportunities for interaction (Hansen, 1959), the ease of reaching any area of activity using a specific transport system (Dalvi & Martin, 1976), and, the overall benefits provided by a given transport system (Ben-Akiva & Lermann, 1979), among others. From a more classical point of view, accessibility can be understood as the ease of reaching desired destinations given a number of available opportunities and intrinsic impedance to the resources used to travel from the origin to the destination. Usually, opportunities are measured in terms of employment positions, and impedance in units of distance or time (Niemeier, 1997). Many authors have complemented this view of accessibility by adding and developing existing and new components to the approach, constructing a wider theory about accessibility. Three main clusters can be identified according to Wee and Hagoort (2001) for accessibility definitions and measures: infrastructure-related, activities-related and mixed approaches. The first approach focuses on characteristics of transport supply and its demand; some examples of this approach can be found in Priemus (1995), Linneker and Spence (1996), Lovett et al (2002), Gutierrez (2009), Ribeiro et al (2009), among others. The activities approach is associated with land use and activities location focusing on the number of activities accessible in a given range of travel time or distance; many authors have studied accessibility from this perspective, and among the most representative works are Hansen

Transport accessibility and social exclusion: a better way to evaluate public transport investment?
BOCAREJO, Juan; OVIEDO, Daniel
12th WCTR, July 11-15, 2010 – Lisbon, Portugal 5
(1959), Cervero (1989, 1996), Gutiérrez (2001), Wee and Hagoort (2001), Halden (2002), Bertolini et al (2005), Ben Akiva (2006), Kenyon (2006), Grengs (2009). The last approach combines the preceding two, making a more complete analysis of accessibility; some authors found in scientific literature who have used this kind of method are Nutley (1980), Wee and Hagoort (2001), Levine and Garb (2002), Wu and Hine (2003), Curtis (2008), Straatemeier (2009), Iacono et al (2009). Generally, nearly all accessibility definitions and measures consider elements linked with generalized travel costs, demand characteristics such as number of households, job clusters, commercial activities, and origin-destination interaction and access. As shown, accessibility has several components from which it can be analysed. Three main elements are determinant to define accessibility in a more complete way than in previous works: Land Use, Transport and Individual characteristics. Geurs and Wee (2004) define each of these components, on the basis of an extensive collection of research. According to their study, the analysis of accessibility can be divided into three specific components as described below:
1. Land Use: this component includes quantity, quality, and distribution of productive activities in a given area of study (destination), and demand for goods and services generated in residential centres (origin). Similarly, it considers the supply-demand relationship based on the interaction of origins and destinations, and emphasizes its analysis on impacts produced over the capacity of a territory to provide and carry out economic activities.
2. Transport: this can be comprehended in terms of the disutility for a user when
moving between an origin-destination pair. It analyzes transport supply (infrastructure, services, etc.) and demand, and includes time (travel and waiting time), costs (fixed and variable) and effort variables (convenience, safety, reliability, etc.).
3. Characteristics of Individuals: this component considers needs, skills and abilities
that allow individuals to access areas of activity. Elements considered in this perspective include income and educational levels, vehicle ownership, physical restrictions, age distribution, and so on. These features allow one to determine the influence of characteristics of individual travellers in their levels of accessibility and effectiveness of land use zones within the city. In addition, limitations of both time and money, which limit the number of opportunities available for an individual, are considered from this perspective. One of the main objects of study is the relationship between time and money budgets and characteristics of land use.
Measurement Techniques and Indicators
As transport demand is derived from people’s need to reach activities and access opportunities that are not available at their trip origin. Social and economic benefits depend directly on the number of opportunities reachable from a given location. Similarly,

Transport accessibility and social exclusion: a better way to evaluate public transport investment?
BOCAREJO, Juan; OVIEDO, Daniel
12th WCTR, July 11-15, 2010 – Lisbon, Portugal 6
accessibility measures focus on estimation of choices availability generated as a result of both transportation supply and land use characteristics. In addition, accessibility can be used as an indicator of social inclusion and the potential of economic development at the individual level (Scottish Executive, 2000). Over the years, many researchers have focused on the study and development of accessibility measurement systems. Some of the most representative works on this subject range from activity-based measures (Ben Akiva, 2006) and utility-based measures (Handy & Clifton, 2000) to specialized software for calculation of accessibility levels (Bhat, 2000). Among the different approaches for measuring accessibility, the most frequently used measures are based on the combination of opportunities and impedances. An example of this type of indicator is the denominated gravity model regularly employed by many research institutions (Niemeier, 1997). Hansen (1959) was the first to propose a gravity measure for accessibility in the scientific literature with the purpose of modelling land development. As described by Meyer and Miller (1984) and Dickey et al (1983), gravity-type accessibility measures correspond to the portion of the gravity models which measure attractive power and the friction of spatial separation. New approaches and measures related to other aspects of urban mobility have been developed in recent years. Some of these classifications are described below. Infrastructure- based indicators: analyze the characteristics of the supply of infrastructure in terms of capacity and level of service, studying the quality of transport facilities using measures such as levels of congestion and average travel speed on roads. This type of indicator studies the coverage, capacity and quality of transport infrastructure through measures of length, density, and traffic levels during congestion periods. Such measures provide a general idea of the accessibility features in a given zone and enable the formulation of descriptive analysis of the transport network. Activities / land use based indicators: these measures give a perspective of accessibility on the macroscopic level. Activities-based indicators usually describe the level of access to activities distributed in space, using indicators of opportunities availability regarding their distribution in space and time. An example of this type of measure is the number of jobs within a given range of time (e.g. 30 minutes on public transport between origin and destination). Some more refined measures consider additional factors such as capacity constraints in the areas of activity (example: number of job vacancies available, number of tickets available for an event, etc.). Some of the most common used measures of this type are potential indicators, also called gravity measures. These indicators, applied for the first time in 1947 by Stewart to identify potential of population for different regions of the United States, were subsequently employed by Harrys (1954) and Hansen (1959) for analysis of specific locations and to describe access to employment opportunities.

Transport accessibility and social exclusion: a better way to evaluate public transport investment?
BOCAREJO, Juan; OVIEDO, Daniel
12th WCTR, July 11-15, 2010 – Lisbon, Portugal 7
Potential measures are generated by weighting opportunities located in a given area using an attribute of attraction (population, ability to pay, etc.), and discounting a measure of impedance (Knox, 1978; Handy, 1993; Geertman & Ritsema, 1995; Wyatt, 1997; Johnston, 2000). These accessibility indicators provide a powerful tool of analysis because they consider both measures of attractiveness and impedance to establish a reliable value of the potential of a given area. People-based indicators: these measures are based on spatial and temporal geography, and consider the restrictions of an individual to reach activities. The accessibility measures at the individual level examine the activities that a person can perform in a given time, measured in terms of their time budgets for the mandatory activities (working, studying), flexible activities (entertainment, leisure, etc.), and the speed offered by the transport systems for moving between areas of activity. Also known as space-time accessibility measures (Kwan, 1998, Miller 1999, Miller & Wu, 2000; Kwan & Weber, 2003), people-based measures consider accessibility as an attribute of individuals (Kwan & Weber, 2003), and evaluate it from the daily schedule of activities and spatial and temporal constraints for an individual (Landau, 1982; Kwan, 1998). Using these indicators requires a considerable level of disaggregation, and separately evaluating accessibility for different trip purposes, modes of transport, income level, gender, age, occupational groups and types of activity (Wachs & Kumagai 1973, Ben-Akiva & Lerman, 1979; Handy & Niemeier, 1997; Kwan, 1998). For example, this approach allows us, to determine differences in accessibility between people of different genders, relations between income levels and access to opportunities, evaluate the conditions of access to systems for disabled people, generate analysis of accessibility to certain transport systems given some specific known restrictions, and so on. Utility-based indicators: these measures, based on economic studies, contemplate the benefits acquired by people when accessing activities distributed in space. This type of indicator estimates accessibility at the individual level, taking into account not only the characteristics of individuals but also those of the different transport modes (Banister & Berechman, 2001; Geurs & Ritsema van Eck, 2001). The basic assumptions of these measures were defined by Koenig in 1980. First, people associate a utility with each alternative to confront them, and then select the most useful. Then people define a utility function composed of the sum of a deterministic and a random component, incorporating the variables representing each option, reflecting the attractiveness of the destination area, the impedance of the trip owing to the characteristics of the network and transport systems, and the characteristics and preferences of individuals studied (Handy & Niemeier, 1997). One of the main problems with this type of measure, besides that sometimes they are difficult to estimate, is that they require a large amount of information.

Transport accessibility and social exclusion: a better way to evaluate public transport investment?
BOCAREJO, Juan; OVIEDO, Daniel
12th WCTR, July 11-15, 2010 – Lisbon, Portugal 8
METHODOLOGY
Proposed Indicator
Accessibility to jobs (Hansen equation) Several hypotheses have been made over the years around the concept of accessibility and how it can be measured, as identified in the conceptual framework of this paper. Colombia has no record of the application of any of the existing methodologies for measuring accessibility neither in urban nor in other kinds of contexts, making the possibility to explore this potential an interesting field of research at the local level. Therefore, a first approach to the use of accessibility as a measure of evaluation of transport systems and social exclusion in urban locations in Colombia is the adoption and parameterization of Hansen accessibility indicator for its usage in local context. The conventional Hansen equation, one of the most used in the scientific literature for several years to estimate the level of accessibility of a given area is defined as:
(1) Where, Ai = Accessibility of the zone i (origin zone) aj = Attractiveness of Zone j (destiny zone) f(dij) = Function of the distance (cost) between zones i and j The attractiveness of a land use area can be determined in different ways depending on the information available and the type of analysis being performed. The activities located in a destination area are the main target. Nevertheless, given the context in which is intended to work, the information available is limited and can be difficult to determine the number of activities of all kinds located in a specific area. In that sense, it is advisable to reduce the analysis to the grounds for mandatory commutes as study and work to use the number of positions of employment and educational institutions in a given area as an index of its attractiveness. In equation (1), the cost function is traditionally defined in terms of travel time or distance inherent to move from one area to another, and takes the standard form of utility functions. Although this may represent a first approach in accessibility measurement in developing countries, in order to consider a component of exceptional relevance given the characteristics of the population residing in the study area, it is necessary to incorporate an affordability component to the function, which can be expressed in terms of the percentage of individual income spent in transportation, obtaining:

Transport accessibility and social exclusion: a better way to evaluate public transport investment?
BOCAREJO, Juan; OVIEDO, Daniel
12th WCTR, July 11-15, 2010 – Lisbon, Portugal 9
(2)
Where,
Cij = Generalized travel cost (Impedance) between zones i and j
Ct = travel time cost between i y j
Cc = percentage of the individual income spent on travelling
The first component of generalized travel cost, the cost expressed in terms of time, is directly related to individual variables such as occupation, age, income level, among others, and land use variables as activities distribution, which determines the travel and activity time budgets. Similarly, it is related to supply variables that define the speed of travel and availability of transport modes that can increase or reduce waiting and walking times as alternatives’ availability varies. On the other hand, the monetary cost component of f(dij) is directly connected to income level of individuals and supply of transport. The affordability component of this function is closely associated to the travel money budget that is conditioned to a percentage of income of individuals which, according to Zahavi, tends to remain constant in time. As a result, the monetary cost of each mode determines whether or not individuals are able to use every alternative available to mobilize given their budget restriction and purchase power.
Accessibility estimation traditionally involves the use of travel information generated at the time of analysis, so the potential of activities reachable from a given area can be determined from the known characteristics of demand and supply, providing an estimate of the accessibility of the zone. However, it is equally important to study the preferences of users and their own valuation of the variables in the impedance function for determining the most likely value of activities accessible from the study area, consolidating this approach as a first indication for policy intervention. Likewise, it is recognized that there are both temporal and financial restrictions that limit the ability of individuals to mobilize. These constraints represent conditions for the relationship between internal and external issues that directly affect the level of accessibility for an individual in a defined study area.
Three types of accessibility
Real Accessibility
Since a relationship between costs/budgets of time and money for travel, transport supply, socioeconomic characteristics of individuals, and accessibility levels can be inferred as stated above, these variables can be used to define the parameters of equation (2) as:
(3) (4)

Transport accessibility and social exclusion: a better way to evaluate public transport investment?
BOCAREJO, Juan; OVIEDO, Daniel
12th WCTR, July 11-15, 2010 – Lisbon, Portugal
10
Where, Mode = Transport mode(s) used to travel from origin to destiny Spatial location = Origin zone Socioeconomic strata = Local classification for purchase power and household income that goes from 1 for the poorest segment of the population to 6 for the richest. c/i = Travel cost Vs. Origin zone average Individual income ratio A primary result of this research is setting the values of the coefficients of each variable defined above for all the selected areas of Bogotá, as well as its most likely value corresponding to the characteristics that determine the level of access to jobs in each zone. This first value will be denoted as Real Accessibility. Real Accessibility is given by the number of jobs that inhabitants in different zones of the city are reaching. We assume this as the number of trips made to work. Accessibility per capita for each zone is obtained by dividing the total number of trips to work by the labor population of the zone. Thus, real accessibility is known, and is given by O-D surveys. From this kind of survey, it is also possible to determine the way jobs are reached. It is possible to calculate for each OD pair, the average time and percentage of income spent. Therefore, it is possible to calibrate the f(dij) function for several study areas with this data. In order to calculate the coefficients for both of the variables that are considered in the impedance function, the values of daily working commutes are estimated from 2005 survey and compared with the total job positions offered at each zone, obtaining an approximate value of f(dij). In addition, averages of time and percentage of income employed on traveling between each i and j pair are known from given data bases permitting to perform a regression that results on the values of and for each of the selected zones. The resulting equation allows researchers and transport planners to evaluate the effects of different policies on accessibility to jobs at each zone by transforming time and cost savings into a measurable number of additional opportunities obtained from each alternative. These analyses can lead to new forms of transport projects evaluation based on the benefits in terms of access and inclusion, particularly for the most vulnerable population groups. Standardized Accessibility Zahavi (1972) hypothesized that the average individual travel time budget is around an hour a day, however, when looking at the most vulnerable population of Bogotá it is noted that the amount of time spent on traveling is very close to, and in many cases exceed 60 minutes per trip. In addition, the same author suggests that most people have a travel money budget closely related to their income level. Zahavi argues that depending of certain individual characteristics; travel money budget remains fairly stable, ranging between 7% and 9% of individual income. Yet, evidence has shown that in Bogotá the poorest people spend more than 20% of their income on transport.

Transport accessibility and social exclusion: a better way to evaluate public transport investment?
BOCAREJO, Juan; OVIEDO, Daniel
12th WCTR, July 11-15, 2010 – Lisbon, Portugal
11
Therefore, if the international standards of travel money budget and travel time budget are applied as a restriction to the variables used to determine accessibility to jobs, the reduction on the number of reachable job positions may decrease to a critical level depending of the characteristics and the ease for using transport systems that provide an acceptable service even under these conditions. Accessibility levels under these restrictions are called Standardized Accessibility and are estimated in order to determine possible inequalities in terms of accessibility on areas with different purchase power, access to transport systems, and specific spatial location relative to job clusters on the city under the same maximum budget of money and time for accessing to mandatory activities such as working. Desired conditions for Accessibility The study of the effects of homogeneous budget restrictions applied to population groups with different characteristics of transport demand and supply can be useful for preliminary analysis over the effects of travel budgets on accessibility. However, if the actual budget of time and money that people on each area of study are willing to spend on travelling to work is determined, researchers could have better resources to estimate their effect on accessibility, and be allowed to draw relevant conclusions about the disposition of individuals to sacrifice resources (as time or money) given the disparities of opportunities. This exercise could be the first step on the study of access inequity generated from an unequal distribution of activities or an insufficient supply of transport systems in some neighbourhoods. Therefore, the application of the model obtained from the first type of accessibility to the information gathered from declared preferences surveys conducted in each of the areas of study, seeks to establish the access level subject to the budgets of time and money defined by the inhabitants of each zone, which is defined as Desired Accessibility. Evaluation of transport policies
Our laboratory is Bogota transport system. In the year 2000, Transmilenio BRT system starts operation; a second phase is implemented in 2006, while a third phase should begin operation by the end of 2011. In ten years Transmilenio system will be carrying almost 30% of the public transport demand, almost 2 million trips per day. Transmilenio’s impact in terms of travel time savings has been important. Nevertheless, cost may have increased for some users. Considering the Accessibility approach, it is possible to estimate the improvement that Transmilenio has brought for population with different incomes, location and access to the system. This will be done for some of the zones served by the third phase of Transmilenio. As the fare may be a critical issue for a large part of the population served by Transmilenio, we also calculate the variation in accessibility brought by a subsidy policy.
Transport accessibility and social exclusion: a better way to evaluate public transport investment?
BOCAREJO, Juan; OVIEDO, Daniel
12th WCTR, July 11-15, 2010 – Lisbon, Portugal
12
RESULTS
In order to test our methodology we decided to analyze the different types of accessibility in different zones of Bogota.
Available information
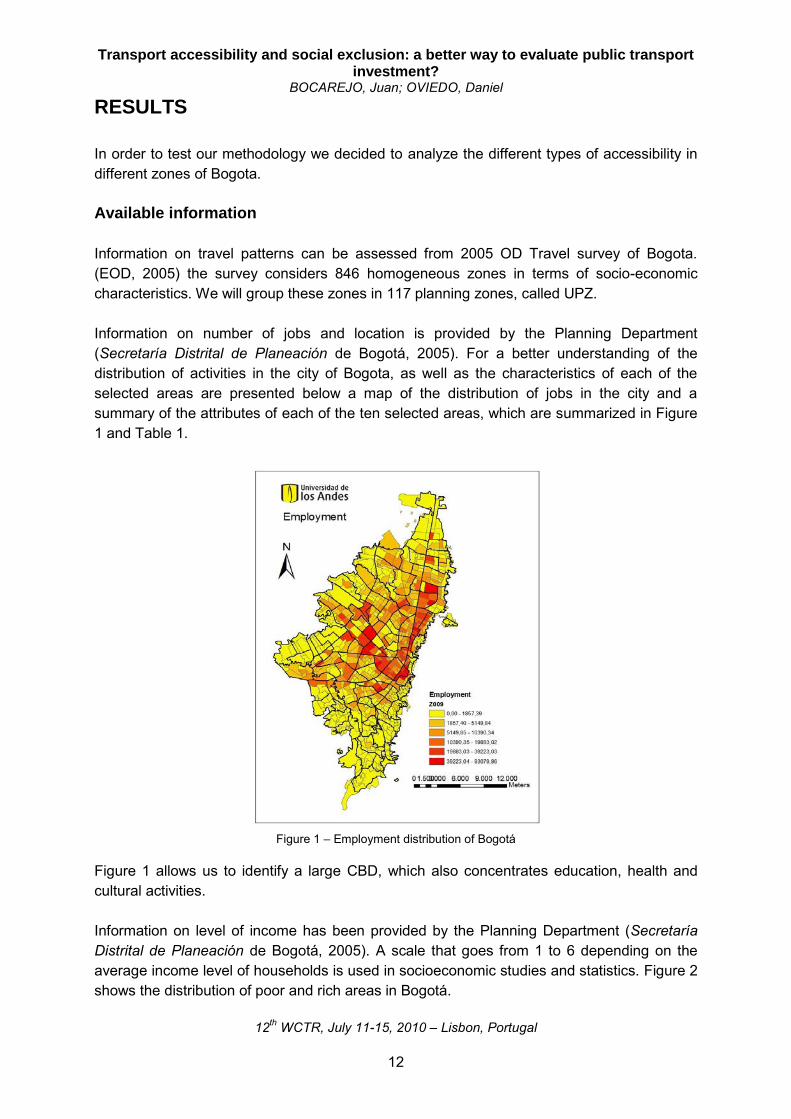
Information on travel patterns can be assessed from 2005 OD Travel survey of Bogota. (EOD, 2005) the survey considers 846 homogeneous zones in terms of socio-economic characteristics. We will group these zones in 117 planning zones, called UPZ. Information on number of jobs and location is provided by the Planning Department (Secretaría Distrital de Planeación de Bogotá, 2005). For a better understanding of the distribution of activities in the city of Bogota, as well as the characteristics of each of the selected areas are presented below a map of the distribution of jobs in the city and a summary of the attributes of each of the ten selected areas, which are summarized in Figure 1 and Table 1.
Figure 1 – Employment distribution of Bogotá
Figure 1 allows us to identify a large CBD, which also concentrates education, health and cultural activities. Information on level of income has been provided by the Planning Department (Secretaría Distrital de Planeación de Bogotá, 2005). A scale that goes from 1 to 6 depending on the average income level of households is used in socioeconomic studies and statistics. Figure 2 shows the distribution of poor and rich areas in Bogotá.

Transport accessibility and social exclusion: a better way to evaluate public transport investment?
BOCAREJO, Juan; OVIEDO, Daniel
12th WCTR, July 11-15, 2010 – Lisbon, Portugal
13
Figure 2 – Income distribution of Bogotá
It is possible to notice that high income population tends to settle close to CBD, while the poorest live at Bogota´s boundaries. Socio economic segregation is quite dramatic. Choice of study zones In order to evaluate real, standardized and desired accessibility, we have analyzed UPZs that have different characteristics, related to level of income, quality of transport system and location related to main work areas, as shown in Table 1. The following table briefly summarizes the characteristics of each of the areas chosen for the study and reflects the differences between each of them, showing that there are areas such as Lucero and Bosa Central which are not only located in a unfavorable place relative to the position of employment centers, but also have a fairly low income level. Also, some of the selected zones, despite their high income level, may also be affected in terms of accessibility because they are away from the city center. Similarly, some chosen areas as Bolivia, which have a medium purchase power, is considerably close to the main sources of employment and have a public transport service of good quality. An example of areas that contrast with all previous is Ciudad Salitre, which not only has high income but is very close to the major work centers in Bogota.

Transport accessibility and social exclusion: a better way to evaluate public transport investment? BOCAREJO, Juan; OVIEDO, Daniel
12th WCTR, July 11-15, 2010 – Lisbon, Portugal
14
Table 1– Main attributes of selected study zones
Zone
Income BRT Service Car ownership Distance to main job clusters Population density Job density Road density
High Medium Low Yes No High Medium Low High Medium Low High Medium Low High Medium Low High Medium Low
Bolivia x x x x x x X
Bosa Central X x x x x x X
Chicó Lago x x x x x x X
Ciudad Salitre x x x x x x X
Country Club x x x x x x X
El Rincón x x x x x x X
La Esmeralda x x x x x x X
Lucero X x x x x x X
San Blás X x x x x x X
Zona Franca x x x x x x X

Transport accessibility and social exclusion: a better way to evaluate public transport investment?
BOCAREJO, Juan; OVIEDO, Daniel
12th WCTR, July 11-15, 2010 – Lisbon, Portugal
15
Accessibility Estimation
Table 2 shows the main information obtained for each zone in terms of accessibility in number of work trips (Aj) per capita, average travel time and percentage of income used in transportation. The following are some initial facts that may be determined with this analysis: First, per capita real accessibility does not depend entirely on level of income. Even though lowest income areas tend to have lower real accessibility, some interesting exceptions can be identified. Accessibility in areas such as Country Club and Ciudad Salitre, the last one being in average of lower income, shows that location regarding employment and public transport availability can be determinant. With less time spent in commuting, Ciudad Salitre has the same accessibility as in Country Club. In contrast, some areas like El Rincón, despite being the ones that spend more time travelling to work, access to more employment than other zones with similar income level such as Bosa Central or Bolivia. Table 2– Real accessibility results
Zona Socioeconomic
class
Accessibility (Number of employment positions)
Accessibility per
inhabitant
Average Travel Time
Average percentage of income
El Rincón 2-3 148,238 0.86 68 15% Zona
Franca 2 35,704 0.87 54 21% Country
Club 5 27,860 1 50 4% Bosa
Central 2 93,713 0.53 60 24%
Bolivia 3 76,336 0.83 44.9 13%
Lucero 1-2 42,286 0.22 63.1 26%
Chico lago 5-6 28,363 0.99 36.9 3% La
esmeralda 4 24,249 0.85 39 5%
San Blás 1-2 43,279 0.62 59.4 27% Ciudad Salitre 4-5 23,997 1.1 38.5 6%

Transport accessibility and social exclusion: a better way to evaluate public transport investment?
BOCAREJO, Juan; OVIEDO, Daniel
12th WCTR, July 11-15, 2010 – Lisbon, Portugal
16
Second, according to the obtained results, the potential access for the observed conditions of supply and demand reveals a dilemma of inequality to access to opportunities of work. According to the needs and characteristics of various socioeconomic groups, which directly affects their chances to satisfy their main needs and access to better quality of life, as in the case of the areas of Bosa Central, Lucero and San Blas. Although the difference in time spent by the lower strata is greater than 48% compared to the upper strata, the most critical differences correspond to the percentage of income destined to travel that is 400% higher. In addition, some of these zones show some kind of resignation in terms of the amount of some attributes which generate that, in the case of mandatory travels, they are inclined to spend a lot more of what is expected, because of the need to earn a basic income. In some cases sacrifice “pays of” as more time spent allows a better accessibility as in the case of El Rincon. With poor transportation and location, their inhabitants have more access to work that middle income zones as they are spending almost 70 minutes per trip. Third, from the real accessibility results it can be inferred that, due to the geographic location of some areas and the unequal distribution of activities in the city of Bogotá, the trips generated, mainly those related to mandatory activities, require a higher travel time, resulting in a lower number of jobs accessible within a similar range of distance. Furthermore, the low purchase power, combined with inadequate transport and unfavourable location compared to job clusters make cases such as Lucero critical examples of access inequity to opportunities in the city. Due to a centralized distribution of activities and an imbalance in the opportunities, there is a willingness from certain individuals to sacrifice certain aspects like more time for other activities or money for other purposes, to access employment. Fourth, even though high income individuals have access to car in a larger proportion than middle income individuals, there is not a big difference in terms of time and money spent, and in terms of accessibility. Car use is not having a big impact in accessibility for the people in Bogota; a dense and congested city may in part explain this fact. As explained in previous sections, one of the main results of this research is the estimation of the parameters for the impedance function in each of the selected study areas. In this regard, the obtained equations according to the characteristics of transport supply and demand in each area studied are summarized below,
(5)
(6)
(7)
(8)

Transport accessibility and social exclusion: a better way to evaluate public transport investment?
BOCAREJO, Juan; OVIEDO, Daniel
12th WCTR, July 11-15, 2010 – Lisbon, Portugal
17
(9)
(10)
(11)
(12)
(13)
(14) As shown in the equations above, the coefficients vary sharply from one area to another depending on their income levels, location and supply of transport. For example, in the case of high-income areas such as Ciudad Salitre and Country Club, the value of the coefficient of money is quite low, while the coefficient of time is considerably high, reflecting the value given by the inhabitants of these areas to less time travel. Likewise, we see that the coefficients of middle-income areas as Bolivia and Zona Franca, which also are well located, both coefficients are similar and high compared with areas with the same income, as result of the additional value given to the proximity to centres of high labour supply. On the contrary, it appears that in zones as Bosa Central and Lucero, the coefficients are low for the time variable since individuals are willing to spend more time travelling for accessing to a job, while looking for a low monetary cost for their trips. Table 3. Declared travel time and Money budgets for each zone
Zone
Travel Budgets for work commutes
Time (Minutes) Money
(% of income)
El Rincón 40 17.0%
Zona Franca 44 26.0%
Country Club 43 12.0%
Bosa Central 43 18.0%
Bolivia 41 9.6%
Lucero 42 15.6%
Chico lago 35 6.5%
La esmeralda 36 7.7%
San Blás 40 11.3%
Ciudad Salitre 38 5.6%

Transport accessibility and social exclusion: a better way to evaluate public transport investment?
BOCAREJO, Juan; OVIEDO, Daniel
12th WCTR, July 11-15, 2010 – Lisbon, Portugal
18
Regarding desired expenditure in time and income, results show that: First, the time individuals would like to spend travelling to work is similar for all income levels and locations and it is close to 40 min with few exceptions that are more close to 35 minutes such as Ciudad Salitre, La Esmeralda and Chicó. These atypical cases can be explained in terms of spatial location relative to Employment centres because these zones are located on favourable places, have a higher income and also better access to transport systems than other zones. Regarding percentage of income they wish to spend in average 13% with marked variations depending on purchase power of each zone. Unusual budgets are identified following a similar explanation of the previous case. Second, difference between the desired condition and the real condition for individuals in Bogota is quite dramatic. The low income individuals spend 40% more time and 38% more money that they wish to do. In comparison middle income individuals spend 39% and wish to spend 5%; for higher income these percentages are 8% and -43%. This certainly is a way to measure transport quality and its impact on quality of life in cities. Third, considering the actual transport supply and cost as well as activity location of Bogota, spending a “desired” time travelling and expenditure would cause an important decrease in accessibility, mainly in lower income classes. In the case of Bosa Central we identified a tendency to tolerate higher travel costs because their income level is much lower than in other areas, and because unlike other areas, inhabitants of Bosa are willing to sacrifice their time in order to gain access to an opportunity to increase their income. In the case of El Rincon, geographic location has a significant impact that makes the inhabitants less willing to employ more time on travelling despite having a medium-low income level, which also affects the level of access under these restrictions. In the case of Zona Franca it is observed that despite having an income level similar to El Rincon, the percentage of their income employed in transport is not a significant restriction compared with those in the Mobility Survey. The time, on the other hand, generates a greater negative effect on this area showing less willingness to travel longer periods even for mandatory activities. The particular case of areas as Ciudad Salitre or La Esmeralda, which are well located and have a high income shows an evident disparity between people of different purchase power inside Bogotá that tends to give more benefits to the people that are able to sacrifice more, and forces people that don’t have required resources to move in acceptable lapses, to sacrifice more time and money than what they are willing to pay for accessing a Job. Table 4, shows the important decrease in accessibility if “international standards” of time spending and money expenditure were adopted by individuals. In the low income areas, the jobs accessible are close to none, while in the rich income areas the reduction of accessibility per capita is close to 15%.

Transport accessibility and social exclusion: a better way to evaluate public transport investment?
BOCAREJO, Juan; OVIEDO, Daniel
12th WCTR, July 11-15, 2010 – Lisbon, Portugal
19
Table 4– Desired accessibility results
Zone
Difference in Accessibility per inhabitant compared with real Accessibility
Time Restriction Monetary restriction Combined restriction
El Rincón -89% -69% -99%
Zona Franca -41% -11% -53%
Country Club -10% 0% -10%
Bosa Central -36% -79% -79%
Bolivia -53% -77% -94%
Lucero -84% -85% -100%
Chico lago -3% -2% -6%
La esmeralda -5% -27% -35%
San Blás -58% -96% -96%
Ciudad Salitre -13% -33% -40%
Table 5– Standardized accessibility results
Zone
Difference in Accessibility per inhabitant compared with real Accessibility
Time Restriction Monetary restriction Combined restriction
El Rincón -84% -85% -100%
Zona Franca -25% -70% -70%
Country Club -6% 0% -6%
Bosa Central -30% -79% -79%
Bolivia -42% -31% -63%
Lucero -80% -85% -100%
Chico lago -1% 0% -1%
La esmeralda -1% 0% -7%
San Blás -47% -96% -96%
Ciudad Salitre -5% 0% -8%
When analyzing the results obtained for applying “normal” restrictions of time and percentage of income used to mobilize, there is a drastic reduction in the percentage of jobs in the city accessible from each UPZ studied, and consequently, the potential access for Population in working age. When applying restrictions interchangeably, they observe a greater effect on certain areas over others for taking into account not only the specific characteristics, but also the assessment that is given in each of the different variables. In that sense, there is a smaller reduction as consequence of the temporal restriction in the study areas where geographic location or access to transport systems allows shorter trips, excluding only the most remote UPZ. In cases as Rincón, Bosa Central, or Lucero, as already mentioned, the geographical conditions are counterproductive, which for Bosa, Lucero and San Blás is even more serious if the access cost to inefficient transport systems it is taken into account. With respect to the monetary restriction, given the modal split observed in each zone, and the income level of the same, it is expected that in cases such as Ciudad Salitre, the restriction effect is negligible, while for others areas, belonging to medium-low and low socioeconomic

Transport accessibility and social exclusion: a better way to evaluate public transport investment?
BOCAREJO, Juan; OVIEDO, Daniel
12th WCTR, July 11-15, 2010 – Lisbon, Portugal
20
levels, the effect is excluding more remote areas, which usually require more transfers and therefore higher travel costs, and the effect in the number of jobs accessible to the population that is able to work is more dramatic. Evaluation of transport policies
One of the main objectives of this research is that the developed methodology can become a useful tool for planners and researchers in developing countries that can be applied for public policy planning and evaluation. In this regard, two types of transport initiatives, targeted to the variables considered in the accessibility model proposed, were evaluated in order to test the effectiveness of the methodology in terms of social impacts and equity assessment. Differenced fare system Because the estimation model developed for calculating accessibility takes into account the modal split of trips conducted in each zone, it is possible to slightly change the attributes of each mode to determine the effects of such variations on accessibility. Consequently, we carried out a study over the effects of a differentiated fare system, developed according to socioeconomic classification and purchase power, in areas currently served by the system that differ in their socio-economic characteristics and proximity to workplaces. The main characteristics of these areas are summarized below, as well as their estimated level of accessibility according to the model. We selected two areas of upper and two of lower class in order to compare costs and benefits for the inhabitants of each, considering that low socioeconomic areas are in unfavorable locations to access working positions. The first two zones are characterized for conducting most of their trips on private vehicle while the other zones make the major part of their daily commutes on public transport. Consequently, the people of the third and fourth zone have no other choice for traveling to work, taking in account the system design, becoming captive demand.
Table 6– Evaluation zones and real accessibility results
Zone Modal share of Transmilenio
Socioeconomic Classification
Income percentage
employed by Transmilenio
users
Real Accessibility
(Employments per inhabitant)
Chicó Lago 12% 5 1.31% 0.99 Country Club 18% 5 1.33% 1.01 Gran Yomasa 18% 2 15.0% 0.42
Lucero 11% 2 18.0% 0.22 The adopted fare system corresponds to an estimation made in 2008 that sought to define a value according to the income of each population layer without threatening the financial

Transport accessibility and social exclusion: a better way to evaluate public transport investment?
BOCAREJO, Juan; OVIEDO, Daniel
12th WCTR, July 11-15, 2010 – Lisbon, Portugal
21
sustainability of the system (Scorcia & Bocarejo, 2008). Results of the fare change rate obtained in the mentioned research are summarized in table 7.
Table 7– Proposed changes on fare system for Transmilenio
Proposed fare system Socieoconomic
Class Fare change 1 and 2 -23%
3 0% 4, 5 and 6 14%
As well as in many public transport systems, Transmilenio’s fare scheme is calculated in order to pay the entire operational costs from the ticket. The technical price for accessing the system is supposed to cover the costs of trunk lines, feeder system, fare collection, trusteeship, and management. With respect to this, is necessary to clarify that in the case of an inappropriate change in the costs for each demand layer, the resultant change may risk the financial sustainability of the system. The proposed charging design of Transmilenio is based on a cross subsidy system, as well as the existing one. Therefore, the proposed changes in the fare system takes into account the purchase power of each socioeconomic class and the elasticity of the demand to the price for each demand layer, reducing the negative financial impact on the system. The estimated costs changes for the system were applied to each evaluated zone considering their purchase power and existing demand for each transport mode, which should reflect demand changes due to the respective increase and reduction of Transmilenio´s costs. Yet, for the purpose of this exercise, the modal split was not changed in spite of fare modifications in order to address only the immediate changes on accessibility for testing the effectiveness of the evaluation tool. The proposed change in the price is based on a greater elasticity for low-income population, which would benefit significantly by reducing costs; as well as the fact that the elasticity in the upper classes with respect to changes in the price of public transport would make the impact on demand lower.
Table 8– Accessibility results applying changes on travel costs due to new fare system
Zone
Percentage income
employed by Transmilenio
users Resultant
Accessibility Accessibility
Number of additional
employments accessed
Chicó Lago 1.50% 0.96 -2.8% -802
Country Club 1.53% 0.99 -2.3% -633 Gran
Yomasa 11% 0.50 8.1% 7,936
Lucero 14% 0.28 5.8% 11,121
It can be seen from the results of accessibility for the new price system that target areas obtained significant reductions in travel costs, achieving savings between 2% and 3% for

Transport accessibility and social exclusion: a better way to evaluate public transport investment?
BOCAREJO, Juan; OVIEDO, Daniel
12th WCTR, July 11-15, 2010 – Lisbon, Portugal
22
low-income groups and only an increase of 1% for higher-income areas. In addition, contrasting to these low changes in travel costs it can be seen that the benefits individual and zonal accessibility in areas like Gran Yomasa and Lucero are considerable while the losses in the other zones are negligible both in absolute and relative terms. A cross subsidy policy could generate benefits in terms of equity in cities as Bogotá, which are reflected in better accessibility to work opportunities. However, if the price changes would not involve an increase in fares for the richer population, benefits in terms of access might be greater. Nonetheless, the increasing operative costs and reducing revenues could attempt against the self-financing stability of Transmilenio. Evaluation of a new BRT line The BRT bus system of the city of Bogotá called TransMilenio, has been expanded considerably in recent years, providing better mobility conditions to most of the inhabitants of the city. As part of its expansion, Transmilenio’s third Phase aims to develop a new bus corridor that will connect the north and south of the city on its east side, attending mostly low-income households in the southern part. In the Third Phase, certain benefits of the new system compared to traditional public transport are recognized in terms of commercial speed that will increase from the current 15 km/h to approximately 24 km/h, which will reduce travel times and also generate a demand transfer from the traditional public transport.
Table 9– Attributes of the new BRT line compared to the existing public transport system
BRT characteristics compared to the existing public transport service
Speed Increase (km/h) 9.2 Fare Change (% increase) 15%
Expected attracted demand from present public transport system 50% Two adjacent areas to the new BRT corridor have been analysed. The main objective, similarly to the previous exercise, is to estimate the combined effects of travel time savings and fare changes over accessibility in order to test the evaluation tool in a more complex context. As explained in previous sections, the accessibility estimation model uses the existing modal split in every zone for work travels to calculate the weighted average of travel times and costs for all O-D Pairs. Therefore, the proposed changes on demand, speed and cost will be reflected on the calculated accessibility for each zone, allowing a comparative analysis of the new access level due to the effect of the new system against the scenario without project. The selected evaluation zones were selected in order to reflect accessibility changes under similar purchase power restrictions and proximity to the CBD. Each zone is situated adjacent to the new line. However, the difference on the present accessibility between the two zones

Transport accessibility and social exclusion: a better way to evaluate public transport investment?
BOCAREJO, Juan; OVIEDO, Daniel
12th WCTR, July 11-15, 2010 – Lisbon, Portugal
23
is considerable, which leads to infer different access to transport and elevated walking times or trips made on foot. Table 10 summarizes the main characteristics of each zone.
Table 10– Evaluation zones and real accessibility results
Zone Socioeconomic Classification
Average travel time to work
Average percentage of income destined
to commuting Real Accessibility
per inhabitant 20 de julio 2 46.90 24.1% 0.33 Las cruces 2 57.2 20.0% 0.68 Transmilenio’s new phase impacts accessibility positively, for the two zones analysed, as the increase in speed has a greater effect than the rise of fares. Nevertheless, a higher increase in tariffs or a less efficient system could produce a negative impact on accessibility. In order to explain these results, is necessary to consider the modal Split of each zone; both of them characterized for having an important portion of total daily trips made on foot (approximately 23%). This trip behavior can be explained based on the low income level of the study areas and their proximity to the CBD. In addition, the described modal split affects directly the results in terms of accessibility because of the increased fare costs of the BRT system. This factor prevents a greater demand attraction for the new system due to the impossibility to pay the new fare for almost a quarter of the population.
Table 11– Accessibility changes due to the new BRT line
Zone
Average Time savings
per trip (minutes)
Increase in Percentage of
Income destined to commuting
Accessibility per inhabitant
Number of additional
employments accessed
20 de julio -3.10 1% 4.5% 800
Las cruces -3.30 1% 3.3% 3295
As seen, there is a slight increase in the accessibility of each of the study areas, given the modal split, and their locations close to employment centres which generate the possibility of an increased number of walking trips. In that sense, we conclude that, given an important increase of travel speed for a greater share of existing public transport users, it is possible to obtain major benefits in terms of accessibility than the decrease in accessibility generated as result of the price raise for those users. It can be inferred that the estimated accessibility detriment produced by the higher cost of the new system proved to be less likely to adversely affect the total accessibility of each area to the extent that, under the proposed situation, time savings are more profitable than the number of additional jobs that can be lost due to the increase in costs. Transmilenio’s effect on commuting efficiency in terms of speed and reduced travel times is very positive even for zones that value more transport systems costs as shown on the calculations made on this section. Therefore, if improvements in public transport system as Transmilenio’s were

Transport accessibility and social exclusion: a better way to evaluate public transport investment?
BOCAREJO, Juan; OVIEDO, Daniel
12th WCTR, July 11-15, 2010 – Lisbon, Portugal
24
combined with a fare policy as the evaluated in the previous section, benefit in terms of accessibility for low-income areas of cities as Bogotá could be enormous.
WORK IN PROGRESS
The present research stills in progress. Some of the work that is being developed includes:
- Accessibility generated by different modes, in different income level zones - Differential accessibility related to gender - More complex definition of impedance function f(ij). - A more comprehensive analysis of transport policy impacts
This model could be used afterwards in evaluating the impact of differential accessibility on equity and social exclusion. It can also be apprehended to produce analysis regarding economic impact. The purpose of the research is to develop a useful tool for transportation planning processes in developing countries and evaluation of existing policies. Therefore, it is expected that the tool can be used in the future for the assessment of accessibility benefits of expanding and existing projects as Transmilenio and also benefit analysis of proposed policies as the first line of a metro system for the city, subsidy schemes for public transportation, or new land use developments.
REFERENCES
Banister, D., Berechman, J., (2000). Transport Investment and Economics Development. University College London Press, London Ben-Akiva, M., Lerman, S.R., (1979). Disaggregate travel and mobilitychoice models and measures of accessibility. In: Hensher, D.A., Ben-Akiva, M., Lerman, S.R., (1985). Discrete Choice Analysis. MIT Press, Cambridge, MA. Bruinsma, F., Rietveld, P., 1998. The accessibility of European cities; theoretical framework and comparison of approached. Environment and Planning A 30, 499–521. Burns, L.D., (1979). Transportation, Temporal and Spatial Components of Accessibility. Lexington Books, Lexington/Toronto. Dalvi, M.Q., Martin, K.M., (1976). The measurement of accessibility: some preliminary results. Transportation 5, 17–42. Geurs, K.T., Ritsema van Eck, J.R., (2001). Accessibility measures: review and applications. RIVM report 408505 006, National Institute of Public Health and the Environment, Bilthoven. Geurs, K.T., Ritsema van Eck, J.R., (2003). Accessibility evaluation of land-use scenarios: the impact of job competition land-use and infrastructure developments for the Netherlands. Environment and Planning B 30 (1), 69–87.

Transport accessibility and social exclusion: a better way to evaluate public transport investment?
BOCAREJO, Juan; OVIEDO, Daniel
12th WCTR, July 11-15, 2010 – Lisbon, Portugal
25
Geurs, K.T, Van Wee, B., (2004). Accessibility evaluation of land-use and transport strategies: review and research directions. Journal of Transport Geography 12, 127–140. Gutierrez, J., Urbano, P., (1996). Accessibility in the European Union: the impact of the Trans-European road network. Journal of Transport Geography 4 (1), 15–25. Halden. D., (2002), Using accessibility measures to integrate land use and transport policy in Edinburgh and the Lothians. Transport Policy 9 313–324 Hansen. W., (1959), How accessibilitv shapes land use. Journal of the American institute of Planners. Linneker, B.J., Spence, N.A., (1992). Accessibility measures compared in an analysis of the impact of the M25 London orbital motorway on Britain. Environment and Planning A 24, 1 Martınez, F.J., (1995). Access: the transport-land use economic link. Transportation Research Part B 29 (6), 457–470. Scorcia, Y. S., Bocarejo, J.P., (2008), Análisis de la implementación de una tarifa en Transmilenio en algunos sectores de Bogotá, Universidad de los Andes. Scottish Executive, (2000ª). Review of Accessibility Analysis Techniques. Derek Halden Consultancy for the Scottish Executive Central Research Unit, Edinburgh. Scottish Executive, (2000b). Guidance on Accessibility Measuring Techniques. Derek Halden Consultancy for the Scottish Executive Central Research Unit, Edinburgh. Secretaría Distrital de Planeación, Monografías de localidades, recovered on may 2009 from http//: www.sdp.gov.co Sopher, P.R. (Eds.), Behavioural Travel Modelling. Croom Helm, Andover, Hants, p. 654–679. Van Wee, B., Hagoort, M., Annema, J.A., (2001). Accessibility measures with competition. Journal of Transport geography 9, 199–208. Vickerman, (1995). Location, Accessibility and Regional Development. The Appraisal of Trans European Networks. Transport Policy. Williams, H.C.W.L., Senior, M.L., (1978). Accessibility spatial interaction and the spatial benefit analysis of land use––transportation plans. In: Karlquist, A. (Ed.), Spatial Interaction Theory and Planning Models. North-Holland, Amsterdam. Wilson, A.G., (1998). Land- use/ transport interaction models. Past and future. Journal of Transport Economics and Policy 32, 3–26.