Transpacific FY14 Results Presentation For personal use only · For personal use only Presentation...
32
Robert Boucher – CEO Stewart Cummins – CFO 19 August 2014 Transpacific FY14 Results Presentation For personal use only
Transcript of Transpacific FY14 Results Presentation For personal use only · For personal use only Presentation...

Robert Boucher – CEO
Stewart Cummins – CFO
19 August 2014
Transpacific FY14 Results Presentation
For
per
sona
l use
onl
y
2
Forward looking statements - This presentation contains certain forward-looking statements, including with respect to the financial condition, results of operations and
businesses of Transpacific Industries Group Ltd (“TPI”) and certain plans and objectives of the management of TPI. Forward-looking statements can generally be
identified by the use of words including but not limited to ‘project’, ‘foresee’, ‘plan’, ‘guidance’, ‘expect’, ‘aim’, ‘intend’, ‘anticipate’, ‘believe’, ‘estimate’, ‘may’, ‘should’, ‘will’
or similar expressions. All such forward-looking statements involve known and unknown risks, significant uncertainties, assumptions, contingencies and other factors,
many of which are outside the control of TPI, which may cause the actual results or performance of TPI to be materially different from any future results or performance
expressed or implied by such forward-looking statements. Such forward-looking statements apply only as of the date of this presentation.
Factors that could cause actual results or performance to differ materially include without limitation the following: risks and uncertainties associated with the Australian
and global economic environment and capital market conditions, the cyclical nature of the various industries, the level of activity in Australian construction, manufacturing,
mining, agricultural and automotive industries, commodity price fluctuations, fluctuation in foreign currency exchange and interest rates, competition, TPI’s relationships
with, and the financial condition of, its suppliers and customers, legislative changes, regulatory changes or other changes in the laws which affect TPI’s business,
including environmental and taxation laws, and operational risks. The foregoing list of important factors and risks is not exhaustive.
To the fullest extent permitted by law, no representation or warranty (express or implied) is given or made by any person (including TPI) in relation to the accuracy or
completeness of all or any part of this presentation, or any constituent or associated presentation, information or material (collectively, the Information) or the accuracy or
completeness or likelihood of achievement or reasonableness of any forward looking statements or the assumptions on which any forward looking statements are based.
TPI does not accept responsibility or liability arising in any way for errors in, omissions from, or information contained in this presentation.
The Information may include information derived from public or third party sources that has not been independently verified.
TPI disclaims any obligation or undertaking to release any updates or revisions to the Information to reflect any new information or change in expectations or
assumptions, except as required by applicable law.
Investment decisions - Nothing contained in the Information constitutes investment, legal, tax or other advice. The Information does not take into account the investment
objectives, financial situation or particular needs of any investor, potential investor or any other person. You should take independent professional advice before making
any investment decision.
Financial year results information - This presentation contains summary information that should be read in conjunction with TPI's Financial Reports for the financial
year ended 30 June 2014.
All amounts are in Australian dollars unless otherwise stated. A number of figures in the tables and charts in the presentation pages have been rounded to one decimal
place. Percentages (%) have been calculated on actual whole figures.
Underlying earnings are categorised as non-IFRS financial information and therefore have been presented in compliance with ASIC Regulatory Guide 230 – Disclosing
non-IFRS information, issued in December 2011. Refer to TPI’s Directors’ Report for the definition of “Underlying earnings”. The term EBITDA represents earnings before
interest, income tax, and depreciation and amortisation expense and the term EBIT represents earnings before interest and income tax expense.
This presentation has not been subject to review or audit except as noted on pages 19.
Transpacific 2014 Financial Year Results - Disclaimer
For
per
sona
l use
onl
y

3
Transpacific 2014 Financial Year Results Agenda
Achievements
Financial Management
Capital Structure
Q&A
Appendices
Landfill Rectification and Remediation Review
Robert Boucher, CEO
Strategy Update Robert Boucher, CEO
Financial Summary and Overview
Underlying AdjustmentsStewart Cummins, CFO
Closing Comments and FY15 Outlook
Divisional Underlying Results
For
per
sona
l use
onl
y

4
Transpacific 2014 Financial Year Results Achievements
Safety Total recordable injury frequency rate reduced by 33% from 15.5 to 10.4
Divestment program
Successfully completed divestment program: $885 million gross proceeds from New Zealand business $219 million gross proceeds from Commercial Vehicles Group $32 million gross proceeds from 39 non-core businesses and sale of surplus properties
Debt reduction
$1,059 million of debt, finance leases and interest rate hedges repaid $137 million net cash position at 30 June 2014 $400 million of syndicated debt refinanced with improved pricing $40 million reduction in underlying net interest expense
Dividend Board policy to pay regular dividends of 50-75% of underlying NPAT 1.5 cents per share, fully franked, payment date 8 October 2014
Operational
Soft results from Cleanaway and Industrials Increase to landfill rectification and remediation provisions $20 million cost savings target achieved but more than offset by weakness from operational
performance
For
per
sona
l use
onl
y

5
Transpacific 2014 Financial Year Results Financial Summary and Overview
Statutory results
Total revenue of $1,889 million Profit after income tax attributable to ordinary equity holders of $11.5 million Earnings per share 0.7 cents
Trading conditions
Trading conditions remain difficult, particularly in the Queensland and West Australian markets as mining related activity declines and weakness in the Manufacturing and Industrial sectors continue
Significant items
(after tax)
Totalled $81 million net loss: $172 million gain on disposal of Commercial Vehicles and New Zealand $189 million one-off charge arising from Landfill Remediation Review $64 million related to write off of establishment costs associated with former debt
facilities ($12 million), onerous lease provisions ($8 million) and other items ($44 million)
Underlying results
(compared to FY13)
EBITDA of $383.2 million, down 7.0% EBIT of $214.9 million, down 5.1% Profit after income tax attributable to ordinary equity holders $92.0 million, up 35.5% Earnings per share 5.8 cents, up 34.8%
For
per
sona
l use
onl
y

6
Transpacific 2014 Financial Year Results Landfill Rectification and Remediation Review
Background
Concerned that we were not achieving best practice standards in relation to a number of landfill sites
Appointed Civil & Environmental Consultants, Inc., a specialist US landfill engineering firm, to conduct an evaluation
The purpose of the evaluation was to:
1. Assess the current conditions of all landfill facilities
2. Provide recommendations to mitigate potential future issues and achieve best practice
3. Provide estimates of financial resources needed to meet the recommendations
For
per
sona
l use
onl
y

7
Transpacific 2014 Financial Year Results Landfill Rectification and Remediation Review (cont’d)
Profit impact(after tax) A one-off significant charge of $189 million
Why the provision has
been increased
Rectify historic operational issues and defects largely around leachate and gas management Reflect a fuller engineering scope of work for remediation activities and current costs for
capping, particularly at the Clayton VIC sites which are due to close over the next 1 to 3 years Provide contingency in all cost estimates for inherent uncertainties
Cash flow
An extra $125-175 million of cash spend (pre-tax) over the next 5 years to: Rectify historic operational issues at all landfills ($50-69 million) Complete the capping of the Clayton landfills due to close by 2017 ($65-82 million) Various closure and post-closure works at non-Clayton landfills ($10-24 million)
Balance Sheet impact
Landfill related provisions now total $347 million and represent estimated future discounted cash flow impacts over the next 30 to 50 years
For
per
sona
l use
onl
y

8
Transpacific 2014 Financial Year Results Landfill Rectification and Remediation Review (cont’d)
Operating Landfills Type Year Opened Estimated Years Left
Erskine Park, NSW Inert 1994 3
Clayton, VIC – 3 sites Putrescible/Inert Between 1987 and 2001 1 to 2.5
New Chum, QLD Inert 1998 10
Banksia, WA Putrescible 2000 >25
Inkerman/Nuriootpa, SA Putrescible 1998 and 2005 25 to 50+
Closed Landfills Type Year Opened Estimated Years Left
Clayton, VIC – 4 sites Putrescible/Inert Between 1987 and 2001 n/a
Tullamarine, VIC Prescribed 1972 n/a
Old Geelong, VIC Putrescible 1990 n/a
For
per
sona
l use
onl
y

9
Transpacific 2014 Financial Year Results Key Highlights of Underlying Results (1)
Australian Waste Management Revenue
$1,409.7m Down 3.3%
AustralianWaste ManagementUnderlying EBITDA
$272.5m Down 7.8%
Australian Waste Management Underlying EBIT
$138.3m Down 3.4%
Note 1: All comparisons against previous corresponding period. Refer to page 20 for reconciliation from statutory profit to underlying profit
Note 2: Normalised for working capital release on divestment of Commercial Vehicles Group and underlying adjustments
Note 3: Net debt following repayment of $250 million in Step-up Securities in September 2014
Underlying OperatingCash Flow(2)
$265.4m Down 9.0%
Net Debt(3)
(Pro forma)
~$115m
Underlying Net InterestExpense
$76.7m Down $39.6m
For
per
sona
l use
onl
y

10
Transpacific 2014 Financial Year Results Divisional Underlying Results
Note: Segments divested - Commercial Vehicles on 30 August 2013- Manufacturing on 30 June 2014- New Zealand on 30 June 2014
A$ million
FY14 FY13 % change FY14 FY13 % change FY14 FY13 % change
Cleanaway 911.8 924.7 -1.4% 189.8 194.2 -2.3% 98.8 92.4 6.9%
Industrials 485.0 523.6 -7.4% 90.1 107.4 -16.1% 60.7 75.0 -19.0%
Associates - - - 1.7 1.0 68.9% 1.7 1.0 68.9%
Corporate & other 12.9 9.1 42.2% (9.1) (7.1) -28.1% (22.9) (25.3) 9.5%
Total Australian Waste Management 1,409.7 1,457.4 -3.3% 272.5 295.5 -7.8% 138.3 143.1 -3.4%
Segments divested
Commercial Vehicles 75.7 445.8 5.3 35.8 5.1 34.6
Manufacturing 11.6 37.6 0.5 (2.2) 0.5 (2.2)
New Zealand incl associates (NZ$) 432.9 437.9 -1.1% 115.9 103.7 11.8% 78.4 63.6 23.3%
New Zealand incl associates (A$) 390.3 351.0 11.2% 104.9 83.1 26.2% 71.0 51.0 39.2%
Other 1.3 2.2 -40.9% - - - - - -
Total segments divested 478.9 836.6 -42.8% 110.7 116.7 -5.1% 76.6 83.4 -8.1%
Total Group 1,888.6 2,294.0 -17.7% 383.2 412.2 -7.0% 214.9 226.5 -5.1%
Revenue EBITDA EBIT
For
per
sona
l use
onl
y

11
Transpacific 2014 Financial Year Results Australian Waste Management Underlying Results FY13 to FY14
Divisional FY13 to FY14 change
Cleanaway Collections impacted by weaker volumes in 2H14
Technical Services hazardous liquid waste volumes down 6%
Hydrocarbon waste oil collection volumes down 4.1% as competition and rebates paid to customers increased
(2.9)(1.5)
-12500000
-10500000
-8500000
-6500000
-4500000
-2500000
-500000
1500000
A$
EB
ITD
A
Cleanaway
Collections Post Collections
(5.3)
(0.2)
(11.8)
(12.5)
(10.5)
(8.5)
(6.5)
(4.5)
(2.5)
(0.5)
1.5
A$
EB
ITD
A
Industrials
Hydrocarbons
EMR
Technical Services
295.5
272.5
(4.4)(17.3)
(1.3)
200
220
240
260
280
300
320
FY13 Underlying EBITDA CWY IND Corp & Assoc. FY14 Underlying EBITDA
A$
m
Australian Waste Management EBITDA Bridge FY13 to FY14
189.3
For
per
sona
l use
onl
y

12
Transpacific 2014 Financial Year Results Cleanaway
*Represent Underlying results
Collections revenue (Commercial & Industrial and Municipal) up 1.4% on last year
Post Collections volumes down 10%
Remediation amortisation down $7.9 million due to decreased Post Collections volumes
A$ million FY14 2H14 1H14 FY13 FY14 v FY13
Commercial & Industrial 603.8 294.6 309.2 589.9 2.4%
Municipal 197.1 96.6 100.5 199.0 -1.0%
Post Collections (excl levies and carbon tax) 125.3 61.5 63.8 135.5 -7.6%
Levies and carbon tax 62.9 29.2 33.7 79.9 -21.3%
Total Cleanaway Revenue 989.1 481.9 507.2 1,004.4 -1.5%
Less Intercompany (77.3) (37.8) (39.5) (79.7) -2.9%
Net Cleanaway Revenue 911.8 444.1 467.7 924.7 -1.4%
Net Cleanaway Revenue (excl levies and carbon tax) 848.9 414.9 434.0 844.8 0.5%
EBITDA* 189.8 91.2 98.6 194.2 -2.3%
EBITDA Margin (excl levies and carbon tax)* 22.4% 22.0% 22.7% 23.0%
EBIT* 98.8 48.0 50.8 92.4 7.0%
EBIT Margin (excl levies and carbon tax)* 11.6% 11.6% 11.7% 10.9%
424.8 420.0434.0
414.9
40.2 39.7 33.729.2
22.8% 23.2% 22.7% 22.0%
10.8% 11.0% 11.7% 11.6%
40.0
90.0
140.0
190.0
240.0
290.0
340.0
390.0
440.0
490.0
1H13 2H13 1H14 2H14
Revenue Levies and carbon tax
EBITDA Margin EBIT Margin
Financial Performance (A$m)
For
per
sona
l use
onl
y
13
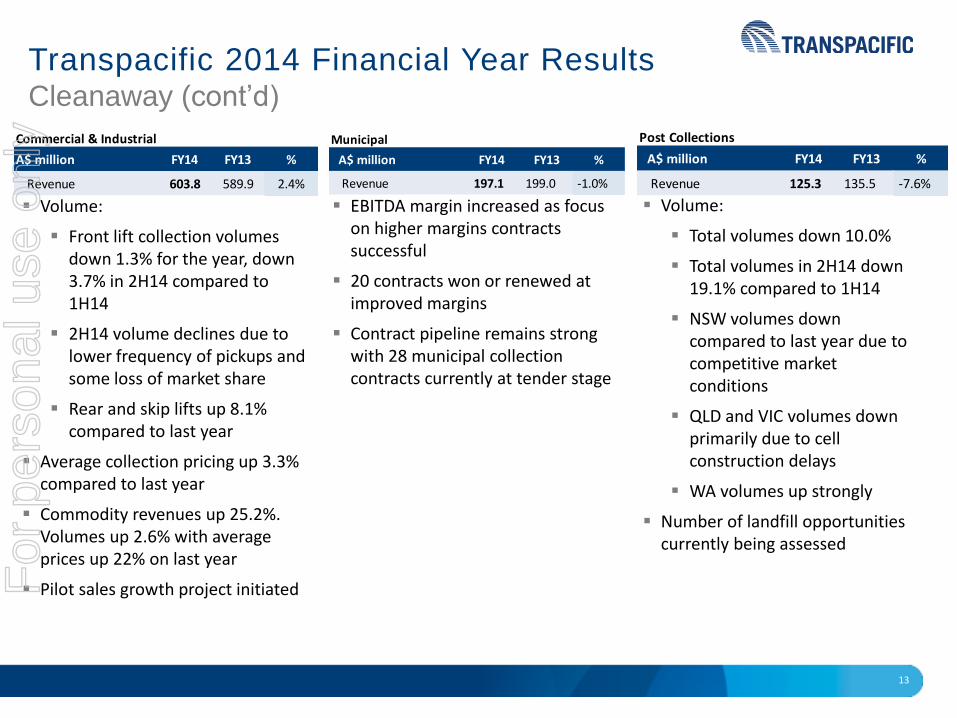
Transpacific 2014 Financial Year Results Cleanaway (cont’d)
Volume:
Front lift collection volumes down 1.3% for the year, down 3.7% in 2H14 compared to 1H14
2H14 volume declines due to lower frequency of pickups and some loss of market share
Rear and skip lifts up 8.1% compared to last year
Average collection pricing up 3.3% compared to last year
Commodity revenues up 25.2%. Volumes up 2.6% with average prices up 22% on last year
Pilot sales growth project initiated
EBITDA margin increased as focus on higher margins contracts successful
20 contracts won or renewed at improved margins
Contract pipeline remains strong with 28 municipal collection contracts currently at tender stage
Volume:
Total volumes down 10.0%
Total volumes in 2H14 down 19.1% compared to 1H14
NSW volumes down compared to last year due to competitive market conditions
QLD and VIC volumes down primarily due to cell construction delays
WA volumes up strongly
Number of landfill opportunities currently being assessed
Commercial & Industrial
A$ million FY14 FY13 %
Revenue 603.8 589.9 2.4%
Municipal
A$ million FY14 FY13 %
Revenue 197.1 199.0 -1.0%
Post Collections
A$ million FY14 FY13 %
Revenue 125.3 135.5 -7.6%
For
per
sona
l use
onl
y

14
Transpacific 2014 Financial Year Results Industrials
Note: The sub-segments of the Industrials Division have been restructured. The previous sub-segment known as Industrial Solutions has
now been replaced by a sub-segment titled Energy, Minerals and Remediation (EMR). Refer to Appendix 6 for detailed historical results.
Demand from the manufacturing and industrial sectors remained weak during the year
Technical Services earnings impacted by reduced liquid volumes
Hydrocarbons experiencing increased competition for waste oil collections
*Represent Underlying results
271.0252.6 246.9
238.1
21.9%19.1% 18.1% 19.0%
15.7%12.8% 12.3% 12.8%
0.0%
5.0%
10.0%
15.0%
20.0%
25.0%
30.0%
35.0%
40.0%
40.0
90.0
140.0
190.0
240.0
290.0
1H13 2H13 1H14 2H14
Revenue EBITDA Margin* EBIT Margin*
Financial Performance (A$m)
A$ million FY14 2H14 1H14 FY13 FY14 v FY13 2H14 v 1H14
Revenue 485.0 238.1 246.9 523.6 -7.4% -3.6%
EBITDA* 90.1 45.3 44.8 107.4 -16.1% 1.2%
EBITDA Margin* 18.6% 19.0% 18.1% 20.5%
EBIT* 60.7 30.4 30.3 75.0 -19.0% 0.5%
EBIT Margin* 12.5% 12.8% 12.3% 14.3%
For
per
sona
l use
onl
y

15
Transpacific 2014 Financial Year Results Industrials
Total liquid processing volumes down 7.3% compared to last year
Higher margin hazardous liquid volumes down 6% reflecting continued weakness in manufacturing and industrial markets
Industrial services revenues increased as demand for remediation and project work improved in metropolitan areas
Oil refinery conversion work will increase liquid processing volumes in FY15
Slight improvement in shut down work seen in 2H14
Emergency response work remains low
Contract for refinery conversion work commenced late FY14, will continue into FY15
Continuing to build competitive market position in Oil & Gas sector
*Represent Underlying results
Collection volumes down 4.1% on last year and down 4.7% in 2H14 compared to 1H14, reflecting greater competition for waste oil
Export sales volumes down significantly
Rebates payable on collection volumes increased
Margins impacted by higher proportion of domestic sales compared to export sales and extended shutdown at Wetherill Park refinery in 1H14
Technical Services
A$ million FY14 FY13 FY14 v FY13
Revenue 218.9 221.6 -1.2%
EBITDA* 34.4 39.7 -13.4%
EBITDA Margin* 15.7% 17.9%
EBIT* 21.8 25.8 -15.4%
EBIT Margin* 10.0% 11.6%
Energy, Minerals and Remediation
A$ million FY14 FY13 FY14 v FY13
Revenue 115.6 130.4 -11.3%
EBITDA* 16.7 16.9 -1.2%
EBITDA Margin* 14.4% 13.0%
EBIT* 10.5 9.3 12.7%
EBIT Margin* 9.1% 7.1%
Hydrocarbons
A$ million FY14 FY13 FY14 v FY13
Revenue 150.5 171.6 -12.3%
EBITDA* 39.0 50.8 -23.1%
EBITDA Margin* 25.9% 29.6%
EBIT* 28.4 39.9 -28.8%
EBIT Margin* 18.9% 23.2%
For
per
sona
l use
onl
y

16
Transpacific 2014 Financial Year Results New Zealand
*Represent Underlying results
Market conditions improved in key markets of Auckland and Christchurch
New Municipal contracts in Auckland and Christchurch rebuild continued to drive growth
2H14 margins benefited from divestments in 1H14
The business was sold on 30 June 2014 for NZ$950 million
NZ$ million FY14 2H14 1H14 FY13 FY14 v FY13 2H14 v 1H14
Revenue 432.9 206.9 226.0 437.9 -1.1% -8.4%
EBITDA* 115.9 59.4 56.5 103.7 11.8% 5.2%
EBITDA Margin* 26.8% 28.7% 25.0% 23.7% 13.1% 14.9%
EBIT* 78.4 40.1 38.3 63.6 23.3% 4.8%
EBIT Margin* 18.1% 19.4% 16.9% 14.5% 24.7% 14.4%
215.4222.5 226.0
206.9
13.8%15.2%
16.9% 19.4%
23.2% 24.1% 25.0%
28.7%
0.0%
5.0%
10.0%
15.0%
20.0%
25.0%
30.0%
35.0%
40.0%
45.0%
40.0
90.0
140.0
190.0
240.0
1H13 2H13 1H14 2H14
Revenue EBIT Margin* EBITDA Margin*
Financial Performance (NZ$m)
For
per
sona
l use
onl
y

17
Transpacific 2014 Financial Year Results Key Highlights – Financial Management
Capital
structure
Divestment program
Completed debt reduction – net cash position of $137 million at 30 June 2014
Net interest expense down by $39.6 million or 34%
$400 million of syndicated debt refinanced with improved pricing
$250 million Step-up Preference Securities to be redeemed in September 2014
Operatingcash flow
Statutory operating cash flow of $223.5 million
Including Commercial Vehicles cash flow to date of sale, operating cash flow was $235.2 million
Working capital to sales ratio(1) reduced to 3.2% (pcp: 8.0%). Business mix will reduce working capital intensity going forward
Successfully completed divestment program: $885 million gross proceeds from New Zealand business $219 million gross proceeds from Commercial Vehicles Group $32 million gross proceeds from 39 non-core businesses and sale of surplus properties
Note 1: Current trade receivables plus inventories less current creditors divided by revenue from continuing operations for the twelve months to 30 June 2014
Dividend 1.5 cents per share, fully franked
Book close on 29 August 2014 with payment date of 8 October 2014
Intention to pay regular dividends of 50-75% of underlying NPAT (subject to Board policy)
For
per
sona
l use
onl
y

18
Transpacific 2014 Financial Year Results Group Income Statement – Statutory and Underlying Results
A$ million
%
FY14 FY13 FY14 FY13 FY14 FY13 change
Revenue from total waste management 1,409.7 1,457.4 - - 1,409.7 1,457.4 -3.3%
Revenue from businesses disposed 478.9 836.6 - - 478.9 836.6 -42.8%
Total revenue 1,888.6 2,294.0 - - 1,888.6 2,294.0 -17.7%
Share of profits in associates 1.7 1.0 - - 1.7 1.0 68.9%
Expenses (net of other income) (1,760.3) (2,232.2) 253.2 349.4 (1,507.1) (1,882.8) -20.0%
EBITDA from total waste management 23.0 9.8 249.5 285.7 272.5 295.5 -7.8%
EBITDA from businesses disposed 107.0 53.0 3.7 63.7 110.7 116.7 -5.1%
Total EBITDA 130.0 62.8 253.2 349.4 383.2 412.2 -7.0%
Depreciation and amortisation (229.2) (185.7) 60.9 - (168.3) (185.7) -9.4%
EBIT from total waste management (172.1) (206.2) 310.4 349.4 138.3 143.1 -3.4%
EBIT from businesses disposed 72.9 83.3 3.7 - 76.6 83.3 -8.0%
Total EBIT (99.2) (122.9) 314.1 349.4 214.9 226.5 -5.1%
Underlying Results Statutory Results Underlying Adjustments
For
per
sona
l use
onl
y

19
Transpacific 2014 Financial Year Results Group Income Statement – Statutory and Underlying Results
Shaded area indicates IFRS disclosures in FY14 Financial Statements. The non-IFRS information on this page and pages 20 and 29 have been subject to review by our auditors. Refer page 20 for reconciliation of detailed adjustments from Statutory Profit to Underlying Profit. Refer to pages 8 and 9 of the 30 June 2014 Director’s Report for detailed explanations of Underlying Adjustments and definitions.
A$ million
%
FY14 FY13 FY14 FY13 FY14 FY13 change
Net interest expense (64.5) (103.3) - 0.3 (64.5) (103.0) 37.4%
Non-cash finance costs (30.1) (13.3) 17.9 - (12.2) (13.3) 8.5%
Changes in fair value of derivatives (8.8) 12.5 8.8 (12.5) - - -
(Loss)/Profit before income tax (202.6) (227.0) 340.8 337.2 138.2 110.2 25.5%
Income tax benefit/(expense) 59.4 26.6 (88.2) (50.6) (28.8) (24.0) -20.0%
(Loss)/Profit from continuing operations after income tax (143.2) (200.4) 252.6 286.6 109.4 86.2 27.0%
Gain on sale from disposal of Commercial Vehicle Group after income tax 131.0 - (131.0) - - - -
Gain on sale from disposal of New Zealand after income tax 41.1 - (41.1) - - - -
(Loss)/Profit from continuing and discontinued operations after income tax 28.9 (200.4) 80.5 286.6 109.4 86.2 27.0%
Non-controlling interest 1.9 1.2 - - 1.9 1.2 58.3%
(Loss)/Profit after income tax and minorities 27.0 (201.6) 80.5 286.6 107.5 85.0 26.5%
SPS distribution 15.5 17.1 - - 15.5 17.1 -9.4%
(Loss)/Profit after income tax attributable to ordinary equity holders 11.5 (218.7) 80.5 286.6 92.0 67.9 35.5%
Weighted average number of shares 1,578.7 1,578.5 1,578.7 1,578.5
Basic earnings per share (cents) 0.7 (13.9) 5.8 4.3 34.9%
Statutory Results Underlying Adjustments Underlying Results
For
per
sona
l use
onl
y

20
Transpacific 2014 Financial Year Results Statutory Profit Reconciliation to Underlying ProfitA$ million FY14 FY13Statutory Profit/(loss) From Continuing and Discontinued Operations After Income Tax (Attributable to
Ordinary Equity Holders) 11.5 (218.7)
Impairment of assets (1) 139.4 325.0
Rectification expense on landfill assets and operations (1) 69.2 -
Loss on disposal of investments and site closures from Business and Operational Review 6.5 15.9
Restructuring costs, including redundancy 7.2 9.0
Costs associated with Business and Operational Review - 7.3
Onerous lease provision 10.9 -
Change in fair value of land and buildings taken to profit and loss 8.3 -
Costs associated with transformation program and other strategic projects 10.5 -
Refund of prior periods' tax credits - (7.9)
Other 1.2 0.1
Total Underlying Adjustments to EBITDA 253.2 349.4
Accelerated depreciation on landfill assets (1) 60.9 -
Total Underlying Adjustments to Depreciation 60.9 -
Write off of establishment costs associated with former debt facilities 17.9 -
Accelerated amortisation of Convertible Notes and redemption costs - 0.3
Changes in fair value of derivative financial instruments 8.8 (12.5)
Total Underlying Adjustments to Finance Costs 26.7 (12.2)
Tax impacts of Underlying Adjustments to EBITDA and finance costs (100.6) (50.6)
Tax impacts of FX on SPS Trust Redemption 12.4 -
Total Underlying Adjustments to Income Tax (88.2) (50.6)
Gain on sale of Commercial Vehicles Group after items transferred from reserves and income tax (131.0) -
Gain on sale of NZ businesses after items transferred from reserves and income tax (41.1) -
Total Gain on Sale from Divestments (172.1) -
Underlying Profit After Income Tax (Attributable to Ordinary Equity Holders) 92.0 67.9
Note 1: Relates to landfill rectification and remediation review
Refer to pages 8 and 9 of the 30 June 2014 Directors' Report for detailed explanations of the above Underlying Adjustments
For
per
sona
l use
onl
y

21
Transpacific 2014 Financial Year Results Balance Sheet
Net cash balance to partially fund SPS redemption in September 2014
Receivable days outstanding improved 2% compared to previous year
Inventory level reduction on sale of Commercial Vehicles and New Zealand businesses
Creditors reduction on sale of Commercial Vehicles and New Zealand businesses
Borrowings are USPP only – uneconomic to pay out early
Current and Non- Current landfill provisions total $347 million
Note 1: 30 June 2014 balance sheet excludes New Zealand as business sold on that date
A$ million 30 Jun 14 (1) 31 Dec 13 30 Jun 13
AssetsCash 190.1 71.7 76.2
Receivables 233.3 293.9 282.6
Inventories 10.7 22.3 165.2
Other current assets 11.7 22.7 28.0
Property, plant and equipment 822.0 1,076.9 1,084.4
Land held for sale 6.6 7.6 7.7
Intangible assets 1,272.0 1,915.1 1,862.8
Other non-current assets 187.0 119.6 129.5
Total Assets 2,733.4 3,529.8 3,636.4
Liabilities
Creditors 180.7 192.4 264.9
Borrowings 53.4 825.6 1,053.7
Other liabilities 440.6 280.7 310.5
Total Liabilities 674.7 1,298.7 1,629.1
Net Assets 2,058.7 2,231.1 2,007.3
For
per
sona
l use
onl
y

22
Transpacific 2014 Financial Year Results Cash Flows
Ratio of cash flow from operating activities to underlying EBITDA 95.1% (pcp: 98.7%)(2)
Remediation of landfills expected to be ~$35million in FY15 vs budgeted $19 million
Net cash interest paid continues to reduce –down $31.6 million or 30.7%
Capital expenditure
Note 1: $11.7 million of Cash from Operating Activities from the Commercial Vehicles Group has been reclassified as Cash from Investing Activities for statutory purposes. On a like-for-like basis, operating cash flow in FY14 is $235.2 million.
Note 2: Calculated as cash from operating activities before remediation paid, underlying adjustments, net interest paid and tax paid divided by underlying EBITDA
Capital expenditure expected to be ~$150 million in FY15
A$ million FY14 FY13
Underlying EBITDA incl. associates 383.2 412.2
Less share of associates profit (12.4) (5.5)
Change in operating assets and liabilities (8.0) 0.2
Remediation of landfills (8.0) (6.9)
Underlying adjustments (30.2) (9.1)Net interest paid (71.4) (103.0)Income taxes (paid)/received (18.0) (5.5)
Cash from Operating Activities (1) 235.2 282.4
Capital expenditure (186.1) (196.3)
Net proceeds from investing and asset sales (1) 1,127.4 32.3
Dividends received from Associates 10.6 -
Cash from Investing Activities(1) 951.9 (164.0)
Net proceeds from issue of equity (0.1) 1.2
Net repayment of debt facilities including leases
and hedges (1,058.9) (105.0)
Distributions to SPS holders (15.4) (17.1)
Cash from Financing Activities (1,074.4) (120.9)
Net (Decrease) in Cash Over Prior Year 112.7 (2.5)
A$ million FY14 FY13
Cleanaway 99.6 96.4
Industrials 31.5 42.7New Zealand 41.3 33.7
Commercial Vehicles 0.3 1.1
Manufacturing - -
Corporate & Property 13.4 22.4
Total Capex 186.1 196.3
For
per
sona
l use
onl
y

23
Transpacific 2014 Financial Year Results Capital Structure
Net Debt comprises:
Gross debt reduced to $53.4 million
All interest rate hedges terminated in FY14
At 1 July 2014 the Company had $282 million of headroom under the new $400 million banking facilities
Average debt maturity 4.3 years (pcp: 2.5 years)
$250 million Step-up Preference Securities to be redeemed on 30 September 2014
On a pro-forma basis, allowing for repayment of Step-up Preference Securities, net debt was $113.3 million
Funding Facility maturity profile ($m)
* Bank Facility Drawn mainly comprises bank guarantees
A$ million 30 Jun 14 31 Dec 13 30 Jun 13
Current interest bearing liabilities 2.0 22.3 21.5
Non current interest bearing liabilities 51.4 803.3 1,032.2
Gross debt 53.4 825.6 1,053.7
Cash and cash equivalents (190.1) (71.7) (76.2)
Net (cash)/debt (136.7) 753.9 977.5
For
per
sona
l use
onl
y

24
Our strategy revolves around four key components
ProductivityTuck-in
AcquisitionsLandfillGrowth
How
Current
Drive unit growth through transformed sales function
Optimise pricing Increase market
intelligence
Best practice landfill operations
Acquire or joint venture landfills
Increase focus on internalisation
Create pipeline of opportunities
Implement initiatives identified in Business and Operational Review
Pilot sales project underway
Internalisation rate 10% -12%
Opportunities identified
Redesigning collection routes to increase internalisation
Opportunities identified and being assessed
Expanding use of route optimisation and fleet management software
Extending procurement program
Reduce back office costs
Transpacific 2014 Financial Year Results Strategy update
For
per
sona
l use
onl
y

25
Transpacific 2014 Financial Year Results Closing Comments and FY15 Outlook
We have 4 fundamental areas that we must get right :1. Volumes2. Pricing 3. Internalisation of waste streams4. Best practice landfill operations
We have a number of initiatives in progress to achieve these which will take 18-24 months to fully implement
Outlook for FY15: Trading conditions in FY15 are expected to remain consistent with those of FY14 Cleanaway to show a modest improvement in earnings Industrials will continue to be challenged by economic conditions and difficult
markets
For
per
sona
l use
onl
y

26
Appendices
For
per
sona
l use
onl
y

27
Transpacific 2014 Financial Year Results Appendix 1: Capital Structure – Net Finance Costs
Cash interest costs $15-18 million and non-cash interest costs $6-7 million in FY15
A$ million
FY14 FY13 FY14 FY13
Interest expense
Bank interest 39.1 55.2 39.1 55.2
Commitment fees 3.4 4.0 3.4 4.0
Hedging 10.8 22.0 10.8 22.0
Guarantee/Bond fees 3.7 4.0 3.7 4.0
Convertible Notes - 1.7 - 1.4
USPP Notes 5.8 11.7 5.8 11.7
Finance leases 3.6 6.1 3.6 6.1
Total interest expense 66.4 104.6 66.4 104.3
Interest received (1.9) (1.3) (1.9) (1.3)
Net interest expense 64.5 103.3 64.5 103.0
Non-cash finance costs
Amortisation of borrowing costs 7.2 10.2 7.2 10.2
Present value for landfill remediation provision 5.0 3.1 5.0 3.1
Accelerated amortisation of borrowing costs 16.6 - - -
Interest on payout of finance leases 1.3 - - -
Total non-cash finance cost 30.1 13.3 12.2 13.3
Total net finance costs 94.6 116.6 76.7 116.3
Statutory Underlying
For
per
sona
l use
onl
y

28
Transpacific 2014 Financial Year Results Appendix 2: Australian Waste Management Underlying EBITDA
1H14 to 2H14
139.5 133.1
(7.4)0.5 0.5
-
20
40
60
80
100
120
140
160
180
1H14 Underlying EBITDA CWY IND Corp & Assoc. 2H14 Underlying EBITDA
A$
m
Australian Waste Management EBITDA Bridge 2H14 to 1H14
189.3
For
per
sona
l use
onl
y

29
Transpacific 2014 Financial Year Results Appendix 3: Underlying Divisional EBITDA Adjustments
Note: Refer to page 20 for reconciliation of detailed adjustments from Statutory results to Underlying results.
A$ million
FY14 FY13 FY14 FY13 FY14 FY13 change
Cleanaway (26.9) (36.7) 216.7 230.9 189.8 194.2 -2.3%
Industrials 86.7 62.1 3.4 45.3 90.1 107.4 -16.1%
Share of profits in continuing
associates1.7 1.0 - - 1.7 1.0 69.5%
Total Waste Management 61.5 26.4 220.1 276.2 281.6 302.6 -6.9%
Corporate (38.5) (16.6) 29.4 9.5 (9.1) (7.1) 28.2%
New Zealand 100.9 25.8 (6.7) 52.8 94.2 78.6 19.8%
Commercial Vehicles 5.3 35.8 - - 5.3 35.8 -85.2%
Manufacturing (9.9) (13.1) 10.4 10.9 0.5 (2.2) -122.7%
Share of profits in
discontinued associates10.7 4.5 - - 10.7 4.5 137.9%
EBITDA 130.0 62.8 253.2 349.4 383.2 412.2 -7.0%
Depreciation and amortisation (229.2) (185.7) 60.9 - (168.3) (185.7) -9.4%
EBIT (99.2) (122.9) 314.1 349.4 214.9 226.5 -5.1%
Statutory Results Underlying Adjustments Underlying Results
For
per
sona
l use
onl
y

30
Transpacific 2014 Financial Year Results Appendix 4: Divisional Underlying Results 2H14 v 1H14
A$ million
2H14 1H14 % change 2H14 1H14 % change 2H14 1H14 % change
Cleanaway 444.1 467.7 -5.0% 91.2 98.6 -7.5% 48.0 50.8 -5.6%
Industrials 238.1 246.9 -3.6% 45.3 44.8 1.2% 30.4 30.3 0.5%
Associates - - - 0.7 1.0 -30.5% 0.7 1.0 -30.5%
Corporate & other 7.8 5.1 53.4% (4.2) (4.9) -86.0% (10.2) (12.7) -80.1%
Total Australian Waste Management 690.0 719.7 -4.1% 133.0 139.5 -4.7% 68.9 69.4 99.2%
Segments divested
Commercial Vehicles - 75.7 - 5.3 - 5.1
Manufacturing 4.5 7.1 - 0.5 - 0.5
New Zealand incl associates (NZ$) 206.9 226.0 -8.4% 59.4 56.5 5.2% 40.1 33.8 18.7%
New Zealand incl associates (A$) 191.1 199.2 -4.1% 55.1 49.8 10.7% 37.2 33.8 9.9%
Other - 1.3 -100.0% - - - - - -
Total segments divested 195.6 283.3 -31.0% 55.1 55.6 -0.9% 37.2 39.4 -5.6%
Total Group 885.6 1,003.0 -11.7% 188.1 195.1 -3.6% 106.1 108.8 -2.5%
Revenue EBITDA EBIT
For
per
sona
l use
onl
y

31
Transpacific 2014 Financial Year Results Appendix 5: Capital Structure – Credit Metrics
Note: Underlying EBITDA is used in the calculation of credit metrics as it is considered to better reflect the ongoing position of the Group
2.70x2.56x 2.46x 2.56x
2.08x
0.14x
(0.50x)
0.5x
1.0x
1.5x
2.0x
2.5x
3.0x
1H12 FY12 1H13 FY13 1H14 FY14
Gross Debt/Underlying EBITDA
2.56x2.39x 2.39x 2.37x
1.90x
(0.36x)
(1.00x)
(0.50x)
0.5x
1.0x
1.5x
2.0x
2.5x
3.0x
1H12 FY12 1H13 FY13 1H14 FY14
Net Debt/Underlying EBITDA
2.56x
2.89x
3.73x3.55x
4.10x 4.05x
1.0x
1.5x
2.0x
2.5x
3.0x
3.5x
4.0x
4.5x
1H12 FY12 1H13 FY13 1H14 FY14
Underlying EBITDA/Net Interest
34.2% 32.8% 32.1% 32.7%
25.3%
(7.1%)
(10.0%)
0.0%
10.0%
20.0%
30.0%
40.0%
1H12 FY12 1H13 FY13 1H14 FY14
Net Debt/Net Debt + Equity
For
per
sona
l use
onl
y
32
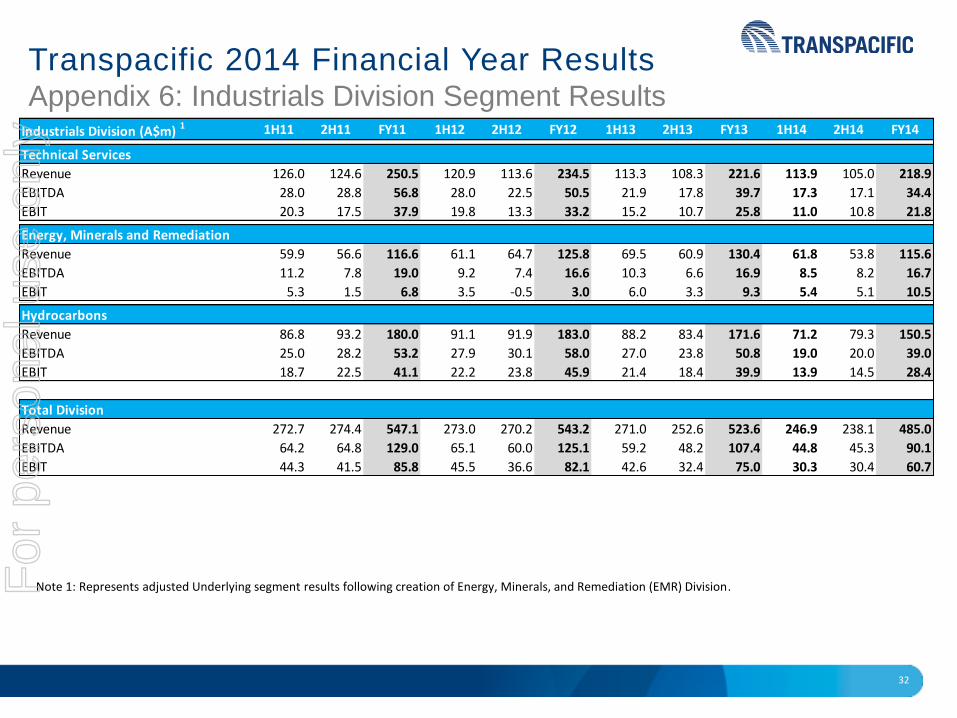
Transpacific 2014 Financial Year Results Appendix 6: Industrials Division Segment Results
Note 1: Represents adjusted Underlying segment results following creation of Energy, Minerals, and Remediation (EMR) Division.
Industrials Division (A$m) 1 1H11 2H11 FY11 1H12 2H12 FY12 1H13 2H13 FY13 1H14 2H14 FY14
Technical Services
Revenue 126.0 124.6 250.5 120.9 113.6 234.5 113.3 108.3 221.6 113.9 105.0 218.9
EBITDA 28.0 28.8 56.8 28.0 22.5 50.5 21.9 17.8 39.7 17.3 17.1 34.4
EBIT 20.3 17.5 37.9 19.8 13.3 33.2 15.2 10.7 25.8 11.0 10.8 21.8
Energy, Minerals and Remediation
Revenue 59.9 56.6 116.6 61.1 64.7 125.8 69.5 60.9 130.4 61.8 53.8 115.6
EBITDA 11.2 7.8 19.0 9.2 7.4 16.6 10.3 6.6 16.9 8.5 8.2 16.7
EBIT 5.3 1.5 6.8 3.5 -0.5 3.0 6.0 3.3 9.3 5.4 5.1 10.5
Hydrocarbons
Revenue 86.8 93.2 180.0 91.1 91.9 183.0 88.2 83.4 171.6 71.2 79.3 150.5
EBITDA 25.0 28.2 53.2 27.9 30.1 58.0 27.0 23.8 50.8 19.0 20.0 39.0
EBIT 18.7 22.5 41.1 22.2 23.8 45.9 21.4 18.4 39.9 13.9 14.5 28.4
Total Division
Revenue 272.7 274.4 547.1 273.0 270.2 543.2 271.0 252.6 523.6 246.9 238.1 485.0
EBITDA 64.2 64.8 129.0 65.1 60.0 125.1 59.2 48.2 107.4 44.8 45.3 90.1
EBIT 44.3 41.5 85.8 45.5 36.6 82.1 42.6 32.4 75.0 30.3 30.4 60.7
For
per
sona
l use
onl
y