TRANSMUTATION OF ACTINIDES USING HEAVY …...v RÉSUMÉ La gestion du combustible nucléaire usé...
260
This thesis may be used within the Department of National Defence but copyright for open publication remains the property of the author. TRANSMUTATION OF ACTINIDES USING HEAVY WATER REACTORS AND SODIUM COOLED FAST REACTORS TRANSMUTATION D’ACTINIDES À L’AIDE DE RÉACTEURS À EAU LOURDE ET DE RÉACTEURS RAPIDES REFROIDIS AU SODIUM A Thesis Submitted to the Division of Graduate Studies of the Royal Military College of Canada by Bronwyn Heather Hyland, M.Sc In Partial Fulfillment of the Requirements for the Degree of Doctor of Philosophy January 16, 2017
Transcript of TRANSMUTATION OF ACTINIDES USING HEAVY …...v RÉSUMÉ La gestion du combustible nucléaire usé...

This thesis may be used within the Department of National Defence but copyright for open
publication remains the property of the author.
TRANSMUTATION OF ACTINIDES USING HEAVY WATER REACTORS AND SODIUM
COOLED FAST REACTORS
TRANSMUTATION D’ACTINIDES À L’AIDE DE RÉACTEURS À EAU LOURDE ET DE
RÉACTEURS RAPIDES REFROIDIS AU SODIUM
A Thesis Submitted to the
Division of Graduate Studies of the Royal Military College of Canada
by
Bronwyn Heather Hyland, M.Sc
In Partial Fulfillment of the
Requirements for the Degree of
Doctor of Philosophy
January 16, 2017

ii
To Jonathan and Kealan.
iii
ACKNOWLEDGEMENTS
I would like to thank Canadian Nuclear Laboratories, formerly Atomic Energy of Canada
Limited, for supporting my work. All of my managers through this time have been very
supportive of me: Jim Sullivan, Darren Radford, Alastair McIvor, Christina Van Drunen, Bob
Walker, Steve Bushby, and Ramesh Sadhankar. I would also like to thank my two supervisors,
Dr. Brent Lewis, and Dr. Hugues Bonin for their guidance and mentorship through my studies.
I owe a huge thank you to Geoff Edwards, Jeremy Pencer and Dan Wojtaszek at CNL/AECL, for
their help and technical guidance and expertise. Without Geoff and Jeremy to help with the
physics work, and Dan’s help with VISION, this would not have been completed. Thanks also to
Jeff Armstrong for his help with the fuel calculations, and Zaki Bhatti’s meticulous verification. I
would also like to acknowledge Martin Magill’s help in the development of the fast reactor
models.
Lastly I would like to thank my family. Especially my husband Sean, who has been steadfastly
supportive through this very long journey, which has not been easy with a full time job, and
twins. And I would like to thank my sons, Jonathan and Kealan, who have given me the
motivation to finish this work.
iv
ABSTRACT
The management of spent nuclear fuel is one of the largest challenges preventing widespread
acceptance and expansion of nuclear energy. One strategy to alleviate the concerns surrounding
spent nuclear fuel is to transmute long-lived actinides. In this work a heavy water reactor (HWR)
was proposed to be employed as an intermediate burner of transuranic elements (plutonium,
americium, curium, and neptunium) from light water reactor (LWR) spent fuel, prior to further
transmutation in a sodium cooled fast reactor. Reactor physics modelling of the HWR was
performed using the lattice cell code WIMS-AECL 3.1, and the sodium cooled fast reactor was
modelled using the Monte Carlo code Serpent. Basic safety criteria were analyzed for both the
HWR and the fast reactor models. Dynamic simulations to determine the impact of transitioning
to actinide burning fuel cycles were performed using the VISION fuel cycle systems model.
Five fuel cycles were modeled, in order to determine the impact of an intermediate burner HWR:
1: a reference case, once-through LWR; 2: LWR, transitioning to fast reactors; 3: LWRs,
transitioning to HWR intermediate actinide burners, then to fast reactors; 4: LWRs, transitioning
to both HWR intermediate burners and LWR-derived fuel fast reactors; and 5: an LWR to HWR
modified open fuel cycle (no fast reactors).
Fuel cycles that include a transition to fast reactors have the most favourable impact on
sustainability metrics, such as uranium consumption. Relative to a reference once-through LWR
case, a transition to fast reactors reduces consumption by 70%. Fuel cycles utilizing HWRs as
intermediate burner of minor actinides reduce this somewhat, giving a reduction in uranium
requirements of 55-59%.
The fuel cycles studied here significantly reduce the amount of spent fuel requiring long term
storage. 527 kt of spent fuel in the reference once through LWR case is reduced by 76% to 126 kt
in the LWR to HWR modified open fuel cycle, and by 98% to 10 kt for the fast reactor scenarios.
The determination of the actinide burning abilities of the different fuel cycles was complicated by
the concentration of minor actinides (i.e. Am and Cm) in the fast reactor fuel. When a sufficient
number of fast reactors are built in relation to the supply of fuel from LWR or HWRs, the
scenario runs out of minor actinides, and is forced to “borrow” these elements from a region
outside of that being modelled. However, it can be concluded that since these scenarios are forced
to import minor actinides, they do a sufficient job of dispositioning actinides.

v
RÉSUMÉ
La gestion du combustible nucléaire usé est l’un des défis les plus importants empêchant une
acceptation généralisée et une expansion de l’énergie nucléaire. Une stratégie visant à répondre
aux inquiétudes reliées au combustible nucléaire usé est de transmuter les actinides à longues
vies. Dans ce présent travail, on propose l’emploi d’un réacteur à eau lourde (HWR) comme un
brûleur intermédiaire d’éléments transuraniens (plutonium, américium, curium, et neptunium)
provenant du combustible usé de réacteurs à eau légère (LWR), préalablement à une
transmutation ultérieure dans un réacteur rapide refroidi au sodium. La modélisation de la
physique du réacteur à eau lourde a été effectuée à l’aide du logiciel de calcul de cellule WIMS-
AECL 3.1, et celle du réacteur rapide refroidi au sodium fut accomplie grâce au logiciel Serpent
qui est basé sur une méthode de Monte Carlo. Des critères de base en sûreté ont été analysés pour
le réacteur à eau lourde et le réacteur rapide modélisés. On a effectué des simulations
dynamiques pour déterminer l’impact des transitions vers des cycles de combustible consommant
des actinides à l’aide du modèle VISION de systèmes de cycles de combustible.
On a modélisé cinq cycles de combustible afin de déterminer l’impact du réacteur à eau légère
intermédiaire : 1: un cas de référence, celui du cycle à passage unique dans un réacteur à eau
légère; un cycle partant d’un passage initial dans un réacteur à eau légère suivi d’une transition
dans un réacteur rapide; 3: un cycle commençant par un passage dans des réacteurs à eau légère,
suivi d’une transition dans des réacteurs à eau lourde, puis dans des réacteurs rapides; 4: un cycle
démarrant par un passage dans des réacteurs à eau légère, suivi par une transition dans des
réacteurs à eau lourde en parallèle avec une transition de combustible irradié dans des réacteurs à
eau légère vers des réacteurs rapides; et, 5: un cycle ouvert dans lequel le combustible irradié
dans des réacteurs à eau légère est envoyé dans des réacteurs à eau lourde (sans réacteur rapide).
Les cycles de combustible qui impliquent des réacteurs rapides ont l’impact le plus favorable sur
les paramètres de faisabilité, comme celui de la consommation de l’uranium. Relativement au cas
de référence qui est le cycle à passage unique dans un réacteur à eau légère, une transition vers
des réacteurs rapides diminue la consommation d’uranium par 70%. Les cycles de combustible
qui incluent des réacteurs à eau lourde comme brûleur intermédiaire d’actinides mineurs
diminuent cela quelque peu, donnant une réduction de 55-59% des besoins en uranium.
Les cycles de combustible étudiés ici réduisent de façon significative les quantités produites de
combustible usé qui demandent un entreposage de longue durée. Les 527 kt de combustible usé
produites dans le cycle de référence à passage unique dans un réacteur à eau légère sont
diminuées par 76% à 126 kt dans le cycle ouvert modifié avec passage d’un réacteur à eau légère
à un réacteur à eau lourde, et par 98% à 10 kt pour les cycles impliquant des réacteurs rapides.
La détermination des capacités de brûler les actinides des différents cycles de combustible était
rendue compliquée par la concentration des actinides mineurs (i.e. Am et Cm) dans le
combustible du réacteur rapide. Lorsqu’un nombre suffisant de réacteurs rapides sont construits
en relation avec les quantités de combustible produites par les réacteurs à eau légère et les
réacteurs à eau lourde, le scénario épuise les quantités disponibles d’actinides mineurs, et on est
forcé d’ « emprunter » ces éléments de sources situées dans une région extérieure à celle

vi
modélisée. Cependant, on peut conclure que, puisque ces scenarios doivent importer des
actinides mineurs, ils effectuent un travail suffisant de disposition des actinides.

vii
Table of Contents LIST OF TABLES .......................................................................................................................................10
LIST OF FIGURES .....................................................................................................................................13
NOMENCLATURE ....................................................................................................................................25
LIST OF ABBREVIATIONS ...........................................................................................................................25
LIST OF SYMBOLS ......................................................................................................................................27
1 INTRODUCTION AND LITERATURE REVIEW ......................................................................... 1
1.1 OVERVIEW OF REACTOR TYPES ..................................................................................................... 2
1.1.1 Light Water Reactors ................................................................................................................ 2
1.1.2 Heavy Water Reactors .............................................................................................................. 3
1.1.3 Fast Reactors ............................................................................................................................ 4
1.2 OVERVIEW OF LIGHT WATER REACTOR SPENT NUCLEAR FUEL .................................................... 6
1.3 PHYSICS OF ACTINIDE TRANSMUTATION ....................................................................................... 8
1.3.1 Transmutation Pathways in a Thermal Spectrum ..................................................................... 9
1.4 SPENT FUEL PARTITIONING ..........................................................................................................11
1.4.1 Curium Management ...............................................................................................................11
1.5 POTENTIALS FOR MINOR ACTINIDE TRANSMUTATION ..................................................................12
1.5.1 Potential for Transmutation of Minor Actinides in Sodium-Cooled Fast Reactors .................12
1.5.2 Potential for Transmutation of Minor Actinides in CANDU Reactors ....................................12
1.6 FUEL CYCLE SCENARIO STUDIES ..................................................................................................13
1.7 GOALS AND SCOPE OF THESIS WORK ...........................................................................................17
2 HEAVY WATER REACTOR CALCULATIONS ..........................................................................21
2.1 HWR MODEL DEVELOPMENT OVERVIEW ....................................................................................21
2.2 HEAVY WATER REACTOR SAFETY CONSIDERATIONS ...................................................................22
2.3 WIMS-AECL ...............................................................................................................................23
2.4 GEOMETRY ...................................................................................................................................23
2.4.1 Adjustments Due to the 2-Dimensional Calculation ................................................................23
2.5 MATERIAL COMPOSITIONS ...........................................................................................................25
2.5.1 Actinide Composition ..............................................................................................................25
2.6 CALCULATION OF FUEL TEMPERATURES ......................................................................................28
2.7 WIMS-AECL MODEL PARAMETERS ............................................................................................30
2.8 COOLANT VOID REACTIVITY TARGET ..........................................................................................30
2.9 TRANSMUTATION OF THE TRANSURANIC NUCLIDES .....................................................................32
2.10 RESULTS FOR INVESTIGATION OF COOLING TIME .........................................................................43
2.10.1 Determination of Exit Burnup .............................................................................................43
2.10.2 Common Centre Poison Pin ................................................................................................43
2.10.3 Cases to Achieve the Target CVR ........................................................................................44
2.11 CASE CHOSEN TO PROVIDE INPUT TO THE FAST REACTOR ANALYSIS ..........................................45
2.11.1 Fuel Temperature Coefficient .............................................................................................46
2.11.2 Comparison Calculation Using Serpent ..............................................................................46
3 FAST REACTOR CALCULATIONS ..............................................................................................49
3.1 SODIUM-COOLED FAST REACTORS SAFETY CONSIDERATIONS .....................................................49

viii
3.2 EUROPEAN SODIUM COOLED FAST REACTOR ...............................................................................51
3.3 SERPENT .......................................................................................................................................54
3.3.1 Serpent Data Libraries ............................................................................................................54
3.4 TESTS OF THE DOPPLER BROADENING CORRECTION IN SERPENT .................................................54
3.5 INITIAL MODEL CONSTRUCTION AND TESTING .............................................................................55
3.6 HOM4 ESFR CONFIGURATION ....................................................................................................58
3.7 HOM4 REFERENCE CASE RESULTS ..............................................................................................58
3.8 FAST REACTOR WITH THE TAKAHAMA LWR-DERIVED FUEL COMPOSITION................................60
3.9 LWRCANDU TRU, ESFR CONF2 DESIGN ............................................................................62
3.10 FAST REACTOR WITH HOM4 DESIGN ...........................................................................................62
3.10.2 ESFR Results for LWRCANDU Spent TRU for the HOM4 Design .................................70
3.11 COMPARISON OF TRANSMUTATION PERFORMANCE ......................................................................79
3.12 DISCUSSION ..................................................................................................................................84
4 FUEL CYCLE SCENARIO STUDIES .............................................................................................87
4.1 INTRODUCTION .............................................................................................................................87
4.2 OVERVIEW OF VISION .................................................................................................................88
4.2.1 Mass Inventory in VISION .......................................................................................................89
4.3 OVERVIEW OF THE SCENARIO STUDIES .........................................................................................92
4.3.1 HWR intermediate burner with LWR-derived fuel fast reactors ..............................................93
4.4 INPUT PARAMETERS AND ASSUMPTIONS ......................................................................................95
4.4.1 Fuel Cycle Scenario Parameters .............................................................................................95
4.4.2 Reactor Assumptions ...............................................................................................................95
4.4.3 Energy Projection ....................................................................................................................97
4.4.4 Initial Spent Fuel Inventory ...................................................................................................100
4.5 SENSITIVITY CASES ....................................................................................................................100
4.5.1 Power De-Rating Cases .........................................................................................................100
4.5.2 No Legacy Spent Fuel ............................................................................................................101
4.5.3 Capped Reprocessing Capacity .............................................................................................101
4.5.4 Delayed Fast Reactor Operation Date ..................................................................................102
4.6 BASE CASE RESULTS ..................................................................................................................102
4.6.1 Case 1, Reference, Once-Through LWR ................................................................................104
4.6.2 Case 2, LWRs and fast reactors .............................................................................................106
4.6.3 Case 3, HWR intermediate actinide burner ...........................................................................110
4.6.4 Case 4, HWR intermediate burner with LWR-derived fuel fast reactors ...............................114
4.6.5 Case 5, LWR to HWR modified open fuel cycle .....................................................................118
4.6.6 Comparison of the Five Cases ...............................................................................................122
4.7 RESULTS FOR THE SENSITIVITY CASES .......................................................................................131
4.7.1 Fast Reactor Power De-rating ..............................................................................................132
4.7.2 No Legacy Spent Fuel ............................................................................................................140
4.7.3 Capped Reprocessing Capacity .............................................................................................147
4.7.4 Delayed Fast Reactor Operation Date ..................................................................................157
4.7.5 Comparisons with the Base Cases .........................................................................................166
4.8 DISCUSSION ................................................................................................................................174
4.8.1 Applicability and Validity ......................................................................................................178
5 SUMMARY AND CONCLUSIONS ...............................................................................................181
6 RECOMMENDATIONS..................................................................................................................185

ix
7 REFERENCES .................................................................................................................................187
APPENDICES
APPENDIX A FISSION AND CAPTURE CROSS SECTIONS FOR ISOTOPES OF IMPORTANCE FOR LONG TERM
CHARACTERISTICS OF SPENT LIGHT WATER REACTOR FUEL ............................................................. A-193
APPENDIX B SENSITIVITY CASE RESULTS WITH NO SIGNIFICANT IMPACT ON THE PARAMETER OF
INTEREST ............................................................................................................................................. B-197
B.1 FAST REACTOR POWER DE-RATING .............................................................................................. B-197
B.2 NO LEGACY SPENT FUEL .............................................................................................................. B-201
B.3 CAPPED REPROCESSING CAPACITY............................................................................................... B-212
B.4 FAST REACTOR OPERATION DELAYED UNTIL 2050...................................................................... B-219
B.5 COMPARISONS OF THE BASE AND SENSITIVITY CASES FOR URANIUM ORE CONSUMPTION, MASS OF
SPENT FUEL REPROCESSED AND THE SOURCE OF AMERICIUM AND CURIUM ....................................... B-224
x
LIST OF TABLES
Table 1 Fission and capture cross-sections in thermal and fast neutron spectra for important transuranic
nuclides [17]. ......................................................................................................................................... 5
Table 2 Constituents of light water reactor spent nuclear fuel. [16] .............................................................. 6
Table 3 Actinides of importance to the characteristics of spent LWR fuel. .................................................. 6
Table 4. A few possible partitioning schemes. .............................................................................................11
Table 5 Isotopic composition, in weight %, of LWR-derived curium at exit from the reactor and cooled for
15 years. ................................................................................................................................................12
Table 6 A comparison of the minor actinide burning capabilities of a few sodium cooled fast reactor
concepts. ...............................................................................................................................................14
Table 7 A comparison of a few minor actinide burning concepts in a CANDU reactor. .............................15
Table 8 Fuel bundle and lattice cell dimensions ............................................................................................24
Table 9 Lattice cell material compositions, densities and temperatures ........................................................25
Table 10 Amount of transuranic nuclides (g kg-1 IHE) in LWR spent fuel for decay times out to 45 years. 26
Table 11 Isotopic composition (weight %) of transuranic nuclides in LWR spent fuel for decay times out to
45 years. ................................................................................................................................................27
Table 12 Comparison of some reactor parameters using the same fuel temperature for all fuel rings, and for
the calculated fuel temperatures............................................................................................................28
Table 13 Averaged beta-delayed neutron fractions and CVR values for the NU reference fuel and the TRU-
containing fuel. .....................................................................................................................................31
Table 14 Initial masses (g kgIHE-1(initial heavy elements)) of transuranic nuclides in the fuel as a function
of decay time of the TRU for the cases with a constant amount of dysprosia in the centre pin. ..........35
Table 15 Final masses (g kgIHE-1) of transuranic nuclides in the fuel as a function of decay time of the
TRU for the cases with a constant amount of dysprosia in the centre pin. ...........................................36
Table 16 Initial masses (g kgIHE-1) of transuranic nuclides in the fuel as a function of decay time of the
TRU for cases with a target CVR of 11 mk ..........................................................................................37
Table 17 Final masses (g kgIHE-1) of transuranic nuclides in the fuel as a function of decay time of the
TRU for cases with a target CVR of 11 mk ..........................................................................................38
Table 18 Percent transmuted for the transuranic nuclides in the fuel as a function of decay time of the TRU
for the cases with a constant amount of dysprosia in the centre pin. ....................................................39
Table 19 Percentage transmuted of transuranic nuclides in the fuel as a function of decay time of the TRU
for cases with a target CVR of 11 mk ...................................................................................................40
Table 20 Mass transmuted per reactor per year (kg reactor-1 year-1) for the cases with a constant amount of
dysprosia in the centre pin ....................................................................................................................41
Table 21 Mass transmuted per reactor per year (kg reactor-1 year-1) for the cases with a target CVR of 11
mk .........................................................................................................................................................42
Table 22 Amount of TRU in the fuel, exit burnup, and CVR for each decay time of the LWR fuel. ...........43
Table 23 Results for the decay time cases with a target CVR of 11 mk. .......................................................45
xi
Table 24 Final mass of transuranic elements as calculated by Serpent and WIMS-AECL ...........................48
Table 25 The three input fuel plutonium and minor actinide isotopic compositions used for the fast reactor
simulations. ...........................................................................................................................................50
Table 26 The contribution of various isotopes to the sodium void reactivity effect, normalized to the mass
of the isotope [63]. ................................................................................................................................50
Table 27 ESFR Parameters [35], [34]............................................................................................................52
Table 28 Tests of the Doppler broadening correction using Serpent .............................................................55
Table 29 eff, SVRE, and Doppler coefficient results for the ESFR CONF2 benchmark case. .....................57
Table 30 Elemental discharge masses for the ESFR CONF2 benchmark case. ............................................57
Table 31 Minor actinide composition used in the ESFR HOM4 reference case ...........................................58
Table 32 eff, SVRE, and Doppler coefficient results for the ESFR HOM4 benchmark case .......................59
Table 33 Elemental discharge masses for the ESFR HOM4 benchmark case. ..............................................59
Table 34 Comparison of eff, SVRE, and Doppler coefficient for the 15-year decayed Takahama LWR TRU
composition for the CONF2 design. .....................................................................................................60
Table 35 Comparison of eff, SVRE, and Doppler coefficient for the Takahama LWR TRU composition
for the HOM4 design. ...........................................................................................................................64
Table 36 Peak powers and relative powers for inner and outer reference channels for the Takahama LWR-
derived fuel ESFR cases. ......................................................................................................................68
Table 37 Input fuel compositions for three passes through a fast reactor with the initial composition derived
from Takahama LWR used fuel. ...........................................................................................................69
Table 38 Exit fuel compositions for three passes through a fast reactor with the initial composition derived
from Takahama LWR used fuel. ...........................................................................................................70
Table 39 Comparison of eff, SVRE, and Doppler coefficient for the LWRCANDU TRU composition for
the HOM4 design. .................................................................................................................................72
Table 40 Comparison of eff, SVRE, and Doppler coefficient for the LWRCANDU TRU composition for
the HOM4 design for three passes through the ESFR. .........................................................................72
Table 41 Peak powers and relative powers for inner and outer reference channels for the LWRCANDU
fuel ESFR cases. ...................................................................................................................................76
Table 42 Input fuel compositions for three passes through a fast reactor with the initial composition derived
from LWRCANDU used fuel. ..........................................................................................................77
Table 43 Exit fuel compositions for three passes through a fast reactor with the initial composition derived
from LWRCANDU used fuel. ..........................................................................................................78
Table 44 Mass transmuted per reactor per year (kg reactor-1 year-1) for the three passes through the ESFR
starting with Takahama LWR-derived transuranic elements. ...............................................................79
Table 45 Mass transmuted per reactor per year (kg reactor-1 year-1) for the three passes through the ESFR
starting with LWRCANDU derived fuel. .........................................................................................79
Table 46 Percent transmuted for the entire irradiation for each pass through the ESFR starting with
Takahama LWR-derived transuranic elements. ....................................................................................79
xii
Table 47 Percent transmuted for the entire irradiation for each pass through the ESFR starting with
LWRCANDU derived fuel. ..............................................................................................................79
Table 48 Isotopic composition of plutonium for the fresh fuel for the first pass into the Takahama LWR-
derived fuel case and the LWRCANDU derived fuel case. ..............................................................81
Table 49 The mass of nuclides in LWR spent fuel after 5, 15 and 45 years’ decay, and the elemental
isotopic compositions. ..........................................................................................................................90
Table 50 Fuel cycle scenario parameters .......................................................................................................95
Table 51 Light water reactor parameters for the Takahama-3 reactor used in the fuel cycle scenarios ........96
Table 52 Assumed light water reactor fuel cycle parameters ........................................................................96
Table 53 Heavy water reactor parameters used in the fuel cycle scenario studies ........................................96
Table 54 Fast reactor parameters used in the fuel cycle scenario studies ......................................................97
Table 55 Nuclear power demand in each year. ..............................................................................................99
Table 56 The number of each reactor type operated in each of the five base cases ....................................123
Table 57 Uranium consumption, comparison with the reference once-through case, and percentage of
worldwide uranium resources required ...............................................................................................124
Table 58 Location of plutonium in the fuel cycle for the five base cases. ...................................................125
Table 59 The amount of high level waste and americium and curium in high level waste requiring
permanent disposal at the end of the scenario for the five base cases.................................................128
Table 60 First year at which external sources of americium and curium are obtained, and the amounts
required for the five base cases ...........................................................................................................130
Table 61 The number of reactors of each type operated in each of the sensitivity cases in comparison with
the base case. ......................................................................................................................................133
Table 62 First year at which external sources of americium and curium are obtained, and the amounts
required for the sensitivity cases .........................................................................................................142
Table 63 Uranium consumption, comparison with the reference once-through case, and percentage of
worldwide uranium resources required for the sensitivity cases .........................................................158
Table 64 Location of plutonium in the fuel cycle for the sensitivity cases..................................................167
Table 65 Comparison between LWR spent fuel that has been decayed for 5 years and that has been decayed
for 15 years prior to irradiation in a HWR. .........................................................................................178

xiii
LIST OF FIGURES
Figure 1 Schematic diagram of a pressurized water reactor [13] ................................................................... 3
Figure 2 A CANDU heavy water reactor and fuel channel. ........................................................................... 4
Figure 3 Decay heat of the dominant actinides for light water reactor spent fuel between 10 and 1 million
years after discharge. ............................................................................................................................. 7
Figure 4 Committed effective dose of the dominant actinides for light water reactor spent fuel between 10
and 1 million years after discharge. ....................................................................................................... 7
Figure 5 Radioactivity of the dominant actinides for light water reactor spent fuel between 10 and 1
million years after discharge. ................................................................................................................. 8
Figure 6 Transmutation pathways for uranium and transuranic nuclides. Reaction probabilities correspond
to a MOX fuel, comprised of 30-year-old cooled transuranics (Np, Pu, Am, Cm) from LWR mixed
with NU, in a CANDU-6 reactor at mid-burnup [18]. ..........................................................................10
Figure 7 CANDU-6 lattice cell and fuel bundle. ...........................................................................................24
Figure 8 k∞ as a function of burnup using the same fuel temperature for all fuel rings, and for the calculated
fuel temperatures. .................................................................................................................................29
Figure 9 CVR as a function of burnup using the same fuel temperature for all fuel rings, and for the
calculated fuel temperatures. ................................................................................................................29
Figure 10 Beta delayed neutron fraction as a function of irradiation for NU reference fuel and for TRU-
containing fuel. .....................................................................................................................................32
Figure 11 Percent transmuted for the complete irradiation for some transuranic elements and nuclides as a
function of cooling time of the TRU for the cases with a constant amount of dysprosia in the centre
pin. ........................................................................................................................................................33
Figure 12 Percent transmuted for the complete irradiation for some transuranic elements and nuclides as a
function of cooling time of the TRU for the cases with a target CVR of 11 mk ..................................33
Figure 13 Mass transmuted (kg reactor-1 year-1) for some transuranic elements and nuclides as a function of
cooling time of the TRU with a constant amount of dysprosia in the centre pin. .................................34
Figure 14 Mass transmuted (kg reactor-1 year-1) for some transuranic elements and nuclides as a function of
cooling time of the TRU for the cases with a target CVR of 11 mk .....................................................34
Figure 15 Volume fraction of TRU in the fuel as a function of decay time of the TRU ...............................44
Figure 16 Coolant void reactivity as a function of decay time of the TRU ...................................................44
Figure 17 Amounts of dysprosia and TRU for the cases with a target CVR of 11 mk ..................................45
Figure 18 The neutron multiplication factor, k, as a function of burnup calculated by WIMS-AECL and
Serpent ..................................................................................................................................................47
Figure 19 The change in the neutron multiplication factor, k, between the WIMS-AECL and Serpent
calculations. ..........................................................................................................................................47
Figure 20 Radial cross-section of the CONF-2 ESFR core design ................................................................52
Figure 21 Cross-section of a fuel assembly ...................................................................................................53
Figure 22 Axial cross-section of the ESFR reactor core................................................................................53

xiv
Figure 23 k-effective as a function of irradiation time for the benchmark case using the JEFF3.1.1 and the
ENDF/B-VII libraries. ..........................................................................................................................56
Figure 24 Evolution of k-effective for the HOM4 reference case. ................................................................59
Figure 25 Reactivity curves for 15-year decayed LWR TRU, altering the ratio of Pu in the inner and outer
fuel. A positive number refers to a higher amount of Pu in the inner fuel. ...........................................61
Figure 26 Amount of U-238 in the fuel as a function of time in the reactor .................................................61
Figure 27 Reactivity curves for the spent LWRCANDU TRU, altering the ratio of Pu in the inner and
outer fuel. A positive number refers to a higher amount of Pu in the inner fuel. ..................................63
Figure 28 Evolution of k-effective for the Takahama LWR TRU for the HOM4 ESFR design for three
passes. ...................................................................................................................................................63
Figure 29 k-effective evolution for the second pass using Takahama LWR-derived fuel. ............................64
Figure 30 Flux map of cooled and voided ESFR cores for the Takahama LWR-derived fuel case and for the
HOM4 reference case (no colour scale available in Serpent). ..............................................................66
Figure 31 Flux map of normal and high temperature ESFR cores for the Takahama LWR-derived fuel case
and for the HOM4 reference case (no colour scale available in Serpent). ............................................67
Figure 32 The locations of the peak powers and the representative channels for the Takahama LWR-
derived fuel ESFR cases. ......................................................................................................................68
Figure 33 Reactivity curve for the LWRCANDU TRU for the HOM4 ESFR design, first pass. .............71
Figure 34 Reactivity curve for the LWRCANDU TRU for the HOM4 ESFR design, all three passes. ....71
Figure 35 Flux map of cooled and voided ESFR cores for the LWR CANDU fuel case and for the HOM4
reference case (no colour scale available in Serpent). ..........................................................................74
Figure 36 Flux map of normal and high temperature ESFR cores for the LWRCANDU fuel case and for
the HOM4 reference case (no colour scale available in Serpent). ........................................................75
Figure 37 The locations of the peak powers and the representative channels for the LWRCANDU fuel
ESFR cases. ..........................................................................................................................................76
Figure 38 Mass transmuted per reactor per year (kg reactor-1 year-1) for the three passes through the ESFR.
L: starting with Takahama LWR-derived transuranic elements, C: starting with LWRCANDU-
derived fuel. ..........................................................................................................................................80
Figure 39 Percent transmutation for the three passes through the ESFR. L: starting with Takahama LWR-
derived transuranic elements, C: starting with LWRCANDU-derived fuel. .....................................80
Figure 40 Evolution of the mass of plutonium nuclides through three passes in the fast reactor for the
Takahama LWR derived fuel case. .......................................................................................................81
Figure 41 Evolution of the mass of plutonium nuclides through three passes in the fast reactor for the
LWRCANDU derived fuel case. ......................................................................................................82
Figure 42 Evolution of the mass of plutonium nuclides through three passes in the fast reactor for both
cases. Solid lines designate the Takahama LWR-derived fuel case, and the dashed lines designate the
LWRCANDU derived fuel case. ......................................................................................................82
Figure 43 Evolution of the mass of americium nuclides through three passes in the fast reactor for the
Takahama LWR derived fuel case. .......................................................................................................83

xv
Figure 44 Evolution of the mass of americium nuclides through three passes in the fast reactor for the
LWRCANDU derived fuel case. ......................................................................................................84
Figure 45 Evolution of the mass of americium nuclides through three passes in the fast reactor for both
cases. Solid lines designate the Takahama LWR-derived fuel case, and the dashed lines designate the
LWRCANDU derived fuel case. ......................................................................................................84
Figure 46 The five fuel cycle systems. ..........................................................................................................94
Figure 47 Nuclear energy growth projection for OECD90 countries [78]. ...................................................98
Figure 48 Nuclear power demand used in these scenarios. ...........................................................................98
Figure 49 Global installed nuclear capacity [73] .........................................................................................100
Figure 50 Electrical capacity in each year for the reference once-through LWR case ................................104
Figure 51 Number of operating reactors in each year for the reference once-through LWR case...............105
Figure 52 Number of new reactors brought online in each year for the reference once-through LWR case
............................................................................................................................................................105
Figure 53 Cumulative consumed uranium ore for the reference once-through LWR case ..........................106
Figure 54 Electrical capacity in each year for each reactor type for the LWR and fast reactor case ...........106
Figure 55 Number of operating reactors in each year for each reactor type for the LWR and fast reactor
case .....................................................................................................................................................107
Figure 56 Number of new reactors brought online in each year for each reactor type for the LWR and fast
reactor case .........................................................................................................................................107
Figure 57 Cumulative consumed uranium ore for each reactor type for the LWR and fast reactor case ....108
Figure 58 Mass of fuel from each reactor type reprocessed in each year for the LWR and fast reactor case
............................................................................................................................................................108
Figure 59 Mass of fuel from each reactor type reprocessed in each year for the LWR and fast reactor case,
with the y-axis magnified. Note that the top of the peak is 46 kt. .......................................................109
Figure 60 Source of americium, internal or external to the scenario, used to fabricate fuel, in each year for
the LWR and fast reactor case. ...........................................................................................................109
Figure 61 Source of curium, internal or external to the scenario, used to fabricate fuel, in each year for the
LWR and fast reactor case. .................................................................................................................110
Figure 62 Electrical capacity in each year for each reactor type for the HWR intermediate burner case ...110
Figure 63 Number of operating reactors in each year for each reactor type for the HWR intermediate burner
case .....................................................................................................................................................111
Figure 64 Number of new reactors brought online in each year for each reactor type for the HWR
intermediate burner case .....................................................................................................................111
Figure 65 Cumulative consumed uranium ore for each reactor type for the HWR intermediate burner case
............................................................................................................................................................112
Figure 66 Mass of fuel from each reactor type reprocessed in each year for the HWR intermediate burner
case .....................................................................................................................................................112
xvi
Figure 67 Mass of fuel from each reactor type reprocessed in each year for the HWR intermediate burner
case, with the y-axis magnified. Note that the top of the peak is 46 kt. ..............................................113
Figure 68 Source of americium, internal or external to the scenario, used to fabricate fuel, in each year for
the HWR intermediate burner case. ....................................................................................................113
Figure 69 Source of curium, internal or external to the scenario, used to fabricate fuel, in each year for the
HWR intermediate burner case. ..........................................................................................................114
Figure 70 Electrical capacity in each year for each reactor type for the HWR intermediate burner with
LWR-derived fuel fast reactors case ...................................................................................................114
Figure 71 Number of operating reactors in each year for each reactor type for the HWR intermediate burner
with LWR-derived fuel fast reactors case ...........................................................................................115
Figure 72 Number of new reactors brought online in each year for each reactor type for the HWR
intermediate burner with LWR-derived fuel fast reactors case ...........................................................115
Figure 73 Cumulative consumed uranium ore for each reactor type for the HWR intermediate burner with
LWR-derived fuel fast reactors case ...................................................................................................116
Figure 74 Mass of fuel from each reactor type reprocessed in each year for the HWR intermediate burner
with LWR-derived fuel fast reactors case ...........................................................................................116
Figure 75 Mass of fuel from each reactor type reprocessed in each year for the HWR intermediate burner
with LWR-derived fuel fast reactors case, with the y-axis magnified. Note that the top of the peak is
46 kt. ...................................................................................................................................................117
Figure 76 Source of americium, internal or external to the scenario, used to fabricate fuel, in each year for
HWR intermediate burner with LWR-derived fuel fast reactors case. ...............................................117
Figure 77 Source of curium, internal or external to the scenario, used to fabricate fuel, in each year for
HWR intermediate burner with LWR-derived fuel fast reactors case. ...............................................118
Figure 78 Electrical capacity in each year for each reactor type for the LWR to HWR modified open fuel
cycle case ............................................................................................................................................118
Figure 79 Number of operating reactors in each year for each reactor type for the LWR to HWR modified
open fuel cycle case ............................................................................................................................119
Figure 80 Number of new reactors brought online in each year for each reactor type for the LWR to HWR
modified open fuel cycle case .............................................................................................................119
Figure 81 Cumulative consumed uranium ore for each reactor type for the LWR to HWR modified open
fuel cycle case .....................................................................................................................................120
Figure 82 Mass of fuel from each reactor type reprocessed in each year for the LWR to HWR modified
open fuel cycle case ............................................................................................................................120
Figure 83 Mass of fuel from each reactor type reprocessed in each year for the LWR to HWR modified
open fuel cycle case, with the y-axis magnified. Note that the top of the peak is 46 kt......................121
Figure 84 Source of americium, internal or external to the scenario, used to fabricate fuel, in each year for
LWR to HWR modified open fuel cycle case. ....................................................................................121
Figure 85 Source of curium, internal or external to the scenario, used to fabricate fuel, in each year for
LWR to HWR modified open fuel cycle case. ....................................................................................122
Figure 86 Total cumulative uranium consumption for the five cases ..........................................................123

xvii
Figure 87 Total mass of plutonium in the fuel cycle in each year for the five cases ...................................124
Figure 88 Total mass of plutonium in waste, including dry storage, wet storage, and high level waste from
reprocessing for each of the five base cases .......................................................................................125
Figure 89 Spent fuel in wet and dry storage in each year for the five cases ................................................126
Figure 90 Spent fuel in wet and dry storage in each year for the five cases, magnified y-axis. ..................127
Figure 91 Mass of fuel reprocessed in each year for the five cases, magnified y-axis. Note that the top of
the peak is 45 kt. .................................................................................................................................128
Figure 92 Mass of external Am used to fabricate fuel, in each year for the five base cases........................129
Figure 93 Mass of Cm external to the scenario, used to fabricate fuel, in each year for the five base cases
............................................................................................................................................................130
Figure 94 Electrical capacity in each year for each reactor type for the LWR and fast reactor case with the
fast reactor power de-rated .................................................................................................................134
Figure 95 Number of operating reactors in each year for each reactor type for the LWR and fast reactor
case with the fast reactor power de-rated ............................................................................................134
Figure 96 Electrical capacity in each year for each reactor type for the HWR intermediate burner case with
de-rated fast reactors ...........................................................................................................................135
Figure 97 Number of reactors operating in each year for each reactor type for the HWR intermediate burner
case with de-rated fast reactors ...........................................................................................................135
Figure 98 Cumulative consumed uranium ore for each reactor type for the HWR intermediate burner case
with de-rated fast reactors ...................................................................................................................136
Figure 99 Mass of fuel from each reactor type reprocessed in each year for the HWR intermediate burner
case, with the fast reactor power de-rated, with the y-axis magnified. Note that the peak is 45 kt. ...136
Figure 100 Source of americium, internal or external to the scenario, used to fabricate fuel, in each year for
the HWR intermediate burner case with de-rated fast reactors ...........................................................137
Figure 101 Source of curium, internal or external to the scenario, used to fabricate fuel, in each year for the
HWR intermediate burner case with de-rated fast reactors.................................................................137
Figure 102 Electrical capacity in each year for each reactor type for the HWR intermediate burner with
LWR-derived fuel fast reactors case with de-rated fast reactors ........................................................138
Figure 103 The number of operating reactors in each year for each reactor type for the HWR intermediate
burner with LWR-derived fuel fast reactors case with de-rated fast reactors .....................................138
Figure 104 Cumulative consumed uranium ore for each reactor type for the HWR intermediate burner with
LWR-derived fuel fast reactors case with de-rated fast reactors ........................................................139
Figure 105 Mass of fuel from each reactor type reprocessed in each year for the HWR intermediate burner
with LWR-derived fuel fast reactors case, with the fast reactor power de-rated, with the y-axis
magnified. Note that the peak is 45 kt. ...............................................................................................139
Figure 106 Source of curium, internal or external to the scenario, used to fabricate fuel, in each year for the
HWR intermediate burner with LWR-derived fuel fast reactors case, with the fast reactor power de-
rated ....................................................................................................................................................140
Figure 107 Source of americium, internal or external to the scenario, used to fabricate fuel, in each year for
the HWR intermediate burner with LWR-derived fuel fast reactors case with de-rated fast reactors 140
xviii
Figure 108 Electrical capacity in each year for each reactor type for the LWR and fast reactor case with no
legacy spent fuel .................................................................................................................................143
Figure 109 Mass of fuel from each reactor type reprocessed in each year for the LWR and fast reactor case
with no legacy spent fuel ....................................................................................................................143
Figure 110 Electrical capacity in each year for each reactor type for the HWR intermediate burner case with
no legacy spent fuel ............................................................................................................................144
Figure 111 Mass of fuel from each reactor type reprocessed in each year for the HWR intermediate burner
case with no legacy spent fuel ............................................................................................................144
Figure 112 Electrical capacity in each year for each reactor type for the HWR intermediate burner with
LWR-derived fuel fast reactors case with no legacy spent fuel ..........................................................145
Figure 113 Mass of fuel from each reactor type reprocessed in each year for the HWR intermediate burner
with LWR-derived fuel fast reactors case with no legacy spent fuel ..................................................145
Figure 114 Electrical capacity in each year for each reactor type for the LWR to HWR modified open fuel
cycle case with no legacy spent fuel ...................................................................................................146
Figure 115 Mass of fuel from each reactor type reprocessed in each year for the LWR to HWR modified
open fuel cycle case with no legacy spent fuel ...................................................................................146
Figure 116 Source of americium, internal or external to the scenario, used to fabricate fuel, in each year for
the LWR to HWR modified open fuel cycle case with no legacy spent fuel ......................................147
Figure 117 Electrical capacity in each year for each reactor type for the LWR with fast reactors case with
capped reprocessing capacity ..............................................................................................................148
Figure 118 Mass of fuel reprocessed in each year for each reactor type for the LWR with fast reactors case
with capped reprocessing capacity ......................................................................................................148
Figure 119 Mass of fuel reprocessed in each year for each reactor type for the LWR with fast reactors case
with capped reprocessing capacity, with magnified axis. Note that the peak is 45 kt. .......................149
Figure 120 Electrical capacity in each year for each reactor type for the HWR intermediate actinide burner
case with capped reprocessing capacity ..............................................................................................149
Figure 121 The number of operating reactors in each year for each reactor type for the HWR intermediate
actinide burner case with capped reprocessing capacity .....................................................................150
Figure 122 Mass of fuel reprocessed in each year for each reactor type for the HWR intermediate actinide
burner case with capped reprocessing capacity ..................................................................................150
Figure 123 Mass of fuel reprocessed in each year for each reactor type for the HWR intermediate actinide
burner case with capped reprocessing capacity, with magnified axis. Note that the top of the peak is
45 kt. ...................................................................................................................................................151
Figure 124 Electrical capacity in each year for each reactor type for the HWR intermediate burner with
LWR-derived fuel fast reactors case with capped reprocessing capacity ...........................................151
Figure 125 Number of operating reactors in each year for each reactor type for the HWR intermediate
burner with LWR-derived fuel fast reactors case with capped reprocessing capacity ........................152
Figure 126 Cumulative consumed uranium ore for each reactor type for the HWR intermediate burner with
LWR-derived fuel fast reactors case with capped reprocessing capacity ...........................................152

xix
Figure 127 Mass of fuel reprocessed in each year for each reactor type for the HWR intermediate burner
with LWR-derived fuel fast reactors case with capped reprocessing capacity ...................................153
Figure 128 Mass of fuel reprocessed in each year for each reactor type for the HWR intermediate burner
with LWR-derived fuel fast reactors case with capped reprocessing capacity, with the y-axis
magnified. Note that the top of the peak is 45 kt. ...............................................................................153
Figure 129 Source of americium, internal or external to the scenario, used to fabricate fuel, in each year for
the HWR intermediate burner with LWR-derived fuel fast reactors case with capped reprocessing
capacity ...............................................................................................................................................154
Figure 130 Source of curium, internal or external to the scenario, used to fabricate fuel, in each year for the
HWR intermediate burner with LWR-derived fuel fast reactors case with capped reprocessing
capacity ...............................................................................................................................................154
Figure 131 Electrical capacity in each year for each reactor type for the LWR to HWR modified open fuel
cycle case with capped reprocessing capacity ....................................................................................155
Figure 132 Number of operating reactors in each year for each reactor type for the LWR to HWR modified
open fuel cycle case with capped reprocessing capacity.....................................................................155
Figure 133 Mass of fuel reprocessed in each year for each reactor type for the LWR to HWR modified open
fuel cycle case with capped reprocessing capacity .............................................................................156
Figure 134 Mass of fuel reprocessed in each year for each reactor type for the LWR to HWR modified open
fuel cycle case with capped reprocessing capacity, with the y-axis magnified. Note that the top of the
peak is 45 kt. .......................................................................................................................................156
Figure 135 Source of americium, internal or external to the scenario, used to fabricate fuel, in each year for
the LWR to HWR modified open fuel cycle case with capped reprocessing capacity .......................157
Figure 136 Electrical capacity in each year for each reactor type for the LWR with fast reactors fuel cycle
case with fast reactor operation delayed to 2050 ................................................................................159
Figure 137 The number of operating reactors in each year for each reactor type for the LWR with fast
reactors fuel cycle case with fast reactor operation delayed to 2050 ..................................................159
Figure 138 Cumulative uranium ore consumption in each year for each reactor type for the LWR with fast
reactors fuel cycle case with fast reactor operation delayed to 2050 ..................................................160
Figure 139 Mass of fuel reprocessed in each year for each reactor type for the LWR with fast reactors fuel
cycle case with fast reactor operation delayed to 2050, with y-axis magnified. Note that the top of the
peak is 45 kt. .......................................................................................................................................160
Figure 140 Source of americium, internal or external to the scenario, used to fabricate fuel, in each year for
the LWR with fast reactors fuel cycle case with fast reactor operation delayed to 2050 ....................161
Figure 141 Electrical capacity in each year for each reactor type for the HWR intermediate actinide burner
case with fast reactor operation delayed to 2050 ................................................................................161
Figure 142 The number of operating reactors in each year for each reactor type for the HWR intermediate
actinide burner case with fast reactor operation delayed to 2050 .......................................................162
Figure 143 Mass of fuel reprocessed in each year for each reactor type for the HWR intermediate actinide
burner case with fast reactor operation delayed to 2050, with the y-axis magnified. Note that the top
of the peak is 45 kt. .............................................................................................................................162

xx
Figure 144 Source of curium, internal or external to the scenario, used to fabricate fuel, in each year for the
HWR intermediate actinide burner case with fast reactor operation delayed to 2050 ........................163
Figure 145 Electrical capacity in each year for each reactor type for the HWR intermediate burner with
LWR-derived fuel fast reactors case, with fast reactor operation delayed to 2050 .............................163
Figure 146 The number of operating reactors in each year for each reactor type for the HWR intermediate
burner with LWR-derived fuel fast reactors case, with fast reactor operation delayed to 2050 .........164
Figure 147 Cumulative consumed uranium ore in each year for each reactor type for the HWR intermediate
burner with LWR-derived fuel fast reactors case, with fast reactor operation delayed to 2050 .........164
Figure 148 Mass of fuel reprocessed in each year for each reactor type for the HWR intermediate burner
with LWR-derived fuel fast reactors case, with fast reactor operation delayed to 2050, with y-axis
magnified. Note that the top of the peak is 45 kt. ...............................................................................165
Figure 149 Source of americium, internal or external to the scenario, used to fabricate fuel, in each year for
the HWR intermediate burner with LWR-derived fuel fast reactors case, with fast reactor operation
delayed to 2050 ...................................................................................................................................165
Figure 150 Source of curium, internal or external to the scenario, used to fabricate fuel, in each year for the
HWR intermediate burner with LWR-derived fuel fast reactors case, with fast reactor operation
delayed to 2050 ...................................................................................................................................166
Figure 151 Total mass of plutonium in the fuel cycle in each year for the sensitivity cases for the LWR with
fast reactors scenario ...........................................................................................................................168
Figure 152 Total mass of plutonium in waste, including dry storage, wet storage, and high level waste from
reprocessing for the LWR with fast reactors scenario sensitivity cases ..............................................169
Figure 153 Spent fuel in wet and dry storage in each year for the sensitivity cases for the LWR with fast
reactors scenario. The de-rated case behaves as per the base case prior to the year 2115. .................169
Figure 154 Total mass of plutonium in the fuel cycle in each year for the sensitivity cases for the HWR
intermediate burner scenario ...............................................................................................................170
Figure 155 Total mass of plutonium in waste, including dry storage, wet storage, and high level waste from
reprocessing for the HWR intermediate burner scenario sensitivity cases .........................................170
Figure 156 Spent fuel in wet and dry storage in each year for the sensitivity cases for the HWR
intermediate burner scenario. The de-rated case behaves as per the base case prior to the year 2115.
............................................................................................................................................................171
Figure 157 Total mass of plutonium in the fuel cycle in each year for the sensitivity cases for the HWR
intermediate burner with LWR-derived fuel fast reactors scenario ....................................................171
Figure 158 Total mass of plutonium in waste, including dry storage, wet storage, and high level waste from
reprocessing for the HWR intermediate burner with LWR-derived fuel fast reactors scenario
sensitivity cases ..................................................................................................................................172
Figure 159 Spent fuel in wet and dry storage in each year for the sensitivity cases for the HWR
intermediate burner with LWR-derived fuel fast reactors scenario ....................................................172
Figure 160 Total mass of plutonium in the fuel cycle in each year for the sensitivity cases for the LWR to
HWR modified open fuel cycle scenario ............................................................................................173
Figure 161 Total mass of plutonium in waste, including dry storage, wet storage, and high level waste from
reprocessing for the LWR to HWR modified open fuel cycle scenario sensitivity cases ...................173
xxi
Figure 162 Spent fuel in wet and dry storage in each year for the sensitivity cases for the LWR to HWR
modified open fuel cycle scenario ......................................................................................................174
Figure 163 Separated plutonium available for fuel fabrication for cases 2, 3, and 4, the three base cases with
fast reactors. ........................................................................................................................................175
Figure 164 Capture (green) and fission (blue) cross-sections for Pu-238. ..................................................193
Figure 165 Capture (green) and fission (blue) cross-sections for Pu-239. ..................................................194
Figure 166 Capture (green) and fission (blue) cross-sections for Pu-240. ..................................................194
Figure 167 Capture (green) and fission (blue) cross-sections for Am-241 ..................................................195
Figure 168 Capture (green) and fission (blue) cross-sections for Am-243 ..................................................195
Figure 169 Capture (green) and fission (blue) cross-sections for Cm-244 ..................................................196
Figure 170 Number of new reactors brought online in each year for each reactor type for the LWR and fast
reactor case with the fast reactor power de-rated ................................................................................197
Figure 171 Cumulative uranium ore consumption for each reactor type for the LWR and fast reactor case
with the fast reactor power de-rated ....................................................................................................198
Figure 172 Mass of fuel from each reactor type reprocessed in each year for the LWR and fast reactor case,
with the fast reactor power de-rated, with the y-axis magnified. Note that the peak is 45 kt. ............198
Figure 173 Source of americium, internal or external to the scenario, used to fabricate fuel, in each year for
the LWR and fast reactor case, with the fast reactor power de-rated ..................................................199
Figure 174 Source of curium, internal or external to the scenario, used to fabricate fuel, in each year for the
LWR and fast reactor case, with the fast reactor power de-rated .......................................................199
Figure 175 The number of new reactors brought online in each year for each reactor type for the HWR
intermediate burner case with de-rated fast reactors ...........................................................................200
Figure 176 The number of new reactors brought online in each year for each reactor type for the HWR
intermediate burner with LWR-derived fuel fast reactors case with de-rated fast reactors ................200
Figure 177 The number of operating reactors in each year for each reactor type for the LWR and fast
reactor case with no legacy spent fuel ................................................................................................201
Figure 178 The number of new reactors brought online in each year for each reactor type for the LWR and
fast reactor case with no legacy spent fuel ..........................................................................................201
Figure 179 Cumulative consumed uranium ore for each reactor type for the LWR and fast reactor case with
no legacy spent fuel ............................................................................................................................202
Figure 180 Mass of fuel from each reactor type reprocessed in each year for the LWR and fast reactor case
with no legacy spent fuel, with the y-axis magnified. Note that the peak is 45 kt. .............................202
Figure 181 Source of americium, internal or external to the scenario, used to fabricate fuel, in each year for
the LWR and fast reactor case with no legacy spent fuel ...................................................................203
Figure 182 Source of curium, internal or external to the scenario, used to fabricate fuel, in each year for the
LWR and fast reactor case with no legacy spent fuel .........................................................................203
Figure 183 The number of operating reactors in each year for each reactor type for the HWR intermediate
burner case with no legacy spent fuel .................................................................................................204

xxii
Figure 184 The number of new reactors brought online in each year for each reactor type for the HWR
intermediate burner case with no legacy spent fuel ............................................................................204
Figure 185 Cumulative uranium ore consumption for each reactor type for the HWR intermediate burner
case with no legacy spent fuel ............................................................................................................205
Figure 186 Mass of fuel from each reactor type reprocessed in each year for the HWR intermediate burner
case with no legacy spent fuel, with the y-axis magnified. Note that the peak is 45 kt. .....................205
Figure 187 Source of americium, internal or external to the scenario, used to fabricate fuel, in each year for
the HWR intermediate burner case with no legacy spent fuel ............................................................206
Figure 188 Source of curium, internal or external to the scenario, used to fabricate fuel, in each year for the
HWR intermediate burner case with no legacy spent fuel ..................................................................206
Figure 189 The number of operating reactors in each year for each reactor type for the HWR intermediate
burner with LWR-derived fuel fast reactors case with no legacy spent fuel ......................................207
Figure 190 The number of new reactors brought online in each year for each reactor type for the HWR
intermediate burner with LWR-derived fuel fast reactors case with no legacy spent fuel ..................207
Figure 191 Cumulative consumed uranium ore for each reactor type for the HWR intermediate burner with
LWR-derived fuel fast reactors case with no legacy spent fuel ..........................................................208
Figure 192 Mass of fuel from each reactor type reprocessed in each year for the HWR intermediate burner
with LWR-derived fuel fast reactors case with no legacy spent fuel, with the y-axis magnified. Note
that the peak is 45 kt. ..........................................................................................................................208
Figure 193 Source of americium, internal or external to the scenario, used to fabricate fuel, in each year for
the HWR intermediate burner with LWR-derived fuel fast reactors case with no legacy spent fuel ..209
Figure 194 Source of curium, internal or external to the scenario, used to fabricate fuel, in each year for the
HWR intermediate burner with LWR-derived fuel fast reactors case with no legacy spent fuel .......209
Figure 195 The number of operating reactors in each year for each reactor type for the LWR to HWR
modified open fuel cycle case with no legacy spent fuel ....................................................................210
Figure 196 The number of new reactors brought online in each year for each reactor type for the LWR to
HWR modified open fuel cycle case with no legacy spent fuel ..........................................................210
Figure 197 Cumulative uranium ore consumed for each reactor type for the LWR to HWR modified open
fuel cycle case with no legacy spent fuel ............................................................................................211
Figure 198 Mass of fuel from each reactor type reprocessed in each year for the LWR to HWR modified
open fuel cycle case with no legacy spent fuel, with the y-axis magnified. Note that the peak is 45 kt.
............................................................................................................................................................211
Figure 199 The number of operating reactors in each year for each reactor type for the LWR with fast
reactors case with capped reprocessing capacity ................................................................................212
Figure 200 The number of new reactors brought online in each year for each reactor type for the LWR with
fast reactors case with capped reprocessing capacity .........................................................................212
Figure 201 Cumulative consumed uranium ore for each reactor type for the LWR with fast reactors case
with capped reprocessing capacity ......................................................................................................213
Figure 202 Source of americium, internal or external to the scenario, used to fabricate fuel, in each year for
the LWR with fast reactors case with capped reprocessing capacity ..................................................213
xxiii
Figure 203 Source of curium, internal or external to the scenario, used to fabricate fuel, in each year for the
LWR with fast reactors case with capped reprocessing capacity ........................................................214
Figure 204 The number of new reactors brought online in each year for each reactor type for the HWR
intermediate actinide burner case with capped reprocessing capacity ................................................214
Figure 205 Cumulative consumed uranium ore for each reactor type for the HWR intermediate actinide
burner case with capped reprocessing capacity ..................................................................................215
Figure 206 Source of americium, internal or external to the scenario, used to fabricate fuel, in each year for
the HWR intermediate actinide burner case with capped reprocessing capacity ................................215
Figure 207 Source of curium, internal or external to the scenario, used to fabricate fuel, in each year for the
HWR intermediate actinide burner case with capped reprocessing capacity ......................................216
Figure 208 Number of new reactors brought online in each year for each reactor type for the HWR
intermediate burner with LWR-derived fuel fast reactors case with capped reprocessing capacity ...216
Figure 209 The number of new reactors brought online in each year for each reactor type for the LWR to
HWR modified open fuel cycle case with capped reprocessing capacity ...........................................217
Figure 210 Cumulative consumed uranium ore for each reactor type for the LWR to HWR modified open
fuel cycle case with capped reprocessing capacity .............................................................................217
Figure 211 Source of curium, internal or external to the scenario, used to fabricate fuel, in each year for the
LWR to HWR modified open fuel cycle case with capped reprocessing capacity .............................218
Figure 212 The number of new reactors brought online in each year for each reactor type for the LWR with
fast reactors fuel cycle case with fast reactor operation delayed to 2050 ...........................................219
Figure 213 Mass of fuel reprocessed in each year for each reactor type for the LWR with fast reactors fuel
cycle case with fast reactor operation delayed to 2050 .......................................................................219
Figure 214 Source of curium, internal or external to the scenario, used to fabricate fuel, in each year for the
LWR with fast reactors fuel cycle case with fast reactor operation delayed to 2050 .........................220
Figure 215 The number of new reactors brought online in each year for each reactor type for the HWR
intermediate actinide burner case with fast reactor operation delayed to 2050 ..................................220
Figure 216 Cumulative uranium ore consumption in each year for each reactor type for the HWR
intermediate actinide burner case with fast reactor operation delayed to 2050 ..................................221
Figure 217 Mass of fuel reprocessed in each year for each reactor type for the HWR intermediate actinide
burner case with fast reactor operation delayed to 2050 .....................................................................221
Figure 218 Source of americium, internal or external to the scenario, used to fabricate fuel, in each year for
the HWR intermediate actinide burner case with fast reactor operation delayed to 2050 ..................222
Figure 219 The number of new reactors brought online in each year for each reactor type for the HWR
intermediate burner with LWR-derived fuel fast reactors case, with fast reactor operation delayed to
2050 ....................................................................................................................................................222
Figure 220 Mass of fuel reprocessed in each year for each reactor type for the HWR intermediate burner
with LWR-derived fuel fast reactors case, with fast reactor operation delayed to 2050 .....................223
Figure 221 Cumulative consumed uranium ore for the sensitivity cases for the LWR with fast reactors
scenario ...............................................................................................................................................224

xxiv
Figure 222 Mass of fuel reprocessed in each year for the sensitivity cases for the LWR with fast reactors
scenario ...............................................................................................................................................224
Figure 223 Mass of fuel reprocessed in each year for the sensitivity cases for the LWR with fast reactors
scenario, with axis magnified .............................................................................................................225
Figure 224 Source of americium, internal or external to the scenario, used to fabricate fuel, in each year for
the sensitivity cases for the LWR with fast reactors scenario .............................................................225
Figure 225 Source of curium internal or external to the scenario, used to fabricate fuel, in each year for the
sensitivity cases for the LWR with fast reactors scenario ...................................................................226
Figure 226 Cumulative consumed uranium ore for the sensitivity cases for the HWR intermediate burner
scenario ...............................................................................................................................................226
Figure 227 Mass of fuel reprocessed in each year for the sensitivity cases for the HWR intermediate burner
scenario ...............................................................................................................................................227
Figure 228 Mass of fuel reprocessed in each year for the sensitivity cases for the HWR intermediate burner
scenario, with axis magnified .............................................................................................................227
Figure 229 Source of americium, internal or external to the scenario, used to fabricate fuel, in each year for
the sensitivity cases for the HWR intermediate burner scenario ........................................................228
Figure 230 Source of curium, internal or external to the scenario, used to fabricate fuel, in each year for the
sensitivity cases for the HWR intermediate burner scenario ..............................................................228
Figure 231 Cumulative consumed uranium ore for the sensitivity cases for the HWR intermediate burner
with LWR-derived fuel fast reactors scenario ....................................................................................229
Figure 232 Mass of fuel reprocessed in each year for the sensitivity cases for the HWR intermediate burner
with LWR-derived fuel fast reactors scenario ....................................................................................229
Figure 233 Mass of fuel reprocessed in each year for the sensitivity cases for the HWR intermediate burner
with LWR-derived fuel fast reactors scenario, with axis magnified ...................................................230
Figure 234 Source of americium, internal or external to the scenario, used to fabricate fuel, in each year for
the sensitivity cases for the HWR intermediate burner with LWR-derived fuel fast reactors scenario
............................................................................................................................................................230
Figure 235 Source of curium, internal or external to the scenario, used to fabricate fuel, in each year for the
sensitivity cases for the HWR intermediate burner with LWR-derived fuel fast reactors scenario ....231
Figure 236 Cumulative consumed uranium ore for the sensitivity cases for the LWR to HWR modified
open fuel cycle scenario ......................................................................................................................231
Figure 237 Mass of spent fuel reprocessed in each year for the sensitivity cases for the LWR to HWR
modified open fuel cycle scenario ......................................................................................................232
Figure 238 Mass of spent fuel reprocessed in each year for the sensitivity cases for the LWR to HWR
modified open fuel cycle scenario, with axis magnified .....................................................................232
Figure 239 Source of americium, internal or external to the scenario, used to fabricate fuel, in each year for
the sensitivity cases for the LWR to HWR modified open fuel cycle scenario ..................................233

xxv
NOMENCLATURE
List of Abbreviations
Abbreviation Long Form
ADS Accelerator Driven System
AECL Atomic Energy of Canada Limited
CANDU CANadian Deuterium Uranium
CEA Commissariat à l’énergie atomique
CDS Control and Shutdown Devices
CED Committed Effective Dose
CERMET Ceramic Metallic
CF Capacity Factor
CNL Canadian Nuclear Laboratories
CVR Coolant Void Reactivity
DFBR Demonstration Fast Breeder Reactor
DGR Deep Geological Repository
DSD Diverse Shutdown Device
DU Depleted Uranium
EFPD Effective Full Power Days
EG-AFCS Expert Group on Advanced Fuel Cycle Scenarios
ENDF Evaluated Nuclear Data File
ESFR European Sodium-cooled Fast Reactor
FaCT FAst reactor Cycle Technology development project
FP Fission Product
FR Fast Reactor
FTC Fuel Temperature Coefficient
GIF Generation-IV International Forum
HAC Highly Advanced CANDU
HLW High Level Waste
HWR Heavy Water Reactor
IHE Initial Heavy Elements
IMF Inert Matrix Fuel
ITU Initial TransUranic elements
JEFF Joint Evaluated Fission and Fusion File
JNC Japan Nuclear Cycle Development Institute
JSFR JNC Sodium-Cooled Fast Reactor
KAERI Korean Atomic Energy Research Institute
LER Linear Element Rating
LWR Light Water Reactors
MA Minor Actinides (namely Am, Cm, and Np)
MCNP Monte Carlo N-Particle
MOX Mixed Oxide
NEA Nuclear Energy Agency
NU Natural Uranium
OECD Organization for Economic Cooperation and Development
pBOC pseudo-Beginning Of Cycle
xxvi
Abbreviation Long Form
pEOC pseudo-End Of Cycle
PWR Pressurized Water Reactor
RU Recycled Uranium also may be called Reprocessed or
Recovered Uranium
SANEX Selective Actinide EXtraction
SFR Sodium-cooled Fast Reactor
SNF Spent Nuclear Fuel
SVRE Sodium Void Reactivity Effect
TRL Technology Readiness Level
TRU Transuranic nuclides, or Transuranic elements
WIMS Winfrith Improved Multigroup Scheme
ULOF Unprotected Loss Of Flow
ULOHS Unprotected Loss Of Heat Sink
UREX URanium EXtraction
USD US Dollars
UTOP Unprotected Transient Overpower
VISION Verifiable Fuel Cycle Simulation

xxvii
List of Symbols
Symbol Description
eff Effective delayed neutron fraction
BU burnup
k Thermal conductivity
k∞ Infinite lattice neutron multiplication factor
Kd Doppler coefficient
keff Effective neutron multiplication factor
l Stretched length of the fuel stack
mf Final mass
mi Initial mass
nbundles Number of bundles in one channel
nchannels Number of channels in one reactor
(voided) Reactivity of the voided core
(cooled) Reactivity of the cooled core
r Radial position
R Outer fuel radius
Tcoolant Coolant temperature
Tfuel Fuel temperature
Thigh Upper temperature
tirr Irradiation time
Tlow Lower temperature

1
1 INTRODUCTION AND LITERATURE REVIEW There are three main concerns that affect the widespread adoption and expansion of nuclear
power: safety, economics, and management of the spent nuclear fuel (SNF). This thesis will
consider methods to alleviate concerns surrounding SNF by reducing the amount of long-lived
transuranic nuclides (TRU, namely Pu, Np, Am, and Cm) and minor actinides (MA, namely Am,
Cm, and Np).
Many countries, e.g., [1] to [4] are researching methods to separate MA from SNF, and then
transmute the actinides into shorter-lived nuclides, thus reducing the long term radioactivity and
radiotoxicity of the spent fuel. The two leading candidate technologies worldwide to transmute
the actinides are fast reactors and accelerator driven systems (ADS)1.
In recent years studies have been performed at Canadian Nuclear Laboratories (CNL) and its
predecessor Atomic Energy of Canada Limited (AECL) to investigate the potential of the heavy
water reactors (HWR) to transmute minor actinides [5] to [11]. This has been studied as a stand-
alone burner of MA, and also hypothesized to have benefits as an intermediate burner prior to
further transmutation by fast reactors.
Employing HWRs as intermediate actinide burners prior to transitioning to a full fast reactor fuel
cycle is anticipated to have some advantages. HWRs are a mature technology that is
commercially available today. Though actinide bearing fuels are not currently used in these
reactors, it is highly likely that deploying these fuels in HWRs can occur much quicker than in
fast reactors. Though there are many fast reactors, both commercial power generating reactors
and prototype reactors in operation, they are not considered a mature technology, and widespread
use of these reactors to reduce the actinide inventory will take longer to implement than in
HWRs. The use of HWRs to bridge the gap to a fast reactor fuel cycle is under study here, and it
is hypothesized that this will enable a quicker transition to fast reactors, and require fewer fast
reactors in the reactor mix for the future fuel cycle, and consequently lead to improvements in the
management of spent fuel.
The research, design, and development of any new advanced reactor or advanced fuel is a long,
complex, and expensive endeavour. Before investing in such a venture it is expedient to model
the fuel cycle in order to assess whether the advanced reactor and advanced fuels will have the
expected advantage, to what degree and under what circumstances, and to guide the research
program.
The literature on the partitioning and transmutation of minor actinides is extensive. Research has
been conducted around the world on this topic since the start of the nuclear power industry. This
1 Though not intended to be a subject of this thesis work, ADS are a transmutation technology that are
being studied extensively in some countries. An ADS combines an accelerator and a subcritical reactor
core. Protons from the accelerator, typically around 1GeV, are injected into the subcritical onto a spallation
target. This produces neutrons, which drive the nuclear reaction in the core. Since the system has a neutron
multiplication factor of less than 1, there are additional safety characteristics not available to conventional
reactors.

2
full body of work is much too large to fully review here. A few relevant and recent studies will
briefly discussed in this chapter.
1.1 Overview of Reactor Types
Nuclear reactors can be divided into two categories, depending on the speed of neutrons used to
sustain the critical nuclear reaction. Thermal reactors contain a neutron moderator that functions
to slow neutrons down, while fast reactors maintain the neutrons at the high energies with which
they are produced. Thermal and fast reactors can further be categorized according to which
neutron moderator they employ to slow neutrons, and which coolant is used extract heat from the
reactor. Three nuclear reactor types are included in this work, two thermal reactors and one fast
reactor: light water reactors (LWR), heavy water reactors (HWR) and fast reactors (FR). The
specific reactor types studied here are:
Light water reactor: the pressurized water reactor, which uses light water as both coolant
and moderator
Heavy water reactor: the CANDU (CANadian Deuterium Uranium) reactor, which uses
heavy water as both coolant and moderator
Fast reactor: the sodium-cooled fast reactor, which uses liquid sodium as coolant (no
moderator)
1.1.1 Light Water Reactors
Light water reactors are the most prevalent type of nuclear reactor in operation today. 363 of the
444 operating reactors (82%) are LWRs, which represents 89% of the net electrical capacity (342
GW of a total 386 GW) [12]. As LWRs comprise such a large portion of the world’s nuclear
energy capacity, it makes sense to initiate a generic fuel cycle model using this reactor type.
A pressurized water reactor (PWR) uses liquid light water as both coolant and neutron moderator,
Figure 1. The reactor core is housed inside of a pressure vessel, which maintains the water at a
high pressure or around 15MPa, required to prevent the water from boiling. Cool water enters the
reactor vessel, passes through the fuel assemblies, where it is heated up, and then exits the vessel.
This heated water then passes through a steam generator, where the heat is transferred into the
secondary system, producing pressurized steam, which in turn is used to power the turbine and
create electricity.
The high neutron absorbing materials, such as light water and stainless steel, used in PWRs
requires the use of enriched uranium as fuel. Enrichment levels as well as fuel burnup have been
increasing with time. Current PWR fuel enrichment is generally around 4.0-4.75 wt%U-235, and
burnups are typically around 45MWd kg-1.
CANDU is a registered trademark of Atomic Energy of Canada Limited (AECL).
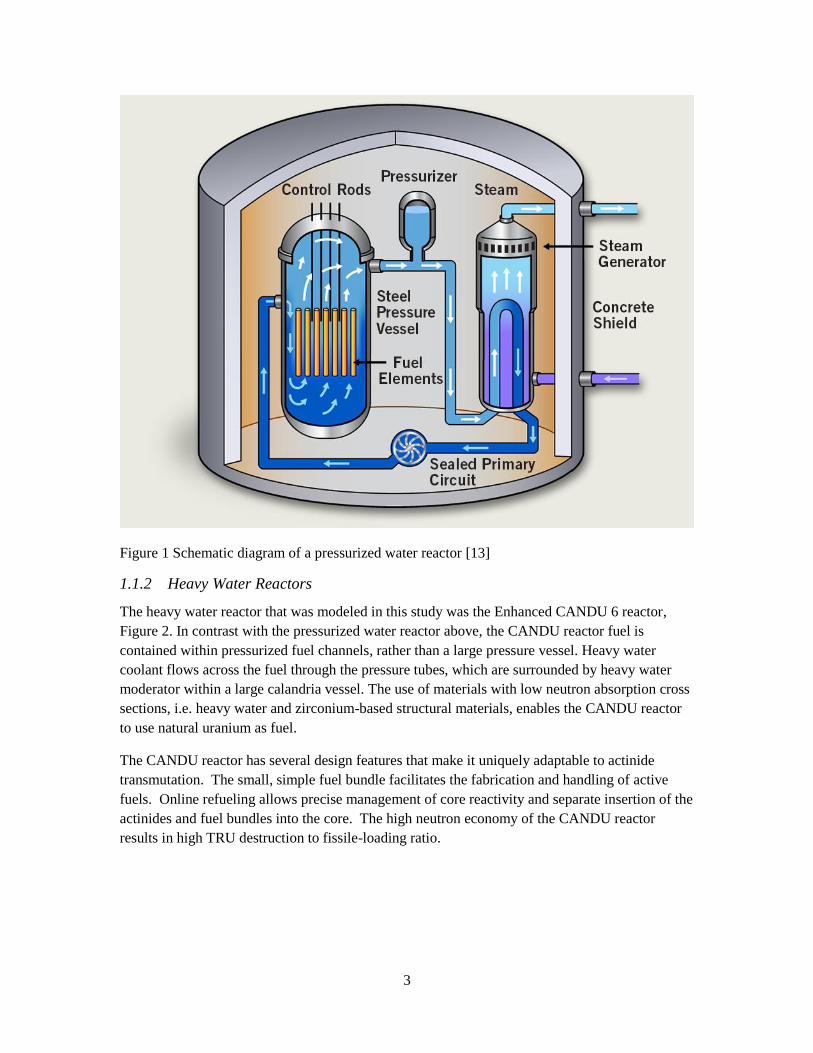
3
Figure 1 Schematic diagram of a pressurized water reactor [13]
1.1.2 Heavy Water Reactors
The heavy water reactor that was modeled in this study was the Enhanced CANDU 6 reactor,
Figure 2. In contrast with the pressurized water reactor above, the CANDU reactor fuel is
contained within pressurized fuel channels, rather than a large pressure vessel. Heavy water
coolant flows across the fuel through the pressure tubes, which are surrounded by heavy water
moderator within a large calandria vessel. The use of materials with low neutron absorption cross
sections, i.e. heavy water and zirconium-based structural materials, enables the CANDU reactor
to use natural uranium as fuel.
The CANDU reactor has several design features that make it uniquely adaptable to actinide
transmutation. The small, simple fuel bundle facilitates the fabrication and handling of active
fuels. Online refueling allows precise management of core reactivity and separate insertion of the
actinides and fuel bundles into the core. The high neutron economy of the CANDU reactor
results in high TRU destruction to fissile-loading ratio.
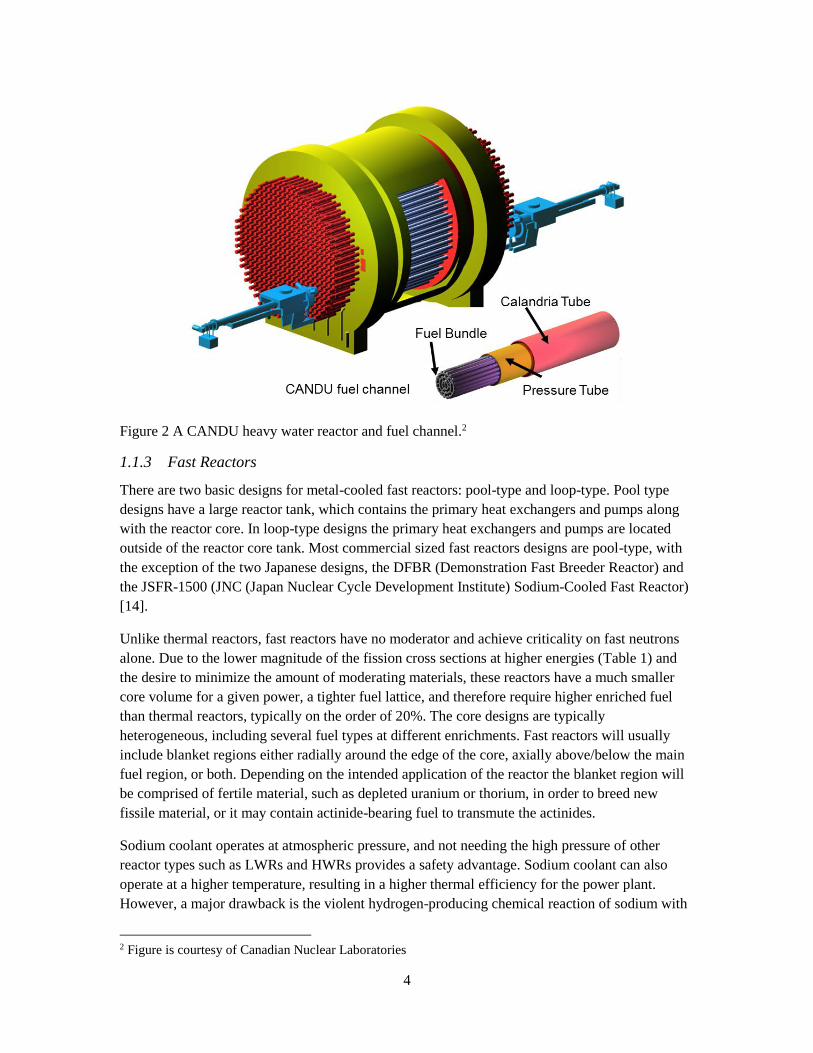
4
Figure 2 A CANDU heavy water reactor and fuel channel.2
1.1.3 Fast Reactors
There are two basic designs for metal-cooled fast reactors: pool-type and loop-type. Pool type
designs have a large reactor tank, which contains the primary heat exchangers and pumps along
with the reactor core. In loop-type designs the primary heat exchangers and pumps are located
outside of the reactor core tank. Most commercial sized fast reactors designs are pool-type, with
the exception of the two Japanese designs, the DFBR (Demonstration Fast Breeder Reactor) and
the JSFR-1500 (JNC (Japan Nuclear Cycle Development Institute) Sodium-Cooled Fast Reactor)
[14].
Unlike thermal reactors, fast reactors have no moderator and achieve criticality on fast neutrons
alone. Due to the lower magnitude of the fission cross sections at higher energies (Table 1) and
the desire to minimize the amount of moderating materials, these reactors have a much smaller
core volume for a given power, a tighter fuel lattice, and therefore require higher enriched fuel
than thermal reactors, typically on the order of 20%. The core designs are typically
heterogeneous, including several fuel types at different enrichments. Fast reactors will usually
include blanket regions either radially around the edge of the core, axially above/below the main
fuel region, or both. Depending on the intended application of the reactor the blanket region will
be comprised of fertile material, such as depleted uranium or thorium, in order to breed new
fissile material, or it may contain actinide-bearing fuel to transmute the actinides.
Sodium coolant operates at atmospheric pressure, and not needing the high pressure of other
reactor types such as LWRs and HWRs provides a safety advantage. Sodium coolant can also
operate at a higher temperature, resulting in a higher thermal efficiency for the power plant.
However, a major drawback is the violent hydrogen-producing chemical reaction of sodium with
2 Figure is courtesy of Canadian Nuclear Laboratories

5
water. This necessitates the addition of an additional thermal loop, and mandates extra care in the
fabrication of the Na-H2O steam generator. Sodium also reacts exothermically with air, as
experienced by the experimental MONJU reactor in Japan. However, this technology has been
operated in several instances, including the experimental reactor Rapsodie, the prototype Phénix
and the full-scale prototype Superphénix reactors in France. This history of operation shows that
this technology is available.
This work will only consider sodium-cooled fast reactors (SFR). SFRs are the leading candidate
for fast reactors. In the world today all of the experimental fast reactors are sodium-cooled; ten of
the demonstration/prototype fast reactors are sodium-cooled, versus two lead-cooled; eleven of
the commercial sized fast reactors are sodium-cooled versus two lead-cooled [14]. These are also
the fast reactor type that is most actively being researched. At a recent advanced fuel cycle
conference, Global 2011: Toward and Over the Fukushima Accident, in Makuhari, Japan, there
were approximately 56 papers discussing SFR and 16 for lead-cooled fast reactors (including
lead-cooled ADS).
Table 1 Fission and capture cross-sections in thermal and fast neutron spectra for important
transuranic nuclides [17].
Nuclide Thermal Spectrum (barns) Fast Spectrum (barns)
Fission Capture C/F Fission Capture C/F
Pu-238 18 540 30.0 2.0 0.21 0.11
Pu-239 747 270 0.4 1.7 0.027 0.02
Pu-240 59 mb 289 4898.3 1.5 0.089 0.06
Am-241 3.0 600 200.0 1.3 0.30 0.23
Am-243 116 mb 78.5 676.7 0.98 0.21 0.21
Cm-244 1.0 15 15.0 2.2 0.16 0.07
One advantage of sodium coolant is the high thermal conductivity, which allows better transfer of
heat from the fuel. This also gives an added safety benefit; sodium cooled fast reactors have the
potential for cooling by natural circulation in the event of an accident. The very high thermal
conductivity of the coolant means it can transfer heat out at low flow rates, potentially including
natural circulation, depending on the specific reactor design.
Oxide and metallic fuels are both under consideration in many transmutation programs world-
wide. It was decided to use oxide fuels for this work. Oxide fuels are the most widely used fuels;
there is a significant body of knowledge and experience with these fuels. However, the addition
of minor actinides to a uranium oxide or plutonium-uranium oxide fuel represents a significant
change to the fuel that will require significant research and development prior to deployment. A
recent report by the Nuclear Energy Agency [15] found several aspects of the Technology
Readiness Level (TRL) of minor actinide bearing oxide fuels to be similar to, but slightly higher
than that of metallic fuels. The TRL for fabrication processes are similar, but in-pile testing of the
fuels at prototype conditions is more progressed for oxide fuels.

6
1.2 Overview of Light Water Reactor Spent Nuclear Fuel
This study considers the disposition of LWR spent fuel. A representative composition of light
water reactor spent fuel is provided in Table 2. This composition corresponds to a light water
reactor with an initial enrichment of 4 wt% U-235 and an exit burnup of 50 MWd kg-1, cooled for
10 years [5]. The actual composition of LWR SNF will vary considerably based on the specific
reactor, position of the fuel in the core (axially and radially), and exit burnup.
Three criteria on which the spent fuel is typically evaluated are: the decay heat generated by the
fuel, the radioactivity of the fuel, and the radiotoxicity of the fuel. Here, committed effective dose
(CED)3 is used as a measure of the potential toxicity of the fuel. Plots of the decay heat,
committed effective dose, and radioactivity of spent light water reactor fuel are given in Figure 3,
Figure 4, and Figure 5 respectively. In each of these figures the main contributors are shown. To
provide context the levels for uranium ore, which includes the equilibrium concentrations of
uranium daughters, and for fresh LWR fuel (consisting of only those uranium isotopes present in
fresh fuel, (i.e. no daughters) are given. On the graphs the daughter products are combined by
radioactive decay chain. The important nuclides at various decay times are given in Table 3.
Table 2 Constituents of light water reactor spent nuclear fuel. [16]
Element Percentage (wt%) of Spent Fuel
U 93.8
Pu 1.2
Np 0.07
Am 0.025
Cm 0.012
Total Minor Actinides
(Am, Cm, Np) 0.10
Total Transuranic Elements
(Pu, Am, Cm, Np) 1.3
Fission Products 4.9
Table 3 Actinides of importance to the characteristics of spent LWR fuel.
Log Time
Period
(years)
10 to 100 100 to 1000 1000 to 10 000 10 000 to
100 000
100 000 to
1 000 000
Important
Isotopes
Pu-238
Pu-239
Pu-240
Pu-241*
Am-241
Cm-244
Pu-238
Pu-239
Pu-240
Am-241
Pu-239
Pu-240
Am-241
Pu-239
Pu-240
Pu-239
Daughters in the
radium and
neptunium decay
series
*Only important for radioactivity and radiotoxicity, not for decay heat
3 CED is a measure of the cancer causing potential of radionuclides due to inhalation, with the effects of
biological half-life, specific uptake by vulnerable organs, and decay rate of radionuclides, and the mode of
decay taken into consideration.

7
Figure 3 Decay heat of the dominant actinides for light water reactor spent fuel between 10 and 1
million years after discharge.
Figure 4 Committed effective dose of the dominant actinides for light water reactor spent fuel
between 10 and 1 million years after discharge.
1.0E-5
1.0E-4
1.0E-3
1.0E-2
1.0E-1
1.0E+0
10 100 1000 10000 100000 1000000
De
cay
He
at (
W/k
gIH
E)
Time After Discharge (years)
Np-237
Np-239
Pu-239
Pu-240
Pu-242
Am-241
Am-243
Cm-244
Total
Radium series
Neptunium series
Fission Products
Uranium Ore
LWR Fresh Fuel
1.0E+00
1.0E+01
1.0E+02
1.0E+03
1.0E+04
1.0E+05
1.0E+06
1.0E+07
10 100 1000 10000 100000 1000000
Co
mm
itte
d E
ffe
ctiv
e D
ose
(Sv
/kgI
HE)
Time After Discharge (years)
U-234U-237Np-237Np-238Pu-238Pu-239Pu-240Pu-241Pu-242Am-241Am-242mAm-243Cm-242Cm-243Cm-244Cm-245ActinidesRadium seriesNeptunium seriesUranium OreLWR Fresh FuelFission Products

8
Figure 5 Radioactivity of the dominant actinides for light water reactor spent fuel between 10
and 1 million years after discharge.
1.3 Physics of Actinide Transmutation
Worldwide the vast majority of studies on the transmutation of actinides are considering fast
transmutation systems, such as ADS and fast reactors. Several types of fast reactors are currently
being studied worldwide. Much of the fast reactor research is under the Generation-IV
International Forum, which includes work on fast reactors with a variety of coolants: sodium, lead
(or lead-bismuth), helium gas, supercritical water, and molten salts. A smaller effort is ongoing to
investigate thermal actinide burners, including light water reactors and heavy water moderated
CANDU reactors.
The primary reason for the focus on fast transmutation system is in the behaviour of the cross
sections at high energies. The fission and capture cross-sections in the thermal and high energy
regions of the neutron spectrum are given in Table 1. Plots of the fission and capture cross
sections are given in Appendix A for the nuclides that are most important to the long term decay
heat and radioactivity of spent fuel. For all nuclides other than Pu-239, there will be more
captures than fissions in the thermal range of the spectrum. In the fast region of the spectrum the
capture cross-sections drop significantly while the fission cross-sections rise. Thus, the capture-
to-fission ratio decreases greatly for fast neutrons. As the goal of transmutation is to convert long-
lived actinides into shorter-lived fission products, the fast spectrum is generally considered
1.0E-03
1.0E-02
1.0E-01
1.0E+00
1.0E+01
1.0E+02
1.0E+03
10 100 1000 10000 100000 1000000
Rad
ioac
tivi
ty (
Cu
rie
s/kg
IHE)
Time After Discharge (years)
U-234
Np-239
Pu-238
Pu-239
Pu-240
Pu-241
Am-241
Am-242m
Am-242
Am-243
Cm-242
Cm-243
Cm-244
Total
Radium series
Neptunium series
Uranium Ore
LWR Fresh Fuel
Fission Products
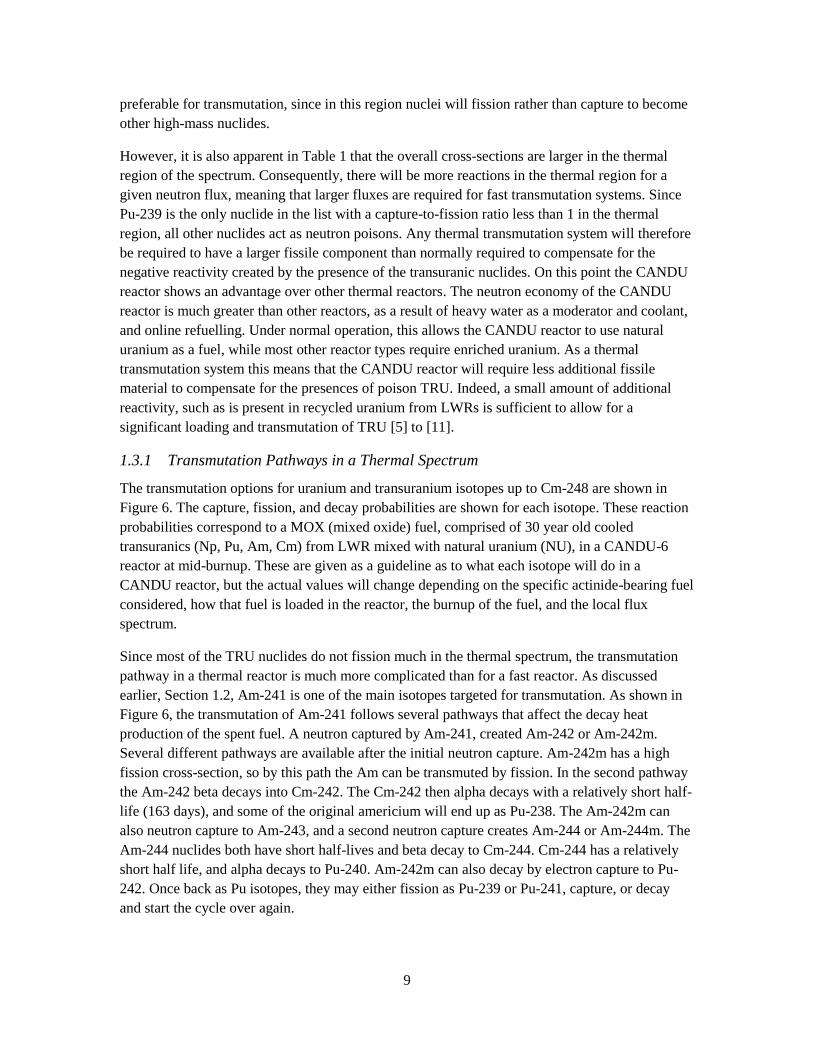
9
preferable for transmutation, since in this region nuclei will fission rather than capture to become
other high-mass nuclides.
However, it is also apparent in Table 1 that the overall cross-sections are larger in the thermal
region of the spectrum. Consequently, there will be more reactions in the thermal region for a
given neutron flux, meaning that larger fluxes are required for fast transmutation systems. Since
Pu-239 is the only nuclide in the list with a capture-to-fission ratio less than 1 in the thermal
region, all other nuclides act as neutron poisons. Any thermal transmutation system will therefore
be required to have a larger fissile component than normally required to compensate for the
negative reactivity created by the presence of the transuranic nuclides. On this point the CANDU
reactor shows an advantage over other thermal reactors. The neutron economy of the CANDU
reactor is much greater than other reactors, as a result of heavy water as a moderator and coolant,
and online refuelling. Under normal operation, this allows the CANDU reactor to use natural
uranium as a fuel, while most other reactor types require enriched uranium. As a thermal
transmutation system this means that the CANDU reactor will require less additional fissile
material to compensate for the presences of poison TRU. Indeed, a small amount of additional
reactivity, such as is present in recycled uranium from LWRs is sufficient to allow for a
significant loading and transmutation of TRU [5] to [11].
1.3.1 Transmutation Pathways in a Thermal Spectrum
The transmutation options for uranium and transuranium isotopes up to Cm-248 are shown in
Figure 6. The capture, fission, and decay probabilities are shown for each isotope. These reaction
probabilities correspond to a MOX (mixed oxide) fuel, comprised of 30 year old cooled
transuranics (Np, Pu, Am, Cm) from LWR mixed with natural uranium (NU), in a CANDU-6
reactor at mid-burnup. These are given as a guideline as to what each isotope will do in a
CANDU reactor, but the actual values will change depending on the specific actinide-bearing fuel
considered, how that fuel is loaded in the reactor, the burnup of the fuel, and the local flux
spectrum.
Since most of the TRU nuclides do not fission much in the thermal spectrum, the transmutation
pathway in a thermal reactor is much more complicated than for a fast reactor. As discussed
earlier, Section 1.2, Am-241 is one of the main isotopes targeted for transmutation. As shown in
Figure 6, the transmutation of Am-241 follows several pathways that affect the decay heat
production of the spent fuel. A neutron captured by Am-241, created Am-242 or Am-242m.
Several different pathways are available after the initial neutron capture. Am-242m has a high
fission cross-section, so by this path the Am can be transmuted by fission. In the second pathway
the Am-242 beta decays into Cm-242. The Cm-242 then alpha decays with a relatively short half-
life (163 days), and some of the original americium will end up as Pu-238. The Am-242m can
also neutron capture to Am-243, and a second neutron capture creates Am-244 or Am-244m. The
Am-244 nuclides both have short half-lives and beta decay to Cm-244. Cm-244 has a relatively
short half life, and alpha decays to Pu-240. Am-242m can also decay by electron capture to Pu-
242. Once back as Pu isotopes, they may either fission as Pu-239 or Pu-241, capture, or decay
and start the cycle over again.
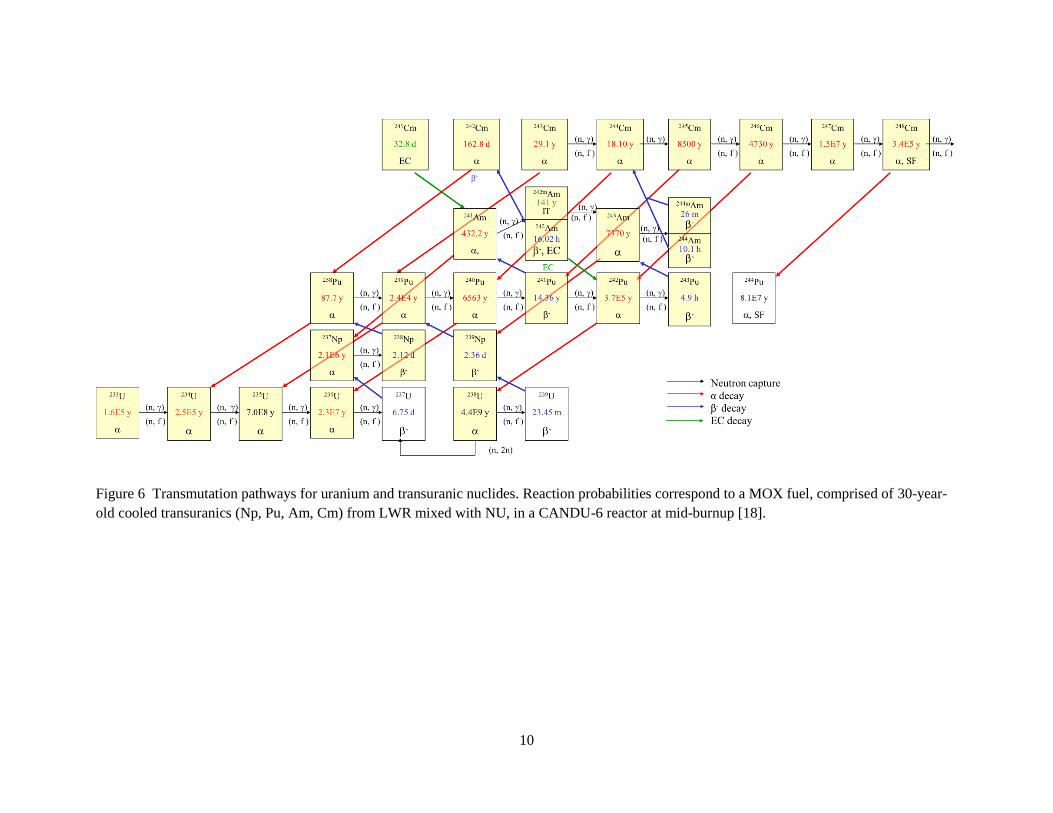
10
Figure 6 Transmutation pathways for uranium and transuranic nuclides. Reaction probabilities correspond to a MOX fuel, comprised of 30-year-
old cooled transuranics (Np, Pu, Am, Cm) from LWR mixed with NU, in a CANDU-6 reactor at mid-burnup [18].

11
1.4 Spent Fuel Partitioning
Many different partitioning schemes have been studied worldwide. There are schemes to separate
out whichever combination of elements is desired. A few of the possible product streams are
given in Table 4. This product list is for the UREX+ [19] (URanium EXtraction) suite of
processes, but there are other processes developed that produce the same product streams, for
example SANEX (Selective Actinide EXtraction), which also separates Am+Cm from Ln. For
reactor physics studies the chemical process used to obtain the product streams is not important, it
is just necessary to know what elements are available, in what ratios, and the isotopic
distributions, in order to devise a suitable input fuel composition.
Table 4. A few possible partitioning schemes.
Process Product
1
Product
2
Product
3 Product 4 Product 5
Product
6
Product
7
UREX+1 U Tc Cs/Sr TRU+Ln FP*
UREX+1a U Tc Cs/Sr TRU All FP
UREX+2 U Tc Cs/Sr Pu+Np Am+Cm+Ln FP
UREX+3 U Tc Cs/Sr Pu+Np Am+Cm All FP
UREX+4 U Tc Cs/Sr Pu+Np Am Cm All FP
* FP stands for Fission Products
1.4.1 Curium Management
Though actinide transmutation does result in a net reduction in minor actinides, it does breed
higher mass actinides, particularly curium. Cm-244 makes up most of the isotopic composition of
curium at exit, and this percentage increases with time as the Cm-242 decays (half life = 163
days), see Table 5. Cm-244 is a source of spontaneous fissions, which requires special handling
and shielding. This creates difficulties for partitioning processes if large amounts of curium are
present. Cm-244, half life = 18y, is also a large source of decay heat. Cm-244 decays primarily by
alpha decay, with a decay energy of 5.902 MeV, but also decays via spontaneous fission, emitting
neutrons with and energy of ~200 MeV/fission.
Three main strategies for curium management are being considered by different countries world
wide (primarily France, Japan and the USA) [20]:
Separation of Am from Cm, storage of curium while Am recycling proceeds
Am and Cm recycling without separation
Delay reprocessing for several decades to minimize the impact of Cm, and also alters the
transmutation paths to minimize Cm production
In this study the second option is considered, where Am and Cm are not separated, they are
transmuted together in the same isotopic composition in which they exist in the spent fuel.
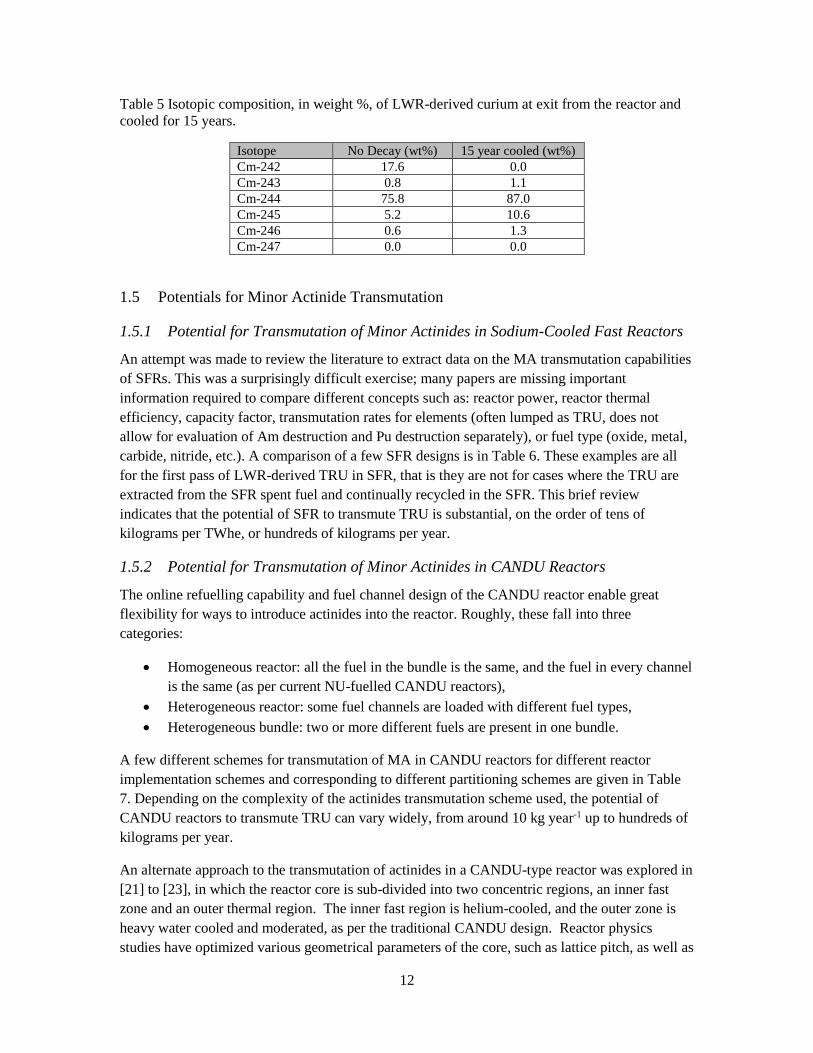
12
Table 5 Isotopic composition, in weight %, of LWR-derived curium at exit from the reactor and
cooled for 15 years.
Isotope No Decay (wt%) 15 year cooled (wt%)
Cm-242 17.6 0.0
Cm-243 0.8 1.1
Cm-244 75.8 87.0
Cm-245 5.2 10.6
Cm-246 0.6 1.3
Cm-247 0.0 0.0
1.5 Potentials for Minor Actinide Transmutation
1.5.1 Potential for Transmutation of Minor Actinides in Sodium-Cooled Fast Reactors
An attempt was made to review the literature to extract data on the MA transmutation capabilities
of SFRs. This was a surprisingly difficult exercise; many papers are missing important
information required to compare different concepts such as: reactor power, reactor thermal
efficiency, capacity factor, transmutation rates for elements (often lumped as TRU, does not
allow for evaluation of Am destruction and Pu destruction separately), or fuel type (oxide, metal,
carbide, nitride, etc.). A comparison of a few SFR designs is in Table 6. These examples are all
for the first pass of LWR-derived TRU in SFR, that is they are not for cases where the TRU are
extracted from the SFR spent fuel and continually recycled in the SFR. This brief review
indicates that the potential of SFR to transmute TRU is substantial, on the order of tens of
kilograms per TWhe, or hundreds of kilograms per year.
1.5.2 Potential for Transmutation of Minor Actinides in CANDU Reactors
The online refuelling capability and fuel channel design of the CANDU reactor enable great
flexibility for ways to introduce actinides into the reactor. Roughly, these fall into three
categories:
Homogeneous reactor: all the fuel in the bundle is the same, and the fuel in every channel
is the same (as per current NU-fuelled CANDU reactors),
Heterogeneous reactor: some fuel channels are loaded with different fuel types,
Heterogeneous bundle: two or more different fuels are present in one bundle.
A few different schemes for transmutation of MA in CANDU reactors for different reactor
implementation schemes and corresponding to different partitioning schemes are given in Table
7. Depending on the complexity of the actinides transmutation scheme used, the potential of
CANDU reactors to transmute TRU can vary widely, from around 10 kg year-1 up to hundreds of
kilograms per year.
An alternate approach to the transmutation of actinides in a CANDU-type reactor was explored in
[21] to [23], in which the reactor core is sub-divided into two concentric regions, an inner fast
zone and an outer thermal region. The inner fast region is helium-cooled, and the outer zone is
heavy water cooled and moderated, as per the traditional CANDU design. Reactor physics
studies have optimized various geometrical parameters of the core, such as lattice pitch, as well as

13
fuel composition in order to optimize the reactor for excess reactivity, form factor (i.e. power
peaking), and the neutron capture rate of U-238. This latter is an indicator of the breeding
potential of this reactor concept.
1.6 Fuel Cycle Scenario Studies
To determine the impact of transitioning to a different type of reactor or a different type of fuel
the entire fuel cycle system must be studied. Fuel cycle scenario studies aid in the understanding
of the relationships between fuel cycle components, and the changes that would be expected if the
nature of those components change.
A dynamic scenario is constructed in which fuel cycle facilities, such as reactors, reprocessing
plants, etc. are built, operated and decommissioned. Fuel flow is tracked, with the progression of
fuel from the mine through conversion, enrichment, fabrication, irradiation, and spent fuel storage
all modelled, depending on the level of detail desired. Fuel reprocessing, re-fabrication and re-
irradiation are also modelled, if exercised in the scenario.
The reactor and fuel tracking is performed within the context of a nuclear energy capacity that is
defined by the user. In this case, a region was defined with a nuclear energy growth profile, such
that the nuclear energy required increases over time.
The fuel cycle scenario code used will make decisions as to what fuel cycle facilities to build
when, depending on the energy requirements of the scenario, the available technologies, and the
available fuel. These models can become very complicated very quickly if multiple reactor and
fuel types are employed, with fuel that moves between reactor types through reprocessing.
Fuel cycle scenario studies have been performed around the world for decades. A few of the
larger and more recent studies in the US, France, and Europe are briefly outlined here.
The most recent major fuel cycle evaluation study was conducted by the United States
Department of Energy, [30]. An initial comprehensive set of 4398 fuel cycle options was
narrowed down to 40 evaluation groups. These groups were based on fundamental physics
characteristics, rather than a specific technology, e.g. a thermal spectrum reactor, rather than a
specific pressurized water reactor. These 40 fuel cycle groups were analyzed and compared
against nine criteria. The six “Benefit” criteria examined were:
Nuclear waste management
Proliferation risk
Nuclear material security risk
Safety
Environmental impact
Resource utilization.

Table 6 A comparison of the minor actinide burning capabilities of a few sodium cooled fast reactor concepts.
Reference [24] [25] [26] [27] [28] [29]
MA-bearing fuel MA-bearing
blanket
Scheme
3a
MA in
core
MA in
blankets
MA in core
and blankets fertile free FaCT4 KALIMER5
% MA 3.2 7.9 18.4 20 Am
only 20 3.989 4.1 1.8
4.1 core/
1.8 blanket 7.3 3 3.3 3.2 3.2
Power (MWe) 1440 600 600 600 1500 600 1200 1800
Fuel Type Oxide Metal Oxide CERMET6 Oxide Metal, TRU-U-Zr
Mass Transmuted (kg TWhe-1)
Np7 -0.6 -0.62 -0.64 -0.14 1.02 6.3 6.3 6.3
Am 13.9 12.0 8.6 6.6 5.4 1.4 1.5 1.6
Cm -5.46 -4.99 -4.15 -1.7 -0.44 -2.1 -2.1 -2.1
Pu 49.5 2.3 -37.7 -28.5 37.5 39.5 39.3 38.8
Total MA 7.87 6.42 3.85 4.79 5.94 6.9 12.6 12.4 24.9 17.9 8.4 5.7 5.7 5.8
Total TRU 56.4 14.8 -25.3 -3.6 55.4 45.2 45.1 44.5
Mass Transmuted (kg y-1) 8
Np -6.4 -6.6 -6.9 -1.5 10.9 23.9 48.0 72.0
Am 149.4 129.0 92.6 71.0 57.5 5.4 11.7 18.1
Cm -58.5 -53.5 -44.5 -18.2 -4.7 -7.8 -16.3 -24.4
Pu 221.3 12 -198 -150 178 150.0 298.8 441.8
Total MA 84.4 68.8 41.3 51.4 63.7 30.6 66 65 131 85 110.0 21.5 43.5 65.7
Total TRU 251.9 78 -133 -19 263 171.5 342.3 507.5
4 FaCT stands for FAst reactor Cycle Technology development project. It is the Japanese sodium-cooled fast breeder program. 5 KALIMER is a sodium cooled fast reactor under development by the Korean Atomic Energy Research Institute (KAERI). 6 CERMET is ceramic metallic fuel, in this case it is AnO2-Mo-92. 7 The table is blank where the data were missing in the reference. 8 A capacity factor of 0.85 was assumed in cases where it was not specified in the paper
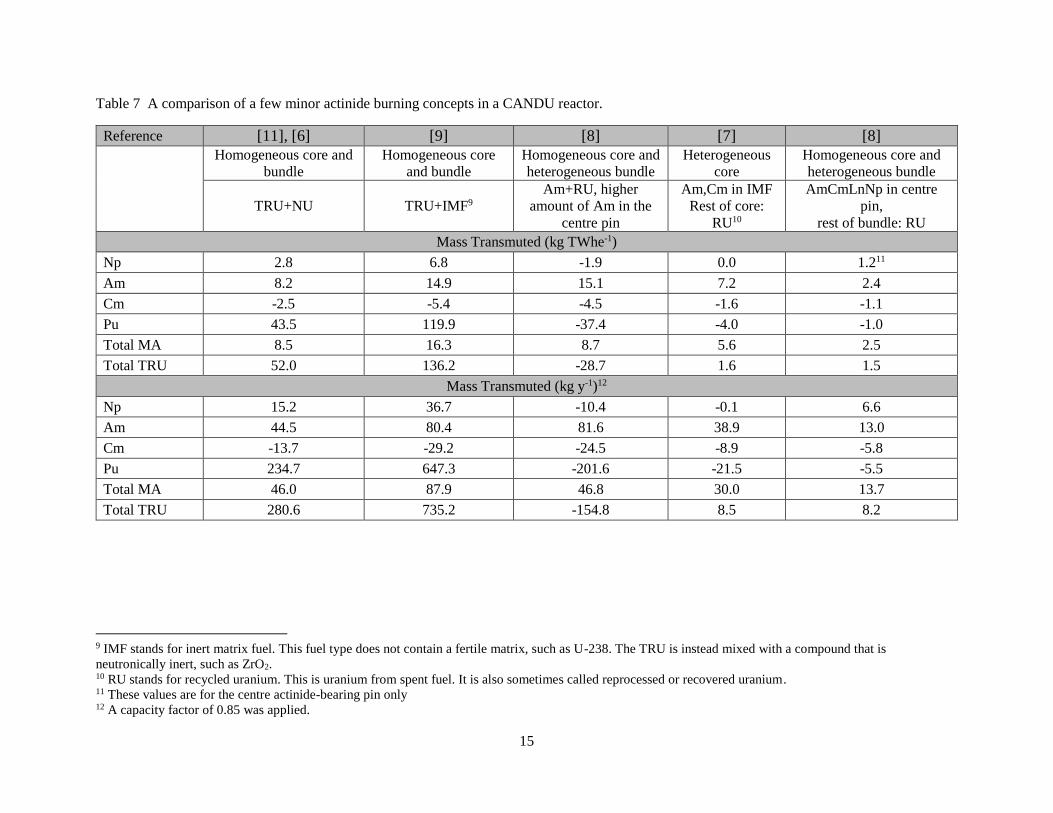
15
Table 7 A comparison of a few minor actinide burning concepts in a CANDU reactor.
Reference [11], [6] [9] [8] [7] [8]
Homogeneous core and
bundle
Homogeneous core
and bundle
Homogeneous core and
heterogeneous bundle
Heterogeneous
core
Homogeneous core and
heterogeneous bundle
TRU+NU TRU+IMF9
Am+RU, higher
amount of Am in the
centre pin
Am,Cm in IMF
Rest of core:
RU10
AmCmLnNp in centre
pin,
rest of bundle: RU
Mass Transmuted (kg TWhe-1)
Np 2.8 6.8 -1.9 0.0 1.211
Am 8.2 14.9 15.1 7.2 2.4
Cm -2.5 -5.4 -4.5 -1.6 -1.1
Pu 43.5 119.9 -37.4 -4.0 -1.0
Total MA 8.5 16.3 8.7 5.6 2.5
Total TRU 52.0 136.2 -28.7 1.6 1.5
Mass Transmuted (kg y-1)12
Np 15.2 36.7 -10.4 -0.1 6.6
Am 44.5 80.4 81.6 38.9 13.0
Cm -13.7 -29.2 -24.5 -8.9 -5.8
Pu 234.7 647.3 -201.6 -21.5 -5.5
Total MA 46.0 87.9 46.8 30.0 13.7
Total TRU 280.6 735.2 -154.8 8.5 8.2
9 IMF stands for inert matrix fuel. This fuel type does not contain a fertile matrix, such as U-238. The TRU is instead mixed with a compound that is
neutronically inert, such as ZrO2. 10 RU stands for recycled uranium. This is uranium from spent fuel. It is also sometimes called reprocessed or recovered uranium. 11 These values are for the centre actinide-bearing pin only 12 A capacity factor of 0.85 was applied.
16
Three “Challenge” criteria were also examined:
Development and deployment risk
Institutional issues
Financial risk and economics.
Some of the evaluation metrics can be determined quantitatively through fuel cycle scenario
analyses, but others require expert judgement. The study identified three fuel cycles as the most
promising: continuous recycle of uranium and plutonium with new natural uranium fuel in fast
reactors, continuous recycle of uranium and transuranic elements with new natural uranium fuel
in fast reactors, and continuous recycle of uranium and transuranic elements with new natural
uranium fuel in both fast and thermal reactors. This thesis looks at a variant of the third fuel
cycle.
A large fuel cycle scenario study has been ongoing in France because of legislation passed in
1991 and 2006. The Commissariat à l’énergie atomique (CEA, the French Atomic Energy
Commission) has a mandate to perform research and development in the area of partitioning and
transmutation for high-level and long-lived intermediate-level radioactive waste management
[31]. A recent study [32] compared the minor actinide transmutation performance of sodium
cooled fast reactors operated in a homogenous mode (all minor actinides distributed evenly
throughout the core) and in a heterogeneous mode (minor actinides concentrated in certain
regions of the core) and accelerator driven systems, in the French context.
The French study found that homogeneous transmutation is more efficient, and led to a decrease
in minor actinide content in the fuel cycle by almost a factor of 2. The heterogeneous
transmutation mode, in which there is a higher concentration of MA in some regions of the core,
led to MA-bearing fuels that had a much higher fresh thermal power and spent fuel decay heat
than homogeneous designs. Consequently, the higher MA heterogeneous fuels require a longer
cooling time before the fuel can be handled and reprocessed, up to 15 years. Minor actinide
transmutation in a dedicated accelerator driven systems can have transmutation performance
similar to that of a fast reactor, however, in the French case 18 ADS would be required, which
would have a strong economic implication.
The RED-IMPACT project [33] was a partnership of 23 organizations funded through the
European Union to examine the impact of partitioning and transmutation and waste reduction
technologies on nuclear waste management and final nuclear waste disposal. Several partitioning
and transmutation schemes were investigated, including recycling of plutonium only in fast
reactors and light water reactors, recycling of all transuranic elements in fast reactors, and
scenarios involving accelerator driven systems.
The RED-IMPACT study concluded that partitioning and transmutation scenarios would reduce
the required size of a geological repository by a factor of 3 to 6. It is interesting to note that
partitioning and transmutation of actinides has little impact on the performance, that is, the dose
to an individual, of a geological repository. This is because actinides have very low solubility and
hence they do not move out of a geological repository.

17
A major study into the sensitivities and uncertainties associated with fuel cycle system studies has
recently been concluded at the Expert Group on Advanced Fuel Cycle Scenarios (EG-AFCS) of
the Nuclear Energy Agency (NEA) of the Organization for Economic Cooperation and
Development (OECD) [34]. The sensitivities of a variety of front-end and back-end output
parameters, such as uranium requirements, fabrication capacity required, fuel in storage, and Pu
and MA inventories in the fuel cycle and in waste were examined. Fuel cycle scenario input
parameters in the study included reactor characteristics, MA recycling parameters, general
scenario assumptions such as energy production, cooling times, fabrication times, and the
introduction date and rate of fast reactors, and reprocessing parameters. The greatest impacts to
output metrics were found to be from the overall energy growth rate, introduction date of fast
reactors, introduction rate of fast reactors, and reactor lifetime.
1.7 Goals and Scope of Thesis Work
The objective of this research is to model nuclear fuel cycles in which the HWRs act as an
intermediate actinide burner prior to transmutation in a fast reactor. Fuel cycle modeling studies
such as this help to steer research programs by answering questions such as:
What would a fuel cycle with an actinide burning HWR look like?
Is the design and development of an actinide burning HWR worth investing in?
Is a fast reactor fueled with LWR-derived HWR spent fuel worth investing in?
Do these innovative reactor types make enough of a difference to reference fuel cycles to
justify further work?
A fuel cycle with HWR reactors as intermediate burners will be compared to reference cases with
LWRs only and with LWRs and fast reactors, but no HWR reactors in order to determine the
impact of including the HWR reactor in the fuel cycle. Namely, the goal will be to determine fuel
cycle characteristics including:
Mass of plutonium and minor actinides in the fuel cycle and in waste
Natural uranium consumption
The reactor mix, i.e. how many LWR/fast reactors/HWRs are present in the fuel cycle,
How quickly fast reactors can be built,
The required reprocessing capacity.
The fuel cycle scenarios are the primary interest in this project, rather than the particular reactor
modelling. As such, the reactor physics models for the HWR reactors and the fast reactor will be
simplified models and not highly detailed, nor will detailed safety analyses be performed. The
physics models will be performed to a level of detail sufficient to give a high-level indication of
feasibility by looking at some easy to calculate reactivity coefficients. This is done in order to
keep the scope of the project reasonable and allow more analysis of fuel cycle options and
characteristics.
Similarly, the benchmarking, verification, and validation activities of this study will be limited.
The HWR reactor physics calculations used as a basis a standard WIMS-AECL (Winfrith
Improved Multigroup Scheme) CANDU 6 lattice cell model, which has undergone extensive
18
verification and validation. Changes to this model were verified by a qualified reactor physicist at
Canadian Nuclear Laboratories.
No standard model was available for the reactor physics calculations for the fast reactor. Instead,
a model was built from scratch, corresponding to studies available in the literature [35].
Verification of the correctness of this model was performed by comparing the output from this
model to published results. It is not expected that the results will match exactly; everyone builds
models slightly differently, so some minor deviations are expected. The only subsequent changes
required to this base model are the fuel compositions.
Validation is not possible for this work. Validation requires comparison to experimental data,
which does not exist for this study. In this case, that would require building the fuel cycle,
including the new advanced reactors, new fuel types, and reprocessing facilities. This is a very
large, and expensive endeavour. Indeed, the motivation for this work is to determine if
proceeding down that extensive research and development path is worthwhile.
This project will consider spent fuel from LWRs only. The vast majority of the literature is
concerned with transmutation of LWR spent fuel. Spent fuel from heavy water reactors is not
being considered in this study because:
Heavy water reactors, such as the CANDU reactor, use NU as fuel. This fuel produces
spent nuclear fuel that is high in volume and low in fissile content. This low fissile-to-
fuel volume ratio makes NU SNF less valuable to reprocess. The case for reprocessing is
easier for LWR SNF which has a relatively large amount of fissile remaining in the spent
fuel.
Due to the low burnup of HWR spent fuel, there are fewer long-lived minor actinides
produced. As a result, the decay heat and radiotoxicity are lower per unit fuel mass (but
there is more volume produced).
Once-through disposal into a deep geological repository (DGR) is well researched,
scientifically sound, and the siting process for a DGR in Canada is proceeding well.
There is little reason to think at this point that a repository in Canada will encounter
challenges as it has in other countries such as the United States.
The economic impact of using HWRs as an intermediate burner of LWR actinides has not been
investigated in this work. The economics of advanced fuel cycles have been investigated
elsewhere, e.g. [36] to [41].
There is a substantial body of work over decades investigating the transmutation of actinides in
fast reactors [1] to [4], [15], [24] to [28], [31], [32], [35]. There has also been recent work on the
transmutation of LWR-derived actinides in CANDU reactors, [5] to [11]. However, there has not
been any study of a fuel cycle with both HWR and fast reactors, nor this case, in which LWR
spent fuel is first sent to a HWR, and then the spent fuel from the HWR is sent to a fast reactor.
Also, while the reactor physics of a HWR transmuting LWR-derived actinides has been studied,
the fuel cycle system has not. A case of LWRs transitioning to HWRs with no subsequent

19
transition to fast reactors is also included in this study, to examine a case in which fast reactors
are never subsequently deployed.

20

21
2 HEAVY WATER REACTOR CALCULATIONS Most heavy water power reactors currently in operation around the world use natural uranium as
fuel. This study investigates the impact of using a different fuel, namely natural uranium mixed
with transuranic nuclides (neptunium, plutonium, americium and curium) that are derived from
light water reactor fuel. As this fuel has never been used in actual operation, a physics model was
created to simulate the irradiation of this advanced fuel.
One important irradiation parameter was also changed in this study. The exit burnup of the fuel
was increased to be around 45 MWd kg-1. Typical HWR natural uranium has a burnup of
7.5-9 MWd kg-1, depending on the specific reactor, and the way in which that reactor is operated.
This increase in burnup is 5 to 6 times the normal HWR burnup. In order to achieve this burnup,
the fresh fuel must have higher reactivity, that is, it must have a higher initial fissile content.
Natural uranium contains 0.71 wt%U-235. The fissile content here is plutonium, isotopes Pu-239
and Pu-241, as well as U-235 from the natural uranium that comprises the remainder of the fuel.
The heavy water reactor that was chosen for this study is the Enhanced CANDU 6 reactor. The
CANDU reactor is a large pressure tube reactor. These 380 pressure tubes are arranged in a
square lattice. Due to the size of the reactor, a two-dimensional lattice cell model provides a good
approximation for the whole reactor. More detailed simulations, for example of fueling studies
and accident scenarios, would require full core models. The lattice cell model is sufficient for
preliminary, survey-type, reactor physics scoping studies such as this study, where the goal is to
obtain reasonable estimates of input and output fuel compositions, and only a very preliminary
assessment of safety characteristics.
2.1 HWR Model Development Overview
The objective of this section of the work was to generate the output fuel composition from a
CANDU reactor that had been fuelled with actinides derived from LWR spent fuel. This output
fuel from the CANDU reactor will then be the input fuel for the fast reactor in the next set of
calculations. The main steps in this portion of the thesis work were:
Build the initial WIMS-AECL model. The model used for this thesis work was based on
models previously used for advanced CANDU reactor modeling and simulation at CNL,
[47] to [50]. Geometry and fuel materials were changed from the original model, as
detailed in the sections below. These incremental changes were independently verified13.
Determine what decay time to use for the spent LWR fuel. The isotopic composition of
the LWR spent fuel changes as a function of decay time after exiting the reactor. The
primary isotopic change is the decay of Pu-241 to Am-241, which has a half-life of
14.36 y (Figure 6). This reduces the fissile inventory of the spent fuel, which means that
more of the spent TRU will be required to fabricate fresh CANDU fuel, to achieve the
same exit burnup. Decay times from 0 to 45 y were modelled.
Initial set of scoping models with constant neutron absorber. The initial set of WIMS-
AECL models were constructed with the same amount of dysprosia in the centre pin
13 Verification of the WIMS-AECL models via line-by-line examination of the input files, changes against
Standard Models, and of the output was performed by Zaki Bhatti and Jeremy Pencer.

22
(50% dysprosia, 50% zirconia) for each decay time. The initial amount of TRU in the
fuel was adjusted to achieve an exit burnup of 45 MWd kg-1. The problem with these
models is that they do not have the same CVR as the decay time varies. Therefore, they
are not a good comparison, or basis to make the choice of which decay time to use.
Models with a target CVR. A second set of models was then produced in which the
neutron absorber content of the centre pin was varied to obtain a constant target CVR
(Section 2.7). The dysprosia content and the TRU content of the fresh fuel were both
varied to achieve both the desired CVR and exit burnup. This final set of models was also
independently verified14. Analysis of the transmutation performance of these simulations
then forms the basis for the decision on what decay time to use for the LWR spent fuel.
Code-to-code comparison test with Serpent. To further test the WIMS model, the final,
selected model was reproduced using the reactor physics code Serpent (see Section
2.11.2).
2.2 Heavy Water Reactor Safety Considerations
There are several types of accidents that are postulated for HWRs. In [42], these are grouped
these into eight categories, by phenomenon:
Reactivity accidents
Decrease of reactor coolant flow
Increase of reactor coolant pressure
Decrease of reactor coolant inventory
Increase of secondary side pressure
Loss of secondary side heat removal
Moderator and shield cooling system failures
Fuel handling accidents
Simulating these accident scenarios is a complex and detailed process, involving the interplay of
different disciplines, such as physics, thermal hydraulics, and fuel behaviour, and multiple
computer codes. Fuel cycle scenario studies such as this work do not warrant a full safety
analysis. However, a few characteristics are evaluated to provide an initial indication that the
reactor, when loaded with the advanced fuel, will operate similarly to the normal case with
natural uranium fuel.
In this work a target was set for the coolant void reactivity coefficient (CVR), to ensure that the
reactor would have a similar response in the event of a loss of coolant accident. The fuel
temperature coefficient (FTC) was also evaluated and compared with that for a normal natural
uranium fuelled CANDU reactor.
The CVR coefficient calculated in this work is for a complete voided scenario, that is,
14 Verification of the WIMS-AECL models via line-by-line examination of the input files, changes against
Standard Models, and of the output was performed by Zaki Bhatti.

23
𝐶𝑉𝑅 = (1
𝑘∞(𝑐𝑜𝑜𝑙𝑒𝑑)−
1
𝑘∞(𝑣𝑜𝑖𝑑𝑒𝑑))
given in units of mk, where k∞ is the infinite lattice neutron multiplication factor.
The fuel temperature coefficient calculations used simulations with the fuel temperature increased
by 50ºC (Thigh) and decreased by 50ºC (Tlow), that is,
𝐹𝑇𝐶 = (1
𝑘∞(𝑇ℎ𝑖𝑔ℎ)−
1
𝑘∞(𝑇𝑙𝑜𝑤))(𝑇ℎ𝑖𝑔ℎ − 𝑇𝑙𝑜𝑤)
given in units of µk ºC-1.
2.3 WIMS-AECL
WIMS-AECL [43] is a reactor physics code developed and maintained by Canadian Nuclear
Laboratories (CNL). This code performs 2-dimensional deterministic lattice physics calculations
by solving the neutron transport equation. WIMS-AECL capabilities include resonance self-
shielding, multi-cell modelling, up to an 89-energy group structure, and depletion calculations
enabling the determination of isotopic and lattice cell parameters as a function of burnup, or
fluence. The latest release of WIMS-AECL is version 3.1, and the most recent library [44] is
based on ENDF/B-VII (Evaluated Nuclear Data File) data.
Recently there has been an effort at CNL and the CANDU Owners Group (COG) to develop a
standard WIMS-AECL model for natural uranium 37-element fuel [45], [46]. This effort has been
extended at CNL to include standard models for advanced fuel models, such as Standard
CANFLEX bundle designs [47], and supercritical water cooled reactor models [48]. These
models give recommended parameters for the models, such as discretization of the lattice cell
geometries, and recommended material compositions. All WIMS-AECL models developed for
this study will follow the practices in those reports.
2.4 Geometry
The discretization used in the WIMS input models was adapted from the WIMS Standard 37-
Element model [45]. The dimensions used for the fuel bundle, Table 8, were modified from the
HAC (highly advanced CANDU) bundle design, [49]. The centre pin and inner fuel ring were
replaced with one larger central element to introduce sufficient poison into the centre of the
bundle to reduce the coolant void reactivity (CVR). The fuel channel geometry was based on the
current operating HWRs in Ontario, with open literature dimensions used (see Table 8). The
lattice cell and fuel bundle are shown in Figure 7.
2.4.1 Adjustments Due to the 2-Dimensional Calculation
As a WIMS lattice cell calculation is a 2-dimensional rendering of a 3-dimensional object, some
adjustments are required. The density of the cladding was adjusted to account for the endcaps and
endplates. The density corresponds to the total mass of cladding, endcaps and end plates in the 3-
dimensional total bundle divided by the volume of cladding in the bundle. The mass of the
endcaps and end plates were used in this calculation was 1.34 g and 27.78 g, respectively, from
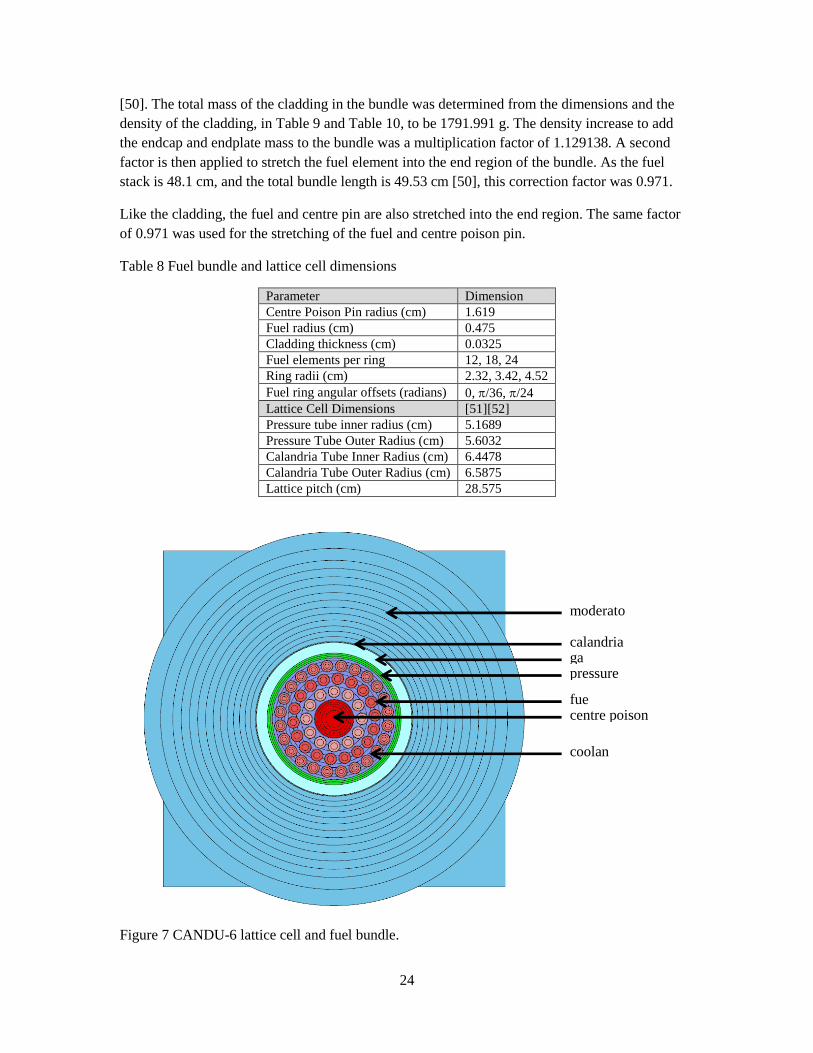
24
[50]. The total mass of the cladding in the bundle was determined from the dimensions and the
density of the cladding, in Table 9 and Table 10, to be 1791.991 g. The density increase to add
the endcap and endplate mass to the bundle was a multiplication factor of 1.129138. A second
factor is then applied to stretch the fuel element into the end region of the bundle. As the fuel
stack is 48.1 cm, and the total bundle length is 49.53 cm [50], this correction factor was 0.971.
Like the cladding, the fuel and centre pin are also stretched into the end region. The same factor
of 0.971 was used for the stretching of the fuel and centre poison pin.
Table 8 Fuel bundle and lattice cell dimensions
Parameter Dimension
Centre Poison Pin radius (cm) 1.619
Fuel radius (cm) 0.475
Cladding thickness (cm) 0.0325
Fuel elements per ring 12, 18, 24
Ring radii (cm) 2.32, 3.42, 4.52
Fuel ring angular offsets (radians) 0, /36, /24
Lattice Cell Dimensions [51][52]
Pressure tube inner radius (cm) 5.1689
Pressure Tube Outer Radius (cm) 5.6032
Calandria Tube Inner Radius (cm) 6.4478
Calandria Tube Outer Radius (cm) 6.5875
Lattice pitch (cm) 28.575
Figure 7 CANDU-6 lattice cell and fuel bundle.
moderato
r calandria
tube ga
p pressure
tube fue
l centre poison
pin
coolan
t
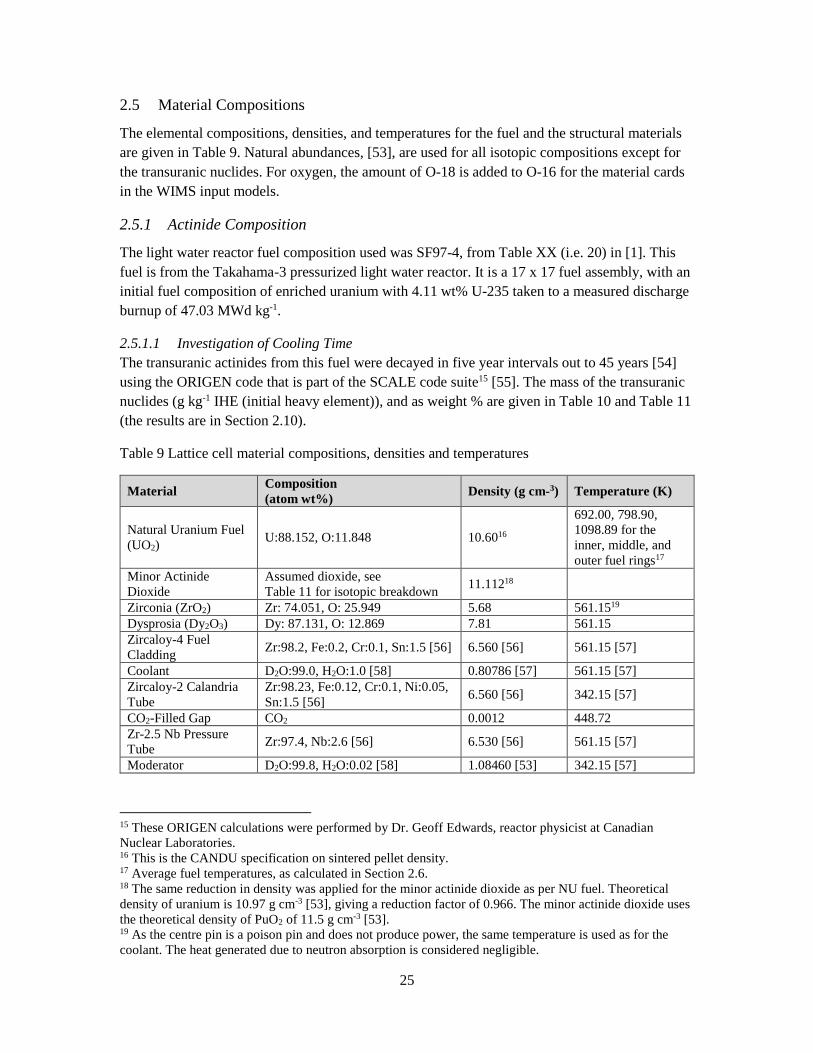
25
2.5 Material Compositions
The elemental compositions, densities, and temperatures for the fuel and the structural materials
are given in Table 9. Natural abundances, [53], are used for all isotopic compositions except for
the transuranic nuclides. For oxygen, the amount of O-18 is added to O-16 for the material cards
in the WIMS input models.
2.5.1 Actinide Composition
The light water reactor fuel composition used was SF97-4, from Table XX (i.e. 20) in [1]. This
fuel is from the Takahama-3 pressurized light water reactor. It is a 17 x 17 fuel assembly, with an
initial fuel composition of enriched uranium with 4.11 wt% U-235 taken to a measured discharge
burnup of 47.03 MWd kg-1.
2.5.1.1 Investigation of Cooling Time
The transuranic actinides from this fuel were decayed in five year intervals out to 45 years [54]
using the ORIGEN code that is part of the SCALE code suite15 [55]. The mass of the transuranic
nuclides (g kg-1 IHE (initial heavy element)), and as weight % are given in Table 10 and Table 11
(the results are in Section 2.10).
Table 9 Lattice cell material compositions, densities and temperatures
Material Composition
(atom wt%) Density (g cm-3) Temperature (K)
Natural Uranium Fuel
(UO2) U:88.152, O:11.848 10.6016
692.00, 798.90,
1098.89 for the
inner, middle, and
outer fuel rings17
Minor Actinide
Dioxide
Assumed dioxide, see
Table 11 for isotopic breakdown 11.11218
Zirconia (ZrO2) Zr: 74.051, O: 25.949 5.68 561.1519
Dysprosia (Dy2O3) Dy: 87.131, O: 12.869 7.81 561.15
Zircaloy-4 Fuel
Cladding Zr:98.2, Fe:0.2, Cr:0.1, Sn:1.5 [56] 6.560 [56] 561.15 [57]
Coolant D2O:99.0, H2O:1.0 [58] 0.80786 [57] 561.15 [57]
Zircaloy-2 Calandria
Tube
Zr:98.23, Fe:0.12, Cr:0.1, Ni:0.05,
Sn:1.5 [56] 6.560 [56] 342.15 [57]
CO2-Filled Gap CO2 0.0012 448.72
Zr-2.5 Nb Pressure
Tube Zr:97.4, Nb:2.6 [56] 6.530 [56] 561.15 [57]
Moderator D2O:99.8, H2O:0.02 [58] 1.08460 [53] 342.15 [57]
15 These ORIGEN calculations were performed by Dr. Geoff Edwards, reactor physicist at Canadian
Nuclear Laboratories. 16 This is the CANDU specification on sintered pellet density. 17 Average fuel temperatures, as calculated in Section 2.6. 18 The same reduction in density was applied for the minor actinide dioxide as per NU fuel. Theoretical
density of uranium is 10.97 g cm-3 [53], giving a reduction factor of 0.966. The minor actinide dioxide uses
the theoretical density of PuO2 of 11.5 g cm-3 [53]. 19 As the centre pin is a poison pin and does not produce power, the same temperature is used as for the
coolant. The heat generated due to neutron absorption is considered negligible.

26
Table 10 Amount of transuranic nuclides (g kg-1 IHE) in LWR spent fuel for decay times out to 45 years.
Nuclide Decay Time (years)
0 5 10 15 20 25 30 35 40 45
Np-237 6.60E-01 6.62E-01 6.67E-01 6.74E-01 6.82E-01 6.91E-01 7.02E-01 7.13E-01 7.25E-01 7.37E-01
Pu-238 3.20E-01 3.27E-01 3.14E-01 3.02E-01 2.90E-01 2.79E-01 2.68E-01 2.58E-01 2.48E-01 2.38E-01
Pu-239 6.04E+00 6.04E+00 6.04E+00 6.03E+00 6.03E+00 6.03E+00 6.03E+00 6.03E+00 6.03E+00 6.03E+00
Pu-240 2.67E+00 2.68E+00 2.69E+00 2.70E+00 2.71E+00 2.71E+00 2.72E+00 2.72E+00 2.72E+00 2.73E+00
Pu-241 1.77E+00 1.39E+00 1.09E+00 8.55E-01 6.71E-01 5.26E-01 4.13E-01 3.24E-01 2.54E-01 1.99E-01
Pu-242 8.25E-01 8.25E-01 8.25E-01 8.25E-01 8.25E-01 8.25E-01 8.25E-01 8.25E-01 8.25E-01 8.25E-01
Am-241 5.31E-02 4.32E-01 7.27E-01 9.55E-01 1.13E+00 1.27E+00 1.37E+00 1.45E+00 1.50E+00 1.55E+00
Am-242m 1.23E-03 1.20E-03 1.17E-03 1.15E-03 1.12E-03 1.09E-03 1.06E-03 1.04E-03 1.01E-03 9.88E-04
Am-243 1.92E-01 1.92E-01 1.92E-01 1.92E-01 1.92E-01 1.92E-01 1.92E-01 1.92E-01 1.92E-01 1.92E-01
Cm-242 2.04E-02 1.17E-05 3.06E-06 2.98E-06 2.91E-06 2.84E-06 2.77E-06 2.70E-06 2.64E-06 2.57E-06
Cm-243 8.72E-04 7.74E-04 6.87E-04 6.10E-04 5.42E-04 4.81E-04 4.27E-04 3.79E-04 3.36E-04 2.99E-04
Cm-244 8.81E-02 7.27E-02 6.01E-02 4.96E-02 4.10E-02 3.38E-02 2.79E-02 2.31E-02 1.90E-02 1.57E-02
Cm-245 6.04E-03 6.04E-03 6.04E-03 6.03E-03 6.03E-03 6.03E-03 6.03E-03 6.02E-03 6.02E-03 6.02E-03
Cm-246 7.44E-04 7.43E-04 7.43E-04 7.42E-04 7.42E-04 7.41E-04 7.41E-04 7.40E-04 7.40E-04 7.39E-04
Cm-247 1.10E-05 1.10E-05 1.10E-05 1.10E-05 1.10E-05 1.10E-05 1.10E-05 1.10E-05 1.10E-05 1.10E-05
Total TRU 1.26E+01 1.26E+01 1.26E+01 1.26E+01 1.26E+01 1.26E+01 1.26E+01 1.25E+01 1.25E+01 1.25E+01

27
Table 11 Isotopic composition (weight %) of transuranic nuclides in LWR spent fuel for decay times out to 45 years.
Nuclide Decay Time (years)
0 5 10 15 20 25 30 35 40 45
Np-237 5.2235 5.2458 5.2888 5.3479 5.4196 5.5008 5.5895 5.6838 5.7823 5.8840
Pu-238 2.5303 2.5892 2.4921 2.3986 2.3084 2.2216 2.1379 2.0574 1.9798 1.9051
Pu-239 47.7503 47.8054 47.8577 47.9082 47.9570 48.0041 48.0496 48.0935 48.1359 48.1768
Pu-240 21.1028 21.2380 21.3513 21.4467 21.5273 21.5955 21.6533 21.7024 21.7443 21.7800
Pu-241 14.0000 10.9986 8.6402 6.7873 5.3315 4.1879 3.2894 2.5836 2.0292 1.5937
Pu-242 6.5223 6.5305 6.5384 6.5460 6.5535 6.5607 6.5677 6.5744 6.5810 6.5874
Am-241 0.4201 3.4238 5.7624 7.5784 8.9839 10.0668 10.8962 11.5267 12.0009 12.3524
Am-242m 0.0098 0.0095 0.0093 0.0091 0.0089 0.0087 0.0085 0.0083 0.0081 0.0079
Am-243 1.5218 1.5230 1.5242 1.5252 1.5262 1.5272 1.5281 1.5290 1.5298 1.5306
Cm-242 0.1617 0.0001 0.0000 0.0000 0.0000 0.0000 0.0000 0.0000 0.0000 0.0000
Cm-243 0.0069 0.0061 0.0054 0.0048 0.0043 0.0038 0.0034 0.0030 0.0027 0.0024
Cm-244 0.6968 0.5761 0.4763 0.3937 0.3255 0.2691 0.2224 0.1838 0.1520 0.1256
Cm-245 0.0478 0.0478 0.0479 0.0479 0.0479 0.0480 0.0480 0.0480 0.0481 0.0481
Cm-246 0.0059 0.0059 0.0059 0.0059 0.0059 0.0059 0.0059 0.0059 0.0059 0.0059
Cm-247 0.0001 0.0001 0.0001 0.0001 0.0001 0.0001 0.0001 0.0001 0.0001 0.0001

28
2.6 Calculation of Fuel Temperatures
The calculation of fuel temperatures for each ring of fuel was performed using a base case with
no decay of the TRU, to an exit burnup of around 45 MWd kg-1, and a centre pin composition of
50%Dy2O3, 50% ZrO2.
The fuel temperature was calculated using an iterative process using the zero cooling time case.
First the model was run with fuel temperatures for all three rings of 960.15 K.
The fuel temperature, Tfuel, for each ring can be calculated as a function of the fuel radius position
r, using the equation
𝑇𝑓𝑢𝑒𝑙 =∫
𝐿𝐸𝑅
4𝜋𝑘(1 − (
𝑟
𝑅)
2) 𝑑𝑟
𝑅
0
𝑅+ 𝑇𝑐𝑜𝑜𝑙𝑎𝑛𝑡
where LER is the linear element rating, R is the outer fuel pellet radius, Tcoolant is the temperature
of the coolant, and k is the thermal conductivity. Using a constant value for the thermal
conductivity k (k=4.95 W m-1 K-1)20[59], the equation becomes independent of R,
𝑇𝑓𝑢𝑒𝑙 =2𝐿𝐸𝑅
12𝜋𝑘+ 𝑇𝑐𝑜𝑜𝑙𝑎𝑛𝑡
The LER values were calculated using the relative power density output for fresh fuel from
WIMS to be 11.85, 21.81, and 50.63 kW m-1 for rings 2, 3, and 4, respectively. The calculated
temperatures are given in Table 9.
Some basic reactor parameters were evaluated to investigate the effect of changing the fuel
temperatures, Table 12. The largest effect of changing the fuel temperature was on CVR, which
showed a 6% increase at exit burnup when using the calculated fuel temperatures, and a 2%
increase for the burnup-weighted average CVR. k∞ and CVR as a function of burnup are shown in
Figure 8 and Figure 9, respectively. The reactivity is virtually the same for the entire irradiation,
but the CVR deviates as the burnup increases. Given the small effect of changing the fuel
temperatures, these calculated fuel temperatures were used for all subsequent calculations; the
temperatures were not updated for changes in initial fuel composition.
Table 12 Comparison of some reactor parameters using the same fuel temperature for all fuel
rings, and for the calculated fuel temperatures.
Parameter All Fuels = 960.15 K Calculated Fuel
Temperatures % Change
Initial k∞ 1.389 1.389 -0.01
Average CVR (mk) 1.79 1.72 -4.47
Exit burnup (MWd kg-1) 45.12 45.09 -0.06
Exit CVR (mk) -2.67 -2.83 6.18
20 Calculated by J. Armstrong using ELESTRES.
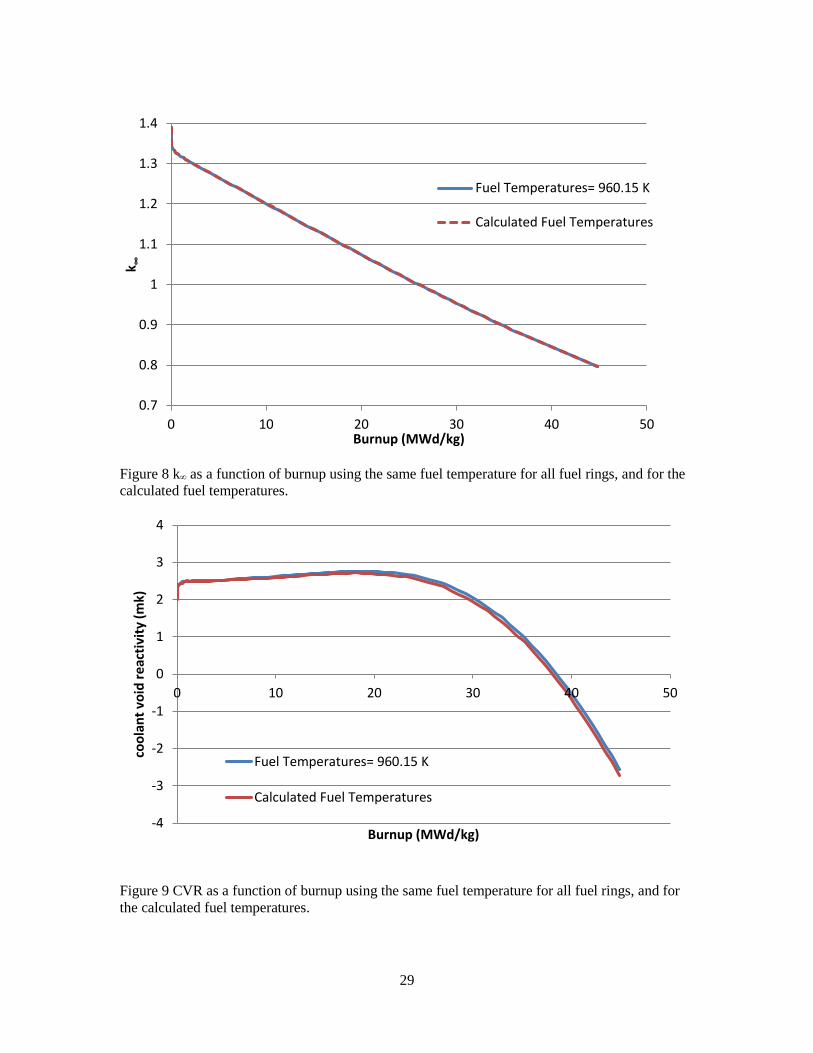
29
Figure 8 k∞ as a function of burnup using the same fuel temperature for all fuel rings, and for the
calculated fuel temperatures.
Figure 9 CVR as a function of burnup using the same fuel temperature for all fuel rings, and for
the calculated fuel temperatures.
0.7
0.8
0.9
1
1.1
1.2
1.3
1.4
0 10 20 30 40 50
k ∞
Burnup (MWd/kg)
Fuel Temperatures= 960.15 K
Calculated Fuel Temperatures
-4
-3
-2
-1
0
1
2
3
4
0 10 20 30 40 50
coo
lan
t vo
id r
eac
tivi
ty (
mk)
Burnup (MWd/kg)
Fuel Temperatures= 960.15 K
Calculated Fuel Temperatures

30
2.7 WIMS-AECL Model Parameters
The WIMS-AECL model was developed as a single cell in multicell mode, using the following
input lines:
SEQUENCE MultiCell=1,4,2,1
CELL 1 cluster Position=1,1 Neighbours=1,1,1,1
symmetry -4 0.d 90.d *4 Sectors
TOLErance 1e-6
NEWRES 4 .1 -12 0.d 30d *
Other input specification used are:
89 energy groups
BUCKling 1e-4 1e-4
o Specifies the axial and radial bucklings in units of cm-2.
No burnup of the moderator and coolant
Leakage -6
o This setting uses the critical bucklings calculated with their ratio set to the ratio
of the input bucklings
BENOist 1
o This keyword selects a multi-region diffusion coefficient calculation. This setting
specifies to use Beniost directional diffusion coefficients calculated by annular
cell smearing.
BEEOne 1
o The BEEOne keyword selects the flux solution method used for the leakage
calculation. This setting uses B1 solutions of neutron flux and total current given
buckling and diffusion coefficients.
Timesteps for the burnup calculation were finer at the beginning of the irradiation, lengthening as
time progresses. The following timesteps were used, all in days: 0.2, 0.4, .5, 0.8, 1.2, 2.85, 4, 5
steps of 5 days, and then 15 day steps up to the total irradiation time.
2.8 Coolant Void Reactivity Target
When a fission reaction occurs most neutrons are emitted immediately, referred to as prompt
neutrons. However, there are two phenomena which lead to a delay of neutron emission following
the fission reaction: the decay of fission products, and photoneutrons. In the former process
unstable fission products decay via the emission of a particle creating an excited daughter
product, which de-excites by the prompt emission of a neutron. The time delay of the neutron
emission with respect to the initiating fission reaction is due to the half-life of the decay, hence
the term -delayed neutrons.
In the second process, neutrons are emitted following the capture of a -ray, (,n), and these
neutrons are referred to as photoneutrons. As the -rays initiating this process can be emitted by
fission products with a delay after the initial fission, they are treated similarly to -delayed
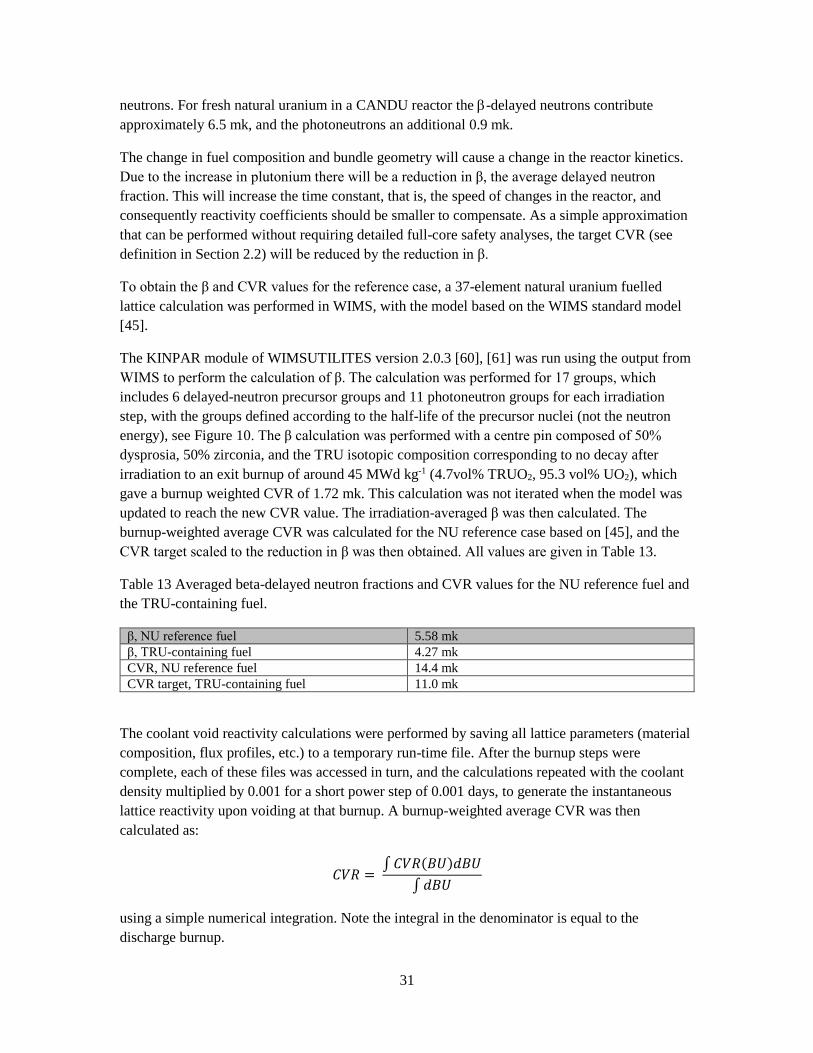
31
neutrons. For fresh natural uranium in a CANDU reactor the -delayed neutrons contribute
approximately 6.5 mk, and the photoneutrons an additional 0.9 mk.
The change in fuel composition and bundle geometry will cause a change in the reactor kinetics.
Due to the increase in plutonium there will be a reduction in β, the average delayed neutron
fraction. This will increase the time constant, that is, the speed of changes in the reactor, and
consequently reactivity coefficients should be smaller to compensate. As a simple approximation
that can be performed without requiring detailed full-core safety analyses, the target CVR (see
definition in Section 2.2) will be reduced by the reduction in β.
To obtain the β and CVR values for the reference case, a 37-element natural uranium fuelled
lattice calculation was performed in WIMS, with the model based on the WIMS standard model
[45].
The KINPAR module of WIMSUTILITES version 2.0.3 [60], [61] was run using the output from
WIMS to perform the calculation of β. The calculation was performed for 17 groups, which
includes 6 delayed-neutron precursor groups and 11 photoneutron groups for each irradiation
step, with the groups defined according to the half-life of the precursor nuclei (not the neutron
energy), see Figure 10. The β calculation was performed with a centre pin composed of 50%
dysprosia, 50% zirconia, and the TRU isotopic composition corresponding to no decay after
irradiation to an exit burnup of around 45 MWd kg-1 (4.7vol% TRUO2, 95.3 vol% UO2), which
gave a burnup weighted CVR of 1.72 mk. This calculation was not iterated when the model was
updated to reach the new CVR value. The irradiation-averaged β was then calculated. The
burnup-weighted average CVR was calculated for the NU reference case based on [45], and the
CVR target scaled to the reduction in β was then obtained. All values are given in Table 13.
Table 13 Averaged beta-delayed neutron fractions and CVR values for the NU reference fuel and
the TRU-containing fuel.
β, NU reference fuel 5.58 mk
β, TRU-containing fuel 4.27 mk
CVR, NU reference fuel 14.4 mk
CVR target, TRU-containing fuel 11.0 mk
The coolant void reactivity calculations were performed by saving all lattice parameters (material
composition, flux profiles, etc.) to a temporary run-time file. After the burnup steps were
complete, each of these files was accessed in turn, and the calculations repeated with the coolant
density multiplied by 0.001 for a short power step of 0.001 days, to generate the instantaneous
lattice reactivity upon voiding at that burnup. A burnup-weighted average CVR was then
calculated as:
𝐶𝑉𝑅 = ∫ 𝐶𝑉𝑅(𝐵𝑈)𝑑𝐵𝑈
∫ 𝑑𝐵𝑈
using a simple numerical integration. Note the integral in the denominator is equal to the
discharge burnup.
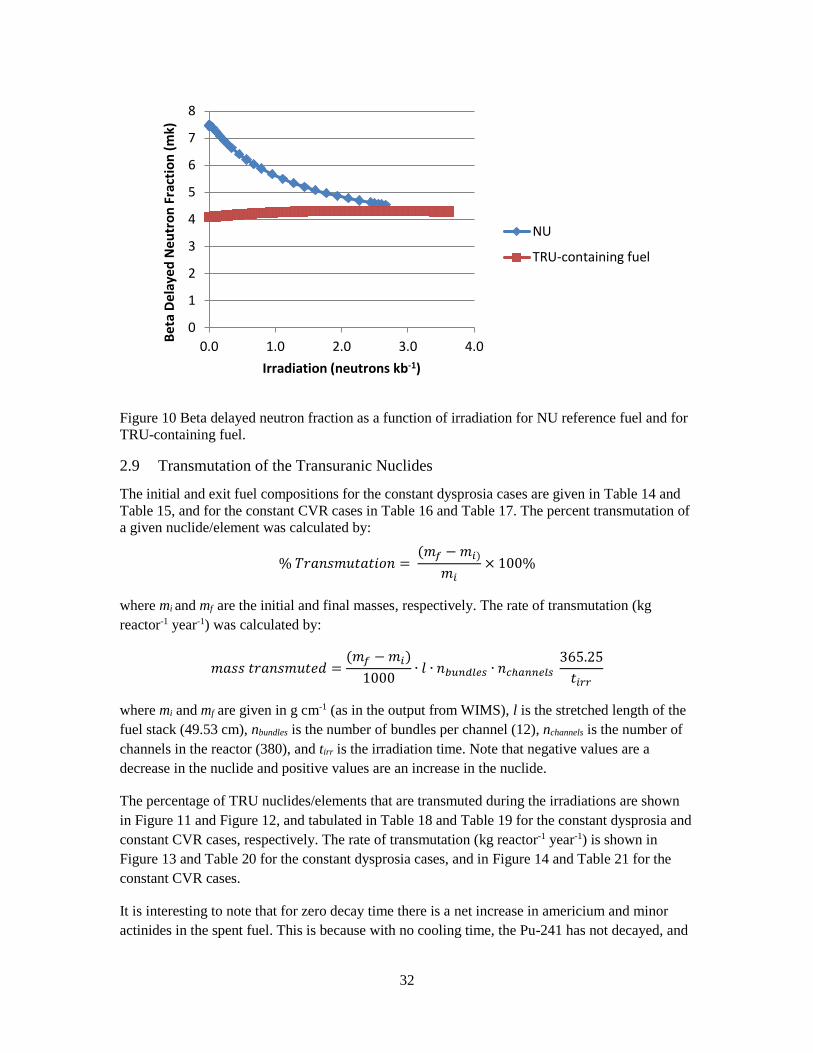
32
Figure 10 Beta delayed neutron fraction as a function of irradiation for NU reference fuel and for
TRU-containing fuel.
2.9 Transmutation of the Transuranic Nuclides
The initial and exit fuel compositions for the constant dysprosia cases are given in Table 14 and
Table 15, and for the constant CVR cases in Table 16 and Table 17. The percent transmutation of
a given nuclide/element was calculated by:
% 𝑇𝑟𝑎𝑛𝑠𝑚𝑢𝑡𝑎𝑡𝑖𝑜𝑛 = (𝑚𝑓 − 𝑚𝑖)
𝑚𝑖× 100%
where mi and mf are the initial and final masses, respectively. The rate of transmutation (kg
reactor-1 year-1) was calculated by:
𝑚𝑎𝑠𝑠 𝑡𝑟𝑎𝑛𝑠𝑚𝑢𝑡𝑒𝑑 =(𝑚𝑓 − 𝑚𝑖)
1000∙ 𝑙 ∙ 𝑛𝑏𝑢𝑛𝑑𝑙𝑒𝑠 ∙ 𝑛𝑐ℎ𝑎𝑛𝑛𝑒𝑙𝑠
365.25
𝑡𝑖𝑟𝑟
where mi and mf are given in g cm-1 (as in the output from WIMS), l is the stretched length of the
fuel stack (49.53 cm), nbundles is the number of bundles per channel (12), nchannels is the number of
channels in the reactor (380), and tirr is the irradiation time. Note that negative values are a
decrease in the nuclide and positive values are an increase in the nuclide.
The percentage of TRU nuclides/elements that are transmuted during the irradiations are shown
in Figure 11 and Figure 12, and tabulated in Table 18 and Table 19 for the constant dysprosia and
constant CVR cases, respectively. The rate of transmutation (kg reactor-1 year-1) is shown in
Figure 13 and Table 20 for the constant dysprosia cases, and in Figure 14 and Table 21 for the
constant CVR cases.
It is interesting to note that for zero decay time there is a net increase in americium and minor
actinides in the spent fuel. This is because with no cooling time, the Pu-241 has not decayed, and
0
1
2
3
4
5
6
7
8
0.0 1.0 2.0 3.0 4.0
Bet
a D
ela
yed
Neu
tro
n F
ract
ion
(m
k)
Irradiation (neutrons kb-1)
NU
TRU-containing fuel
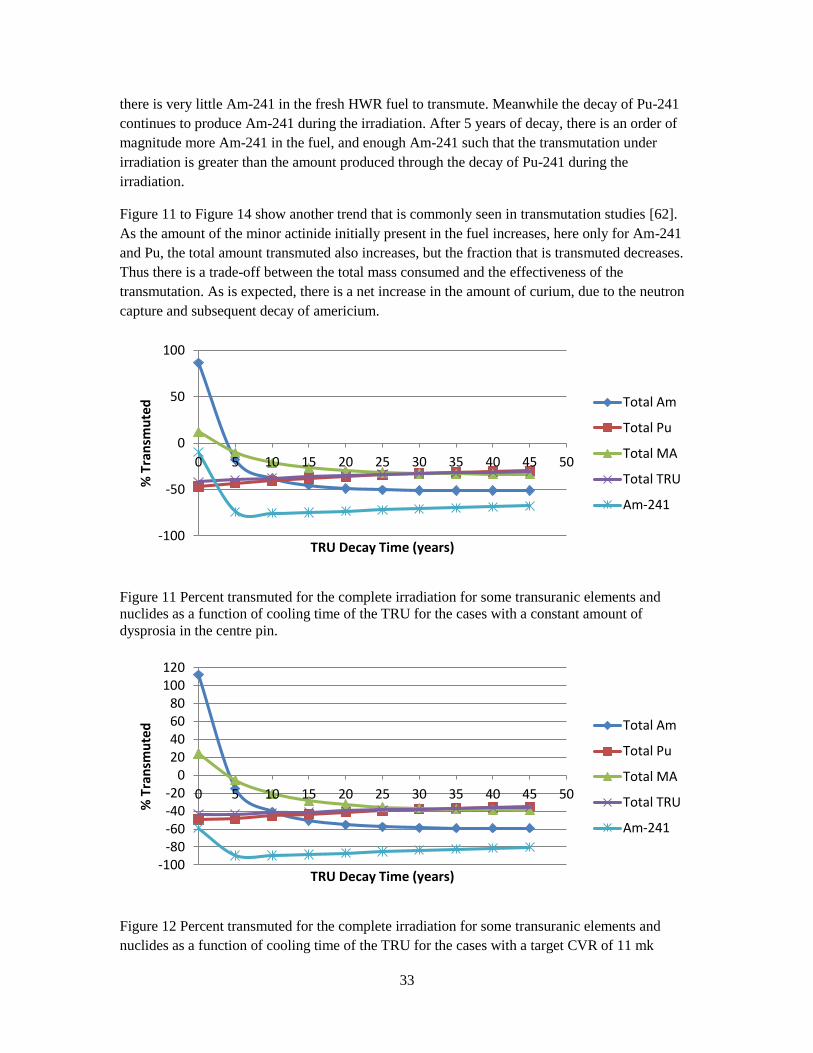
33
there is very little Am-241 in the fresh HWR fuel to transmute. Meanwhile the decay of Pu-241
continues to produce Am-241 during the irradiation. After 5 years of decay, there is an order of
magnitude more Am-241 in the fuel, and enough Am-241 such that the transmutation under
irradiation is greater than the amount produced through the decay of Pu-241 during the
irradiation.
Figure 11 to Figure 14 show another trend that is commonly seen in transmutation studies [62].
As the amount of the minor actinide initially present in the fuel increases, here only for Am-241
and Pu, the total amount transmuted also increases, but the fraction that is transmuted decreases.
Thus there is a trade-off between the total mass consumed and the effectiveness of the
transmutation. As is expected, there is a net increase in the amount of curium, due to the neutron
capture and subsequent decay of americium.
Figure 11 Percent transmuted for the complete irradiation for some transuranic elements and
nuclides as a function of cooling time of the TRU for the cases with a constant amount of
dysprosia in the centre pin.
Figure 12 Percent transmuted for the complete irradiation for some transuranic elements and
nuclides as a function of cooling time of the TRU for the cases with a target CVR of 11 mk
-100
-50
0
50
100
0 5 10 15 20 25 30 35 40 45 50
% T
ran
smu
ted
TRU Decay Time (years)
Total Am
Total Pu
Total MA
Total TRU
Am-241
-100-80-60-40-20
020406080
100120
0 5 10 15 20 25 30 35 40 45 50
% T
ran
smu
ted
TRU Decay Time (years)
Total Am
Total Pu
Total MA
Total TRU
Am-241
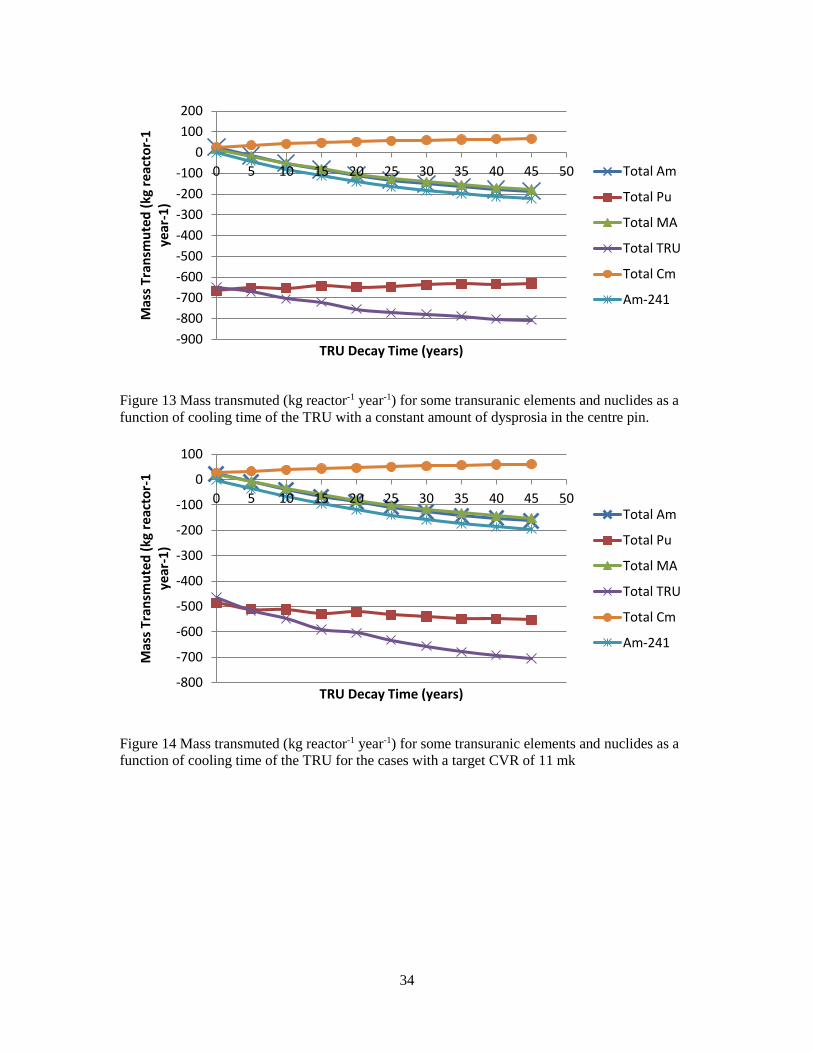
34
Figure 13 Mass transmuted (kg reactor-1 year-1) for some transuranic elements and nuclides as a
function of cooling time of the TRU with a constant amount of dysprosia in the centre pin.
Figure 14 Mass transmuted (kg reactor-1 year-1) for some transuranic elements and nuclides as a
function of cooling time of the TRU for the cases with a target CVR of 11 mk
-900
-800
-700
-600
-500
-400
-300
-200
-100
0
100
200
0 5 10 15 20 25 30 35 40 45 50
Mas
s Tr
ansm
ute
d (
kg r
eact
or-
1
year
-1)
TRU Decay Time (years)
Total Am
Total Pu
Total MA
Total TRU
Total Cm
Am-241
-800
-700
-600
-500
-400
-300
-200
-100
0
100
0 5 10 15 20 25 30 35 40 45 50
Mas
s Tr
ansm
ute
d (
kg r
eac
tor-
1
year
-1)
TRU Decay Time (years)
Total Am
Total Pu
Total MA
Total TRU
Total Cm
Am-241

35
Table 14 Initial masses (g kgIHE-1(initial heavy elements)) of transuranic nuclides in the fuel as a function of decay time of the TRU for the cases
with a constant amount of dysprosia in the centre pin.
Nuclide Decay Time (years)
0 5 10 15 20 25 30 35 40 45
Np-237 2.57 2.80 3.10 3.36 3.68 3.97 4.21 4.46 4.71 4.92
Total Np 2.57 2.80 3.10 3.36 3.68 3.97 4.21 4.46 4.71 4.92
Pu-238 1.24 1.38 1.46 1.51 1.57 1.60 1.61 1.61 1.61 1.59
Pu-239 23.48 25.51 28.03 30.06 32.59 34.62 36.16 37.69 39.23 40.26
Pu-240 10.38 11.34 12.51 13.46 14.63 15.58 16.30 17.02 17.73 18.21
Pu-241 6.89 5.87 5.06 4.26 3.62 3.02 2.48 2.03 1.66 1.33
Pu-242 3.21 3.49 3.83 4.11 4.45 4.73 4.94 5.15 5.36 5.51
Total Pu 45.20 47.58 50.89 53.39 56.87 59.56 61.49 63.50 65.59 66.91
Am-241 0.21 1.83 3.38 4.76 6.11 7.26 8.20 9.03 9.78 10.32
Am-242m 0.00 0.01 0.01 0.01 0.01 0.01 0.01 0.01 0.01 0.01
Am-243 0.75 0.81 0.89 0.96 1.04 1.10 1.15 1.20 1.25 1.28
Total Am 0.96 2.64 4.27 5.72 7.15 8.37 9.36 10.24 11.03 11.61
Cm-242 0.08 0.00 0.00 0.00 0.00 0.00 0.00 0.00 0.00 0.00
Cm-243 0.00 0.00 0.00 0.00 0.00 0.00 0.00 0.00 0.00 0.00
Cm-244 0.34 0.31 0.28 0.25 0.22 0.19 0.17 0.14 0.12 0.11
Cm-245 0.02 0.03 0.03 0.03 0.03 0.03 0.04 0.04 0.04 0.04
Cm-246 0.00 0.00 0.00 0.00 0.00 0.00 0.00 0.00 0.00 0.00
Cm-247 0.00 0.00 0.00 0.00 0.00 0.00 0.00 0.00 0.00 0.00
Cm-248 0.00 0.00 0.00 0.00 0.00 0.00 0.00 0.00 0.00 0.00
Total Cm 0.45 0.34 0.31 0.28 0.26 0.24 0.21 0.19 0.17 0.15
Total MA 3.98 5.78 7.69 9.36 11.09 12.57 13.77 14.88 15.92 16.68
Total TRU 49.19 53.36 58.58 62.75 67.97 72.13 75.26 78.38 81.51 83.59
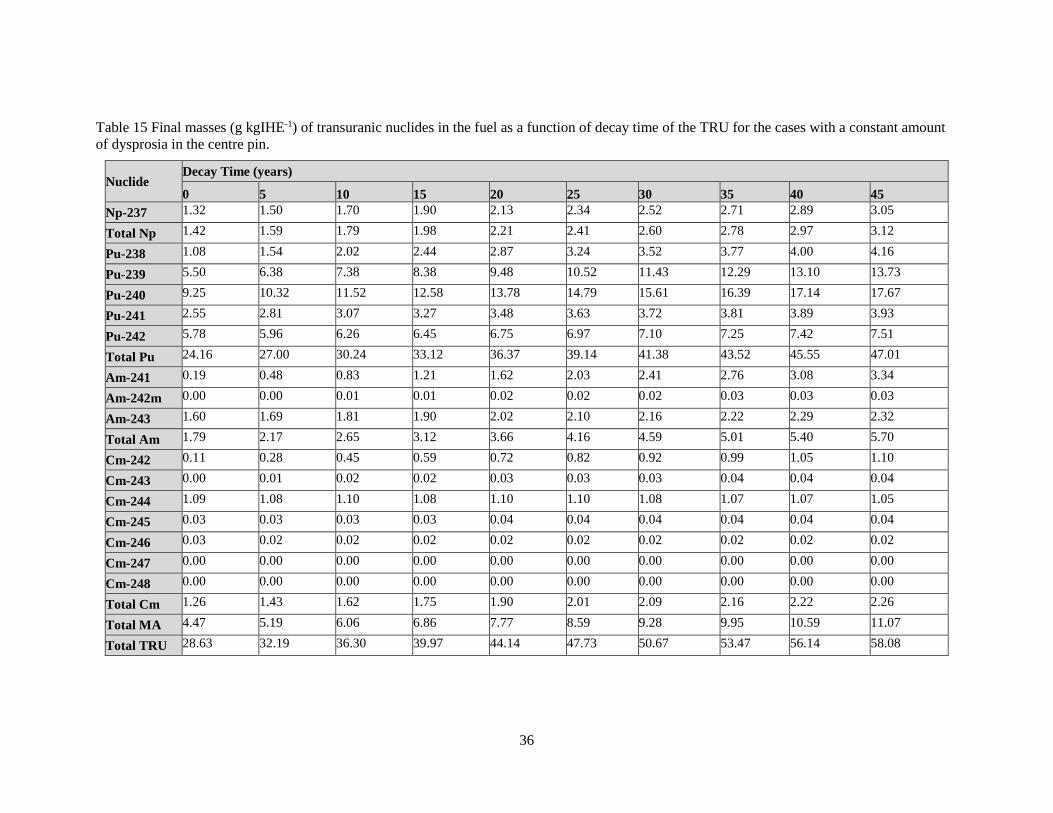
36
Table 15 Final masses (g kgIHE-1) of transuranic nuclides in the fuel as a function of decay time of the TRU for the cases with a constant amount
of dysprosia in the centre pin.
Nuclide Decay Time (years)
0 5 10 15 20 25 30 35 40 45
Np-237 1.32 1.50 1.70 1.90 2.13 2.34 2.52 2.71 2.89 3.05
Total Np 1.42 1.59 1.79 1.98 2.21 2.41 2.60 2.78 2.97 3.12
Pu-238 1.08 1.54 2.02 2.44 2.87 3.24 3.52 3.77 4.00 4.16
Pu-239 5.50 6.38 7.38 8.38 9.48 10.52 11.43 12.29 13.10 13.73
Pu-240 9.25 10.32 11.52 12.58 13.78 14.79 15.61 16.39 17.14 17.67
Pu-241 2.55 2.81 3.07 3.27 3.48 3.63 3.72 3.81 3.89 3.93
Pu-242 5.78 5.96 6.26 6.45 6.75 6.97 7.10 7.25 7.42 7.51
Total Pu 24.16 27.00 30.24 33.12 36.37 39.14 41.38 43.52 45.55 47.01
Am-241 0.19 0.48 0.83 1.21 1.62 2.03 2.41 2.76 3.08 3.34
Am-242m 0.00 0.00 0.01 0.01 0.02 0.02 0.02 0.03 0.03 0.03
Am-243 1.60 1.69 1.81 1.90 2.02 2.10 2.16 2.22 2.29 2.32
Total Am 1.79 2.17 2.65 3.12 3.66 4.16 4.59 5.01 5.40 5.70
Cm-242 0.11 0.28 0.45 0.59 0.72 0.82 0.92 0.99 1.05 1.10
Cm-243 0.00 0.01 0.02 0.02 0.03 0.03 0.03 0.04 0.04 0.04
Cm-244 1.09 1.08 1.10 1.08 1.10 1.10 1.08 1.07 1.07 1.05
Cm-245 0.03 0.03 0.03 0.03 0.04 0.04 0.04 0.04 0.04 0.04
Cm-246 0.03 0.02 0.02 0.02 0.02 0.02 0.02 0.02 0.02 0.02
Cm-247 0.00 0.00 0.00 0.00 0.00 0.00 0.00 0.00 0.00 0.00
Cm-248 0.00 0.00 0.00 0.00 0.00 0.00 0.00 0.00 0.00 0.00
Total Cm 1.26 1.43 1.62 1.75 1.90 2.01 2.09 2.16 2.22 2.26
Total MA 4.47 5.19 6.06 6.86 7.77 8.59 9.28 9.95 10.59 11.07
Total TRU 28.63 32.19 36.30 39.97 44.14 47.73 50.67 53.47 56.14 58.08
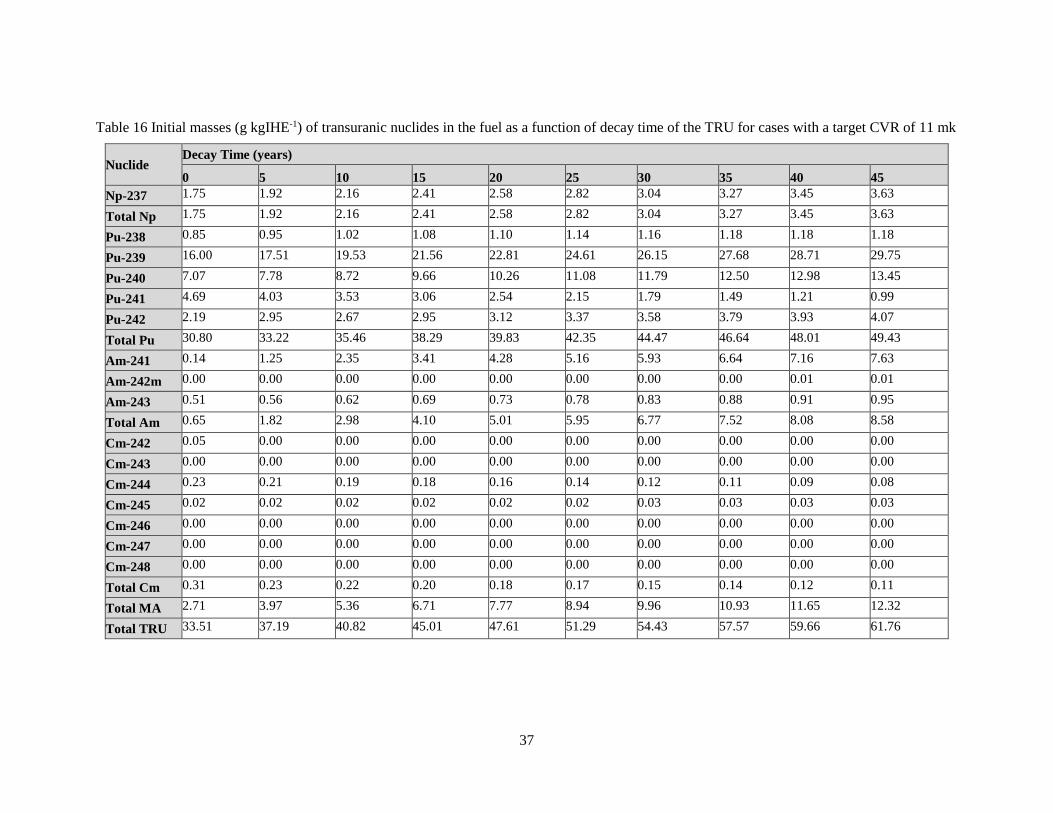
37
Table 16 Initial masses (g kgIHE-1) of transuranic nuclides in the fuel as a function of decay time of the TRU for cases with a target CVR of 11 mk
Nuclide Decay Time (years)
0 5 10 15 20 25 30 35 40 45
Np-237 1.75 1.92 2.16 2.41 2.58 2.82 3.04 3.27 3.45 3.63
Total Np 1.75 1.92 2.16 2.41 2.58 2.82 3.04 3.27 3.45 3.63
Pu-238 0.85 0.95 1.02 1.08 1.10 1.14 1.16 1.18 1.18 1.18
Pu-239 16.00 17.51 19.53 21.56 22.81 24.61 26.15 27.68 28.71 29.75
Pu-240 7.07 7.78 8.72 9.66 10.26 11.08 11.79 12.50 12.98 13.45
Pu-241 4.69 4.03 3.53 3.06 2.54 2.15 1.79 1.49 1.21 0.99
Pu-242 2.19 2.95 2.67 2.95 3.12 3.37 3.58 3.79 3.93 4.07
Total Pu 30.80 33.22 35.46 38.29 39.83 42.35 44.47 46.64 48.01 49.43
Am-241 0.14 1.25 2.35 3.41 4.28 5.16 5.93 6.64 7.16 7.63
Am-242m 0.00 0.00 0.00 0.00 0.00 0.00 0.00 0.00 0.01 0.01
Am-243 0.51 0.56 0.62 0.69 0.73 0.78 0.83 0.88 0.91 0.95
Total Am 0.65 1.82 2.98 4.10 5.01 5.95 6.77 7.52 8.08 8.58
Cm-242 0.05 0.00 0.00 0.00 0.00 0.00 0.00 0.00 0.00 0.00
Cm-243 0.00 0.00 0.00 0.00 0.00 0.00 0.00 0.00 0.00 0.00
Cm-244 0.23 0.21 0.19 0.18 0.16 0.14 0.12 0.11 0.09 0.08
Cm-245 0.02 0.02 0.02 0.02 0.02 0.02 0.03 0.03 0.03 0.03
Cm-246 0.00 0.00 0.00 0.00 0.00 0.00 0.00 0.00 0.00 0.00
Cm-247 0.00 0.00 0.00 0.00 0.00 0.00 0.00 0.00 0.00 0.00
Cm-248 0.00 0.00 0.00 0.00 0.00 0.00 0.00 0.00 0.00 0.00
Total Cm 0.31 0.23 0.22 0.20 0.18 0.17 0.15 0.14 0.12 0.11
Total MA 2.71 3.97 5.36 6.71 7.77 8.94 9.96 10.93 11.65 12.32
Total TRU 33.51 37.19 40.82 45.01 47.61 51.29 54.43 57.57 59.66 61.76

38
Table 17 Final masses (g kgIHE-1) of transuranic nuclides in the fuel as a function of decay time of the TRU for cases with a target CVR of 11 mk
Nuclide Decay Time (years)
0 5 10 15 20 25 30 35 40 45
Np-237 0.71 0.81 0.96 1.11 1.24 1.40 1.55 1.70 1.82 1.94
Total Np 0.84 0.94 1.07 1.22 1.35 1.50 1.64 1.79 1.91 2.03
Pu-238 0.55 0.83 1.17 1.53 1.82 2.14 2.42 2.67 2.86 3.03
Pu-239 3.31 3.61 4.06 4.56 5.04 5.63 6.18 6.75 7.16 7.61
Pu-240 5.65 6.32 7.22 8.15 8.87 9.74 10.50 11.23 11.74 12.26
Pu-241 1.49 1.67 1.92 2.15 2.33 2.53 2.70 2.85 2.95 3.04
Pu-242 4.57 4.75 5.02 5.29 5.38 5.59 5.76 5.94 6.05 6.16
Total Pu 15.57 17.19 19.40 21.67 23.45 25.63 27.55 29.44 30.76 32.10
Am-241 0.06 0.13 0.25 0.40 0.57 0.77 0.97 1.18 1.34 1.50
Am-242m 0.00 0.00 0.00 0.00 0.01 0.01 0.01 0.01 0.01 0.01
Am-243 1.33 1.41 1.51 1.61 1.66 1.75 1.82 1.89 1.93 1.98
Total Am 1.39 1.54 1.76 2.02 2.24 2.52 2.80 3.08 3.29 3.50
Cm-242 0.07 0.18 0.30 0.41 0.51 0.61 0.69 0.76 0.82 0.86
Cm-243 0.00 0.01 0.01 0.02 0.02 0.02 0.03 0.03 0.03 0.03
Cm-244 1.02 1.03 1.05 1.08 1.05 1.06 1.06 1.07 1.07 1.07
Cm-245 0.02 0.02 0.02 0.03 0.03 0.03 0.03 0.03 0.03 0.03
Cm-246 0.02 0.02 0.02 0.02 0.02 0.02 0.02 0.02 0.02 0.02
Cm-247 0.00 0.00 0.00 0.00 0.00 0.00 0.00 0.00 0.00 0.00
Cm-248 0.00 0.00 0.00 0.00 0.00 0.00 0.00 0.00 0.00 0.00
Total Cm 1.14 1.27 1.41 1.56 1.64 1.75 1.84 1.92 1.97 2.02
Total MA 3.37 3.74 4.25 4.80 5.22 5.77 6.28 6.79 7.17 7.55
Total TRU 18.94 20.93 23.64 26.47 28.67 31.40 33.83 36.23 37.92 39.65

39
Table 18 Percent transmuted for the transuranic nuclides in the fuel as a function of decay time of the TRU for the cases with a constant amount of
dysprosia in the centre pin.
Nuclide Decay Time (years)
0 5 10 15 20 25 30 35 40 45
Np-237 -48.72 -46.58 -45.06 -43.38 -42.29 -41.15 -40.03 -39.19 -38.61 -38.04
Total Np -44.83 -43.23 -42.21 -40.86 -40.09 -39.18 -38.22 -37.52 -37.06 -36.57
Pu-238 -13.38 11.39 38.16 62.15 83.18 101.87 118.78 134.03 147.93 161.09
Pu-239 -76.56 -74.97 -73.67 -72.12 -70.90 -69.62 -68.39 -67.40 -66.60 -65.90
Pu-240 -10.94 -9.01 -7.93 -6.54 -5.87 -5.06 -4.22 -3.66 -3.33 -2.94
Pu-241 -62.93 -52.19 -39.42 -23.31 -4.09 20.03 50.38 88.03 134.93 194.64
Pu-242 79.97 70.86 63.40 56.91 51.63 47.16 43.57 40.64 38.35 36.41
Total Pu -46.56 -43.25 -40.57 -37.98 -36.06 -34.29 -32.69 -31.47 -30.55 -29.74
Am-241 -9.57 -73.96 -75.53 -74.62 -73.39 -72.00 -70.64 -69.47 -68.52 -67.69
Am-242m -65.75 -15.24 39.28 96.87 153.70 209.75 263.39 312.74 357.27 397.42
Am-243 114.03 107.90 102.91 98.14 94.37 90.83 87.67 85.17 83.25 81.55
Total Am 86.58 -17.91 -38.06 -45.49 -48.81 -50.31 -50.90 -51.08 -51.07 -50.93
Cm-242 38.54 342781.96 611350.32 621699.08 629035.29 637568.19 647630.24 655011.94 659312.12 665230.57
Cm-243 7.51 202.97 399.62 597.56 787.21 983.21 1191.47 1405.48 1627.48 1874.77
Cm-244 218.81 251.32 292.95 338.44 397.39 464.90 543.30 640.58 760.91 903.33
Cm-245 24.91 21.67 19.52 16.08 14.03 11.19 7.82 5.14 3.12 0.80
Cm-246 770.85 668.26 597.29 529.09 484.31 442.34 404.61 376.77 356.73 338.13
Cm-247 1099.40 984.45 914.46 837.04 795.05 749.31 703.96 672.32 651.56 629.22
Cm-248 4196052.27 3735300.43 3523338.60 3225089.76 3125108.05 2970637.02 2790682.93 2680005.13 2623814.17 2540101.56
Total Cm 179.10 321.08 415.02 517.28 629.77 753.36 891.08 1041.48 1202.74 1379.98
Total MA 12.29 -10.26 -21.22 -26.74 -29.95 -31.71 -32.61 -33.14 -33.50 -33.62
Total TRU -41.79 -39.67 -38.04 -36.30 -35.06 -33.84 -32.68 -31.79 -31.13 -30.52

40
Table 19 Percentage transmuted of transuranic nuclides in the fuel as a function of decay time of the TRU for cases with a target CVR of 11 mk
Nuclide Decay Time (years)
0 5 10 15 20 25 30 35 40 45
Np-237 -59.58 -57.70 -55.56 -53.78 -51.78 -50.26 -49.01 -48.01 -47.31 -46.55
Total Np -52.14 -51.34 -50.29 -49.35 -47.84 -46.82 -45.94 -45.25 -44.74 -44.15
Pu-238 -34.71 -12.18 15.43 41.29 65.57 87.75 107.65 125.80 142.11 157.69
Pu-239 -79.34 -79.37 -79.23 -78.85 -77.89 -77.13 -76.35 -75.63 -75.08 -74.43
Pu-240 -20.19 -18.86 -17.15 -15.64 -13.55 -12.12 -10.98 -10.13 -9.52 -8.85
Pu-241 -68.22 -58.45 -45.65 -29.48 -8.25 17.90 50.63 91.47 143.15 208.60
Pu-242 109.11 61.32 88.10 79.45 72.46 66.01 61.04 56.93 54.06 51.29
Total Pu -49.44 -48.25 -45.31 -43.40 -41.13 -39.48 -38.04 -36.86 -35.94 -35.06
Am-241 -59.17 -89.59 -89.48 -88.28 -86.75 -85.09 -83.62 -82.27 -81.34 -80.30
Am-242m -85.03 -67.62 -43.10 -14.08 12.57 54.21 89.01 123.08 151.35 181.23
Am-243 160.54 152.02 142.73 135.20 128.61 122.80 118.27 114.34 111.86 109.08
Total Am 112.07 -15.25 -40.86 -50.76 -55.34 -57.57 -58.64 -59.08 -59.32 -59.23
Cm-242 31.83 277586.32 456285.22 472955.25 68662.08 510992.43 526019.04 538362.36 546068.24 555789.52
Cm-243 2.26 202.14 417.98 637.74 878.73 1114.16 1360.13 1612.00 1885.63 2180.11
Cm-244 337.68 388.99 441.66 507.14 578.30 668.24 777.80 911.36 1079.41 1273.34
Cm-245 33.30 30.16 27.58 25.78 22.25 20.09 18.00 16.34 14.57 12.71
Cm-246 1165.63 1033.04 910.66 816.88 721.60 656.24 603.78 563.61 533.34 504.46
Cm-247 1546.03 1406.18 1282.13 1188.87 1074.34 1005.75 949.14 907.86 874.22 841.32
Cm-248 5489453.66 4967481.14 4554554.26 4266785.11 1270235.87 3603838.96 3428889.28 3320179.19 3217060.87 3114772.73
Total Cm 271.04 444.04 546.23 663.60 792.24 941.75 1104.94 1282.34 1482.30 1692.83
Total MA 24.16 -5.75 -20.68 -28.56 -32.81 -35.42 -36.94 -37.89 -38.50 -38.77
Total TRU -43.48 -43.71 -42.08 -41.19 -39.77 -38.77 -37.84 -37.06 -36.44 -35.80

41
Table 20 Mass transmuted per reactor per year (kg reactor-1 year-1) for the cases with a constant amount of dysprosia in the centre pin
Nuclide Decay Time (years)
0 5 10 15 20 25 30 35 40 45
Np-237 -39.6 -41.3 -44.2 -46.1 -49.3 -51.7 -53.3 -55.3 -57.7 -59.3
Total Np -36.4 -38.3 -41.4 -43.4 -46.8 -49.2 -50.9 -53.0 -55.3 -57.0
Pu-238 -5.3 5.0 17.6 29.6 41.3 51.7 60.5 68.5 75.6 81.3
Pu-239 -568.7 -604.9 -653.4 -686.1 -731.4 -763.2 -783.1 -804.6 -827.6 -840.6
Pu-240 -35.9 -32.3 -31.4 -27.9 -27.2 -25.0 -21.8 -19.7 -18.7 -16.9
Pu-241 -137.1 -96.9 -63.1 -31.4 -4.7 19.2 39.5 56.5 70.8 82.3
Pu-242 81.2 78.1 76.9 74.0 72.8 70.7 68.2 66.3 65.2 63.5
Total Pu -665.7 -651.0 -653.4 -641.8 -649.1 -646.6 -636.6 -633.0 -634.7 -630.4
Am-241 -6.3E-01 -42.8 -80.7 -112.3 -141.9 -165.5 -183.4 -198.8 -212.3 -221.4
Am-242m -1.0E-01 -2.5E-02 6.9E-02 1.8E-01 3.0E-01 4.3E-01 5.5E-01 6.6E-01 0.8 0.9
Am-243 27.0 27.7 29.1 29.7 31.0 31.7 31.9 32.3 32.9 33.1
Total Am 26.3 -15.0 -51.5 -82.3 -110.5 -133.3 -150.8 -165.7 -178.5 -187.3
Cm-242 9.7E-01 9.0 14.1 18.7 22.7 26.1 29.0 31.4 33.3 34.8
Cm-243 8.1E-03 2.1E-01 4.0E-01 5.7E-01 7.3E-01 8.6E-01 9.7E-01 1.1 1.1 1.2
Cm-244 23.7 24.5 25.9 26.5 27.8 28.6 28.8 29.3 29.9 30.1
Cm-245 1.9E-01 1.8E-01 1.7E-01 1.5E-01 1.4E-01 1.2E-01 9.0E-02 6.1E-02 3.9E-02 1.0E-02
Cm-246 7.1E-01 6.6E-01 6.5E-01 6.2E-01 6.1E-01 6.0E-01 5.7E-01 5.5E-01 5.4E-01 5.3E-01
Cm-247 1.5E-02 1.4E-02 1.5E-02 1.5E-02 1.5E-02 1.5E-02 1.5E-02 1.5E-02 1.5E-02 1.5E-02
Cm-248 2.5E-03 2.3E-03 2.3E-03 2.2E-03 2.2E-03 2.2E-03 2.1E-03 2.0E-03 2.0E-03 2.0E-03
Total Cm 25.6 34.5 41.2 46.5 52.0 56.3 59.5 62.4 64.9 66.7
Total MA 15.5 -18.8 -51.6 -79.2 -105.2 -126.2 -142.2 -156.2 -168.9 -177.7
Total TRU -650.2 -669.8 -705.1 -721.0 -754.3 -772.9 -778.8 -789.2 -803.7 -808.1
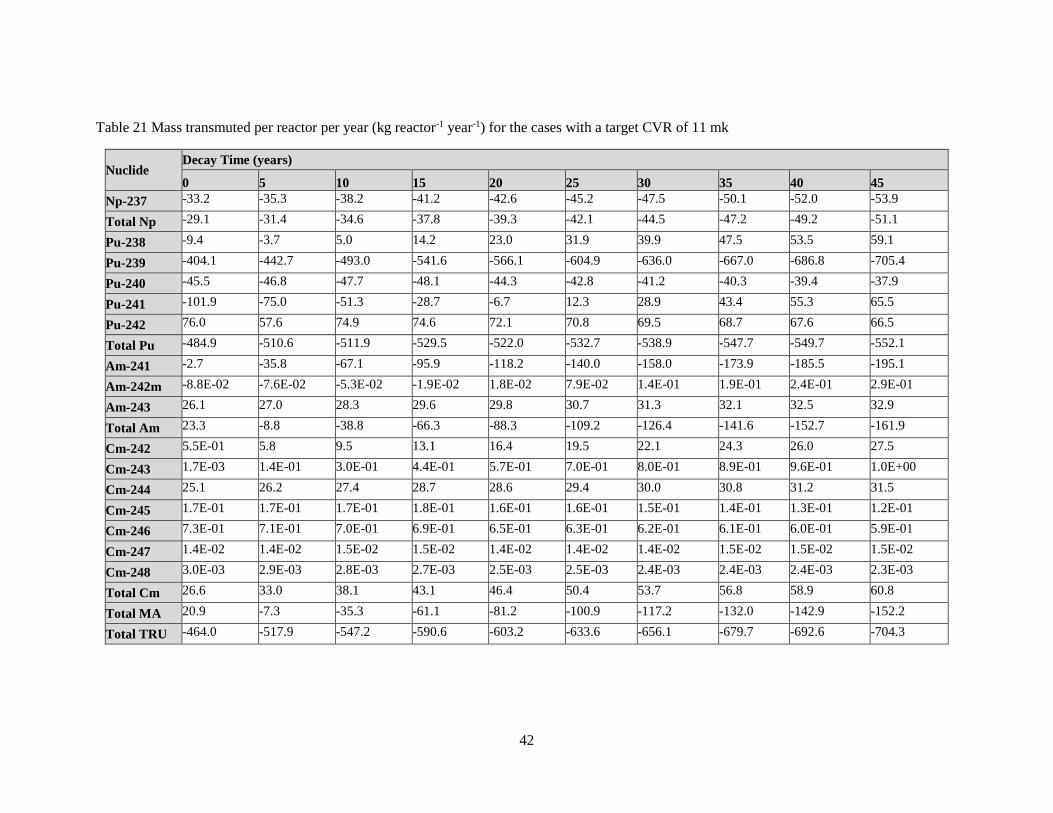
42
Table 21 Mass transmuted per reactor per year (kg reactor-1 year-1) for the cases with a target CVR of 11 mk
Nuclide Decay Time (years)
0 5 10 15 20 25 30 35 40 45
Np-237 -33.2 -35.3 -38.2 -41.2 -42.6 -45.2 -47.5 -50.1 -52.0 -53.9
Total Np -29.1 -31.4 -34.6 -37.8 -39.3 -42.1 -44.5 -47.2 -49.2 -51.1
Pu-238 -9.4 -3.7 5.0 14.2 23.0 31.9 39.9 47.5 53.5 59.1
Pu-239 -404.1 -442.7 -493.0 -541.6 -566.1 -604.9 -636.0 -667.0 -686.8 -705.4
Pu-240 -45.5 -46.8 -47.7 -48.1 -44.3 -42.8 -41.2 -40.3 -39.4 -37.9
Pu-241 -101.9 -75.0 -51.3 -28.7 -6.7 12.3 28.9 43.4 55.3 65.5
Pu-242 76.0 57.6 74.9 74.6 72.1 70.8 69.5 68.7 67.6 66.5
Total Pu -484.9 -510.6 -511.9 -529.5 -522.0 -532.7 -538.9 -547.7 -549.7 -552.1
Am-241 -2.7 -35.8 -67.1 -95.9 -118.2 -140.0 -158.0 -173.9 -185.5 -195.1
Am-242m -8.8E-02 -7.6E-02 -5.3E-02 -1.9E-02 1.8E-02 7.9E-02 1.4E-01 1.9E-01 2.4E-01 2.9E-01
Am-243 26.1 27.0 28.3 29.6 29.8 30.7 31.3 32.1 32.5 32.9
Total Am 23.3 -8.8 -38.8 -66.3 -88.3 -109.2 -126.4 -141.6 -152.7 -161.9
Cm-242 5.5E-01 5.8 9.5 13.1 16.4 19.5 22.1 24.3 26.0 27.5
Cm-243 1.7E-03 1.4E-01 3.0E-01 4.4E-01 5.7E-01 7.0E-01 8.0E-01 8.9E-01 9.6E-01 1.0E+00
Cm-244 25.1 26.2 27.4 28.7 28.6 29.4 30.0 30.8 31.2 31.5
Cm-245 1.7E-01 1.7E-01 1.7E-01 1.8E-01 1.6E-01 1.6E-01 1.5E-01 1.4E-01 1.3E-01 1.2E-01
Cm-246 7.3E-01 7.1E-01 7.0E-01 6.9E-01 6.5E-01 6.3E-01 6.2E-01 6.1E-01 6.0E-01 5.9E-01
Cm-247 1.4E-02 1.4E-02 1.5E-02 1.5E-02 1.4E-02 1.4E-02 1.4E-02 1.5E-02 1.5E-02 1.5E-02
Cm-248 3.0E-03 2.9E-03 2.8E-03 2.7E-03 2.5E-03 2.5E-03 2.4E-03 2.4E-03 2.4E-03 2.3E-03
Total Cm 26.6 33.0 38.1 43.1 46.4 50.4 53.7 56.8 58.9 60.8
Total MA 20.9 -7.3 -35.3 -61.1 -81.2 -100.9 -117.2 -132.0 -142.9 -152.2
Total TRU -464.0 -517.9 -547.2 -590.6 -603.2 -633.6 -656.1 -679.7 -692.6 -704.3

2.10 Results for Investigation of Cooling Time
2.10.1 Determination of Exit Burnup
A target exit burnup of 45 MWd kg-1 was chosen. The leakage was assumed to be equal to 30 mk, thus
the exit burnup was defined as the burnup at which the integrated k∞ was equal to 1.030. As it is difficult
to design cases in which a burnup step ends precisely at integrated- k∞ = 1.030, a linear interpolation was
taken using the two nearest burnup steps.
The volume fraction of TRU in the fuel was varied to maintain the same burnup for each case. The TRU
volume fraction was determined to the nearest tenth of a percent to give an exit burnup nearest to
45 MWd kg-1. Thus, there is some small variation in exit burnup between the cases, see Table 22.
Table 22 Amount of TRU in the fuel, exit burnup, and CVR for each decay time of the LWR fuel.
Decay Time
(years)
Amount of TRU
(vol%)
Exit Burnup
(MWd kg-1)
Coolant Void
Reactivity
(mk)
Irradiation Time
(days)
0 4.7 45092.0 1.7 910
5 5.1 44632.0 2.8 900
10 5.6 45063.8 3.9 908
15 6 44727.6 4.7 901
20 6.5 45317.3 5.5 913
25 6.9 45352.5 6.2 914
30 7.2 44973.4 6.6 906
35 7.5 44888.5 7.0 904
40 7.8 45074.1 7.3 908
45 8 44909.3 7.6 905
The irradiation time was also calculated using a linear interpolation between the nearest two burnup steps.
It is noted here that there is generally a large discrepancy in irradiation time between WIMS lattice cell
calculations and full-core calculations. These lattice cell calculations will be used for this analysis, as full-
core analyses are very time consuming and out of the scope of this project.
2.10.2 Common Centre Poison Pin
An initial study was performed to investigate the impact of cooling time prior to irradiation of the TRU in
the HWR reactor, in which the same composition, 50% dysprosia and 50% zirconia, was used for the
central poison pin. There was no attempt in these cases to achieve a target value for CVR. The
dependence of the volume fraction of TRU in the fuel with cooling time of the TRU is shown in Figure
15, and the initial masses of TRU in the fuel are given in Table 14. As the TRU decays, the fissile
component of the fuel decreases due to the decay of Pu-241 with a half-life of 14.4 years. To make up for
the loss of Pu-241 and the addition of Am-241, more TRU is required to maintain the same burnup.
As the cooling time of the TRU increases, so does the CVR, using a constant amount of poison in the
centre pin, see Table 22 and Figure 16. The reason for this has not been investigated, but may be due to a
hardening of the neutron spectrum due to the increase of Pu in the fuel. The contributing factors to CVR
are very complicated, and determining in detail the relationships would be a large and challenging scope
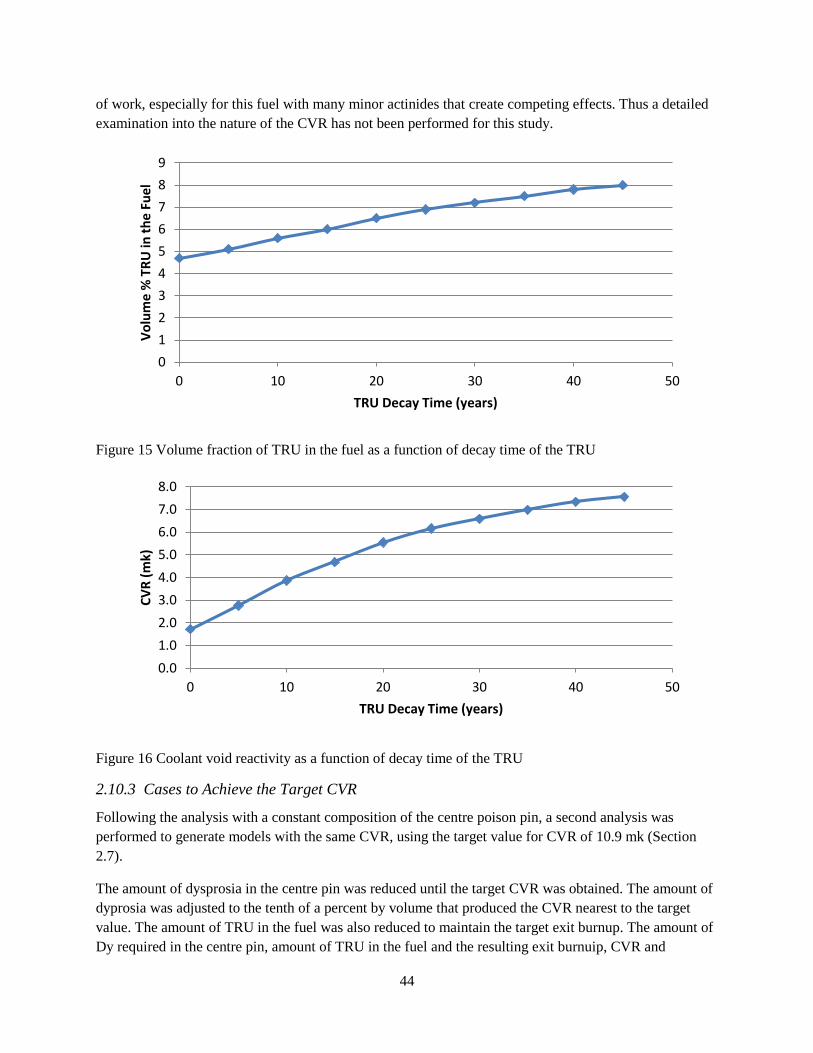
44
of work, especially for this fuel with many minor actinides that create competing effects. Thus a detailed
examination into the nature of the CVR has not been performed for this study.
Figure 15 Volume fraction of TRU in the fuel as a function of decay time of the TRU
Figure 16 Coolant void reactivity as a function of decay time of the TRU
2.10.3 Cases to Achieve the Target CVR
Following the analysis with a constant composition of the centre poison pin, a second analysis was
performed to generate models with the same CVR, using the target value for CVR of 10.9 mk (Section
2.7).
The amount of dysprosia in the centre pin was reduced until the target CVR was obtained. The amount of
dyprosia was adjusted to the tenth of a percent by volume that produced the CVR nearest to the target
value. The amount of TRU in the fuel was also reduced to maintain the target exit burnup. The amount of
Dy required in the centre pin, amount of TRU in the fuel and the resulting exit burnuip, CVR and
0
1
2
3
4
5
6
7
8
9
0 10 20 30 40 50
Vo
lum
e %
TR
U in
th
e Fu
el
TRU Decay Time (years)
0.0
1.0
2.0
3.0
4.0
5.0
6.0
7.0
8.0
0 10 20 30 40 50
CV
R (
mk)
TRU Decay Time (years)
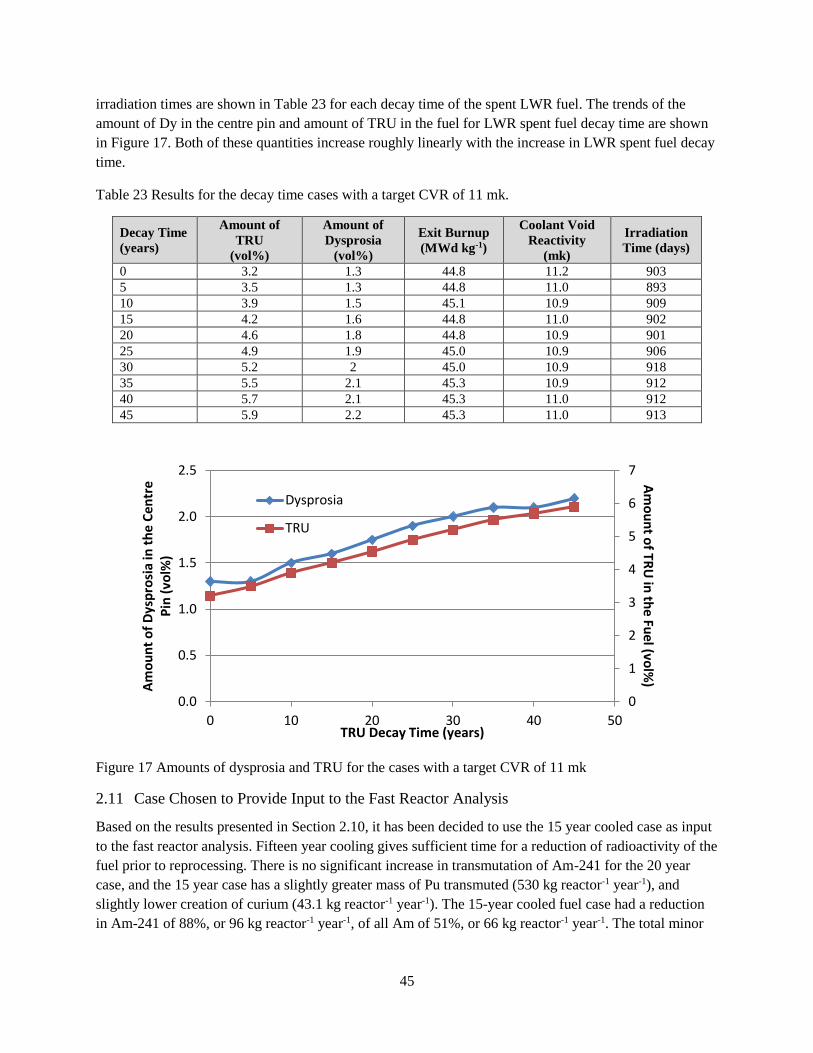
45
irradiation times are shown in Table 23 for each decay time of the spent LWR fuel. The trends of the
amount of Dy in the centre pin and amount of TRU in the fuel for LWR spent fuel decay time are shown
in Figure 17. Both of these quantities increase roughly linearly with the increase in LWR spent fuel decay
time.
Table 23 Results for the decay time cases with a target CVR of 11 mk.
Decay Time
(years)
Amount of
TRU
(vol%)
Amount of
Dysprosia
(vol%)
Exit Burnup
(MWd kg-1)
Coolant Void
Reactivity
(mk)
Irradiation
Time (days)
0 3.2 1.3 44.8 11.2 903
5 3.5 1.3 44.8 11.0 893
10 3.9 1.5 45.1 10.9 909
15 4.2 1.6 44.8 11.0 902
20 4.6 1.8 44.8 10.9 901
25 4.9 1.9 45.0 10.9 906
30 5.2 2 45.0 10.9 918
35 5.5 2.1 45.3 10.9 912
40 5.7 2.1 45.3 11.0 912
45 5.9 2.2 45.3 11.0 913
Figure 17 Amounts of dysprosia and TRU for the cases with a target CVR of 11 mk
2.11 Case Chosen to Provide Input to the Fast Reactor Analysis
Based on the results presented in Section 2.10, it has been decided to use the 15 year cooled case as input
to the fast reactor analysis. Fifteen year cooling gives sufficient time for a reduction of radioactivity of the
fuel prior to reprocessing. There is no significant increase in transmutation of Am-241 for the 20 year
case, and the 15 year case has a slightly greater mass of Pu transmuted (530 kg reactor-1 year-1), and
slightly lower creation of curium (43.1 kg reactor-1 year-1). The 15-year cooled fuel case had a reduction
in Am-241 of 88%, or 96 kg reactor-1 year-1, of all Am of 51%, or 66 kg reactor-1 year-1. The total minor
0
1
2
3
4
5
6
7
0.0
0.5
1.0
1.5
2.0
2.5
0 10 20 30 40 50
Am
ou
nt o
f TR
U in
the
Fue
l (vol%
)A
mo
un
t o
f D
ysp
rosi
a in
th
e C
en
tre
P
in (
vol%
)
TRU Decay Time (years)
Dysprosia
TRU

46
actinide reduction was 29%, or 61 kg reactor-1 year-1, and the total transuranic element reduction was
41%, which corresponds to 591 kg reactor-1 year-1.
The output fuel from the CANDU reactor was then decayed for an additional 5 years prior to its reuse as
fresh fuel in the fast reactor. This 5-year time accounts for cooling, reprocessing and fabrication.
2.11.1 Fuel Temperature Coefficient
The fuel temperature coefficient (see definition in Section 2.2) was calculated for the chosen case. The
method for calculating the FTC is similar to that for CVR. All lattice parameters (material composition,
flux profiles, etc.) to a temporary run-time file. After the burnup steps were complete, each of these files
was accessed in turn, and the calculations repeated with the fuel temperature increased by 50ºC (Thigh)for
each burnup step. A second set of calculations was then performed with the fuel temperature decreased by
50ºC (Tlow). A burnup-weighted average FTC was then calculated as:
𝐹𝑇𝐶 = (∫ 𝐹𝑇𝐶𝑇ℎ𝑖𝑔ℎ
(𝐵𝑈)𝑑𝐵𝑈
∫ 𝑑𝐵𝑈+
∫ 𝐹𝑇𝐶𝑇𝑙𝑜𝑤(𝐵𝑈)𝑑𝐵𝑈
∫ 𝑑𝐵𝑈) (𝑇ℎ𝑖𝑔ℎ − 𝑇𝑙𝑜𝑤)
using a simple numerical integration. Note the integral in the denominator is equal to the discharge
burnup.
The value for the FTC was -1.8 µk ºC-1. This is slightly more negative than the value for burnup-weighted
average FTC calculated for the NU reference case based on [45], of -1.7 µk ºC-1.
2.11.2 Comparison Calculation Using Serpent
An additional verification of the WIMS model was performed by reproducing the calculation using an
alternate code. The alternate code used was Serpent 1.18, a Monte Carlo reactor physics code, see Section
3.3. All geometry and material compositions were as used for the WIMS model. As the run times for
Monte Carlo codes are much longer than those for deterministic codes such as WIMS, the number of
timesteps was reduced to achieve a realistic run time of a few days. Nineteen timesteps were used, at 0
days, 10 days, 50 days, and then in increments of 50 days, with the last timestep being 55 days long, to
the total irradiation time of 905 days. The WIMS model was similarly revised to use the same timesteps
to provide a better comparison between the two models.
The Serpent model was run with 20000 neutrons/cycle, 500 cycles, and 10 inactive cycles.
The calculation of the neutron multiplication factor, k, using both codes is shown in Figure 18, and the
bias between the codes is shown in Figure 19. There is reasonable agreement between the two codes. At
the start of the irradiation there is a bias between the codes of about +10 mk, which increases to 11.8 mk
at 0.5 MWd kg-1, but then decreases. The bias between the codes becomes negative at approximately 19
MWd kg-1, and then becomes positive again at around 38 MWd kg-1. This maximum difference in k, 12
mk, corresponds to a percentage difference of less than 1%.
For the fuel cycle analysis calculations, the more important values are the fissile plutonium nuclides,
Pu-239 and Pu-241 because it is the mass of the sum of these nuclides that the fuel cycle scenario will use
to draw masses to build and fuel reactors. For these nuclides, the agreement between the two codes is
within the expected accuracy of the model to represent a final operating design

47
Figure 18 The neutron multiplication factor, k, as a function of burnup calculated by WIMS-AECL and
Serpent
Figure 19 The change in the neutron multiplication factor, k, between the WIMS-AECL and Serpent
calculations.
The final mass of transuranic nuclides in the fuel are given in Table 24 for the WIMS-AECL and Serpent
calculations. In general, the agreement is good, but there is a substantial discrepancy for americium
nuclides21. The reason for this discrepancy is not known now, but a difference in the nuclear data libraries
is suspected.
21 Discrepancy in the composition of americium nuclides has been found in other studies comparing WIMS-AECL
and Serpent calculations at Canadian Nuclear Laboratories, but those studies have not yet been published. G.
0.8
0.9
1.0
1.1
1.2
1.3
1.4
0 10 20 30 40 50
k
Burnup (MWd kg-1)
SERPENT
WIMS
-6
-4
-2
0
2
4
6
8
10
12
14
0 10 20 30 40 50
chan
ge in
k (
mk)
Burnup (MWd kg-1)
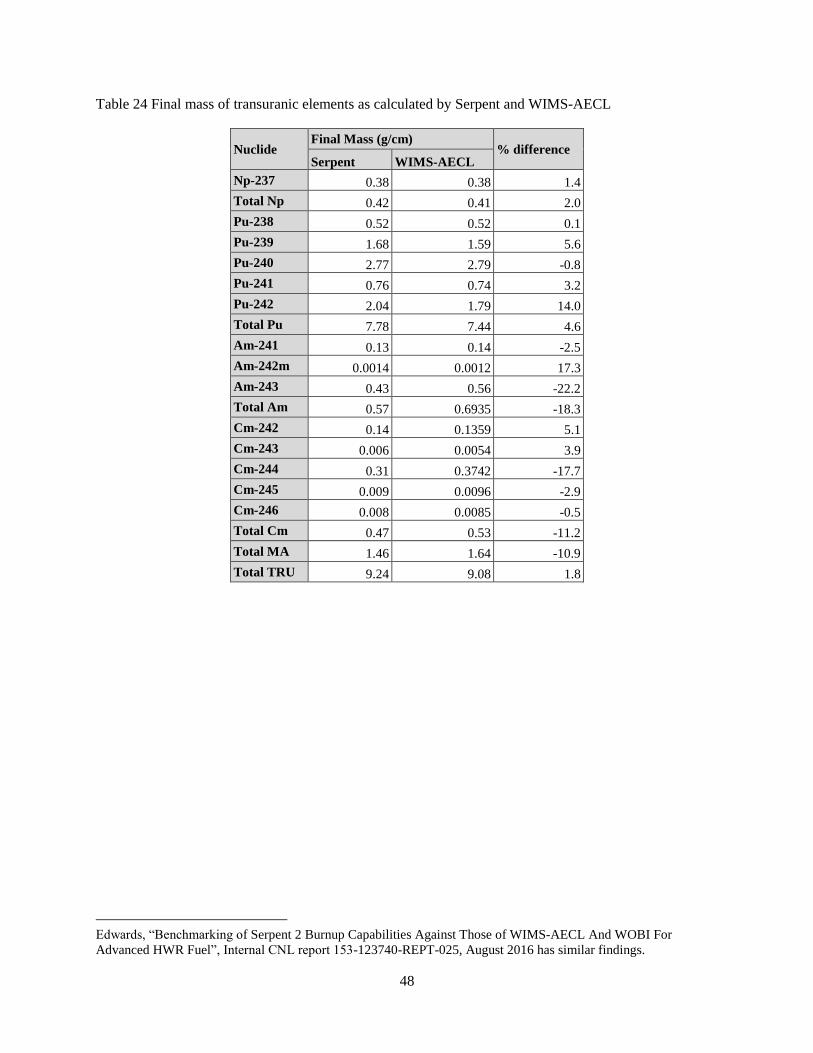
48
Table 24 Final mass of transuranic elements as calculated by Serpent and WIMS-AECL
Nuclide Final Mass (g/cm)
% difference Serpent WIMS-AECL
Np-237 0.38 0.38 1.4
Total Np 0.42 0.41 2.0
Pu-238 0.52 0.52 0.1
Pu-239 1.68 1.59 5.6
Pu-240 2.77 2.79 -0.8
Pu-241 0.76 0.74 3.2
Pu-242 2.04 1.79 14.0
Total Pu 7.78 7.44 4.6
Am-241 0.13 0.14 -2.5
Am-242m 0.0014 0.0012 17.3
Am-243 0.43 0.56 -22.2
Total Am 0.57 0.6935 -18.3
Cm-242 0.14 0.1359 5.1
Cm-243 0.006 0.0054 3.9
Cm-244 0.31 0.3742 -17.7
Cm-245 0.009 0.0096 -2.9
Cm-246 0.008 0.0085 -0.5
Total Cm 0.47 0.53 -11.2
Total MA 1.46 1.64 -10.9
Total TRU 9.24 9.08 1.8
Edwards, “Benchmarking of Serpent 2 Burnup Capabilities Against Those of WIMS-AECL And WOBI For
Advanced HWR Fuel”, Internal CNL report 153-123740-REPT-025, August 2016 has similar findings.

49
3 FAST REACTOR CALCULATIONS The purpose of this section of the thesis is to simulate a fast reactor to generate the parameters required
for the system studies. It is noted here that highly detailed, accurate and precise modeling is not required
for this purpose. The system studies will look at the impacts of employing various reactors with different
fuels 200 years from now. It is not realistic to expect that the exact reactor design, fuel composition, and
reactor operation be known for a reactor that would not be constructed until the far future if at all. Instead
what is done here is to generate a model that gives a reasonable amount of confidence that a fast reactor
operating with the given fuel is possible by calculating a small number of safety related parameters, and
simulating irradiation to generate a representative exit fuel composition.
This chapter will first discuss some general safety considerations for sodium-cooled fast reactors, then
describe the specific reactor design chosen for this study, the European Sodium-Cooled Fast Reactor
(ESFR). A brief description of the reactor physics code Serpent, which was used for this study is then
presented. The simulations were performed in three general steps:
1. Initial model construction and testing. Develop a model for the ESFR in Serpent, and compare
the results to the literature [35], to obtain confidence that the models are correct
2. LWR-Derived Fuel Simulations. Change the fuel composition of the ESFR model to be a mixture
of LWR-derived transuranic elements and depleted uranium, using the same LWR-derived
transuranic composition used for the HWR modelling in Section 2.5.1.
3. LWRCANDU Derived Fuel Simulations. Change the fuel composition of the ESFR model to be
a mixture of transuranic elements from the HWR spent fuel calculated in Section 2.
Three input fuel compositions have therefore been used for the fast reactor modelling work (Table 25):
1. The composition from [35], used to develop and test the original model
2. Takahama. The Takahama-3 PWR fuel composition, decayed for 15 years, Section 2.11, and
Table 11. This fuel composition will be referred to as Takahama.
3. LWRCANDU. Fuel derived from the HWR intermediate actinide burner reactor, Table 15. This
fuel will be referred to as LWRCANDU.
3.1 Sodium-Cooled Fast Reactors Safety Considerations
Under normal operation SFRs are not in their most reactive state. For example, a loss of sodium coolant
or a rearrangement of fuel locations could result in increased reactivity of the core. There are three
general types of events for a SFR:
1. unprotected loss of flow (ULOF), in which there is a loss of cooling of the core,
2. unprotected loss of heat sink (ULOHS), in which there is a loss of normal heat removal, and
3. unprotected transient overpower (UTOP), in which there is an addition of reactivity
An unprotected event is due to failure of multiple safety systems such that the reactor does not shut down.
There are several neutronic and physical effects in a SFR that determine what happens to the reactor in
the event of an unprotected event. The two main neutronic parameters are the reactivity insertion due to
the loss of sodium coolant, also called the Sodium Void Reactivity Effect (SVRE), and the Doppler
effect.

50
Table 25 The three input fuel plutonium and minor actinide isotopic compositions used for the fast reactor
simulations.
Nuclide LWR Spent fuel from
[35]
Takahama spent fuel
composition (15 year
cooled)
LWRCANDU spent
fuel composition (15 year
cooled)
Plutonium Composition (wt%)
Pu-238 3.57 2.82 7.47
Pu-239 47.39 56.29 8.49
Pu-240 29.66 25.21 21.45
Pu-241 8.23 7.98 38.09
Pu-242 10.37 7.70 7.74
Am-241 0.78
Minor Actinide Composition (wt%)
Np-237 16.86 35.86 1.55
Am-241 60.62 50.81 24.61
Am-242m 0.24 0.062 18.74
Am-243 15.7 10.23 0.08
Cm-242 0.02 0.001 35.57
Cm-243 0.07 0.032 0.004
Cm-244 5.14 2.64 0.32
Cm-245 1.26 0.32 19.55
Cm-246 0.09 0.040 0.59
Cm-247 0.001 0.53
Cm-248 0.011
The main cause of the SVRE is the elastic scattering cross-section peak of Na-23 at 3 keV. This has the
effect of softening the spectrum, into a region where there is more absorption by U-238. When the sodium
is voided, the spectrum hardens since this down scattering is lost, and there is less absorption in U-238.
This reduction in absorption by U-238 is the largest contributor to the increase in reactivity on voiding in
SFR. The moderating effect of the sodium is most important at the interior of the core, and less so at the
edges where there is more leakage. At the edge the hardening of the spectrum increases leakage, and there
is a negative contribution to the SVRE. Because of this, many SFR designs are of a “pancake” shape, that
is, have a large diameter but relatively are short in height. This shape increases the relative importance of
leakage to moderation by sodium, and results in a lower, or even negative, SVRE. However, increasing
the leakage of the core reduces other metrics such as fuel efficiency by requiring higher enrichment to
compensate for the loss of neutrons. A study of the causes of the sodium void effect [63] found
contributions to the void reactivity by isotope, Table 26.
Table 26 The contribution of various isotopes to the sodium void reactivity effect, normalized to the mass
of the isotope [63].
Isotope Change in reactivity per mass (mk tonne-1)
U-238 0.295
Pu-238 0.571
Pu-239 -0.490
Pu-240 1.001
Pu-241 -2.61
Pu-242 0.735
Am-241 1.894

51
The Doppler effect22, which results in a negative insertion or reactivity, counters some of the positive
reactivity of the SVRE. The Doppler coefficient leads to an increase in neutron absorption when the
temperature of the fuel increases. The Doppler effect of U-238 is negative, i.e. an increase in fuel
temperature leads to an increase in absorption in U-238.
Mechanical effects in an SFR event that affect the outcome of the accident include:
Fuel expansion coefficient: an increase in the temperature of the fuel causes it to expand. This is a
negative reactivity effect.
Core radial expansion: the sign of this coefficient is dependent on where the fuel moves. If fuel
moves in to the centre region of the core, a region of higher worth, then there will be a positive
insertion of reactivity. If the fuel assemblies move outward, essentially extending the size of the
core, then there will be a negative effect. The size and sign of this effect is dependent on
engineering and design of the core, and the restraint system for the fuel assemblies.
Control rod driveline expansion: an increase in temperature of the control rod drivelines will
cause relative motion between the control rods and the reactor core. The drivelines will expand,
causing the control rods to drop further in to the core, resulting in negative reactivity. The size of
this effect is largely dependent on the design of the reactor. For instance, it will be different for
loop-type and pool-type reactors due to the different supporting structures for both the core and
the control rod drivelines.
These mechanical effects will not be simulated in this study, only the eff, SVRE, and the Doppler
coefficient will be calculated. These three quantities, along with the reactivity evolution, will give a high-
level indication that the reactor performs satisfactorily relative to a benchmark case.
3.2 European Sodium Cooled Fast Reactor
The fast reactor simulated in this work is the 3600 MWth European Sodium Cooled Fast Reactor (ESFR)
[35]. The sodium cooled fast reactor is one of the six reactor types under development through the
Generation-IV International Forum (GIF). The ESFR is under development through a European
Collaborative Project (CP-ESFR). This reactor has also been used by the Nuclear Energy Agency’s
Expert Group on Advanced Fuel Cycle Scenarios for several studies of the transition to advanced fuel
cycles [34].
The core layout used here is the CONF-2 design [35], Figure 20 and Table 27, which is a modified core to
lower the SVRE. The core contains 453 fuel assemblies, 225 inner fuel assemblies in the inner 8 rows
and 228 outer fuel assemblies in the outer 4 rows of the core. Both inner and outer fuel assemblies have
the same geometry, and differ only in fuel composition. The control system contains two types of devices
in three rings. Nine Diverse Shutdown Devices (DSD) are in the second ring, and 24 Control and
Shutdown Devices (CDS) are in the first and third rings.
22 Cross sections depend on the relative energy of the incident and target species. The nuclei in the fuel are vibrating
with a given energy, and as the temperature increases the spectrum of energies of the fuel nuclei broadens. This
effectively broadens the cross section, as incident nuclei slightly above and slightly below the rest energy cross
section peak can interact with target nuclei vibrating above or below the average.

52
Figure 20 Radial cross-section of the CONF-2 ESFR core design
Table 27 ESFR Parameters [35], [34]
Parameter Value
Core
Thermal Power 3600 MWth
Irradiation Time 2050 days, in 5 cycles of 410 days
Number of fuel assemblies (Inner/Outer) 453 (225/228)
Number of Diverse Shutdown Devices 9
Diverse Shutdown Device composition 90 wt%B-10
Number of Control and Shutdown Devices 24
Control and Shutdown Device composition 19.9 wt%B-10
Fuel Assembly
Number of pins 271
Fuel pellet diameter 0.943 cm
Fuel assembly pitch 21.08 cm
Inner fuel assembly composition
MOX, 14.76 wt%Pu
Pu: 3.57/47.39/29.66/8.23/10.37/0.78 (Pu-238/Pu-
239/Pu-240/Pu-241/Pu-242/Am-241, wt%)
U: 0.25/99.75 (U-235/U-238, wt%)
Outer fuel assembly composition MOX, 17.15 wt%Pu
Isotopic compositions as per inner fuel assemblies
Active height 100 cm
Upper Gas Plenum 5 cm
Sodium plenum 60 cm
Upper Absorber 30 cm, B4C
Lower Axial Blanket 30 cm
Lower Gas Plenum 91.3 cm
Fertile Blanket 30 cm
Outer core (4 rows) Inner core (8 rows)
Reflector
Diverse Shutdown Device
Control and Shutdown Device

53
The fuel assemblies are hexagonal, with 271 fuel pins in each assembly, Figure 21. Axially, each fuel
assembly has a sodium plenum and a boron carbide absorber above the active core. A fertile blanket of
depleted uranium (0.25%wt U-235) and a lower gas plenum are below the active core, Figure 22.
Figure 21 Cross-section of a fuel assembly
Figure 22 Axial cross-section of the ESFR reactor core
In these models the whole core is loaded with fresh fuel. This is done to simplify the calculation. In
reality, the reactor would be operated in five 410 day cycles. As the fresh core in the simulation does not
correspond to a fresh core in operation (only one fifth of the core would be fresh fuel), pseudo-beginning
of cycle (pBOC) and pseudo-end of cycle (pEOC) states are used in the literature [35] to better
approximate the reactor at the beginning and end of an operating cycle. These approximations are also
adopted here.
Active core
SodiumPlenum
Fertile Blanket
Lower Gas Plenum
Absorber
54
The Serpent calculations were performed with 150,000 neutrons per cycle, 200 cycles, and 100 inactive
cycles, as in [35].
3.3 Serpent
The Serpent version 1.18 Monte Carlo reactor physics code [64] to [66] will be used to perform the
physics modelling of the sodium cooled fast reactor. Simulation of the fast reactor requires a three-
dimensional tool, as these reactors are heterogeneous both radially and axially. Serpent is a Monte Carlo
reactor physics code with three-dimensional modelling and burnup capabilities. A relatively new physics
tool, Serpent has taken advantage of advances in computing to enable accuracy of Monte Carlo methods
with acceptable run times. Monte Carlo enables the use of continuous energy nuclear data, instead of
having to arrange nuclear data in to energy groups, as well as complex energy and spatial variations, in
contrast to homogenization and other approximations required by the more traditional diffusion codes.
3.3.1 Serpent Data Libraries
The ESFR model on which this work is based used JEFF-3.1.1 (Joint Evaluated Fission and Fusion File)
cross section and fission yield libraries. A JEFF-3.1.1 cross section library is distributed with the Serpent
code. However, this library does not contain data at the high temperature, 2500 K, required to calculate
the Doppler coefficient. The highest temperature available in the JEFF library is 1800 K.
At Canadian Nuclear Laboratories, an ENDF/B-VII.0 library [67] has recently been created for use with
MCNP (Monte Carlo N-Particle). This ENDF library contains data at more temperatures, including
2500 K. This library was adapted for use with Serpent for this work, as follows:
Data from the ENDF/B-VII library at 2500K were added to the JEFF3.1.1 library
A new ENDF/B-VII library was created for use with Serpent.
A library conversion script (xsdirconvert.pl) that is distributed with Serpent was used to create the
ENDF/B-VII Serpent library. Where the nuclide naming conventions differ between what Serpent
requires and what CNL used in the MCNP library, these were modified by hand.
3.4 Tests of the Doppler Broadening Correction in Serpent
As the calculation of the Doppler coefficient for using the JEFF3.1.1 cross sections required either new
ENDF/B-VII data to be added to the library, or the use of the Doppler broadening correction, some tests
were performed to evaluate the accuracy of the Doppler broadening correction in Serpent. It is noted that
the JEFF3.1.1 and ENDF/B-VII library do not have the same temperature nodes. All tests were run using
the fuel composition in [35].
The following tests were run for fresh fuel, pseudo beginning of cycle (pBOC, 820 days) and pseudo end
of cycle (pEOC, 1230 days):
Using the JEFF3.1.1 library: use two temperature nodes in the library, 1200 K and 1800 K; then
using the 1200K node and Doppler broadened up to 1800K
Using the ENDF/B-VII library: use two temperature nodes in the library, 1999 K and 2500 K;
then using the 1999K node and Doppler broadened up to 2500 K
The results of these calculations are given in Table 28 below.

55
Table 28 Tests of the Doppler broadening correction using Serpent
k-effective Doppler Coefficient (pcm)
At High
Temperature
Node
Doppler
Broadening
% Difference
(% difference in
mk)
Using
Temperature
Nodes
Doppler
Broadening
% Difference
(% difference in
mk)
JEFF3.1.1
Fresh 1.02357 1.02349 -0.0078 (-0.34) -1010 -1029 1.9
pBOC 1.02231 1.02215 -0.0157 (-0.72) -875 -912 4.3
pEOC 1.02158 1.02161 0.0029 (0.14) -730 -723 -0.97
ENDF/B-VII
Fresh 1.01262 1.01259 -0.0030 (-0.24) -1059 -1073 1.2
pBOC 1.01605 1.01596 -0.0089 (-0.56) -745 -784 5.2
pEOC 1.01626 1.01633 0.0069 (0.43) -1013 -983 -3.0
The results show good agreement between using the Doppler broadening correction and calculating the
Doppler coefficient using the temperature nodes in the data libraries. It was decided to use the ENDF/B-
VII library and perform calculations at the temperature nodes in the library for all calculations after the
benchmark case.
3.5 Initial Model Construction and Testing
To test that the ESFR was modelled correctly, the fuel specifications were used from [35] and the results
compared for the following parameters: sodium void worth, Doppler coefficient, and eff at pseudo
beginning of cycle and at pseudo end of cycle, evolution of k-effective, and the mass of actinide elements
at discharge.
The full axial complexity of the ESFR was modeled, which deviates from [35], in which only the active
core and the fertile blanket were considered. The JEFF3.1.1 library that comes with Serpent does not
contain temperatures at 2500K needed to perform the Doppler calculation. Two library options were
analyzed:
ENDF/B-VII library, constructed at Chalk River for MCNP was converted for use with Serpent
The cross-section data from the ENDF/B-VII data at 2500 K were added to the Serpent JEFF3.1.1
library, referred to as JEFF-BH.
A third Doppler calculation was performed using the JEFF3.1.1 library. These calculations used the
highest temperature available in the JEFF3.1.1 library, 1800 K and the Doppler broadening function in
Serpent.
Nuclides in the blanket regions with less than 1 x 10⁻¹⁰ g cm-3 for the pBOC and pEOC CVR and Doppler
calculations with the ENDF/B-VII and JEFF-BH libraries were removed due to memory constraints. For
the ENDF/B-VII CVR pBOC and pEOC, JEFF-BH Doppler pBOC and pEOC calculations this threshold
was decreased to 1 x 10⁻⁹ g cm-3. All tests of the Doppler broadening function were done with a 1 x 10⁻⁹
g cm-3 threshold.

56
The JEFF3.1 decay and fission yield libraries were used with the JEFF3.1.1 cross-section libraries. The
ENDF/B-VII decay and fission yield libraries that come with Serpent were used with the ENDFB/VII
cross-section library.
Doppler coefficient (Kd) calculation:
𝐾𝑑 =𝜌(2500) − 𝜌(1500)
ln 2500 − ln 1500
The temperature was increased for both the blanket and the fuel to 2500K. For this case the Doppler
calculation was performed two ways, the first was to use the modified JEFF library with the ENDF/B-VII
data at the 2500K temperature. The second method was to use the Doppler broadening function.
SVRE calculation:
𝑆𝑉𝑅𝐸 = 𝜌(𝑣𝑜𝑖𝑑𝑒𝑑) − 𝜌(𝑐𝑜𝑜𝑙𝑒𝑑)
where (voided) and (cooled) are the reactivities of the voided and cooled cores, respectively. As per
[35] only the active core was voided.
The following calculation parameters were used:
200 active cycles and 100 inactive cycles with 150 000 neutron histories
Five burnup steps, in intervals of 410 days, for a total burn time of 2050 EFPD (effective full
power days).
The simulation results for k-effective as a function of irradiation time, eff, SVRE, the Doppler
coefficient, and discharge material compositions are provided in Figure 23, Table 29, and Table 30.
Figure 23 k-effective as a function of irradiation time for the benchmark case using the JEFF3.1.1 and the
ENDF/B-VII libraries.
1.000
1.005
1.010
1.015
1.020
1.025
1.030
0 500 1000 1500 2000
k-e
ffe
ctiv
e
Time (days)
JEFF3.1.1
ENDF/B-VII
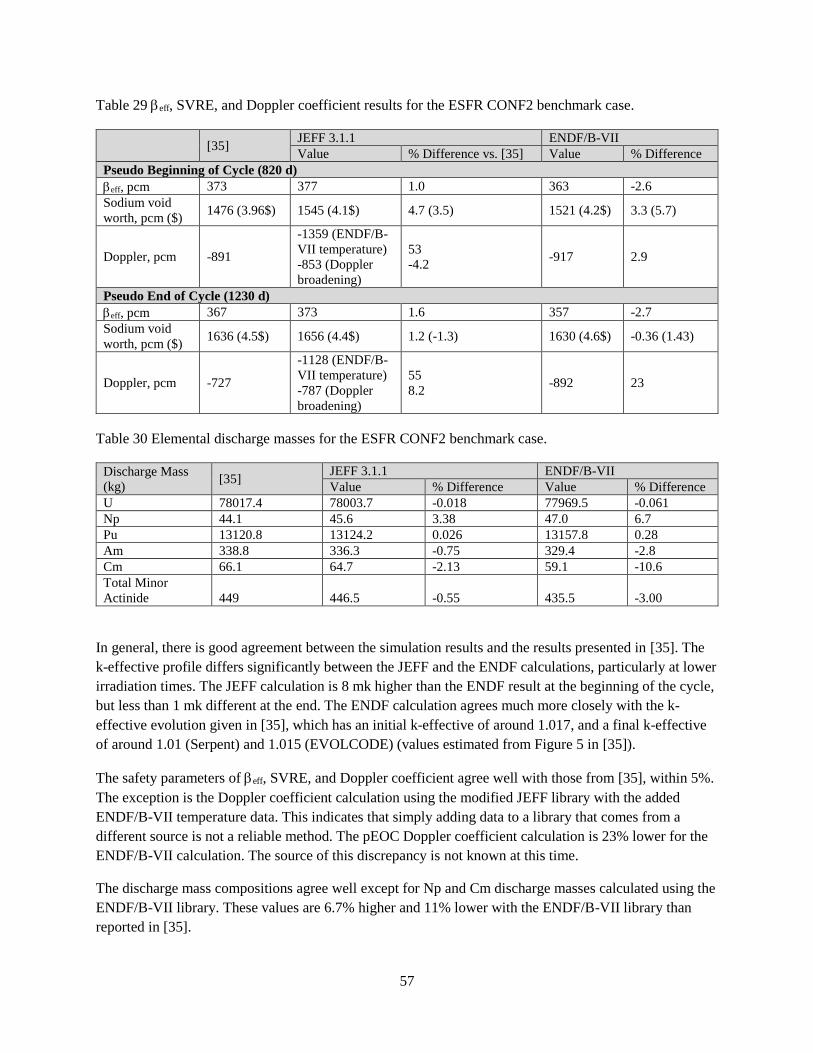
57
Table 29 eff, SVRE, and Doppler coefficient results for the ESFR CONF2 benchmark case.
[35] JEFF 3.1.1 ENDF/B-VII
Value % Difference vs. [35] Value % Difference
Pseudo Beginning of Cycle (820 d)
eff, pcm 373 377 1.0 363 -2.6
Sodium void
worth, pcm ($) 1476 (3.96$) 1545 (4.1$) 4.7 (3.5) 1521 (4.2$) 3.3 (5.7)
Doppler, pcm -891
-1359 (ENDF/B-
VII temperature)
-853 (Doppler
broadening)
53
-4.2 -917 2.9
Pseudo End of Cycle (1230 d)
eff, pcm 367 373 1.6 357 -2.7
Sodium void
worth, pcm ($) 1636 (4.5$) 1656 (4.4$) 1.2 (-1.3) 1630 (4.6$) -0.36 (1.43)
Doppler, pcm -727
-1128 (ENDF/B-
VII temperature)
-787 (Doppler
broadening)
55
8.2 -892 23
Table 30 Elemental discharge masses for the ESFR CONF2 benchmark case.
Discharge Mass
(kg) [35]
JEFF 3.1.1 ENDF/B-VII
Value % Difference Value % Difference
U 78017.4 78003.7 -0.018 77969.5 -0.061
Np 44.1 45.6 3.38 47.0 6.7
Pu 13120.8 13124.2 0.026 13157.8 0.28
Am 338.8 336.3 -0.75 329.4 -2.8
Cm 66.1 64.7 -2.13 59.1 -10.6
Total Minor
Actinide 449 446.5 -0.55 435.5 -3.00
In general, there is good agreement between the simulation results and the results presented in [35]. The
k-effective profile differs significantly between the JEFF and the ENDF calculations, particularly at lower
irradiation times. The JEFF calculation is 8 mk higher than the ENDF result at the beginning of the cycle,
but less than 1 mk different at the end. The ENDF calculation agrees much more closely with the k-
effective evolution given in [35], which has an initial k-effective of around 1.017, and a final k-effective
of around 1.01 (Serpent) and 1.015 (EVOLCODE) (values estimated from Figure 5 in [35]).
The safety parameters of eff, SVRE, and Doppler coefficient agree well with those from [35], within 5%.
The exception is the Doppler coefficient calculation using the modified JEFF library with the added
ENDF/B-VII temperature data. This indicates that simply adding data to a library that comes from a
different source is not a reliable method. The pEOC Doppler coefficient calculation is 23% lower for the
ENDF/B-VII calculation. The source of this discrepancy is not known at this time.
The discharge mass compositions agree well except for Np and Cm discharge masses calculated using the
ENDF/B-VII library. These values are 6.7% higher and 11% lower with the ENDF/B-VII library than
reported in [35].
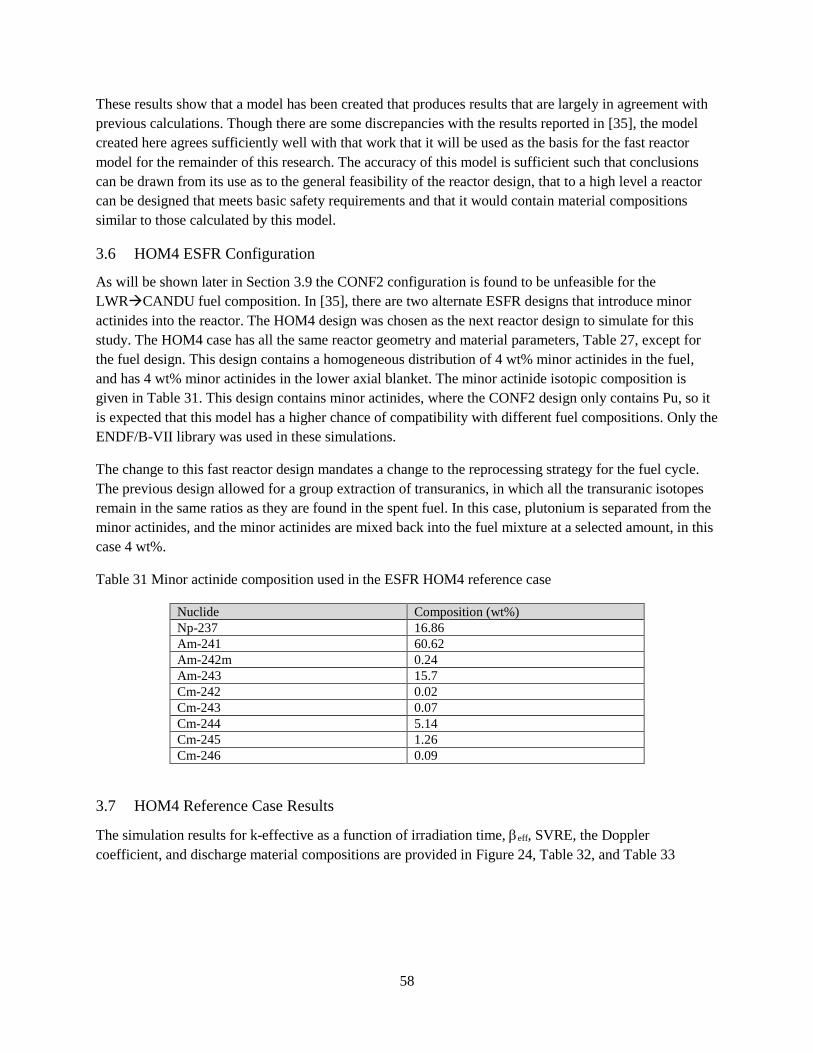
58
These results show that a model has been created that produces results that are largely in agreement with
previous calculations. Though there are some discrepancies with the results reported in [35], the model
created here agrees sufficiently well with that work that it will be used as the basis for the fast reactor
model for the remainder of this research. The accuracy of this model is sufficient such that conclusions
can be drawn from its use as to the general feasibility of the reactor design, that to a high level a reactor
can be designed that meets basic safety requirements and that it would contain material compositions
similar to those calculated by this model.
3.6 HOM4 ESFR Configuration
As will be shown later in Section 3.9 the CONF2 configuration is found to be unfeasible for the
LWRCANDU fuel composition. In [35], there are two alternate ESFR designs that introduce minor
actinides into the reactor. The HOM4 design was chosen as the next reactor design to simulate for this
study. The HOM4 case has all the same reactor geometry and material parameters, Table 27, except for
the fuel design. This design contains a homogeneous distribution of 4 wt% minor actinides in the fuel,
and has 4 wt% minor actinides in the lower axial blanket. The minor actinide isotopic composition is
given in Table 31. This design contains minor actinides, where the CONF2 design only contains Pu, so it
is expected that this model has a higher chance of compatibility with different fuel compositions. Only the
ENDF/B-VII library was used in these simulations.
The change to this fast reactor design mandates a change to the reprocessing strategy for the fuel cycle.
The previous design allowed for a group extraction of transuranics, in which all the transuranic isotopes
remain in the same ratios as they are found in the spent fuel. In this case, plutonium is separated from the
minor actinides, and the minor actinides are mixed back into the fuel mixture at a selected amount, in this
case 4 wt%.
Table 31 Minor actinide composition used in the ESFR HOM4 reference case
Nuclide Composition (wt%)
Np-237 16.86
Am-241 60.62
Am-242m 0.24
Am-243 15.7
Cm-242 0.02
Cm-243 0.07
Cm-244 5.14
Cm-245 1.26
Cm-246 0.09
3.7 HOM4 Reference Case Results
The simulation results for k-effective as a function of irradiation time, eff, SVRE, the Doppler
coefficient, and discharge material compositions are provided in Figure 24, Table 32, and Table 33

59
Figure 24 Evolution of k-effective for the HOM4 reference case.
Table 32 eff, SVRE, and Doppler coefficient results for the ESFR HOM4 benchmark case
[35] Value % Difference
Pseudo Beginning of Cycle (820 d)
eff, pcm 350 342 -2.2
Sodium void
worth, pcm ($) 1714 (4.9$) 1881 (5.5$) 9.7 (12.2)
Doppler, pcm -562 -492 12.3
Pseudo End of Cycle (1230 d)
eff, pcm 345 334 -3.2
Sodium void
worth, pcm ($) 1778 (5.2$) 1886 (5.6$) 6.1
Doppler, pcm -570 -599 -5.2
Table 33 Elemental discharge masses for the ESFR HOM4 benchmark case.
Discharge Mass (kg) [35] Value % Difference
U 72632.4 72685.8 0.07
Np 406.0 405.1 -0.21
Pu 13417.4 13407.5 -0.07
Am 1900.4 1910.8 0.55
Cm 472.0 469.5 -0.52
Total Minor Actinide 2778.4 2785.5 0.26
These results agree with those presented in [35], with some discrepancy in the Doppler coefficient. This
level of disagreement is not unexpected given the differences in the model development and libraries. The
calculation of the elemental discharge masses shows very close agreement, all within 1%. This result
gives confidence to use this HOM4 reference model as the basis for further calculations.
1.000
1.005
1.010
1.015
1.020
1.025
1.030
1.035
1.040
1.045
0 500 1000 1500 2000
k-e
ffe
ctiv
e
Time (days)
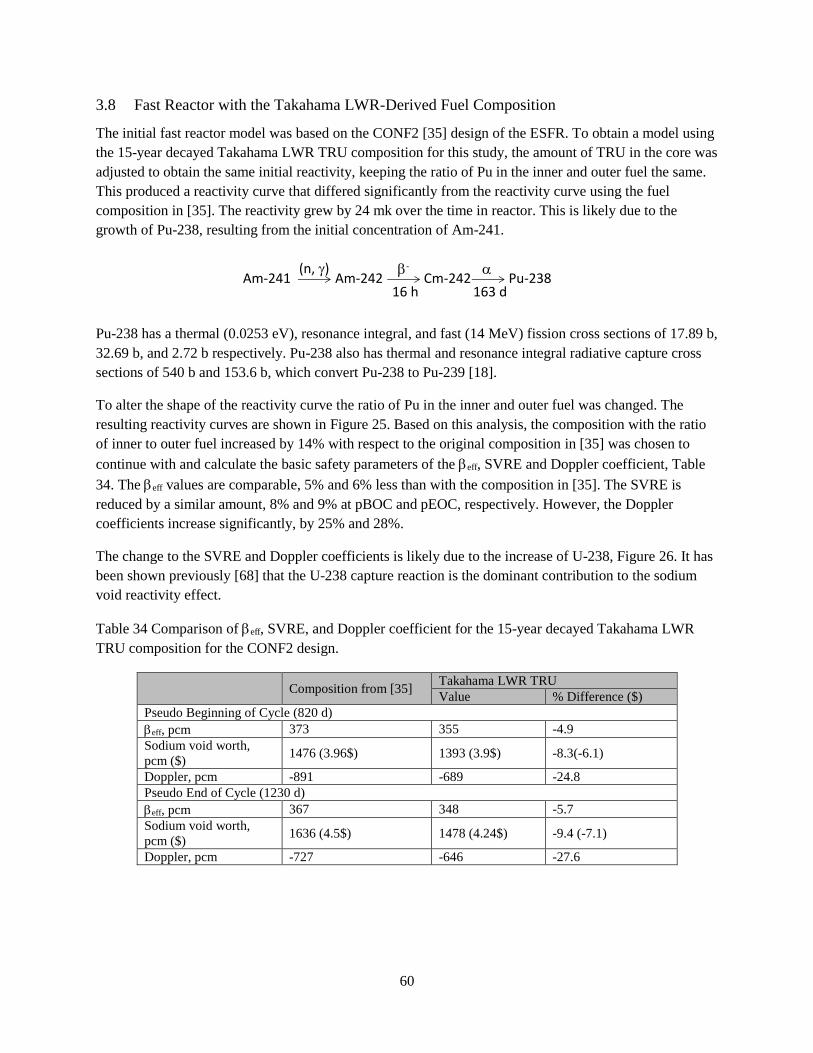
60
3.8 Fast Reactor with the Takahama LWR-Derived Fuel Composition
The initial fast reactor model was based on the CONF2 [35] design of the ESFR. To obtain a model using
the 15-year decayed Takahama LWR TRU composition for this study, the amount of TRU in the core was
adjusted to obtain the same initial reactivity, keeping the ratio of Pu in the inner and outer fuel the same.
This produced a reactivity curve that differed significantly from the reactivity curve using the fuel
composition in [35]. The reactivity grew by 24 mk over the time in reactor. This is likely due to the
growth of Pu-238, resulting from the initial concentration of Am-241.
Pu-238 has a thermal (0.0253 eV), resonance integral, and fast (14 MeV) fission cross sections of 17.89 b,
32.69 b, and 2.72 b respectively. Pu-238 also has thermal and resonance integral radiative capture cross
sections of 540 b and 153.6 b, which convert Pu-238 to Pu-239 [18].
To alter the shape of the reactivity curve the ratio of Pu in the inner and outer fuel was changed. The
resulting reactivity curves are shown in Figure 25. Based on this analysis, the composition with the ratio
of inner to outer fuel increased by 14% with respect to the original composition in [35] was chosen to
continue with and calculate the basic safety parameters of the eff, SVRE and Doppler coefficient, Table
34. The eff values are comparable, 5% and 6% less than with the composition in [35]. The SVRE is
reduced by a similar amount, 8% and 9% at pBOC and pEOC, respectively. However, the Doppler
coefficients increase significantly, by 25% and 28%.
The change to the SVRE and Doppler coefficients is likely due to the increase of U-238, Figure 26. It has
been shown previously [68] that the U-238 capture reaction is the dominant contribution to the sodium
void reactivity effect.
Table 34 Comparison of eff, SVRE, and Doppler coefficient for the 15-year decayed Takahama LWR
TRU composition for the CONF2 design.
Composition from [35] Takahama LWR TRU
Value % Difference ($)
Pseudo Beginning of Cycle (820 d)
eff, pcm 373 355 -4.9
Sodium void worth,
pcm ($) 1476 (3.96$) 1393 (3.9$) -8.3(-6.1)
Doppler, pcm -891 -689 -24.8
Pseudo End of Cycle (1230 d)
eff, pcm 367 348 -5.7
Sodium void worth,
pcm ($) 1636 (4.5$) 1478 (4.24$) -9.4 (-7.1)
Doppler, pcm -727 -646 -27.6
Am-241 Am-242 Cm-242 Pu-238(n, ) -
16 h 163 d

61
Figure 25 Reactivity curves for 15-year decayed LWR TRU, altering the ratio of Pu in the inner and outer
fuel. A positive number refers to a higher amount of Pu in the inner fuel.
Figure 26 Amount of U-238 in the fuel as a function of time in the reactor
1.000
1.005
1.010
1.015
1.020
1.025
1.030
1.035
1.040
1.045
1.050
0 500 1000 1500 2000
k-e
ffe
ctiv
e
Time (days)
Composition from [31]
Takahama LWR TRU
Takahama LWR TRU, -10%
Takahama LWR TRU +10%
Takahama LWR TRU, -14%
Takahama LWR TRU, -12%
0
10
20
30
40
50
60
70
80
90
100
0 500 1000 1500 2000 2500
Mas
s, t
on
s
Time, d
Composition from [31]
Takahama LWR TRU, -14%
62
3.9 LWRCANDU TRU, ESFR CONF2 Design
The analysis of the LWRCANDU spent TRU was performed in the same manner as the Takahama
LWR spent TRU. Similar to the Takahama LWR TRU case, the reactivity curve for the LWRCANDU
TRU deviated significantly from that for the fuel composition from [35], but in this case the deviation was
greater. The ratio of Pu in the inner and outer fuel was altered to try to reduce the increase in reactivity,
Figure 27. In this case, it was not possible to lower the reactivity sufficiently to produce a reactivity
progression that resembled that of the original composition from [35]. At this point this approach was
abandoned and an alternate ESFR design was employed.
3.10 Fast Reactor with HOM4 Design
In the fuel cycle systems, the fuel in the fast reactor is recycled back into that reactor. These fuel
compositions are required for the system scenario analyses. Physics simulations for three fuel passes
through the fast reactor were performed. For each case the sodium void reactivity worth, Doppler
coefficient, and eff at pseudo beginning of cycle and at pseudo end of cycle, evolution of k-effective, and
the transmutation performance were calculated. The fuel was decayed for five years in between the passes
to account for a decay period, reprocessing time, and fuel fabrication. The five-year decay period was
performed using the ORIGEN code that is part of the SCALE code suite23 [55].
3.10.1 ESFR Results Fuelled with Takahama LWR Spent TRU for the HOM4 Design
The evolution of k-effective is shown in Figure 28. It is important to note that this is a k-effective curve
for a simulation for the irradiation of an entire reactor filled with fresh fuel. If this reactor were
constructed, it would be batch-fuelled in five batches, so that only 1/5 of the core consists of fresh fuel at
any time. Therefore, the actual reactivity curve will be some combination of the reactivities at the times
on this curve. The actual curve is expected to be much flatter.
For the second pass, there was a greater increase in k-effective like that observed in the CONF2 design,
Section 3.8. The same approach was taken here as in that case, and the ratio of Pu in the inner to outer
fuel assemblies was reduced by 10%. The resulting k-effective evolution is shown in Figure 29. This
produced a less reactive curve, and this fuel composition was used for subsequent calculations. This
plutonium ratio was also used in the third pass.
The safety parameters eff, SVRE, and the Doppler coefficient are given in Table 35 for the three passes
through the ESFR. In general, the results are similar to the HOM4 results in [35], within 10%. The
Doppler coefficient at pEOC deviates more, a 13% reduction from the value in [35]. However, this
coefficient decreases (-644 pcm vs. -570 pcm), so this is in the direction of lower reactivity in the event of
an incident. It is not expected that these results agree exactly, as a different fuel composition is used here,
and this composition changes during each pass through the reactor.
23 These ORIGEN calculations were performed by D. Geoff Edwards, reactor physicist at Canadian Nuclear
Laboratories
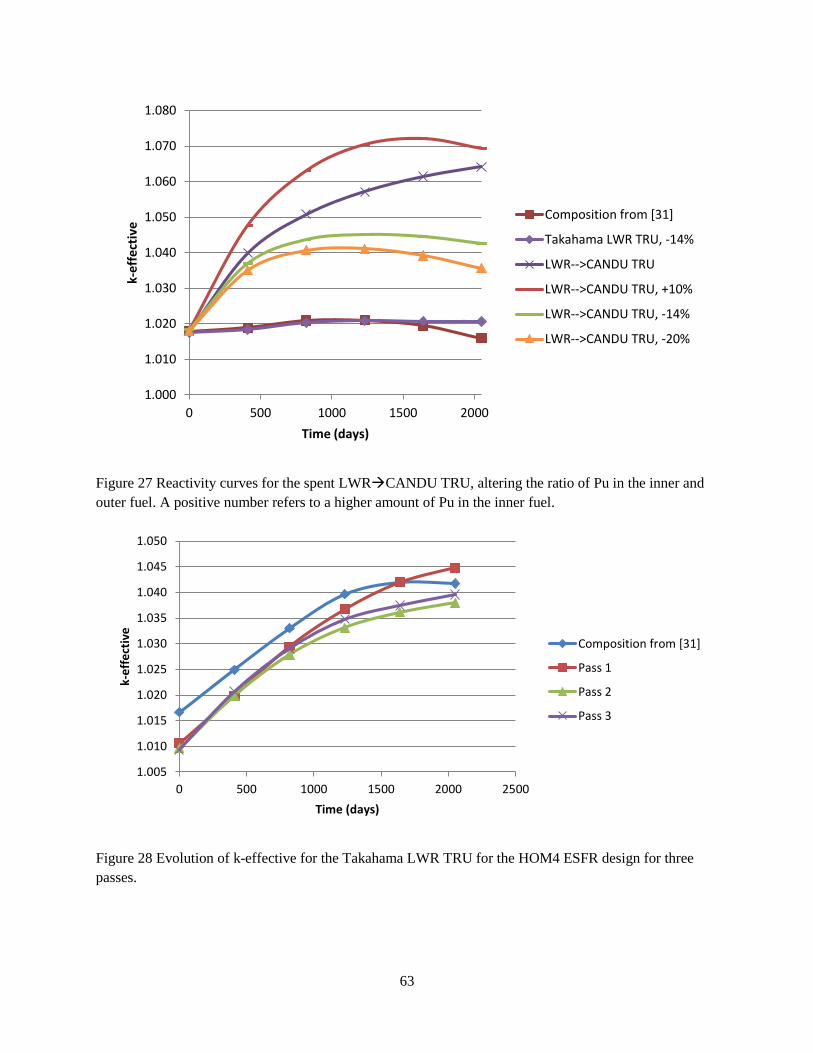
63
Figure 27 Reactivity curves for the spent LWRCANDU TRU, altering the ratio of Pu in the inner and
outer fuel. A positive number refers to a higher amount of Pu in the inner fuel.
Figure 28 Evolution of k-effective for the Takahama LWR TRU for the HOM4 ESFR design for three
passes.
1.000
1.010
1.020
1.030
1.040
1.050
1.060
1.070
1.080
0 500 1000 1500 2000
k-e
ffe
ctiv
e
Time (days)
Composition from [31]
Takahama LWR TRU, -14%
LWR-->CANDU TRU
LWR-->CANDU TRU, +10%
LWR-->CANDU TRU, -14%
LWR-->CANDU TRU, -20%
1.005
1.010
1.015
1.020
1.025
1.030
1.035
1.040
1.045
1.050
0 500 1000 1500 2000 2500
k-e
ffe
ctiv
e
Time (days)
Composition from [31]
Pass 1
Pass 2
Pass 3

64
Figure 29 k-effective evolution for the second pass using Takahama LWR-derived fuel.
Table 35 Comparison of eff, SVRE, and Doppler coefficient for the Takahama LWR TRU composition
for the HOM4 design.
Composition
from [35]
Takahama LWR TRU
Pass 1 Pass 2 Pass 3
Value % Difference Value % Difference Value % Difference
Pseudo Beginning of Cycle (820 d)
eff, pcm 350 347 -1.0 331 -5.4 326 -6.9
Sodium void
worth, pcm ($)
1714
(4.9$)
1634
(4.7$)
-4.7
(-3.8)
1550
(4.7$)
-9.5
(-4.1)
1584
(4.9$)
-7.5
(-0.8)
Doppler, pcm -562 -586 4.2 -559 -0.5 -532 -5.3
Pseudo End of Cycle (1230 d)
eff, pcm 345 340 -1.4 328 -4.9 327 -5.3
Sodium void
worth, pcm ($)
1778
(5.2$)
1669
(4.9$)
-6.1
(-5.7)
1587
(4.9$)
-10.7
(-6.9)
1583
(4.8$)
-10.9
(-6.8)
Doppler, pcm -570 -592 3.9 -559 -1.9 -644 13
At pBOC the sodium void effect decreases for the second pass through, before rising for the third pass,
but is still a 3% reduction compared to the first pass. The sodium void reactivity effect at pEOC decreases
for each pass, a total 5% reduction. eff decreases with each pass through the reactor, a 6% decrease
between the first and third passes. The decrease of eff indicates that the kinetics of the reactor will be
faster in successive passes. Since the reactivity coefficients also generally decrease, such that the dollar
values of the reactivity coefficients remain similar or even lower, and the reduction is modest (6% at
pBOC, 4% at pEOC), this does not indicate a safety concern at this point. More detailed design and
analysis is required to determine the impacts, but the reactor design can likely support, or be adjusted to
support, this range.
Flux profiles of the core in normal operating conditions and for coolant voiding are given in Figure 30.
There is no scale provided for the flux profile pictures generated in Serpent, so these provide a qualitative
1.005
1.010
1.015
1.020
1.025
1.030
1.035
1.040
1.045
1.050
1.055
1.060
0 500 1000 1500 2000 2500
k-e
ffe
ctiv
e
Time (days)
Composition from [31]
Takahama LWR TRU
TakahamaLWR TRU, -10%
65
indication only. Flux profiles for normal operating temperature (1500K) and for an increased temperature
(2500 K) used to calculate the Doppler coefficients are shown in Figure 31. The flux profiles in these two
figures show an increase in flux at the periphery of the core in passes 2 and 3 compared with the reference
HOM4 case.
Given the significant change in flux profile, the power distribution was also investigated. The peak
powers and the relative power for representative inner and outer fuel locations are given in Table 36.
These locations are shown schematically in Figure 32. As similar results will be shown for the
LWRCANDU ESFR cases, these results will be discussed together in Section 3.12.
The input and output fuel compositions, which are required input for the fuel cycle scenario calculations,
are given in Table 37 and Table 38.

66
Figure 30 Flux map of cooled and voided ESFR cores for the Takahama LWR-derived fuel case and for
the HOM4 reference case (no colour scale available in Serpent).

67
Figure 31 Flux map of normal and high temperature ESFR cores for the Takahama LWR-derived fuel
case and for the HOM4 reference case (no colour scale available in Serpent).

68
Table 36 Peak powers and relative powers for inner and outer reference channels for the Takahama LWR-
derived fuel ESFR cases.
Case
Peak Power Reference Channel
Location
(x y)
Peak
Power
(relative)
% change
vs.
Reference
Case
Relative Power
% Change vs.
Reference Case
Inner Outer Inner Outer
Reference Case
pBOC 10 20 1.25 1.06 1.23
pEOC 18 25 1.27 1.25 1.16
LWR 1st Pass
pBOC 28 10 1.47 18.2 0.76 1.28 -27.7 3.9
pEOC 27 10 1.33 4.5 0.97 1.17 -22.5 1.0
LWR 2nd Pass
pBOC 10 28 1.77 42.0 0.29 1.60 -72.8 30.2
pEOC 28 19 1.70 34.0 0.35 1.58 -72.1 36.0
LWR 3rd pass
pBOC 28 19 1.71 37.3 0.29 1.68 -72.1 36.5
pEOC 28 19 1.60 25.6 0.38 1.55 -69.5 33.4
Figure 32 The locations of the peak powers and the representative channels for the Takahama LWR-
derived fuel ESFR cases.
Outer core (4 rows) Inner core (8 rows)
Representative channelOther colours are indicated in the table above
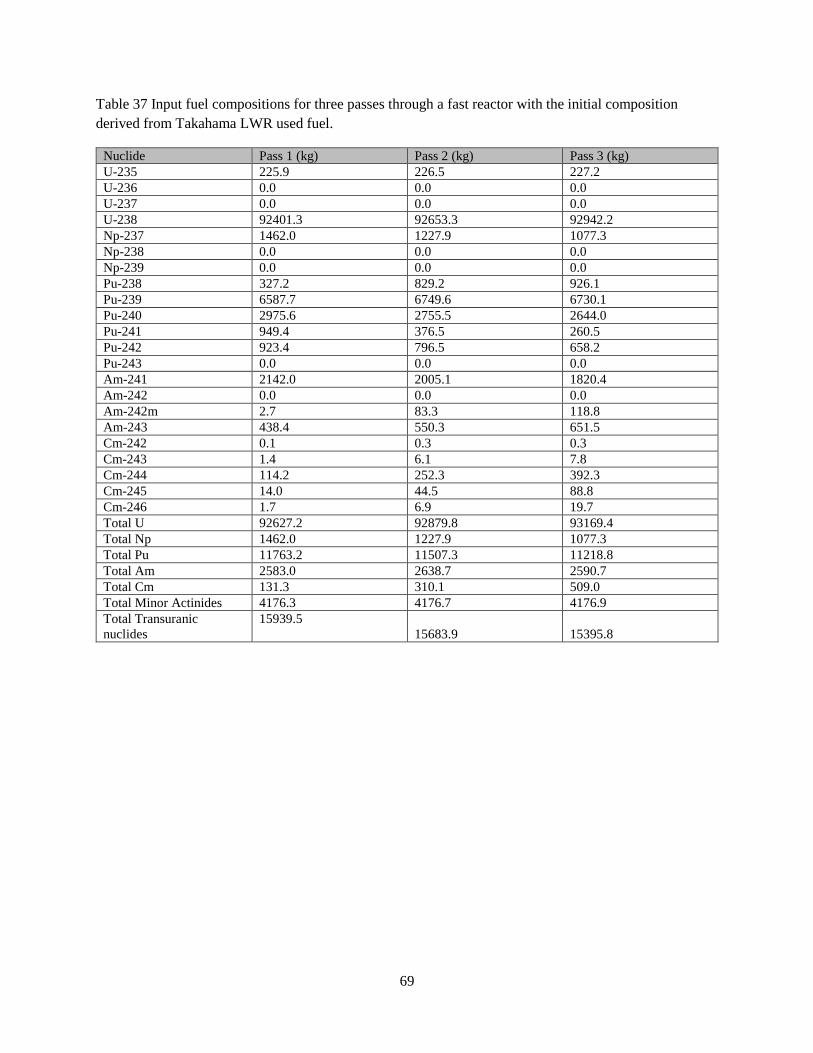
69
Table 37 Input fuel compositions for three passes through a fast reactor with the initial composition
derived from Takahama LWR used fuel.
Nuclide Pass 1 (kg) Pass 2 (kg) Pass 3 (kg)
U-235 225.9 226.5 227.2
U-236 0.0 0.0 0.0
U-237 0.0 0.0 0.0
U-238 92401.3 92653.3 92942.2
Np-237 1462.0 1227.9 1077.3
Np-238 0.0 0.0 0.0
Np-239 0.0 0.0 0.0
Pu-238 327.2 829.2 926.1
Pu-239 6587.7 6749.6 6730.1
Pu-240 2975.6 2755.5 2644.0
Pu-241 949.4 376.5 260.5
Pu-242 923.4 796.5 658.2
Pu-243 0.0 0.0 0.0
Am-241 2142.0 2005.1 1820.4
Am-242 0.0 0.0 0.0
Am-242m 2.7 83.3 118.8
Am-243 438.4 550.3 651.5
Cm-242 0.1 0.3 0.3
Cm-243 1.4 6.1 7.8
Cm-244 114.2 252.3 392.3
Cm-245 14.0 44.5 88.8
Cm-246 1.7 6.9 19.7
Total U 92627.2 92879.8 93169.4
Total Np 1462.0 1227.9 1077.3
Total Pu 11763.2 11507.3 11218.8
Total Am 2583.0 2638.7 2590.7
Total Cm 131.3 310.1 509.0
Total Minor Actinides 4176.3 4176.7 4176.9
Total Transuranic
nuclides
15939.5
15683.9 15395.8

70
Table 38 Exit fuel compositions for three passes through a fast reactor with the initial composition
derived from Takahama LWR used fuel.
Nuclide Pass 1 (kg) Pass 2 (kg) Pass 3 (kg)
U-235 115.5 118.2 117.9
U-236 25.4 25.1 25.4
U-237 0.2 0.2 0.2
U-238 83999.4 84293.8 84499.0
Np-237 871.1 743.3 653.8
Np-238 0.6 0.5 0.5
Np-239 11.3 11.4 11.5
Pu-238 991.2 1129.0 1105.5
Pu-239 8150.8 8189.6 8225.0
Pu-240 3272.5 3142.9 3092.2
Pu-241 570.4 397.5 359.3
Pu-242 938.7 781.9 655.4
Pu-243 0.0 0.0 0.0
Am-241 1276.5 1153.9 1036.4
Am-242 0.3 0.3 0.2
Am-242m 58.8 81.6 89.2
Am-243 376.2 433.1 479.4
Cm-242 59.1 53.5 48.5
Cm-243 4.7 5.9 6.1
Cm-244 207.4 313.2 417.8
Cm-245 29.9 58.1 91.7
Cm-246 4.6 12.8 28.2
Total U 84140.5 84437.4 84642.5
Total Np 883.0 755.2 665.7
Total Pu 13923.6 13640.8 13437.3
Total Am 1711.8 1668.9 1605.3
Total Cm 305.7 443.5 592.3
Total Minor Actinides 2900.5 2867.5 2863.3
Total Transuranic
nuclides 16824.2 16508.3 16300.6
3.10.2 ESFR Results for LWRCANDU Spent TRU for the HOM4 Design
Similar to the CONF2 models, the ratio of Pu in the inner and outer fuel was adjusted in this case in order
to obtain a k-effective evolution that resembled the benchmark case. Reductions of 15% and 20% of the
amount of Pu in the inner fuel relative to the outer fuel were investigated. The evolution of k-effective is
shown in Figure 33 for the different Pu ratios investigated, and in Figure 34 for all three passes. The
values for eff, SVRE, and the Doppler coefficient are in Table 39. For all parameters, the -15% Pu ratio
produces results that are closer to the HOM4 reference case [35]. The k-effective evolution, eff, SVRE
are similar to [35] for the 15% reduction, within 5%. The values for the Doppler coefficient deviate more,
-13% at pBOC to 19% at pEOC. This fuel was chosen for the fuel cycle system studies, and physics
calculations for two more passes through the ESFR were performed.

71
Figure 33 Reactivity curve for the LWRCANDU TRU for the HOM4 ESFR design, first pass.
Figure 34 Reactivity curve for the LWRCANDU TRU for the HOM4 ESFR design, all three passes.
1.000
1.010
1.020
1.030
1.040
1.050
1.060
1.070
0 500 1000 1500 2000
k-e
ffe
ctiv
e
Time (days)
Composition from [31]
Takahama LWR TRU
LWR-->CANDU TRU
LWR-->CANDU TRU, -15%
LWR-->CANDU TRU, -20%
1.005
1.010
1.015
1.020
1.025
1.030
1.035
1.040
1.045
0 500 1000 1500 2000 2500
k-e
ffe
ctiv
e
Time (days)
Composition from [31]
Pass 1
Pass 2
Pass 3
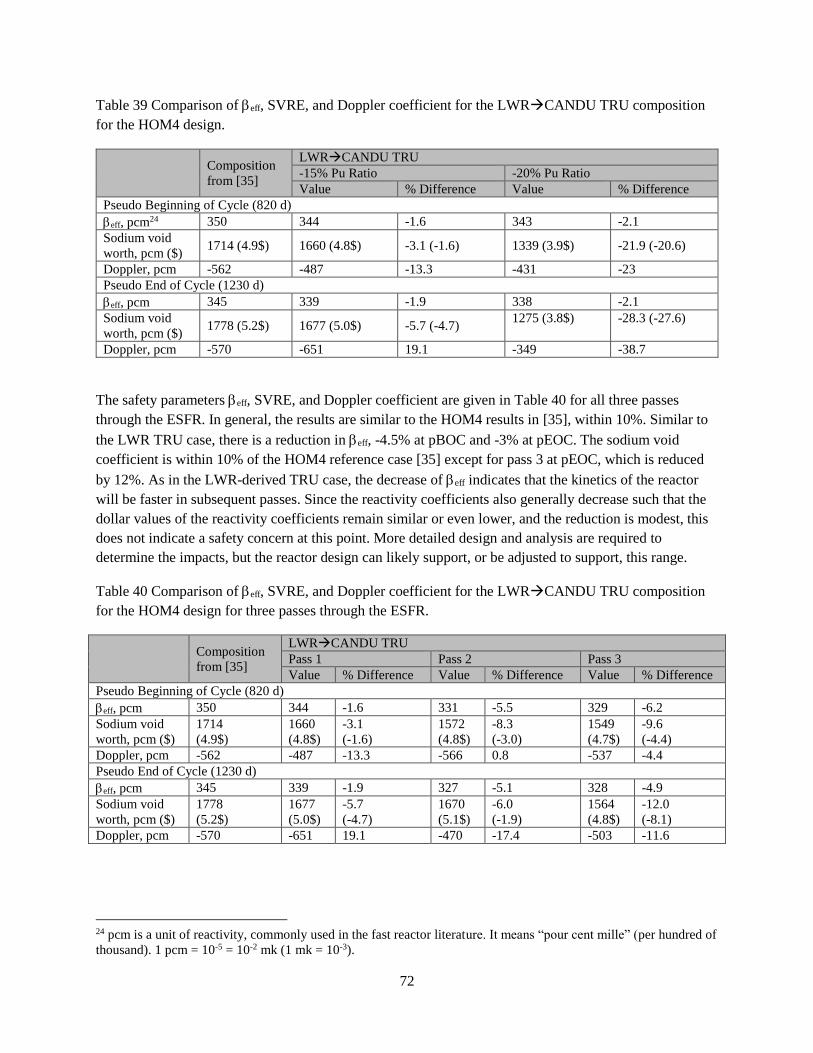
72
Table 39 Comparison of eff, SVRE, and Doppler coefficient for the LWRCANDU TRU composition
for the HOM4 design.
Composition
from [35]
LWRCANDU TRU
-15% Pu Ratio -20% Pu Ratio
Value % Difference Value % Difference
Pseudo Beginning of Cycle (820 d)
eff, pcm24 350 344 -1.6 343 -2.1
Sodium void
worth, pcm ($) 1714 (4.9$) 1660 (4.8$) -3.1 (-1.6) 1339 (3.9$) -21.9 (-20.6)
Doppler, pcm -562 -487 -13.3 -431 -23
Pseudo End of Cycle (1230 d)
eff, pcm 345 339 -1.9 338 -2.1
Sodium void
worth, pcm ($) 1778 (5.2$) 1677 (5.0$) -5.7 (-4.7)
1275 (3.8$)
-28.3 (-27.6)
Doppler, pcm -570 -651 19.1 -349 -38.7
The safety parameters eff, SVRE, and Doppler coefficient are given in Table 40 for all three passes
through the ESFR. In general, the results are similar to the HOM4 results in [35], within 10%. Similar to
the LWR TRU case, there is a reduction in eff, -4.5% at pBOC and -3% at pEOC. The sodium void
coefficient is within 10% of the HOM4 reference case [35] except for pass 3 at pEOC, which is reduced
by 12%. As in the LWR-derived TRU case, the decrease of eff indicates that the kinetics of the reactor
will be faster in subsequent passes. Since the reactivity coefficients also generally decrease such that the
dollar values of the reactivity coefficients remain similar or even lower, and the reduction is modest, this
does not indicate a safety concern at this point. More detailed design and analysis are required to
determine the impacts, but the reactor design can likely support, or be adjusted to support, this range.
Table 40 Comparison of eff, SVRE, and Doppler coefficient for the LWRCANDU TRU composition
for the HOM4 design for three passes through the ESFR.
Composition
from [35]
LWRCANDU TRU
Pass 1 Pass 2 Pass 3
Value % Difference Value % Difference Value % Difference
Pseudo Beginning of Cycle (820 d)
eff, pcm 350 344 -1.6 331 -5.5 329 -6.2
Sodium void
worth, pcm ($)
1714
(4.9$)
1660
(4.8$)
-3.1
(-1.6)
1572
(4.8$)
-8.3
(-3.0)
1549
(4.7$)
-9.6
(-4.4)
Doppler, pcm -562 -487 -13.3 -566 0.8 -537 -4.4
Pseudo End of Cycle (1230 d)
eff, pcm 345 339 -1.9 327 -5.1 328 -4.9
Sodium void
worth, pcm ($)
1778
(5.2$)
1677
(5.0$)
-5.7
(-4.7)
1670
(5.1$)
-6.0
(-1.9)
1564
(4.8$)
-12.0
(-8.1)
Doppler, pcm -570 -651 19.1 -470 -17.4 -503 -11.6
24 pcm is a unit of reactivity, commonly used in the fast reactor literature. It means “pour cent mille” (per hundred of
thousand). 1 pcm = 10-5 = 10-2 mk (1 mk = 10-3).

73
The Doppler coefficients show a larger range, with values increasing and decreasing relative to [35] with
no real trend with the fuel pass through the fast reactor. Two values are more negative, and six are more
positive. The value of the most concern is the pEOC value for the second pass through the reactor, -470
pcm, which is a 17% increase in the Doppler coefficient relative to [35]. The decrease in sodium void
coefficient (6%) should counteract this impact to some extent. The extent of this effect, and whether this
represents a safety issue in the operation of the reactor, requires more detailed studies which are beyond
the scope of this work. It is expected that even should this raise a problem, mitigation is possible. For
example, the fuel composition can be altered to be a mixture of fuel from the three passes such that it
produces adequate safety characteristics. This does impact the accuracy of this study, as the input and
output fuel compositions would not match those of an actual operating ESFR. This will be discussed
further in Section 4.2.1.
The flux profiles of the core in normal operating conditions and for coolant voiding are displayed in
Figure 35. The flux profiles for normal operating temperature (1500 K) and for an increased temperature
(2500 K) used to calculate the Doppler coefficients are shown in Figure 36. The flux profiles in these two
figures show an increase in flux at the centre of the core for all passes compared with the reference
HOM4 case.
Given the significant change in flux profile, the power distribution was also investigated. The peak
powers and the relative power for representative inner and outer fuel locations are given in Table 41.
These locations are shown schematically in Figure 37. As similar results will be shown for the
LWRCANDU ESFR cases, these results will be discussed together in Section 3.12.
The input and output fuel compositions, which are required input for the fuel cycle scenario calculations,
are given in Table 42 and Table 43.

74
Figure 35 Flux map of cooled and voided ESFR cores for the LWR CANDU fuel case and for the
HOM4 reference case (no colour scale available in Serpent).
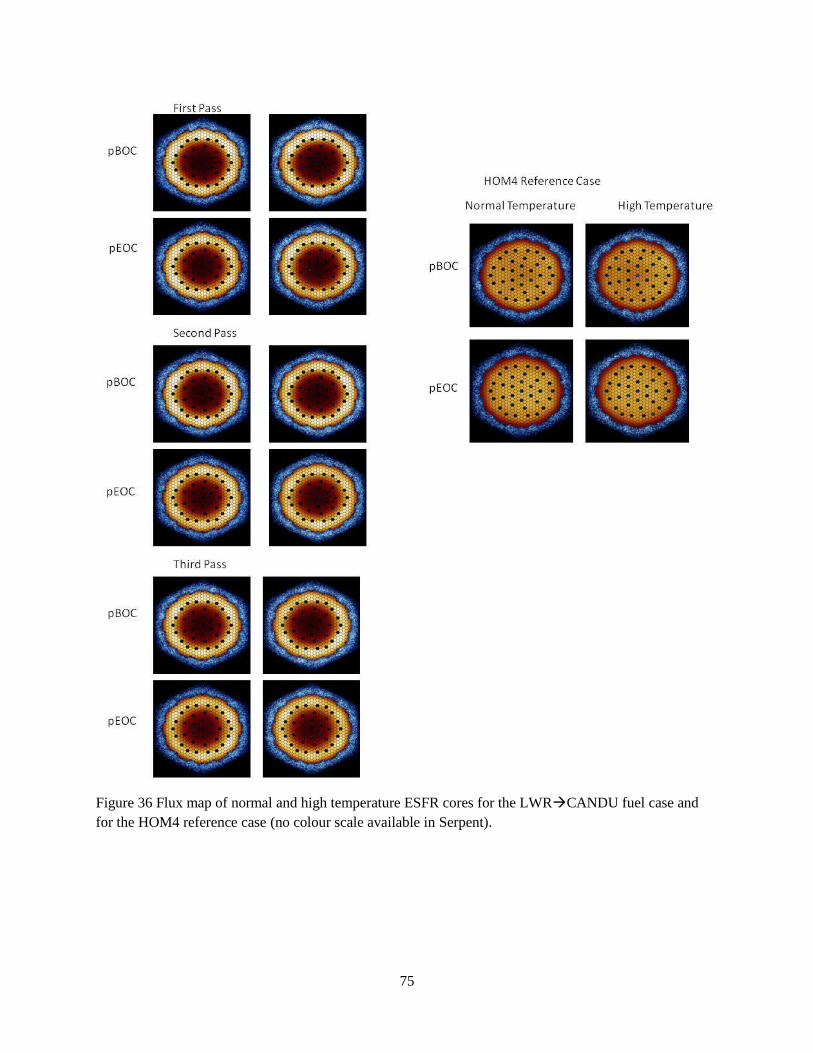
75
Figure 36 Flux map of normal and high temperature ESFR cores for the LWRCANDU fuel case and
for the HOM4 reference case (no colour scale available in Serpent).

76
Table 41 Peak powers and relative powers for inner and outer reference channels for the LWRCANDU
fuel ESFR cases.
Case
Peak Power Reference Channel
Location
Peak
Power
(relative
value)
% change
vs.
Reference
Case
Relative Power
% Change vs.
Reference Case
Inner Outer Inner Outer
Reference Case
pBOC 10 20 1.25 1.06 1.23
pEOC 18 25 1.27 1.25 1.16
LWR--
>CANDU 1st
Pass
pBOC 20 28 1.93 54.9 0.12 1.91 -88.3 55.2
pEOC 19 10 1.85 45.2 0.15 1.69 -88.3 45.4
LWR--
>CANDU 2nd
Pass
pBOC 28 9 1.96 57.3 0.15 1.78 -86.3 44.8
pEOC 10 28 1.79 40.9 0.19 1.70 -84.5 46.4
LWR--
>CANDU 3rd
Pass
pBOC 29 10 1.78 42.4 0.17 1.76 -83.6 43.1
pEOC 10 28 1.76 38.2 0.24 1.72 -80.9 48.5
Figure 37 The locations of the peak powers and the representative channels for the LWRCANDU fuel
ESFR cases.
Outer core (4 rows) Inner core (8 rows)
Representative channelOther colours are indicated in the table above

77
Table 42 Input fuel compositions for three passes through a fast reactor with the initial composition
derived from LWRCANDU used fuel.
Nuclide Pass 1 (kg) Pass 2 (kg) Pass 3 (kg)
U-235 213.8 219.0 223.1
U-236 0.0 0.0 0.0
U-237 0.0 0.0 0.0
U-238 87451.6 89581.9 91234.8
Np-237 959.5 659.1 482.1
Np-238 0.0 0.0 0.0
Np-239 0.0 0.0 0.0
Pu-238 1172.9 945.3 647.5
Pu-239 3534.8 5267.4 5906.7
Pu-240 6369.2 4837.7 3964.0
Pu-241 1698.8 685.5 417.9
Pu-242 4204.4 2973.3 2046.6
Pu-243 0.0 0.0 0.0
Am-241 356.4 751.4 791.3
Am-242 0.0 0.0 0.0
Am-242m 3.2 18.4 32.9
Am-243 1464.2 1530.0 1487.2
Cm-242 370.3 0.1 0.1
Cm-243 14.6 7.9 4.7
Cm-244 984.3 1014.0 1059.4
Cm-245 25.0 170.9 256.1
Cm-246 22.6 39.1 71.8
Total U 87665.4 89800.9 91457.8
Total Np 959.5 659.1 482.1
Total Pu 16980.1 14709.3 12982.7
Total Am 1823.9 2299.9 2311.4
Total Cm 1416.8 1232.0 1392.2
Total Minor Actinides 4200.2 4191.0 4185.6
Total Transuranic
nuclides 21180.3 18900.2 17168.2
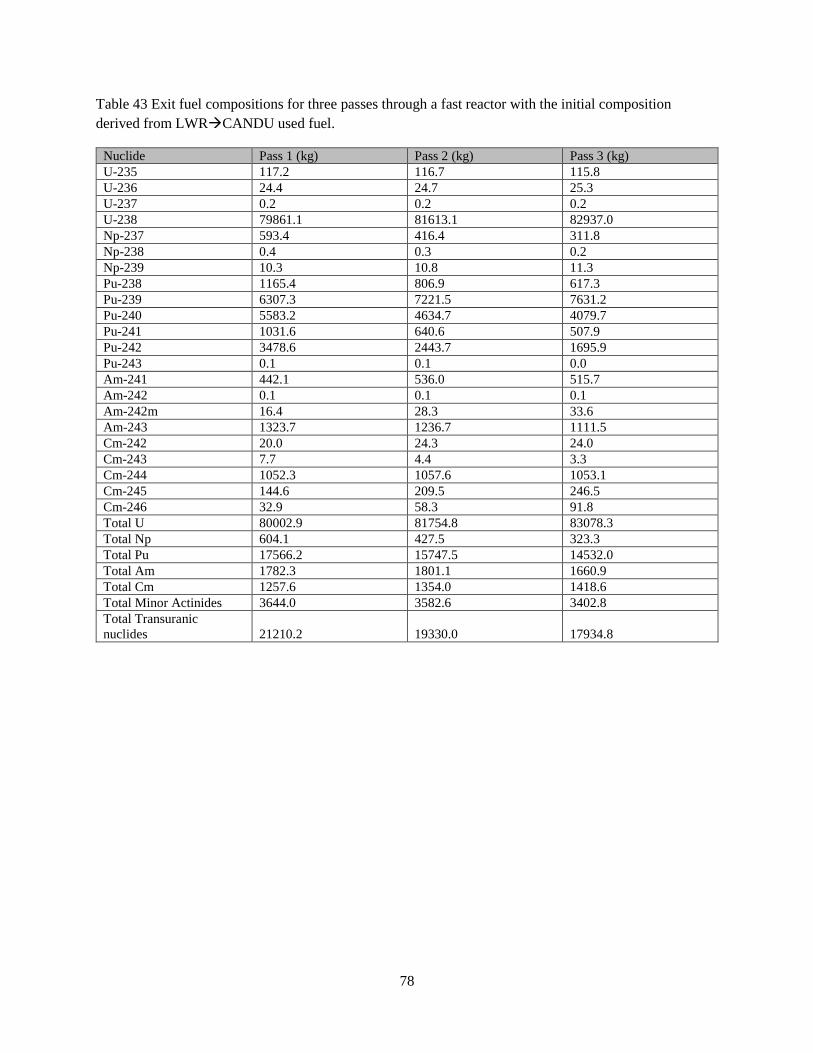
78
Table 43 Exit fuel compositions for three passes through a fast reactor with the initial composition
derived from LWRCANDU used fuel.
Nuclide Pass 1 (kg) Pass 2 (kg) Pass 3 (kg)
U-235 117.2 116.7 115.8
U-236 24.4 24.7 25.3
U-237 0.2 0.2 0.2
U-238 79861.1 81613.1 82937.0
Np-237 593.4 416.4 311.8
Np-238 0.4 0.3 0.2
Np-239 10.3 10.8 11.3
Pu-238 1165.4 806.9 617.3
Pu-239 6307.3 7221.5 7631.2
Pu-240 5583.2 4634.7 4079.7
Pu-241 1031.6 640.6 507.9
Pu-242 3478.6 2443.7 1695.9
Pu-243 0.1 0.1 0.0
Am-241 442.1 536.0 515.7
Am-242 0.1 0.1 0.1
Am-242m 16.4 28.3 33.6
Am-243 1323.7 1236.7 1111.5
Cm-242 20.0 24.3 24.0
Cm-243 7.7 4.4 3.3
Cm-244 1052.3 1057.6 1053.1
Cm-245 144.6 209.5 246.5
Cm-246 32.9 58.3 91.8
Total U 80002.9 81754.8 83078.3
Total Np 604.1 427.5 323.3
Total Pu 17566.2 15747.5 14532.0
Total Am 1782.3 1801.1 1660.9
Total Cm 1257.6 1354.0 1418.6
Total Minor Actinides 3644.0 3582.6 3402.8
Total Transuranic
nuclides 21210.2 19330.0 17934.8

79
3.11 Comparison of Transmutation Performance
The total mass transmuted and percent transmuted for Am, Pu, total minor actinides, total transuranic
elements, and Am-241 are given in Table 44 to Table 47 and Figure 38 and Figure 39. Values for the
transmutation in a CANDU reactor are provided for comparison. The calculations of these quantities are
the same as those used in Section 2.9.
Table 44 Mass transmuted per reactor per year (kg reactor-1 year-1) for the three passes through the ESFR
starting with Takahama LWR-derived transuranic elements.
1st Pass 2nd Pass 3rd Pass CANDU
Total Am -155.2 -172.8 -175.6 -66.3
Total Pu 384.9 380.1 395.3 -529.5
Total Cm 31.1 23.8 14.8 -43.1
Total MA -227.3 -233.3 -234.1 -61.1
Total TRU 157.6 146.9 161.2 -590.6
Am-241 -154.2 -151.6 -139.7 -95.9
Table 45 Mass transmuted per reactor per year (kg reactor-1 year-1) for the three passes through the ESFR
starting with LWRCANDU derived fuel.
1st Pass 2nd Pass 3rd Pass CANDU
Total Am -7.4 -88.9 -115.9 -66.3
Total Pu 104.4 185.0 276.1 -529.5
Total Cm -28.4 21.7 4.7 -43.1
Total MA -99.1 -108.4 -139.5 -61.1
Total TRU 5.3 76.6 136.6 -590.6
Am-241 15.3 -38.4 -49.1 -95.9
Table 46 Percent transmuted for the entire irradiation for each pass through the ESFR starting with
Takahama LWR-derived transuranic elements.
1st Pass 2nd Pass 3rd Pass CANDU
Total Am -33.7 -36.8 -38.0 -50.8
Total Pu 18.4 18.5 19.8 -43.4
Total Cm 132.8 43.0 16.4 663.6
Total MA -30.5 -31.3 -31.4 -28.6
Total TRU 5.5 5.3 5.9 -41.2
Am-241 -40.4 -42.4 -43.1 -88.3
Table 47 Percent transmuted for the entire irradiation for each pass through the ESFR starting with
LWRCANDU derived fuel.
1st Pass 2nd Pass 3rd Pass CANDU
Total Am -2.3 -21.7 -28.1 -50.8
Total Pu 3.5 7.1 11.9 -43.4
Total Cm -11.2 9.9 1.9 663.6
Total MA -13.2 -14.5 -18.7 -28.6
Total TRU 0.1 2.3 4.5 -41.2
Am-241 24.0 -28.7 -34.8 -88.3

80
Figure 38 Mass transmuted per reactor per year (kg reactor-1 year-1) for the three passes through the
ESFR. L: starting with Takahama LWR-derived transuranic elements, C: starting with LWRCANDU-
derived fuel.
Figure 39 Percent transmutation for the three passes through the ESFR. L: starting with Takahama LWR-
derived transuranic elements, C: starting with LWRCANDU-derived fuel.
The ESFR is a breeder reactor. It produces Pu during the irradiation. Using the LWRCANDU-derived
fuel the ESFR breeds less Pu than from Takahama LWR-derived fuel. This is due to the initial Pu
composition, given in Table 25. The LWRCANDU TRU case, in which the Pu has already passed
through a CANDU reactor, has depleted Pu-239, more Pu-238 from the transmutation of Am-241, and
more Pu-242, which is created through neutron capture onto Pu-241 and through the electron capture
radioactive decay of Am-242. There is also more Pu in the fresh fuel in the LWRCANDU TRU case,
-600
-500
-400
-300
-200
-100
0
100
200
300
400
Total Am Total Pu Total MA Total TRU Am-241
Mas
s Tr
ansm
ute
d (
kg r
eac
tor-1
year
-1)
L-1st Pass
L-2nd Pass
L-3rd Pass
C-1st Pass
C-2nd Pass
C-3rd Pass
CANDU
-100
-80
-60
-40
-20
0
20
40
Total Am Total Pu Total MA Total TRU Am-241
% T
ran
smu
ted
L-1st Pass
L-2nd Pass
L-3rd Pass
C-1st Pass
C-2nd Pass
C-3rd Pass
CANDU

81
30% more, due to this depleted isotopic composition. The evolution of the Pu isotopes through the three
passes is shown in Figure 40 and Figure 41; Figure 42 shows both cases for comparison. As the
plutonium input vector improves through the passes in the LWRCANDU case, and the proportion of
Pu-239 increases, the amount of Pu in the fresh fuel decreases and approaches that of the Takahama LWR
TRU case.
Table 48 Isotopic composition of plutonium for the fresh fuel for the first pass into the Takahama LWR-
derived fuel case and the LWRCANDU derived fuel case.
Nuclide Takahama LWR TRU LWRCANDU TRU
Pu-238 2.8 6.9
Pu-239 56.0 20.8
Pu-240 25.3 37.5
Pu-241 8.1 10.0
Pu-242 7.8 24.8
Figure 40 Evolution of the mass of plutonium nuclides through three passes in the fast reactor for the
Takahama LWR derived fuel case.

82
Figure 41 Evolution of the mass of plutonium nuclides through three passes in the fast reactor for the
LWRCANDU derived fuel case.
Figure 42 Evolution of the mass of plutonium nuclides through three passes in the fast reactor for both
cases. Solid lines designate the Takahama LWR-derived fuel case, and the dashed lines designate the
LWRCANDU derived fuel case.
The fast reactor fuelled with Takahama LWR-derived fuel transmutes more americium, as would be
expected, since the CANDU reactor has already transmuted much of the Am in the other scenario. The
evolution of Am though the three passes is shown in Figure 43 and Figure 44; Figure 45 shows both the
cases for comparison. These figures show the decrease in Am over the irradiation, and then an increase in
the fresh fuel, due to the beta decay of Pu-241 prior to re-insertion, and the concentration of minor
actinides in the new fuel. In the LWRCANDU fuelled ESFR, there is a growth in Am-241 over the
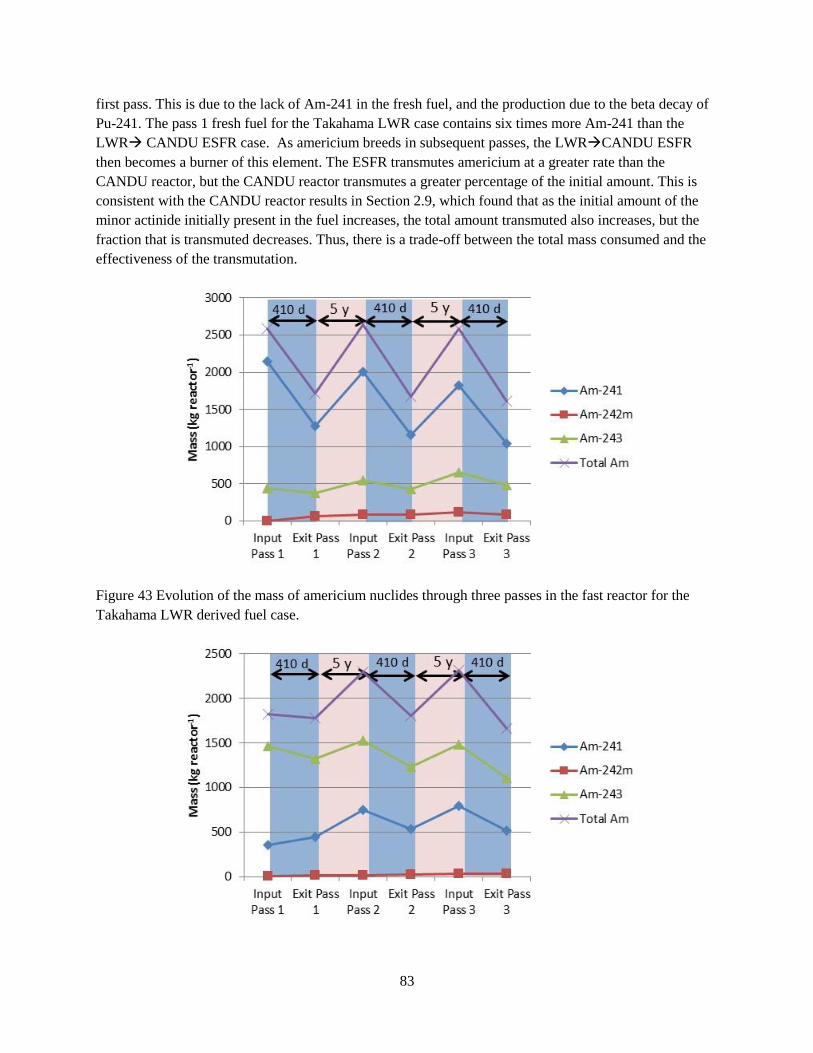
83
first pass. This is due to the lack of Am-241 in the fresh fuel, and the production due to the beta decay of
Pu-241. The pass 1 fresh fuel for the Takahama LWR case contains six times more Am-241 than the
LWR CANDU ESFR case. As americium breeds in subsequent passes, the LWRCANDU ESFR
then becomes a burner of this element. The ESFR transmutes americium at a greater rate than the
CANDU reactor, but the CANDU reactor transmutes a greater percentage of the initial amount. This is
consistent with the CANDU reactor results in Section 2.9, which found that as the initial amount of the
minor actinide initially present in the fuel increases, the total amount transmuted also increases, but the
fraction that is transmuted decreases. Thus, there is a trade-off between the total mass consumed and the
effectiveness of the transmutation.
Figure 43 Evolution of the mass of americium nuclides through three passes in the fast reactor for the
Takahama LWR derived fuel case.

84
Figure 44 Evolution of the mass of americium nuclides through three passes in the fast reactor for the
LWRCANDU derived fuel case.
Figure 45 Evolution of the mass of americium nuclides through three passes in the fast reactor for both
cases. Solid lines designate the Takahama LWR-derived fuel case, and the dashed lines designate the
LWRCANDU derived fuel case.
In almost every case, curium is produced through the irradiation. The exception is the first pass of the
LWRCANDU fast reactor; this is because there is much more curium in this reactor than in the
Takahama LWR-derived case, 1417 kg vs. 131 kg. This larger amount of curium and smaller amount of
americium allow the depletion of curium to compete with its production. The greatest rate of production
of curium occurs in the CANDU reactor, which is consistent with the greatest rate of transmutation of
americium that also occurs in that case. Also, as shown in Section 1.3, the thermal spectrum is less
efficient at fissioning actinides than is the fast spectrum, so more higher mass actinides are produced per
actinide that is transmuted by fission.
3.12 Discussion
The flux profiles in Figure 30, Figure 31, Figure 35 and Figure 36 and the power peaking data in Table 36
and Table 41 show that the ESFR cores for the second and third passes of the Takahama LWR-derived
case and the LWRCANDU cases differ significantly from the reference HOM4 case. Without detailed
further thermalhydraulics calculations it is not known whether these power peaks can be tolerated by this
reactor without damage to the fuel, but it is unlikely given the large discrepancies. The thermal
conductivity of sodium at 500ºC is 67 W m-1 K, and for water at 300ºC it is 0.68 W m-1 K [69]25(at typical
operating temperatures.) Given the two order of magnitude increase in thermal conductivity of the sodium
coolant, the ESFR should be able to provide more efficient cooling to the fuel and may be able to operate
with some higher power peaks.
The large increase in the peak power, 42% in the Takahama LWR-derived fuel case, and 55% in the
LWRCANDU fuel case, is a big concern. This indicates that this model of the ESFR is not viable. It is
25 The values in [69] are given in BTU hr-1 ft ºF; these values have been converted here.
85
highly likely that a different core configuration would bring the peak power down closer to the reference
case. Different arrangements of the inner and outer fuel assemblies, and different amounts of Pu and
minor actinides in the fuel assemblies would alter these values. Re-designing the ESFR core design for
these fuels is a large piece of work, and beyond the scope of this thesis. Another method, which would
likely happen should a fuel cycle of this type be adopted, would be to change the fuel composition by
mixing fuel from different sources and different ages to achieve the desired reactor physics
characteristics. For example, the input fuel could be a mixture of LWRCANDU second pass fuel
LWRCANDU first pass fuel, and Takahama LWR-derived fuel. This would temper the impact of the
changing isotopic compositions.
Adding a poison to the fuel, such as gadolinium, could also function to reduce the power in the fuel. This
tactic is used in boiling water reactors for reactivity hold down and power shaping. The reduction of the
cross sections in the fast spectrum will likely make this method less effective.
There are control devices located in the outer region of the core. These are positioned out of the core in
this simulation, but it is possible that if they are in the core that this would lower the powers. Re-design of
these control devices, to increase the absorption in the material, or changing the amount and location of
the devices may also result in a core with acceptable power peaking.
If a different core configuration cannot be found to lower the peak powers, and the thermal hydraulic
characteristics of the sodium cooled reactor are not sufficient to remove the excess heat, then the nominal
reactor power can be lowered.
It is a reasonable assumption that reactors derived from these fuels could be built, though it is recognized
that some redesign and a substantial amount of work would be required. This reactor model is realistic
enough that the trends that arise from these models are expected to hold if more detailed design is
performed, and if the subsequent reactor were build and these fuel cycles deployed. For example, it is
expected that the transmutation rates and fractions are on the correct order, and that the overall trends are
correct, such as where one reactor has a higher rate or fraction of a nuclide transmuted, that trend would
hold in a future redesigned and operating reactor.
Given that this model is unviable, and a redesign to obtain a viable model will not be performed for this
work, cases will be run in the fuel cycle scenario study that de-rate the reactors, in order to model what
would happen in that “worst case” scenario. The Takahama LWR-derived fuel ESFR will be de-rated by
35%, and the LWR CANDU fuel ESFR will be de-rated by 50%. These nominal power reductions will
apply for all passes; it is not possible in VISION, the fuel cycle scenario code used, (see Section 4.2) to
adjust the reactor power for later fuel passes through the reactor. The cycle lengths will be adjusted
accordingly. With the power and cycle lengths adjusted the burnup will remain the same and the fuel
compositions calculated here will also be approximately constant.
The scenario studies in this work are preliminary studies to determine if this fuel cycle is worth further
investigation. It is not intended as a detailed, highly precise examination. The reactor designs and fuels in
the study need to be sufficiently robust to deduce reliable trends, they do not need to be precise models of
the reactors and the fuels that would be employed. It is impossible to know this at this stage. These
reactors and fuels are hypothetical. A large amount of additional work needs to be done to make these
reactors and fuels a reality, which represents many years of research by many people, and hundreds of

86
millions of dollars. This type of study is performed to provide preliminary answers to the question of
whether it would be worthwhile to begin that larger investment.
87
4 FUEL CYCLE SCENARIO STUDIES
4.1 Introduction
Fuel cycle studies are performed to guide research programs. The development of new reactors and new
fuels is an incredibly expensive endeavour. Many options are also available; a brainstorming activity in
the US came up with over 4300 different possible fuel cycles. It is prohibitive to develop all of these.
Thus, fuel cycle scenario tools have been developed to model and compare these different options. The
fuel cycle scenarios in this study examine the transition from a LWR-only fleet of nuclear reactors to a
fleet containing HWR and/or fast reactors over a 200-year period, from 2000 to 2200.
Fuel cycle scenario studies produce a large amount of results and parameters that can be analyzed. A few
parameters have been selected to report on here to give an overview and comparison of key components
and characteristics of the fuel cycles. These are in a few different categories:
What the fuel cycle looks like
These parameters show the reactor composition of the fuel cycle and include:
Electrical capacity, broken down by reactor type in each year
Operating reactors, how many of each type of reactor are operating in each year
New reactors, how many of each type of reactor are brought online in each year
Mass of spent fuel in storage in each year
Sustainability
The primary sustainability metric is the cumulative uranium consumption.
Actinide masses
The mass of various elements is a key characteristic to evaluate the impact that the fuel cycle would have
on a deep geological repository. The mass of americium, plutonium, curium and total minor actinides is
presented for each year. These values are available from VISION (Verifiable Fuel Cycle Simulation) only
by element and not by individual isotope. This does not include any mass currently under irradiation in a
reactor, only that in storage or in reprocessing. In some cases, an element is totally depleted over the
course of the scenario. In these instances, the year in which the element runs out is given.
The neptunium inventory is not presented here. Neptunium is tracked in VISION, and the information is
available. However, since neptunium is not a significant contributor to any waste characteristics (Section
1.2) or fuel handling considerations (Section 1.4.1), it is not of interest to any fuel cycle metrics.
Reprocessing
Reprocessing of spent fuel is a key feature in these fuel cycles. How much fuel of each type is
reprocessed in each year will be examined.
88
Uncertainties
It is important to view the results of a scenario study within the context of the assumptions and
uncertainties present in this type of study. This study models fuel cycle options out to the year 2200. It is
impossible to predict what the energy situation will be in the world, or in any particular region, in 180
years. Many input parameters are best guesses, e.g. the nuclear energy demand, fuel compositions, and
reactor designs. For reactors currently in operation, such as the HWR and LWRs, the designs in use today
are a good basis, but these are expected to evolve in future generations. For advanced reactors not yet
deployed, the final design is much less certain. In each case a representative design is chosen, one that is
as far along the development path as is available.
Despite these large uncertainties, fuel cycle scenarios are still a useful tool. It is not necessary to be able
to predict the future exactly to compare different fuel cycle options. As an example, it is not reasonable to
conclude from this study the exact natural uranium consumption in 2200. There are too many inherent
uncertainties and modelling assumptions to believe that number to be highly accurate. However, it is
reasonable to conclude that one fuel cycle would have a reduction in natural uranium consumption of a
certain percentage relative to a second fuel cycle studied. It is these comparative results of one fuel cycle
option relative to another that are the aim of these studies, and these are much less affected by the
inherent uncertainties, which are equally present in all the scenarios.
4.2 Overview of VISION
VISION (Verifiable Fuel Cycle Simulation) [70], [71] is a dynamic fuel cycle simulation model
developed at Idaho National Laboratory as part of the Advanced Fuel Cycle Initiative. The model enables
the analysis of future nuclear energy systems. VISION is a model that uses the PowerSim Studio platform
to perform the calculations.
Through VISION the user can vary fuel cycle parameters such as: nuclear energy growth rates, reactor
types, reactor fuels, reprocessing scenarios. This allows the examination of the relationships between the
components in the fuel cycle, for instance, uranium resources, number of reactors, mix of reactor and fuel
types, and waste management characteristics. VISION is a dynamic model, not a steady-state
approximation. Scenarios simulated using VISION change with time; reactors are built, operated and
decommissioned, and fuel compositions change with time throughout the scenario. Static, steady state
scenarios show the system once equilibrium has been achieved, but are not able to model how the system
evolves from one fuel cycle to another. Previous studies [72] have shown that dynamic, time-dependent
fuel cycle models are necessary and will produce dramatically different results depending on the fuel
cycle analyzed. Scenarios involving the transition from one fuel cycle to another fuel cycle, such as are to
be studied here, require dynamic analysis. Parameters such as when the transition to the new fuel cycle
can occur, and how long that transition takes will greatly affect the metrics for the evaluation of the fuel
cycle (such as uranium utilization and waste management characteristics) and cannot be captured in a
steady state analysis.
VISION tracks material through the entire fuel cycle, i.e. mining, milling, conversion, enrichment, fuel
fabrication, power generation, recycling, storage, and final disposal. The tracking is done by isotope, and
includes 81 isotopes and chemical elements. The model includes the ability to apply logic, such as not
building a reactor unless the fuel will be available for the entire life of that reactor. This is a very
89
comprehensive model, and allows for fuel cycle analysis based on a wide range of metrics such as
sustainability (i.e. resource requirements), waste management, proliferation resistance, and economics.
Waste management metrics include: the volumes and masses of spent fuel present at various points in the
fuel cycle (e.g. unprocessed fuel, amount in storage, and amount in final disposal), long-term
radiotoxicity, and long-term heat generation.
4.2.1 Mass Inventory in VISION
Within VISION the composition of the fuel is changed dynamically; out of reactor fuel is decayed. This is
an important component to fuel cycle scenario system that is not accounted for in a steady state
calculation. It is especially important in plutonium fuelled cases and actinide transmutation scenarios,
where the decay of Pu-241 to Am-241 impacts both the fissile component of future fresh fuel, and the
amount of americium to be transmuted.
VISION does not perform any reactor physics calculations; as such it must make approximations and
assumptions about the isotopic composition of the fuel entering and exiting reactors. The user supplies
input and output fuel composition (recipe) for each reactor, and for each pass through reactors that use
self-recycled fuel. This creates a problem if the available fuel in the fuel cycle at a given time does not
exactly match the composition in the fuel recipe. This effect will always have an impact on the fuel cycle
accuracy. The spent fuel in the fuel cycle at a given time may contain fuel of many ages, and the ages of
the spent fuel in the scenario will change during the scenario. The spent fuel composition in the scenario
will never correspond exactly to what was used in the physics models.
In this study the reprocessing options were set such that VISION reprocesses fuel as it becomes available.
The separated fuel then goes into a “separations buffer”. When the model requires fuel for fabrication, it
draws fuel from the separations buffer according to the input fuel elemental masses in the fuel recipe.
However, the isotopic compositions of the elements used to fabricate the fresh fuel will be what exist in
the separations buffer, which may be different than the isotopic compositions in the fuel recipe. Re-stated,
the mass of an element used to fabricate new fresh fuel is dictated by the fresh fuel recipe, but the isotopic
content of that element is dictated by the separations buffer. If the decay times used in the reactor physics
calculations are the same as those used in the VISION model, then the deviations should not be too great.
In this study, 5 years were used for decay, reprocessing and fabrication of used fast reactor fuel in both
the scenario model and the reactor physics calculations (i.e. the total time between fuel exiting the reactor
and its reinsertion into a reactor is equal to five years).
A bigger inaccuracy may exist for LWR spent fuel. All reactor physics calculations were performed using
15-year-cooled LWR spent fuel. This same composition was used for the legacy spent fuel that exists at
the beginning of the scenario in the fuel cycle scenario model. However, any LWR spent fuel produced in
the model decays for 4 years before being reprocessed, plus a one year fabrication time, for a minimum of
five years between discharge from an LWR and insertion into a new reactor. Also, the legacy spent fuel
will decay until it is used as new fresh fuel (2030 for HWRs, 2040 for fast reactors). The fuel in the LWR
separations buffer will be a combination of many ages of LWR spent fuel: legacy spent fuel that starts off
15 years old, then decays, LWR fuel that is produced during the scenario up to 2025 when LWR
reprocessing begins, and LWR fuel that is produced after reprocessing begins, and is therefore 4 years old
when it is sent for reprocessing. The fuel in the LWR separations buffer will get younger once new
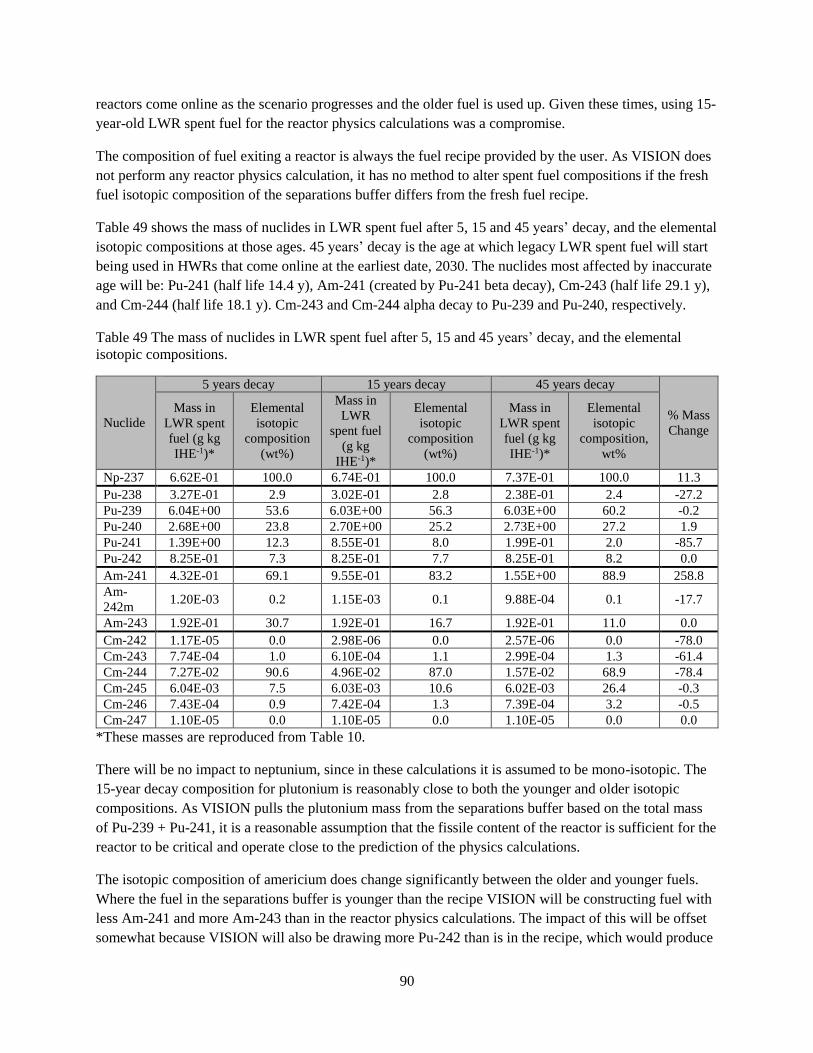
90
reactors come online as the scenario progresses and the older fuel is used up. Given these times, using 15-
year-old LWR spent fuel for the reactor physics calculations was a compromise.
The composition of fuel exiting a reactor is always the fuel recipe provided by the user. As VISION does
not perform any reactor physics calculation, it has no method to alter spent fuel compositions if the fresh
fuel isotopic composition of the separations buffer differs from the fresh fuel recipe.
Table 49 shows the mass of nuclides in LWR spent fuel after 5, 15 and 45 years’ decay, and the elemental
isotopic compositions at those ages. 45 years’ decay is the age at which legacy LWR spent fuel will start
being used in HWRs that come online at the earliest date, 2030. The nuclides most affected by inaccurate
age will be: Pu-241 (half life 14.4 y), Am-241 (created by Pu-241 beta decay), Cm-243 (half life 29.1 y),
and Cm-244 (half life 18.1 y). Cm-243 and Cm-244 alpha decay to Pu-239 and Pu-240, respectively.
Table 49 The mass of nuclides in LWR spent fuel after 5, 15 and 45 years’ decay, and the elemental
isotopic compositions.
Nuclide
5 years decay 15 years decay 45 years decay
% Mass
Change
Mass in
LWR spent
fuel (g kg
IHE-1)*
Elemental
isotopic
composition
(wt%)
Mass in
LWR
spent fuel
(g kg
IHE-1)*
Elemental
isotopic
composition
(wt%)
Mass in
LWR spent
fuel (g kg
IHE-1)*
Elemental
isotopic
composition,
wt%
Np-237 6.62E-01 100.0 6.74E-01 100.0 7.37E-01 100.0 11.3
Pu-238 3.27E-01 2.9 3.02E-01 2.8 2.38E-01 2.4 -27.2
Pu-239 6.04E+00 53.6 6.03E+00 56.3 6.03E+00 60.2 -0.2
Pu-240 2.68E+00 23.8 2.70E+00 25.2 2.73E+00 27.2 1.9
Pu-241 1.39E+00 12.3 8.55E-01 8.0 1.99E-01 2.0 -85.7
Pu-242 8.25E-01 7.3 8.25E-01 7.7 8.25E-01 8.2 0.0
Am-241 4.32E-01 69.1 9.55E-01 83.2 1.55E+00 88.9 258.8
Am-
242m 1.20E-03 0.2 1.15E-03 0.1 9.88E-04 0.1 -17.7
Am-243 1.92E-01 30.7 1.92E-01 16.7 1.92E-01 11.0 0.0
Cm-242 1.17E-05 0.0 2.98E-06 0.0 2.57E-06 0.0 -78.0
Cm-243 7.74E-04 1.0 6.10E-04 1.1 2.99E-04 1.3 -61.4
Cm-244 7.27E-02 90.6 4.96E-02 87.0 1.57E-02 68.9 -78.4
Cm-245 6.04E-03 7.5 6.03E-03 10.6 6.02E-03 26.4 -0.3
Cm-246 7.43E-04 0.9 7.42E-04 1.3 7.39E-04 3.2 -0.5
Cm-247 1.10E-05 0.0 1.10E-05 0.0 1.10E-05 0.0 0.0
*These masses are reproduced from Table 10.
There will be no impact to neptunium, since in these calculations it is assumed to be mono-isotopic. The
15-year decay composition for plutonium is reasonably close to both the younger and older isotopic
compositions. As VISION pulls the plutonium mass from the separations buffer based on the total mass
of Pu-239 + Pu-241, it is a reasonable assumption that the fissile content of the reactor is sufficient for the
reactor to be critical and operate close to the prediction of the physics calculations.
The isotopic composition of americium does change significantly between the older and younger fuels.
Where the fuel in the separations buffer is younger than the recipe VISION will be constructing fuel with
less Am-241 and more Am-243 than in the reactor physics calculations. The impact of this will be offset
somewhat because VISION will also be drawing more Pu-242 than is in the recipe, which would produce

91
more Am-241 during the irradiation. Thus, this inaccuracy in the Am-241 exit fuel recipe with respect to
the actual isotopic that were in the VISION fuel will be partly negated.
A significant amount of curium is produced in the reactor irradiations that are fueled with LWR spent
fuel, both in HWR and FR-LWR, 664% and 133% respectively, relative to the starting amounts. Given
these large relative increases, the potential deviations in the starting isotopic compositions will probably
not have a large impact relative to the changes that occur during the irradiation.
There is no way in VISION to determine the size or impact of deviations in isotopic composition of the
separations buffer and the fuel recipe. The composition of the separations buffer in VISION is output by
element only.
The user can select what nuclides to use for fuel flow control, that is, to determine if enough fuel exists to
build and/or fuel reactors. In this study, option 3, Pu-239 + Pu-241, was used. This means that if there is a
sufficient amount of Pu-239 + Pu-241, reactors will be constructed and fuel will be fabricated when
needed. If the fuel requires additional reprocessed elements, then the mass of those elements will be
drawn from the buffer according to the recipe. This means that it is possible for the buffer to run out of
other elements. If that occurs, then the separations buffer runs negative for that element.
In these scenarios, the fast reactor contains 4 wt% minor actinides, which is a greater concentration of
minor actinides than is present in LWR spent fuel, and subsequently a greater concentration than is
present in the separations buffer. This allows the fuel cycle to dispose of minor actinides at a greater rate,
but also means that the scenario is likely to run out of these elements, as the scenario will continue to
build reactors.
When the separations buffer runs negative, the scenario still fabricates new fuel with the mass and
isotopic composition of that element, according to the fuel recipe. This can be thought of as the element
coming into this fuel cycle from outside the region. After the region being modeled runs out of a
particular element, it could begin being supplied with elements from other regions.
The scenario running out of an element and then creating the element from the ether generates a problem
when trying to determine the ability of the fuel cycle to transmute minor actinides. A few metrics have
been explored in this study to figure out how a fuel cycle performs in terms of the transmutation of minor
actinides, or at least the relative performance of the fuel cycles. In this work, some of the fuel cycles
scenarios run out of americium and curium, and for those scenarios the following metrics are used:
the year at which the scenario runs out of americium in the separations buffer, and needs to bring
in americium from outside of the scenario,
the year at which the scenario runs out of curium in the separations buffer, and needs to bring in
americium from outside of the scenarios,
the amount of americium that the scenario requires from external sources,
the amount of curium that the scenario requires from external sources.
It is problematic to simply subtract the amount of americium that the scenario had to bring in from the
outside from the amount elsewhere in the cycle (i.e. in reactors). This is because, if the americium were
not available, and was not in new fresh fuel, then this would significantly change the amount that is
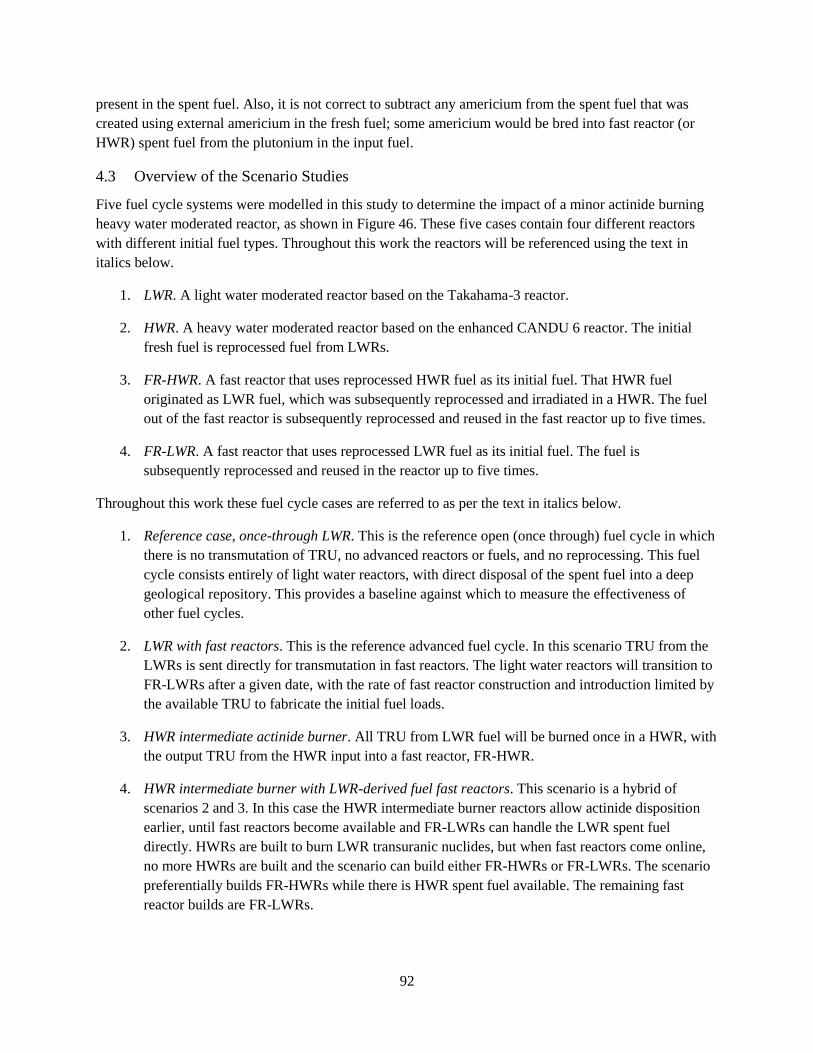
92
present in the spent fuel. Also, it is not correct to subtract any americium from the spent fuel that was
created using external americium in the fresh fuel; some americium would be bred into fast reactor (or
HWR) spent fuel from the plutonium in the input fuel.
4.3 Overview of the Scenario Studies
Five fuel cycle systems were modelled in this study to determine the impact of a minor actinide burning
heavy water moderated reactor, as shown in Figure 46. These five cases contain four different reactors
with different initial fuel types. Throughout this work the reactors will be referenced using the text in
italics below.
1. LWR. A light water moderated reactor based on the Takahama-3 reactor.
2. HWR. A heavy water moderated reactor based on the enhanced CANDU 6 reactor. The initial
fresh fuel is reprocessed fuel from LWRs.
3. FR-HWR. A fast reactor that uses reprocessed HWR fuel as its initial fuel. That HWR fuel
originated as LWR fuel, which was subsequently reprocessed and irradiated in a HWR. The fuel
out of the fast reactor is subsequently reprocessed and reused in the fast reactor up to five times.
4. FR-LWR. A fast reactor that uses reprocessed LWR fuel as its initial fuel. The fuel is
subsequently reprocessed and reused in the reactor up to five times.
Throughout this work these fuel cycle cases are referred to as per the text in italics below.
1. Reference case, once-through LWR. This is the reference open (once through) fuel cycle in which
there is no transmutation of TRU, no advanced reactors or fuels, and no reprocessing. This fuel
cycle consists entirely of light water reactors, with direct disposal of the spent fuel into a deep
geological repository. This provides a baseline against which to measure the effectiveness of
other fuel cycles.
2. LWR with fast reactors. This is the reference advanced fuel cycle. In this scenario TRU from the
LWRs is sent directly for transmutation in fast reactors. The light water reactors will transition to
FR-LWRs after a given date, with the rate of fast reactor construction and introduction limited by
the available TRU to fabricate the initial fuel loads.
3. HWR intermediate actinide burner. All TRU from LWR fuel will be burned once in a HWR, with
the output TRU from the HWR input into a fast reactor, FR-HWR.
4. HWR intermediate burner with LWR-derived fuel fast reactors. This scenario is a hybrid of
scenarios 2 and 3. In this case the HWR intermediate burner reactors allow actinide disposition
earlier, until fast reactors become available and FR-LWRs can handle the LWR spent fuel
directly. HWRs are built to burn LWR transuranic nuclides, but when fast reactors come online,
no more HWRs are built and the scenario can build either FR-HWRs or FR-LWRs. The scenario
preferentially builds FR-HWRs while there is HWR spent fuel available. The remaining fast
reactor builds are FR-LWRs.
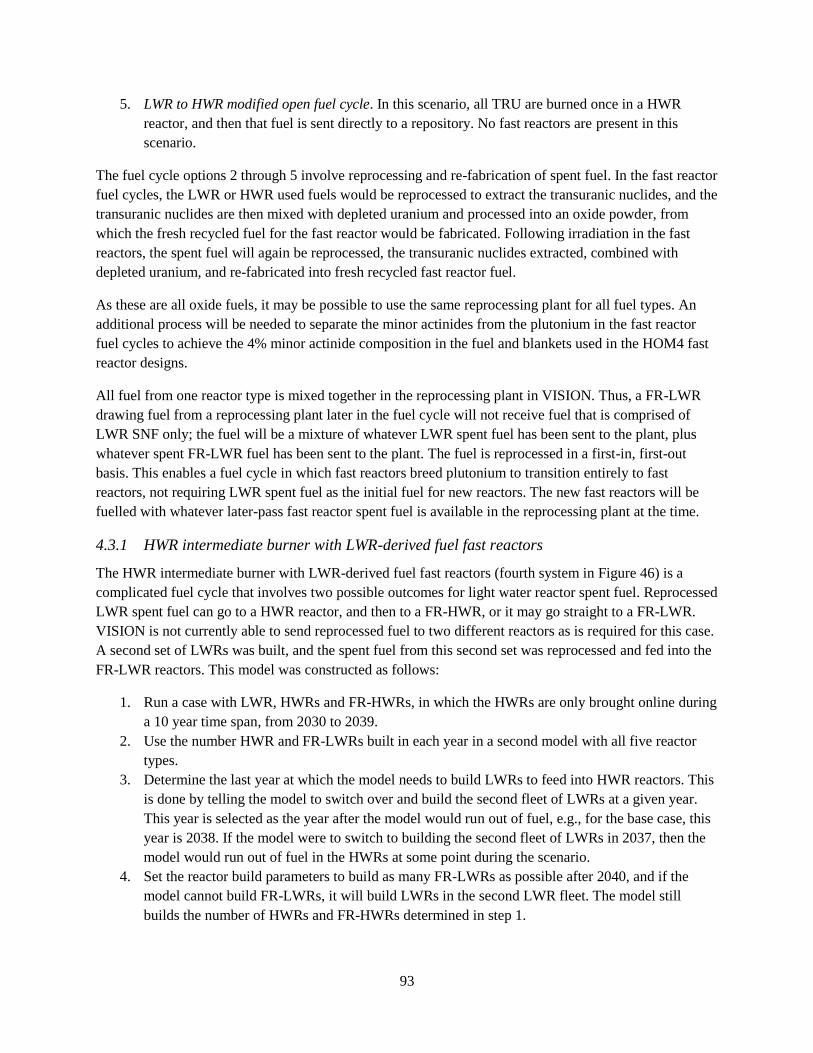
93
5. LWR to HWR modified open fuel cycle. In this scenario, all TRU are burned once in a HWR
reactor, and then that fuel is sent directly to a repository. No fast reactors are present in this
scenario.
The fuel cycle options 2 through 5 involve reprocessing and re-fabrication of spent fuel. In the fast reactor
fuel cycles, the LWR or HWR used fuels would be reprocessed to extract the transuranic nuclides, and the
transuranic nuclides are then mixed with depleted uranium and processed into an oxide powder, from
which the fresh recycled fuel for the fast reactor would be fabricated. Following irradiation in the fast
reactors, the spent fuel will again be reprocessed, the transuranic nuclides extracted, combined with
depleted uranium, and re-fabricated into fresh recycled fast reactor fuel.
As these are all oxide fuels, it may be possible to use the same reprocessing plant for all fuel types. An
additional process will be needed to separate the minor actinides from the plutonium in the fast reactor
fuel cycles to achieve the 4% minor actinide composition in the fuel and blankets used in the HOM4 fast
reactor designs.
All fuel from one reactor type is mixed together in the reprocessing plant in VISION. Thus, a FR-LWR
drawing fuel from a reprocessing plant later in the fuel cycle will not receive fuel that is comprised of
LWR SNF only; the fuel will be a mixture of whatever LWR spent fuel has been sent to the plant, plus
whatever spent FR-LWR fuel has been sent to the plant. The fuel is reprocessed in a first-in, first-out
basis. This enables a fuel cycle in which fast reactors breed plutonium to transition entirely to fast
reactors, not requiring LWR spent fuel as the initial fuel for new reactors. The new fast reactors will be
fuelled with whatever later-pass fast reactor spent fuel is available in the reprocessing plant at the time.
4.3.1 HWR intermediate burner with LWR-derived fuel fast reactors
The HWR intermediate burner with LWR-derived fuel fast reactors (fourth system in Figure 46) is a
complicated fuel cycle that involves two possible outcomes for light water reactor spent fuel. Reprocessed
LWR spent fuel can go to a HWR reactor, and then to a FR-HWR, or it may go straight to a FR-LWR.
VISION is not currently able to send reprocessed fuel to two different reactors as is required for this case.
A second set of LWRs was built, and the spent fuel from this second set was reprocessed and fed into the
FR-LWR reactors. This model was constructed as follows:
1. Run a case with LWR, HWRs and FR-HWRs, in which the HWRs are only brought online during
a 10 year time span, from 2030 to 2039.
2. Use the number HWR and FR-LWRs built in each year in a second model with all five reactor
types.
3. Determine the last year at which the model needs to build LWRs to feed into HWR reactors. This
is done by telling the model to switch over and build the second fleet of LWRs at a given year.
This year is selected as the year after the model would run out of fuel, e.g., for the base case, this
year is 2038. If the model were to switch to building the second fleet of LWRs in 2037, then the
model would run out of fuel in the HWRs at some point during the scenario.
4. Set the reactor build parameters to build as many FR-LWRs as possible after 2040, and if the
model cannot build FR-LWRs, it will build LWRs in the second LWR fleet. The model still
builds the number of HWRs and FR-HWRs determined in step 1.
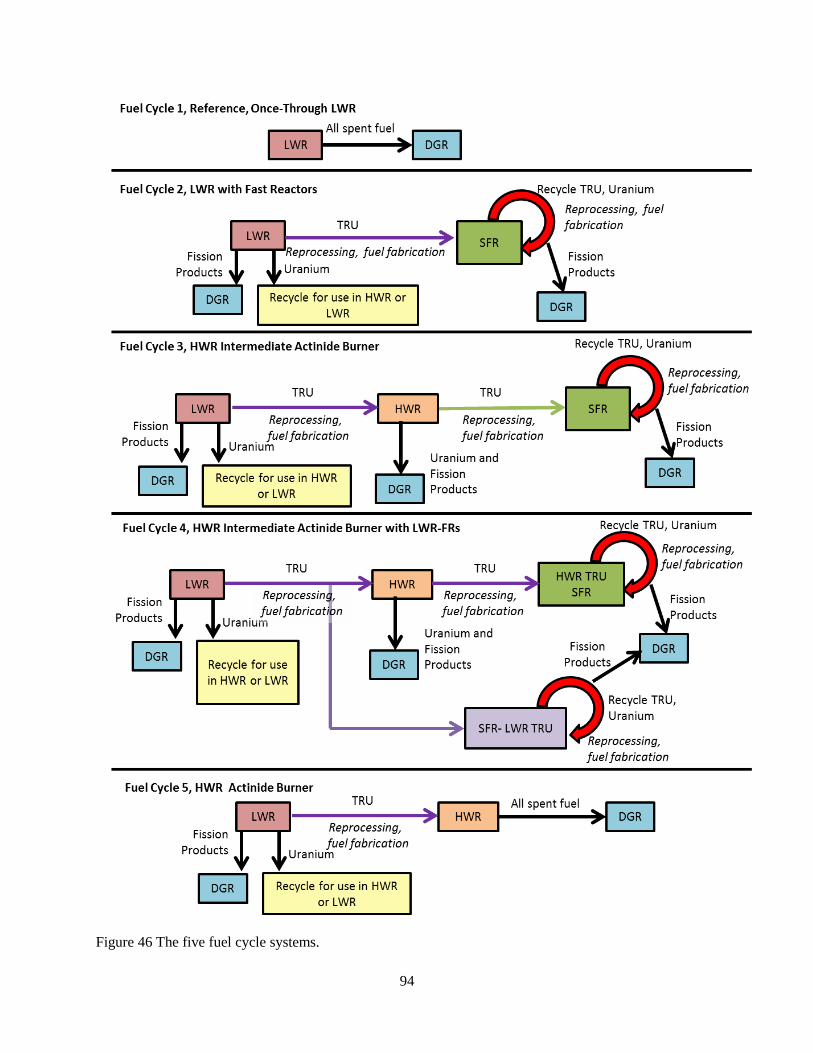
94
Figure 46 The five fuel cycle systems.
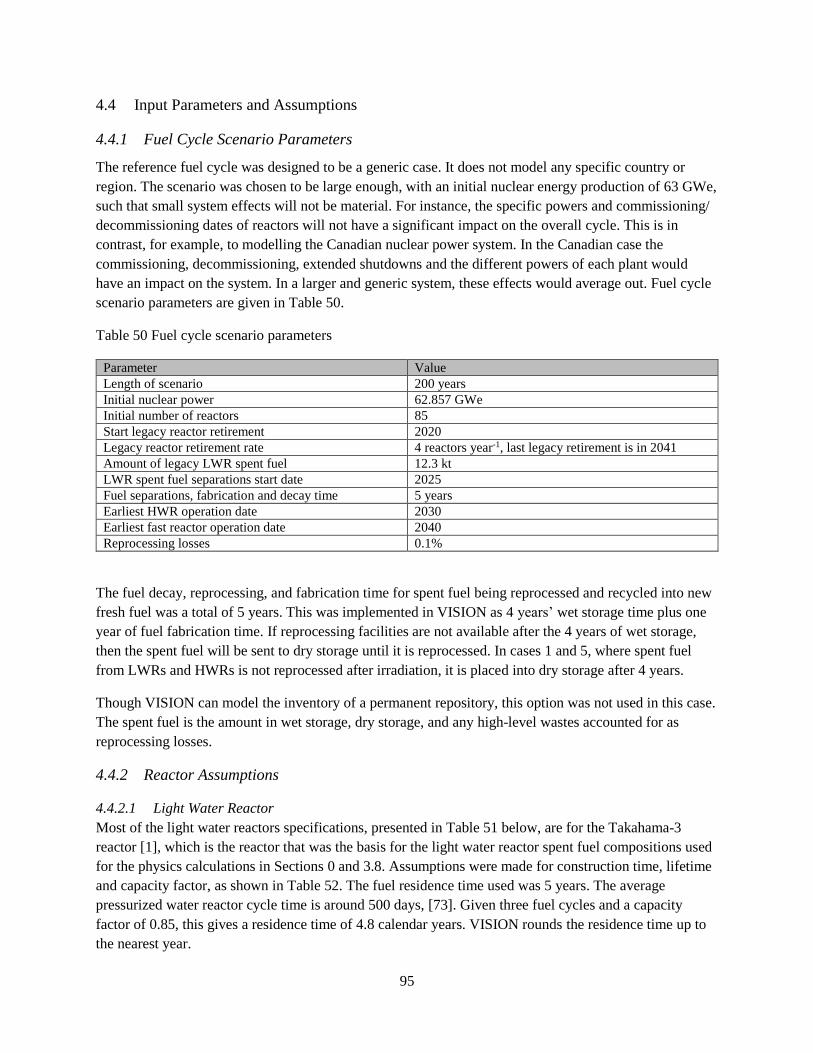
95
4.4 Input Parameters and Assumptions
4.4.1 Fuel Cycle Scenario Parameters
The reference fuel cycle was designed to be a generic case. It does not model any specific country or
region. The scenario was chosen to be large enough, with an initial nuclear energy production of 63 GWe,
such that small system effects will not be material. For instance, the specific powers and commissioning/
decommissioning dates of reactors will not have a significant impact on the overall cycle. This is in
contrast, for example, to modelling the Canadian nuclear power system. In the Canadian case the
commissioning, decommissioning, extended shutdowns and the different powers of each plant would
have an impact on the system. In a larger and generic system, these effects would average out. Fuel cycle
scenario parameters are given in Table 50.
Table 50 Fuel cycle scenario parameters
Parameter Value
Length of scenario 200 years
Initial nuclear power 62.857 GWe
Initial number of reactors 85
Start legacy reactor retirement 2020
Legacy reactor retirement rate 4 reactors year-1, last legacy retirement is in 2041
Amount of legacy LWR spent fuel 12.3 kt
LWR spent fuel separations start date 2025
Fuel separations, fabrication and decay time 5 years
Earliest HWR operation date 2030
Earliest fast reactor operation date 2040
Reprocessing losses 0.1%
The fuel decay, reprocessing, and fabrication time for spent fuel being reprocessed and recycled into new
fresh fuel was a total of 5 years. This was implemented in VISION as 4 years’ wet storage time plus one
year of fuel fabrication time. If reprocessing facilities are not available after the 4 years of wet storage,
then the spent fuel will be sent to dry storage until it is reprocessed. In cases 1 and 5, where spent fuel
from LWRs and HWRs is not reprocessed after irradiation, it is placed into dry storage after 4 years.
Though VISION can model the inventory of a permanent repository, this option was not used in this case.
The spent fuel is the amount in wet storage, dry storage, and any high-level wastes accounted for as
reprocessing losses.
4.4.2 Reactor Assumptions
4.4.2.1 Light Water Reactor
Most of the light water reactors specifications, presented in Table 51 below, are for the Takahama-3
reactor [1], which is the reactor that was the basis for the light water reactor spent fuel compositions used
for the physics calculations in Sections 0 and 3.8. Assumptions were made for construction time, lifetime
and capacity factor, as shown in Table 52. The fuel residence time used was 5 years. The average
pressurized water reactor cycle time is around 500 days, [73]. Given three fuel cycles and a capacity
factor of 0.85, this gives a residence time of 4.8 calendar years. VISION rounds the residence time up to
the nearest year.

96
Table 51 Light water reactor parameters for the Takahama-3 reactor used in the fuel cycle scenarios
Parameter Value
Initial enrichment 4.1wt% U-235
Electrical power 870 MWe
Thermal Power 2652 MWth
Thermal efficiency 0.328
Burnup 47.03 MWd kg-1
Table 52 Assumed light water reactor fuel cycle parameters
Parameter Value
Construction Time 5 years
Reactor Lifetime 60 years
Capacity factor 0.85 (Median CF PWR performance 2008-2012,
Appendix 2, from [74])
Fuel residence time 5 years
4.4.2.2 Heavy Water Reactor
The heavy water reactor parameters are based on the Enhanced CANDU 6 reactor, which was used for the
physics modeling in Section 0, and are given in Table 53. The HWR lifetime is characteristic of a reactor
with a refurbishment at midlife. The refurbishment and associated outage time are not modeled.
Table 53 Heavy water reactor parameters used in the fuel cycle scenario studies
Parameter Value
Initial fuel LWR spent transuranics, mixed with natural uranium
Electrical power 740 MWe [75]
Thermal Power 2084 MWth [75]
Thermal efficiency 0.355
Burnup 44.7 MWd kg-1
Construction Time 5 years
Reactor Lifetime 60 years
Capacity factor 0.92 [75]
4.4.2.3 Fast Reactor
The fast reactor parameters are based on the European Sodium Cooled Fast Reactor (ESFR), which was
used for the physics modeling in Section 2.10, and are given in Table 54. There is some discrepancy in
the literature on the capacity factor for this reactor, [76] has 0.80, whereas the “Availability objective” in
[77] is 0.90. The higher value of 0.90 was chosen for this work because a Generation-IV reactor is
anticipated to have a capacity factor that is at least as good as current reactors. The best quartile PWR is
0.90, from [74].
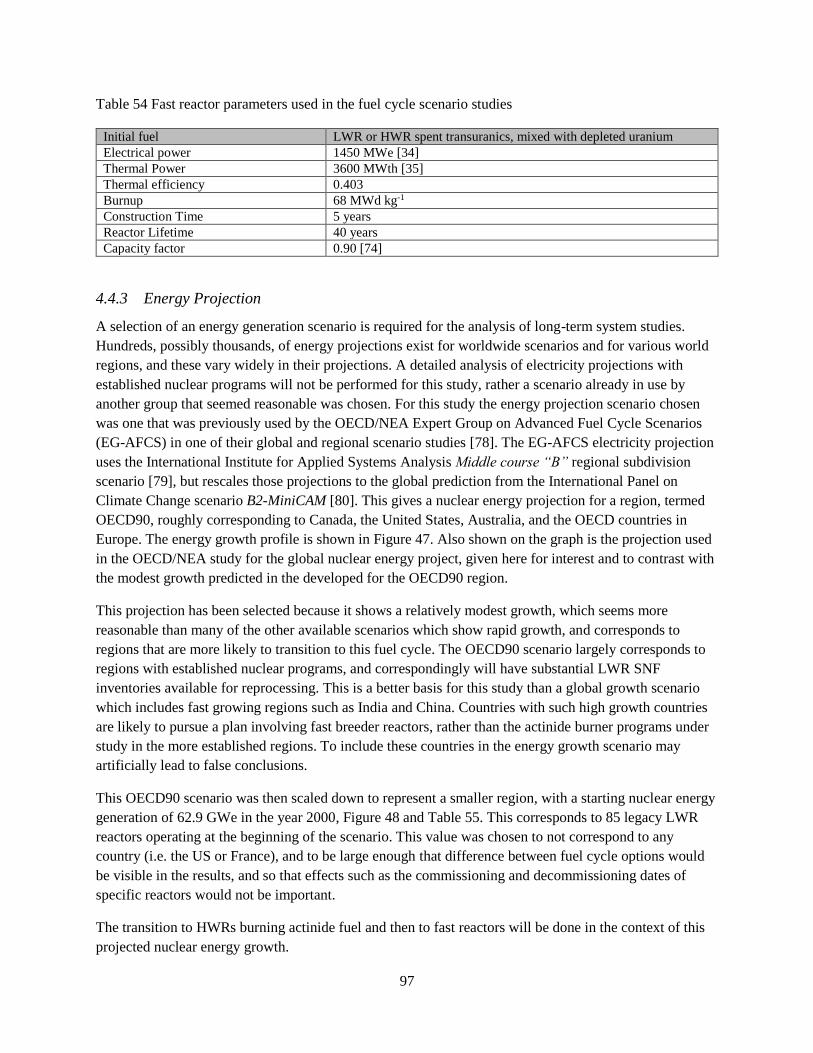
97
Table 54 Fast reactor parameters used in the fuel cycle scenario studies
Initial fuel LWR or HWR spent transuranics, mixed with depleted uranium
Electrical power 1450 MWe [34]
Thermal Power 3600 MWth [35]
Thermal efficiency 0.403
Burnup 68 MWd kg-1
Construction Time 5 years
Reactor Lifetime 40 years
Capacity factor 0.90 [74]
4.4.3 Energy Projection
A selection of an energy generation scenario is required for the analysis of long-term system studies.
Hundreds, possibly thousands, of energy projections exist for worldwide scenarios and for various world
regions, and these vary widely in their projections. A detailed analysis of electricity projections with
established nuclear programs will not be performed for this study, rather a scenario already in use by
another group that seemed reasonable was chosen. For this study the energy projection scenario chosen
was one that was previously used by the OECD/NEA Expert Group on Advanced Fuel Cycle Scenarios
(EG-AFCS) in one of their global and regional scenario studies [78]. The EG-AFCS electricity projection
uses the International Institute for Applied Systems Analysis Middle course “B” regional subdivision
scenario [79], but rescales those projections to the global prediction from the International Panel on
Climate Change scenario B2-MiniCAM [80]. This gives a nuclear energy projection for a region, termed
OECD90, roughly corresponding to Canada, the United States, Australia, and the OECD countries in
Europe. The energy growth profile is shown in Figure 47. Also shown on the graph is the projection used
in the OECD/NEA study for the global nuclear energy project, given here for interest and to contrast with
the modest growth predicted in the developed for the OECD90 region.
This projection has been selected because it shows a relatively modest growth, which seems more
reasonable than many of the other available scenarios which show rapid growth, and corresponds to
regions that are more likely to transition to this fuel cycle. The OECD90 scenario largely corresponds to
regions with established nuclear programs, and correspondingly will have substantial LWR SNF
inventories available for reprocessing. This is a better basis for this study than a global growth scenario
which includes fast growing regions such as India and China. Countries with such high growth countries
are likely to pursue a plan involving fast breeder reactors, rather than the actinide burner programs under
study in the more established regions. To include these countries in the energy growth scenario may
artificially lead to false conclusions.
This OECD90 scenario was then scaled down to represent a smaller region, with a starting nuclear energy
generation of 62.9 GWe in the year 2000, Figure 48 and Table 55. This corresponds to 85 legacy LWR
reactors operating at the beginning of the scenario. This value was chosen to not correspond to any
country (i.e. the US or France), and to be large enough that difference between fuel cycle options would
be visible in the results, and so that effects such as the commissioning and decommissioning dates of
specific reactors would not be important.
The transition to HWRs burning actinide fuel and then to fast reactors will be done in the context of this
projected nuclear energy growth.

98
Figure 47 Nuclear energy growth projection for OECD90 countries [78].
Figure 48 Nuclear power demand used in these scenarios.
0
5000
10000
15000
20000
25000
2000 2050 2100 2150 2200
Nu
cle
ar E
ne
rgy
Ge
ne
rati
on
(TW
he
)
Year
OECD90
WORLD
0
20
40
60
80
100
120
140
160
2000 2050 2100 2150 2200
Nu
cear
Po
we
r D
em
and
(G
We
)
Year
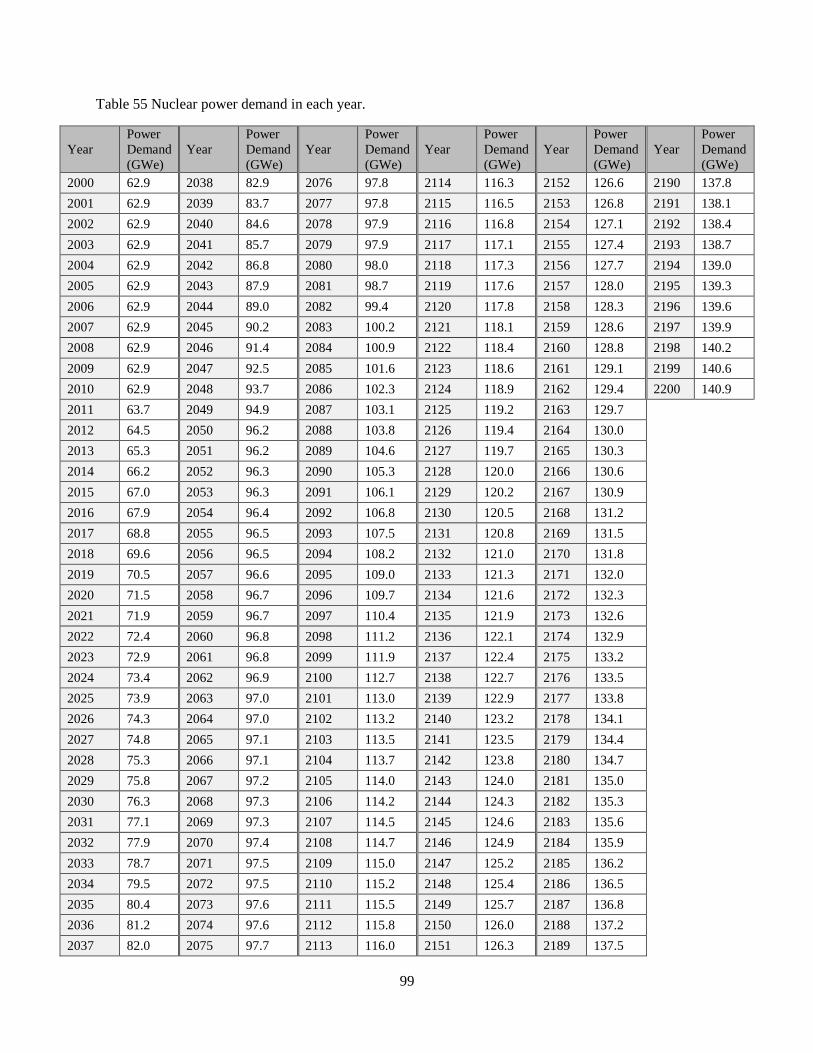
99
Table 55 Nuclear power demand in each year.
Year
Power
Demand
(GWe)
Year
Power
Demand
(GWe)
Year
Power
Demand
(GWe)
Year
Power
Demand
(GWe)
Year
Power
Demand
(GWe)
Year
Power
Demand
(GWe)
2000 62.9 2038 82.9 2076 97.8 2114 116.3 2152 126.6 2190 137.8
2001 62.9 2039 83.7 2077 97.8 2115 116.5 2153 126.8 2191 138.1
2002 62.9 2040 84.6 2078 97.9 2116 116.8 2154 127.1 2192 138.4
2003 62.9 2041 85.7 2079 97.9 2117 117.1 2155 127.4 2193 138.7
2004 62.9 2042 86.8 2080 98.0 2118 117.3 2156 127.7 2194 139.0
2005 62.9 2043 87.9 2081 98.7 2119 117.6 2157 128.0 2195 139.3
2006 62.9 2044 89.0 2082 99.4 2120 117.8 2158 128.3 2196 139.6
2007 62.9 2045 90.2 2083 100.2 2121 118.1 2159 128.6 2197 139.9
2008 62.9 2046 91.4 2084 100.9 2122 118.4 2160 128.8 2198 140.2
2009 62.9 2047 92.5 2085 101.6 2123 118.6 2161 129.1 2199 140.6
2010 62.9 2048 93.7 2086 102.3 2124 118.9 2162 129.4 2200 140.9
2011 63.7 2049 94.9 2087 103.1 2125 119.2 2163 129.7
2012 64.5 2050 96.2 2088 103.8 2126 119.4 2164 130.0
2013 65.3 2051 96.2 2089 104.6 2127 119.7 2165 130.3
2014 66.2 2052 96.3 2090 105.3 2128 120.0 2166 130.6
2015 67.0 2053 96.3 2091 106.1 2129 120.2 2167 130.9
2016 67.9 2054 96.4 2092 106.8 2130 120.5 2168 131.2
2017 68.8 2055 96.5 2093 107.5 2131 120.8 2169 131.5
2018 69.6 2056 96.5 2094 108.2 2132 121.0 2170 131.8
2019 70.5 2057 96.6 2095 109.0 2133 121.3 2171 132.0
2020 71.5 2058 96.7 2096 109.7 2134 121.6 2172 132.3
2021 71.9 2059 96.7 2097 110.4 2135 121.9 2173 132.6
2022 72.4 2060 96.8 2098 111.2 2136 122.1 2174 132.9
2023 72.9 2061 96.8 2099 111.9 2137 122.4 2175 133.2
2024 73.4 2062 96.9 2100 112.7 2138 122.7 2176 133.5
2025 73.9 2063 97.0 2101 113.0 2139 122.9 2177 133.8
2026 74.3 2064 97.0 2102 113.2 2140 123.2 2178 134.1
2027 74.8 2065 97.1 2103 113.5 2141 123.5 2179 134.4
2028 75.3 2066 97.1 2104 113.7 2142 123.8 2180 134.7
2029 75.8 2067 97.2 2105 114.0 2143 124.0 2181 135.0
2030 76.3 2068 97.3 2106 114.2 2144 124.3 2182 135.3
2031 77.1 2069 97.3 2107 114.5 2145 124.6 2183 135.6
2032 77.9 2070 97.4 2108 114.7 2146 124.9 2184 135.9
2033 78.7 2071 97.5 2109 115.0 2147 125.2 2185 136.2
2034 79.5 2072 97.5 2110 115.2 2148 125.4 2186 136.5
2035 80.4 2073 97.6 2111 115.5 2149 125.7 2187 136.8
2036 81.2 2074 97.6 2112 115.8 2150 126.0 2188 137.2
2037 82.0 2075 97.7 2113 116.0 2151 126.3 2189 137.5

100
4.4.4 Initial Spent Fuel Inventory
As this scenario begins in the year 2000, it is reasonable to assume an initial spent fuel inventory. This
initial inventory was calculated using the global installed nuclear capacity from [73], Figure 49. This
curve was renormalized to 62.9 GWe in the year 2000, which is the starting nuclear capacity for the
scenario study. These installed capacities were then adjusted for capacity factor, estimated from [74]. The
capacity factors used were: up to 1990, 0.70; 1990-1999, 0.75. The burnup was estimated from Figure 4
of [81]. The burnup values used were 22 GWd t-1 prior to 1975, then a linear interpolation between 22
GWd t-1 in 1975 and 42 GWd t-1 in 1999. The resulting spent fuel inventory at the beginning of the
scenario is 12.3 kt.
Figure 49 Global installed nuclear capacity [73]
4.5 Sensitivity Cases
Four sensitivity cases were modelled to investigate the impact to parameters that could affect the overall
conclusions of the study.
1. Fast reactor power de-rated
2. No legacy spent fuel
3. Capped reprocessing capacity
4. Fast reactor operation delayed until 2050
4.5.1 Power De-Rating Cases
The findings in Section 3.10 show that the fast reactor models with LWR spent fuel that has passed
through a HWR and also the later passes of LWR spent fuel through the fast reactor have fuel assemblies
with much higher peak power than the reference fast reactor model. As discussed previously, it is likely
that re-design would fix this problem.
0
50
100
150
200
250
300
350
400
19
54
19
57
19
60
19
63
19
66
19
69
19
72
19
75
19
78
19
81
19
84
19
87
19
90
19
93
19
96
19
99
20
02
20
05
20
08
20
11
Inst
alle
d N
ucl
ear
Cap
acit
y (G
We
)
Year
101
A worst-case scenario would have the fast reactor power reduced in order to lower the power in those
locations. Sensitivity cases for the system studies were performed for this worst-case scenario as follows:
Fast reactor fuelled with LWR-derived fuel: derated by 35%, from 1.45 GWe to 0.9425 GWe.
The fuel residence time was correspondingly increased from 5.6 years to 7.6 years.
For cases with the fast reactor using LWRCANDU-derived fuel the power was derated by 50%
to 0.725 GWe and the fuel residence time was correspondingly increased to 11.2 years.
This case will only impact fuel cycles that contain fast reactors, and so was performed for fuel cycle cases
2, 3, and 4, and not for cases 1 and 5.
4.5.2 No Legacy Spent Fuel
The base scenarios assume that the region has been operating light water reactors since the establishment
of nuclear power. Not every region will have a historic light water reactor fleet, or a legacy spent fuel
inventory of this size. To investigate this impact, sensitivity cases were performed for the extreme case in
which the region has no legacy spent fuel.
4.5.3 Capped Reprocessing Capacity
The base cases assume unlimited reprocessing capacity. Thus, there is a large spike in the first year that
reprocessing plants are brought online, as all the spent fuel that exists in the fuel cycle that could be
needed by the first actinide burner reactors is reprocessed. This allows the scenario to build many new
reactors quickly, as all of this recycled fuel is available at the earliest date. This obviously presents an
issue in the fuel cycle scenario, as a region is not going to build a plant that is 20 times the capacity that
they will require for the balance of the scenario.
This high initial requirement of reprocessing capacity does not necessarily represent a problem in the fuel
cycle. It could be that the region has sent fuel offshore to be reprocessed until they can commission their
own plant, or there is a backlog of separated fuel. Both situations exist in the world today. However, it is
easy to imagine a region in which this would not occur. Political or transportation reasons could prevent
fuel from being sent offshore, for example. To investigate this, a sensitivity case was run in which a limit
was placed on the reprocessing capacity of light water reactor spent fuel.
Only the reprocessing capacity of light water reactor fuel was capped. The reprocessing capacity of the
other reactors does not experience this large spike. The reprocessing capacity for the advanced reactor
fuel needs to be free to grow with time, as nuclear power in the scenario grows and more advanced
reactors come online, and therefore, more fuel and more reprocessing capacity is required.
The limits on reprocessing capacity were chosen to enable the fastest growth of advanced reactors, while
operating the reprocessing plants at, or close to, peak capacity. The cap was set as the maximum capacity
at which the plant starts to experience some years in which it is not used 100%, rounded to the nearest
0.1kt. That is, the plant does not operate at 100% every year; it is set to be big enough so that some years
run at less than peak capacity. The reprocessing capacity limit was 2.5 kt year-1 for all cases.

102
4.5.4 Delayed Fast Reactor Operation Date
The availability of fast reactors is a source of uncertainty in this work. Though there are fast reactors in
commercial operation today, they are not widely in use, nor in use as actinide burners. Fast reactors as
actinide burners are in the development stages, and a significant amount of research, development and
design work is required before they can be deployed.
To investigate the impact of a delay in the operation of fast reactors, the earliest fast reactor operation
date was changed from 2040 to 2050. The HWR earliest operation date was held constant at 2030. This
doubles the amount of time that HWRs are in operation prior to fast reactor deployment.
4.6 Base Case Results
The following sections contain figures for each of the five base cases for the following results:
Electrical capacity for each reactor type in each year
Number of operating reactors of each type in each year
Number of new reactors brought online of each type in each year
Cumulative uranium consumption by each reactor type
Mass of fuel reprocessed in each year by each fuel type in each year
Source of americium used for fuel fabrication
Source of curium used for fuel fabrication
Figures comparing various characteristics of the fuel cycles follow in Section 4.6.6.
The electrical capacity and number of operating reactor figures (Figure 50, Figure 51, Figure 54, Figure
55, Figure 62, Figure 63, Figure 70, Figure 71, Figure 78, and Figure 79) show the evolution of the
composition of the fuel cycle. For case 1, the once-through LWR scenario, this is simple, and just shows
LWR reactors at all times. For the remainder of the scenarios, the transition to the other reactor types can
been seen. In cases 3 to 5, the HWRs begin operation in the year 2030. In cases 2, 3, and 4, fast reactors
start to appear in the year 2040.
Figure 52, Figure 56, Figure 64, Figure 72, and Figure 80 show the number of new reactors of each type
brought online in each year. In the simpler fuel cycles, 1, 2, 3, and 5, show clearly the waves of new build
reactors, beginning around 2020, 2080, and 2140. The later waves become less distinct in the more
complicated fuel cycles, particularly in case 4, where many different reactor types of different powers
even out this effect. This wave effect is a consequence of the decommissioning schedule of the initial 85
legacy LWR reactors. This wave phenomenon is realistic; most of the reactors around the world today
were built in the late 1970s and early 1980s (Figure 49). Those plants can be expected to be
decommissioned between 2020 and 2040.
These waves of new build reactors affect when new reactor types can be constructed, given the required
electrical capacity of the grid. The start of the 2020 new build wave is always entirely LWRs, as no other
reactor types are yet available to construct. The availability of HWRs alone, 2030 to 2040, lies in the
latter part of the crest of the first new build wave. This enables a relatively rapid growth of HWRs, though
not as much as if the availability of HWRs corresponded to the beginning of the crest.
103
A rapid growth of fast reactors is seen in cases 2, 3, 4 around the years 2080 and more dramatically
around 2150, as fast reactors are available for these new build waves. By 2150 there is enough plutonium
available that has been bred from existing fast reactors to fuel new fast reactors, without initial LWR SNF
input. The previous generation of LWRs can then be decommissioned, with no LWRs needed to replace
them. The entire fuel cycle can be comprised of fast reactors alone.
Plots of cumulative uranium ore consumption for each reactor type are given in Figure 53, Figure 57,
Figure 65, Figure 73, and Figure 81. A comparative plot with the total cumulative uranium consumption
for each case is shown and discussed in Section 4.6.6. The figures in this section show that nearly all the
uranium is used by LWRs. A small amount is used by the HWRs, as the HWR fuel is transuranic
elements from LWR spent fuel mixed with natural uranium. The amount of uranium used by HWRs is
3% of the total uranium consumption in the LWR to HWR modified open fuel cycle case (case 5), which
is the case with the most HWRs.
The amount of each fuel type reprocessed in each year is shown in Figure 58, Figure 66, Figure 74, and
Figure 82. As case 1, the LWR once-through scenario, does not involve reprocessing, there is no
corresponding figure for that case. In that scenario, the spent fuel would be sent straight to a deep
geological repository. In each reprocessing case, there is a large peak, corresponding to 45 kt of LWR
spent fuel reprocessed in the first year of reprocessing, 2025. As this peak dominates the figures, a second
set of figures are provided, which magnify the y-axis, Figure 59, Figure 67, Figure 75, and Figure 83.
This peak in the first year is a result of the unlimited reprocessing capacity used in these scenarios. This
has been discussed above, in Section 4.5.3, and will be examined in a sensitivity study, Section 4.7.3.
Not surprisingly, the shapes of the mass of fuel reprocessed curves for the various fuel types roughly
follow the electrical capacity and number of operating reactor curves for those reactor types.
As the fast reactors take an initial amount of minor actinides (4 wt%) that is greater than it is produced by
the LWR or HWRs, the scenario pulls minor actinides from outside the scenario in order to fabricate fuel
after it runs out. The source of americium, internal or external to the scenario, is shown for each year in
Figure 60, Figure 68, Figure 76, and Figure 84. The source of curium is shown in Figure 61, Figure 69,
Figure 77, and Figure 85. A comparison between the scenarios will be expanded upon in Section 4.6.6.
In each case the scenario can run on internal americium for some time, until 2082 (case 4, HWR
intermediate burner with LWR-derived fuel fast reactors) to 2097 (case 3, HWR intermediate burner)
before an external source of americium is needed. Once the external source is required, it comprises a
substantial, though fluctuating, portion of the americium used for fuel fabrication, typically between 20
and 50% each year. This initial need of external americium corresponds to the second wave of new
reactor builds. Cases 2, 3, and 4 also show an increase in americium in fuel fabrication around year 2150.
More americium is needed when the scenario builds a new wave of reactors because when these reactors
come online a full core of fuel is required, rather than the lower annual amount for refuelling required
once the reactor is operating. Case 5, LWR to HWR modified open fuel cycle, experiences a decrease in
the total amount of americium needed for fuel fabrication in the year 2092, because at this time there is a
dip in the number of HWRs in the scenario, Figure 79.
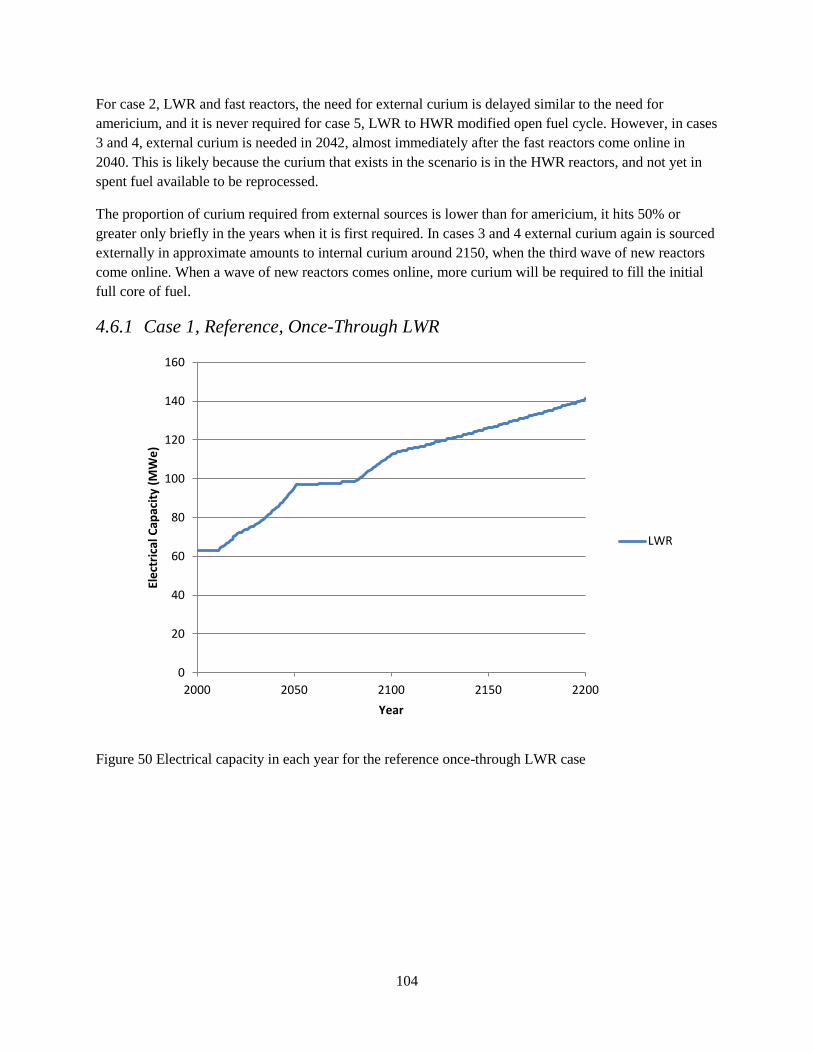
104
For case 2, LWR and fast reactors, the need for external curium is delayed similar to the need for
americium, and it is never required for case 5, LWR to HWR modified open fuel cycle. However, in cases
3 and 4, external curium is needed in 2042, almost immediately after the fast reactors come online in
2040. This is likely because the curium that exists in the scenario is in the HWR reactors, and not yet in
spent fuel available to be reprocessed.
The proportion of curium required from external sources is lower than for americium, it hits 50% or
greater only briefly in the years when it is first required. In cases 3 and 4 external curium again is sourced
externally in approximate amounts to internal curium around 2150, when the third wave of new reactors
come online. When a wave of new reactors comes online, more curium will be required to fill the initial
full core of fuel.
4.6.1 Case 1, Reference, Once-Through LWR
Figure 50 Electrical capacity in each year for the reference once-through LWR case
0
20
40
60
80
100
120
140
160
2000 2050 2100 2150 2200
Ele
ctri
cal C
apac
ity
(MW
e)
Year
LWR
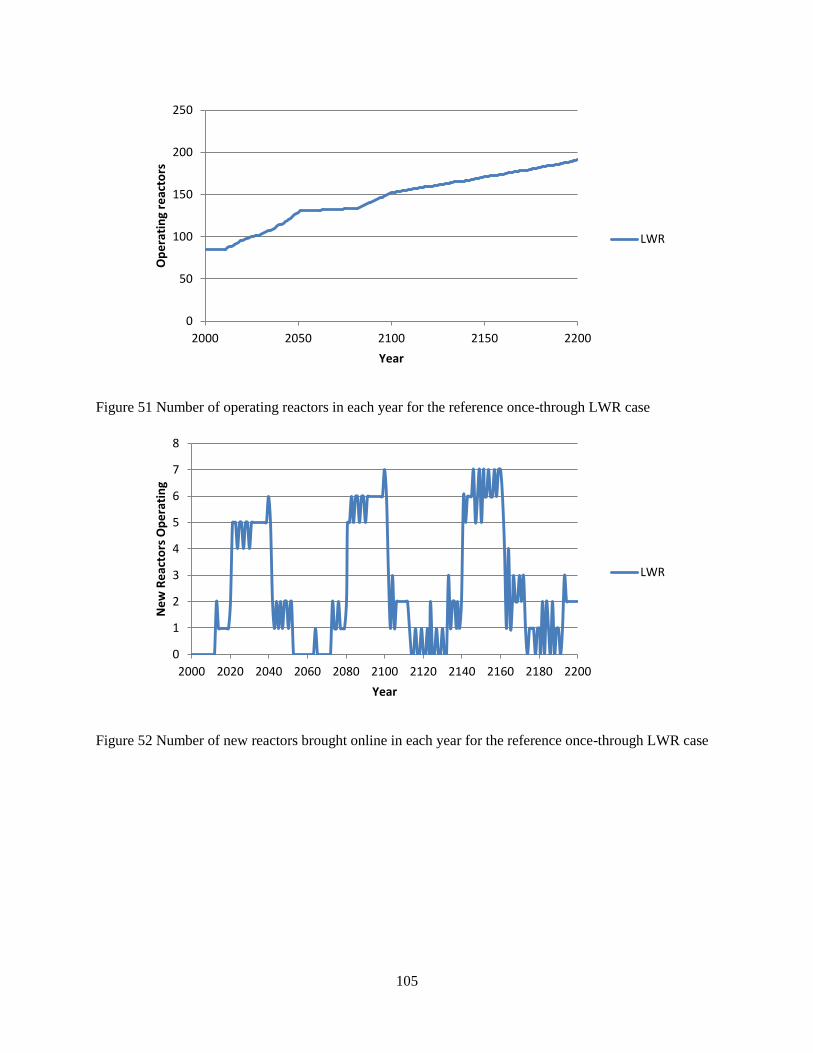
105
Figure 51 Number of operating reactors in each year for the reference once-through LWR case
Figure 52 Number of new reactors brought online in each year for the reference once-through LWR case
0
50
100
150
200
250
2000 2050 2100 2150 2200
Op
era
tin
g re
acto
rs
Year
LWR
0
1
2
3
4
5
6
7
8
2000 2020 2040 2060 2080 2100 2120 2140 2160 2180 2200
Ne
w R
eac
tors
Op
era
tin
g
Year
LWR
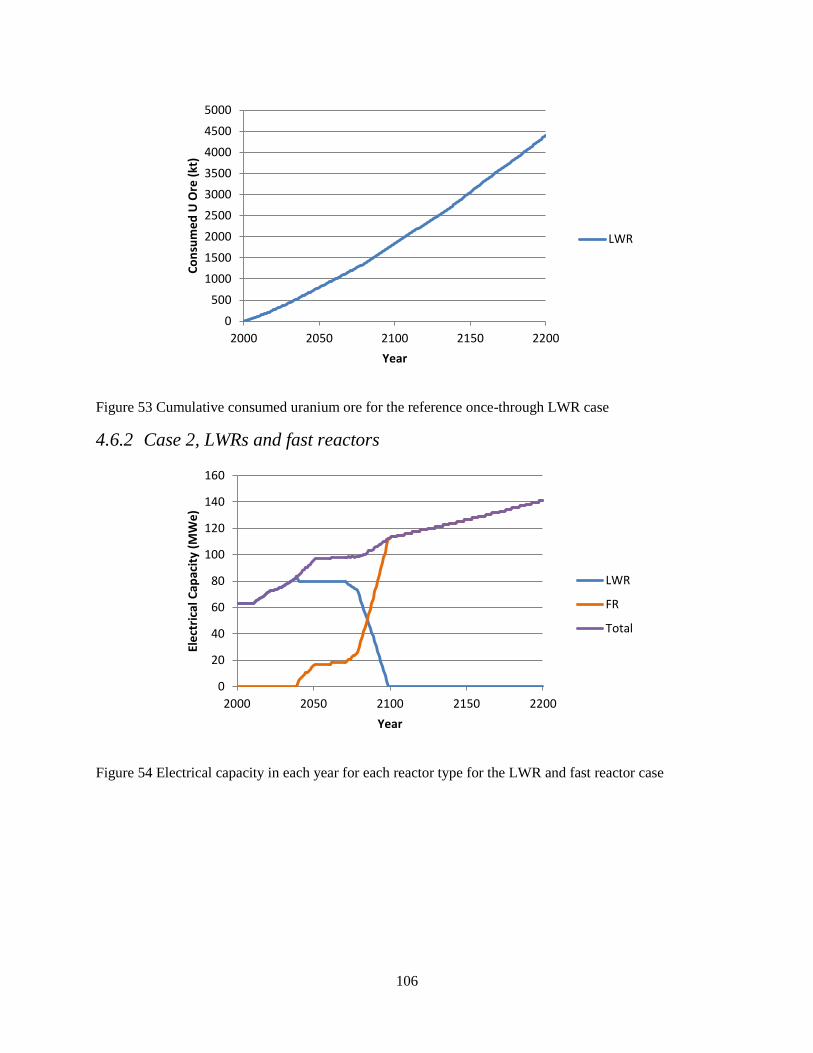
106
Figure 53 Cumulative consumed uranium ore for the reference once-through LWR case
4.6.2 Case 2, LWRs and fast reactors
Figure 54 Electrical capacity in each year for each reactor type for the LWR and fast reactor case
0
500
1000
1500
2000
2500
3000
3500
4000
4500
5000
2000 2050 2100 2150 2200
Co
nsu
me
d U
Ore
(kt
)
Year
LWR
0
20
40
60
80
100
120
140
160
2000 2050 2100 2150 2200
Ele
ctri
cal C
apac
ity
(MW
e)
Year
LWR
FR
Total

107
Figure 55 Number of operating reactors in each year for each reactor type for the LWR and fast reactor
case
Figure 56 Number of new reactors brought online in each year for each reactor type for the LWR and fast
reactor case
0
20
40
60
80
100
120
140
2000 2050 2100 2150 2200
Op
era
tin
g R
eac
tors
Year
LWR
FR
Total
0
1
2
3
4
5
6
7
8
2000 2020 2040 2060 2080 2100 2120 2140 2160 2180 2200
Ne
w R
eac
tors
Op
era
tin
g
Year
LWR
FR
Total

108
Figure 57 Cumulative consumed uranium ore for each reactor type for the LWR and fast reactor case
Figure 58 Mass of fuel from each reactor type reprocessed in each year for the LWR and fast reactor case
0
200
400
600
800
1000
1200
1400
2000 2050 2100 2150 2200
Co
nsu
me
d U
Ore
(kt
)
Year
LWR
FR
Total
0
5
10
15
20
25
30
35
40
45
50
2000 2050 2100 2150 2200
Mas
s o
f Fu
el R
ep
roce
sse
d (
kt)
Year
LWR
FR
Total
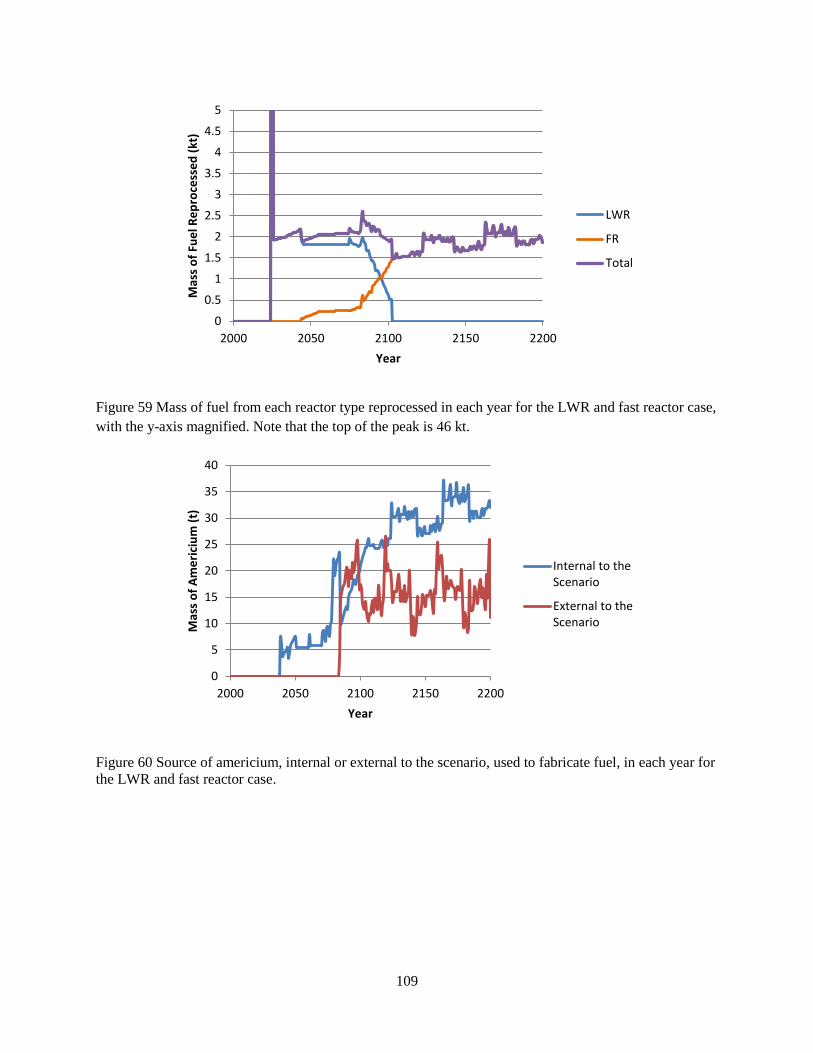
109
Figure 59 Mass of fuel from each reactor type reprocessed in each year for the LWR and fast reactor case,
with the y-axis magnified. Note that the top of the peak is 46 kt.
Figure 60 Source of americium, internal or external to the scenario, used to fabricate fuel, in each year for
the LWR and fast reactor case.
0
0.5
1
1.5
2
2.5
3
3.5
4
4.5
5
2000 2050 2100 2150 2200
Mas
s o
f Fu
el R
ep
roce
sse
d (
kt)
Year
LWR
FR
Total
0
5
10
15
20
25
30
35
40
2000 2050 2100 2150 2200
Mas
s o
f A
me
rici
um
(t)
Year
Internal to theScenario
External to theScenario
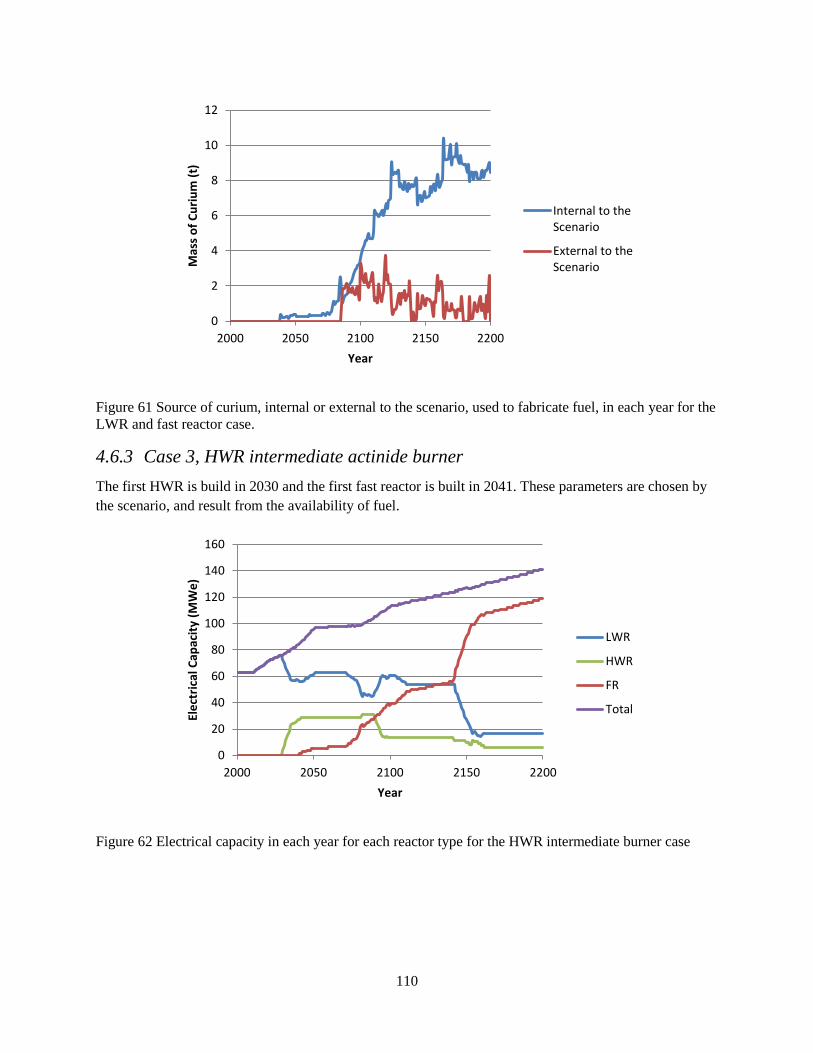
110
Figure 61 Source of curium, internal or external to the scenario, used to fabricate fuel, in each year for the
LWR and fast reactor case.
4.6.3 Case 3, HWR intermediate actinide burner
The first HWR is build in 2030 and the first fast reactor is built in 2041. These parameters are chosen by
the scenario, and result from the availability of fuel.
Figure 62 Electrical capacity in each year for each reactor type for the HWR intermediate burner case
0
2
4
6
8
10
12
2000 2050 2100 2150 2200
Mas
s o
f C
uri
um
(t)
Year
Internal to theScenario
External to theScenario
0
20
40
60
80
100
120
140
160
2000 2050 2100 2150 2200
Ele
ctri
cal C
apac
ity
(MW
e)
Year
LWR
HWR
FR
Total
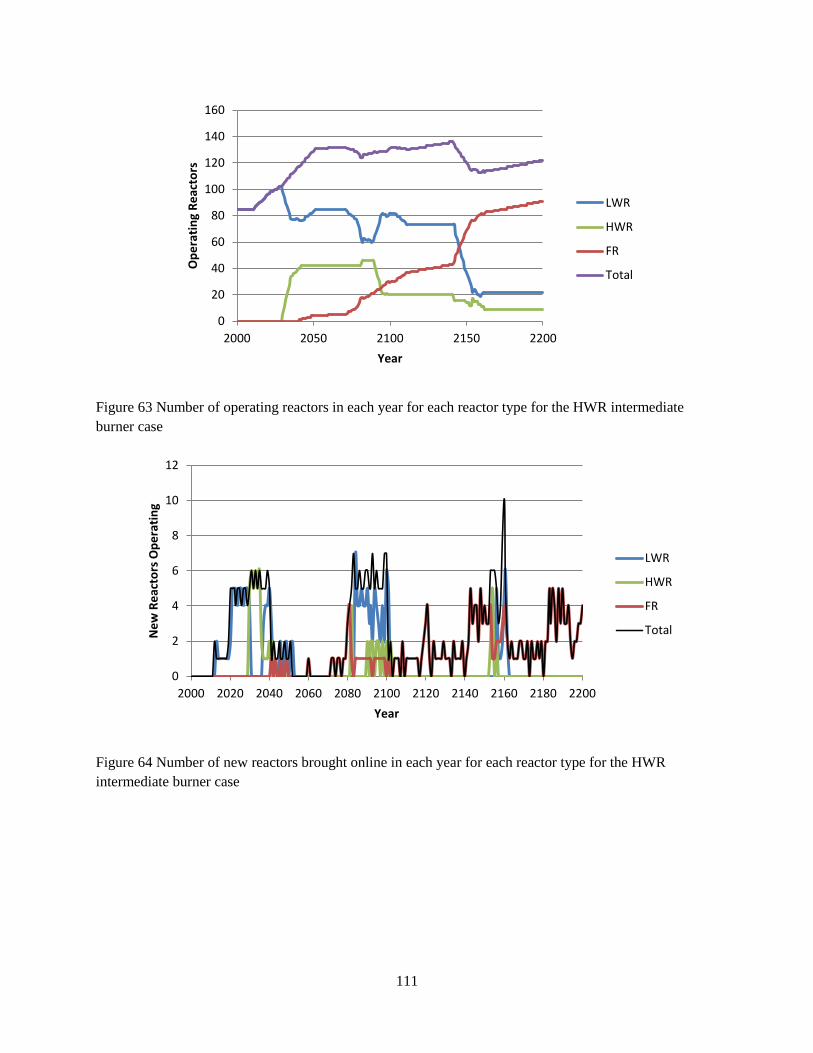
111
Figure 63 Number of operating reactors in each year for each reactor type for the HWR intermediate
burner case
Figure 64 Number of new reactors brought online in each year for each reactor type for the HWR
intermediate burner case
0
20
40
60
80
100
120
140
160
2000 2050 2100 2150 2200
Op
era
tin
g R
eac
tors
Year
LWR
HWR
FR
Total
0
2
4
6
8
10
12
2000 2020 2040 2060 2080 2100 2120 2140 2160 2180 2200
Ne
w R
eac
tors
Op
era
tin
g
Year
LWR
HWR
FR
Total
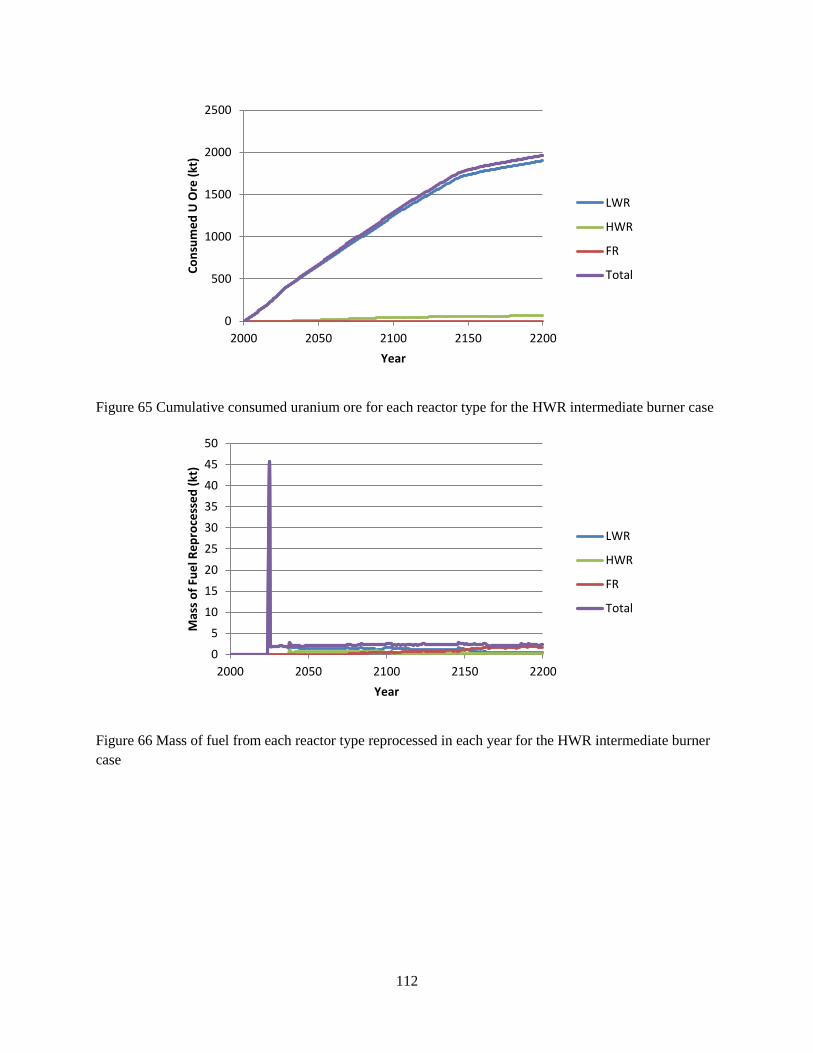
112
Figure 65 Cumulative consumed uranium ore for each reactor type for the HWR intermediate burner case
Figure 66 Mass of fuel from each reactor type reprocessed in each year for the HWR intermediate burner
case
0
500
1000
1500
2000
2500
2000 2050 2100 2150 2200
Co
nsu
me
d U
Ore
(kt
)
Year
LWR
HWR
FR
Total
0
5
10
15
20
25
30
35
40
45
50
2000 2050 2100 2150 2200
Mas
s o
f Fu
el R
ep
roce
sse
d (
kt)
Year
LWR
HWR
FR
Total
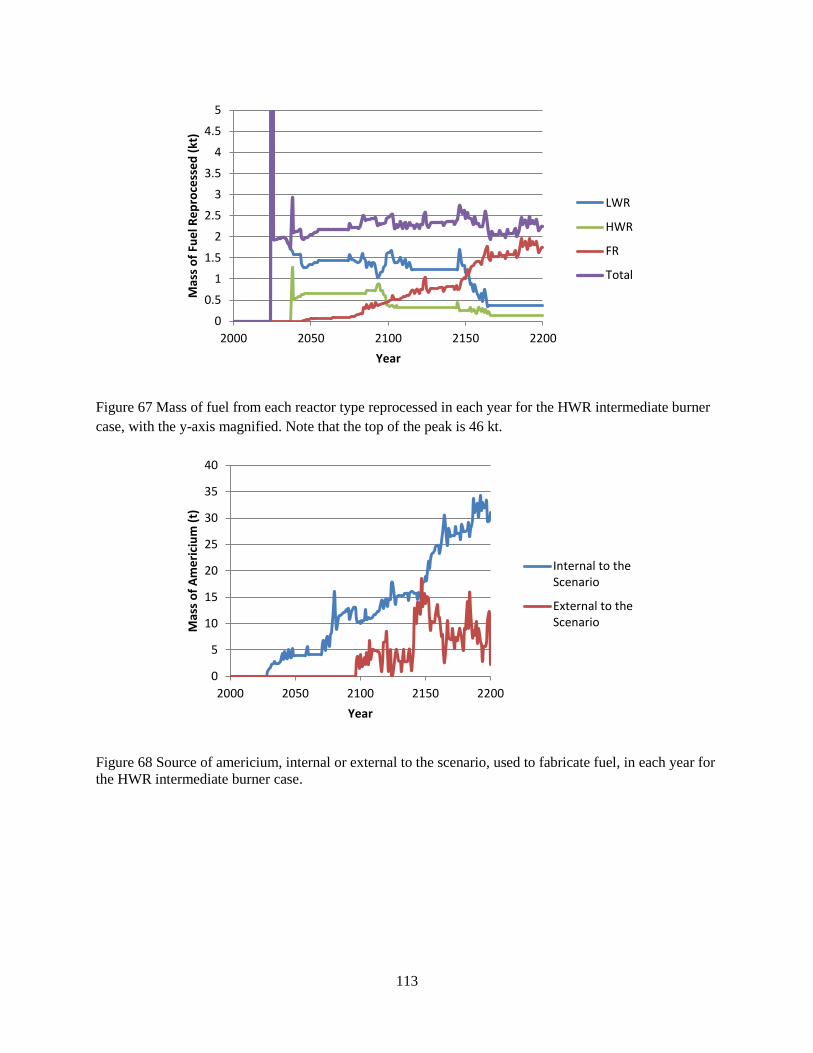
113
Figure 67 Mass of fuel from each reactor type reprocessed in each year for the HWR intermediate burner
case, with the y-axis magnified. Note that the top of the peak is 46 kt.
Figure 68 Source of americium, internal or external to the scenario, used to fabricate fuel, in each year for
the HWR intermediate burner case.
0
0.5
1
1.5
2
2.5
3
3.5
4
4.5
5
2000 2050 2100 2150 2200
Mas
s o
f Fu
el R
ep
roce
sse
d (
kt)
Year
LWR
HWR
FR
Total
0
5
10
15
20
25
30
35
40
2000 2050 2100 2150 2200
Mas
s o
f A
me
rici
um
(t)
Year
Internal to theScenario
External to theScenario
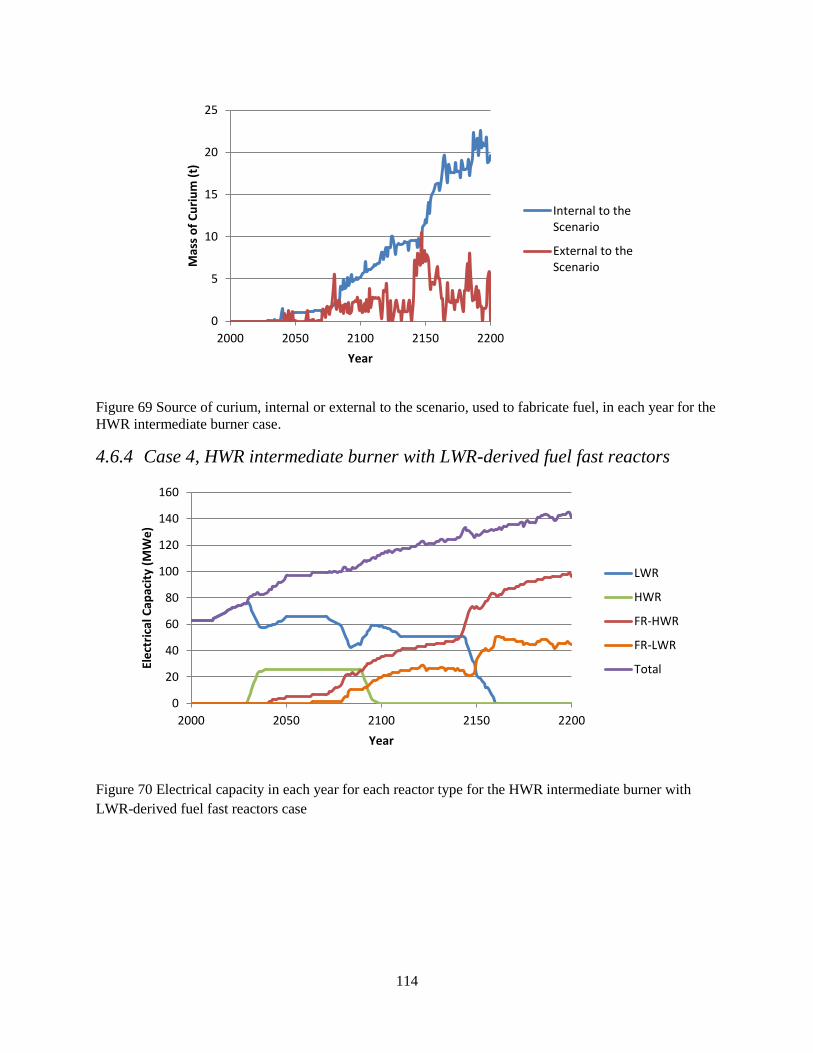
114
Figure 69 Source of curium, internal or external to the scenario, used to fabricate fuel, in each year for the
HWR intermediate burner case.
4.6.4 Case 4, HWR intermediate burner with LWR-derived fuel fast reactors
Figure 70 Electrical capacity in each year for each reactor type for the HWR intermediate burner with
LWR-derived fuel fast reactors case
0
5
10
15
20
25
2000 2050 2100 2150 2200
Mas
s o
f C
uri
um
(t)
Year
Internal to theScenario
External to theScenario
0
20
40
60
80
100
120
140
160
2000 2050 2100 2150 2200
Ele
ctri
cal C
apac
ity
(MW
e)
Year
LWR
HWR
FR-HWR
FR-LWR
Total
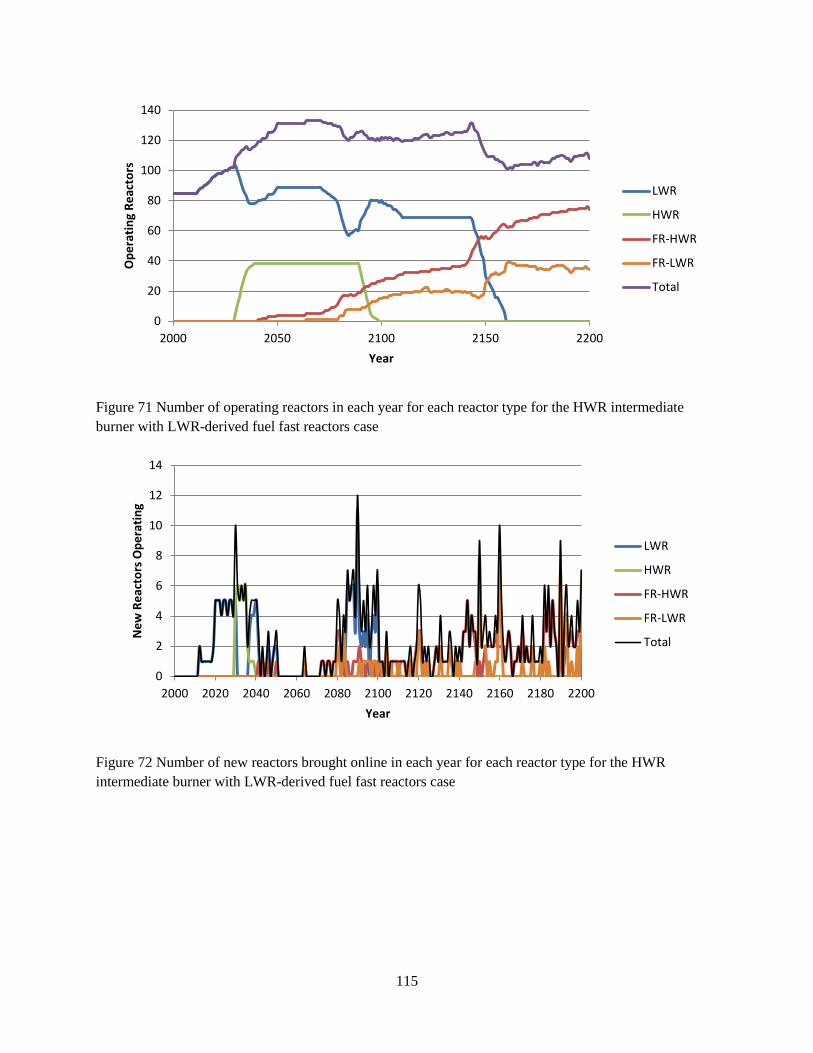
115
Figure 71 Number of operating reactors in each year for each reactor type for the HWR intermediate
burner with LWR-derived fuel fast reactors case
Figure 72 Number of new reactors brought online in each year for each reactor type for the HWR
intermediate burner with LWR-derived fuel fast reactors case
0
20
40
60
80
100
120
140
2000 2050 2100 2150 2200
Op
era
tin
g R
eac
tors
Year
LWR
HWR
FR-HWR
FR-LWR
Total
0
2
4
6
8
10
12
14
2000 2020 2040 2060 2080 2100 2120 2140 2160 2180 2200
Ne
w R
eac
tors
Op
era
tin
g
Year
LWR
HWR
FR-HWR
FR-LWR
Total
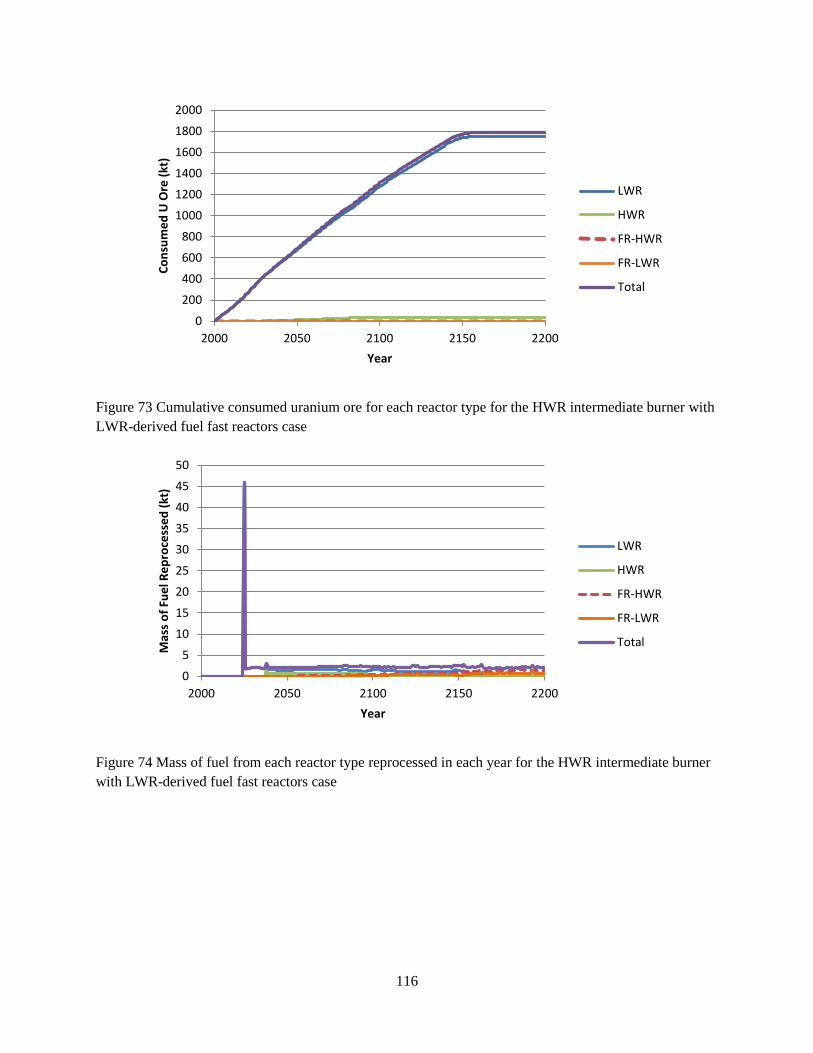
116
Figure 73 Cumulative consumed uranium ore for each reactor type for the HWR intermediate burner with
LWR-derived fuel fast reactors case
Figure 74 Mass of fuel from each reactor type reprocessed in each year for the HWR intermediate burner
with LWR-derived fuel fast reactors case
0
200
400
600
800
1000
1200
1400
1600
1800
2000
2000 2050 2100 2150 2200
Co
nsu
me
d U
Ore
(kt
)
Year
LWR
HWR
FR-HWR
FR-LWR
Total
0
5
10
15
20
25
30
35
40
45
50
2000 2050 2100 2150 2200
Mas
s o
f Fu
el R
ep
roce
sse
d (
kt)
Year
LWR
HWR
FR-HWR
FR-LWR
Total

117
Figure 75 Mass of fuel from each reactor type reprocessed in each year for the HWR intermediate burner
with LWR-derived fuel fast reactors case, with the y-axis magnified. Note that the top of the peak is 46 kt.
Figure 76 Source of americium, internal or external to the scenario, used to fabricate fuel, in each year for
HWR intermediate burner with LWR-derived fuel fast reactors case.
0
0.5
1
1.5
2
2.5
3
3.5
4
4.5
5
2000 2050 2100 2150 2200
Mas
s o
f Fu
el R
ep
roce
sse
d (
kt)
Year
LWR
HWR
FR-HWR
FR-LWR
Total
0
5
10
15
20
25
30
35
40
45
2000 2050 2100 2150 2200
Mas
s o
f A
me
rici
um
(t)
Year
Internal to theScenario
External to theScenario

118
Figure 77 Source of curium, internal or external to the scenario, used to fabricate fuel, in each year for
HWR intermediate burner with LWR-derived fuel fast reactors case.
4.6.5 Case 5, LWR to HWR modified open fuel cycle
Figure 78 Electrical capacity in each year for each reactor type for the LWR to HWR modified open fuel
cycle case
0
5
10
15
20
25
2000 2050 2100 2150 2200
Mas
s o
f C
uri
um
(t)
Year
Internal to theScenario
External to theScenario
0
20
40
60
80
100
120
140
160
2000 2050 2100 2150 2200
Ele
ctri
cal C
apac
ity
(MW
e)
Year
LWR
HWR
Total

119
Figure 79 Number of operating reactors in each year for each reactor type for the LWR to HWR modified
open fuel cycle case
Figure 80 Number of new reactors brought online in each year for each reactor type for the LWR to HWR
modified open fuel cycle case
0
50
100
150
200
250
2000 2050 2100 2150 2200
Op
era
tin
g R
eac
tors
Year
LWR
HWR
Total
0
1
2
3
4
5
6
7
8
9
2000 2020 2040 2060 2080 2100 2120 2140 2160 2180 2200
Ne
w R
eac
tors
Op
era
tin
g
Year
LWR
HWR
Total
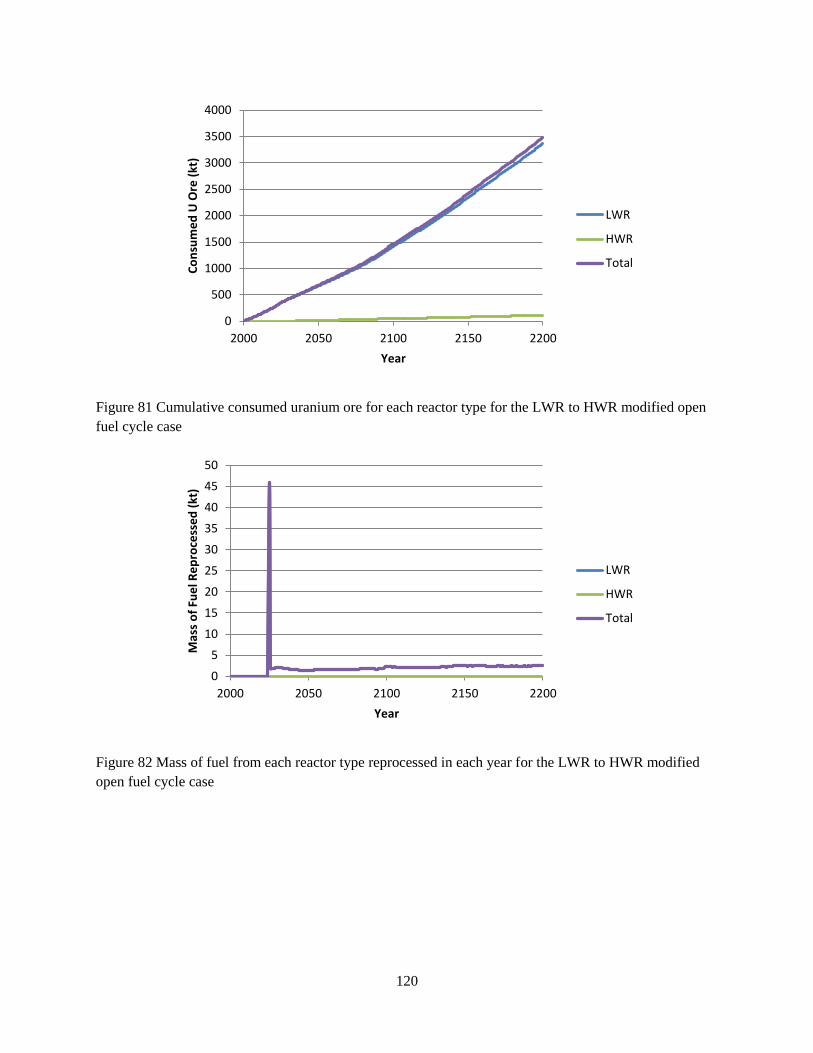
120
Figure 81 Cumulative consumed uranium ore for each reactor type for the LWR to HWR modified open
fuel cycle case
Figure 82 Mass of fuel from each reactor type reprocessed in each year for the LWR to HWR modified
open fuel cycle case
0
500
1000
1500
2000
2500
3000
3500
4000
2000 2050 2100 2150 2200
Co
nsu
me
d U
Ore
(kt
)
Year
LWR
HWR
Total
0
5
10
15
20
25
30
35
40
45
50
2000 2050 2100 2150 2200
Mas
s o
f Fu
el R
ep
roce
sse
d (
kt)
Year
LWR
HWR
Total
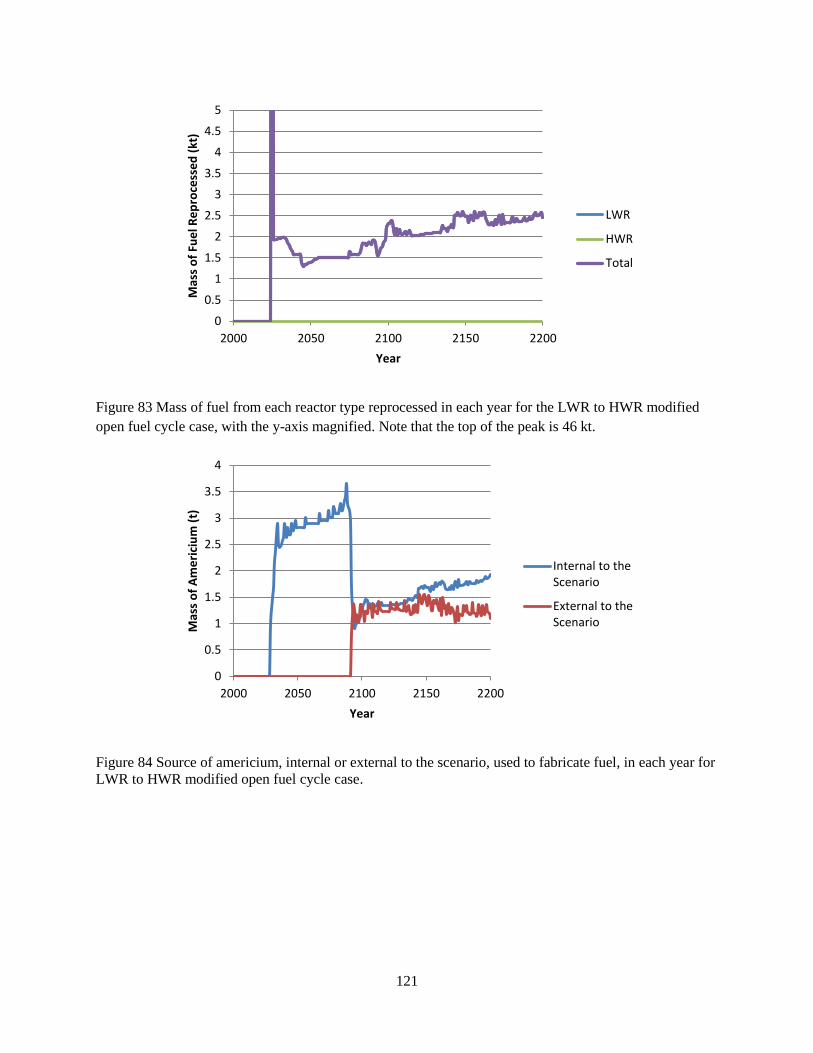
121
Figure 83 Mass of fuel from each reactor type reprocessed in each year for the LWR to HWR modified
open fuel cycle case, with the y-axis magnified. Note that the top of the peak is 46 kt.
Figure 84 Source of americium, internal or external to the scenario, used to fabricate fuel, in each year for
LWR to HWR modified open fuel cycle case.
0
0.5
1
1.5
2
2.5
3
3.5
4
4.5
5
2000 2050 2100 2150 2200
Mas
s o
f Fu
el R
ep
roce
sse
d (
kt)
Year
LWR
HWR
Total
0
0.5
1
1.5
2
2.5
3
3.5
4
2000 2050 2100 2150 2200
Mas
s o
f A
me
rici
um
(t)
Year
Internal to theScenario
External to theScenario
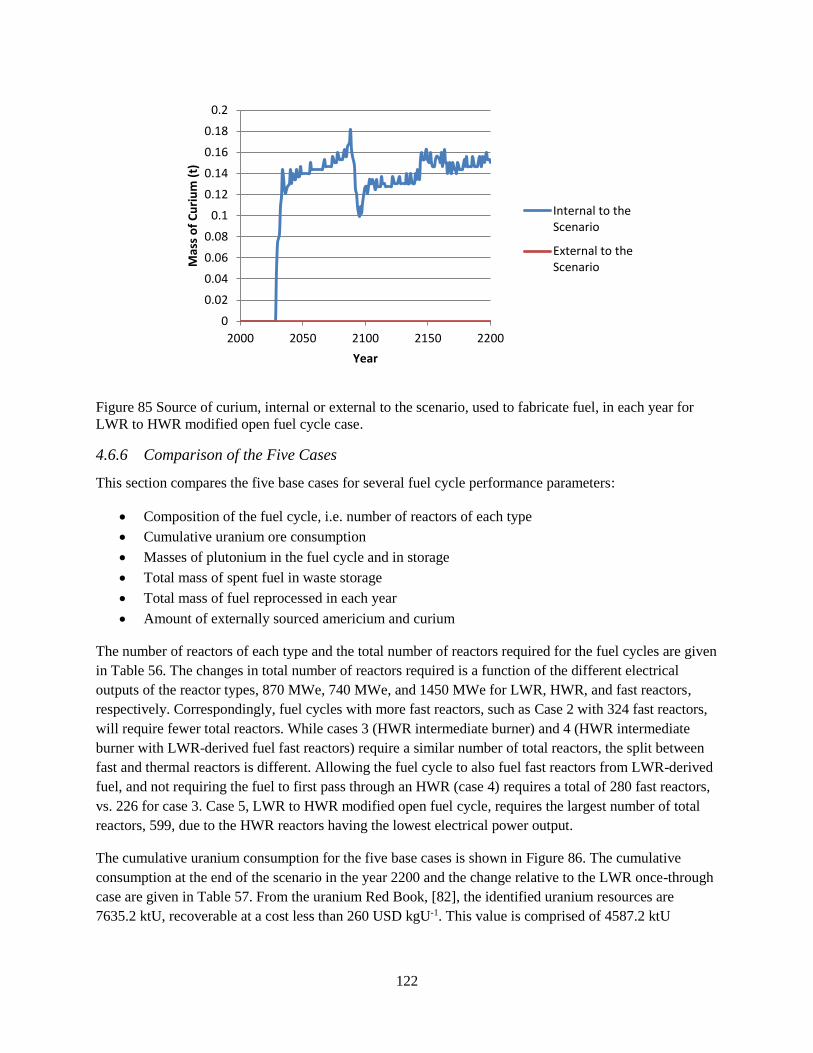
122
Figure 85 Source of curium, internal or external to the scenario, used to fabricate fuel, in each year for
LWR to HWR modified open fuel cycle case.
4.6.6 Comparison of the Five Cases
This section compares the five base cases for several fuel cycle performance parameters:
Composition of the fuel cycle, i.e. number of reactors of each type
Cumulative uranium ore consumption
Masses of plutonium in the fuel cycle and in storage
Total mass of spent fuel in waste storage
Total mass of fuel reprocessed in each year
Amount of externally sourced americium and curium
The number of reactors of each type and the total number of reactors required for the fuel cycles are given
in Table 56. The changes in total number of reactors required is a function of the different electrical
outputs of the reactor types, 870 MWe, 740 MWe, and 1450 MWe for LWR, HWR, and fast reactors,
respectively. Correspondingly, fuel cycles with more fast reactors, such as Case 2 with 324 fast reactors,
will require fewer total reactors. While cases 3 (HWR intermediate burner) and 4 (HWR intermediate
burner with LWR-derived fuel fast reactors) require a similar number of total reactors, the split between
fast and thermal reactors is different. Allowing the fuel cycle to also fuel fast reactors from LWR-derived
fuel, and not requiring the fuel to first pass through an HWR (case 4) requires a total of 280 fast reactors,
vs. 226 for case 3. Case 5, LWR to HWR modified open fuel cycle, requires the largest number of total
reactors, 599, due to the HWR reactors having the lowest electrical power output.
The cumulative uranium consumption for the five base cases is shown in Figure 86. The cumulative
consumption at the end of the scenario in the year 2200 and the change relative to the LWR once-through
case are given in Table 57. From the uranium Red Book, [82], the identified uranium resources are
7635.2 ktU, recoverable at a cost less than 260 USD kgU-1. This value is comprised of 4587.2 ktU
0
0.02
0.04
0.06
0.08
0.1
0.12
0.14
0.16
0.18
0.2
2000 2050 2100 2150 2200
Mas
s o
f C
uri
um
(t)
Year
Internal to theScenario
External to theScenario
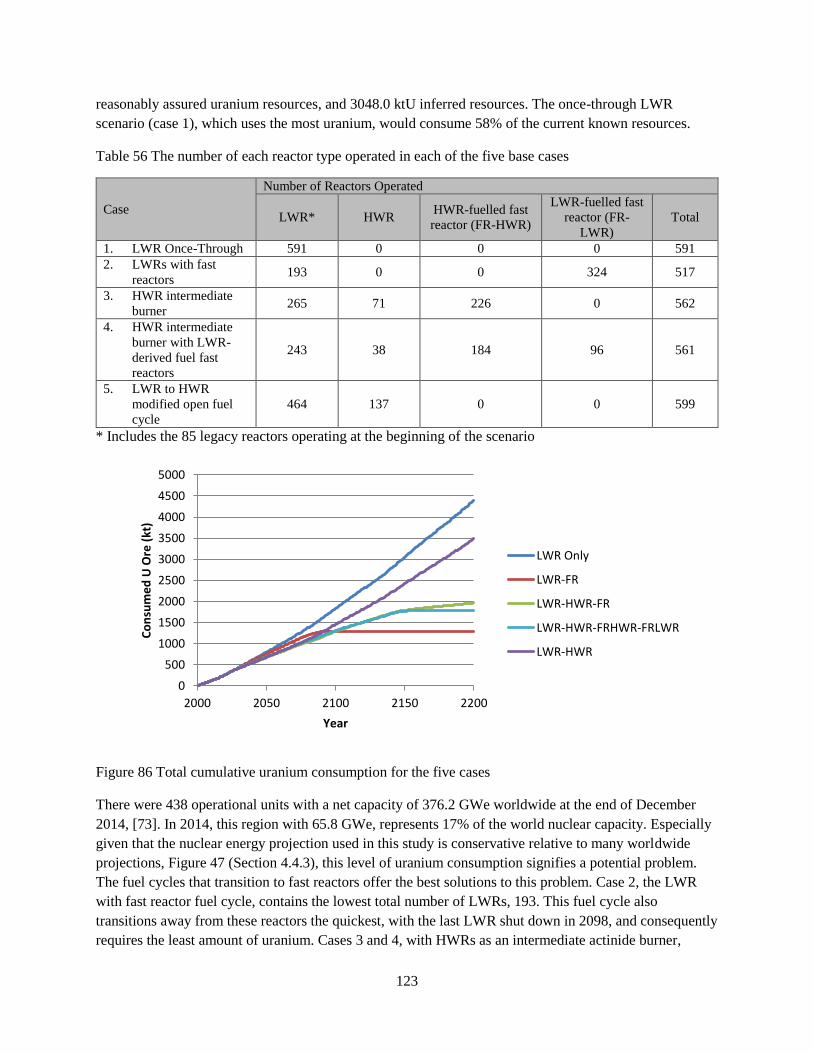
123
reasonably assured uranium resources, and 3048.0 ktU inferred resources. The once-through LWR
scenario (case 1), which uses the most uranium, would consume 58% of the current known resources.
Table 56 The number of each reactor type operated in each of the five base cases
Case
Number of Reactors Operated
LWR* HWR HWR-fuelled fast
reactor (FR-HWR)
LWR-fuelled fast
reactor (FR-
LWR)
Total
1. LWR Once-Through 591 0 0 0 591
2. LWRs with fast
reactors 193 0 0 324 517
3. HWR intermediate
burner 265 71 226 0 562
4. HWR intermediate
burner with LWR-
derived fuel fast
reactors
243 38 184 96 561
5. LWR to HWR
modified open fuel
cycle
464 137 0 0 599
* Includes the 85 legacy reactors operating at the beginning of the scenario
Figure 86 Total cumulative uranium consumption for the five cases
There were 438 operational units with a net capacity of 376.2 GWe worldwide at the end of December
2014, [73]. In 2014, this region with 65.8 GWe, represents 17% of the world nuclear capacity. Especially
given that the nuclear energy projection used in this study is conservative relative to many worldwide
projections, Figure 47 (Section 4.4.3), this level of uranium consumption signifies a potential problem.
The fuel cycles that transition to fast reactors offer the best solutions to this problem. Case 2, the LWR
with fast reactor fuel cycle, contains the lowest total number of LWRs, 193. This fuel cycle also
transitions away from these reactors the quickest, with the last LWR shut down in 2098, and consequently
requires the least amount of uranium. Cases 3 and 4, with HWRs as an intermediate actinide burner,
0
500
1000
1500
2000
2500
3000
3500
4000
4500
5000
2000 2050 2100 2150 2200
Co
nsu
me
d U
Ore
(kt
)
Year
LWR Only
LWR-FR
LWR-HWR-FR
LWR-HWR-FRHWR-FRLWR
LWR-HWR
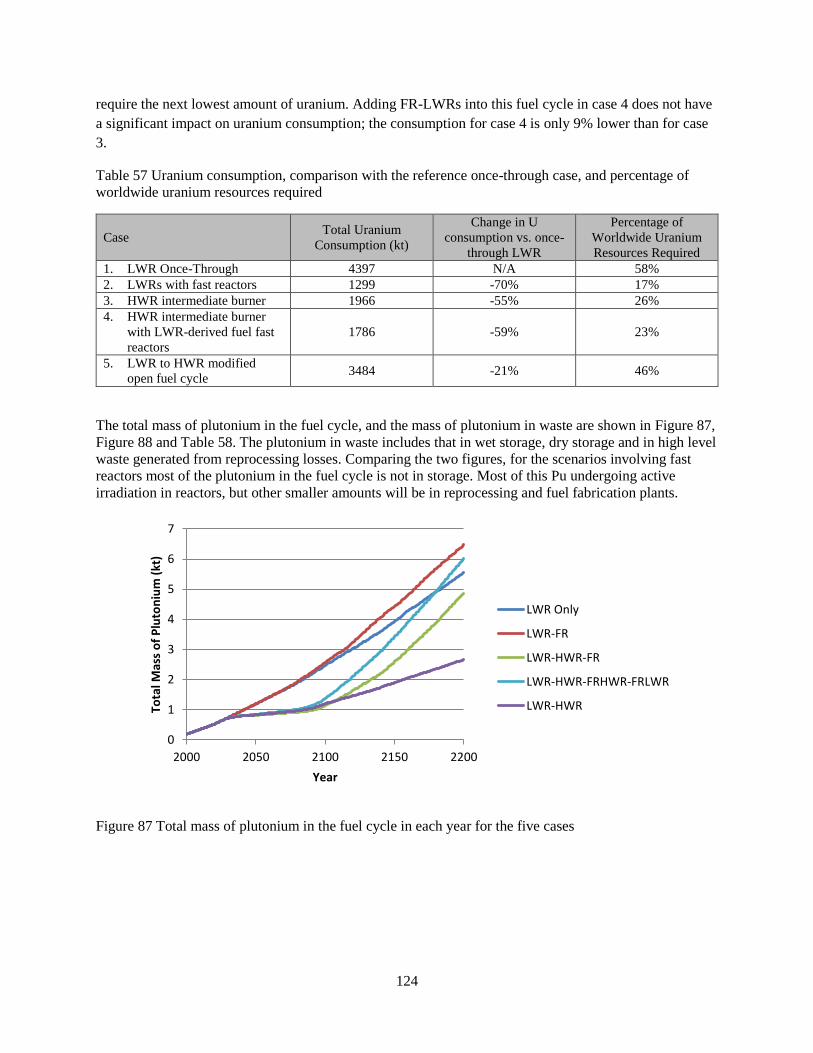
124
require the next lowest amount of uranium. Adding FR-LWRs into this fuel cycle in case 4 does not have
a significant impact on uranium consumption; the consumption for case 4 is only 9% lower than for case
3.
Table 57 Uranium consumption, comparison with the reference once-through case, and percentage of
worldwide uranium resources required
Case Total Uranium
Consumption (kt)
Change in U
consumption vs. once-
through LWR
Percentage of
Worldwide Uranium
Resources Required
1. LWR Once-Through 4397 N/A 58%
2. LWRs with fast reactors 1299 -70% 17%
3. HWR intermediate burner 1966 -55% 26%
4. HWR intermediate burner
with LWR-derived fuel fast
reactors
1786 -59% 23%
5. LWR to HWR modified
open fuel cycle 3484 -21% 46%
The total mass of plutonium in the fuel cycle, and the mass of plutonium in waste are shown in Figure 87,
Figure 88 and Table 58. The plutonium in waste includes that in wet storage, dry storage and in high level
waste generated from reprocessing losses. Comparing the two figures, for the scenarios involving fast
reactors most of the plutonium in the fuel cycle is not in storage. Most of this Pu undergoing active
irradiation in reactors, but other smaller amounts will be in reprocessing and fuel fabrication plants.
Figure 87 Total mass of plutonium in the fuel cycle in each year for the five cases
0
1
2
3
4
5
6
7
2000 2050 2100 2150 2200
Tota
l Mas
s o
f P
luto
niu
m (
kt)
Year
LWR Only
LWR-FR
LWR-HWR-FR
LWR-HWR-FRHWR-FRLWR
LWR-HWR
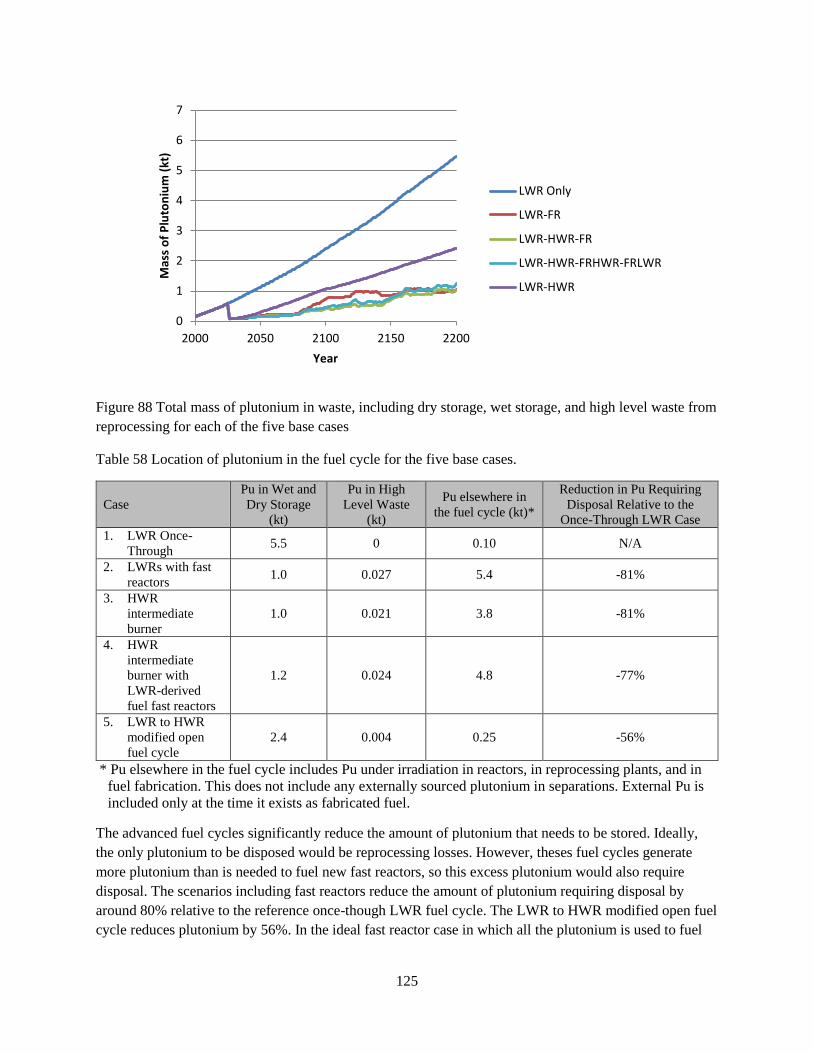
125
Figure 88 Total mass of plutonium in waste, including dry storage, wet storage, and high level waste from
reprocessing for each of the five base cases
Table 58 Location of plutonium in the fuel cycle for the five base cases.
Case
Pu in Wet and
Dry Storage
(kt)
Pu in High
Level Waste
(kt)
Pu elsewhere in
the fuel cycle (kt)*
Reduction in Pu Requiring
Disposal Relative to the
Once-Through LWR Case
1. LWR Once-
Through 5.5 0 0.10 N/A
2. LWRs with fast
reactors 1.0 0.027 5.4 -81%
3. HWR
intermediate
burner
1.0 0.021 3.8 -81%
4. HWR
intermediate
burner with
LWR-derived
fuel fast reactors
1.2 0.024 4.8 -77%
5. LWR to HWR
modified open
fuel cycle
2.4 0.004 0.25 -56%
* Pu elsewhere in the fuel cycle includes Pu under irradiation in reactors, in reprocessing plants, and in
fuel fabrication. This does not include any externally sourced plutonium in separations. External Pu is
included only at the time it exists as fabricated fuel.
The advanced fuel cycles significantly reduce the amount of plutonium that needs to be stored. Ideally,
the only plutonium to be disposed would be reprocessing losses. However, theses fuel cycles generate
more plutonium than is needed to fuel new fast reactors, so this excess plutonium would also require
disposal. The scenarios including fast reactors reduce the amount of plutonium requiring disposal by
around 80% relative to the reference once-though LWR fuel cycle. The LWR to HWR modified open fuel
cycle reduces plutonium by 56%. In the ideal fast reactor case in which all the plutonium is used to fuel
0
1
2
3
4
5
6
7
2000 2050 2100 2150 2200
Mas
s o
f P
luto
niu
m (
kt)
Year
LWR Only
LWR-FR
LWR-HWR-FR
LWR-HWR-FRHWR-FRLWR
LWR-HWR

126
new and existing reactors, and only reprocessing losses are created, the plutonium requiring disposal is
99.5% reduced relative to the once-through scenario.
The transition to advanced fuel cycles significantly reduces the amount of spent fuel. The amount of spent
fuel in wet and dry storage is shown in Figure 89. The y-axis is re-scaled in Figure 90 to better display the
amount of spent fuel in storage in the fast reactor scenarios. For the once-through LWR case there is
527 kt of spent fuel at the end of the scenario. This is reduced by 76% to 126 kt in the LWR to HWR
modified open fuel cycle. The fast reactor scenarios each contain around 10 kt of spent fuel in storage, a
reduction of 98%. It is noted here that for the fast reactor scenarios this amount of fuel in storage will
leave storage and be reprocessed after the 4-year cooling time. Some amount of spent fuel in case 5, that
corresponding to the LWRs, will also leave storage after 4 years to be reprocessed; at the end of the
scenario this is 10.5 kt of the total 126 kt of spent fuel.
Figure 89 Spent fuel in wet and dry storage in each year for the five cases
For the reprocessing scenarios, there will be high level radioactive waste (HLW) produced in the
reprocessing plants that will require permanent disposal. This will be from fission product waste and
some reprocessing losses (0.1%) of transuranic elements. Uranium recovered through reprocessing is not
included. In these scenarios, the transuranic elements are fabricated into new fuel, mixed with either
natural uranium (for HWR fuel) or depleted uranium (for fast reactor fuel). The uranium is reserved in
these scenarios.
The amount of HLW requiring permanent disposal is given in Table 59. For case 1, this is all of the spent
fuel. For cases 2 to 4, this is the reprocessing losses. For case 5, it is the spent fuel from the HWRs plus
reprocessing losses.
0
100
200
300
400
500
600
2000 2050 2100 2150 2200
Spe
nt
Fue
l in
Dry
an
d W
et
Sto
rage
(kt
)
Year
LWR Only
LWR-FR
LWR-HWR-FR
LWR-HWR-FRHWR-FRLWR
LWR-HWR

127
Figure 90 Spent fuel in wet and dry storage in each year for the five cases, magnified y-axis.
The mass of fuel reprocessed in each year is shown in Figure 91. As the scenario has unlimited
reprocessing capacity, each case with reprocessing shows a large spike in the first year that reprocessing
is available, 2025. This spike is 45 kt in each case. Except for the initial peak, the total amount of fuel
reprocessed in the scenarios is relatively constant:
Case 2: around 2 kt year-1
Case 3: between 2 and 2.5 kt year-1
Case 4: between 2 and 2.5 kt year-1
Case 5: increases from 1.5 to 2.5 kt year-1 between 2050 and 2200.
No fuel cycle scenario requires a substantially different equilibrium reprocessing capacity.
0
10
20
30
40
50
60
70
80
90
100
2000 2050 2100 2150 2200
Spe
nt
Fue
l in
Dry
an
d W
et
Sto
rage
(kt
)
Year
LWR Only
LWR-FR
LWR-HWR-FR
LWR-HWR-FRHWR-FRLWR
LWR-HWR

128
Table 59 The amount of high level waste and americium and curium in high level waste requiring
permanent disposal at the end of the scenario for the five base cases
Case
Amount of
High Level
Waste at the
End of the
Scenario (kt)*
Percentage
change vs.
once-
through
LWR**
Amount of
Am in High
Level Waste
at the End of
the Scenario
(t)
Change
vs. once-
through
LWR
Amount of
Cm in High
Level Waste
at the End of
the Scenario
(t)
Percentage
change vs.
once-
through
LWR**
1. LWR Once-
Through 526.5 876.5 11.5
2. LWRs with
fast reactors 16.5 -97 3.7 -99.6 0.4 -96.8
3. HWR
intermediate
burner
14.5 -97 3.0 -99.7 0.7 -93.8
4. HWR
intermediate
burner with
LWR-derived
fuel fast
reactors
15.2 -97 3.4 -99.6 0.7 -94.1
5. LWR to HWR
modified open
fuel cycle
119.6 -77 418.5*** -52.3 23.7 +206%
* Does not include the uranium stream from the reprocessing plant. For the cases with reprocessing, this
includes only reprocessing wastes, as the spent fuel is continuously reprocessed.
** Percentage changes are calculated as % 𝑐ℎ𝑎𝑛𝑔𝑒 = (𝑆𝑐𝑒𝑛𝑎𝑟𝑖𝑜−𝑂𝑛𝑐𝑒 𝑇ℎ𝑟𝑜𝑢𝑔ℎ 𝐿𝑊𝑅
𝑂𝑛𝑐𝑒−𝑇ℎ𝑟𝑜𝑢𝑔ℎ 𝐿𝑊𝑅) × 100%
***Note that this value does not correct for Am obtained from external resources. Externally sourced Am,
138t, is included.
Figure 91 Mass of fuel reprocessed in each year for the five cases, magnified y-axis. Note that the top of
the peak is 45 kt.
0
0.5
1
1.5
2
2.5
3
3.5
4
4.5
5
2000 2050 2100 2150 2200
Mas
s o
f Fu
el R
ep
ross
ed
(kt
)
Year
LWR-FR
LWR-HWR-FR
LWR-HWR-FRHWR-FRLWR
LWR-HWR

129
The fast reactors contain about 4wt% minor actinides. This is a higher concentration of minor actinides to
plutonium than is in the LWR spent fuel. The MA to Pu ratio in LWR spent fuel is 0.088, Table 2
(Section 1.2), while it is 0.36 for first pass FR-LWR fuel, Table 37 (Section 3.10), and 0.175 for first pass
FR-HWR fuel, Table 42 (Section 3.10.2). As discussed in Section 4.2.1, this will cause the scenario to run
out of americium and curium. When this occurs, the scenario effectively “borrows” americium and
curium from outside of the scenario. The mass of americium and curium from external sources are
compared in Figure 92, Figure 93 and Table 60. Case 3 is the first case to require external americium, in
2082. The LWR with fast reactor case, case 2, requires its first americium 2 years later, in 2084, and uses
the most americium from external sources, 1859 t, which represents 34% of the americium required for
fuel fabrication. Since fast reactors have a higher initial core requirement of americium, and a higher
annual americium requirement, the cases with more fast reactors require more external Am.
Figure 92 Mass of external Am used to fabricate fuel, in each year for the five base cases
0
5
10
15
20
25
30
35
2000 2050 2100 2150 2200
Tota
l Mas
s o
f A
me
rici
um
(t)
Year
LWR Only
LWR-FR
LWR-HWR-FR
LWR-HWR-FRHWR-FRLWR
LWR-HWR
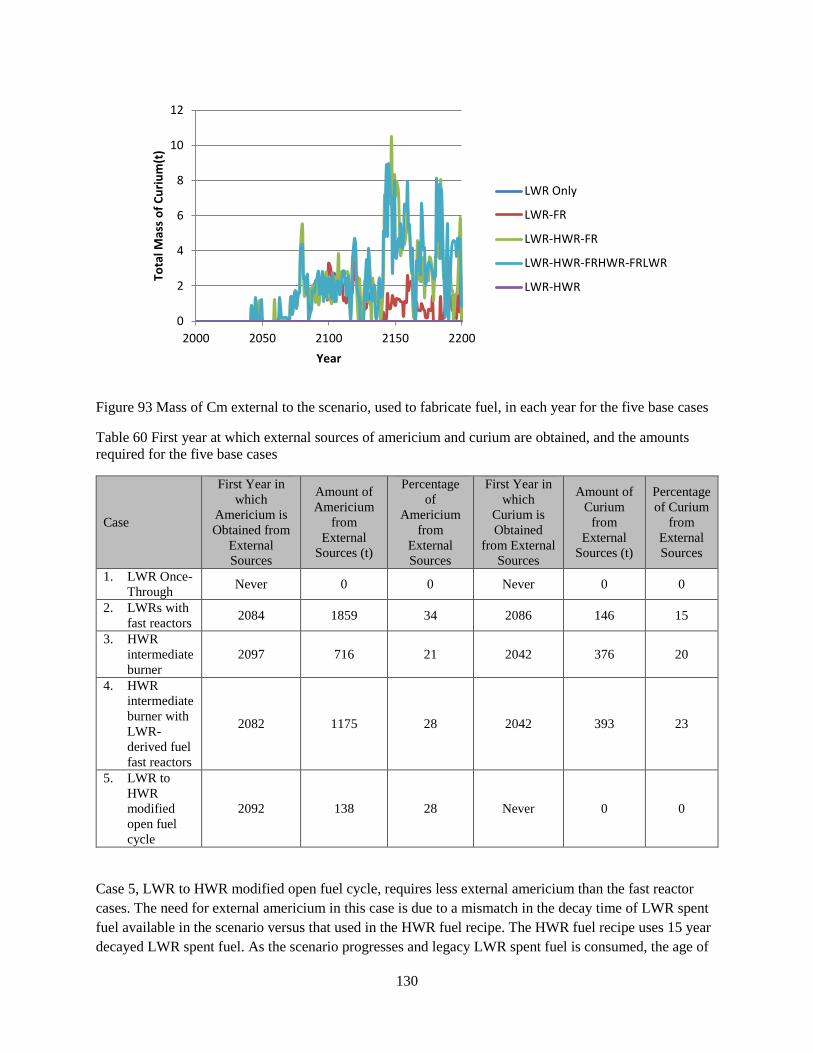
130
Figure 93 Mass of Cm external to the scenario, used to fabricate fuel, in each year for the five base cases
Table 60 First year at which external sources of americium and curium are obtained, and the amounts
required for the five base cases
Case
First Year in
which
Americium is
Obtained from
External
Sources
Amount of
Americium
from
External
Sources (t)
Percentage
of
Americium
from
External
Sources
First Year in
which
Curium is
Obtained
from External
Sources
Amount of
Curium
from
External
Sources (t)
Percentage
of Curium
from
External
Sources
1. LWR Once-
Through Never 0 0 Never 0 0
2. LWRs with
fast reactors 2084 1859 34 2086 146 15
3. HWR
intermediate
burner
2097 716 21 2042 376 20
4. HWR
intermediate
burner with
LWR-
derived fuel
fast reactors
2082 1175 28 2042 393 23
5. LWR to
HWR
modified
open fuel
cycle
2092 138 28 Never 0 0
Case 5, LWR to HWR modified open fuel cycle, requires less external americium than the fast reactor
cases. The need for external americium in this case is due to a mismatch in the decay time of LWR spent
fuel available in the scenario versus that used in the HWR fuel recipe. The HWR fuel recipe uses 15 year
decayed LWR spent fuel. As the scenario progresses and legacy LWR spent fuel is consumed, the age of
0
2
4
6
8
10
12
2000 2050 2100 2150 2200
Tota
l Mas
s o
f C
uri
um
(t)
Year
LWR Only
LWR-FR
LWR-HWR-FR
LWR-HWR-FRHWR-FRLWR
LWR-HWR

131
LWR spent fuel in the scenario used to fabricate HWR fuel will decrease, to a minimum of 5 years
(storage + reprocessing + fuel fabrication time, Section 4.4.1). Younger LWR spent fuel will contain
more Pu and less Am, as less Pu-241 will have decayed to Am-241.
Curium is bred in the HWRs, and hence more Cm will be available in HWR spent fuel than in LWR spent
fuel. Thus, cases 3 and 4, which have HWRs as intermediate reactors, require less external curium than
does case 2, in which the curium generated from the LWR goes directly into the fast reactor.
It is important to note that the pathway for curium production requires americium, namely Am-242m and
Am-244 beta decay (Figure 6, Section 1.3.1). If americium is no longer available as input to fresh fuel,
then the amount of curium produced will decrease significantly. The amount of curium that is present in
these fuel cycles after the americium runs out cannot be used to infer the amount of curium that would
have been present if the reactors had not been fuelled with external Am after the Am within the fuel cycle
was depleted. If there is no americium input into the reactors, then any curium produced would originate
from plutonium in the input fuel. In these cases, since the scenario adds in any missing americium, the
amount of curium in the fuel cycle is significantly higher than it would have been otherwise.
The location of plutonium in the fuel cycle is given in Table 58, shown previously. In the once-through
case almost all the plutonium is in wet or dry storage. However, for the actinide burning fuel cycles most
of the plutonium is elsewhere in the fuel cycle, either in reactors, reprocessing plants, or fuel fabrication
plants; this plutonium will be used as fuel in reactors. Only a relatively small amount requires final
disposal. Fuel cycle 5, the LWR to HWR modified open fuel cycle is a plutonium burner cycle, where
less than half of the amount of plutonium requires final disposal relative to the once through reference
case.
4.7 Results for the Sensitivity Cases
The results displaying the change in reactor population throughout the fuel cycle are presented first for
each relevant case (electrical capacity, number of operating reactors of each type, number of new reactors
built of each type, uranium consumption). The results for the whole fuel cycle are compared next, with
the sensitivity cases compared with the base scenario for each of the five fuel cycle scenarios. Some of
the fuel cycle scenarios are not dependent on the parameter change, and therefore these results are not
included. For example, the once-through LWR only case is not dependent on the power rating of the fast
reactors, as there are no fast reactors in this scenario.
For the sensitivity case results, only the parameters that show a significant difference are included in this
section. The composition of the fuel cycle, i.e. electrical capacity for each reactor type throughout the
cycle, is given for each case. Any other parameters that do not show a significant change for the
sensitivity parameter are omitted here, but are provided for completeness in Appendix B. For example,
the power de-rating of fast reactors has no impact on the uranium consumption of the fuel cycle, so that
figure is omitted here, but presented in Appendix B. The number of new reactors brought online in each
year is shown in Appendix B for all cases.

132
4.7.1 Fast Reactor Power De-rating
These sensitivity cases were performed for the cases with fast reactors only, cases 2, 3, and 4. The other
two cases are not impacted.
Though the electrical capacity supplied by the LWR and FR-LWRs in the base and sensitivity versions of
case 2 scenarios remains the same, Figure 94, the number of FR-LWRs required to provide that electrical
capacity is increased, Figure 95, due to the decreased power output of those reactors. The number of fast
reactors increases from 324 to 496, Table 61. The increase in the number of reactors will have
consequences on the economic impact of this fuel cycle. More reactors will increase the capital cost of the
fuel cycle, and also the operating cost.
De-rating the power output of the fast reactors limits the growth of FR-HWRs in the HWR intermediate
burner scenario, Figure 96 and Figure 97. The growth of FR-HWRs is determined by the availability of
plutonium in HWR spent fuel to fuel the initial full core of the FR-HWR. This initial amount of
plutonium required will be the same in the de-rated reactor, though the annual throughput of fuel will
decrease due to the lower power. More FR-HWRs are needed to maintain the electricity output from these
reactors than in the base case. However, due to the availability of plutonium for initial FR-HWR cores,
the scenario is not able to construct enough FR-HWR to maintain the base case electrical capacity. The
total electrical capacity requirements are met by building more LWRs and more HWRs. As a
consequence of having more LWRs, the uranium ore requirement for the scenario increases, 28% over the
base case 3 (Figure 98).
The increase of LWRs and decrease of fast reactors changes the reprocessing capacity for the spent fuels
from those reactors, Figure 99. There is an overall decrease in the total amount of spent fuel reprocessed
from 2100 to the end of the scenario. Also, as a result, the increase in the number of HWRs, the external
americium and curium requirements decrease, 18% and 8% respectively, Figure 100 and Figure 101.
Similar to case 3, de-rated fast reactors also limit the growth of fast reactors in case 4 (Figure 102 and
Figure 103) due to the plutonium requirement in the initial cores, which remains the same. This carries
some of the same consequences as found previously: increased uranium ore consumption by 8% (Figure
104), a change and overall decrease to the amount of spent fuel reprocessed (Figure 105) and decreased
external curium requirements by 13% (Figure 106).
In contrast to case 3, de-rating the fast reactors increases the external americium requirement by 23% over
the case 4 base case (Figure 107). In this scenario, because new HWRs are only permitted to enter
operation for 10 years between 2040 and 2050, the number of HWRs is unchanged (Figure 103). After
2050 more LWRs are built over the base case, and these allow for many more FR-LWRs to be
constructed, 250 in the de-rated case, versus 96 in the base case. There is also an increase in the number
of FR-HWRs because of the power de-rating, 198 versus 184 in the base case. The overall increase in fast
reactors in this perturbation increases the external americium requirement.

133
Table 61 The number of reactors of each type operated in each of the sensitivity cases in comparison with
the base case.
Sensitivity Case
Number of Reactors
LWR HWR
HWR-fuelled fast
reactor (FR-
HWR)
LWR-fuelled fast
reactor (FR-
LWR)
Total
Case 2, LWRs and fast reactors
Base Case 193 0 0 324 517
Fast reactor power
de-rated 193 0 0 496 689
No legacy spent
fuel 193 0 0 324 517
Capped
reprocessing
capacity
193 0 0 324 517
Fast reactor
operation delayed
until 2050
212 0 0 310 522
Case 3, HWR intermediate actinide burner
Base Case 265 71 226 0 562
Fast reactor power
de-rated 329 89 283 0 701
No legacy spent
fuel 271 69 222 0 562
Capped
reprocessing
capacity
271 72 219 0 562
Fast reactor
operation delayed
until 2050
270 74 218 0 562
Case 4, HWR intermediate burner with LWR-derived fuel fast reactors
Base Case 243 38 184 96 561
Fast reactor power
de-rated 262 38 198 250 748
No legacy spent
fuel 246 36 179 99 560
Capped
reprocessing
capacity
219 27 144 155 545
Fast reactor
operation delayed
until 2050
255 44 188 79 566
Case 5, LWR to HWR modified open fuel cycle
Base Case 464 137 0 0 601
No legacy spent
fuel 466 135 0 0 601
Capped
reprocessing
capacity
464 137 0 0 601
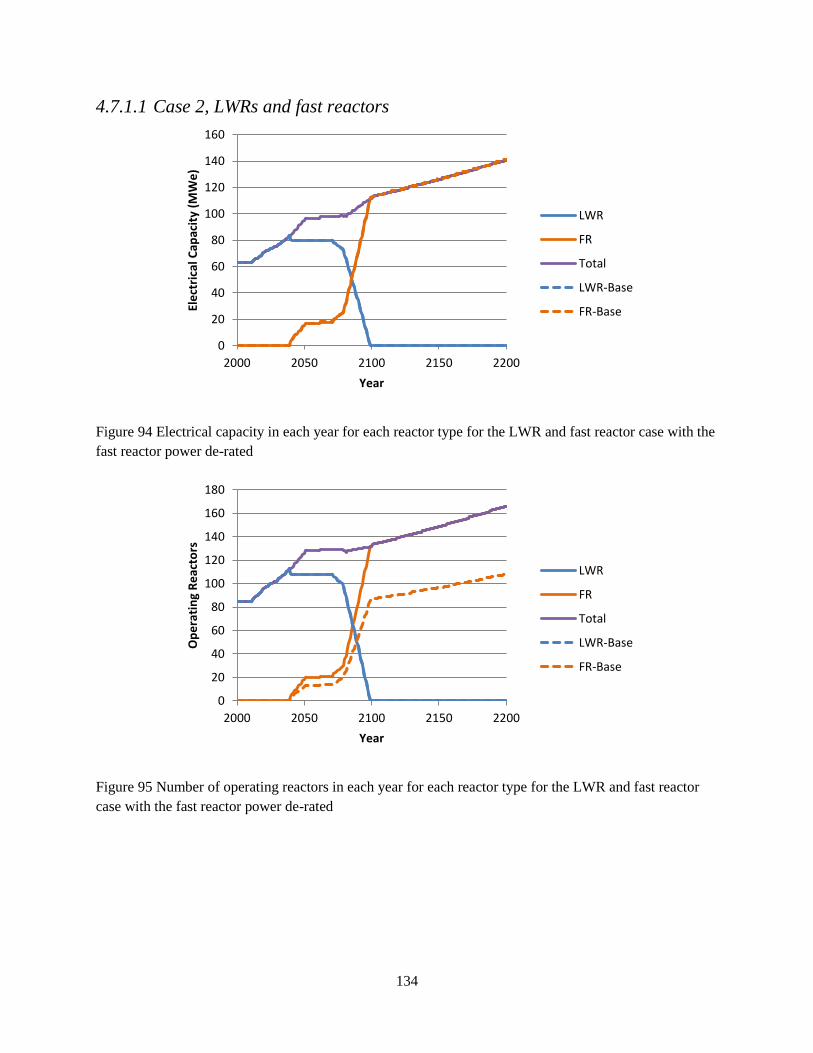
134
4.7.1.1 Case 2, LWRs and fast reactors
Figure 94 Electrical capacity in each year for each reactor type for the LWR and fast reactor case with the
fast reactor power de-rated
Figure 95 Number of operating reactors in each year for each reactor type for the LWR and fast reactor
case with the fast reactor power de-rated
0
20
40
60
80
100
120
140
160
2000 2050 2100 2150 2200
Ele
ctri
cal C
apac
ity
(MW
e)
Year
LWR
FR
Total
LWR-Base
FR-Base
0
20
40
60
80
100
120
140
160
180
2000 2050 2100 2150 2200
Op
era
tin
g R
eac
tors
Year
LWR
FR
Total
LWR-Base
FR-Base
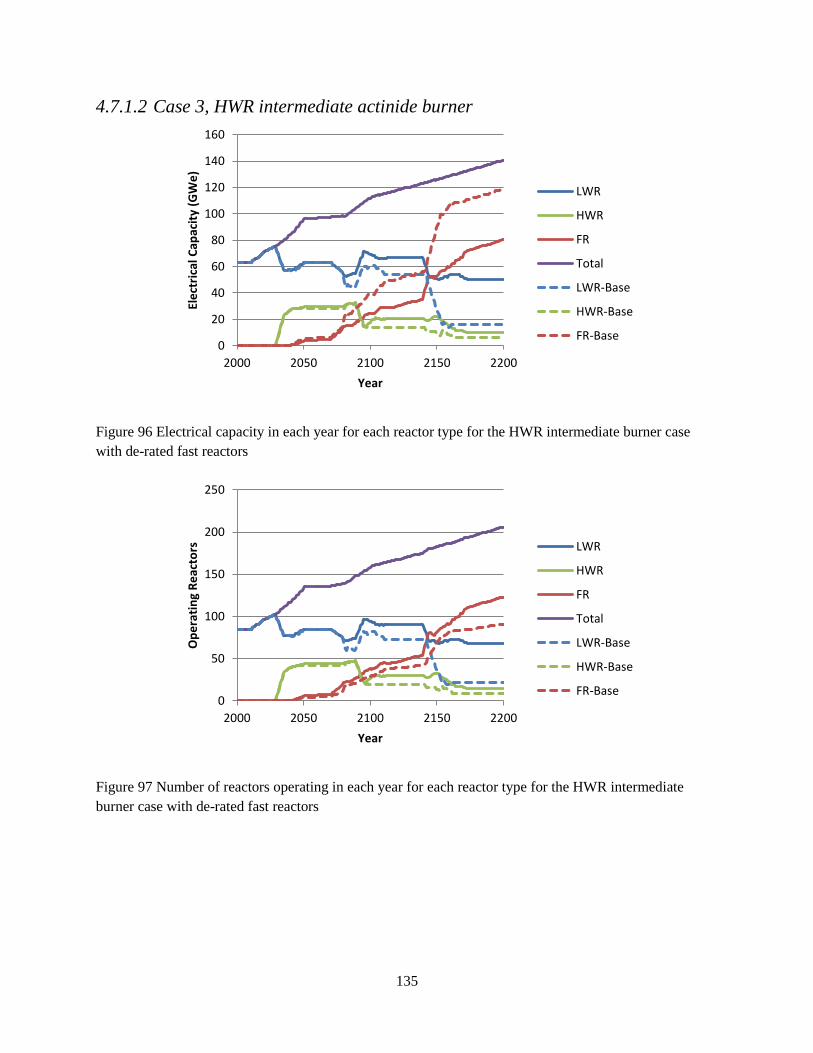
135
4.7.1.2 Case 3, HWR intermediate actinide burner
Figure 96 Electrical capacity in each year for each reactor type for the HWR intermediate burner case
with de-rated fast reactors
Figure 97 Number of reactors operating in each year for each reactor type for the HWR intermediate
burner case with de-rated fast reactors
0
20
40
60
80
100
120
140
160
2000 2050 2100 2150 2200
Ele
ctri
cal C
apac
ity
(GW
e)
Year
LWR
HWR
FR
Total
LWR-Base
HWR-Base
FR-Base
0
50
100
150
200
250
2000 2050 2100 2150 2200
Op
era
tin
g R
eac
tors
Year
LWR
HWR
FR
Total
LWR-Base
HWR-Base
FR-Base
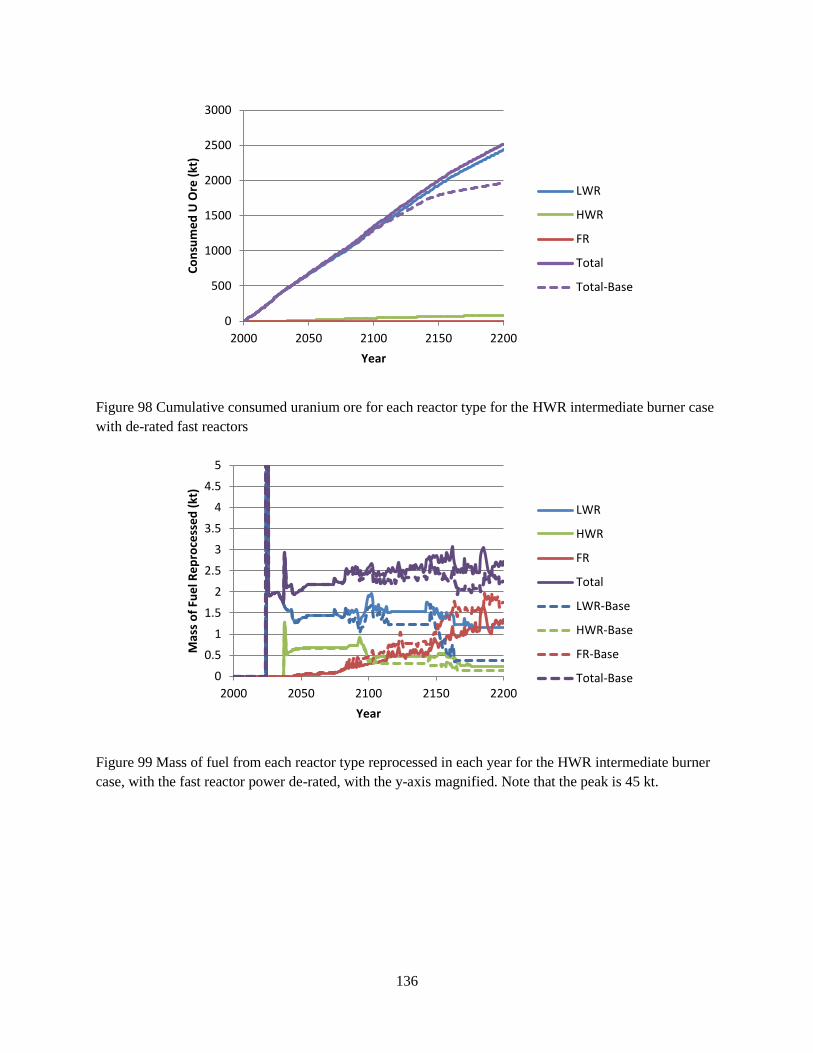
136
Figure 98 Cumulative consumed uranium ore for each reactor type for the HWR intermediate burner case
with de-rated fast reactors
Figure 99 Mass of fuel from each reactor type reprocessed in each year for the HWR intermediate burner
case, with the fast reactor power de-rated, with the y-axis magnified. Note that the peak is 45 kt.
0
500
1000
1500
2000
2500
3000
2000 2050 2100 2150 2200
Co
nsu
me
d U
Ore
(kt
)
Year
LWR
HWR
FR
Total
Total-Base
0
0.5
1
1.5
2
2.5
3
3.5
4
4.5
5
2000 2050 2100 2150 2200
Mas
s o
f Fu
el R
ep
roce
sse
d (
kt)
Year
LWR
HWR
FR
Total
LWR-Base
HWR-Base
FR-Base
Total-Base
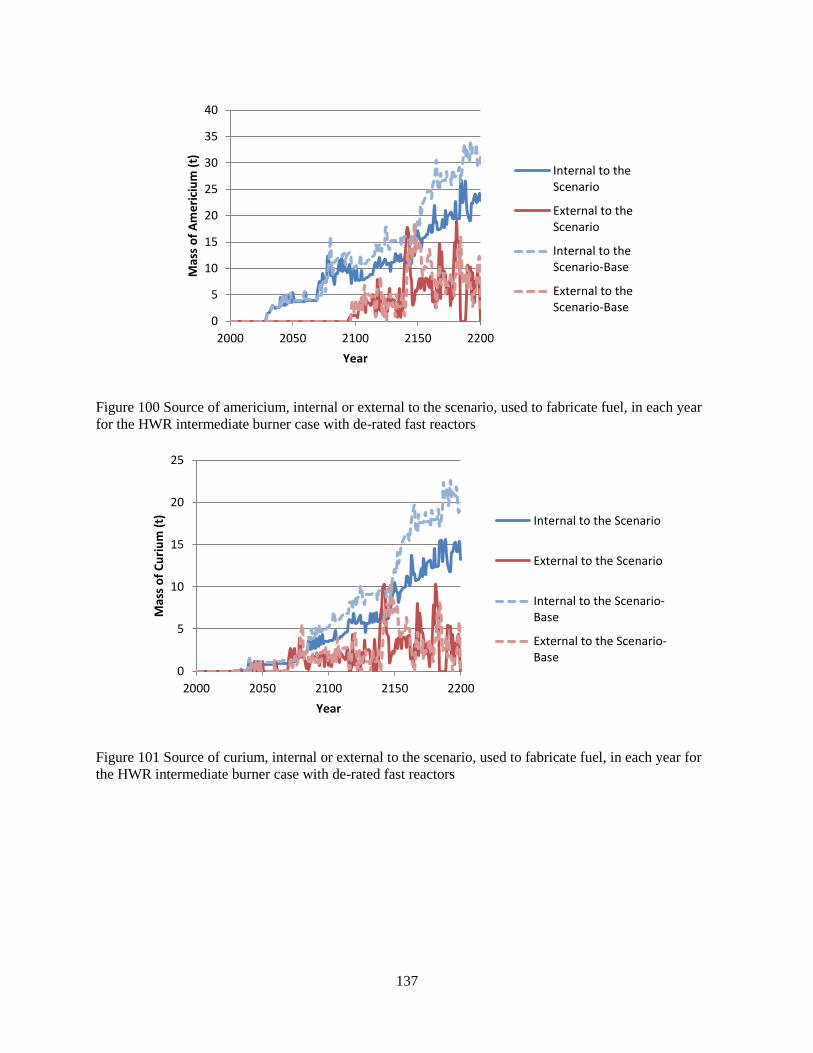
137
Figure 100 Source of americium, internal or external to the scenario, used to fabricate fuel, in each year
for the HWR intermediate burner case with de-rated fast reactors
Figure 101 Source of curium, internal or external to the scenario, used to fabricate fuel, in each year for
the HWR intermediate burner case with de-rated fast reactors
0
5
10
15
20
25
30
35
40
2000 2050 2100 2150 2200
Mas
s o
f A
me
rici
um
(t)
Year
Internal to theScenario
External to theScenario
Internal to theScenario-Base
External to theScenario-Base
0
5
10
15
20
25
2000 2050 2100 2150 2200
Mas
s o
f C
uri
um
(t)
Year
Internal to the Scenario
External to the Scenario
Internal to the Scenario-Base
External to the Scenario-Base
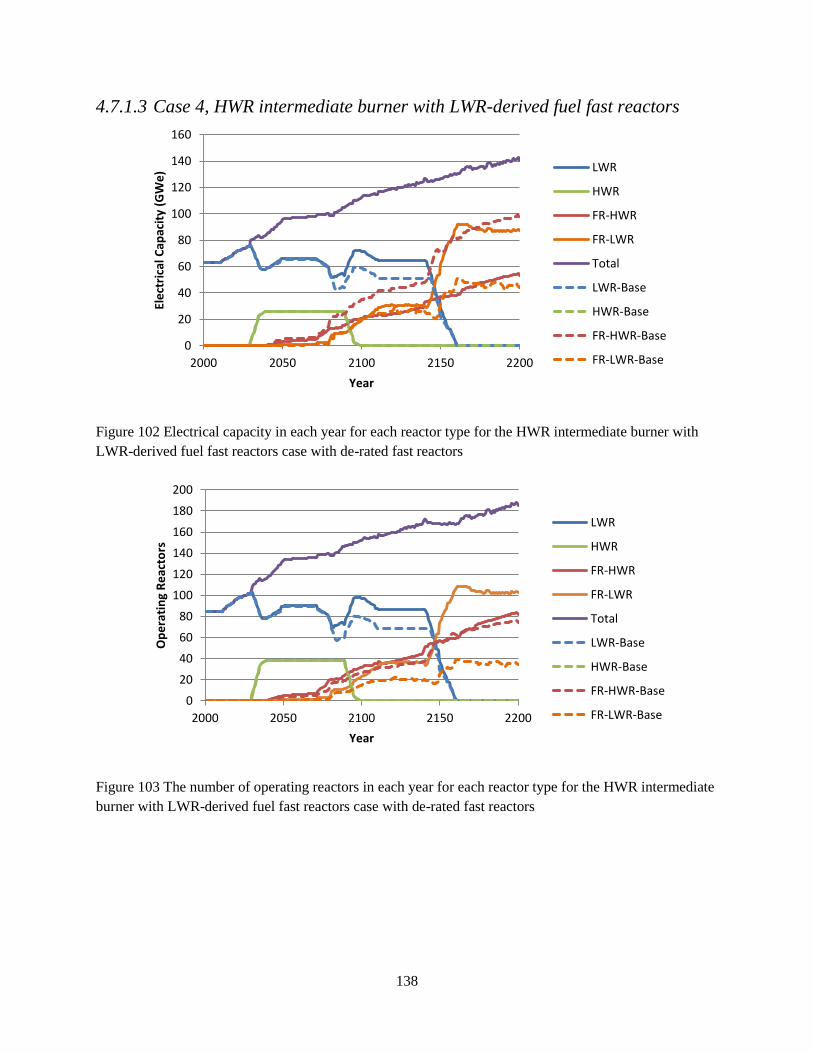
138
4.7.1.3 Case 4, HWR intermediate burner with LWR-derived fuel fast reactors
Figure 102 Electrical capacity in each year for each reactor type for the HWR intermediate burner with
LWR-derived fuel fast reactors case with de-rated fast reactors
Figure 103 The number of operating reactors in each year for each reactor type for the HWR intermediate
burner with LWR-derived fuel fast reactors case with de-rated fast reactors
0
20
40
60
80
100
120
140
160
2000 2050 2100 2150 2200
Ele
ctri
cal C
apac
ity
(GW
e)
Year
LWR
HWR
FR-HWR
FR-LWR
Total
LWR-Base
HWR-Base
FR-HWR-Base
FR-LWR-Base
0
20
40
60
80
100
120
140
160
180
200
2000 2050 2100 2150 2200
Op
era
tin
g R
eac
tors
Year
LWR
HWR
FR-HWR
FR-LWR
Total
LWR-Base
HWR-Base
FR-HWR-Base
FR-LWR-Base

139
Figure 104 Cumulative consumed uranium ore for each reactor type for the HWR intermediate burner
with LWR-derived fuel fast reactors case with de-rated fast reactors
Figure 105 Mass of fuel from each reactor type reprocessed in each year for the HWR intermediate burner
with LWR-derived fuel fast reactors case, with the fast reactor power de-rated, with the y-axis magnified.
Note that the peak is 45 kt.
0
500
1000
1500
2000
2500
2000 2050 2100 2150 2200
Co
nsu
me
d U
Ore
(kt
)
Year
LWR
HWR
FR-HWR
FR-LWR
Total
Total-Base
0
0.5
1
1.5
2
2.5
3
3.5
4
4.5
5
2000 2050 2100 2150 2200
Mas
s o
f Fu
el R
ep
roce
sse
d (
kt)
Year
LWR
HWR
FR-HWR
FR-LWR
Total
LWR-Base
HWR-Base
FR-HWR-Base
FR-LWR-Base
Total-Base
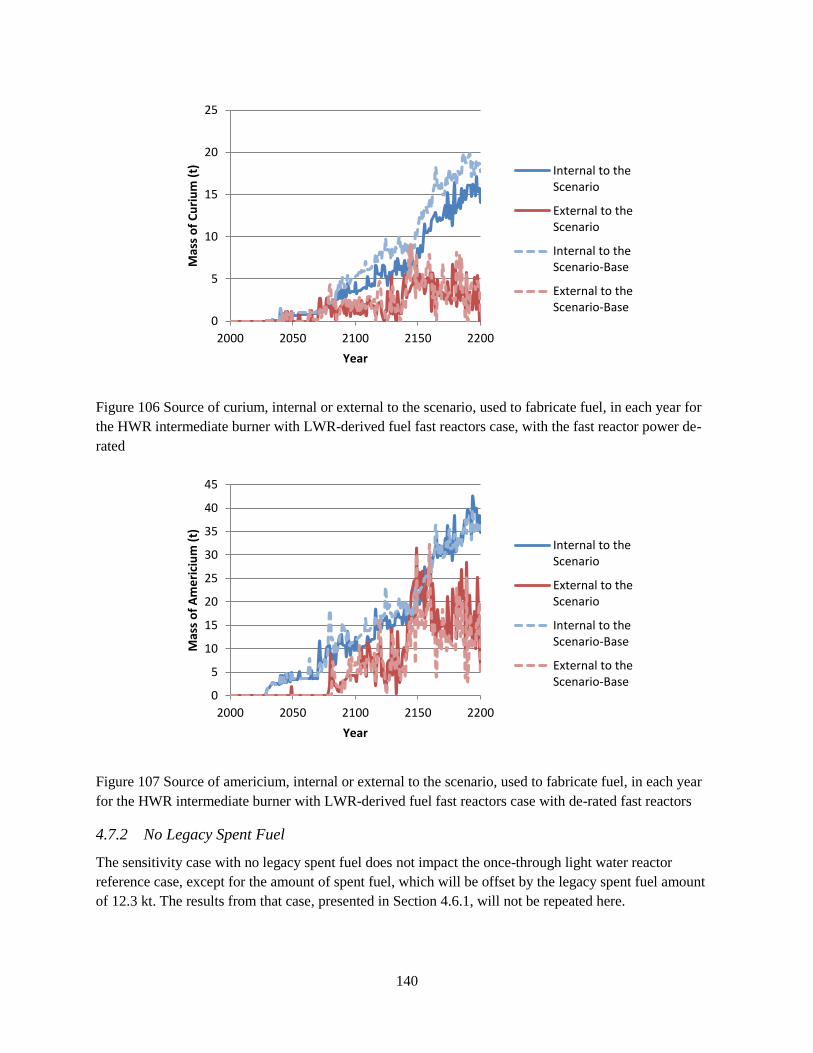
140
Figure 106 Source of curium, internal or external to the scenario, used to fabricate fuel, in each year for
the HWR intermediate burner with LWR-derived fuel fast reactors case, with the fast reactor power de-
rated
Figure 107 Source of americium, internal or external to the scenario, used to fabricate fuel, in each year
for the HWR intermediate burner with LWR-derived fuel fast reactors case with de-rated fast reactors
4.7.2 No Legacy Spent Fuel
The sensitivity case with no legacy spent fuel does not impact the once-through light water reactor
reference case, except for the amount of spent fuel, which will be offset by the legacy spent fuel amount
of 12.3 kt. The results from that case, presented in Section 4.6.1, will not be repeated here.
0
5
10
15
20
25
2000 2050 2100 2150 2200
Mas
s o
f C
uri
um
(t)
Year
Internal to theScenario
External to theScenario
Internal to theScenario-Base
External to theScenario-Base
0
5
10
15
20
25
30
35
40
45
2000 2050 2100 2150 2200
Mas
s o
f A
me
rici
um
(t)
Year
Internal to theScenario
External to theScenario
Internal to theScenario-Base
External to theScenario-Base

141
Though the absence of legacy spent fuel from the scenario does have an impact on the date in which
external americium is needed in the scenarios, this does not show up well in the figures. All figures of the
source of americium and curium are in Appendix B. The additional data of the dates in which external
Am and Cm and the amounts that are required are in Table 62. There is an appreciable impact to the
source of americium in the LWR to HWR modified open fuel cycle case (case 5), Figure 116. In this case
the internal americium runs out earlier in 2084, and a peak in external americium is seen at this date.
In each of the cases with no legacy spent fuel, the LWR spent fuel reprocessing peak that occurs in the
first year of reprocessing, 2025, decreases to 33.5 kt, Figure 109, Figure 111, Figure 113, and Figure 115.
This decrease corresponds to the change in spent fuel available, i.e. the 12.3 kt of legacy spent fuel
removed from this scenario.
No other results are impacted by the removal of the legacy spent fuel.
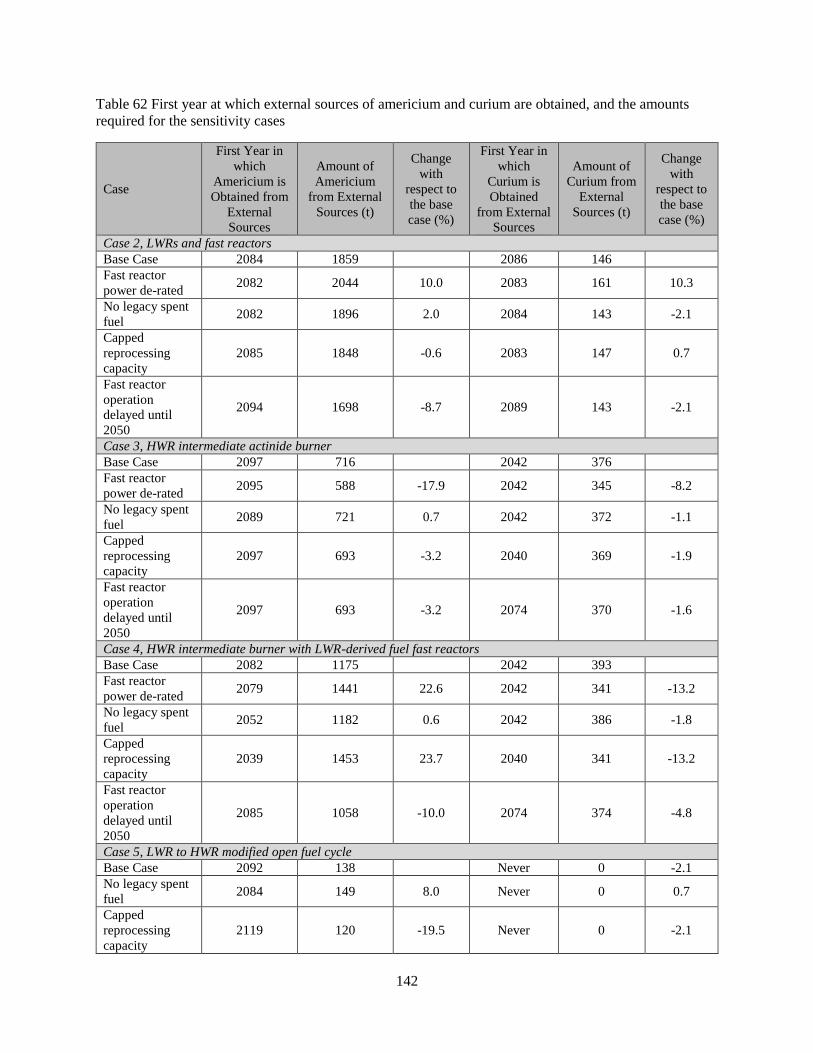
142
Table 62 First year at which external sources of americium and curium are obtained, and the amounts
required for the sensitivity cases
Case
First Year in
which
Americium is
Obtained from
External
Sources
Amount of
Americium
from External
Sources (t)
Change
with
respect to
the base
case (%)
First Year in
which
Curium is
Obtained
from External
Sources
Amount of
Curium from
External
Sources (t)
Change
with
respect to
the base
case (%)
Case 2, LWRs and fast reactors
Base Case 2084 1859 2086 146
Fast reactor
power de-rated 2082 2044 10.0 2083 161 10.3
No legacy spent
fuel 2082 1896 2.0 2084 143 -2.1
Capped
reprocessing
capacity
2085 1848 -0.6 2083 147 0.7
Fast reactor
operation
delayed until
2050
2094 1698 -8.7 2089 143 -2.1
Case 3, HWR intermediate actinide burner
Base Case 2097 716 2042 376
Fast reactor
power de-rated 2095 588 -17.9 2042 345 -8.2
No legacy spent
fuel 2089 721 0.7 2042 372 -1.1
Capped
reprocessing
capacity
2097 693 -3.2 2040 369 -1.9
Fast reactor
operation
delayed until
2050
2097 693 -3.2 2074 370 -1.6
Case 4, HWR intermediate burner with LWR-derived fuel fast reactors
Base Case 2082 1175 2042 393
Fast reactor
power de-rated 2079 1441 22.6 2042 341 -13.2
No legacy spent
fuel 2052 1182 0.6 2042 386 -1.8
Capped
reprocessing
capacity
2039 1453 23.7 2040 341 -13.2
Fast reactor
operation
delayed until
2050
2085 1058 -10.0 2074 374 -4.8
Case 5, LWR to HWR modified open fuel cycle
Base Case 2092 138 Never 0 -2.1
No legacy spent
fuel 2084 149 8.0 Never 0 0.7
Capped
reprocessing
capacity
2119 120 -19.5 Never 0 -2.1

143
4.7.2.1 Case 2, LWR with fast reactors
Figure 108 Electrical capacity in each year for each reactor type for the LWR and fast reactor case with
no legacy spent fuel
Figure 109 Mass of fuel from each reactor type reprocessed in each year for the LWR and fast reactor
case with no legacy spent fuel
0
20
40
60
80
100
120
140
160
2000 2050 2100 2150 2200
Ele
ctri
cal C
apac
ity
(GW
e)
Year
LWR
FR
Total
LWR-Base
FR-Base
0
5
10
15
20
25
30
35
40
45
50
2000 2050 2100 2150 2200
Mas
s o
f Fu
el R
ep
roce
sse
d (
kt)
Year
LWR
FR
Total
LWR-Base
FR-Base
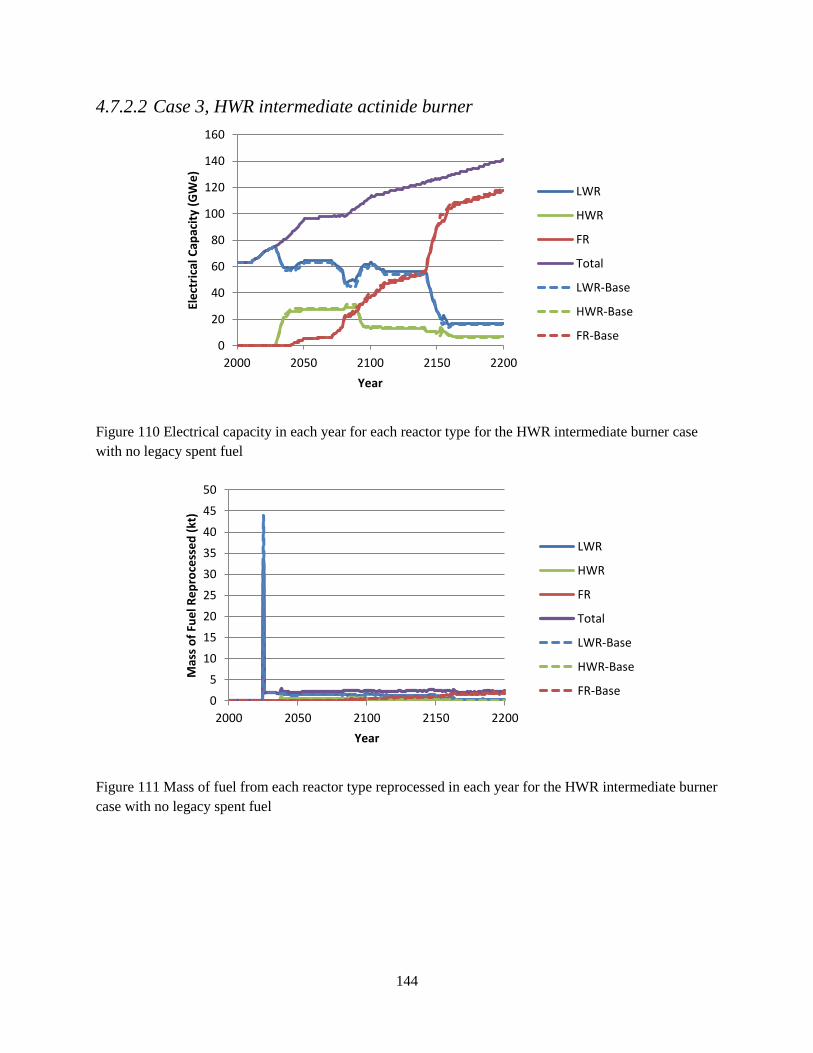
144
4.7.2.2 Case 3, HWR intermediate actinide burner
Figure 110 Electrical capacity in each year for each reactor type for the HWR intermediate burner case
with no legacy spent fuel
Figure 111 Mass of fuel from each reactor type reprocessed in each year for the HWR intermediate burner
case with no legacy spent fuel
0
20
40
60
80
100
120
140
160
2000 2050 2100 2150 2200
Ele
ctri
cal C
apac
ity
(GW
e)
Year
LWR
HWR
FR
Total
LWR-Base
HWR-Base
FR-Base
0
5
10
15
20
25
30
35
40
45
50
2000 2050 2100 2150 2200
Mas
s o
f Fu
el R
ep
roce
sse
d (
kt)
Year
LWR
HWR
FR
Total
LWR-Base
HWR-Base
FR-Base

145
4.7.2.3 Case 4, HWR intermediate burner with LWR-derived fuel fast reactors
Figure 112 Electrical capacity in each year for each reactor type for the HWR intermediate burner with
LWR-derived fuel fast reactors case with no legacy spent fuel
Figure 113 Mass of fuel from each reactor type reprocessed in each year for the HWR intermediate burner
with LWR-derived fuel fast reactors case with no legacy spent fuel
0
20
40
60
80
100
120
140
160
2000 2050 2100 2150 2200
Ele
ctri
cal C
apac
ity
(MW
e)
Year
LWR
HWR
FR-HWR
FR-LWR
Total
LWR-Base
HWR-Base
FR-HWR-Base
FR-LWR-Base
0
5
10
15
20
25
30
35
40
45
50
2000 2050 2100 2150 2200
Mas
s o
f Fu
el R
ep
roce
sse
d (
kt)
Year
LWR
HWR
FR-HWR
FR-LWR
Total
LWR-Base
HWR-Base
FR-HWR-Base
FR-LWR-Base

146
4.7.2.4 Case 5, LWR to HWR modified open fuel cycle
Figure 114 Electrical capacity in each year for each reactor type for the LWR to HWR modified open fuel
cycle case with no legacy spent fuel
Figure 115 Mass of fuel from each reactor type reprocessed in each year for the LWR to HWR modified
open fuel cycle case with no legacy spent fuel
0
20
40
60
80
100
120
140
160
2000 2050 2100 2150 2200
Ele
ctri
cal C
apac
ity
(GW
e)
Year
LWR-Base
HWR-Base
LWR
HWR
Total
0
5
10
15
20
25
30
35
40
45
50
2000 2050 2100 2150 2200
Mas
s o
f Fu
el R
ep
roce
sse
d (
kt)
Year
LWR
HWR
Total
LWR-Base

147
Figure 116 Source of americium, internal or external to the scenario, used to fabricate fuel, in each year
for the LWR to HWR modified open fuel cycle case with no legacy spent fuel
4.7.3 Capped Reprocessing Capacity
The first impact of capping the reprocessing capacity of LWR fuel is to eliminate the large spike in
reprocessed spent fuel that occurs in the first year of reprocessing in the base cases. Instead, the LWR
spent fuel reprocessing plants operate at their peak capacity of 2.5 kt year-1 for several decades, until
2092, 2076, 2056, and 2077 for cases 2 to 5, respectively, before LWR spent fuel reprocessing demand
decreases. This is shown in Figure 118, Figure 119, Figure 122, Figure 123, Figure 127, Figure 128,
Figure 133, and Figure 134 for the five sensitivity cases.
The cap on reprocessing capacity does not have any subsequent impact on the LWR with fast reactor
case. As LWR spent fuel reprocessing begins sufficiently in advance of when the first fast reactor comes
online, the fuel fabrication demands are still able to be met.
In the other scenarios in which there is less LWR spent fuel reprocessing lead time, the limit on the
reprocessing capacity impacts the rate at which HWRs, which require LWR spent fuel as fresh fuel, can
be build. LWR reprocessing begins in 2025, and the first HWR comes online in 2030.
In case 3, HWR intermediate actinide burner, fewer HWRs are built initially, but more are built later,
after 2100, Figure 120 and Figure 121. The result is that there are only two fewer HWRs in the sensitivity
case. Thus, the overall composition of the fuel cycle remains similar, and no other parameters change
significantly.
In case 4, HWR intermediate burner with LWR-derived fuel fast reactors, the lack of fuel available to
build HWRs initially means that fewer HWRs are built in this scenario (Figure 124 and Figure 125) as
they are not permitted to come online after the fast reactors become available in 2050. Therefore, less
HWR fuel is available to build FR-HWRs. More LWR spent fuel is available to fuel FR-LWRs, and the
overall effect is that this scenario becomes more like case 2, LWRs with fast reactors: uranium ore
0
0.5
1
1.5
2
2.5
3
3.5
4
2000 2050 2100 2150 2200
Mas
s o
f A
me
rici
um
(t)
Year
Internal to theScenario
External to theScenario
Internal to theScenario-Base
External to theScenario-Base
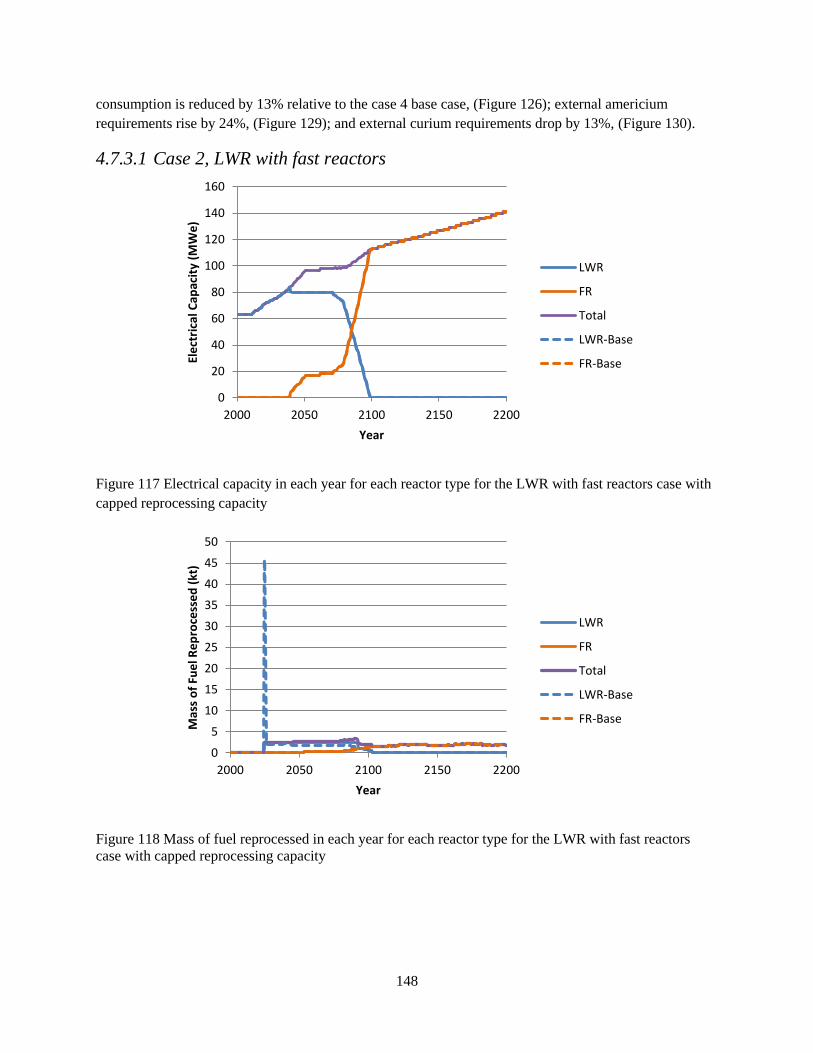
148
consumption is reduced by 13% relative to the case 4 base case, (Figure 126); external americium
requirements rise by 24%, (Figure 129); and external curium requirements drop by 13%, (Figure 130).
4.7.3.1 Case 2, LWR with fast reactors
Figure 117 Electrical capacity in each year for each reactor type for the LWR with fast reactors case with
capped reprocessing capacity
Figure 118 Mass of fuel reprocessed in each year for each reactor type for the LWR with fast reactors
case with capped reprocessing capacity
0
20
40
60
80
100
120
140
160
2000 2050 2100 2150 2200
Ele
ctri
cal C
apac
ity
(MW
e)
Year
LWR
FR
Total
LWR-Base
FR-Base
0
5
10
15
20
25
30
35
40
45
50
2000 2050 2100 2150 2200
Mas
s o
f Fu
el R
ep
roce
sse
d (
kt)
Year
LWR
FR
Total
LWR-Base
FR-Base
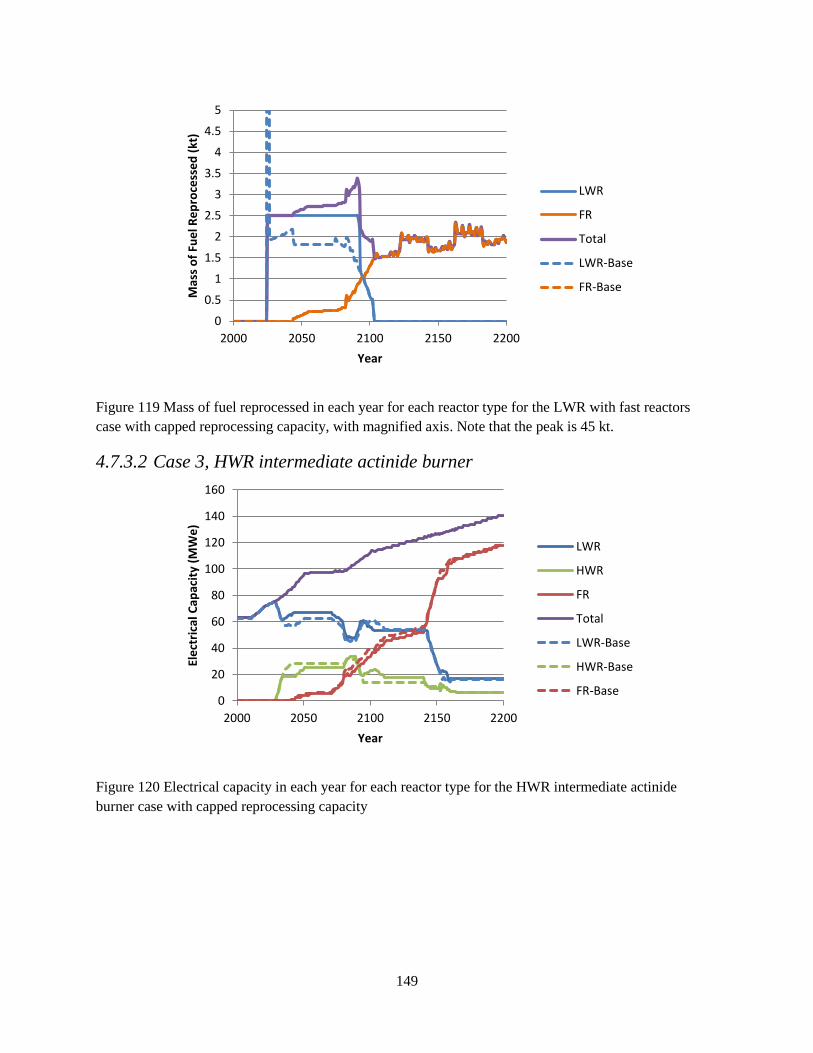
149
Figure 119 Mass of fuel reprocessed in each year for each reactor type for the LWR with fast reactors
case with capped reprocessing capacity, with magnified axis. Note that the peak is 45 kt.
4.7.3.2 Case 3, HWR intermediate actinide burner
Figure 120 Electrical capacity in each year for each reactor type for the HWR intermediate actinide
burner case with capped reprocessing capacity
0
0.5
1
1.5
2
2.5
3
3.5
4
4.5
5
2000 2050 2100 2150 2200
Mas
s o
f Fu
el R
ep
roce
sse
d (
kt)
Year
LWR
FR
Total
LWR-Base
FR-Base
0
20
40
60
80
100
120
140
160
2000 2050 2100 2150 2200
Ele
ctri
cal C
apac
ity
(MW
e)
Year
LWR
HWR
FR
Total
LWR-Base
HWR-Base
FR-Base

150
Figure 121 The number of operating reactors in each year for each reactor type for the HWR intermediate
actinide burner case with capped reprocessing capacity
Figure 122 Mass of fuel reprocessed in each year for each reactor type for the HWR intermediate actinide
burner case with capped reprocessing capacity
0
20
40
60
80
100
120
140
160
2000 2050 2100 2150 2200
Op
era
tin
g R
eac
tors
Year
LWR
HWR
FR
Total
LWR-Base
HWR-Base
FR-Base
0
5
10
15
20
25
30
35
40
45
50
2000 2050 2100 2150 2200
Mas
s o
f Fu
el R
ep
roce
sse
d (
kt)
Year
LWR
HWR
FR
Total
LWR-Base
HWR-Base
FR-Base

151
Figure 123 Mass of fuel reprocessed in each year for each reactor type for the HWR intermediate actinide
burner case with capped reprocessing capacity, with magnified axis. Note that the top of the peak is 45 kt.
4.7.3.3 Case 4, HWR intermediate burner with LWR-derived fuel fast reactors
Figure 124 Electrical capacity in each year for each reactor type for the HWR intermediate burner with
LWR-derived fuel fast reactors case with capped reprocessing capacity
0
0.5
1
1.5
2
2.5
3
3.5
4
4.5
5
2000 2050 2100 2150 2200
Mas
s o
f Fu
el R
ep
roce
sse
d (
kt)
Year
LWR
HWR
FR
Total
LWR-Base
HWR-Base
FR-Base
0
20
40
60
80
100
120
140
160
2000 2050 2100 2150 2200
Ele
ctri
cal C
apac
ity
(MW
e)
Year
LWR
HWR
FR-HWR
FR-LWR
Total
LWR-Base
HWR-Base
FR-HWR-Base
FR-LWR-Base
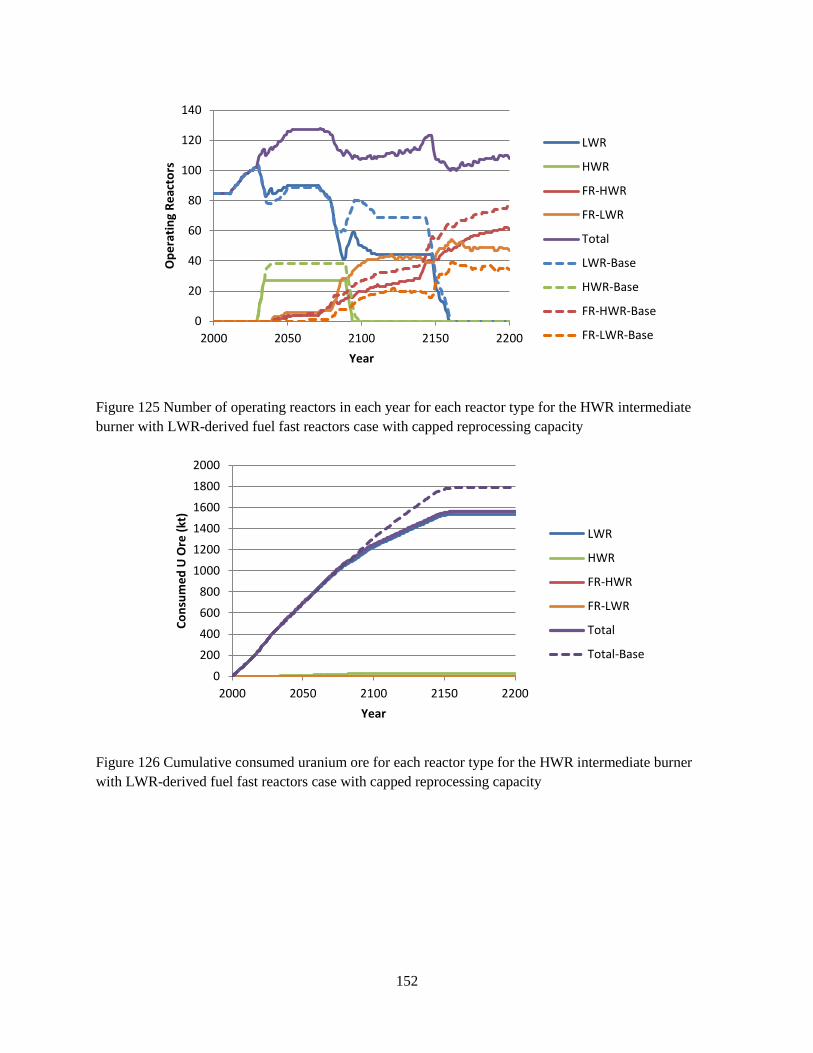
152
Figure 125 Number of operating reactors in each year for each reactor type for the HWR intermediate
burner with LWR-derived fuel fast reactors case with capped reprocessing capacity
Figure 126 Cumulative consumed uranium ore for each reactor type for the HWR intermediate burner
with LWR-derived fuel fast reactors case with capped reprocessing capacity
0
20
40
60
80
100
120
140
2000 2050 2100 2150 2200
Op
era
tin
g R
eac
tors
Year
LWR
HWR
FR-HWR
FR-LWR
Total
LWR-Base
HWR-Base
FR-HWR-Base
FR-LWR-Base
0
200
400
600
800
1000
1200
1400
1600
1800
2000
2000 2050 2100 2150 2200
Co
nsu
me
d U
Ore
(kt
)
Year
LWR
HWR
FR-HWR
FR-LWR
Total
Total-Base
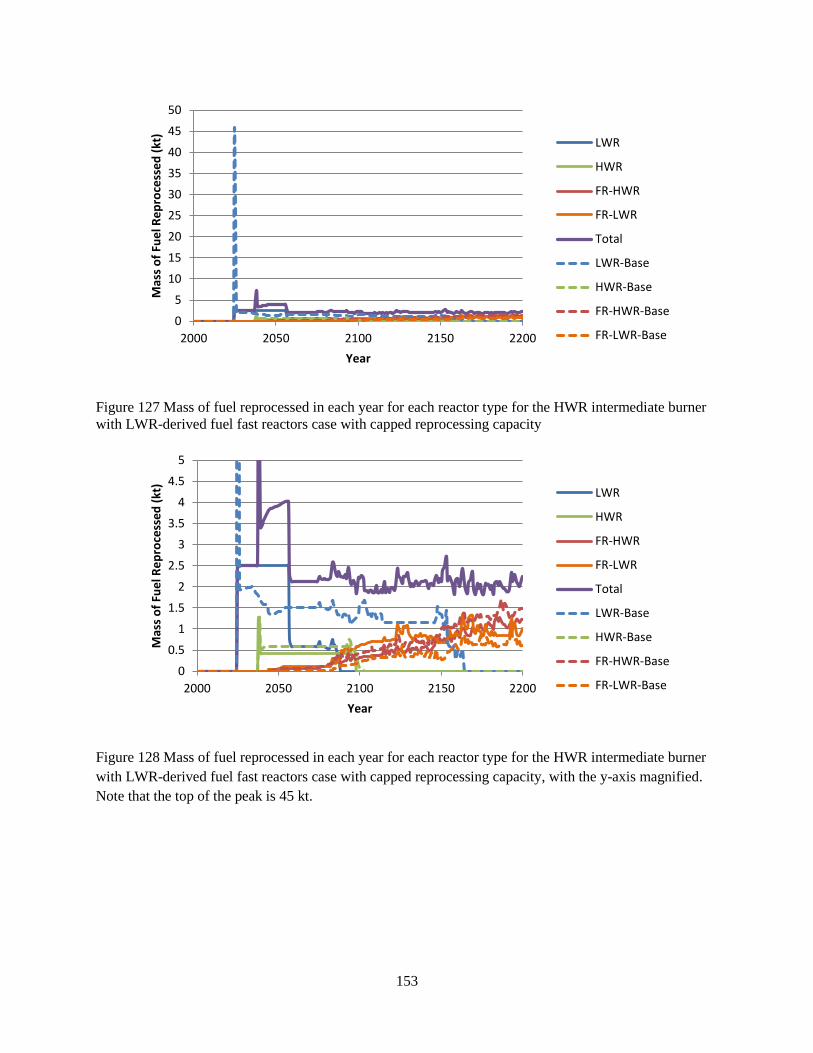
153
Figure 127 Mass of fuel reprocessed in each year for each reactor type for the HWR intermediate burner
with LWR-derived fuel fast reactors case with capped reprocessing capacity
Figure 128 Mass of fuel reprocessed in each year for each reactor type for the HWR intermediate burner
with LWR-derived fuel fast reactors case with capped reprocessing capacity, with the y-axis magnified.
Note that the top of the peak is 45 kt.
0
5
10
15
20
25
30
35
40
45
50
2000 2050 2100 2150 2200
Mas
s o
f Fu
el R
ep
roce
sse
d (
kt)
Year
LWR
HWR
FR-HWR
FR-LWR
Total
LWR-Base
HWR-Base
FR-HWR-Base
FR-LWR-Base
0
0.5
1
1.5
2
2.5
3
3.5
4
4.5
5
2000 2050 2100 2150 2200
Mas
s o
f Fu
el R
ep
roce
sse
d (
kt)
Year
LWR
HWR
FR-HWR
FR-LWR
Total
LWR-Base
HWR-Base
FR-HWR-Base
FR-LWR-Base
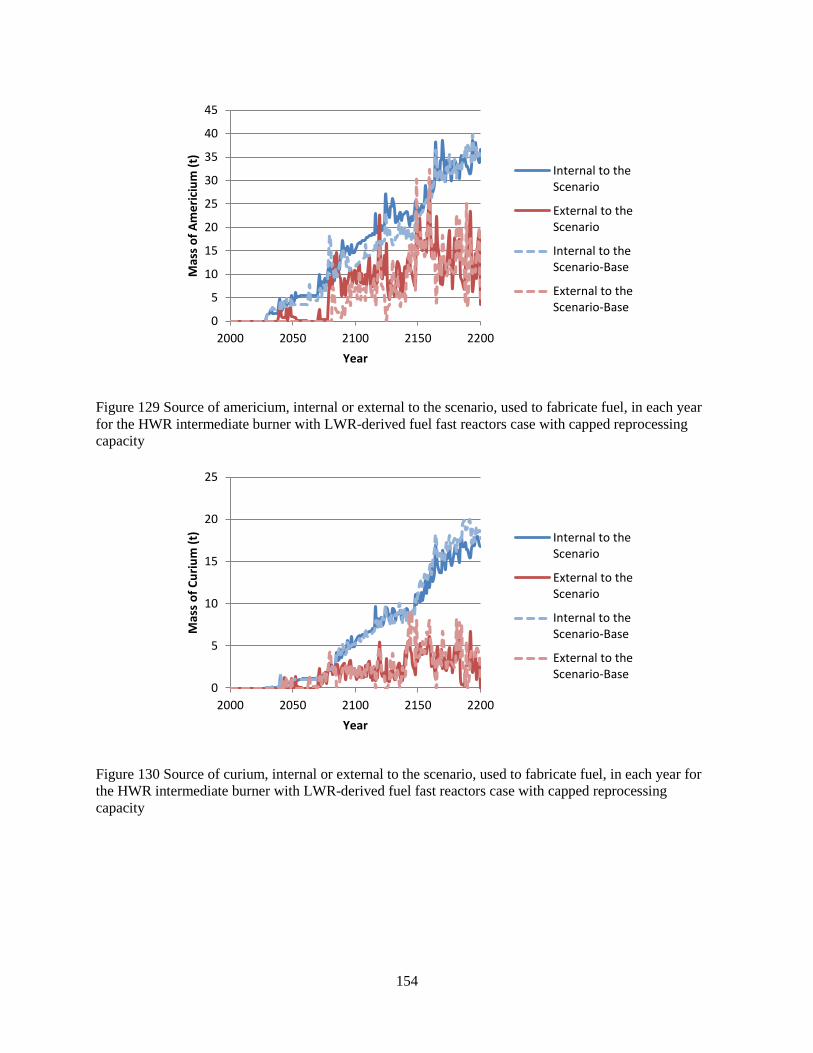
154
Figure 129 Source of americium, internal or external to the scenario, used to fabricate fuel, in each year
for the HWR intermediate burner with LWR-derived fuel fast reactors case with capped reprocessing
capacity
Figure 130 Source of curium, internal or external to the scenario, used to fabricate fuel, in each year for
the HWR intermediate burner with LWR-derived fuel fast reactors case with capped reprocessing
capacity
0
5
10
15
20
25
30
35
40
45
2000 2050 2100 2150 2200
Mas
s o
f A
me
rici
um
(t)
Year
Internal to theScenario
External to theScenario
Internal to theScenario-Base
External to theScenario-Base
0
5
10
15
20
25
2000 2050 2100 2150 2200
Mas
s o
f C
uri
um
(t)
Year
Internal to theScenario
External to theScenario
Internal to theScenario-Base
External to theScenario-Base
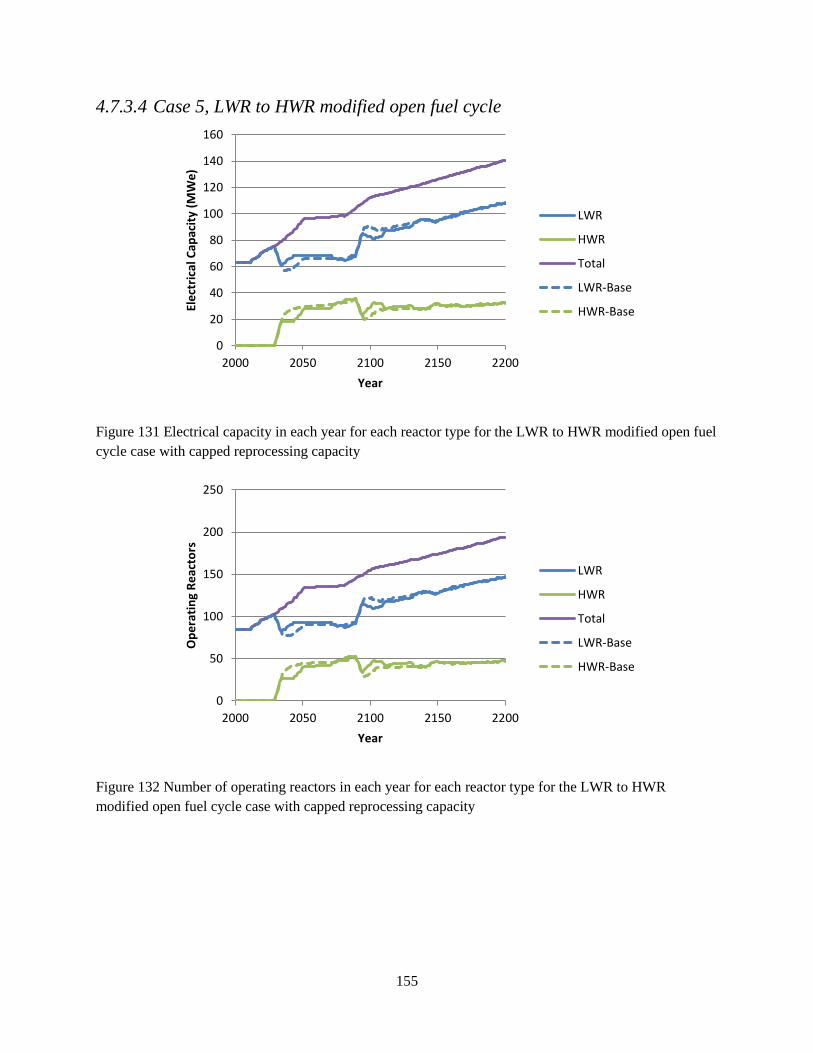
155
4.7.3.4 Case 5, LWR to HWR modified open fuel cycle
Figure 131 Electrical capacity in each year for each reactor type for the LWR to HWR modified open fuel
cycle case with capped reprocessing capacity
Figure 132 Number of operating reactors in each year for each reactor type for the LWR to HWR
modified open fuel cycle case with capped reprocessing capacity
0
20
40
60
80
100
120
140
160
2000 2050 2100 2150 2200
Ele
ctri
cal C
apac
ity
(MW
e)
Year
LWR
HWR
Total
LWR-Base
HWR-Base
0
50
100
150
200
250
2000 2050 2100 2150 2200
Op
era
tin
g R
eac
tors
Year
LWR
HWR
Total
LWR-Base
HWR-Base
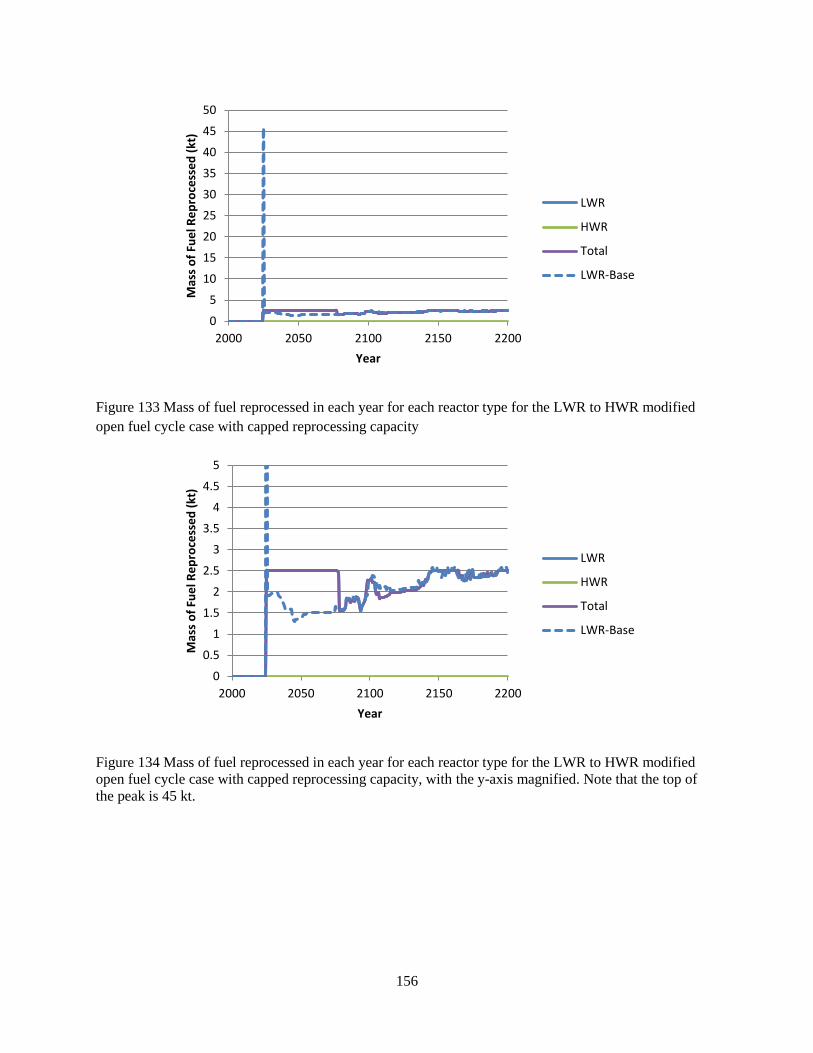
156
Figure 133 Mass of fuel reprocessed in each year for each reactor type for the LWR to HWR modified
open fuel cycle case with capped reprocessing capacity
Figure 134 Mass of fuel reprocessed in each year for each reactor type for the LWR to HWR modified
open fuel cycle case with capped reprocessing capacity, with the y-axis magnified. Note that the top of
the peak is 45 kt.
0
5
10
15
20
25
30
35
40
45
50
2000 2050 2100 2150 2200
Mas
s o
f Fu
el R
ep
roce
sse
d (
kt)
Year
LWR
HWR
Total
LWR-Base
0
0.5
1
1.5
2
2.5
3
3.5
4
4.5
5
2000 2050 2100 2150 2200
Mas
s o
f Fu
el R
ep
roce
sse
d (
kt)
Year
LWR
HWR
Total
LWR-Base

157
Figure 135 Source of americium, internal or external to the scenario, used to fabricate fuel, in each year
for the LWR to HWR modified open fuel cycle case with capped reprocessing capacity
4.7.4 Delayed Fast Reactor Operation Date
A delay in the availability of fast reactors by 10 years to 2050 still has these reactors available to operate
when the second wave of reactor builds occurs in 2080. Thus, this delay does not have a large impact on
the performance parameters of the fuel cycle scenarios. Fewer fast reactors are built in these cases, but the
numbers are not large; 14, 8, and 13(Table 61). This is a change of 3.5%-4.6%, which is not significant in
the context of the uncertainties in the input parameters of the scenarios.
In the case 2 (LWRs and fast reactors) base case, there is a sort of fast reactor “introductory period”,
where a relatively small number of FRs are built, between 2040 and 2070. Around 2070 the number of
fast reactor builds takes off, and the number of fast reactors, and associated electrical capacity escalates.
In the delayed operation case this “introductory period” is shortened, see Figure 136 and Figure 137.
There are fewer fast reactors built up to 2070, as LWRs must be built instead between 2040 and 2050.
However, the rapid increase in fast reactors around 2070 still occurs. The 10 year delay in starting fast
reactor operation does not have a large impact, since fast reactors can be brought online in time for the
2070-2080 reactor growth wave.
One parameter that significantly changes is the uranium ore consumption for case 2, LWRs with fast
reactors. In this case, the decrease of 14 fast reactors and corresponding increase of 19 LWRs in the fuel
cycle results in an increase in uranium requirements of 13%, Figure 138 and Table 63. A smaller effect,
an increase of 4%, is found for case 4, HWR intermediate burner with LWR-derived fuel fast reactors,
0
0.5
1
1.5
2
2.5
3
3.5
4
2000 2050 2100 2150 2200
Mas
s o
f A
me
rici
um
(t)
Year
Internal to theScenario
External to theScenario
Internal to theScenario-Base
External to theScenario-Base

158
Figure 147. For case 4 there are 13 fewer fast reactors and 12 more LWRs in the delayed fast reactor
scenario than in the base case.
Table 63 Uranium consumption, comparison with the reference once-through case, and percentage of
worldwide uranium resources required for the sensitivity cases
Sensitivity Case Total Uranium
Consumption (kt)
Change in U
consumption vs. Base
Case
Percentage of
Worldwide Uranium
Resources Required
Case 2, LWRs and fast reactors
Base Case 1299 17%
Fast reactor power de-rated 1299 0 17%
No legacy spent fuel 1299 0 17%
Capped reprocessing capacity 1299 0 17%
Fast reactor operation delayed
until 2050 1470 +13% 19%
Case 3, HWR intermediate actinide burner
Base Case 1966 26%
Fast reactor power de-rated 2518 +28% 33%
No legacy spent fuel 2019 +2.7% 26%
Capped reprocessing capacity 2026 +3.0% 27%
Fast reactor operation delayed
until 2050 2013 +2.4% 26%
Case 4, HWR intermediate burner with LWR-derived fuel fast reactors
Base Case 1786 23%
Fast reactor power de-rated 1957 +7.6% 26%
No legacy spent fuel 1811 +1.4% 24%
Capped reprocessing capacity 1559 -13% 20%
Fast reactor operation delayed
until 2050 1900 +4.1% 25%
Case 5, LWR to HWR modified open fuel cycle
Base Case 3484 46%
No legacy spent fuel 3503 +0.5% 46%
Capped reprocessing capacity 3486 +0.02% 46%
The mass of LWR spent fuel reprocessed changes slightly, mirroring the change in the electrical capacity
produced by the reactor types, Figure 139, Figure 143, and Figure 148.
There are also changes to the dates that external americium and curium are required, and the total
amounts of the elements needed. The largest changes (Table 62) are:
a delay of 10 years in the need for external americium, from 2084 to 2094 for case 2, LWRs with
fast reactors, Figure 140
a decrease of 9% in the amount of external americium required for case 2, LWRs with fast
reactors, Figure 140
a delay of 30 years in the need for external curium from 2042 to 2074 for both case 3, HWR
intermediate actinide burner, and case 4, HWR intermediate burner with LWR-derived fuel fast
reactor, Figure 144 and Figure 150
a decrease of 10% in the amount of external americium required for case 4, HWR intermediate
burner with LWR-derived fuel fast reactor, Figure 149
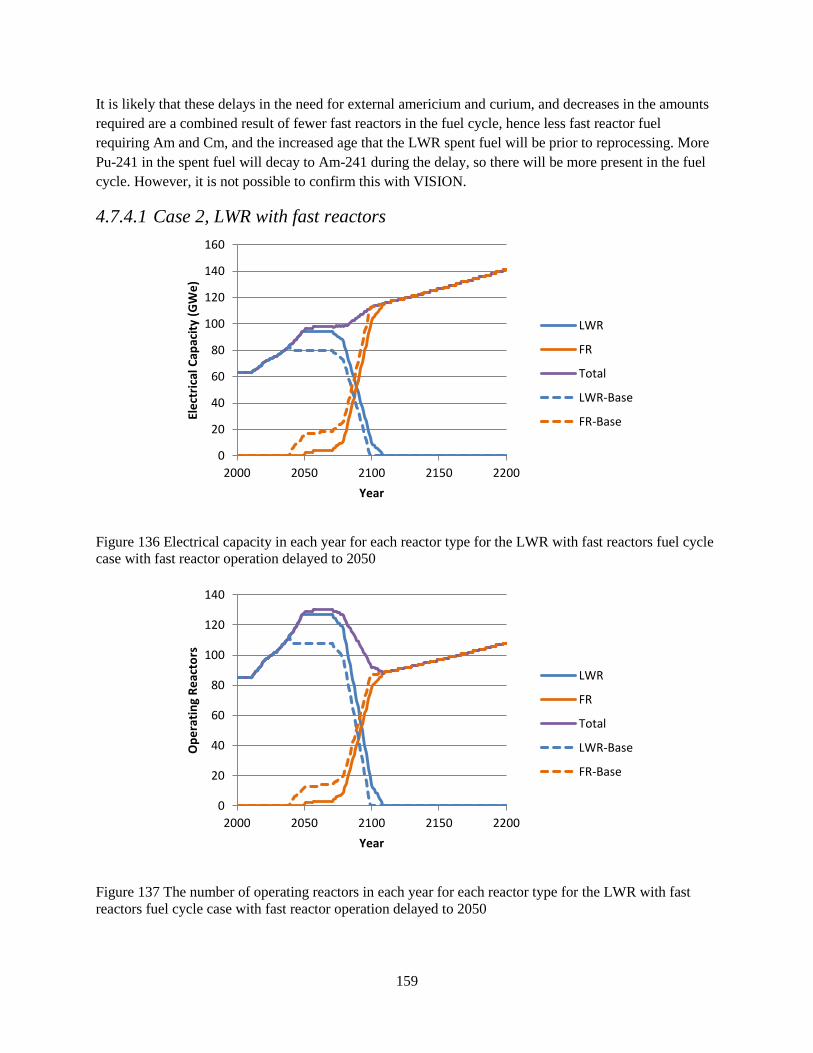
159
It is likely that these delays in the need for external americium and curium, and decreases in the amounts
required are a combined result of fewer fast reactors in the fuel cycle, hence less fast reactor fuel
requiring Am and Cm, and the increased age that the LWR spent fuel will be prior to reprocessing. More
Pu-241 in the spent fuel will decay to Am-241 during the delay, so there will be more present in the fuel
cycle. However, it is not possible to confirm this with VISION.
4.7.4.1 Case 2, LWR with fast reactors
Figure 136 Electrical capacity in each year for each reactor type for the LWR with fast reactors fuel cycle
case with fast reactor operation delayed to 2050
Figure 137 The number of operating reactors in each year for each reactor type for the LWR with fast
reactors fuel cycle case with fast reactor operation delayed to 2050
0
20
40
60
80
100
120
140
160
2000 2050 2100 2150 2200
Ele
ctri
cal C
apac
ity
(GW
e)
Year
LWR
FR
Total
LWR-Base
FR-Base
0
20
40
60
80
100
120
140
2000 2050 2100 2150 2200
Op
era
tin
g R
eac
tors
Year
LWR
FR
Total
LWR-Base
FR-Base

160
Figure 138 Cumulative uranium ore consumption in each year for each reactor type for the LWR with fast
reactors fuel cycle case with fast reactor operation delayed to 2050
Figure 139 Mass of fuel reprocessed in each year for each reactor type for the LWR with fast reactors fuel
cycle case with fast reactor operation delayed to 2050, with y-axis magnified. Note that the top of the
peak is 45 kt.
0
200
400
600
800
1000
1200
1400
1600
2000 2050 2100 2150 2200
Co
nsu
me
d U
Ore
(kt
)
Year
LWR
FR
Total
Total-Base
0
0.5
1
1.5
2
2.5
3
3.5
4
4.5
5
2000 2050 2100 2150 2200
Mas
s o
f Fu
el R
ep
roce
sse
d (
kt)
Year
LWR
FR
Total
LWR-Base
FR-Base
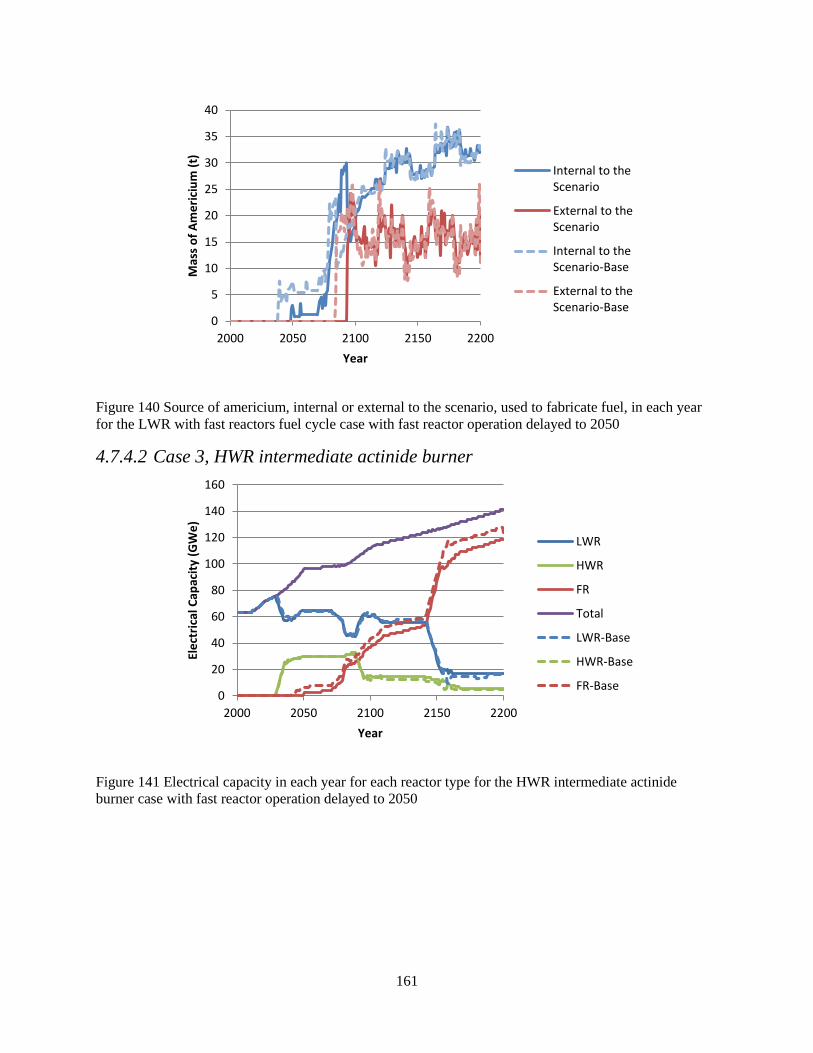
161
Figure 140 Source of americium, internal or external to the scenario, used to fabricate fuel, in each year
for the LWR with fast reactors fuel cycle case with fast reactor operation delayed to 2050
4.7.4.2 Case 3, HWR intermediate actinide burner
Figure 141 Electrical capacity in each year for each reactor type for the HWR intermediate actinide
burner case with fast reactor operation delayed to 2050
0
5
10
15
20
25
30
35
40
2000 2050 2100 2150 2200
Mas
s o
f A
me
rici
um
(t)
Year
Internal to theScenario
External to theScenario
Internal to theScenario-Base
External to theScenario-Base
0
20
40
60
80
100
120
140
160
2000 2050 2100 2150 2200
Ele
ctri
cal C
apac
ity
(GW
e)
Year
LWR
HWR
FR
Total
LWR-Base
HWR-Base
FR-Base
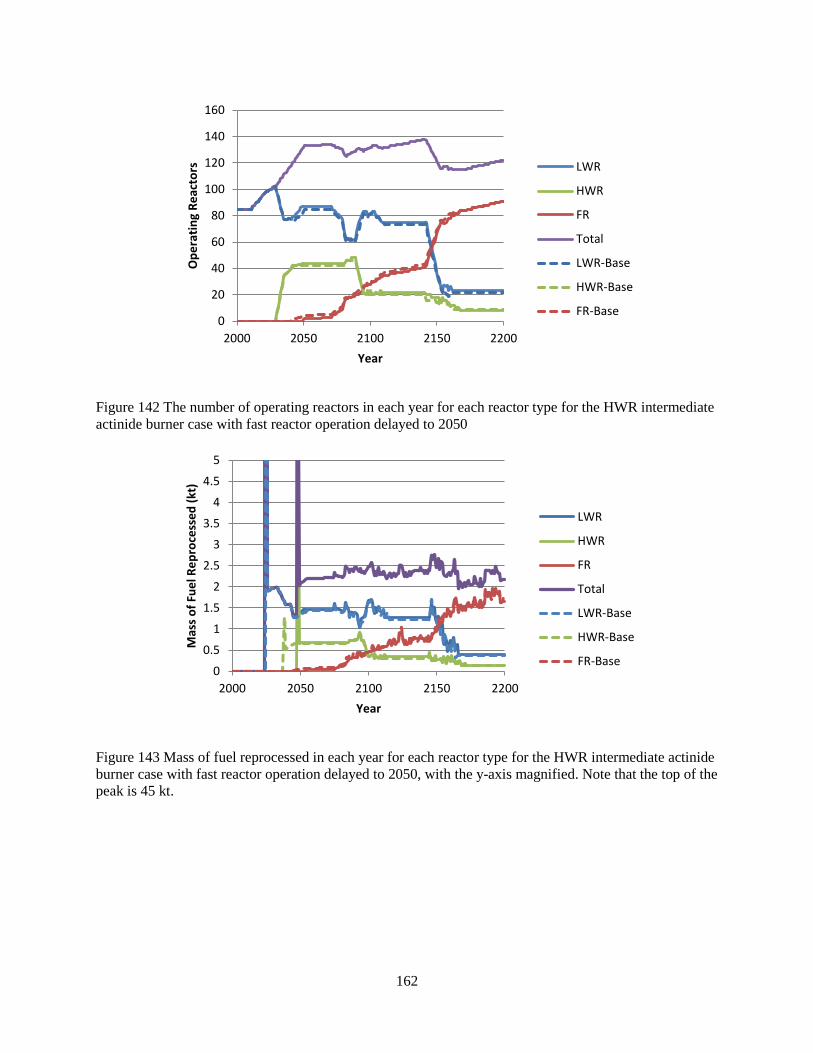
162
Figure 142 The number of operating reactors in each year for each reactor type for the HWR intermediate
actinide burner case with fast reactor operation delayed to 2050
Figure 143 Mass of fuel reprocessed in each year for each reactor type for the HWR intermediate actinide
burner case with fast reactor operation delayed to 2050, with the y-axis magnified. Note that the top of the
peak is 45 kt.
0
20
40
60
80
100
120
140
160
2000 2050 2100 2150 2200
Op
era
tin
g R
eac
tors
Year
LWR
HWR
FR
Total
LWR-Base
HWR-Base
FR-Base
0
0.5
1
1.5
2
2.5
3
3.5
4
4.5
5
2000 2050 2100 2150 2200
Mas
s o
f Fu
el R
ep
roce
sse
d (
kt)
Year
LWR
HWR
FR
Total
LWR-Base
HWR-Base
FR-Base
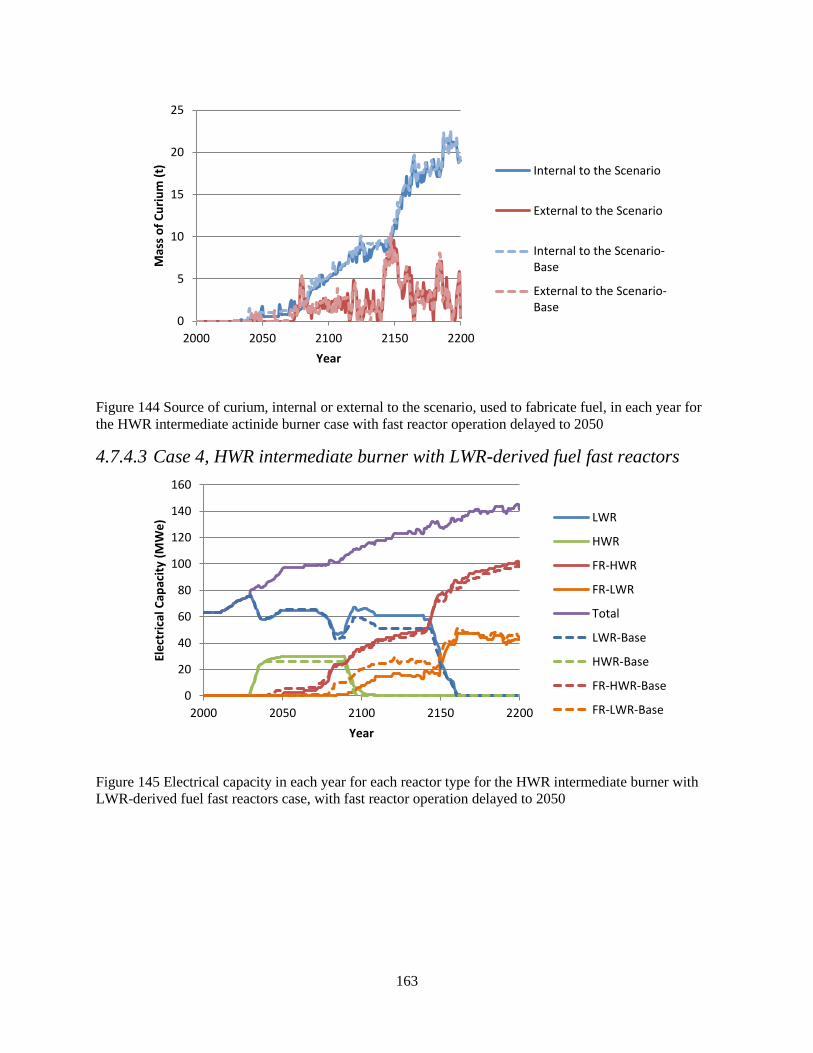
163
Figure 144 Source of curium, internal or external to the scenario, used to fabricate fuel, in each year for
the HWR intermediate actinide burner case with fast reactor operation delayed to 2050
4.7.4.3 Case 4, HWR intermediate burner with LWR-derived fuel fast reactors
Figure 145 Electrical capacity in each year for each reactor type for the HWR intermediate burner with
LWR-derived fuel fast reactors case, with fast reactor operation delayed to 2050
0
5
10
15
20
25
2000 2050 2100 2150 2200
Mas
s o
f C
uri
um
(t)
Year
Internal to the Scenario
External to the Scenario
Internal to the Scenario-Base
External to the Scenario-Base
0
20
40
60
80
100
120
140
160
2000 2050 2100 2150 2200
Ele
ctri
cal C
apac
ity
(MW
e)
Year
LWR
HWR
FR-HWR
FR-LWR
Total
LWR-Base
HWR-Base
FR-HWR-Base
FR-LWR-Base
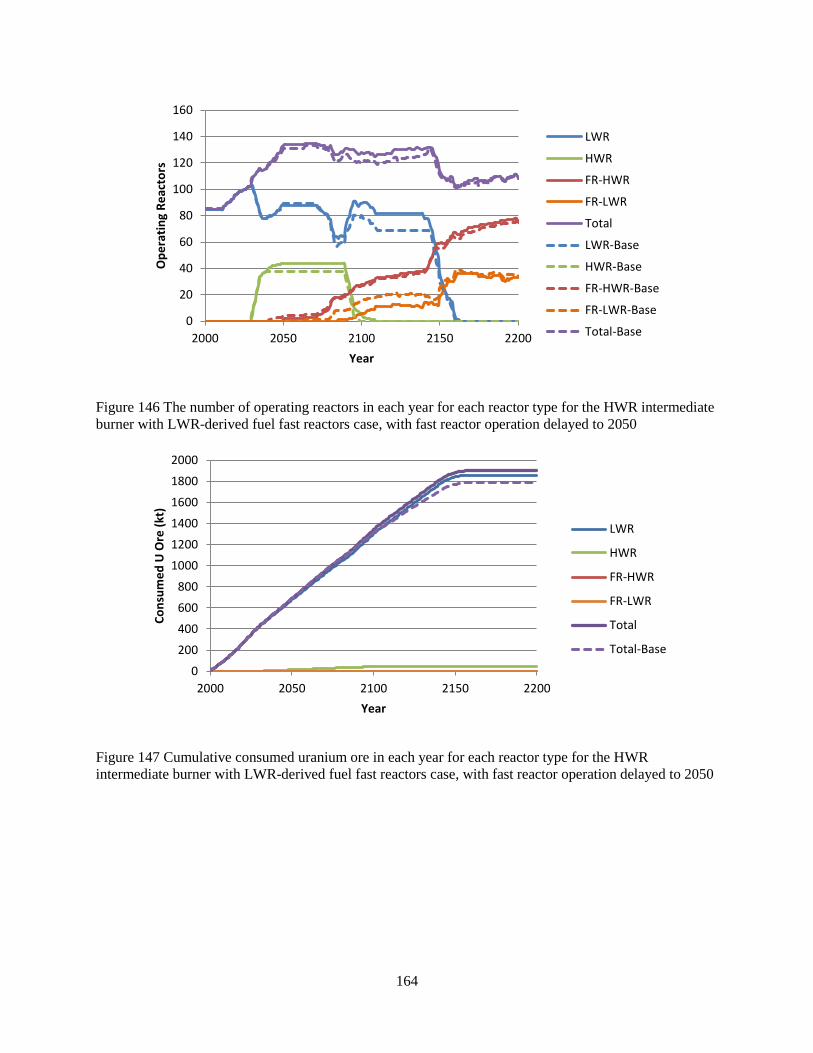
164
Figure 146 The number of operating reactors in each year for each reactor type for the HWR intermediate
burner with LWR-derived fuel fast reactors case, with fast reactor operation delayed to 2050
Figure 147 Cumulative consumed uranium ore in each year for each reactor type for the HWR
intermediate burner with LWR-derived fuel fast reactors case, with fast reactor operation delayed to 2050
0
20
40
60
80
100
120
140
160
2000 2050 2100 2150 2200
Op
era
tin
g R
eac
tors
Year
LWR
HWR
FR-HWR
FR-LWR
Total
LWR-Base
HWR-Base
FR-HWR-Base
FR-LWR-Base
Total-Base
0
200
400
600
800
1000
1200
1400
1600
1800
2000
2000 2050 2100 2150 2200
Co
nsu
me
d U
Ore
(kt
)
Year
LWR
HWR
FR-HWR
FR-LWR
Total
Total-Base
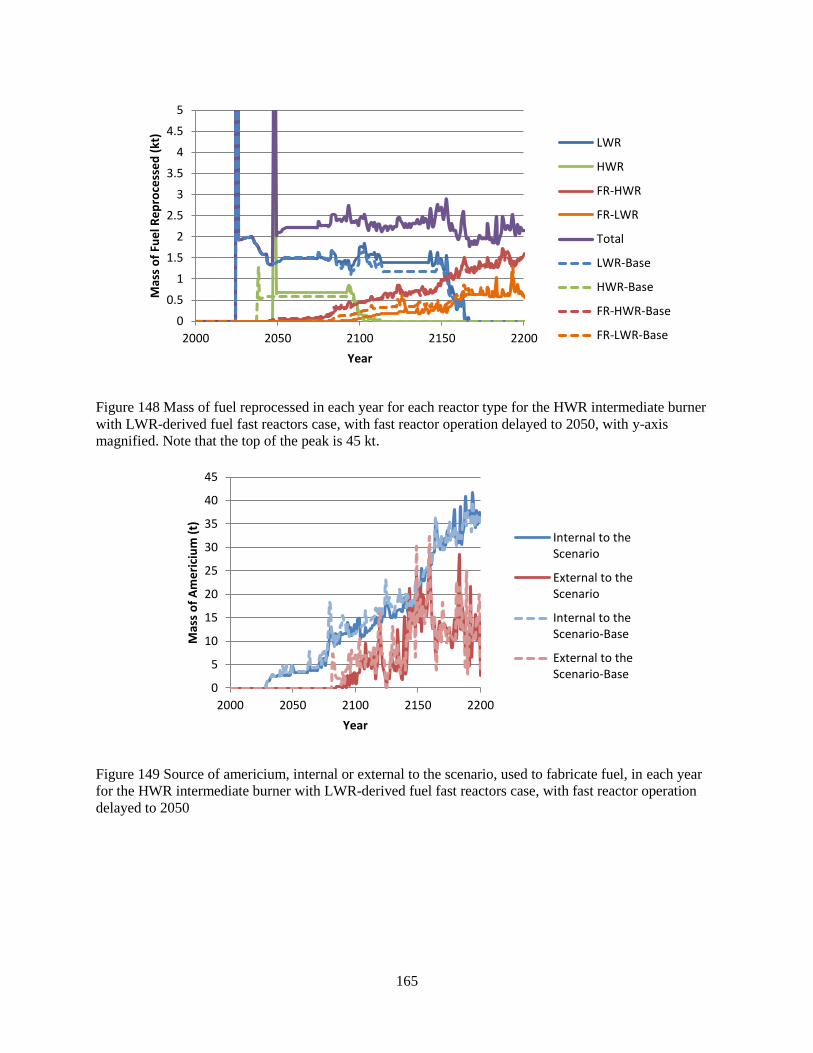
165
Figure 148 Mass of fuel reprocessed in each year for each reactor type for the HWR intermediate burner
with LWR-derived fuel fast reactors case, with fast reactor operation delayed to 2050, with y-axis
magnified. Note that the top of the peak is 45 kt.
Figure 149 Source of americium, internal or external to the scenario, used to fabricate fuel, in each year
for the HWR intermediate burner with LWR-derived fuel fast reactors case, with fast reactor operation
delayed to 2050
0
0.5
1
1.5
2
2.5
3
3.5
4
4.5
5
2000 2050 2100 2150 2200
Mas
s o
f Fu
el R
ep
roce
sse
d (
kt)
Year
LWR
HWR
FR-HWR
FR-LWR
Total
LWR-Base
HWR-Base
FR-HWR-Base
FR-LWR-Base
0
5
10
15
20
25
30
35
40
45
2000 2050 2100 2150 2200
Mas
s o
f A
me
rici
um
(t)
Year
Internal to theScenario
External to theScenario
Internal to theScenario-Base
External to theScenario-Base
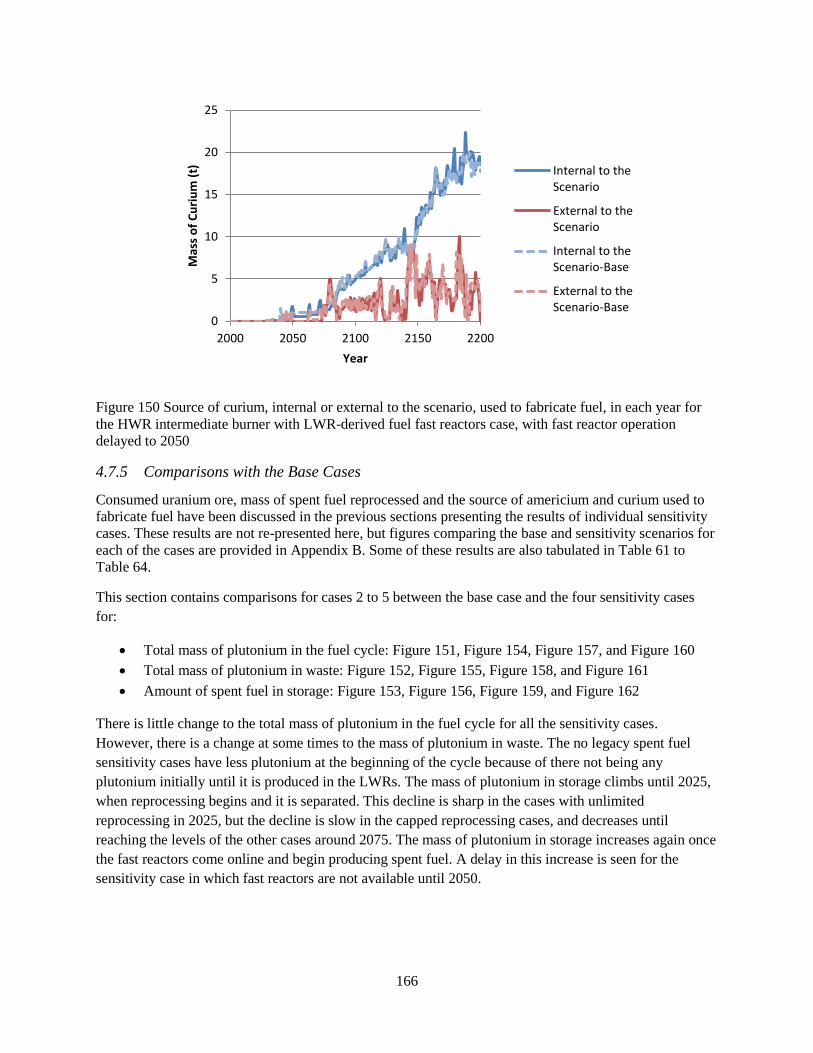
166
Figure 150 Source of curium, internal or external to the scenario, used to fabricate fuel, in each year for
the HWR intermediate burner with LWR-derived fuel fast reactors case, with fast reactor operation
delayed to 2050
4.7.5 Comparisons with the Base Cases
Consumed uranium ore, mass of spent fuel reprocessed and the source of americium and curium used to
fabricate fuel have been discussed in the previous sections presenting the results of individual sensitivity
cases. These results are not re-presented here, but figures comparing the base and sensitivity scenarios for
each of the cases are provided in Appendix B. Some of these results are also tabulated in Table 61 to
Table 64.
This section contains comparisons for cases 2 to 5 between the base case and the four sensitivity cases
for:
Total mass of plutonium in the fuel cycle: Figure 151, Figure 154, Figure 157, and Figure 160
Total mass of plutonium in waste: Figure 152, Figure 155, Figure 158, and Figure 161
Amount of spent fuel in storage: Figure 153, Figure 156, Figure 159, and Figure 162
There is little change to the total mass of plutonium in the fuel cycle for all the sensitivity cases.
However, there is a change at some times to the mass of plutonium in waste. The no legacy spent fuel
sensitivity cases have less plutonium at the beginning of the cycle because of there not being any
plutonium initially until it is produced in the LWRs. The mass of plutonium in storage climbs until 2025,
when reprocessing begins and it is separated. This decline is sharp in the cases with unlimited
reprocessing in 2025, but the decline is slow in the capped reprocessing cases, and decreases until
reaching the levels of the other cases around 2075. The mass of plutonium in storage increases again once
the fast reactors come online and begin producing spent fuel. A delay in this increase is seen for the
sensitivity case in which fast reactors are not available until 2050.
0
5
10
15
20
25
2000 2050 2100 2150 2200
Mas
s o
f C
uri
um
(t)
Year
Internal to theScenario
External to theScenario
Internal to theScenario-Base
External to theScenario-Base
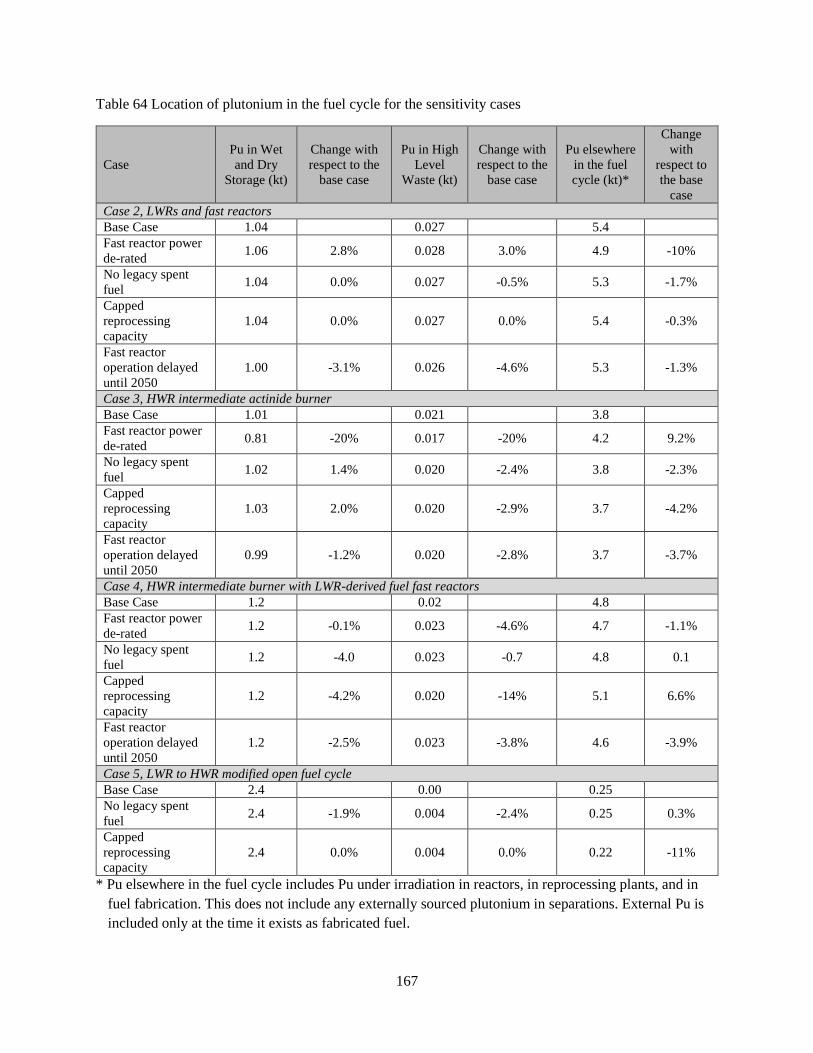
167
Table 64 Location of plutonium in the fuel cycle for the sensitivity cases
Case
Pu in Wet
and Dry
Storage (kt)
Change with
respect to the
base case
Pu in High
Level
Waste (kt)
Change with
respect to the
base case
Pu elsewhere
in the fuel
cycle (kt)*
Change
with
respect to
the base
case
Case 2, LWRs and fast reactors
Base Case 1.04 0.027 5.4
Fast reactor power
de-rated 1.06 2.8% 0.028 3.0% 4.9 -10%
No legacy spent
fuel 1.04 0.0% 0.027 -0.5% 5.3 -1.7%
Capped
reprocessing
capacity
1.04 0.0% 0.027 0.0% 5.4 -0.3%
Fast reactor
operation delayed
until 2050
1.00 -3.1% 0.026 -4.6% 5.3 -1.3%
Case 3, HWR intermediate actinide burner
Base Case 1.01 0.021 3.8
Fast reactor power
de-rated 0.81 -20% 0.017 -20% 4.2 9.2%
No legacy spent
fuel 1.02 1.4% 0.020 -2.4% 3.8 -2.3%
Capped
reprocessing
capacity
1.03 2.0% 0.020 -2.9% 3.7 -4.2%
Fast reactor
operation delayed
until 2050
0.99 -1.2% 0.020 -2.8% 3.7 -3.7%
Case 4, HWR intermediate burner with LWR-derived fuel fast reactors
Base Case 1.2 0.02 4.8
Fast reactor power
de-rated 1.2 -0.1% 0.023 -4.6% 4.7 -1.1%
No legacy spent
fuel 1.2 -4.0 0.023 -0.7 4.8 0.1
Capped
reprocessing
capacity
1.2 -4.2% 0.020 -14% 5.1 6.6%
Fast reactor
operation delayed
until 2050
1.2 -2.5% 0.023 -3.8% 4.6 -3.9%
Case 5, LWR to HWR modified open fuel cycle
Base Case 2.4 0.00 0.25
No legacy spent
fuel 2.4 -1.9% 0.004 -2.4% 0.25 0.3%
Capped
reprocessing
capacity
2.4 0.0% 0.004 0.0% 0.22 -11%
* Pu elsewhere in the fuel cycle includes Pu under irradiation in reactors, in reprocessing plants, and in
fuel fabrication. This does not include any externally sourced plutonium in separations. External Pu is
included only at the time it exists as fabricated fuel.
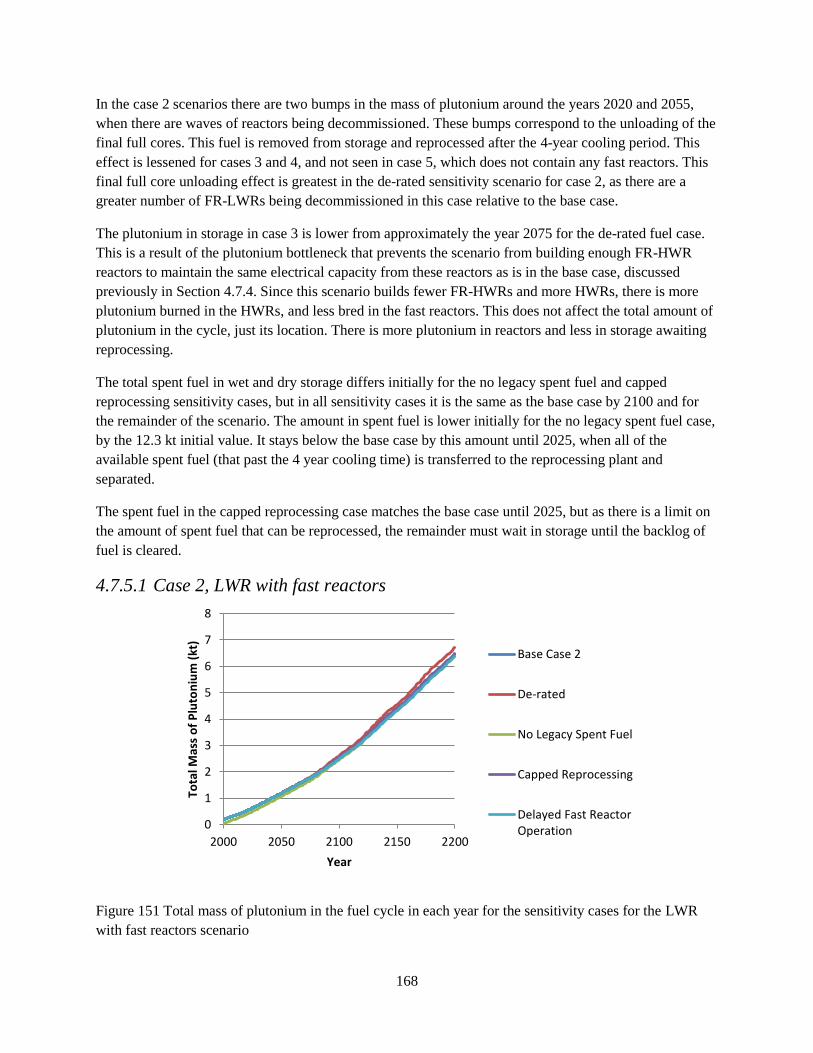
168
In the case 2 scenarios there are two bumps in the mass of plutonium around the years 2020 and 2055,
when there are waves of reactors being decommissioned. These bumps correspond to the unloading of the
final full cores. This fuel is removed from storage and reprocessed after the 4-year cooling period. This
effect is lessened for cases 3 and 4, and not seen in case 5, which does not contain any fast reactors. This
final full core unloading effect is greatest in the de-rated sensitivity scenario for case 2, as there are a
greater number of FR-LWRs being decommissioned in this case relative to the base case.
The plutonium in storage in case 3 is lower from approximately the year 2075 for the de-rated fuel case.
This is a result of the plutonium bottleneck that prevents the scenario from building enough FR-HWR
reactors to maintain the same electrical capacity from these reactors as is in the base case, discussed
previously in Section 4.7.4. Since this scenario builds fewer FR-HWRs and more HWRs, there is more
plutonium burned in the HWRs, and less bred in the fast reactors. This does not affect the total amount of
plutonium in the cycle, just its location. There is more plutonium in reactors and less in storage awaiting
reprocessing.
The total spent fuel in wet and dry storage differs initially for the no legacy spent fuel and capped
reprocessing sensitivity cases, but in all sensitivity cases it is the same as the base case by 2100 and for
the remainder of the scenario. The amount in spent fuel is lower initially for the no legacy spent fuel case,
by the 12.3 kt initial value. It stays below the base case by this amount until 2025, when all of the
available spent fuel (that past the 4 year cooling time) is transferred to the reprocessing plant and
separated.
The spent fuel in the capped reprocessing case matches the base case until 2025, but as there is a limit on
the amount of spent fuel that can be reprocessed, the remainder must wait in storage until the backlog of
fuel is cleared.
4.7.5.1 Case 2, LWR with fast reactors
Figure 151 Total mass of plutonium in the fuel cycle in each year for the sensitivity cases for the LWR
with fast reactors scenario
0
1
2
3
4
5
6
7
8
2000 2050 2100 2150 2200
Tota
l Mas
s o
f P
luto
niu
m (
kt)
Year
Base Case 2
De-rated
No Legacy Spent Fuel
Capped Reprocessing
Delayed Fast ReactorOperation
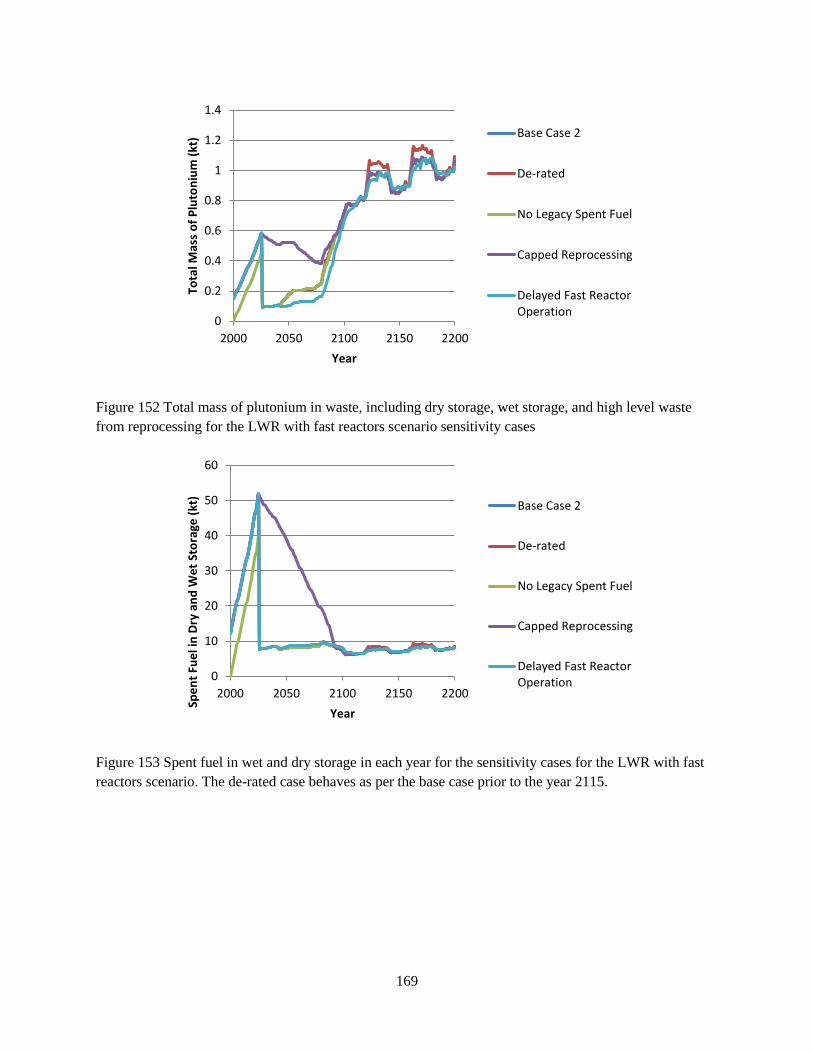
169
Figure 152 Total mass of plutonium in waste, including dry storage, wet storage, and high level waste
from reprocessing for the LWR with fast reactors scenario sensitivity cases
Figure 153 Spent fuel in wet and dry storage in each year for the sensitivity cases for the LWR with fast
reactors scenario. The de-rated case behaves as per the base case prior to the year 2115.
0
0.2
0.4
0.6
0.8
1
1.2
1.4
2000 2050 2100 2150 2200
Tota
l Mas
s o
f P
luto
niu
m (
kt)
Year
Base Case 2
De-rated
No Legacy Spent Fuel
Capped Reprocessing
Delayed Fast ReactorOperation
0
10
20
30
40
50
60
2000 2050 2100 2150 2200
Spe
nt
Fue
l in
Dry
an
d W
et
Sto
rage
(kt
)
Year
Base Case 2
De-rated
No Legacy Spent Fuel
Capped Reprocessing
Delayed Fast ReactorOperation

170
4.7.5.2 Case 3, HWR intermediate actinide burner
Figure 154 Total mass of plutonium in the fuel cycle in each year for the sensitivity cases for the HWR
intermediate burner scenario
Figure 155 Total mass of plutonium in waste, including dry storage, wet storage, and high level waste
from reprocessing for the HWR intermediate burner scenario sensitivity cases
0
1
2
3
4
5
6
2000 2050 2100 2150 2200
Tota
l Mas
s o
f P
luto
niu
m (
kt)
Year
Base Case 3
De-rated
No Legacy Spent Fuel
Capped Reprocessing
Delayed Fast ReactorOperation
0
0.2
0.4
0.6
0.8
1
1.2
2000 2050 2100 2150 2200
Tota
l Mas
s o
f P
luto
niu
m (
kt)
Year
Base Case 3
De-rated
No Legacy Spent Fuel
Capped Reprocessing
Delayed Fast ReactorOperation
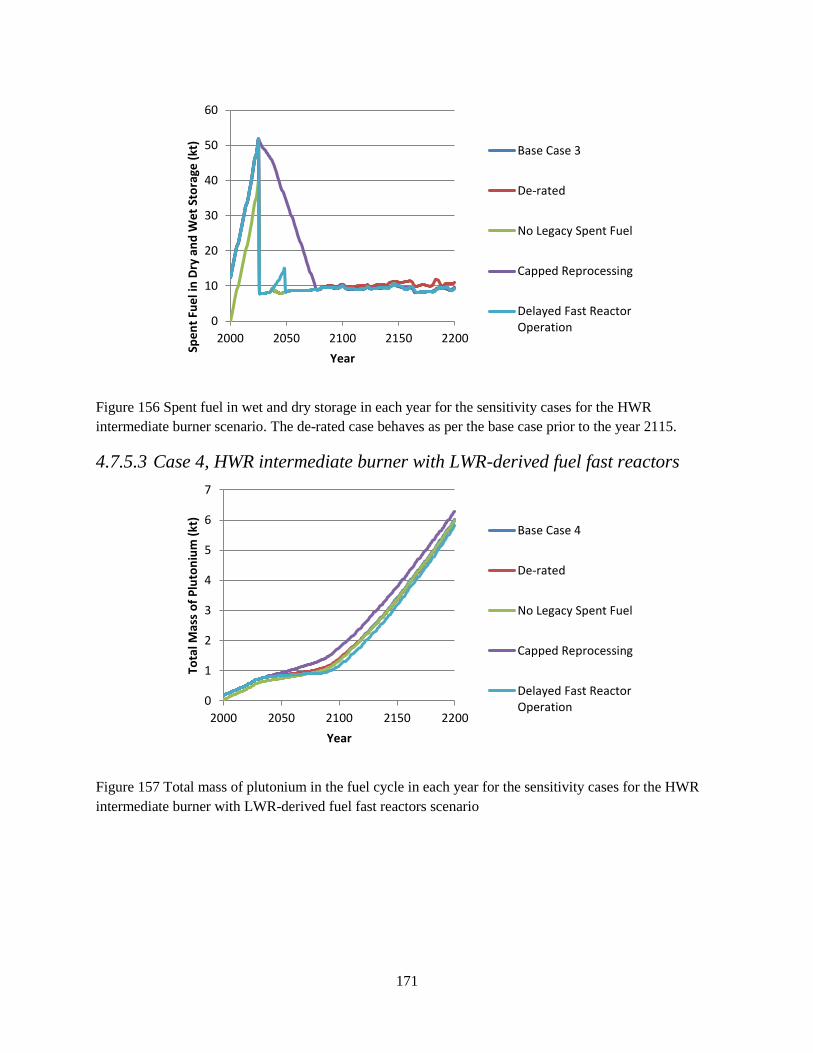
171
Figure 156 Spent fuel in wet and dry storage in each year for the sensitivity cases for the HWR
intermediate burner scenario. The de-rated case behaves as per the base case prior to the year 2115.
4.7.5.3 Case 4, HWR intermediate burner with LWR-derived fuel fast reactors
Figure 157 Total mass of plutonium in the fuel cycle in each year for the sensitivity cases for the HWR
intermediate burner with LWR-derived fuel fast reactors scenario
0
10
20
30
40
50
60
2000 2050 2100 2150 2200
Spe
nt
Fue
l in
Dry
an
d W
et
Sto
rage
(kt
)
Year
Base Case 3
De-rated
No Legacy Spent Fuel
Capped Reprocessing
Delayed Fast ReactorOperation
0
1
2
3
4
5
6
7
2000 2050 2100 2150 2200
Tota
l Mas
s o
f P
luto
niu
m (
kt)
Year
Base Case 4
De-rated
No Legacy Spent Fuel
Capped Reprocessing
Delayed Fast ReactorOperation
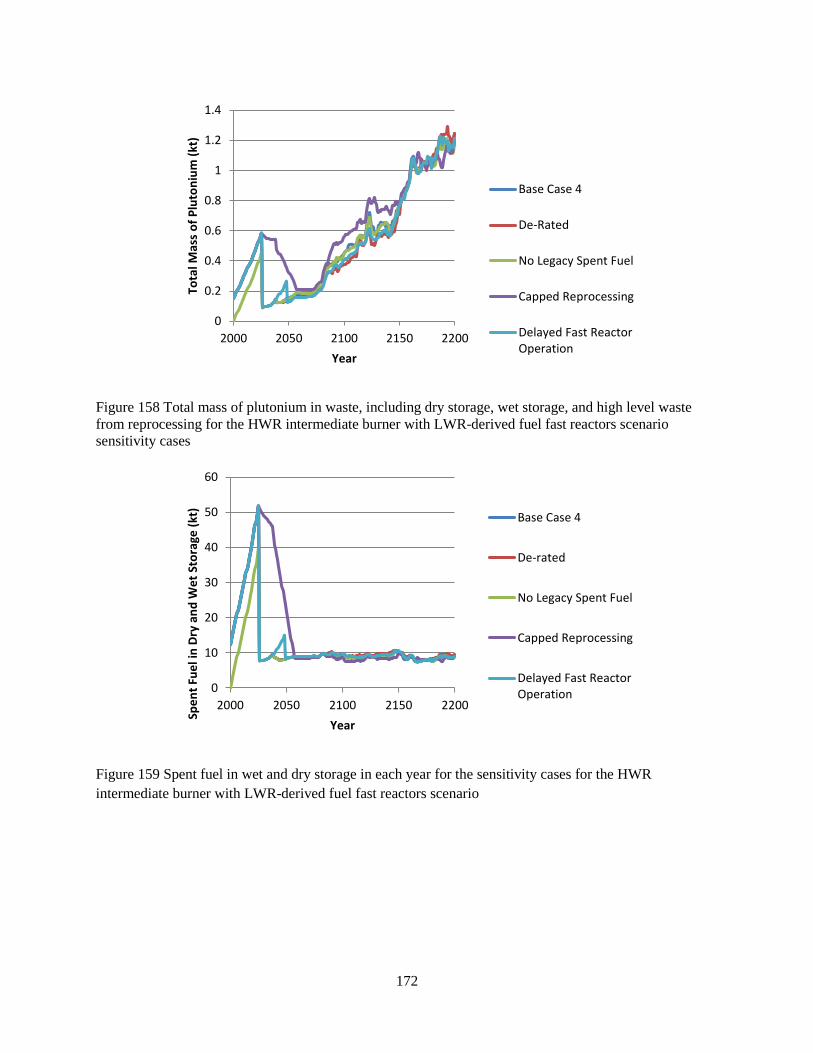
172
Figure 158 Total mass of plutonium in waste, including dry storage, wet storage, and high level waste
from reprocessing for the HWR intermediate burner with LWR-derived fuel fast reactors scenario
sensitivity cases
Figure 159 Spent fuel in wet and dry storage in each year for the sensitivity cases for the HWR
intermediate burner with LWR-derived fuel fast reactors scenario
0
0.2
0.4
0.6
0.8
1
1.2
1.4
2000 2050 2100 2150 2200
Tota
l Mas
s o
f P
luto
niu
m (
kt)
Year
Base Case 4
De-Rated
No Legacy Spent Fuel
Capped Reprocessing
Delayed Fast ReactorOperation
0
10
20
30
40
50
60
2000 2050 2100 2150 2200
Spe
nt
Fue
l in
Dry
an
d W
et
Sto
rage
(kt
)
Year
Base Case 4
De-rated
No Legacy Spent Fuel
Capped Reprocessing
Delayed Fast ReactorOperation
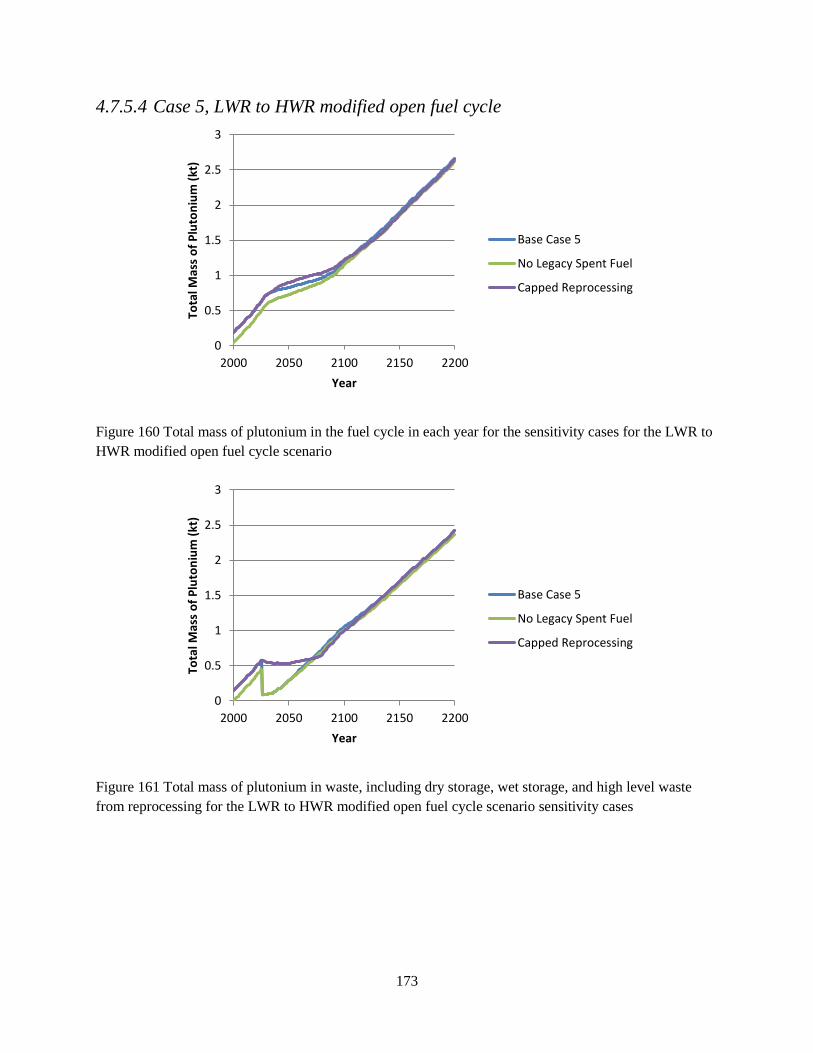
173
4.7.5.4 Case 5, LWR to HWR modified open fuel cycle
Figure 160 Total mass of plutonium in the fuel cycle in each year for the sensitivity cases for the LWR to
HWR modified open fuel cycle scenario
Figure 161 Total mass of plutonium in waste, including dry storage, wet storage, and high level waste
from reprocessing for the LWR to HWR modified open fuel cycle scenario sensitivity cases
0
0.5
1
1.5
2
2.5
3
2000 2050 2100 2150 2200
Tota
l Mas
s o
f P
luto
niu
m (
kt)
Year
Base Case 5
No Legacy Spent Fuel
Capped Reprocessing
0
0.5
1
1.5
2
2.5
3
2000 2050 2100 2150 2200
Tota
l Mas
s o
f P
luto
niu
m (
kt)
Year
Base Case 5
No Legacy Spent Fuel
Capped Reprocessing

174
Figure 162 Spent fuel in wet and dry storage in each year for the sensitivity cases for the LWR to HWR
modified open fuel cycle scenario
4.8 Discussion
The additional aspects of reprocessing and fabrication of highly radioactive fresh recycled fuel add a
significant radioactive hazard to the fuel cycle. These activities present the risk of contamination to
workers as well as to materials and the environment. However, it is noted that reprocessing is a
commercial activity in several countries today (e.g. France, England, Russia, India), as well as
experimentally in many laboratories worldwide. Performing these activities in a safe manner to prevent
contamination to workers, the public and the environment is well understood.
If the availability of fast reactors was delayed such that the HWRs were available for one of the new build
waves while fast reactors were not, then some results would be expected to change. This could change the
values of some parameters, but would not change the impacts of one fuel cycle relative to another. For
example, the uranium consumption of the overall fuel cycle would increase, since more LWRs would be
required to support the increase in number of HWRs. But the conclusion that an LWR to FR (case 2) fuel
cycle would use less uranium than a HWR intermediate burner (case 3) fuel cycle, would still be expected
to be valid, assuming that the fast reactors are not delayed significantly from the initial construction of
HWRs, i.e, a 10 or 20-year gap between first HWR and first fast reactor operation is maintained.
The suitability of the design of the fast reactors for this fuel cycle growth profile can be deduced through
the examination of the amount of separated plutonium that is awaiting fuel fabrication (Figure 163). In the
scenarios for which plutonium is reprocessed as it is available, and waits in separated form until required
for new fuel. In all cases, there is a growth of separated plutonium. This indicates that the breeding rate of
plutonium is higher than is required for this nuclear energy growth profile. A new FR-LWR requires
18.7 t of available Pu, and a FR-HWR requires 27 t. This corresponds to one full core load, plus 5 years
of annual consumption. These cases could therefore support the following numbers of new reactor builds
at the end of the scenario:
0
20
40
60
80
100
120
140
2000 2050 2100 2150 2200
Spe
nt
Fue
l in
Dry
an
d W
et
Sto
rage
(kt
)
Year
Base Case 5
No Legacy Spent Fuel
Capped Reprocessing
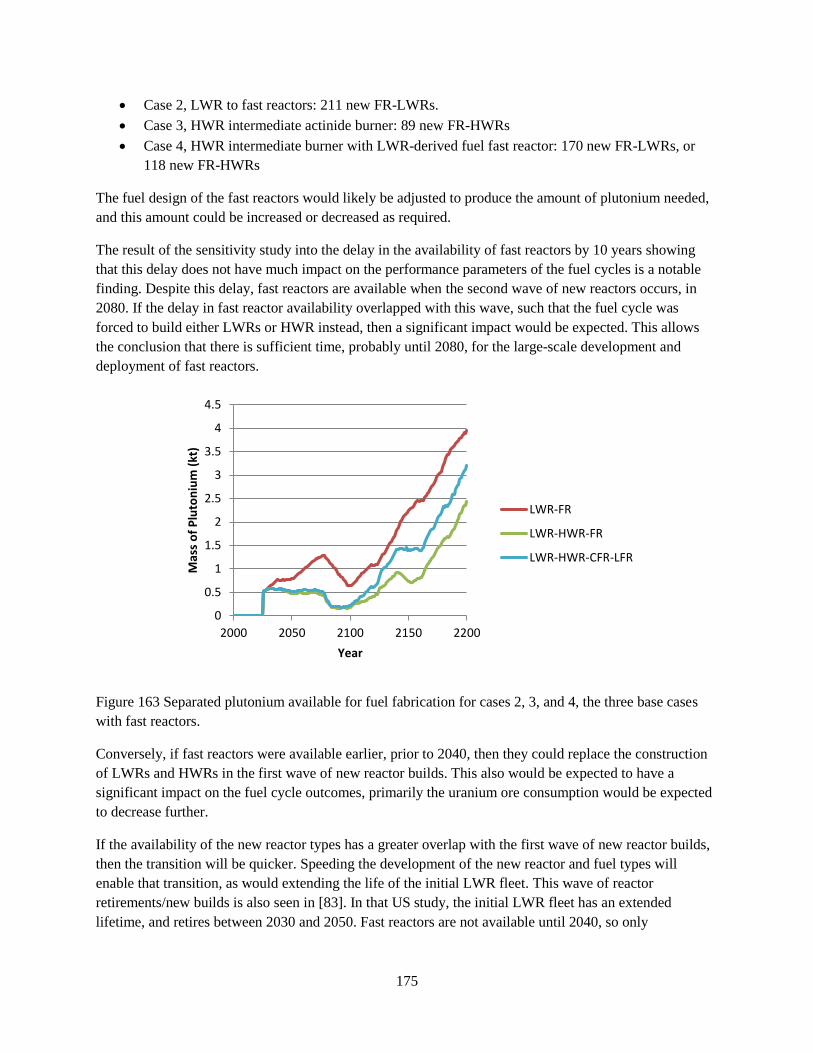
175
Case 2, LWR to fast reactors: 211 new FR-LWRs.
Case 3, HWR intermediate actinide burner: 89 new FR-HWRs
Case 4, HWR intermediate burner with LWR-derived fuel fast reactor: 170 new FR-LWRs, or
118 new FR-HWRs
The fuel design of the fast reactors would likely be adjusted to produce the amount of plutonium needed,
and this amount could be increased or decreased as required.
The result of the sensitivity study into the delay in the availability of fast reactors by 10 years showing
that this delay does not have much impact on the performance parameters of the fuel cycles is a notable
finding. Despite this delay, fast reactors are available when the second wave of new reactors occurs, in
2080. If the delay in fast reactor availability overlapped with this wave, such that the fuel cycle was
forced to build either LWRs or HWR instead, then a significant impact would be expected. This allows
the conclusion that there is sufficient time, probably until 2080, for the large-scale development and
deployment of fast reactors.
Figure 163 Separated plutonium available for fuel fabrication for cases 2, 3, and 4, the three base cases
with fast reactors.
Conversely, if fast reactors were available earlier, prior to 2040, then they could replace the construction
of LWRs and HWRs in the first wave of new reactor builds. This also would be expected to have a
significant impact on the fuel cycle outcomes, primarily the uranium ore consumption would be expected
to decrease further.
If the availability of the new reactor types has a greater overlap with the first wave of new reactor builds,
then the transition will be quicker. Speeding the development of the new reactor and fuel types will
enable that transition, as would extending the life of the initial LWR fleet. This wave of reactor
retirements/new builds is also seen in [83]. In that US study, the initial LWR fleet has an extended
lifetime, and retires between 2030 and 2050. Fast reactors are not available until 2040, so only
0
0.5
1
1.5
2
2.5
3
3.5
4
4.5
2000 2050 2100 2150 2200
Mas
s o
f P
luto
niu
m (
kt)
Year
LWR-FR
LWR-HWR-FR
LWR-HWR-CFR-LFR
176
approximately half of the fleet can be converted in the first wave. The conversion of the fuel cycle to be
entirely fast reactors is not complete until 2100, when the last LWR retires.
In these scenarios, any uranium recovered (RU) in the reprocessing plants is reserved, and not accounted
for as spent fuel or high level waste. There are several possible outcomes for RU:
Use instead of depleted or natural uranium for the HWR or fast reactor fuel
Re-enrich the uranium for use as LWR fresh fuel
Long-term disposal
Sell to other regions to use as fuel
The economic viability of reusing the RU will depend on several factors, primarily the price of uranium
(yellowcake), the isotopic composition of the RU, and the level of contamination in the RU. A higher
price of uranium makes the reuse of RU more attractive, either for this region, or for others. This will be
coupled to the isotopic composition of the RU. Lower burnup RU will have a higher amount of the fissile
U-235, and a lower amount of the undesirable isotopes U-236 (a neutron poison) and U-232 (U-232
daughters are a radiological handling hazard).
Reprocessing uranium will leave some impurities in the uranium from fission products and transuranic
nuclides. The amount of these remaining in the RU is dependent upon the chemistry of the reprocessing
scheme, and the decontamination factors that can be achieved.
In all the advanced fuel cycle options studied, the scenario is forced to acquire external americium and
curium to fuel the reactors. This makes it difficult to draw conclusions on the ability of the different fuel
cycle options to transmute these elements. It could be that the fuel cycle would operate like this; the
region could import minor actinides, and transmute them as a service for profit. This is perhaps unlikely.
More likely is that once the fuel cycle ran out of minor actinides, the fast reactors or HWRs would be
fuelled with a Pu-DU (Pu-NU for HWRs) MOX fuel. These Pu-MOX fuelled reactors would breed minor
actinides. The minor actinides bred from these reactors could then be reprocessed back into minor
actinide burning reactors. Thus, the fuel cycle would contain some portion of minor actinide-breeding
and minor actinide-burning reactors. The fuel cycle content of americium would therefore be kept at
some equilibrium level.
The conclusion can be made that in each of the three cases with fast reactors this equilibrium mix of
burner and breeder reactors would be reached. The only americium waste requiring permanent disposal
would be that generated from reprocessing losses, which will be far lower in quantity than that generated
in the once-through case. Thus, it can be concluded that all of these three cases would adequately dispose
of americium. In the cases in this study in which americium is imported from outside of the region, there
is around 3 t of americium remaining in HLW, a 97% reduction over the once-through LWR case (Table
59). Though the amount that would be present if americium were not imported and a burner/breeder fast
reactor mixture were employed instead, it is safe to conclude that the amount would be on this order, and
would represent a very significant reduction in the amount of americium being sent to a permanent
repository. Some inventory would still exist in the fuel cycle in reactors, in wet storage awaiting
reprocessing, and in the reprocessing and fuel fabrication plants. Without detailed scenario calculations
iterated with reactor physics calculations it is impossible to determine what these levels would be, or the
relative levels between the fuel cycle options.
177
It should be noted here that the first pass of the FR-HWR reactor is the only time when curium is burned
rather than bred. Consequently, all of these fuel cycles will be net curium breeders, though the amount of
curium that would be bred if americium and curium were not imported into the region cannot be
determined in this study. Though the fuel cycle content of americium may reach a constant value in a
breeder/burner mixed cycle, the amount of curium will continue to rise. However, it will rise slower, as it
will take longer to breed curium in the reactors that are fuelled with Pu-MOX, rather than those that
contain americium in the input fuel.
Since the Cm inventory increases over time, and will increase relative to the once-through LWR scenario,
the amount of Cm in HLW that is reported in these results (Table 59) is somewhat misleading. It appears
there is a decline in the amount of Cm requiring permanent disposal, but it is really just storing Cm in
reactors rather than in spent fuel storage. The hazard from curium will be much greater in the scenarios
with reprocessing; workers will be at risk of receiveing a dose during reprocessing, and this will continue
to increase with time as the amount of curium in the cycle increases.
Case 5, LWR to HWR modified open fuel cycle, runs out of americium due to a mismatch in fuel
isotopic composition that develops over time. The LWR spent fuel used as fresh fuel for the HWRs gets
younger over time as the older fuel is used up. Once all the older fuel is used up, the fresh HWR fuel
would be composed of LWR fuel that had decayed for a minimum of 5 years. It is again difficult to
determine what the impact of this on the minor actinide burning performance of the fuel cycle would be
without performing more detailed scenario calculations iterated with reactor physics. The following
would occur for HWRs operating with 5-year decayed LWR fuel:
A lower amount of transuranic elements are required for the input fuel (Figure 17), so more
HWRs could be built relative to the number of LWRs
More HWRs in the fuel cycle would lead to fewer LWRs required to achieve the fuel cycle
electrical capacity
Fewer LWRs would lead to less minor actinides produced in the fuel cycle
To compare the actinide burning performance of HWR fuelled with 5-year-decayed LWR spent fuel
versus 15-year-decayed LWR spent fuel, the isotopic composition of the HWR irradiated 5-year-decayed
fuel after 10 years cooling time was compared with HWR irradiated 15-year-cooled fuel at exit (Table
65). This compares these cases on an equal footing; the 5-year case can fission Pu-241 before it becomes
Am-241. However, more Am-241 is transmuted from 15-year-decayed fuel than in 5-year-decayed fuel
(Figure 14). The ability to fission Pu-241 before it decays to Am-241 has a larger effect. There is
9 g kgITU-1 (Initial TransUranic elements) in fuel that has been irradiated after 5 years of decay, then
cooled for 10 years, versus 19 g kgITU-1 of Am-241 that has been decayed for 15 years and then
irradiated. There is 76 g kgITU-1 in spent fuel that has not been irradiated a second time, but just left after
the first irradiation to decay for 15 years. It is more beneficial to irradiate spent transuranic elements soon
after they have exited the light water reactor, as the HWR will fission Pu-241 before it can decay into
Am-241.
It should be noted that the same effect will also hold true for the fast reactors, though calculation has not
been performed here. The fast reactors are designed to breed plutonium, but breed predominantly Pu-239.
There is a net decrease of Pu-241, Figure 42. This is a key sustainability feature; they can continue to be
operated and fuel new fast reactors without any new mined uranium required by the fuel cycle.

178
This study does not reveal any large benefits to using HWRs as an intermediate burner of actinides. There
are no large changes to any of the main metrics studied: uranium ore consumption, plutonium requiring
disposal, amount of high level waste, and the ability to disposition americium and curium do not change
significantly with the employ of the HWR. The metrics are slightly better for the scenario without the
HWR, as the fast reactors do not use any additional uranium, and can be loaded with a large inventory of
americium.
Though this study does not reveal great benefits in using HWRs as an intermediate burner of actinides, it
should be noted that HWRs do have great potential for benefits with other advanced fuel cycles. Foremost
among these is the use of thorium as a fuel source. The high neutron economy and flexibility of the
HWRs make this reactor type ideally suited to use thorium as a fertile material to create the fissile isotope
U-233.
However, if fast reactors are never operated, then the use of LWR spent fuel in HWRs does show an
improvement over the reference case of continuing to operate only LWRs. In this situation, 21% less
uranium ore is required, 56% less Pu requires final disposal, there is 52% less Am in high level waste at
the end of the 200-year scenario, and all of the americium in the scenario, and some imported americium,
can be fabricated into new fresh fuel, and then transmuted in HWRs.
Table 65 Comparison between LWR spent fuel that has been decayed for 5 years and that has been
decayed for 15 years prior to irradiation in a HWR.
Nuclide 0 y decay
g kgITU-1*
15 y decay 5 y decay, irradiation, 10 year
decay 15 y decay, irradiation
g kgITU-1 %
change g kgITU-1
% change
vs. no
decay
%
change
vs. 15y
decay
g kgITU-1
%
change
vs. no
decay
%
change
vs. 15y
decay
Pu-238 25.3 23.9 -5.6 9.6 -62 -60 38.8 53.2 62
Pu-239 477.5 477.3 0.0 56.8 -88 -88 133.0 -72.1 -72
Pu-240 211.0 213.7 1.3 95.0 -55 -56 199.8 -5.3 -7
Pu-241 140.0 67.6 -52 13.5 -90 -80 51.9 -63.0 -23
Pu-242 65.2 65.2 0.0 100.9 55 55 102.4 56.9 57
Total Pu 919.1 847.8 -8 275.8 -70 -67 525.8 -42.8 -38
Am-241 4.2 75.5 1697 9.1 116 -88 19.2 356.1 -75
Am-242m 0.1 0.1 -7.1 0.0 -94 -94 0.2 86.0 100
Am-243 15.2 15.2 -0.1 31.3 106 106 30.1 97.9 98
Total Am 19.5 90.8 365 40.4 107 -56 49.5 153.6 -45
Total Cm 9.2 4.5 -51 22.0 139 388 27.8 203.0 518
Total
Minor
Actinides
80.9 148.6 84 71.9 -11 -52 108.9 34.5
-27
Total TRU 1000.0 996.4 -0.4 347.7 -65 -65 634.7 -36.5 -36
* g kg-1 initial transuranic elements, i.e. per one kilogram of 0 y decay transuranic elements
4.8.1 Applicability and Validity
The general results, i.e. the relative merits of the fuel cycles studied, from this work are expected to
remain applicable for similar cases. For example, other fast reactor, HWR, or LWR reactor designs that
are operated in the same way should not change the overall conclusions. The neutron spectrum, thermal or
fast, and overall mass flows would be expected to be roughly the same.

179
There are some operational and design changes that could impact the outcomes of the scenario study;
three examples are the fuel burnup, the fuel matrix, and the fast reactor design. If the burnup of the fuel
changes dramatically, then the transmutation rates and percentages will change. For example, a 45 MWd
kg-1 burnup was selected for use here for the HWR; if instead a much lower burnup were used, e.g. 20
MWd kg-1, a much lower percentage of actinides would be transmuted per irradiation, and the fuel mass
throughput would also be increased, by approximately a factor of 2. A change such as this would require a
new analysis to better determine the impact of the change in design and operation of the reactor.
The choice of the fast reactor fuel, use of a metallic, rather than an oxide fuel is also not expected to
change the results significantly. Fast reactor studies using both metallic and oxide fuel show similar
characteristic for the parameters that would influence the fuel cycle results, e.g. TRU inventory and
consumption rates ([84] reports TRU consumption rates of 26 to 32 kg year-1 for a metal core, and 27 to
34 kg year-1 for an oxide core.)
A fast reactor design change that would alter the conclusions is a change to a burner rather than a breeder
of plutonium. If the fast reactor is a net burner of plutonium, then a conversion of the fuel cycle to all fast
reactors would not be possible. Some number of light water reactors would always be required to obtain
the required plutonium inventory needed in the fresh fast reactor fuel.
In Section 4.4.2.2 it was mentioned that a mid-life refurbishment and the associated outage time were not
modeled in this study. In a generic case with a large enough electricity capacity and associated large
number of operating reactors with staggered refurbishment outage times, this effect will average out and
have the same impact as a decreased capacity factor. The decreased capacity factor would require a larger
number of reactor to be built and a corresponding higher amount of fuel to meet the required electricity
demand of the scenario. It is also not unreasonable to assume that a region would make up the electricity
demand using other non-nuclear electricity sources during these outages (such as by gas- or hydro-
powered plants, or import electricity), as has occurred in Canada.
If any of the advanced fuel cycles modeled in this work were to be implemented in real life, then it would
be expected that the numerical values of the metrics evaluated would likely be different, but the overall
trends would hold. The reactor simulations performed here in Sections 2 and 3 were not for detailed,
completed, licensed, reactor designs. A large amount of design and engineering work is required before
these reactors could be licensed, constructed and operated. Many changes to the models used in this work
would be made, and it is expected that the values used here would change. This is certain for the fuel
compositions, but other parameters could also change, including, as an example, thermal and electrical
power outputs.
The tools and methodology used in this study are well established. Both of the physics codes, WIMS-
AECL and Serpent, are widely used for these applications. VISION is also a widely used tool, mainly in
the United States, though it does have limitations, particularly with fuel composition tracking, if the fuel
composition required does not match the fuel recipes, as described previously, e.g. in Section 4.2.1.

180

181
5 SUMMARY AND CONCLUSIONS Many countries are interested in transitioning to a fuel cycle in which a fast reactor transmutes, or “burns”
heavy transuranic elements that were produced by the primary reactors, typically light water reactors.
This study aims at highlighting the role that a heavy water reactor could play as an intermediate burner of
actinides sourced from light water reactor spent fuel, before these elements are placed into a fast reactor.
This study was performed in three stages:
1. Physics simulations of a heavy water reactor fuelled with transuranic elements that were
reprocessed from LWR spent fuel,
2. Physics simulations of a fast reactor fuelled with: a) transuranic elements that were reprocessed
from LWR spent fuel (i.e. the same TRU composition used for the HWR study in stage 1), and b)
transuranic elements reprocessed from the HWR spent fuel,
3. Scenario systems studies of five different fuel cycle options, in order to access the impact of the
HWR as an intermediate burner of TRU.
All of the physics calculations performed were preliminary, scoping-type calculations. These calculations
show a proof-of-principle, but do not have the robustness of detailed design nor detailed safety analyses.
Some basic safety characteristics were evaluated, such as void reactivity coefficients.
WIMS-AECL version 3.1, a deterministic lattice cell physics code, was used for the HWR simulations,
which modeled the Enhanced CANDU 6 reactor. The HWR simulations were performed using TRU from
LWR spent fuel of a range of ages, that is, the time the fuel spent out of reactor before being reprocessed
and fabricated into new fresh fuel for the HWR. A decay time of 15 years for the LWR spent fuel was
selected for the scenario models, and for the fast reactor fuel composition. This case showed good
transmutation performance:
Total Pu: 43%, 530 kg reactor-1 year-1
Am-241: 88%, 96 kg reactor-1 year-1
Total Am: 51%, 66 kg reactor-1 year-1
Total minor actinides: 29%, 61 kg reactor-1 year-1
Total transuranic nuclides: 41%, 591 kg reactor-1 year-1
Curium production of 43.1 kg reactor-1 year-1.
The WIMS-AECL calculation was reproduced using the Serpent Monte Carlo code, in order to verify the
calculation. The results of this benchmarking exercise showed reasonable agreement, to provide
confidence in the WIMS-AECL calculations, but did show some discrepancies, the sources of which are
not known currently, but are suspected to be related to the nuclear data.
The European Sodium Fast Reactor (ESFR) was chosen as the reactor modeled for the fast reactor
simulation portion of this work. The simulations were performed using the Serpent version 1.18 code.
This is a three-dimensional Monte Carlo code with burnup capabilities. Similarly for the HWR
calculations these calculations were also preliminary calculations, but the fast reactor was modeled as a
full three-dimensional core. Some basic safety parameters were calculated, in this case, eff, the sodium
void reactivity effect (SVRE) and the Doppler coefficient.

182
To first establish the implementation of the model, a model of the ESFR was constructed and the results
compared with data available in the literature. Good agreements were found, and the fuel in the ESFR
model was subsequently changed to the compositions of interest for this study. The original homogenous
transuranic actinide distribution of the fuel in the reactor core was found not to work with the
LWRCANDU fuel isotopics, as the safety parameters could not be obtained. An alternate
heterogeneous configuration with the minor actinides separated from the plutoniumwas used, and the
minor actinides placed into both the fuel and the lower axial blankets at 4wt% was used.
Three passes of the fuel through the reactor were simulated, that is, the spent fuel was reprocessed, mixed
with depleted uranium to the required composition, and re-irradiated in the fast reactor, for a total of three
irradiations in the fast reactor.
In contrast to the HWR, the fast reactor was a breeder of plutonium, breeding between 380 and 395 kg
reactor-1 year-1 of plutonium from LWR-derived spent fuel, and between 104 and 276 kg reactor-1 year-1 of
plutonium from LWRCANDU derived spent fuel.
The fuel compositions obtained from the HWR and fast reactor physics simulations were then used as
input to model five different fuel cycles over a duration of 200 years, with the goal of investigating the
impact of the HWR as an intermediate burner of actinides.
Modeling fuel cycle systems that transition to different reactor types with different fuel types is a
complicated problem. Complex physics modeling is required to provide input parameters into the fuel
cycle models. Designing the fuel cycle models themselves is complicated, the analyst must make many
assumptions and take many considerations into account beyond just science. The Expert Group on
Advanced Fuel Cycle Scenarios recently articulated this well [34]:
“Fuel cycle analysis is part art and part science. What to include in an analysis depends on the types of
decisions to be supported; scenario definitions and code selection need to be based on this end goal.
Analyses must integrate the political, economical, social and environmental constraints, intercepting the
impact (and possibly the consequences) of an uncertain economics on energy futures. At the same time,
scenario models must also include key phenomena of the physical systems being modeled. In the area of
the nuclear fuel cycle, these phenomena can range from subatomic physics behavior to the interaction of
systems of complex facilities over many decades.”
In this study, a reference fuel cycle was devised that did not correspond to any particular country, and
instead was intended as a generic case to study the impacts of transitioning to fast reactors, with a heavy
water reactor used as an intermediate burner of actinides. Five fuel cycles were studied using the VISION
fuel cycle scenario simulation tool:
1. Reference case, once-through LWR.
2. LWR with fast reactors.
3. HWR intermediate actinide burner.
4. HWR intermediate burner with LWR-derived fuel fast reactors.
5. LWR to HWR modified open fuel cycle.

183
Fuel cycles that transition to fast reactors have the most favourable impact on uranium consumption. The
reference once-through LWR case would consume 4397 kt of uranium ore, or 58%26 of the current known
worldwide uranium resources. A transition to fast reactors reduces consumption by 70% to 1299 kt. The
case with an HWR intermediate burner is slightly higher, a reduction of 55-59%.
The amount of spent fuel is significantly reduced in the advanced fuel cycles. 527 kt of spent fuel in the
reference case are reduced by 76% to 126 kt in the LWR to HWR modified open fuel cycle, and by 98%
to 10 kt for the fast reactor scenarios.
The actinide-bearing fast reactor model that was used in this study contained 4 wt% minor actinides, a
higher ratio of minor actinides to plutonium than what is in the recycled spent fuel. The fuel cycle model
builds new reactors given available plutonium, but after some time the fuel cycle would run out of minor
actinides, since more of these were required relative to the amount of plutonium. A separations buffer,
which represents the mass of an element being reprocessed would then run negative in the fuel cycle
scenario code. This can be interpreted as the fuel cycle importing the minor actinides from outside of the
region that is modeled in the scenario. Though this is not an unphysical scenario, it does not permit an
easy comparison of the actinide-reduction capabilities of the fuel cycles studied. However, it can be
concluded that since these scenarios are forced to import minor actinides, they do a satisfactory job of
dispositioning actinides. It is more likely that when the region runs out of minor actinides to fabricate new
fast reactor fresh fuel, a plutonium-only fuel would be used for the fast reactors. A plutonium-only fuel
would breed minor actinides. The resulting fuel cycle would then contain some reactors that consume
minor actinides, and other reactors that breed, resulting in a new overall equilibrium fuel cycle.
Four sensitivity analyses were performed for the fuel cycle scenarios: de-rating the power output of the
fast reactor, starting the scenario with no existing inventory of spent fuel, placing a limit on the
reprocessing capacity, and delaying the year in which fast reactors begin operation. The largest
consequence of reducing the power output of the fast reactors was to require a greater number of fast
reactors in order to provide the required overall electrical power output for the scenario. This had the
follow-on consequence of increasing the required reprocessing capacity, increasing the uranium ore
consumption, and decreasing the amount americium and curium required from external sources.
Beginning the scenario with no legacy spent fuel moves up the date in which americium is required to be
imported from outside sources, by up to 30 years, depending on the scenario.
The base scenarios assume an unlimited reprocessing capacity, which is not realistic. This assumption
causes a large spike in the first year that fuel is reprocessed, as all of the available spent fuel is
reprocessed at once. However, the effect of capping the reprocessing capacity was found not to be large.
There was some impact to the rate at which the advanced reactor types could be brought online, due to
fuel restrictions. The largest impact was to case 4, in which the rate of introduction of HWRs was
lowered, and more fast reactors were built as a result, as fast reactors are preferentially build once they are
available to build. Therefore in this case, the impact of HWRs as an intermediate burner of actinides was
reduced, since fewer reactors can be operated in this capacity. The uranium ore requirements
26 From [82], the identified uranium resources are 7635.2 ktU, recoverable at a cost less than 260 USD kgU-1. This
value is comprised of 4587.2 ktU reasonably assured uranium resources, and 3048.0 ktU inferred resources.

184
consequently reduced, and the scenario is able to accommodate more americium and curium from
external sources.
A delay in the availability of fast reactors by 10 years was found not to have a large impact on the
performance parameters of the fuel cycle scenarios. Fewer fast reactors are built in these cases, but the
numbers are not large; 14, 8, and 13, a change of 3.5%-4.6%.
This study does not reveal any large benefits to using HWRs as an intermediate burner of actinides. There
are no large changes to any of the main metrics studied: the uranium ore consumption, plutonium
requiring disposal, amount of high level waste, and the ability to dispose of americium and curium do not
change significantly with the employ of the HWR. The metrics are slightly better for the scenario without
the HWR, as the fast reactors do not use any additional uranium, and can be loaded with a large inventory
of americium.
However, if fast reactors were never operated, then the use of LWR spent fuel in HWRs does show an
improvement over the reference case of continuing to operate only LWRs. In this situation, 21% less
uranium ore is required, 56% less Pu requires final disposal, there is 52% less Am in high level waste at
the end of the 200-year scenario, and all of the americium in the scenario, and some imported americium,
can be fabricated into new fresh fuel, and then transmuted in HWRs.
185
6 RECOMMENDATIONS Several recommendations are made for future work, involving changes to the fuel cycles, and changes to
the fuel cycle scenario code VISION to resolve the issue of “importing” actinides from outside the fuel
cycle model.
Use depleted uranium rather than natural uranium actinide burning HWR using DU (depleted
uranium) instead of NU to further reduce the uranium ore requirements of the fuel cycle
Devise a scenario with a gentler legacy reactor decommissioning schedule, so that the waves of
new builds that are evident in these scenarios do not appear. Though not necessarily unrealistic,
given the general age and consequent decommissioning dates of plants around the world today,
this phenomenon does impact the rate of construction of new reactor types, and may influence the
impact of those advanced reactors.
Modify VISION to enable the determination of the impact of a deviation between the isotopic
composition of the fuel fabricated in the scenario from the fuel recipe provided by the user.
Devise a better method to deal with fuel mass isotopic flow in the scenario code. Perhaps having
several recipes available with different isotopic compositions for some elements. The code would
then determine which recipe is closest to the isotopic composition it has available, and alert the
user if the input isotopic composition in the scenario deviates too much from the recipes
available. A change like this to improve the accuracy of the mass inventories in the scenario
model will have the consequence of requiring more reactor physics calculations and longer run
times.
Repeat with a lower Pu breeding ratio for the fast reactor, or tune the breeding ratio to prevent the
generation of excess plutonium that requires long term disposal.
The discrepancies between WIMS-AECL and Serpent calculations, particularly for americium
nuclides should be investigated further, with subsequent revisions made to either the libraries or
the codes to correct the accuracy of these calculations.

186

187
7 REFERENCES [1] Nuclear Energy Agency, “Trends Towards Sustainability in the Nuclear Fuel Cycle”, OECD No.
662011041P1, ISBN 9789264168107, 2012.
[2] F. Carré, “Research and Development Strategies of France Towards Sustainable Nuclear Fuel
Cycles” Global Conference 2009, Paris, France, September 2009.
[3] U.S. Department of Energy, Nuclear Energy, “Nuclear Energy Research and Development
Roadmap, Report to Congress”, April 2010.
[4] M. Salvatores, J.Marivoet, H. Oigawa, R.Wigeland, H. Geckeis, K. Gompper, A. Saturnin, J. Milot,
A. Zaetta, T. Taiwo, and Y. Choi, “NSC-WPFC Task Force on Potential Benefits and Impacts of
Advanced Fuel Cycles with Actinides Partitioning and Transmutation (WPFC/TFPT)”, Global
Conference 2011, Makuhari, Japan, December 2011.
[5] B. Hyland, R.J. Ellis, G.R Dyck, G.I. Maldonado, J.C Gehin, G.W.R. Edwards, “Transmutation of
Americium in Light and Heavy Water Reactors”, Proceedings of the Global 2009 Conference, Paris,
France, September 2009.
[6] B. Hyland, G.R. Dyck, A. Morreale and R. Dworschak, “Transmutation of Actinides in CANDU
Reactors” 10th Information Exchange Meeting on Partitioning and Transmutation, Mito, Japan,
October 2008.
[7] B. Hyland, B. Gihm, “Scenarios for the Transmutation of Actinides in CANDU reactors”, Nuclear
Engineering and Design, Vol. 241, Issue 12, Pages 4794–4802. December 2011.
[8] B. Hyland, E.D Collins, R. J. Ellis, G. Del Cul and M. Magill, “Transmutation of Americium and
Curium in a Lanthanide Matrix”, Proceedings of the Global 2011 Conference, Makuhari Messe,
Japan, December 2011.
[9] B. Hyland, and G. R. Dyck, “Actinide Burning in CANDU Reactors”, Global 2007 Conference on
Advanced Nuclear Fuel Cycles and Systems, Boise, Idaho, September 2007.
[10] B. Hyland, G. Del Cul, E.D. Collins, R.J. Ellis, and M. Magill, “Transmutation of Actinides in a
Lanthanide Matrix”, Transactions of the American Nuclear Society Summer Meeting, Hollywood,
Florida, USA, June 2011.
[11] A.C. Morreale, W.J. Garland, D.R. Novog, "The Reactor Physics Characteristics of a Transuranic
Mixed Oxide Fuel in a Heavy Water Moderated Reactor", Nuclear Engineering and Design, 241, p.
3768-3776, 2011.
[12] International Atomic Energy Agency, “Power Reactor Information System”, online
https://www.iaea.org/PRIS/home.aspx, accessed May 19, 2016.
[13] Cameco, “Reactor Designs”, online https://www.cameco.com/uranium_101/electricity-
generation/types-of-reactors/, accessed August 31, 2016.
[14] International Atomic Energy Agency, “Fast Reactor Database: 2006 Update”, IAEA-TECDOC-
1531, Vienna, Austria, December 2006.
[15] Nuclear Energy Agency, “State-of-the-Art Report on Innovative Fuels in Advanced Nuclear
Systems”, Nuclear Energy Agency, Organization for Economic Co-operation and Development,
2014.
188
[16] Y. Nakahara, K. Suyama, J. Inagawa, R. Nagaishi, S, Kurosawa, N. Kohno, M. Onuki and H.
Mochizuki, “Nuclide Composition Benchmark Data Set for Verifying Burnup Codes on Spent Light
Water Reactor Fuels”, Nuclear Technology, Vol. 137, p. 111-126, February 2002.
[17] M.B. Chadwick, et al., "ENDF/B-VII.1 Nuclear Data for Science and Technology: Cross Sections,
Covariances, Fission Product Yields and Decay Data," Nucl. Data Sheets, 112, 2887-2996,
Accessed online at http://www-nds.iaea.org/exfor/endf.htm (2011).
[18] Korean Atomic Energy Research Institute, “Table of the Nuclides”, online
http://atom.kaeri.re.kr:8080/ton/index.html, accessed August 1, 2016.
[19] J.J. Laidler, “Advanced Spent Fuel Processing Technologies for the United States GNEP Program”,
9th Information Exchange Meeting on Partitioning and Transmutation, Nice, France, September
2006, NEA No. 6282, OECD 2007.
[20] Nuclear Energy Agency, “Curium Management Studies in France, Japan and USA: A Report by the
WPFC Group on Chemical Partitioning of the NEA Nuclear Science Committee”, Nuclear Energy
Agency, Organization for Economic Co-operation and Development,
NEA/NSC/WPFC/DOC(2012)2, OECD, January 2012.
[21] F. Allen and H. Bonin, “Extending the CANDU Nuclear Reactor Concept: The Multi-Spectrum
Nuclear Reactor”, Proc. International Youth Nuclear Congress 2008, Interlaken, Switzerland,
September 2008.
[22] F. Allen, “Extending the CANDU Nuclear Reactor Concept: The Multi-Spectrum Nuclear Reactor
Feasibility Study of Designing the Multi-Spectrum Nuclear Reactor Using the CANDU’s Unique
Features”, Master’s thesis. Royal Military College of Canada, April 2009.
[23] M. Hussein, H.W. Bonin and B.J. Lewis, “Burning Plutonium in the Multi-Spectrum CANDU-
Based Reactor (MSCR) Using the Serpent Code”, Proc. 13th International Conference on CANDU
Fuel, Kingston, Ontario, August 2016.
[24] L. Buiron, F. Varaine, D. Verrier, D. Ruah, S. Massara, and C. Garenne, “Heterogeneous Minor
Actinide Transmutation on a UO2 blanket and on (U,Pu)O2 fuel in a Sodium-cooled Fast Reactor –
Assessment of core Performances” Global 2009 conference, Paris, France, September 2009.
[25] Nuclear Energy Agency, “Accelerator Driven Systems (ADS) and Fast Reactors (FR) in Advanced
Nuclear Fuel Cycles, A Comparative Study”, Nuclear Energy Agency, Organization for Economic
Co-operation and Development, NEA #03136, ISBN: 92-64-02138-8, OECD, 2002.
[26] K. Tucek, J. Carlsson, D. Vidovic, and H. Wider, "Comparative Study of Minor Actinide
Transmutation in Sodium and Lead-cooled Fast Reactor Cores", Progress in Nuclear Energy Vol.
50, 2008.
[27] International Atomic Energy Agency, "Advanced Reactor Technology Options for Utilization and
Transmutation of Actinides in Spent Nuclear Fuel", IAEA-TECDOC-1626, IAEA, Vienna, 2009.
[28] S. Ohki, T. Ogawa, M. Naganuma, T. Mizuno, and S. Kubo, "Design Study of Minor-Actinide-
Bearing Oxide Fuel Core for Homogeneous TRU”, 10th Information Exchange Meeting on
Partitioning and Transmutation, Mito, Japan, October 2008, NEA No. 6420, OECD 2010.

189
[29] H. Song, S. Kim, J. Jang, and Y. Kim, "Core Performances and Safety Implications of TRU
Burning: Medium to Large Fast Reactor Core Concepts", 10th Information Exchange Meeting on
Partitioning and Transmutation, Mito, Japan, October 2008, NEA No. 6420, OECD 2010.
[30] R. Wigeland, T. Taiwo, H. Ludewig, M. Todosow, W. Halsey, J. Gehin, R. Jubin, J. Buelt, S.
Stockinger, K. Jenni, and B. Oakley, “Nuclear Fuel Cycle Evaluation and Screening-Final Report”,
US Department of Energy, FCRD-FCO-214-000106, October 2014.
[31] Nuclear Energy Agency, “Radioactive Waste Management Programmes in OECD/NEA Member
Countries: France 2016”, Nuclear Energy Agency, Organization for Economic Co-operation and
Development, March 2016.
[32] C. Coquelet-Pascal, M. Meyer, M. Tiphine, R. Girieud, R. Eschbach, C. Chabert, C. Garzenne, P.
Barbrault, L. Van Den Durpel, M. Caron-Charles, D. Favet, M. Arslan, M. Caron-Charles, B.
Carlier, J-C. Lefèvre, “Scenarios for Minor Actinide Transmutation in the Framework of the French
Act on Waste Management”, In Actinide and Fission Product Partitioning and Transmutation, 12th
Information Exchange Meeting, Prague, Czech Republic, 24-27 Spetember 2012 (pp. 54-66)
Nuclear Science NEA/NSC/DOC(2013)3. Paris, France: Nuclear Energy Agency. April 2013.
[33] D. Greneche. B. Quiniou, L. Boucher, M. Celpech, E. Gonzalez, F. Alvarez, M. Cuñado, G.
Serrano, J. L. Cormenzana, W. Kuckshinrichs, R. Odoj, W. von Lensa, J. Wallenius, D. Weslèn, C.
Zimmerman, J. Marivoet, “RED-IMPACT: Impact of Partitioning, Transmutation and Waste
Reduction Technologies on the Final Nuclear Waste Disposal, Synthesis Report”,
Forschungszentrum Jülich GmbH, ISBN 978-3-89336-5388, Germany, September 2007.
[34] Nuclear Energy Agency, “The Effects of the Uncertainty of Input Parameters on Nuclear Fuel Cycle
Scenario Studies”, Nuclear Energy Agency, Organization for Economic Co-operation and
Development, to be published, expected in 2017.
[35] R. Ochoa, M. Vázquez, F. Álvarez-Velarde, F. Martín-Fuertes, N. García-Herranz, D. Cuervo, “A
comparative study of Monte Carlo-coupled depletion codes applied to a Sodium Fast Reactor design
loaded with minor actinides”, Annals of Nuclear Energy 57, 32-40, 2013.
[36] D. E. Shropshire, K. A. Williams, J. D. Smith, B. W. Dixon, M. Dunzik-Gougar, R.D. Adams, D.
Gombert, J. T. Carter, E. Schneider, and D. Hebditch, “Advanced Fuel Cycle Cost Basis, Idaho
National Laboratory, INL/EXT-07-12107 Rev 2, December 2009.
[37] Economic Modelling Working Group, “Cost Estimating Guidelines for Generation IV Nuclear
Energy Systems Revision 4.2”, Generation IV International Forum, September 2007.
[38] M. Moore, J. Pencer, L.K.H. Leung, and R. Sadhankar, “Knowledge Gaps in Economic Analyses of
Advanced Reactor Concepts”, Proceedings of Canadian Nuclear Society's 19th Pacific Basin
Nuclear Conference (PBNC-2014), Vancouver, BC, Canada, August 2014.
[39] International Atomic Energy Agency, “INPRO Methodology for Sustainability Assessment of
Nuclear Energy Systems: Economics. INPRO Manual”, IAEA Nuclear Energy Series, No. NG-T-
4.4, IAEA, Vienna, 2014.

190
[40] International Atomic Energy Agency, “Guidance for the Application of an Assessment
Methodology for Innovative Nuclear Energy Systems. INPRO Manual – Economics. Volume 2 of
the Final Report of Phase 1 of the International Project on Innovative Nuclear Reactors and Fuel
Cycles (INPRO)”, IAEA-TECDOC-1575 Rev.1, IAEA, Vienna, 2008.
[41] Nuclear Energy Agency, “The Economics of the Back End of the Nuclear Fuel Cycle”, NEA No.
7061, Nuclear Energy Agency, Organization for Economic Co-operation and Development, 2013.
[42] W. J. Garland, Editor-in chief, “The Essential CANDU, A Textbook on the CANDU Nuclear Power
Plant Technology”, University Network of Excellence in Nuclear Engineering (UNENE), ISBN 0-
9730040. Retrieved from https://www.unene.ca/education/candu-textbook on May 25, 2016.
[43] D. Altiparmakov, "New Capabilities of the Lattice Code WIMS-AECL", PHYSOR-2008,
International Conference on Reactor Physics, Nuclear Power: A Sustainable Resource, Interlaken,
Switzerland. 2008.
[44] D. Altiparmakov, “ENDF/B-VII.0 Versus ENDF/B-VI.8 in CANDU Calculations”, PHYSOR 2010
– Advances in Reactor Physics to Power the Nuclear Renaissance, Pittsburgh, Pennsylvania, USA,
May 9-14, 2010.
[45] R. Davis, “Standard Model for CANDU 6 Lattice Cell for Use with WIMS AECL 3.1”, 153-03310-
COG-001, ISTR-11-5026, July 2012.
[46] N. Alderson, “WIMS-AECL Standard Model for EC6 Lattice Calculations”, 53A-03310-ASD-003,
February 2011.
[47] J. Pencer, “WIMS-AECL Lattice Reference Models for Use in Fuel Cycle Scoping Studies”, AECL
internal report No. 153-123700-440-012, February 2012.
[48] J. Pencer, “SCWR 78-Element Bundle Reference Model”, AECL internal report No. 217-123700-
REPT-001, February 2012.
[49] M. Tayal, J. W. Love, D. Dennier, M. Gacesa, S. Sato, J. Macquarrie, B. A. W Smith, S-D Yu, M.
Tanaka, B. Wong, and C. Manu, “A 61-Element Fuel Design (HAC) For Very High Burnups”, 4th
International Conference on CANDU Fuel, Pembroke, Ontario, Canada, October 1995.
[50] J. Armstrong, “High-Burnup Project: Full-Core Reactor Physics Result for HAC and ICAF Fuel
Bundle Concepts to a Target Average Exit Burnup of 20 MWd/kgU”, 153-124100-440-003 R1,
September 2012.
[51] International Atomic Energy Agency, “Heavy Water Reactors: Status and Projected Development”,
Technical Reports Series No. 407, Vienna, 2002.
[52] J.M. Pounders, F. Rahnema, D. Serghuita, and J. Tholammakkil, “A 3D stylized half-core CANDU
benchmark problem”, Annals of Nuclear Energy, 38, 876-896, 2011.
[53] CRC, “Handbook of Chemistry and Physics”, 92nd Edition, 2011-2012.
[54] G.W.R. Edwards, Private communication, July 2012.
[55] Oak Ridge National Laboratory, “SCALE: A Modular Code System for Performing Standardized
Computer Analyses for Licensing Evaluations”, ORNL/TM-2005/39, Version 5, Vols. I–III, 2005
April. Available from Radiation Safety Information Computational Center at Oak Ridge National
Laboratory as CCC-725.

191
[56] Woldman's Engineering Alloys 9th ed. J. Frick Editor, ASM International 2000.
[57] G. Roh and H. Choi, “Benchmark Calculations for Standard and DUPIC CANDU Fuel Lattices
Compared with the MCNP-4B Code”, Nuclear Technology, 132, 128-151, 2000.
[58] M.A. Lone, “Fuel Temperature Reactivity Coefficient of a CANDU Lattice – Numerical
Benchmark of WIMS-AECL (2-5d) Against MCNP”, Twenty Second Annual Conference of the
Canadian Nuclear Society Toronto, Ontario, Canada. June 10-13, 2001.
[59] J. Armstrong, Private communication, July 2012.
[60] T. Liang, W. Shen, E. Varin, K. Ho, “Improvement and Qualification of WIMSUTILITIES”, 29th
Annual Conference of the Canadian Nuclear Society, Toronto, Ontario, June 2008.
[61] T. Liang, “WIMSUtilites Version 2.0: User’s manual”, 153-119220-UM-001 Revision 1, January
2010.
[62] B. Hyland, E.D. Collins, R. J. Ellis, G. Del cul and M. Magill, “Transmutation of Americium and
Curium in a Lanthanide Matrix”, Proceedings of the Global 2011 Conference, Chiba, Japan,
December 2011.
[63] K. Sun, J. Krepel, K. Mikityuk, and R. Chawla, “Void Reactivity Decomposition for the Sodium-
Cooled Fast Reactor in Equilibrium Closed Fuel Cycle”, Physor 2010, Pittsburgh, USA, May 2010.
[64] J. Leppänen, "Development of a new Monte Carlo reactor physics code." D.Sc. Thesis, Helsinki
University of Technology (VTT Publications 640), 2007.
[65] M. S. Hussein, H.W. Bonin & B.J. Lewis, “Calculation of the Radial and Axial Flux and Power
Distribution for a CANDU 6 Reactor with both the MCNP6 and Serpent Codes”, 19th Pacific Basin
Nuclear Conference (PBNC 2014), Vancouver, British Columbia, Canada, 24-28 August 2014.
[66] M. S. Hussein, H.W. Bonin & B.J. Lewis, “Burnup Calculations for a CANDU-6 Reactor Using the
SERPENT and MCNP6 Codes”, 38th Annual CNS/CNA Student Conference, Vancouver, British
Columbia, Canada, 24-28 August 2014.
[67] D. Altiparmakov, “ENDF/B-VII.0 versus ENDF/B-VI.8 in CANDU Calculations,” in Proceedings
of PHYSOR 2010, Pittsburgh, Pennsylvania, USA, May 9-14, 2010, on CD ROM, American
Nuclear Society, LaGrange Park, IL (2010).
[68] K. Sun, J. Krepel, K. Mikityuk, R. Chawla, “Void Reactivity Decompostion for the Sodium-cooled
Fast Reactor in Equilibrium Fuel Cycle”, Annals of Nuclear Energy vol. 38, pp 1645-1657, 2011.
[69] M. M. El-Wakil, “Nuclear Power Engineering”, McGraw-Hill, USA, 1962.
[70] J. Jacobson, G.E. Matheson, S.J. Piet, and D.E. Shropshire, “VISION: Verifiable Fuel Cycle
Simulation Model”, Global Conference 2009, Paris, France, September 2009.
[71] J. Jacobson, R.F. Jeffers, G.E. Matheson, S.J. Piet, and W.D. Hintze, “User Guide for VISION 3.4.7
(Verifiable Fuel Cycle Simulation) Model”, AFCI-SYSA-AI-MI-GD-2009-000152, Rev. 3,
INL/EXT-09-16645, Rev 3, U.S. Department of Energy, Idaho National Laboratory, July 2011.
[72] S. J. Piet, B. W. Dixon, J. J. Jacobson, G. E. Matthern, D. E. Shropshire, “Lessons Learned from
Dynamic Simulations of Advanced Fuel Cycles”, Global Conference 2009, Paris, France,
September 2009.
192
[73] International Atomic Energy Agency, “Nuclear Power Reactors in the World”, Reference Data
Series No. 2, 2015 edition, Vienna, Austria, May 2015.
[74] World Nuclear Association, “Optimized Capacity: Global Trends and Issues 2014 edition”,
December 2015.
[75] Candu Energy Inc,. “EC6 Enhanced CANDU 6 Technical Summary”, Candu Energy Inc.,
Mississauga, Canada, 2012.
[76] I. Rodríguez, F.Álvarez-Velarde, F. Martín-Fuertes, “Analysis of Advanced European Nuclea Fuel
Cycle Scenarios Including Transmutation and Economic Studies”, Annals of Nuclear Energy 70,
pp240-247, April 2014.
[77] G. L. Fiorini, “The Collaborative Project on European Sodium Fast Reactor (CP-ESFR Project)”,
FISA 2009 7th European Commission Conference on Euratom Research and Training in Reactor
Systems, Prague, Czech Republic, June 2009.
[78] V. Romanello, A. Schwenk-Ferrero, M. Salvatores, F. Gabrielli, B. Vezzoni, W. Maschek, A.
Rineiski, “Transition Towards a Sustainable Nuclear Fuel Cycle”, Nuclear Energy Agency, 2013.
[79] International Institute for Applied Systems Analysis, “Global Energy Perspectives”, Cambridge
University Press, ISBN: 0-521-64569-7, 1998.
[80] International Panel on Climate Change, “Special Report on emissions Scenarios”, IPCC, ISBN: 92-
9169-113-5, 2000.
[81] International Atomic Energy Agency, “Impact of High Burnup Uranium Oxide and Mixed
Uranium-Plutonium Oxide Water Reactor Fuel on Spent Fuel Management”, IAEA No. NF-T-38,
Vienna 2011.
[82] Organisation for Economic Co-operation and Development Nuclear Energy Agency, “Uranium
2014: Resources, Production and Demand”, A Joint Report by the OECD Nuclear Energy Agency
and the International Atomic Energy Agency, NEA No. 7209, OECD, Paris, France, 2014.
[83] S. Passerini, B. Feng, T. Fei, T. K. Kim, and T. A. Taiwo, “Analysis of Transition to Fuel Cycle
System with Continuous Recycling in Fast and Thermal Reactors”, Proceedings of the Global 2015
Conference: Nuclear Fuel Cycle for a Low-Carbon Future, Paris, France, September 2015.
[84] Y. Chang, P. J. Finck and C. Grandy, “Advanced Burner Test Reactor Preconceptual Design
Report”, ANL-ABR-1, ANL-AFCI-173, Argonne National Laboratory, Chicago, United States,
September 2006.

193
Appendix A
Fission and Capture Cross Sections for Isotopes of Importance for Long Term
Characteristics of Spent Light Water Reactor Fuel
This section contains figures of the capture and fission cross-sections, taken from [17], as a function of
incident neutron energy for transuranic isotopes of importance to the long term characteristics of spent
fuel. These isotopes are listed for various times after irradiation in Table 3. For all isotopes other than the
fissile Pu-239, the capture cross-section is greater than the fission cross-section at low energies, but the
curves cross, and the fission cross section is greater at high neutron energies. The y-axis scales on these
figures are logarithmic, so it is also important to note the drop in magnitude of the cross-sections as the
energy rises from thermal neutrons at 0.025eV, up to a fast neutron ~1 MeV, which can be several orders
of magnitude.
Figure 164 Capture (green) and fission (blue) cross-sections for Pu-238.
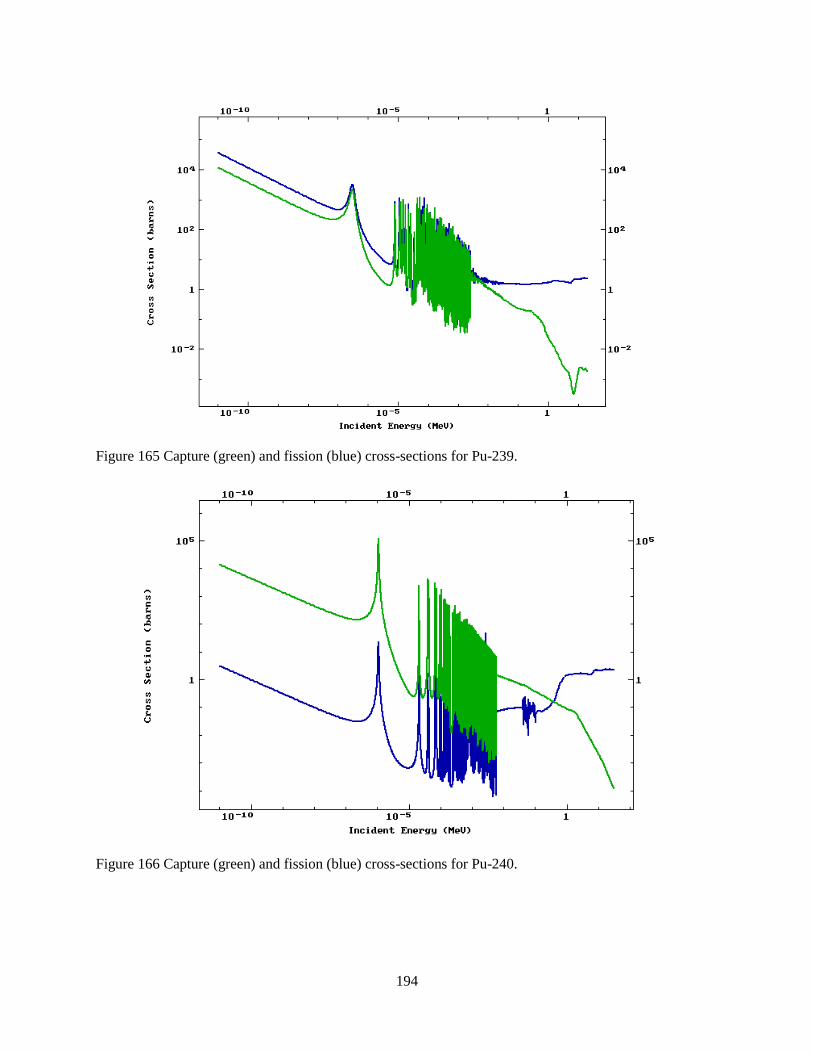
194
Figure 165 Capture (green) and fission (blue) cross-sections for Pu-239.
Figure 166 Capture (green) and fission (blue) cross-sections for Pu-240.
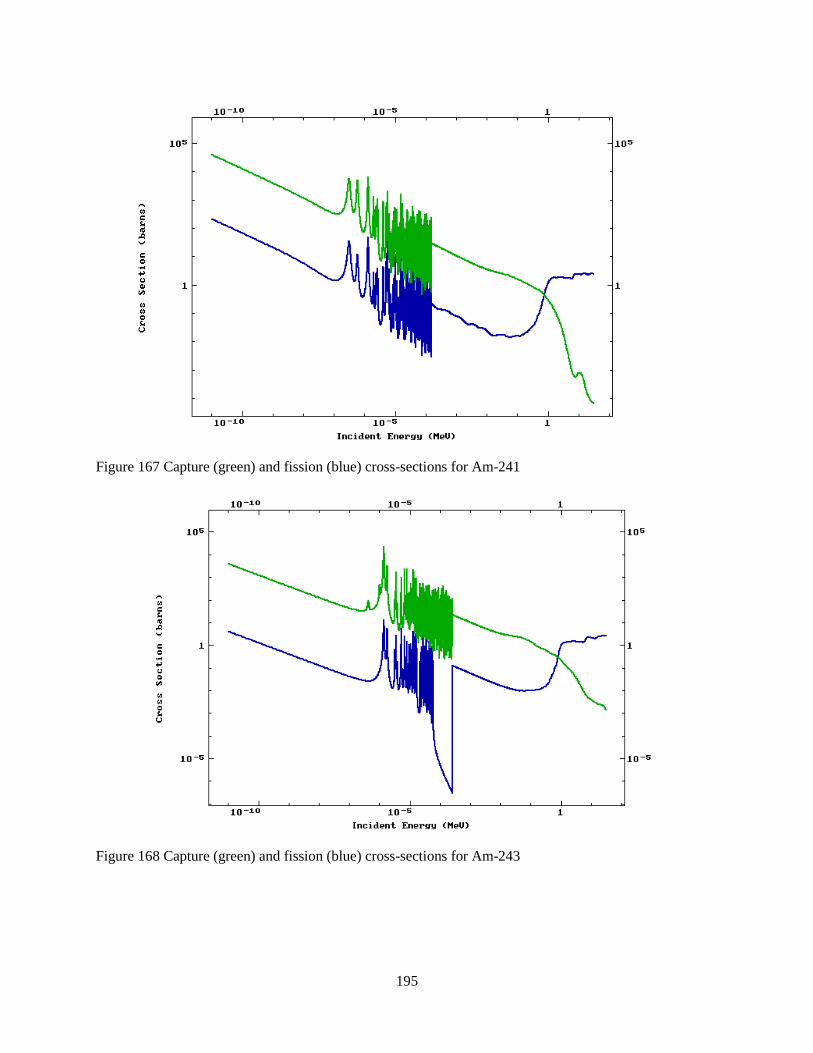
195
Figure 167 Capture (green) and fission (blue) cross-sections for Am-241
Figure 168 Capture (green) and fission (blue) cross-sections for Am-243
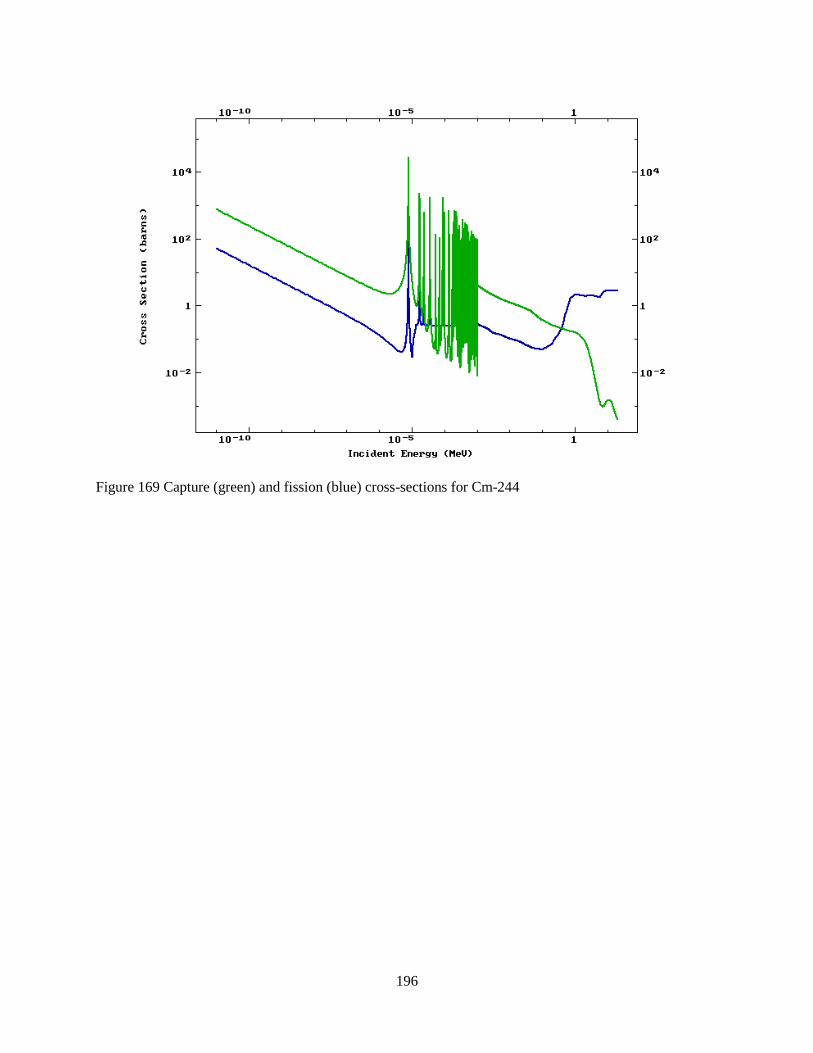
196
Figure 169 Capture (green) and fission (blue) cross-sections for Cm-244
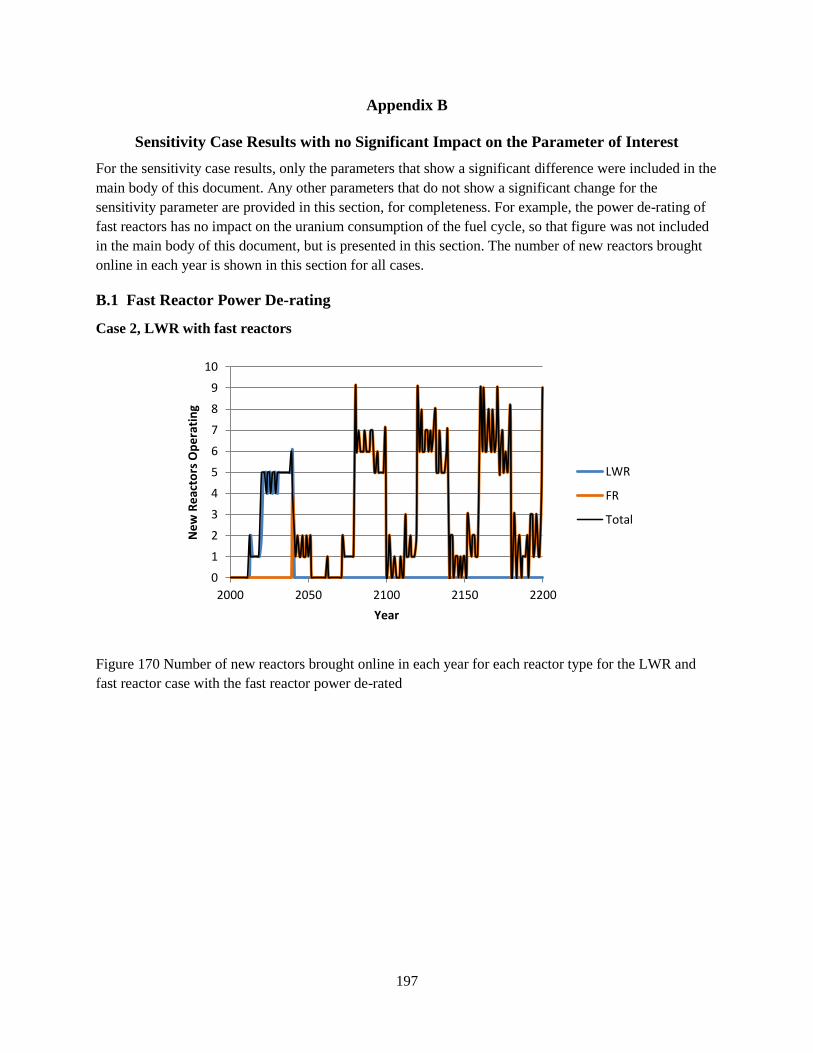
197
Appendix B
Sensitivity Case Results with no Significant Impact on the Parameter of Interest
For the sensitivity case results, only the parameters that show a significant difference were included in the
main body of this document. Any other parameters that do not show a significant change for the
sensitivity parameter are provided in this section, for completeness. For example, the power de-rating of
fast reactors has no impact on the uranium consumption of the fuel cycle, so that figure was not included
in the main body of this document, but is presented in this section. The number of new reactors brought
online in each year is shown in this section for all cases.
B.1 Fast Reactor Power De-rating
Case 2, LWR with fast reactors
Figure 170 Number of new reactors brought online in each year for each reactor type for the LWR and
fast reactor case with the fast reactor power de-rated
0
1
2
3
4
5
6
7
8
9
10
2000 2050 2100 2150 2200
Ne
w R
eac
tors
Op
era
tin
g
Year
LWR
FR
Total
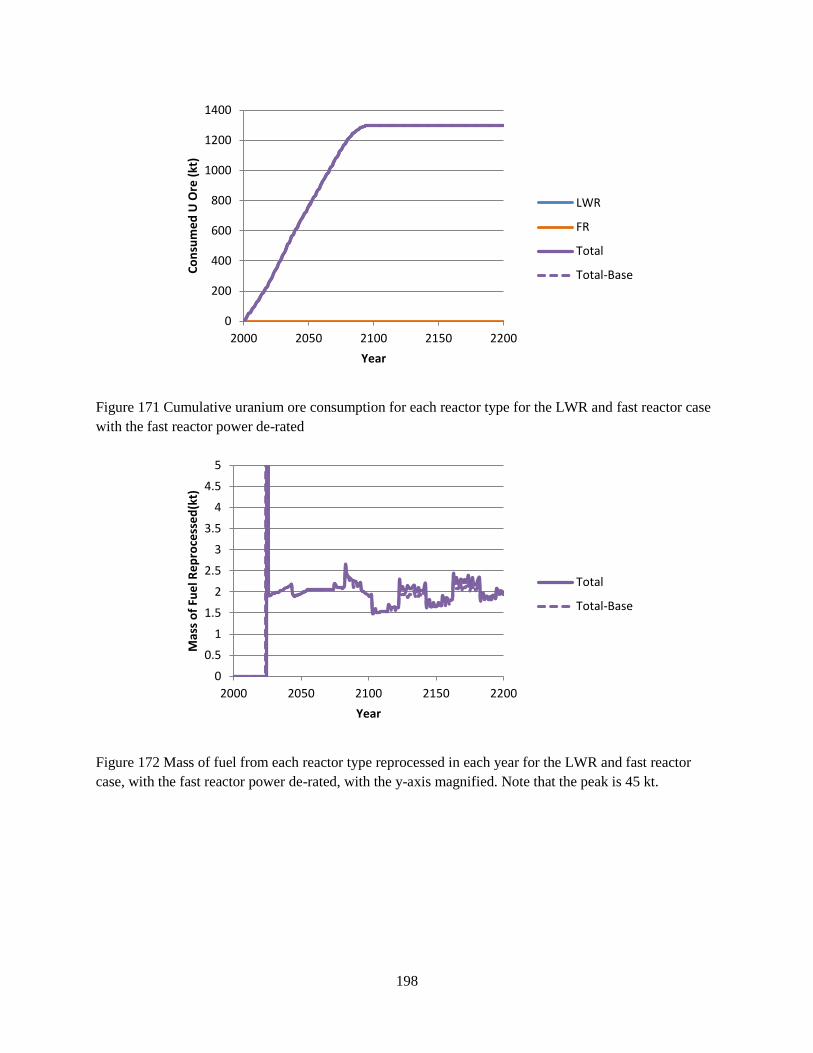
198
Figure 171 Cumulative uranium ore consumption for each reactor type for the LWR and fast reactor case
with the fast reactor power de-rated
Figure 172 Mass of fuel from each reactor type reprocessed in each year for the LWR and fast reactor
case, with the fast reactor power de-rated, with the y-axis magnified. Note that the peak is 45 kt.
0
200
400
600
800
1000
1200
1400
2000 2050 2100 2150 2200
Co
nsu
me
d U
Ore
(kt
)
Year
LWR
FR
Total
Total-Base
0
0.5
1
1.5
2
2.5
3
3.5
4
4.5
5
2000 2050 2100 2150 2200
Mas
s o
f Fu
el R
ep
roce
sse
d(k
t)
Year
Total
Total-Base

199
Figure 173 Source of americium, internal or external to the scenario, used to fabricate fuel, in each year
for the LWR and fast reactor case, with the fast reactor power de-rated
Figure 174 Source of curium, internal or external to the scenario, used to fabricate fuel, in each year for
the LWR and fast reactor case, with the fast reactor power de-rated
0
5
10
15
20
25
30
35
40
45
2000 2050 2100 2150 2200
Mas
s o
f A
me
rici
um
(t)
Year
Internal to theScenario
External to theScenario
Internal to theScenario-Base
External to theScenario-Base
0
2
4
6
8
10
12
2000 2050 2100 2150 2200
Mas
s o
f C
uri
um
(t)
Year
Internal to theScenario
External to theScenario
Internal to Scenario-Base
External to theScenario-Base
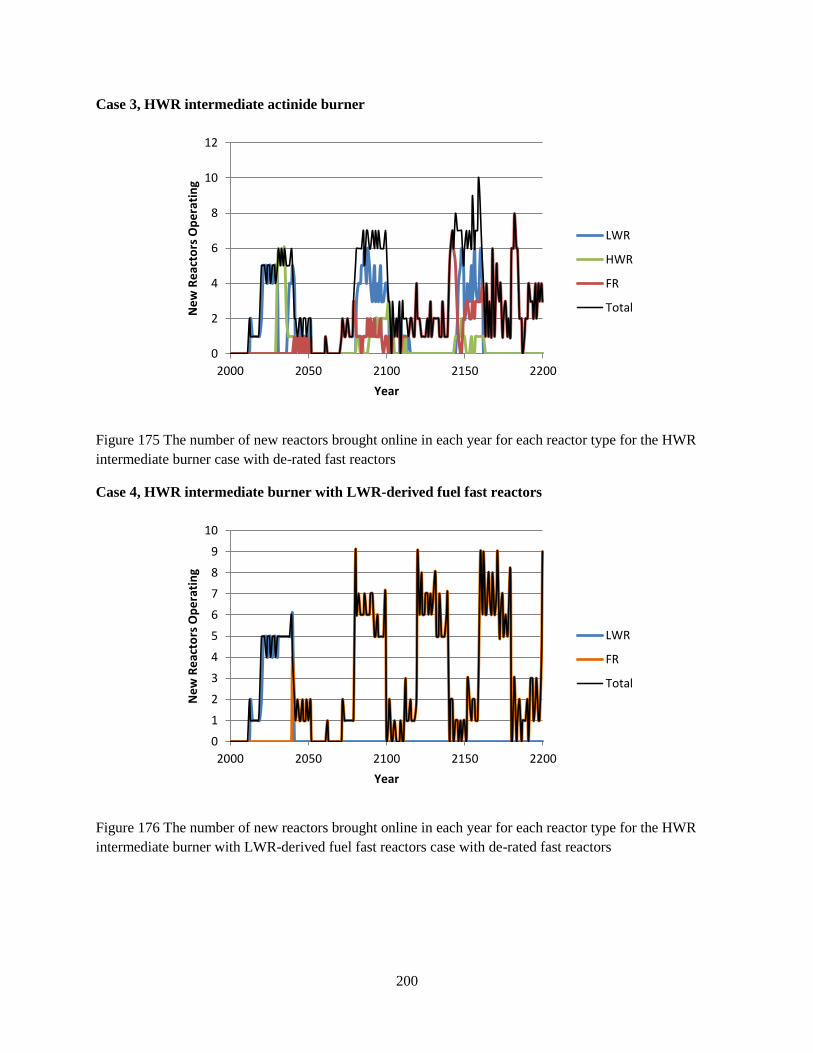
200
Case 3, HWR intermediate actinide burner
Figure 175 The number of new reactors brought online in each year for each reactor type for the HWR
intermediate burner case with de-rated fast reactors
Case 4, HWR intermediate burner with LWR-derived fuel fast reactors
Figure 176 The number of new reactors brought online in each year for each reactor type for the HWR
intermediate burner with LWR-derived fuel fast reactors case with de-rated fast reactors
0
2
4
6
8
10
12
2000 2050 2100 2150 2200
Ne
w R
eac
tors
Op
era
tin
g
Year
LWR
HWR
FR
Total
0
1
2
3
4
5
6
7
8
9
10
2000 2050 2100 2150 2200
Ne
w R
eac
tors
Op
era
tin
g
Year
LWR
FR
Total

201
B.2 No Legacy Spent Fuel
Case 2, LWR with fast reactors
Figure 177 The number of operating reactors in each year for each reactor type for the LWR and fast
reactor case with no legacy spent fuel
Figure 178 The number of new reactors brought online in each year for each reactor type for the LWR
and fast reactor case with no legacy spent fuel
0
20
40
60
80
100
120
140
2000 2050 2100 2150 2200
Op
era
tin
g R
eac
tors
Year
LWR
FR
Total
LWR-Base
FR-Base
0
1
2
3
4
5
6
7
8
2000 2050 2100 2150 2200
Ne
w R
eac
tors
Op
era
tin
g
Year
LWR
FR
Total
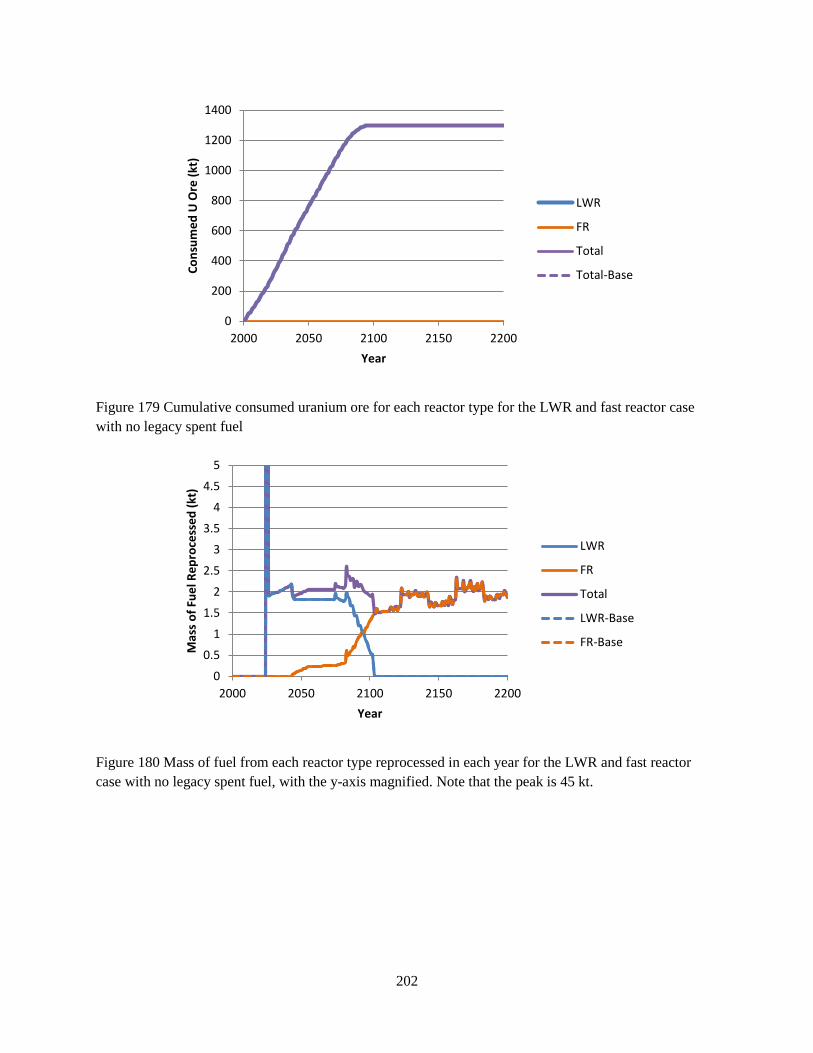
202
Figure 179 Cumulative consumed uranium ore for each reactor type for the LWR and fast reactor case
with no legacy spent fuel
Figure 180 Mass of fuel from each reactor type reprocessed in each year for the LWR and fast reactor
case with no legacy spent fuel, with the y-axis magnified. Note that the peak is 45 kt.
0
200
400
600
800
1000
1200
1400
2000 2050 2100 2150 2200
Co
nsu
me
d U
Ore
(kt
)
Year
LWR
FR
Total
Total-Base
0
0.5
1
1.5
2
2.5
3
3.5
4
4.5
5
2000 2050 2100 2150 2200
Mas
s o
f Fu
el R
ep
roce
sse
d (
kt)
Year
LWR
FR
Total
LWR-Base
FR-Base
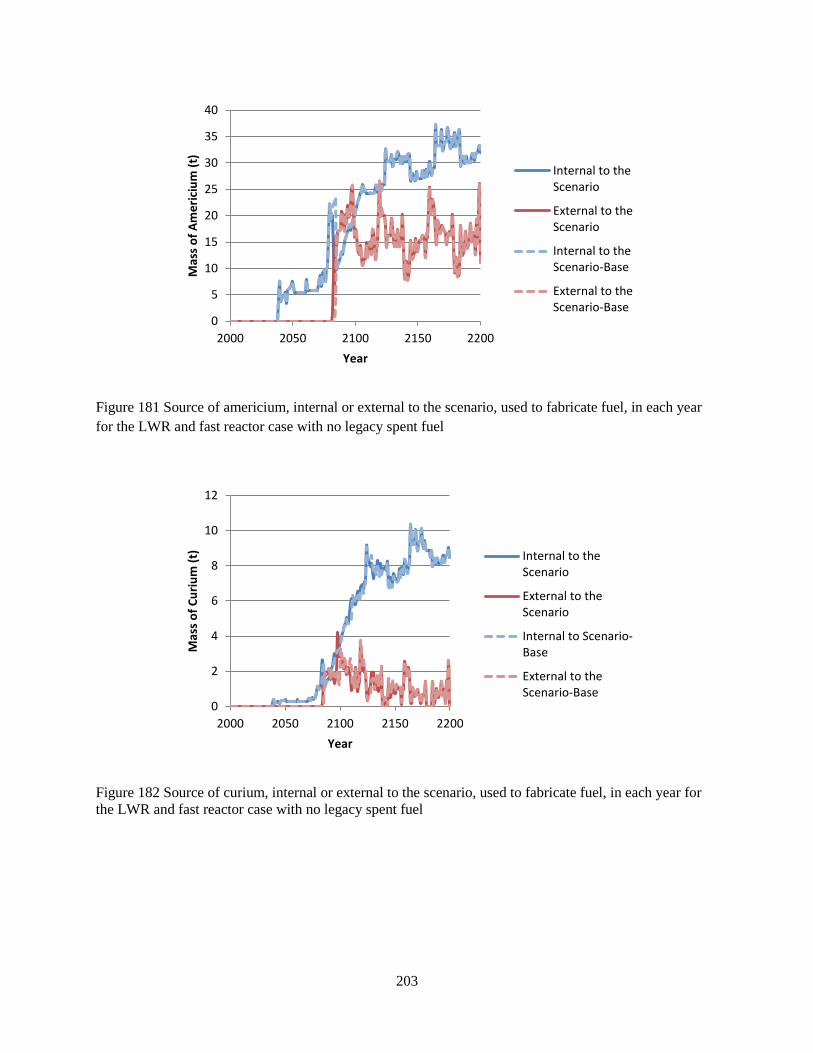
203
Figure 181 Source of americium, internal or external to the scenario, used to fabricate fuel, in each year
for the LWR and fast reactor case with no legacy spent fuel
Figure 182 Source of curium, internal or external to the scenario, used to fabricate fuel, in each year for
the LWR and fast reactor case with no legacy spent fuel
0
5
10
15
20
25
30
35
40
2000 2050 2100 2150 2200
Mas
s o
f A
me
rici
um
(t)
Year
Internal to theScenario
External to theScenario
Internal to theScenario-Base
External to theScenario-Base
0
2
4
6
8
10
12
2000 2050 2100 2150 2200
Mas
s o
f C
uri
um
(t)
Year
Internal to theScenario
External to theScenario
Internal to Scenario-Base
External to theScenario-Base

204
Case 3, HWR intermediate actinide burner
Figure 183 The number of operating reactors in each year for each reactor type for the HWR intermediate
burner case with no legacy spent fuel
Figure 184 The number of new reactors brought online in each year for each reactor type for the HWR
intermediate burner case with no legacy spent fuel
0
20
40
60
80
100
120
140
160
2000 2050 2100 2150 2200
Op
era
tin
g R
eac
tors
Year
LWR
HWR
FR
Total
LWR-Base
HWR-Base
FR-Base
0
2
4
6
8
10
12
2000 2050 2100 2150 2200
Ne
w R
eac
tors
Op
era
tin
g
Year
LWR
HWR
FR
Total

205
Figure 185 Cumulative uranium ore consumption for each reactor type for the HWR intermediate burner
case with no legacy spent fuel
Figure 186 Mass of fuel from each reactor type reprocessed in each year for the HWR intermediate burner
case with no legacy spent fuel, with the y-axis magnified. Note that the peak is 45 kt.
0
500
1000
1500
2000
2500
2000 2050 2100 2150 2200
Co
nsu
me
d U
Ore
(kt
Year
LWR
HWR
FR
Total
Total-Base
0
0.5
1
1.5
2
2.5
3
3.5
4
4.5
5
2000 2050 2100 2150 2200
Mas
s o
f Fu
el R
ep
roce
sse
d (
kt)
Year
LWR
HWR
FR
Total
LWR-Base
HWR-Base
FR-Base
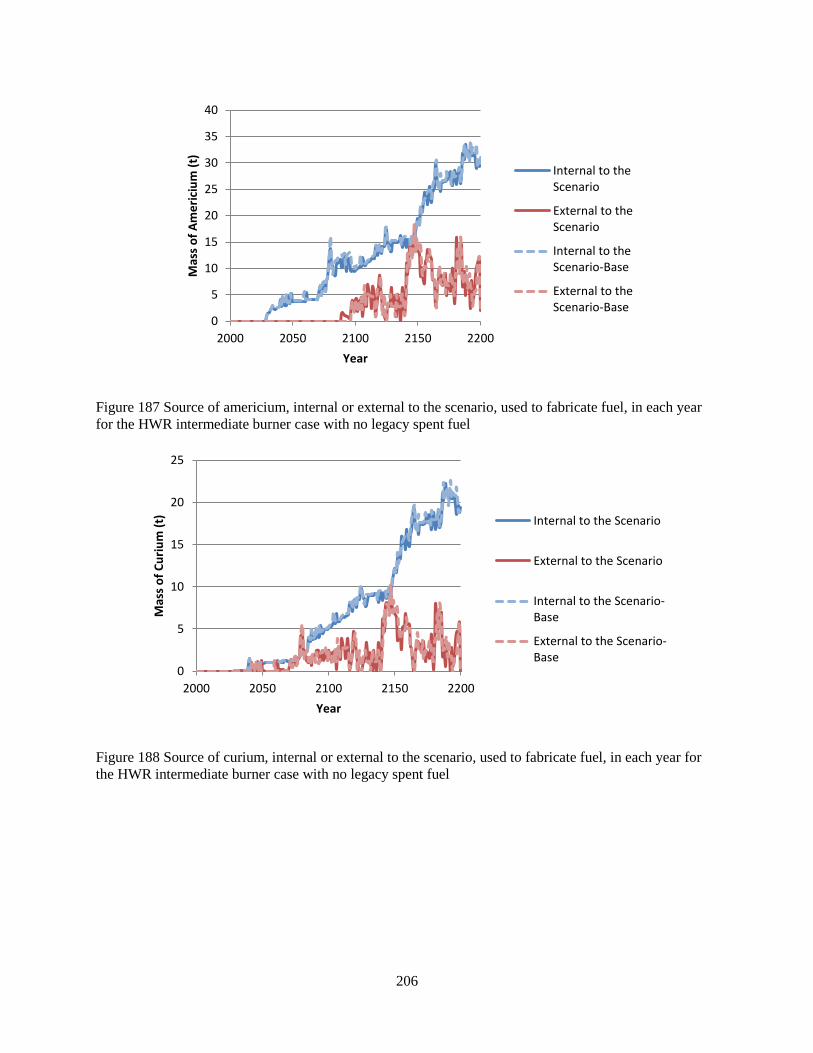
206
Figure 187 Source of americium, internal or external to the scenario, used to fabricate fuel, in each year
for the HWR intermediate burner case with no legacy spent fuel
Figure 188 Source of curium, internal or external to the scenario, used to fabricate fuel, in each year for
the HWR intermediate burner case with no legacy spent fuel
0
5
10
15
20
25
30
35
40
2000 2050 2100 2150 2200
Mas
s o
f A
me
rici
um
(t)
Year
Internal to theScenario
External to theScenario
Internal to theScenario-Base
External to theScenario-Base
0
5
10
15
20
25
2000 2050 2100 2150 2200
Mas
s o
f C
uri
um
(t)
Year
Internal to the Scenario
External to the Scenario
Internal to the Scenario-Base
External to the Scenario-Base

207
Case 4, HWR intermediate burner with LWR-derived fuel fast reactors
Figure 189 The number of operating reactors in each year for each reactor type for the HWR intermediate
burner with LWR-derived fuel fast reactors case with no legacy spent fuel
Figure 190 The number of new reactors brought online in each year for each reactor type for the HWR
intermediate burner with LWR-derived fuel fast reactors case with no legacy spent fuel
0
20
40
60
80
100
120
140
2000 2050 2100 2150 2200
Op
era
tin
g R
eac
tors
Year
LWR
HWR
FR-HWR
FR-LWR
Total
LWR-Base
HWR-Base
FR-HWR-Base
FR-LWR-Base
Total-Base
0
2
4
6
8
10
12
14
2000 2050 2100 2150 2200
Ne
w R
eac
tors
Op
era
tin
g
Year
LWR
HWR
FR-HWR
FR-LWR
Total
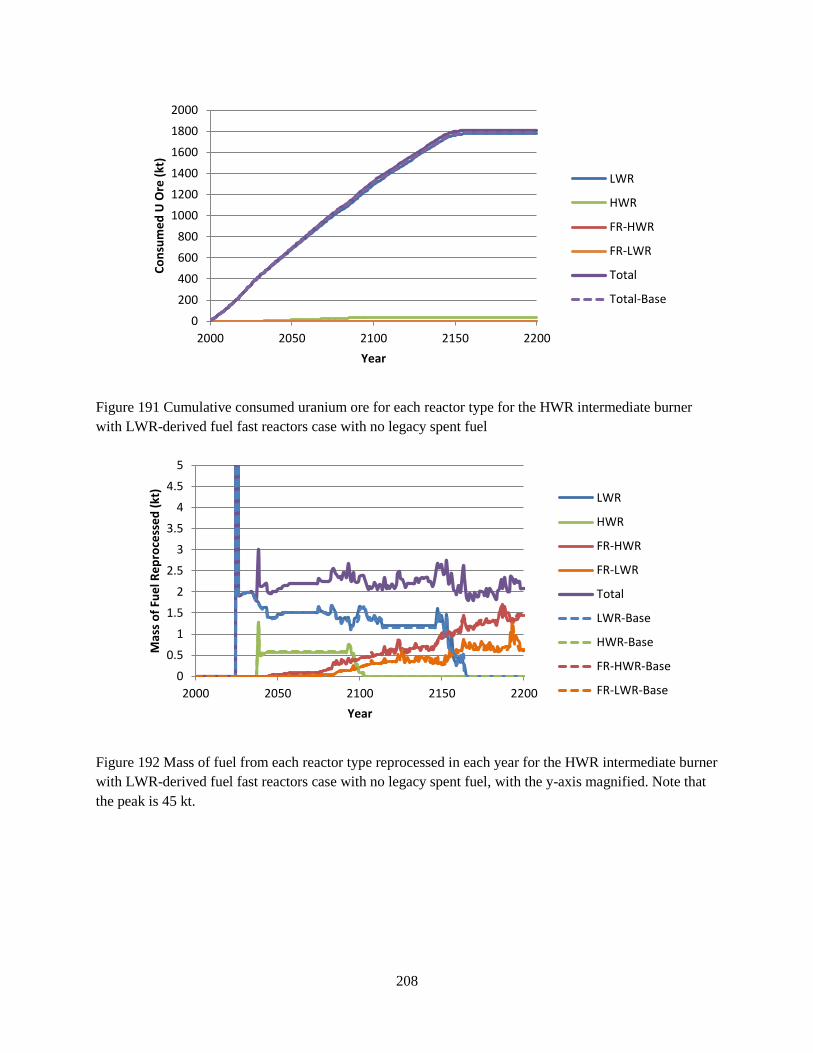
208
Figure 191 Cumulative consumed uranium ore for each reactor type for the HWR intermediate burner
with LWR-derived fuel fast reactors case with no legacy spent fuel
Figure 192 Mass of fuel from each reactor type reprocessed in each year for the HWR intermediate burner
with LWR-derived fuel fast reactors case with no legacy spent fuel, with the y-axis magnified. Note that
the peak is 45 kt.
0
200
400
600
800
1000
1200
1400
1600
1800
2000
2000 2050 2100 2150 2200
Co
nsu
me
d U
Ore
(kt
)
Year
LWR
HWR
FR-HWR
FR-LWR
Total
Total-Base
0
0.5
1
1.5
2
2.5
3
3.5
4
4.5
5
2000 2050 2100 2150 2200
Mas
s o
f Fu
el R
ep
roce
sse
d (
kt)
Year
LWR
HWR
FR-HWR
FR-LWR
Total
LWR-Base
HWR-Base
FR-HWR-Base
FR-LWR-Base
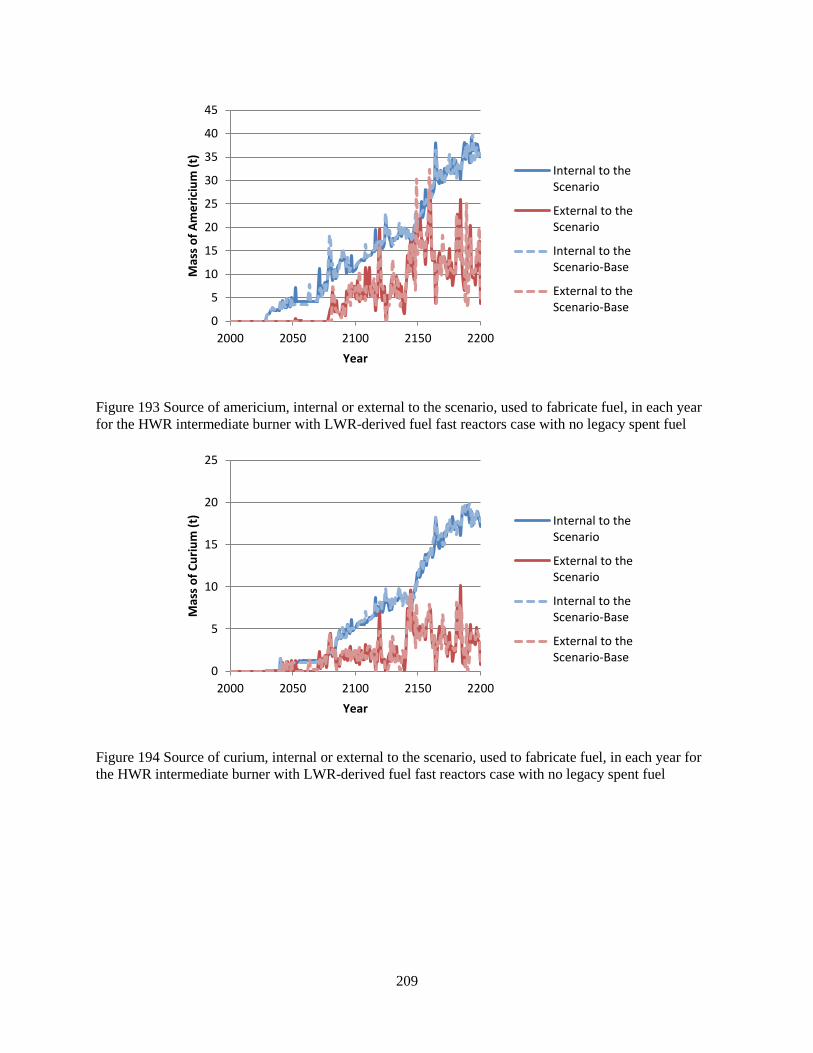
209
Figure 193 Source of americium, internal or external to the scenario, used to fabricate fuel, in each year
for the HWR intermediate burner with LWR-derived fuel fast reactors case with no legacy spent fuel
Figure 194 Source of curium, internal or external to the scenario, used to fabricate fuel, in each year for
the HWR intermediate burner with LWR-derived fuel fast reactors case with no legacy spent fuel
0
5
10
15
20
25
30
35
40
45
2000 2050 2100 2150 2200
Mas
s o
f A
me
rici
um
(t)
Year
Internal to theScenario
External to theScenario
Internal to theScenario-Base
External to theScenario-Base
0
5
10
15
20
25
2000 2050 2100 2150 2200
Mas
s o
f C
uri
um
(t)
Year
Internal to theScenario
External to theScenario
Internal to theScenario-Base
External to theScenario-Base
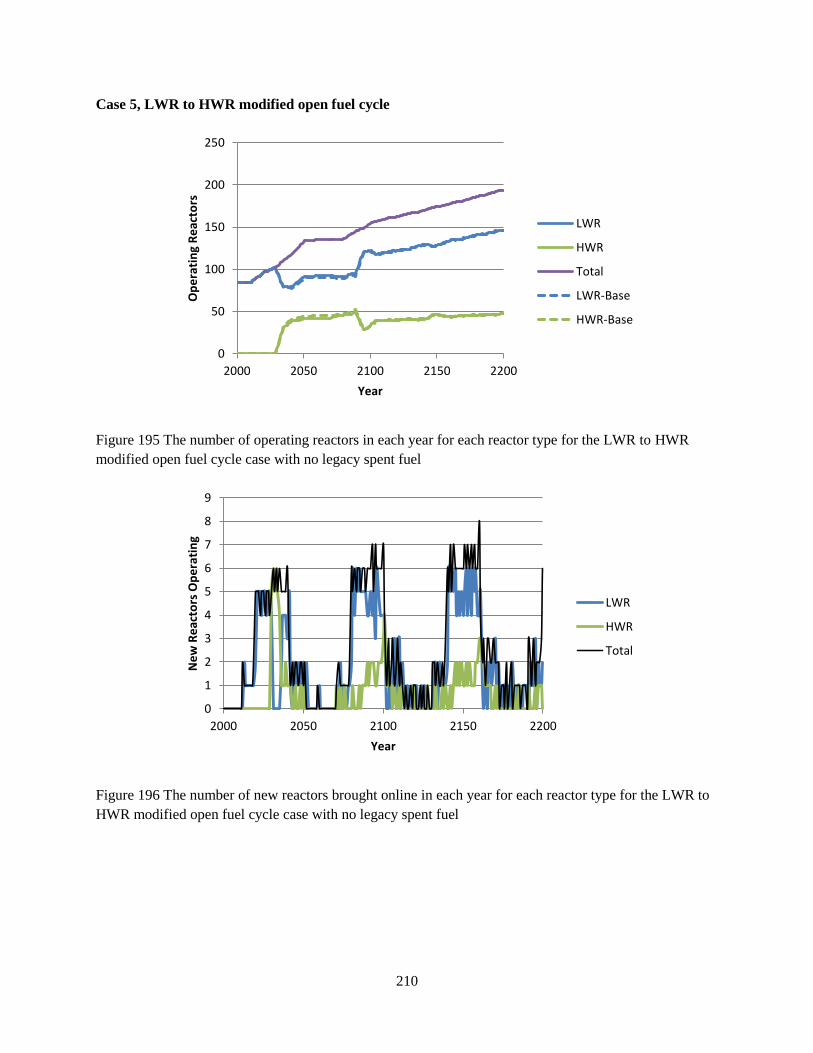
210
Case 5, LWR to HWR modified open fuel cycle
Figure 195 The number of operating reactors in each year for each reactor type for the LWR to HWR
modified open fuel cycle case with no legacy spent fuel
Figure 196 The number of new reactors brought online in each year for each reactor type for the LWR to
HWR modified open fuel cycle case with no legacy spent fuel
0
50
100
150
200
250
2000 2050 2100 2150 2200
Op
era
tin
g R
eac
tors
Year
LWR
HWR
Total
LWR-Base
HWR-Base
0
1
2
3
4
5
6
7
8
9
2000 2050 2100 2150 2200
Ne
w R
eac
tors
Op
era
tin
g
Year
LWR
HWR
Total

211
Figure 197 Cumulative uranium ore consumed for each reactor type for the LWR to HWR modified open
fuel cycle case with no legacy spent fuel
Figure 198 Mass of fuel from each reactor type reprocessed in each year for the LWR to HWR modified
open fuel cycle case with no legacy spent fuel, with the y-axis magnified. Note that the peak is 45 kt.
0
500
1000
1500
2000
2500
3000
3500
4000
2000 2050 2100 2150 2200
Co
nsu
me
d U
Ore
(kt
)
Year
LWR
HWR
Total
Total-Base
0
0.5
1
1.5
2
2.5
3
3.5
4
4.5
5
2000 2050 2100 2150 2200
Mas
s o
f Fu
el R
ep
roce
sse
d (
kt)
Year
LWR
HWR
Total
LWR-Base

212
B.3 Capped Reprocessing Capacity
Case 2, LWR with fast reactors
Figure 199 The number of operating reactors in each year for each reactor type for the LWR with fast
reactors case with capped reprocessing capacity
Figure 200 The number of new reactors brought online in each year for each reactor type for the LWR
with fast reactors case with capped reprocessing capacity
0
20
40
60
80
100
120
140
2000 2050 2100 2150 2200
Op
era
tin
g R
eac
tors
Year
LWR
FR
Total
LWR-Base
FR-Base
0
1
2
3
4
5
6
7
8
2000 2050 2100 2150 2200
Ne
w R
eac
tors
Op
era
tin
g
Year
LWR
FR
Total

213
Figure 201 Cumulative consumed uranium ore for each reactor type for the LWR with fast reactors case
with capped reprocessing capacity
Figure 202 Source of americium, internal or external to the scenario, used to fabricate fuel, in each year
for the LWR with fast reactors case with capped reprocessing capacity
0
200
400
600
800
1000
1200
1400
2000 2050 2100 2150 2200
Co
nsu
me
d U
Ore
(kt
)
Year
LWR
FR
Total
Total-Base
0
5
10
15
20
25
30
35
40
2000 2050 2100 2150 2200
Mas
s o
f A
me
rici
um
(t)
Year
Internal to theScenario
External to theScenario
Internal to theScenario-Base
External to theScenario-Base
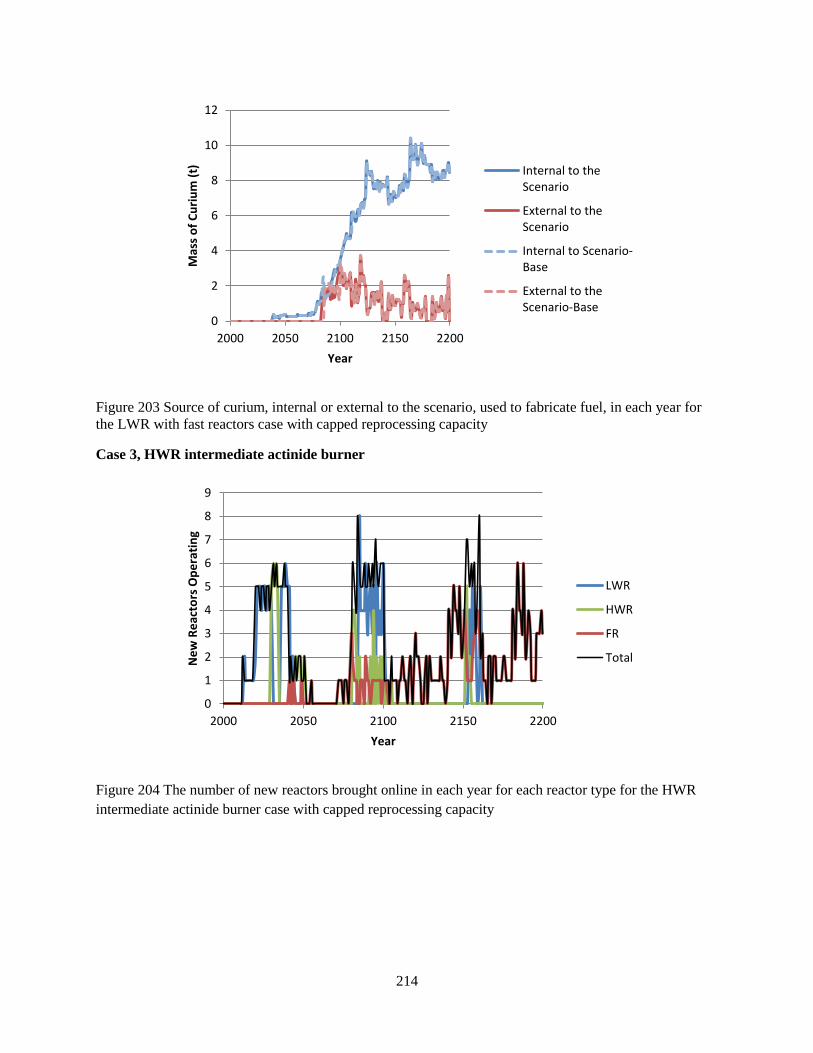
214
Figure 203 Source of curium, internal or external to the scenario, used to fabricate fuel, in each year for
the LWR with fast reactors case with capped reprocessing capacity
Case 3, HWR intermediate actinide burner
Figure 204 The number of new reactors brought online in each year for each reactor type for the HWR
intermediate actinide burner case with capped reprocessing capacity
0
2
4
6
8
10
12
2000 2050 2100 2150 2200
Mas
s o
f C
uri
um
(t)
Year
Internal to theScenario
External to theScenario
Internal to Scenario-Base
External to theScenario-Base
0
1
2
3
4
5
6
7
8
9
2000 2050 2100 2150 2200
Ne
w R
eac
tors
Op
era
tin
g
Year
LWR
HWR
FR
Total
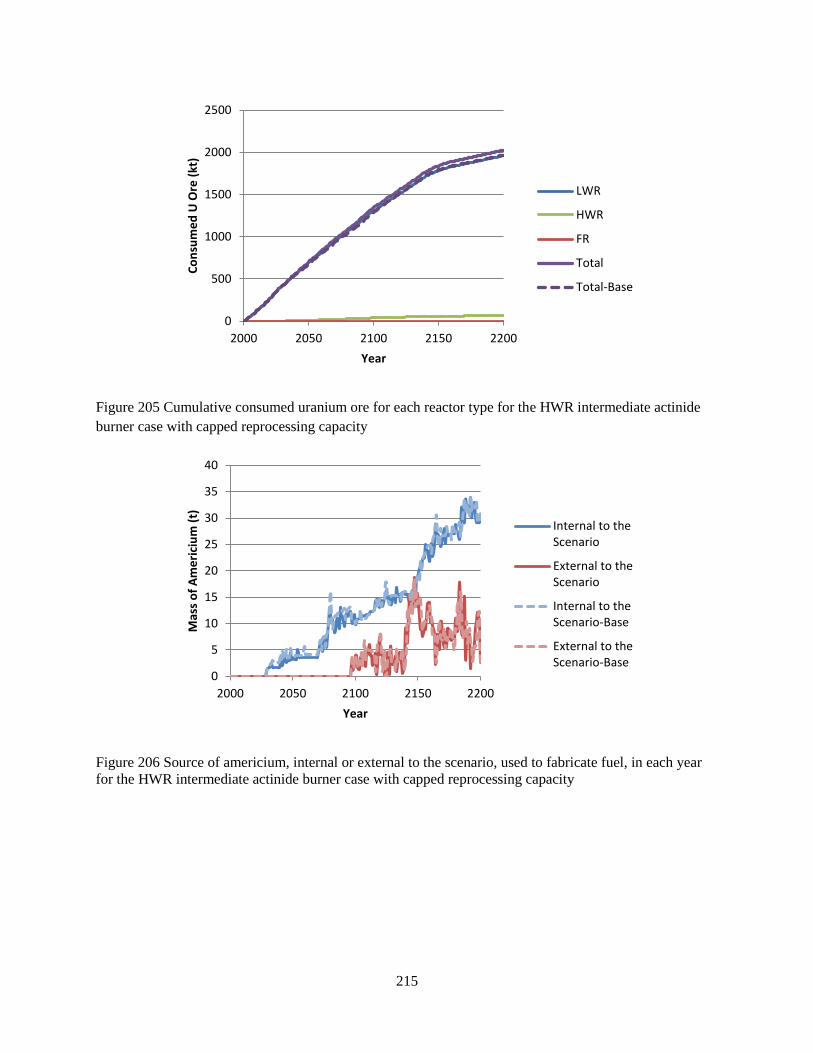
215
Figure 205 Cumulative consumed uranium ore for each reactor type for the HWR intermediate actinide
burner case with capped reprocessing capacity
Figure 206 Source of americium, internal or external to the scenario, used to fabricate fuel, in each year
for the HWR intermediate actinide burner case with capped reprocessing capacity
0
500
1000
1500
2000
2500
2000 2050 2100 2150 2200
Co
nsu
me
d U
Ore
(kt
)
Year
LWR
HWR
FR
Total
Total-Base
0
5
10
15
20
25
30
35
40
2000 2050 2100 2150 2200
Mas
s o
f A
me
rici
um
(t)
Year
Internal to theScenario
External to theScenario
Internal to theScenario-Base
External to theScenario-Base

216
Figure 207 Source of curium, internal or external to the scenario, used to fabricate fuel, in each year for
the HWR intermediate actinide burner case with capped reprocessing capacity
Case 4, HWR intermediate burner with LWR-derived fuel fast reactors
Figure 208 Number of new reactors brought online in each year for each reactor type for the HWR
intermediate burner with LWR-derived fuel fast reactors case with capped reprocessing capacity
0
5
10
15
20
25
2000 2050 2100 2150 2200
Mas
s o
f C
uri
um
(t)
Year
Internal to the Scenario
External to the Scenario
Internal to the Scenario-Base
External to the Scenario-Base
0
2
4
6
8
10
12
14
2000 2050 2100 2150 2200
Ne
w R
eac
tors
Op
era
tin
g
Year
LWR
HWR
FR-HWR
FR-LWR
Total
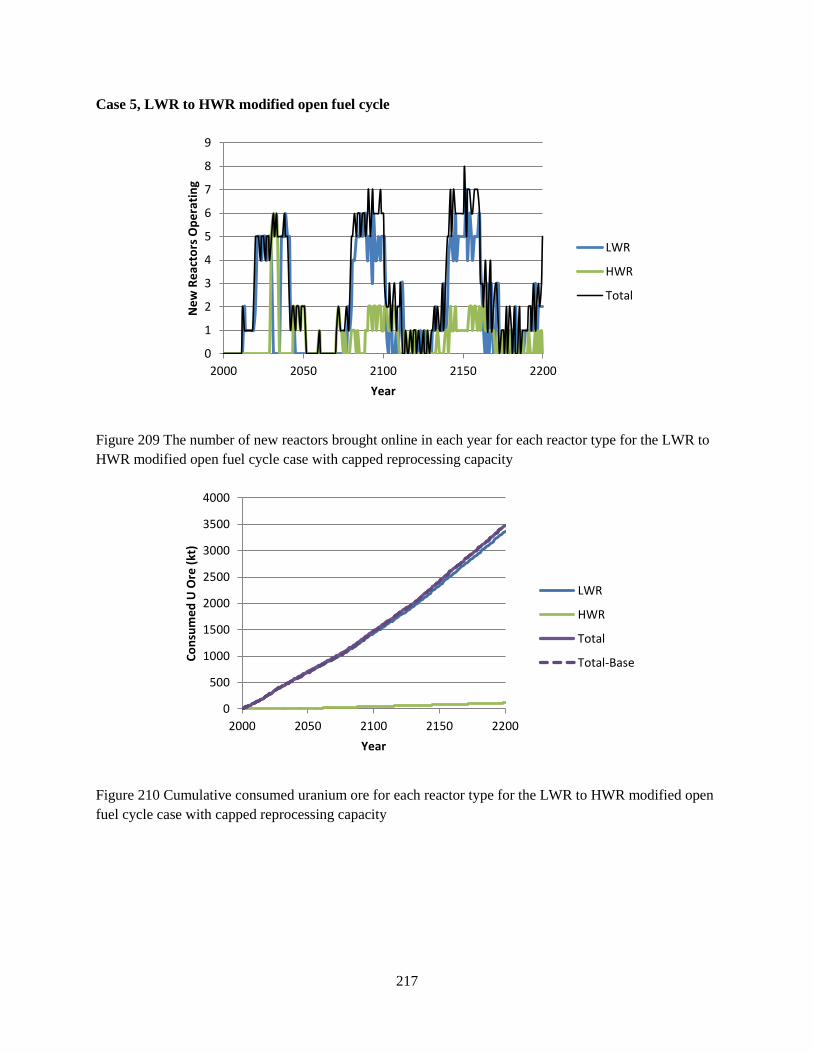
217
Case 5, LWR to HWR modified open fuel cycle
Figure 209 The number of new reactors brought online in each year for each reactor type for the LWR to
HWR modified open fuel cycle case with capped reprocessing capacity
Figure 210 Cumulative consumed uranium ore for each reactor type for the LWR to HWR modified open
fuel cycle case with capped reprocessing capacity
0
1
2
3
4
5
6
7
8
9
2000 2050 2100 2150 2200
Ne
w R
eac
tors
Op
era
tin
g
Year
LWR
HWR
Total
0
500
1000
1500
2000
2500
3000
3500
4000
2000 2050 2100 2150 2200
Co
nsu
me
d U
Ore
(kt
)
Year
LWR
HWR
Total
Total-Base

218
Figure 211 Source of curium, internal or external to the scenario, used to fabricate fuel, in each year for
the LWR to HWR modified open fuel cycle case with capped reprocessing capacity
0
5
10
15
20
25
2000 2050 2100 2150 2200
Mas
s o
f C
uri
um
(t)
Year
Internal to theScenario
External to theScenario
Internal to theScenario-Base
External to theScenario-Base

219
B.4 Fast Reactor Operation Delayed Until 2050
Case 2, LWR with fast reactors
Figure 212 The number of new reactors brought online in each year for each reactor type for the LWR
with fast reactors fuel cycle case with fast reactor operation delayed to 2050
Figure 213 Mass of fuel reprocessed in each year for each reactor type for the LWR with fast reactors fuel
cycle case with fast reactor operation delayed to 2050
0
1
2
3
4
5
6
7
2000 2050 2100 2150 2200
Ne
w R
eac
tors
Op
era
tin
g
Year
LWR
FR
Total
0
5
10
15
20
25
30
35
40
45
50
2000 2050 2100 2150 2200
Mas
s o
f Fu
el R
ep
roce
sse
d (
kt)
Year
LWR
FR
Total
LWR-Base
FR-Base
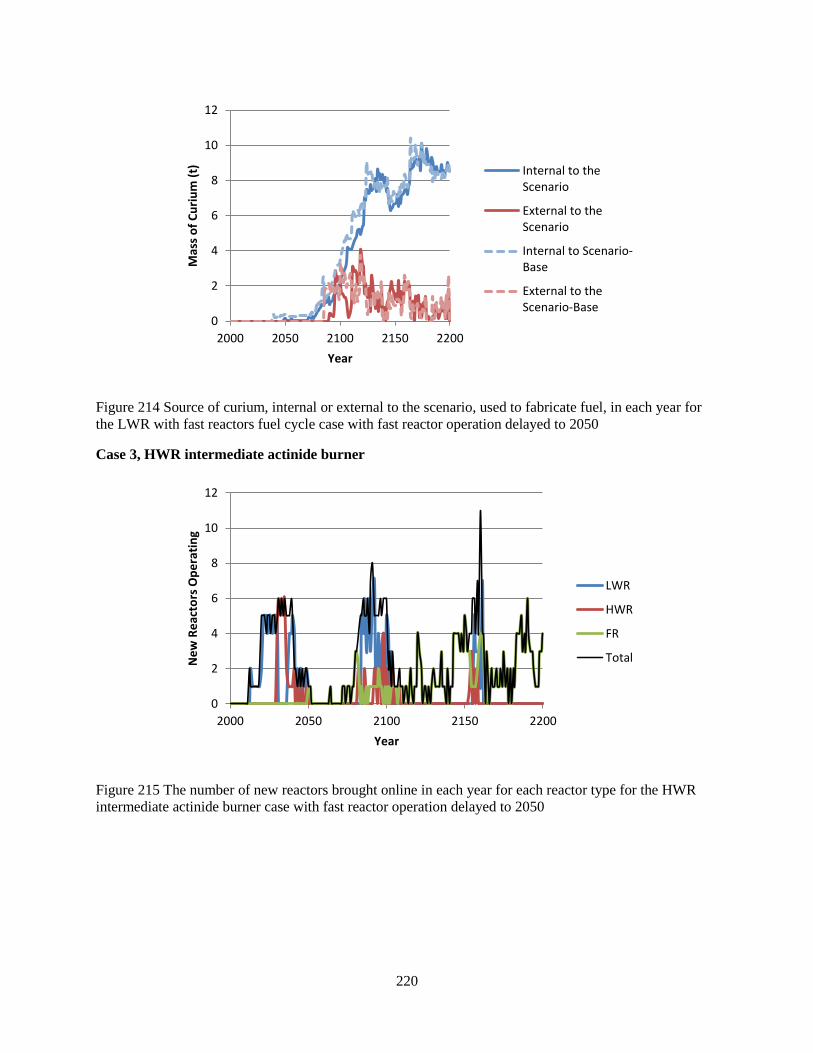
220
Figure 214 Source of curium, internal or external to the scenario, used to fabricate fuel, in each year for
the LWR with fast reactors fuel cycle case with fast reactor operation delayed to 2050
Case 3, HWR intermediate actinide burner
Figure 215 The number of new reactors brought online in each year for each reactor type for the HWR
intermediate actinide burner case with fast reactor operation delayed to 2050
0
2
4
6
8
10
12
2000 2050 2100 2150 2200
Mas
s o
f C
uri
um
(t)
Year
Internal to theScenario
External to theScenario
Internal to Scenario-Base
External to theScenario-Base
0
2
4
6
8
10
12
2000 2050 2100 2150 2200
Ne
w R
eac
tors
Op
era
tin
g
Year
LWR
HWR
FR
Total

221
Figure 216 Cumulative uranium ore consumption in each year for each reactor type for the HWR
intermediate actinide burner case with fast reactor operation delayed to 2050
Figure 217 Mass of fuel reprocessed in each year for each reactor type for the HWR intermediate actinide
burner case with fast reactor operation delayed to 2050
0
500
1000
1500
2000
2500
2000 2050 2100 2150 2200
Co
nsu
me
d U
Ore
(kt
Year
LWR
HWR
FR
Total
Total-Base
0
5
10
15
20
25
30
35
40
45
50
2000 2050 2100 2150 2200
Mas
s o
f Fu
el R
ep
roce
sse
d (
kt)
Year
LWR
HWR
FR
Total
LWR-Base
HWR-Base
FR-Base

222
Figure 218 Source of americium, internal or external to the scenario, used to fabricate fuel, in each year
for the HWR intermediate actinide burner case with fast reactor operation delayed to 2050
Case 4, HWR intermediate burner with LWR-derived fuel fast reactors
Figure 219 The number of new reactors brought online in each year for each reactor type for the HWR
intermediate burner with LWR-derived fuel fast reactors case, with fast reactor operation delayed to 2050
0
5
10
15
20
25
30
35
40
2000 2050 2100 2150 2200
Mas
s o
f A
me
rici
um
(t)
Year
Internal to theScenario
External to theScenario
Internal to theScenario-Base
External to theScenario-Base
0
2
4
6
8
10
12
14
2000 2050 2100 2150 2200
Ne
w R
eac
tors
Op
era
tin
g
Year
LWR
HWR
FR-HWR
FR-LWR
Total
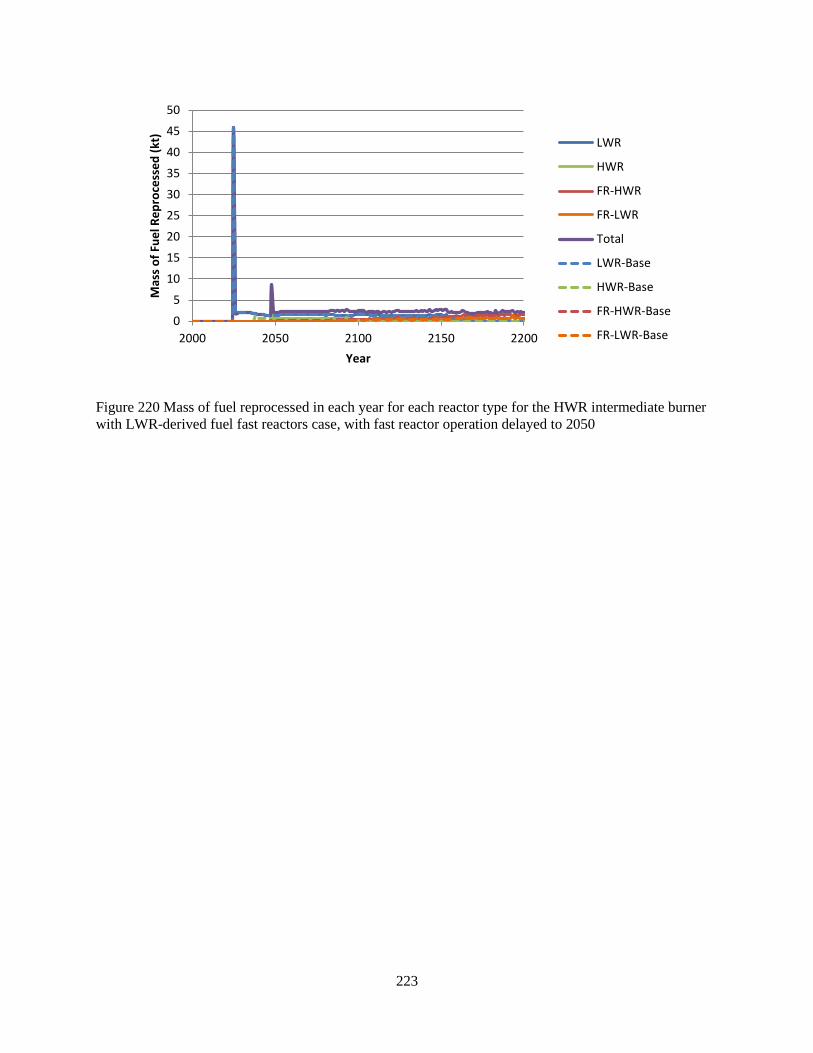
223
Figure 220 Mass of fuel reprocessed in each year for each reactor type for the HWR intermediate burner
with LWR-derived fuel fast reactors case, with fast reactor operation delayed to 2050
0
5
10
15
20
25
30
35
40
45
50
2000 2050 2100 2150 2200
Mas
s o
f Fu
el R
ep
roce
sse
d (
kt)
Year
LWR
HWR
FR-HWR
FR-LWR
Total
LWR-Base
HWR-Base
FR-HWR-Base
FR-LWR-Base
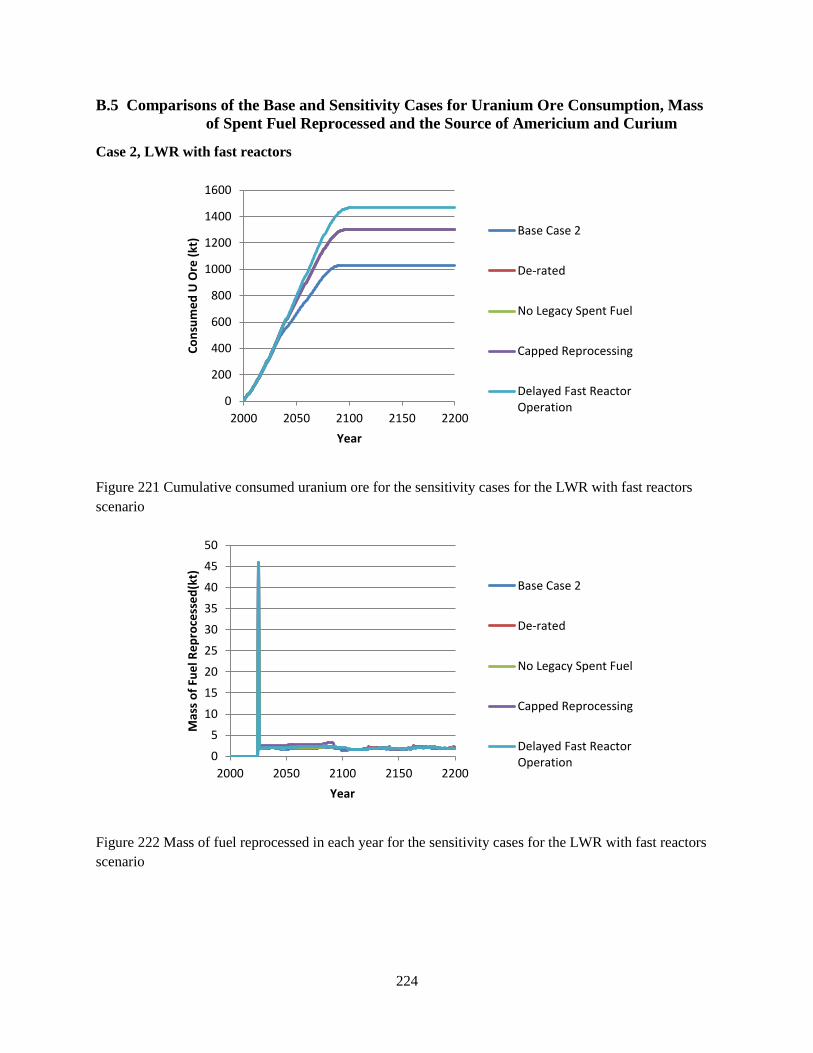
224
B.5 Comparisons of the Base and Sensitivity Cases for Uranium Ore Consumption, Mass
of Spent Fuel Reprocessed and the Source of Americium and Curium
Case 2, LWR with fast reactors
Figure 221 Cumulative consumed uranium ore for the sensitivity cases for the LWR with fast reactors
scenario
Figure 222 Mass of fuel reprocessed in each year for the sensitivity cases for the LWR with fast reactors
scenario
0
200
400
600
800
1000
1200
1400
1600
2000 2050 2100 2150 2200
Co
nsu
me
d U
Ore
(kt
)
Year
Base Case 2
De-rated
No Legacy Spent Fuel
Capped Reprocessing
Delayed Fast ReactorOperation
0
5
10
15
20
25
30
35
40
45
50
2000 2050 2100 2150 2200
Mas
s o
f Fu
el R
ep
roce
sse
d(k
t)
Year
Base Case 2
De-rated
No Legacy Spent Fuel
Capped Reprocessing
Delayed Fast ReactorOperation

225
Figure 223 Mass of fuel reprocessed in each year for the sensitivity cases for the LWR with fast reactors
scenario, with axis magnified
Figure 224 Source of americium, internal or external to the scenario, used to fabricate fuel, in each year
for the sensitivity cases for the LWR with fast reactors scenario
0
0.5
1
1.5
2
2.5
3
3.5
4
4.5
5
2000 2050 2100 2150 2200
Mas
s o
f Fu
el R
ep
roce
sse
d(k
t)
Year
Base Case 2
De-rated
No Legacy Spent Fuel
Capped Reprocessing
Delayed Fast ReactorOperation
0
5
10
15
20
25
30
35
2000 2050 2100 2150 2200
Tota
l Mas
s o
f A
me
rici
um
(t)
Year
Base Case 2
De-rated
No Legacy Spent Fuel
Capped Reprocessing
Delayed Fast ReactorOperation

226
Figure 225 Source of curium internal or external to the scenario, used to fabricate fuel, in each year for
the sensitivity cases for the LWR with fast reactors scenario
Case 3, HWR intermediate actinide burner
Figure 226 Cumulative consumed uranium ore for the sensitivity cases for the HWR intermediate burner
scenario
0
1
2
3
4
5
6
2000 2050 2100 2150 2200
Tota
l Mas
s o
f C
uri
um
(t)
Year
Base Case 2
De-rated
No Legacy Spent Fuel
Capped Reprocessing
Delayed Fast ReactorOperation
0
500
1000
1500
2000
2500
3000
2000 2050 2100 2150 2200
Co
nsu
me
d U
Ore
(kt
)
Year
Base Case 3
De-rated
No Legacy Spent Fuel
Capped Reprocessing
Delayed Fast ReactorOperation

227
Figure 227 Mass of fuel reprocessed in each year for the sensitivity cases for the HWR intermediate
burner scenario
Figure 228 Mass of fuel reprocessed in each year for the sensitivity cases for the HWR intermediate
burner scenario, with axis magnified
0
5
10
15
20
25
30
35
40
45
50
2000 2050 2100 2150 2200
Mas
s o
f Fu
el R
ep
roce
sse
d(k
t)
Year
Base Case 3
De-rated
No Legacy Spent Fuel
Capped Reprocessing
Delayed Fast ReactorOperation
0
1
2
3
4
5
6
7
8
9
10
2000 2050 2100 2150 2200
Mas
s o
f Fu
el R
ep
roce
sse
d(k
t)
Year
Base Case 3
De-rated
No Legacy Spent Fuel
Capped Reprocessing
Delayed Fast ReactorOperation
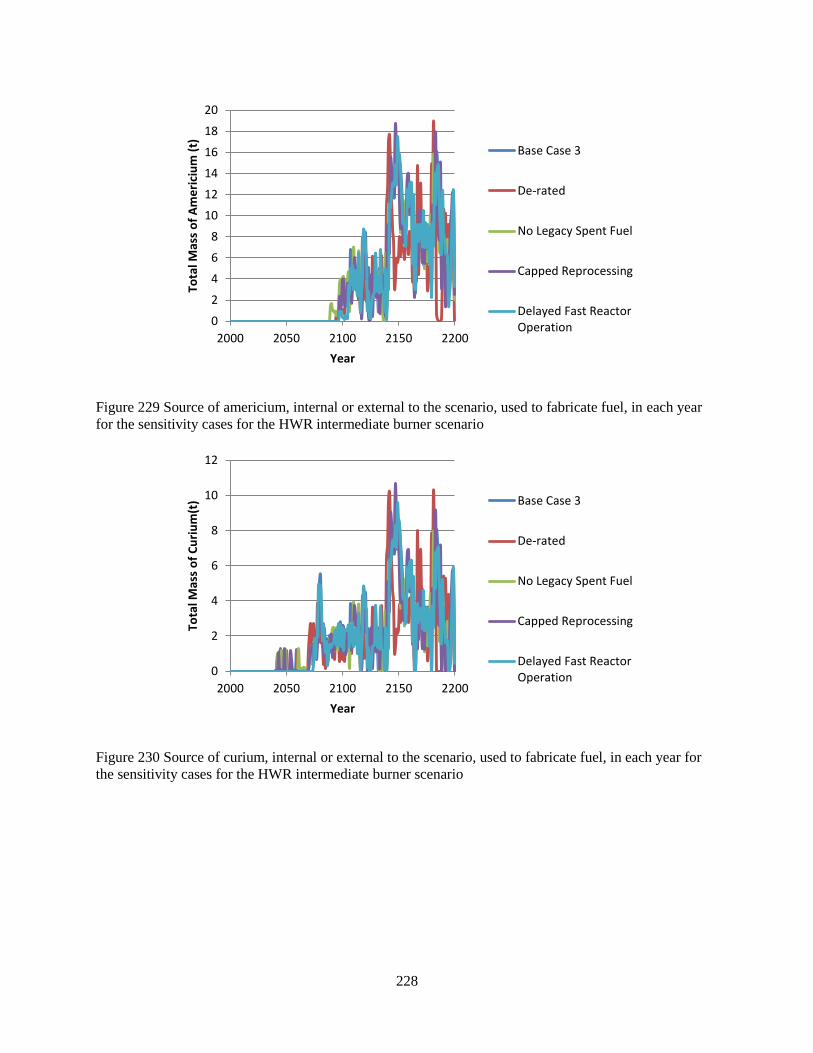
228
Figure 229 Source of americium, internal or external to the scenario, used to fabricate fuel, in each year
for the sensitivity cases for the HWR intermediate burner scenario
Figure 230 Source of curium, internal or external to the scenario, used to fabricate fuel, in each year for
the sensitivity cases for the HWR intermediate burner scenario
0
2
4
6
8
10
12
14
16
18
20
2000 2050 2100 2150 2200
Tota
l Mas
s o
f A
me
rici
um
(t)
Year
Base Case 3
De-rated
No Legacy Spent Fuel
Capped Reprocessing
Delayed Fast ReactorOperation
0
2
4
6
8
10
12
2000 2050 2100 2150 2200
Tota
l Mas
s o
f C
uri
um
(t)
Year
Base Case 3
De-rated
No Legacy Spent Fuel
Capped Reprocessing
Delayed Fast ReactorOperation

229
Case 4, HWR intermediate burner with LWR-derived fuel fast reactors
Figure 231 Cumulative consumed uranium ore for the sensitivity cases for the HWR intermediate burner
with LWR-derived fuel fast reactors scenario
Figure 232 Mass of fuel reprocessed in each year for the sensitivity cases for the HWR intermediate
burner with LWR-derived fuel fast reactors scenario
0
500
1000
1500
2000
2500
2000 2050 2100 2150 2200
Co
nsu
me
d U
Ore
(kt
)
Year
Base Case 4
De-rated
No Legacy Spent Fuel
Capped Reprocessing
Delayed Fast ReactorOperation
0
5
10
15
20
25
30
35
40
45
50
2000 2050 2100 2150 2200
Mas
s o
f Fu
el R
ep
roce
sse
d(k
t)
Year
Base Case 4
De-rated
No Legacy Spent Fuel
Capped Reprocessing
Delayed Fast ReactorOperation
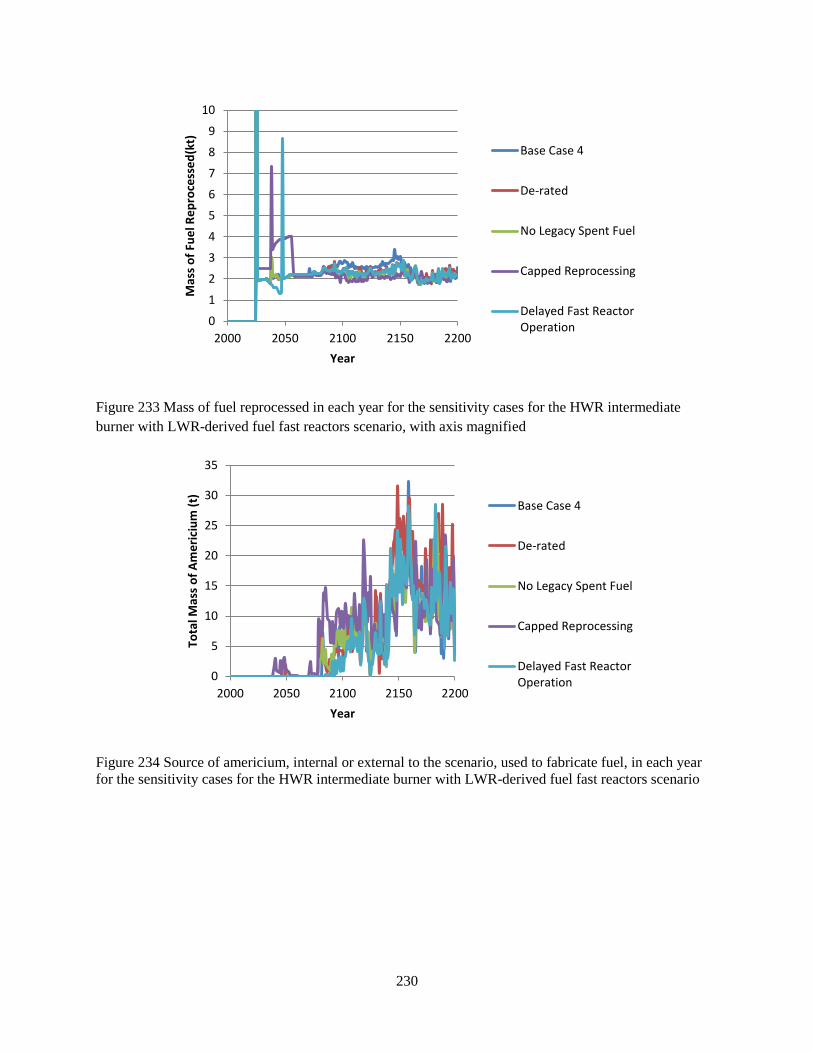
230
Figure 233 Mass of fuel reprocessed in each year for the sensitivity cases for the HWR intermediate
burner with LWR-derived fuel fast reactors scenario, with axis magnified
Figure 234 Source of americium, internal or external to the scenario, used to fabricate fuel, in each year
for the sensitivity cases for the HWR intermediate burner with LWR-derived fuel fast reactors scenario
0
1
2
3
4
5
6
7
8
9
10
2000 2050 2100 2150 2200
Mas
s o
f Fu
el R
ep
roce
sse
d(k
t)
Year
Base Case 4
De-rated
No Legacy Spent Fuel
Capped Reprocessing
Delayed Fast ReactorOperation
0
5
10
15
20
25
30
35
2000 2050 2100 2150 2200
Tota
l Mas
s o
f A
me
rici
um
(t)
Year
Base Case 4
De-rated
No Legacy Spent Fuel
Capped Reprocessing
Delayed Fast ReactorOperation
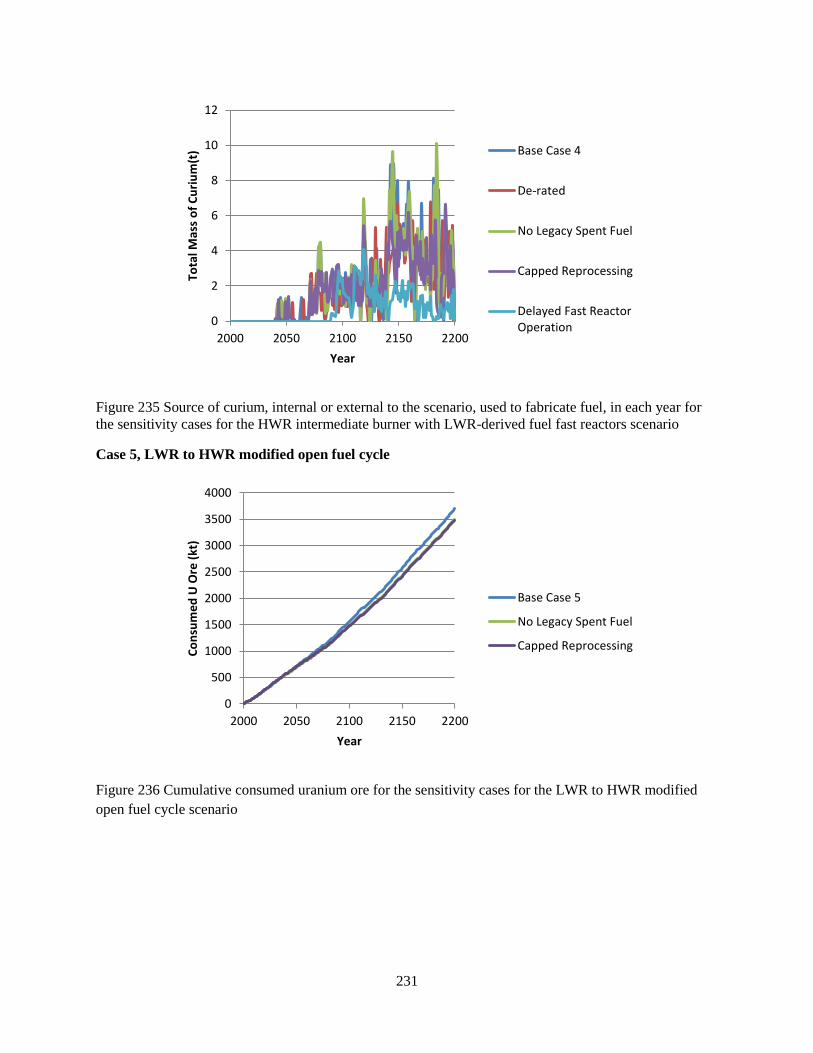
231
Figure 235 Source of curium, internal or external to the scenario, used to fabricate fuel, in each year for
the sensitivity cases for the HWR intermediate burner with LWR-derived fuel fast reactors scenario
Case 5, LWR to HWR modified open fuel cycle
Figure 236 Cumulative consumed uranium ore for the sensitivity cases for the LWR to HWR modified
open fuel cycle scenario
0
2
4
6
8
10
12
2000 2050 2100 2150 2200
Tota
l Mas
s o
f C
uri
um
(t)
Year
Base Case 4
De-rated
No Legacy Spent Fuel
Capped Reprocessing
Delayed Fast ReactorOperation
0
500
1000
1500
2000
2500
3000
3500
4000
2000 2050 2100 2150 2200
Co
nsu
me
d U
Ore
(kt
)
Year
Base Case 5
No Legacy Spent Fuel
Capped Reprocessing

232
Figure 237 Mass of spent fuel reprocessed in each year for the sensitivity cases for the LWR to HWR
modified open fuel cycle scenario
Figure 238 Mass of spent fuel reprocessed in each year for the sensitivity cases for the LWR to HWR
modified open fuel cycle scenario, with axis magnified
0
5
10
15
20
25
30
35
40
45
50
2000 2050 2100 2150 2200
Mas
s o
f Fu
el R
ep
roce
sse
d(k
t)
Year
Base Case 5
No Legacy Spent Fuel
Capped Reprocessing
0
0.5
1
1.5
2
2.5
3
3.5
4
4.5
5
2000 2050 2100 2150 2200
Mas
s o
f Fu
el R
ep
roce
sse
d(k
t)
Year
Base Case 5
No Legacy Spent Fuel
Capped Reprocessing

233
Figure 239 Source of americium, internal or external to the scenario, used to fabricate fuel, in each year
for the sensitivity cases for the LWR to HWR modified open fuel cycle scenario
0
0.5
1
1.5
2
2.5
2000 2050 2100 2150 2200
Tota
l Mas
s o
f A
me
rici
um
(t)
Year
Base Case 5
No Legacy Spent Fuel
Capped Reprocessing