Transmission Planning Technical Guide Appendix E · PDF fileTransmission Planning Technical...
12
Transmission Planning Technical Guide Appendix E Dynamic Stability Simulation Voltage Sag Guideline © ISO New England Inc. System Planning December 6, 2013
Transcript of Transmission Planning Technical Guide Appendix E · PDF fileTransmission Planning Technical...

Transmission Planning Technical Guide
Appendix E
Dynamic Stability Simulation
Voltage Sag Guideline
© ISO New England Inc. System Planning December 6, 2013

Table of Content
VOLTAGE SAG PARAMETERS ........................................................................................................................................ 1
VOLTAGE SAG INTRODUCTION .................................................................................................................................... 2
THE CAUSE OF VOLTAGE SAGS .................................................................................................................................... 2
VOLTAGE SAG EFFECTS .................................................................................................................................................. 3
POWER QUALITY ................................................................................................................................................................. 3
LOSS OF LOAD ..................................................................................................................................................................... 3
EMERGENCY AND STANDBY POWER .................................................................................................................................... 4
MODELING LIMITATIONS ..................................................................................................................................................... 4
VOLTAGE SAG MITIGATION OPTIONS ....................................................................................................................... 4
APPLICABLE STANDARDS ............................................................................................................................................ 5
RECOMMENDATION ......................................................................................................................................................... 5
APPENDIX A ......................................................................................................................................................................... 6
THE CBEMA AND ITIC CURVES [REFERENCE 3] ..................................................................................................... 6
FIGURE 2 – CBEMA CURVE ................................................................................................................................................ 6
FIGURE 3 – ITIC CURVE ...................................................................................................................................................... 6
COMPOSITE CURVE [REFERENCE 10] (IEEE P1564_99_01.DOC) ........................................................................... 7
FIGURE 4 – COMPOSITE CURVE FROM IEEE P1564 ............................................................................................................. 7
EVOLUTION OF POWER ACCEPTABILITY CURVES ................................................................................................ 8
TABLE 1 – LISTING OF ALTERNATIVE POWER ACCEPTABILITY CURVES FROM [3] ............................................................... 8
SYSTEM VOLTAGE SAG SIMULATIONS ...................................................................................................................... 9
FIGURE 5 – SIMULATED 115 KV VOLTAGE SAG OF SECTION 392 ......................................................................................... 9
REFERENCES ..................................................................................................................................................................... 10

Appendix E-Voltage Sag Guideline
1
VOLTAGE SAG PARAMETERS
The minimum post-fault positive sequence voltage sag must remain above 70% of nominal voltage and
must not exceed 250 milliseconds below 80% of nominal voltage within 10 seconds following a fault.
These limits are supported by the typical sag tolerances shown in Figures C.5 to C.10 in IEEE Standard
1346-1998.
100
90
80
0
Maximum duration
of 3-Ph (positive sequence)
sag below 80%
Minimum
post-fault sag
Fault sag
Post Transient
Voltage
10 s
70
%
No
min
al V
olta
ge
Time
Figure 1– Transient Voltage Sag Parameters

Appendix E-Voltage Sag Guideline
2
Voltage Sag Introduction
The intent of this guideline is to avoid uncontrolled significant load shedding that may lead to
unintended system performance, such as widespread system collapse. This guide is not intended
as a standard of utility supply to individual customers, as a standard of power quality, nor used
for transmission or distribution protection design.
The voltage sag resulting from a system short circuit or fault depends on the location of the fault
in relation to the measured voltage, and may vary from zero to a few percent of normal. The
duration of the sag is determined by the fault clearing time and ranges from as low as 3 cycles on
345kV systems to one or more seconds on 34.5 kV sub-transmission systems. Following the fault
clearing, the voltage passes through a transient recovery period before settling to the post-fault
value. During this oscillatory transient period, additional voltage dips typically occur
immediately after the voltage attempts to return to the pre-fault level. The starting voltage, sag,
and duration of these post-fault transient under-voltages are a measure of the system strength.
The performance indicators for prompt restoration of voltage are the object of this guide.
This guide:
provides background information on the cause and effects of voltage sags associated
with transmission faults
discusses relevant IEEE Recommended Practices and Guides and technical papers
which discuss voltage sags and their effect on transmission system performance or
utilization equipment
(IEEE has developed Recommended Practices to guide equipment manufacturers and
customers regarding end-use equipment sensitivity to voltage transients and the
application of power-conditioning equipment. Note that there are no utility
transmission design or operating voltage sag standards.)
defines guideline criteria for the post-fault sag magnitude and duration.
This Voltage Sag Guideline applies only to the transmission system and therefore cannot be
assumed to represent the voltage at the points of utilization. The voltage sag during the fault is
not covered by this guide.
The Cause of Voltage Sags
During the fault period, the active power transferred from the generators to the system is
reduced, causing the generators’ internal angles to advance. When the fault is cleared, the
generators have to supply the pre-fault active load again and their internal angle moves toward to
their pre-fault value. This slowing of the local generators draws inrush decelerating power from
the remote generators and, coupled with motors’ demand for accelerating power (the motors
have slowed down during the lower fault voltage), causes a new voltage sag on the system. This
second sag is then followed by an oscillatory transition to the post-fault steady-state voltage, as
the machine prime mover power is again in balance with the electric load.
Appendix E-Voltage Sag Guideline
3
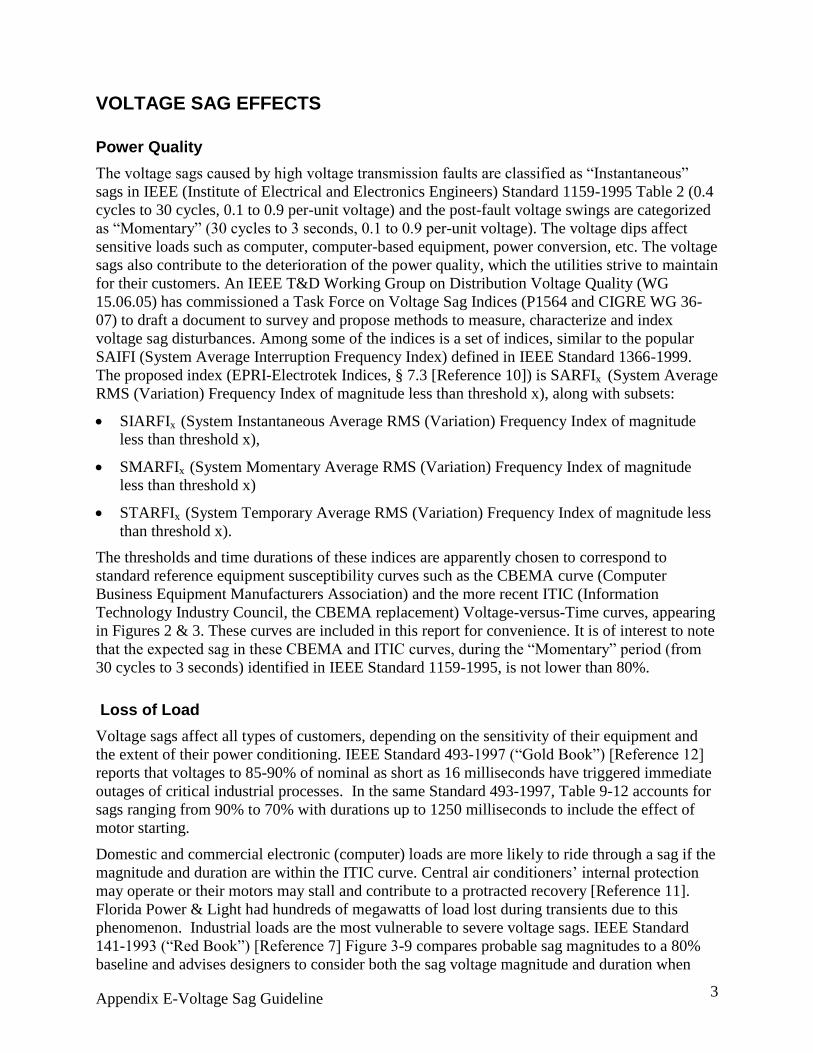
VOLTAGE SAG EFFECTS
Power Quality
The voltage sags caused by high voltage transmission faults are classified as “Instantaneous”
sags in IEEE (Institute of Electrical and Electronics Engineers) Standard 1159-1995 Table 2 (0.4
cycles to 30 cycles, 0.1 to 0.9 per-unit voltage) and the post-fault voltage swings are categorized
as “Momentary” (30 cycles to 3 seconds, 0.1 to 0.9 per-unit voltage). The voltage dips affect
sensitive loads such as computer, computer-based equipment, power conversion, etc. The voltage
sags also contribute to the deterioration of the power quality, which the utilities strive to maintain
for their customers. An IEEE T&D Working Group on Distribution Voltage Quality (WG
15.06.05) has commissioned a Task Force on Voltage Sag Indices (P1564 and CIGRE WG 36-
07) to draft a document to survey and propose methods to measure, characterize and index
voltage sag disturbances. Among some of the indices is a set of indices, similar to the popular
SAIFI (System Average Interruption Frequency Index) defined in IEEE Standard 1366-1999.
The proposed index (EPRI-Electrotek Indices, § 7.3 [Reference 10]) is SARFIx (System Average
RMS (Variation) Frequency Index of magnitude less than threshold x), along with subsets:
SIARFIx (System Instantaneous Average RMS (Variation) Frequency Index of magnitude
less than threshold x),
SMARFIx (System Momentary Average RMS (Variation) Frequency Index of magnitude
less than threshold x)
STARFIx (System Temporary Average RMS (Variation) Frequency Index of magnitude less
than threshold x).
The thresholds and time durations of these indices are apparently chosen to correspond to
standard reference equipment susceptibility curves such as the CBEMA curve (Computer
Business Equipment Manufacturers Association) and the more recent ITIC (Information
Technology Industry Council, the CBEMA replacement) Voltage-versus-Time curves, appearing
in Figures 2 & 3. These curves are included in this report for convenience. It is of interest to note
that the expected sag in these CBEMA and ITIC curves, during the “Momentary” period (from
30 cycles to 3 seconds) identified in IEEE Standard 1159-1995, is not lower than 80%.
Loss of Load
Voltage sags affect all types of customers, depending on the sensitivity of their equipment and
the extent of their power conditioning. IEEE Standard 493-1997 (“Gold Book”) [Reference 12]
reports that voltages to 85-90% of nominal as short as 16 milliseconds have triggered immediate
outages of critical industrial processes. In the same Standard 493-1997, Table 9-12 accounts for
sags ranging from 90% to 70% with durations up to 1250 milliseconds to include the effect of
motor starting.
Domestic and commercial electronic (computer) loads are more likely to ride through a sag if the
magnitude and duration are within the ITIC curve. Central air conditioners’ internal protection
may operate or their motors may stall and contribute to a protracted recovery [Reference 11].
Florida Power & Light had hundreds of megawatts of load lost during transients due to this
phenomenon. Industrial loads are the most vulnerable to severe voltage sags. IEEE Standard
141-1993 (“Red Book”) [Reference 7] Figure 3-9 compares probable sag magnitudes to a 80%
baseline and advises designers to consider both the sag voltage magnitude and duration when
Appendix E-Voltage Sag Guideline
4
specifying equipment performance capability during voltage sags. If a motor control contactor is
unable to ride through a voltage sag, the motor and associated process is interrupted.
Emergency and Standby Power
The Western Electricity Systems Coordinating Council’s (WECC), formally the Western
Systems Coordinating Council (WSCC), voltage sag criteria are based in part on a need to
maintain a margin for nuclear unit auxiliary undervoltage protection and load transfer
[Reference 1. A more general application is found in the setting guidelines of load-transfer
devices in IEEE Standard 446-1987 (“Orange Book”) [Reference 9]. In Section 4.3.6 of this
Standard, typical transfer threshold settings of 75% to 95% of pickup are given, with pickup
settings raging from 85% to 98% of nominal. Time delays are on the order of 1 second. This
means that voltages below 80% ( the limit suggested on the ITIC curve) are likely to initiate
automatic load transfers.
Modeling Limitations
In order to determine if a voltage disturbance for a system transmission fault falls below a level
and duration set in transient voltage criteria, the power system model should represent the
dynamic response of load as accurately as possible. Steady state and dynamic power studies in
New England have relied on static load models (constant admittance and current). An analysis
done by Florida Power & Light [Reference 11] shows that the voltage recovery is worse for a
simulation with a mix of static and motor models [Reference 10, Figure 4], than with the static
load model only. This was confirmed in a feasibility study conducted by American
Superconductor for CMP in September 2000: the post-fault voltage sag was about 0.08 per-unit
lower when the industrial, commercial and residential load models were modified to include
80%, 60% and 40%, respectively, of high and low inertia motor load.
Voltage Sag Mitigation Options
Voltage sags in power systems are unavoidable. The system can be designed and operated to
minimize severe voltage sags. High speed fault clearing, special protection systems, field
forcing, transmission reinforcements, and transmission interface transfer limits can be considered
by generation and transmission owners as options to improve voltage sag performance.
Customers can apply power-conditioning technologies such as Uninterruptible Power Supplies
(UPS), and Distributed-Superconducting Magnetic Energy Storage System (D-SMES) to
sensitive loads. IEEE Standard 1346-1998 [Reference 13] lists voltage sags as the greatest
financial risk due to lack of compatibility of electric supply systems with electronic process
equipment, and offers a method to evaluate the financial impact of incompatibility as well
suggestions of financial analysis of alternatives to improve compatibility.

Appendix E-Voltage Sag Guideline
5
APPLICABLE STANDARDS
IEEE Std 1159-1995 “IEEE Recommended Practice for Monitoring Electric Power Quality”
IEEE Std 1250-1995 “Guide for Service to Equipment Sensitive to Momentary Voltage
Disturbances”
IEEE Std 141-1993 “IEEE Recommended Practice for Electric Power Distribution for Industrial
Plants” (“Red Book”)
IEEE Std 493-1997 “IEEE Recommended Practice for the Design of Reliable Industrial and
Commercial Power Systems” (“Gold Book”)
IEEE Std 1346-1998 “IEEE Recommended Practice for Evaluating Electric Power System
Compatibility with Electronic Process Equipment”
P1564, Task Force on Voltage Sag Indices (proposed standard, in progress)
RECOMMENDATION
The IEEE standards leave the sag and duration up to the specific user and application (Section
9.7 in IEEE Standard 493-1997 [Reference 12] states that “utilization equipment response to sags
must be known from manufacturer specifications or from performance test data. Both supply
characteristics and equipment response data sets are required…”). In this context, Planning and
Operating Engineers are faced with judging between the probability of undesirable load loss and
the imposition of stricter design criteria and operating limits. Based on the references, the
industry has accepted 80% as a typical sag magnitude for momentary voltage sags at the point of
utilization. It should be noted that the IEEE remains divided on the adoption of standard sag
limits for application to utility transmission or distribution systems, and no IEEE standards for
this exist today.

Appendix E-Voltage Sag Guideline
6
APPENDIX A
THE CBEMA and ITIC CURVES [Reference 3]
The well known CBEMA and ITIC power acceptability curves are not the direct objective of this
voltage sag guideline and were not developed as a guide for utility supply. Rather, these curves
were intended to be used as a guide for equipment manufacturers and utility customers in making
decisions for power conditioning equipment for sensitive loads. The curves are reproduced here
for reference and comparison to this voltage sag guide only.
Note that the voltage scale shows percent deviation from pre-sag operating voltage, not percent
of nominal voltage.
0.0001 0.001 0.01 0.1 1 10 100 1000
-100
-50
0
50
100
150
200
250
TIME IN SECONDS
PE
RC
EN
T C
HA
NG
E I
N B
US
VO
LTA
GE
8.33
ms
OVERVOLTAGE CONDITIONS
UNDERVOLTAGE CONDITIONS
0.5
CY
CL
E
RATED
VOLTAGE
ACCEPTABLE
POWER
Figure 2 – CBEMA Curve
0.0001 0.001 0.01 0.1 1 10 100 1000
-100
-50
0
50
100
150
200
250
TIME IN SECONDS
PER
CEN
T C
HAN
GE
IN B
US
VOLT
AGE
8.33
ms
OVERVOLTAGE CONDITIONS
UNDERVOLTAGE CONDITIONS
0.5
CYC
LE
RATED
VOLTAGE
ACCEPTABLE
POWER
10%+--
Figure 3 – ITIC Curve

Appendix E-Voltage Sag Guideline
7
Composite Curve [Reference 10] (IEEE P1564_99_01.doc)
This curve was reproduced from a draft document posted on the IEEE P1564 Working Group
site, and may be adopted into the proposed Standard for classifying voltage sags.
This curve applies to equipment at the point of utilization.
Figure 4 – Composite Curve From IEEE P1564
5 00 %
2 00 %
S A R F I (E U E )
1 40 %
1 20 %
1 10 %
1 00 %
1 m s 3 m s 0 .5 ~ 2 0 m s 0 .5 se c 3 s e c 1 0 s e c 6 0 se c
9 0%
8 0%
7 0%
5 0%
1 0%
0 %
0 0 .5 ~ 2 0 m s 30 ~ 3 s e c 1 m in
V o l ta g e M a g n i tu d e v s . E v e n t D u ra t io n
N o In s ta n ta n e o u s
I n te rr u p ti o n s
1 0 % is 1 1 5 9
T h r e sh o ld L e v e l fo r
In te r r u p tio n s
1 1 5 9 M o m e n ta r y
In te r ru p tio n s
(E U E S M A R F I)
1 1 5 9 T e m p o r a r y
In te r ru p ti o n s
( E U E S TA R FI )
In s ta n ta n e o u s
S a g s /S w e ll s (S IA R F I)
M o m e n ta r y
S a g s /S w e l ls
( S M A R FI )
Te m p o ra r y
S a g s/S w e ll s ( S T A R F I)
T r a ns ien ts
1 µ s
1 6 0 µ s * A g r a p h i ca l c o m b in a t io n fr o m t h e fo ll o w in g re s o u r ce d o c u m e n t s:
ITIC : In fo r m a tio n Te c h n o lo g y In d u st ry C o u n c il (w a s C B E M A ) 1 9 9 6 V o lta g e Q u a l ity G u id e l in e s ;
IE E E 1 1 5 9 - 1 9 9 5 "C a te g o r ie s" T a b le fo r P o w e r S y ste m E M P h e n o m e n a ;
"E U E " i s a n a b b re v ia tio n f o r a p a p e r p re s e n te d a t th e IE E E P E S S u m m e r M e e tin g i n B e rl in , G e r m a n y,
t it l e d In d i ce s fo r A s se ss in g U ti li ty D i st ri b u tio n S y ste m R M S V a ri a tio n P e r fo r m a n ce . A u th o r s w e r e
Du g a n -E le c tr o te k, W a c la w ia k - U n ite d I llu m in a ti n g C o ., a n d S u n d a r a m o f E P RI.
5 0 % is ty p ic a l m o to r
co n ta cto r b r e a k p o in t.

Appendix E-Voltage Sag Guideline
8
Evolution of Power Acceptability Curves
The following table lists the chronology of significant power acceptability curves. According to
[Reference 3] the CBEMA curve was redesigned in 1996 and renamed for its supporting
organization.
Curve Year Application Source
FIPS Power
Acceptability Curve1978
Automatic Data
Processing EquipmentU.S. Federal Government
CBEMA Curve 1978Computer Business
Equipment
Computer Business
Equipment Manufacturers
Association
ITIC Curve 1996Information Technology
Equipment
Information Technology
Industry Council
Failure Rate Curves
for Industrial Loads1972 Industrial Loads IEEE Standard 493
AC Line Voltage
Tolerences1974 Mainframe Computers IEEE Standard 446
IEEE Emerald Book 1992Sensitive Electronic
EquipmentIEEE Standard 1100
Table 1 – Listing of Alternative Power Acceptability Curves from [3]
Appendix E-Voltage Sag Guideline
9
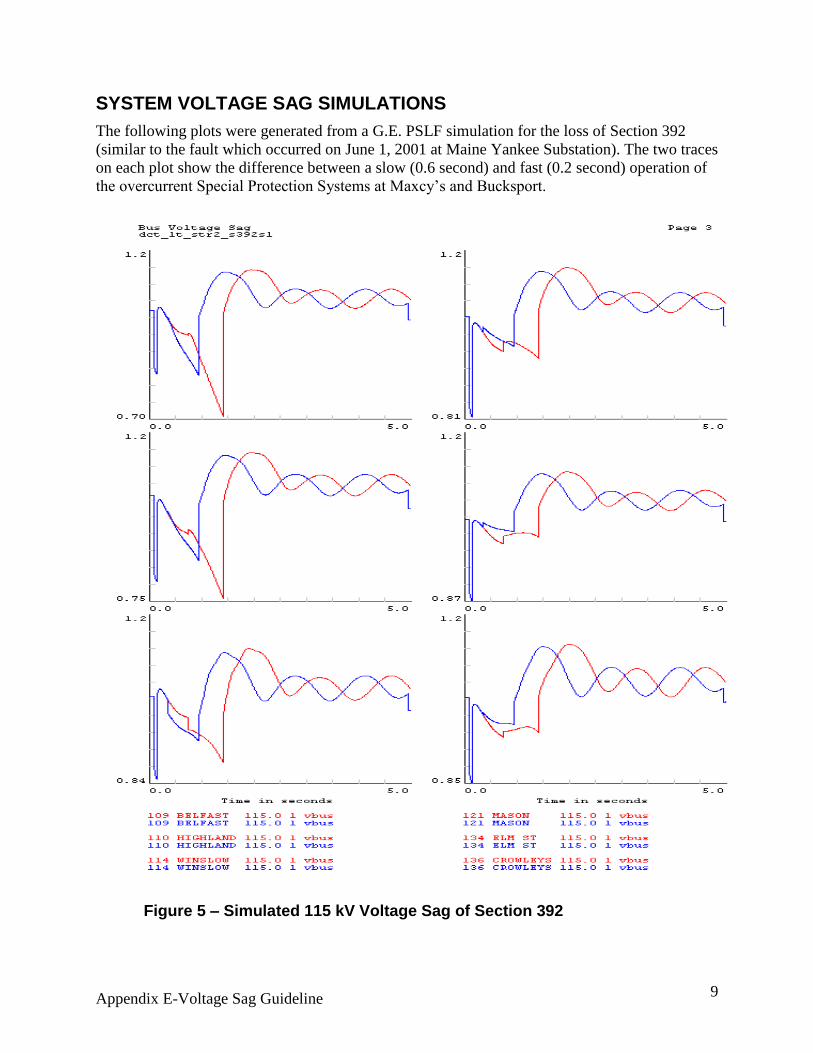
SYSTEM VOLTAGE SAG SIMULATIONS
The following plots were generated from a G.E. PSLF simulation for the loss of Section 392
(similar to the fault which occurred on June 1, 2001 at Maine Yankee Substation). The two traces
on each plot show the difference between a slow (0.6 second) and fast (0.2 second) operation of
the overcurrent Special Protection Systems at Maxcy’s and Bucksport.
Figure 5 – Simulated 115 kV Voltage Sag of Section 392

Appendix E-Voltage Sag Guideline
10
REFERENCES
1-Western Systems Coordinating Council “Supporting Document For Reliability Criteria For
Transmission System Planning” – August 1994.
2- Daniel Sabin, Electrotek “Indices Used to Assess RMS Voltage Variations”- July 2000.
3-R.S.Thallam & G.T.Heydt “Power Acceptability and Voltage Sag Indices in the Three Phase
Sense”.
4- Daniel Sabin, T.E Grebe & A.Sundaram “RMS Voltage Variation Statistical Analysis for a
Survey of Distribution System Power Quality Performance”.
5-IEEE Std 1159-1995 “IEEE Recommended Practice for Monitoring Electric Power Quality”.
6-IEEE Std 1250-1995 “IEEE Guide for Service to Equipment Sensitive to Momentary Voltage
Disturbances”.
7-IEEE Std 141-1993 “IEEE Recommended Practice for Electric Power Distribution for
Industrial Plants” (IEEE Red Book).
8-IEEE Std 242-1986 “IEEE Recommended Practice for Protection and Coordination of
Industrial and Commercial Power Systems” (IEEE Buff Book).
9-IEEE Std 446-1987 “IEEE Recommended Practice for Emergency and Standby Power
Systems for Industrial and Commercial Applications” (IEEE Orange Book).
10-IEEE P1564 Task Force on Voltage Sag Indices (Working Group on Distribution Voltage
Quality) “Voltage Sag Indices-Draft 1.2” – December 2000.
11- John W. Shaffer “Air Conditioner Response to Transmission Faults” – IEEE Transactions
on Power Systems – May 1997.
12-IEEE Std 493-1997 “IEEE Recommended Practice for the Design of Reliable Industrial and
Commercial Power Systems” (IEEE Gold Book).
13-IEEE Std 1346-1998 “IEEE Recommended Practice for Evaluating Electric Power System
Compatibility with Electronic Process Equipment”.