TRANSMISSION FINANCING
25
DECEMBER 16, 2004 Carnegie Mellon University- Electricity Transmission Conference TRANSMISSION FINANCING STRICTLY PRIVATE AND CONFIDENTIAL Presented by Gary Krellenstein JPMorgan Public Power Group (212) 270-7828
Transcript of TRANSMISSION FINANCING
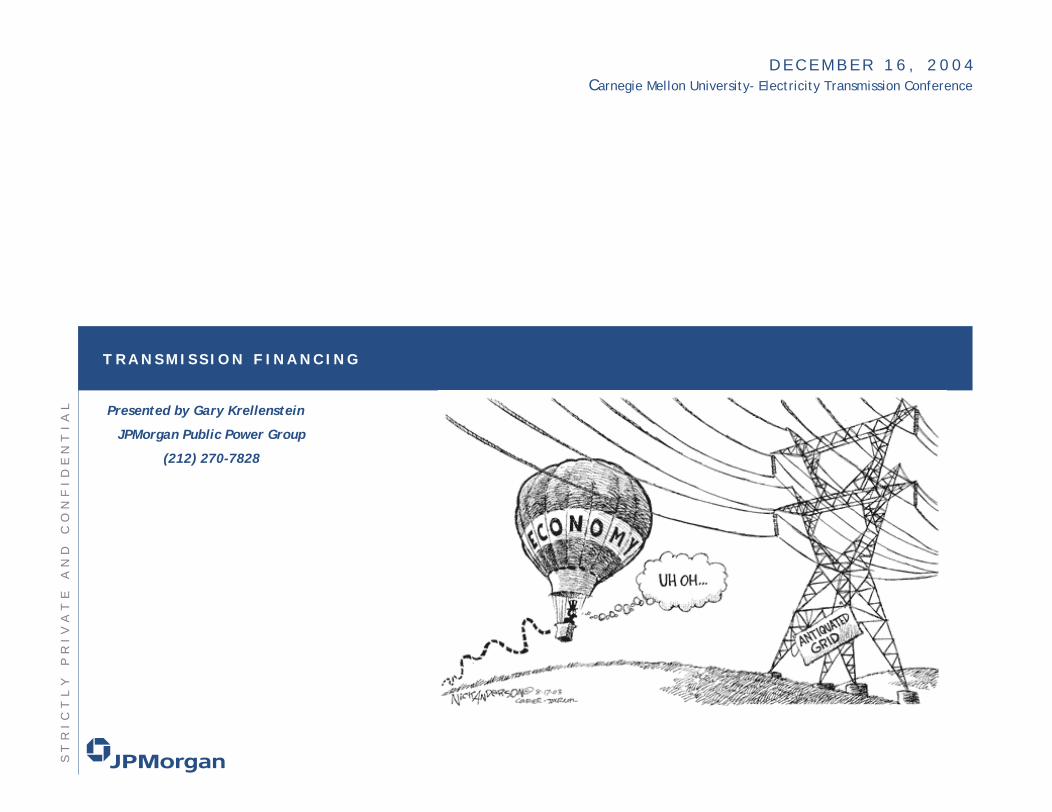
D E C E M B E R 1 6 , 2 0 0 4Carnegie Mellon University- Electricity Transmission Conference
T R A N S M I S S I O N F I N A N C I N G
ST
RI
CT
LY
PR
IV
AT
EA
ND
CO
NF
ID
EN
TI
AL Presented by Gary Krellenstein
JPMorgan Public Power Group
(212) 270-7828

Agenda
Page
cmu v5 refresh
Overview of US Investment in Transmission 1
Current Environment and Problems 6
“Project” versus “System” Financing 11
Investor Considerations 16
Conclusion 23
TR
AN
SM
IS
SI
ON
FI
NA
NC
IN
G
1

Current breakdown of transmission line ownership1
Transmission represents about 10% of total utility assets (est. $80 billion)2
70% are owned by vertically-integrated utilities
WO
FU
SI
NV
ES
TM
EN
TI
NT
RA
NS
MI
SS
IO
NO
VE
RV
IE
1- “Fortifying the Nation’s Transmission Grid”; Moody’s Investor Service, Dec 2004,
2- “Grid 2030 - A National Vision”; DOE, July 20032

US transmission investment has declined over the past 30 years…
Overbuilding of HV lines in the 1970s explains part of the decline
FU
SI
NV
ES
TM
EN
TI
NT
RA
NS
MI
SS
IO
N
Annual Transmission investments by Investor-Owned Utilities – 1975 through 2003
OV
ER
VI
EW
O
Source: “US Transmission Capacity: Present Status and Future Prospects”Eric Hirst for EEI/DOE, June 2004 3

…but growth in demand and congestion may require $50 billion* in new investments by 2030
Transmission Assets$32 billion Generator Hook-up
Costs$9 billion
IncrementalTransmission Investments$12 billion
Generator Hook -Up
Costs$9 billion
Maintenance of Existing
Transmission Assets
$32 billion
Incremental Transmission
Investments$12 billion
OV
ER
VI
EW
OF
US
IN
VE
ST
ME
NT
IN
TR
AN
SM
IS
SI
ON
Use of new technologies to replace existing lines (e.g., 3M’s composite conductor) could significantly change this estimate
*Source: ICF Study for KKR, Public Utilities Fortnightly article, October 2004
4

Cumulative new line builds by investment year
0
10000
20000
30000
40000
50000
60000
70000
2004-2007 2008-2011 2012-2017 2018-2025 2028-2030
Cum
ulat
ive
MW
of T
rans
mis
sion
Bui
lt
0
2
4
6
8
10
12
14
Cum
ulat
ive
Inve
stm
ent (
Bill
ions
of 2
003$
)
MW BuiltBillions Invested
OV
ER
VI
EW
OF
US
IN
VE
ST
ME
NT
IN
TR
AN
SM
IS
SI
ON
5

Agenda
Page
cmu v5 refresh
Overview of US Investment in Transmission 1
Current Environment and Problems 6
“Project” versus “System” Financing 11
Investor Considerations 16
Conclusion 23
TR
AN
SM
IS
SI
ON
FI
NA
NC
IN
G
6

Transmission Financing: The “Old” Environment
Owned and financed by utilities
Utilities pledged system’s net revenues and assets as security for monies borrowed
Transmission investments and O&M costs were recovered through the retail price of electricity
Investors were willing to accept relatively low returns because of minimal risks
Blackouts provided indirect “feedback” loop spurring regulators and utilities to invest more in transmissionA
ND
PR
OB
LE
MS
CU
RR
EN
TE
NV
IR
ON
ME
NT
7

The “New” Environment
Transmission is becoming “unbundled”
67% of US load now served by RTOs/ISOs
Utilities’ ability and willingness to finance and own transmission projects is decreasing
Complex cost recovery with a portion based on “locational marginal pricing”
LMP falls with expanded capacity – no incentive to build
“Feedback loop” caused by blackouts is short-circuited
CU
RR
EN
TE
NV
IR
ON
ME
NT
AN
DP
RO
BL
EM
S
8

The Problems
Reduced incentive to invest in transmission in a “quasi-deregulated/unbundled” market
Uncertainty about cost recovery and pricing mechanisms
Uncertainty about future ownership and control
Intervention by suppliers that benefit from transmission “bottlenecks”
Siting issues, litigation, and adverse public reaction to new lines
Upside potential for investors still limited by regulators
Potential conflicts of interest in financing transmission lines that enhance competition
CU
RR
EN
TE
NV
IR
ON
ME
NT
AN
DP
RO
BL
EM
S
9

Conflicts of interest
Transmission manager shouldn’t own generation
IOUs may have a fiduciary responsibility to shareholders not to invest in new transmission lines if they have high rates in a transmission constrained service area
Example: Stockholder in an IOU with coal generation in a constrained service area that’s getting gas-based power prices 30 – 50% of the time -- doesn’t want new transmission lines that enhance competition
Public power (municipal, coops and federal utilities) does not share this problem since their goal is to maximize benefits to their customers – not shareholders
CU
RR
EN
TE
NV
IR
ON
ME
NT
AN
DP
RO
BL
EM
S
10

Agenda
Page
cmu v5 refresh
Overview of US Investment in Transmission 1
Current Environment and Problems 6
Investor Considerations
“Project” versus “System” Financing 11
16
Conclusion 23
TR
AN
SM
IS
SI
ON
FI
NA
NC
IN
G
11

How will future transmission be financed?
Despite greater investment risk, most transmission-related expenses will continue to be financed by utilities, particularly for maintenance of existing assets
New lines used to enhance competition will probably be financed by a mixture of utilities, “independent”transmission companies, and third-party investors
Public Power will likely continue using “system financing”
Because of “unbundling”, IOU’s may have to fund a portion of their transmission needs using “project financing”
Independent transmission companies will have little choice but to use “project financing”
“S
YS
TE
M”
FI
NA
NC
IN
G“
PR
OJ
EC
T”
VE
RS
US
12

“System” versus “Project” financing
System Financing:
Utility guarantees repayment of the funds used to build transmission projects Repayment not project specificRelatively easy to obtain financing at “normal” rates
Project (and merchant) Financing:
The successful operation of the project is the primary source of revenues to repay investors
No recourse to other moneys/assets if the project fails to operate as expected
If pre-construction contracts for project’s use do not extend to the life of the financing or provide insufficient revenues to cover all costs, the project is considered to have “merchant” risk
“Project financing” (particularly if it has a merchant component) isconsiderably more expensive than “system” financing
”V
ER
SU
S“
SY
ST
EM
”F
IN
AN
CI
NG
“P
RO
JE
CT
13
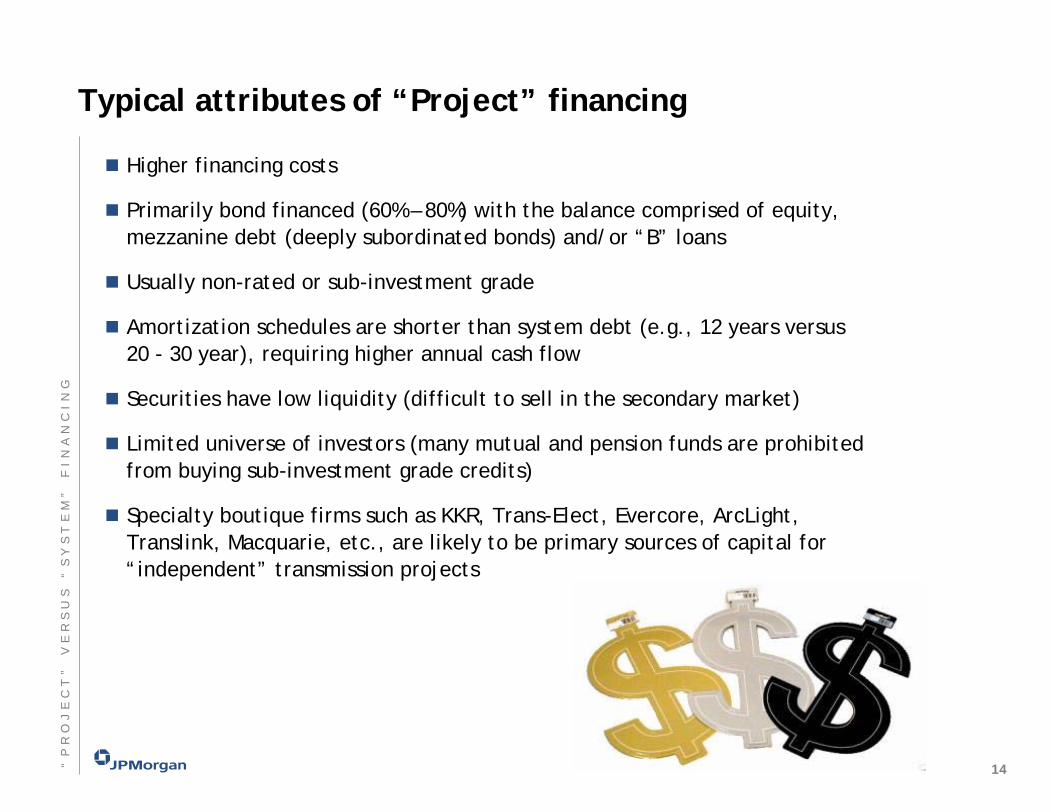
Typical attributes of “Project” financing
Higher financing costs
Primarily bond financed (60% – 80%) with the balance comprised of equity, mezzanine debt (deeply subordinated bonds) and/or “B” loans
Usually non-rated or sub-investment grade
Amortization schedules are shorter than system debt (e.g., 12 years versus 20 - 30 year), requiring higher annual cash flow
Securities have low liquidity (difficult to sell in the secondary market)
Limited universe of investors (many mutual and pension funds are prohibited from buying sub-investment grade credits)
Specialty boutique firms such as KKR, Trans-Elect, Evercore, ArcLight, Translink, Macquarie, etc., are likely to be primary sources of capital for “independent” transmission projects
“P
RO
JE
CT
”V
ER
SU
S“
SY
ST
EM
”F
IN
AN
CI
NG
14
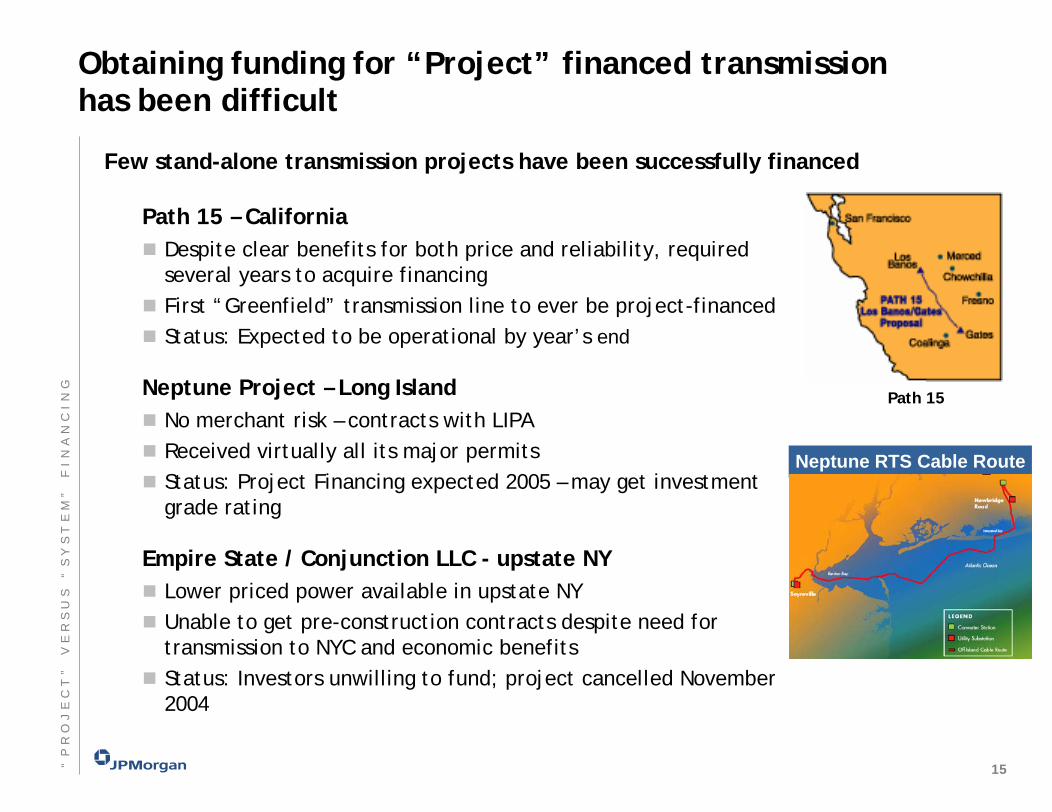
Obtaining funding for “Project” financed transmission has been difficult
Few stand-alone transmission projects have been successfully financed
Path 15 – CaliforniaDespite clear benefits for both price and reliability, required several years to acquire financing First “Greenfield” transmission line to ever be project-financedStatus: Expected to be operational by year’s end
Neptune Project – Long IslandNo merchant risk – contracts with LIPAReceived virtually all its major permitsStatus: Project Financing expected 2005 – may get investment grade rating
Empire State / Conjunction LLC - upstate NYLower priced power available in upstate NYUnable to get pre-construction contracts despite need for transmission to NYC and economic benefitsStatus: Investors unwilling to fund; project cancelled November 2004
Neptune RTS Cable Route
”V
ER
SU
S“
SY
ST
EM
”F
IN
AN
CI
NG
Path 15
“P
RO
JE
CT
15

Agenda
Page
cmu v5 refresh
Overview of US Investment in Transmission 1
Current Environment and Problems 6
“Project” versus “System” Financing 11
Conclusion
Investor Considerations 16
23
TR
AN
SM
IS
SI
ON
FI
NA
NC
IN
G
16

“We’re only in it for the money”
Investor considerations
Past experience with merchant plants and energy traders
Relative return on investment (ROI)
Credit quality & structure
Secondary market liquidity
Expectations for interest rates and “credit spreads”
Social benefits (lower power costs, greater reliability) are not prime considerations for investors
17IN
VE
ST
OR
CO
NS
ID
ER
AT
IO
NS
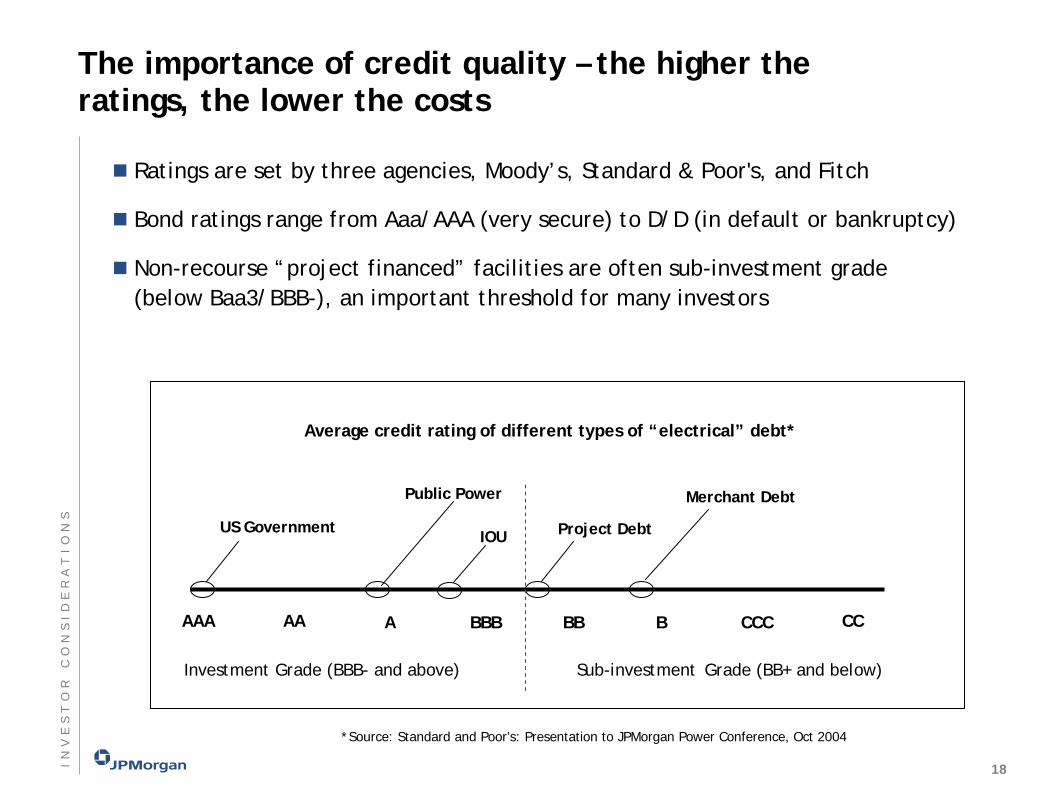
The importance of credit quality – the higher the ratings, the lower the costs
Ratings are set by three agencies, Moody’s, Standard & Poor's, and Fitch
Bond ratings range from Aaa/AAA (very secure) to D/D (in default or bankruptcy)
Non-recourse “project financed” facilities are often sub-investment grade (below Baa3/BBB-), an important threshold for many investors
Average credit rating of different types of “electrical” debt*
AAA A
Investment Grade (BBB- and above) Sub-investment Grade (BB+ and below)
CCBAA BBB CCC
US Government IOU Project Debt
Merchant Debt
BB
Public Power
RC
ON
SI
DE
RA
TI
ON
SI
NV
ES
TO
*Source: Standard and Poor’s: Presentation to JPMorgan Power Conference, Oct 2004
18
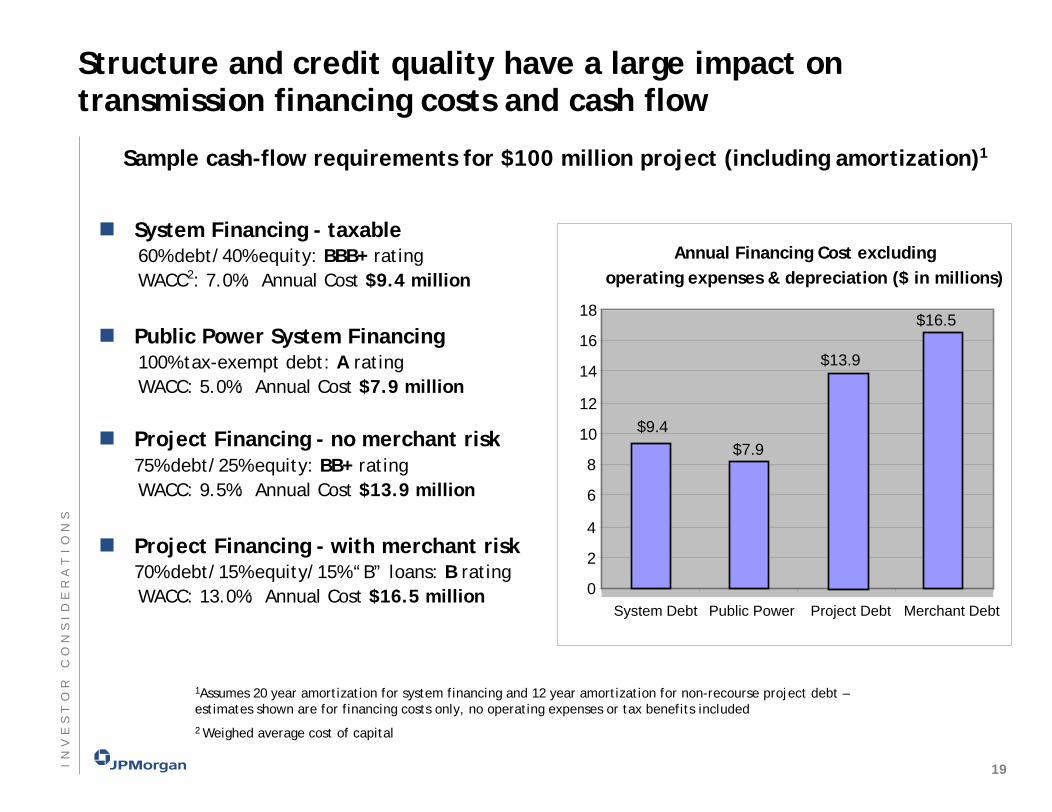
Structure and credit quality have a large impact on transmission financing costs and cash flow
Sample cash-flow requirements for $100 million project (including amortization)1
System Financing - taxable 60% debt/40% equity: BBB+ ratingWACC2: 7.0%: Annual Cost $9.4 million
Public Power System Financing 100% tax-exempt debt: A ratingWACC: 5.0%: Annual Cost $7.9 million
Project Financing - no merchant risk75% debt/25% equity: BB+ ratingWACC: 9.5%: Annual Cost $13.9 million
Project Financing - with merchant risk 70% debt/15% equity/15% “B” loans: B ratingWACC: 13.0%: Annual Cost $16.5 million
$9.4$7.9
$13.9
$16.5
0
2
4
6
8
10
12
14
16
18
System Debt Public Power Project Debt Merchant Debt
Annual Financing Cost excluding operating expenses & depreciation ($ in millions)
CO
NS
ID
ER
AT
IO
NS
IN
VE
ST
OR 1Assumes 20 year amortization for system financing and 12 year amortization for non-recourse project debt –
estimates shown are for financing costs only, no operating expenses or tax benefits included2 Weighed average cost of capital
19

Other investor considerations – “credit spread”and interest rate risk
After years of record low rates, investors are “yield starved,” causing credit spread compression (willing to accept smaller yields for riskier investments)
Spreads are likely to widen when yields go back up, implying that relative cost of financing low rated transmission projects will increase
4
4.5
5
5.5
6
12/01
/2003
01/01
/2004
02/01
/2004
03/01
/2004
04/01
/2004
05/01
/2004
06/01
/2004
07/01
/2004
08/01
/2004
09/01
/2004
10/01
/2004
11/01
/2004
.80 .42
* Municipal Market Data (“MMD”)
-BBB rated 30 year bonds*-AAA rated 30 year bonds*
IN
VE
ST
OR
CO
NS
ID
ER
AT
IO
NS
AAA & BBB Rated Tax-Exempt Bond Yields( 12/1/03-12/1/04)
20

What do investors want?Structuring a transmission project to minimize costs
Demonstrated need for the project
Minimal merchant risk – contracts that equal or exceed life of financing
Unconditional contracts1: system financing
Conditional contracts2: project financing
High quality counter-parties (users of project)
Owner-equity participation
Price, completion date, and performance guarantee from an EPC contractor with liquidated damage provisions
Step-up provisions (for projects with multiple owners/users)
Permits already approved or pending prior to seeking financing
1– Also known as Take-or-Pay:, Hell-or-High Water, All-requirements, etc.
2- Also referred to as Take-and-Pay, Joint but not several, etc.
RC
ON
SI
DE
RA
TI
ON
SI
NV
ES
TO
21

Financing matrix for transmission projects
Scenarios Ranked Highest to Lowest Credit Quality
Scenario Contract Type Step-up Provisions Equity Contribution 2 EPC Contractor 3 Financing Cost1 take or pay yes yes yes Lowest2 take or pay yes no yes3 take or pay yes yes no4 take or pay yes no no5 take or pay no yes yes6 take or pay no no yes7 take or pay no yes no8 take or pay no no no9 take and pay yes yes yes10 take and pay yes no yes11 take and pay yes yes no12 take and pay yes no no13 take and pay no yes yes14 take and pay no no yes15 take and pay no yes no16 take and pay no no no17 merchant n/a yes yes18 merchant n/a yes no Highest19 merchant n/a no yes20 merchant n/a no no
1
IN
VE
ST
OR
CO
NS
ID
ER
AT
IO
NS
1 Actual order will vary depending on factors such as size (%) of step-up provisions,equity contributions, credit quality of participants and/or EPC, type and limitation of step-up provisions, etc.2 Inclusive of reserve funds, rate stabilization funds, unrestricted cash, etc3 Assumes - “liquidated damages” clause for failure to meet schedule/specs
22
Agenda
Page
cmu v5 refresh
Overview of US Investment in Transmission 1
Current Environment and Problems 6
“Project” versus “System” Financing 11
Investor Considerations 16
Conclusion 23
TR
AN
SM
IS
SI
ON
FI
NA
NC
IN
G
23

Conclusions
Financial issues, not technical issues, may prove to be the major constraint in improving the nation’s grid
Expected savings from “competitive grid system” will be lower than projected due to higher financing costs.
Given their experience with merchant power plants, investors will demand high premiums/ROI for non-utility secured transmission projects
Some “needed” transmission facilities may not be built if “project” financing is the only option available, particularly if the facility has a merchant risk component
The “public power” model1 offers the lowest cost option to finance future transmission assets
CO
NC
LU
SI
ON
1Not for profit, non-regulated entity that can issue tax-exempt debt and whole goal is to maximize benefits to the ratepayers – not shareholders
24