TRANSMISSION CONNECTION PLANNING REPORT · 2017 Joint DB Transmission Connection Planning Report...
193
TRANSMISSION CONNECTION PLANNING REPORT Produced jointly by the Victorian Electricity Distribution Businesses 2017
Transcript of TRANSMISSION CONNECTION PLANNING REPORT · 2017 Joint DB Transmission Connection Planning Report...
TRANSMISSION CONNECTION PLANNING REPORT
Produced jointly by the Victorian Electricity Distribution Businesses
2017
2017 Joint DB Transmission Connection Planning Report
Page 1
TRANSMISSION CONNECTION PLANNING REPORT Produced jointly by the five Victorian Electricity Distribution Businesses
TABLE OF CONTENTS
EXECUTIVE SUMMARY ....................................................................................................... 2
1 INTRODUCTION AND BACKGROUND .................................................................... 12
1.1 Purpose of this report ........................................................................................................ 12
1.2 Victorian joint planning arrangements for transmission connection assets ...................... 12
1.3 DBs’ obligations as transmission connection planners ..................................................... 14
1.3.1 Victorian regulatory instruments ........................................................................... 14
1.3.2 National Electricity Rules ...................................................................................... 16
1.3.3 Reliability incentive scheme (s-factor) for the Distribution Businesses ................ 17
1.3.4 Role of transmission connection asset owners in delivering connection services 18
1.4 Matters to be addressed by proponents of non-network alternatives ............................... 18
1.5 Implementing Transmission Connection Projects ............................................................. 19
1.5.1 Land Acquisition ................................................................................................... 19
1.5.2 Connection Application to AEMO ......................................................................... 20
1.5.3 Connection Application to AusNet Transmission Group ...................................... 20
1.5.4 Town Planning Permit ........................................................................................... 20
1.5.5 Public Consultation Strategy ................................................................................ 21
1.5.6 Project Implementation ......................................................................................... 21
1.5.7 Project lead times ................................................................................................. 21
1.6 Overview of Transmission Connection Planning Process ................................................. 23
2 PLANNING STANDARDS ......................................................................................... 24
2.1 Planning standard applying to transmission connection assets ........................................ 24
2.2 Overall objective of transmission connection planning ..................................................... 25
2.3 Overall approach to transmission planning and investment evaluation ............................ 26
2.4 Valuing supply reliability from the customers’ perspective ................................................ 26
2.5 Application of the probabilistic approach to transmission connection planning ................ 30
3 CURRENT AND EMERGING PLANNING CONSIDERATIONS ................................. 32
4 HISTORIC AND FORECAST DEMAND ..................................................................... 36
5 RISK ASSESSMENT AND OPTIONS FOR ALLEVIATION OF CONSTRAINTS ....... 37
5.1 Preamble ........................................................................................................................... 37
5.2 Interpreting “energy at risk” ............................................................................................... 38
5.3 Assessing the costs of transformer outages ..................................................................... 39
5.4 Base reliability statistics for transmission plant ................................................................. 39
5.5 Availability of spare transformers ...................................................................................... 40
5.6 Treatment of Load Transfer Capability .............................................................................. 41
5.7 Detailed risk assessments and options for alleviation of constraints, by terminal station . 42
5.8 Interpreting the dates shown in the risk assessments ...................................................... 43
APPENDIX: ESTIMATION OF BASIC TRANSFORMER RELIABILITY DATA AND EXAMPLE OF EXPECTED TRANSFORMER UNAVAILABILITY CALCULATION ... 44
2017 Joint DB Transmission Connection Planning Report
Page 2
EXECUTIVE SUMMARY
This document sets out a joint report on transmission connection asset planning in Victoria, prepared by the five Victorian electricity Distribution Businesses (“the DBs”)1, in accordance with the transmission connection planning requirements of Clause 3.4 of the Victorian Electricity Distribution Code and clause 5.13.2 of the National Electricity Rules (the Rules).
Under their Electricity Distribution Licences, the DBs have responsibility for planning and directing the augmentation of the facilities that connect their distribution systems to the shared transmission network2. The assets connecting the DBs’ distribution networks to the shared transmission network are known as transmission connection assets. Those assets provide prescribed transmission services in accordance with Chapter 6A of the Rules. Apart from the connection assets at Deer Park terminal station which are owned, operated and maintained by TransGrid, the transmission assets that provide DB connection services are located within terminal stations which are owned, operated, and maintained by the transmission asset owner, AusNet Transmission Group.
The Victorian jurisdiction has not set deterministic planning standards that apply to transmission connection assets. However, clause 5.2 of the Victorian Electricity Distribution Code requires the DBs to use best endeavours to meet, among other things, reasonable customer expectations of reliability of supply.
For the purpose of identifying emerging constraints, and subject to meeting the standards in schedule 5.1 of the Rules and complying with the Victorian Electricity Distribution Code, the DBs apply a probabilistic planning approach. That approach involves estimating the probability of a transmission plant outage occurring, and weighting the costs of such an occurrence by its probability. This calculation enables the assessment of:
• the expected amount (and value) of energy that will not be supplied under a ‘do nothing’ scenario, and therefore
• whether it is economic to take action to reduce or eliminate the expected supply interruptions.
The DBs’ approach is consistent with the probabilistic approach applied by the Australian Energy Market Operator (AEMO) in planning the Victorian shared transmission network3. An important point to note about the use of a probabilistic approach is that it involves customers accepting the risk that there may be circumstances when the available terminal station capacity will be insufficient to meet demand, and significant load shedding could be required.
An estimate of the value that customers place on supply reliability (“VCR”) is a key input to probabilistic network planning. Estimating the VCR is inherently uncertain, and AEMO’s current estimate (published in its September 2014 VCR Final Report4) is substantially lower than its previous estimate. In the 2016 Transmission Connection Planning Report, we
1 The five DBs are: Jemena Electricity Networks (Vic) Ltd, CitiPower, Powercor Australia, United Energy,
and AusNet Electricity Services Pty Ltd. AusNet Electricity Services is owned by AusNet Services, a diversified energy infrastructure business that also owns the Victorian electricity transmission system. Throughout this document “AusNet Transmission Group” refers to the transmission business of AusNet Services and “AusNet Electricity Services” refers to the electricity distribution business of AusNet Services.
2 The shared transmission network is the main extra high voltage network that provides or potentially provides supply to more than a single point. This network includes all lines rated above 66 kV and main system tie transformers that operate at two or three voltage levels above 66 kV.
3 See: http://www.aemo.com.au/-/media/Files/Electricity/NEM/Planning_and_Forecasting/Victorian_Transmission/2016/Victorian-Electricity-Planning-Approach.pdf
4 See: http://www.aemo.com.au/Electricity/Planning/Value-of-Customer-Reliability-review
2017 Joint DB Transmission Connection Planning Report
Page 3
highlighted the impact of AEMO’s lower VCR estimate by reporting the investment signals using both the current and previous estimates where the change in VCR has a material impact on the timing of augmentation over the next 5 years. We adopt the same approach in this report.
AEMO’s 2014 VCR estimate has been escalated to 2017 values using the escalation adjustment set out in AEMO’s VCR Application Guide. The 2017 VCR and AEMO’s previous VCR estimate (also escalated to 2017 dollars) are used to calculate expected unserved energy, and to provide an indication of the timing of remedial action to address an emerging constraint.
Where application of AEMO’s current VCR estimates produces a materially different investment signal (and hence different reliability outcomes and risks for customers) compared to its previous estimate, the DBs will undertake further analysis, which may include customer consultation. Customer consultation may be particularly helpful in determining the investment timing that would meet customers’ expectations of supply reliability as required by clause 5.2 of the Victorian Electricity Distribution Code.
In accordance with Part B (Network Planning and Expansion) of Chapter 5 of the Rules, the planning standard applied by the DBs in relation to transmission connection assets is the Regulatory Investment Test for Transmission (RIT-T), the purpose of which is set out in clause 5.16.1(b) of the Rules as follows:
“To identify the credible option that maximises the present value of net economic benefit to all those who produce, consume and transport electricity in the market (the preferred option). For the avoidance of doubt, a preferred option may, in the relevant circumstances, have a negative net economic benefit (that is, a net economic cost) where the identified need is for reliability corrective action.”
It is noted that “reliability corrective action” involves investment (which may consist of network or non-network options) to satisfy the technical requirements of schedule 5.1 of the Rules or an applicable regulatory instrument, such as the Victorian Electricity Distribution Code.
The assessment presented in this report, and summarised in the table on the following pages sets out the DBs’ Transmission Connection Planning Report for 2017. It is emphasised that this report does not present the detailed investment decision analysis that is required under the RIT-T. Rather, the report presents a high-level indication of the expected balance between capacity and demand at each terminal station over the forecast period and the likely investment requirements.
Data presented in this report may indicate an emerging major constraint. Therefore, this report provides a means of identifying those terminal stations where further detailed consultation and analysis, in accordance with the RIT-T, is required. This report also provides preliminary information on potential opportunities to prospective proponents of alternatives to network augmentations at terminal stations where remedial action may be required. Providing this information to the market should facilitate the efficient development of network and non-network solutions to best meet the needs of end-customers.
The DBs are required by clause 3.4 of the Victorian Electricity Distribution Code to provide, among other things, an indication of the magnitude, and potential impact of loss of load for each transmission connection.
2017 Joint DB Transmission Connection Planning Report
Page 4
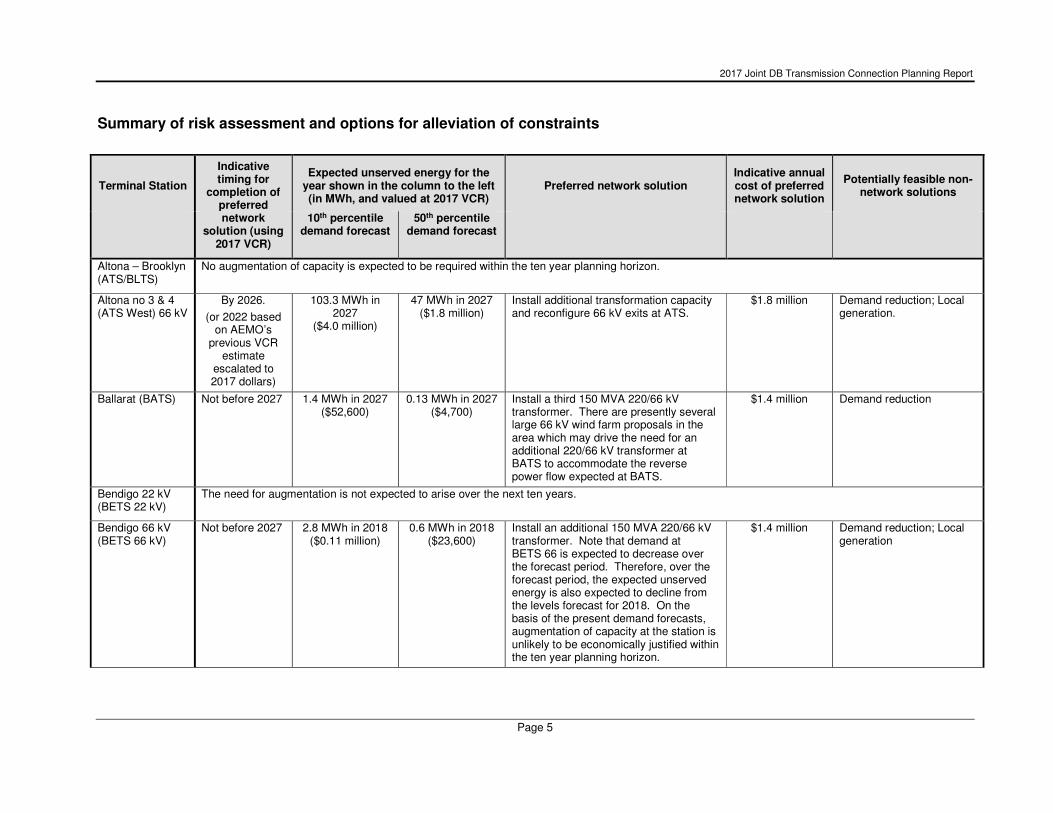
This information is summarised in the table on the following pages, in the form of estimates of “expected unserved energy”5 for each terminal station in the year in which augmentation of the terminal station is likely to be required. Expected unserved energy estimates are provided for two forecasts of demand: the first forecast has a 10% probability of being exceeded, while the second forecast has a 50% probability of being exceeded. The demand forecasts used in the preparation of this report are set out in the 2017 Terminal Station Demand Forecasts, which is prepared by the DBs and published alongside this report.
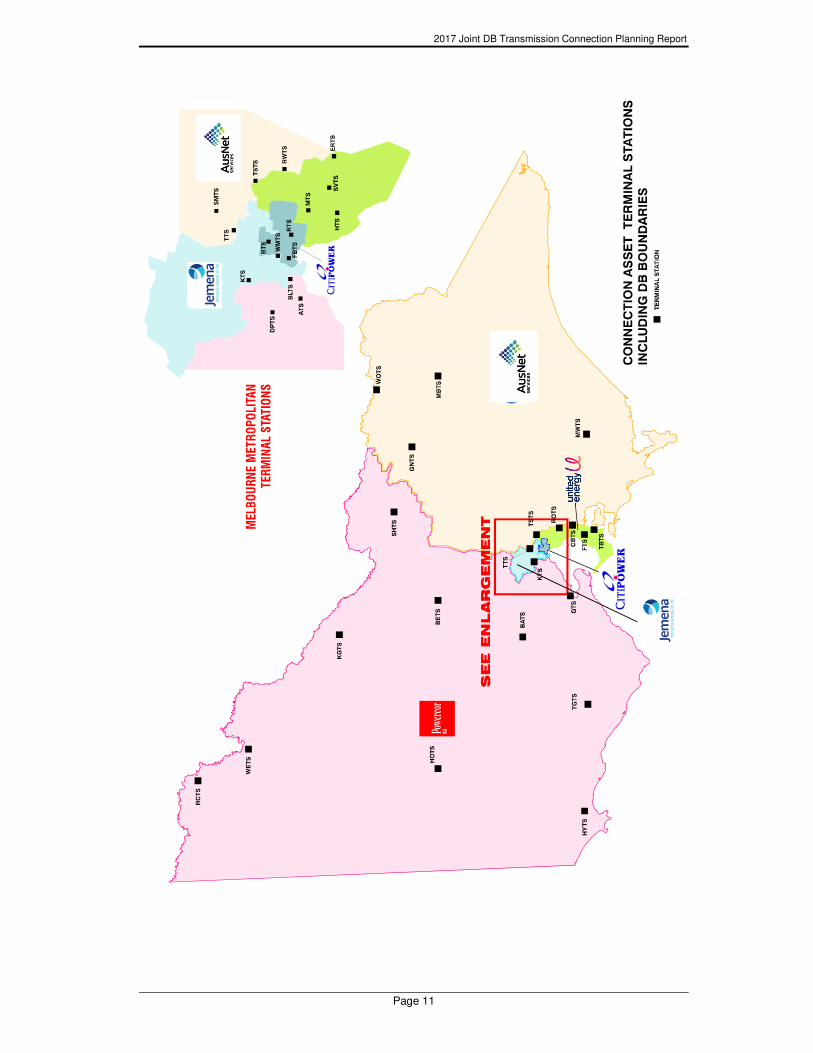
For each terminal station, the table also identifies alternatives to network augmentation that may alleviate constraints. Following the summary table is a map showing the approximate locations of the existing AusNet Transmission Group-owned connection terminal stations.
Unless noted otherwise in this report including the accompanying risk assessment documents, the relevant DB(s) have not identified any issues relating to compliance with applicable standards that would be likely to drive the need for augmentation of transmission connection assets at this time.
It is noted that as conditions change and as new information becomes available, the indicative timing of any remedial action required to address an emerging constraint or possible non-compliance with an applicable standard may also change. For instance, changes in demand forecasts from one year to the next may result in changes in the timing of remedial action at some stations. Further details are set out in the individual risk assessments for each of the terminal stations.
Parties seeking further information about any matter contained in this report should contact any one of the following people:
• Peter Lambis, Subtransmission & Transmission Interface Manager, CitiPower / Powercor, phone 9683 4333.
• Tom Langstaff, Lead Engineer, Strategic Network Planning, AusNet Electricity Services, phone 9695 6859.
• Rodney Bray, Manager Network Planning and Strategy, United Energy, phone 8846 9745.
• Ashley Lloyd, Network Capacity Planning and Assessment Manager, Jemena, phone 9173 8279.
Any of these contact officers will either be able to answer your queries or will direct you to the organisation that is best placed to provide you with the information you are seeking.
5 Throughout this report, the terms “energy at risk” and “expected unserved energy” are used to provide an
indication of the magnitude, and potential impact of loss of load for each terminal station. In this report:
“Energy at risk” is, for a given forecast of demand, the total energy that would not be supplied from a terminal station if: a major outage of a transformer occurs at that station in a specified year; the outage has a mean duration of 2.6 months; and no other mitigation action is taken. This statistic provides an indication of the magnitude of loss of energy that would arise in the unlikely event of a major outage of a transformer.
“Expected unserved energy” is the energy at risk weighted by the probability of a major outage of a transformer, where a “major outage” is defined as one that has a mean duration of 2.6 months. This statistic provides an indication of the amount of energy, on average, that will not be supplied in a year, taking into account the very low probability that one transformer at the station will not be available because of a major outage.
2017 Joint DB Transmission Connection Planning Report
Page 5
Summary of risk assessment and options for alleviation of constraints
Terminal Station
Indicative timing for
completion of preferred
Expected unserved energy for the year shown in the column to the left (in MWh, and valued at 2017 VCR)
Preferred network solution Indicative annual cost of preferred network solution
Potentially feasible non-network solutions
network solution (using
2017 VCR)
10th percentile demand forecast
50th percentile demand forecast
Altona – Brooklyn (ATS/BLTS)
No augmentation of capacity is expected to be required within the ten year planning horizon.
Altona no 3 & 4 (ATS West) 66 kV
By 2026.
(or 2022 based on AEMO’s
previous VCR estimate
escalated to 2017 dollars)
103.3 MWh in 2027
($4.0 million)
47 MWh in 2027 ($1.8 million)
Install additional transformation capacity and reconfigure 66 kV exits at ATS.
$1.8 million Demand reduction; Local generation.
Ballarat (BATS) Not before 2027 1.4 MWh in 2027 ($52,600)
0.13 MWh in 2027 ($4,700)
Install a third 150 MVA 220/66 kV transformer. There are presently several large 66 kV wind farm proposals in the area which may drive the need for an additional 220/66 kV transformer at BATS to accommodate the reverse power flow expected at BATS.
$1.4 million Demand reduction
Bendigo 22 kV (BETS 22 kV)
The need for augmentation is not expected to arise over the next ten years.
Bendigo 66 kV (BETS 66 kV)
Not before 2027 2.8 MWh in 2018 ($0.11 million)
0.6 MWh in 2018 ($23,600)
Install an additional 150 MVA 220/66 kV transformer. Note that demand at BETS 66 is expected to decrease over the forecast period. Therefore, over the forecast period, the expected unserved energy is also expected to decline from the levels forecast for 2018. On the basis of the present demand forecasts, augmentation of capacity at the station is unlikely to be economically justified within the ten year planning horizon.
$1.4 million Demand reduction; Local generation
2017 Joint DB Transmission Connection Planning Report
Page 6
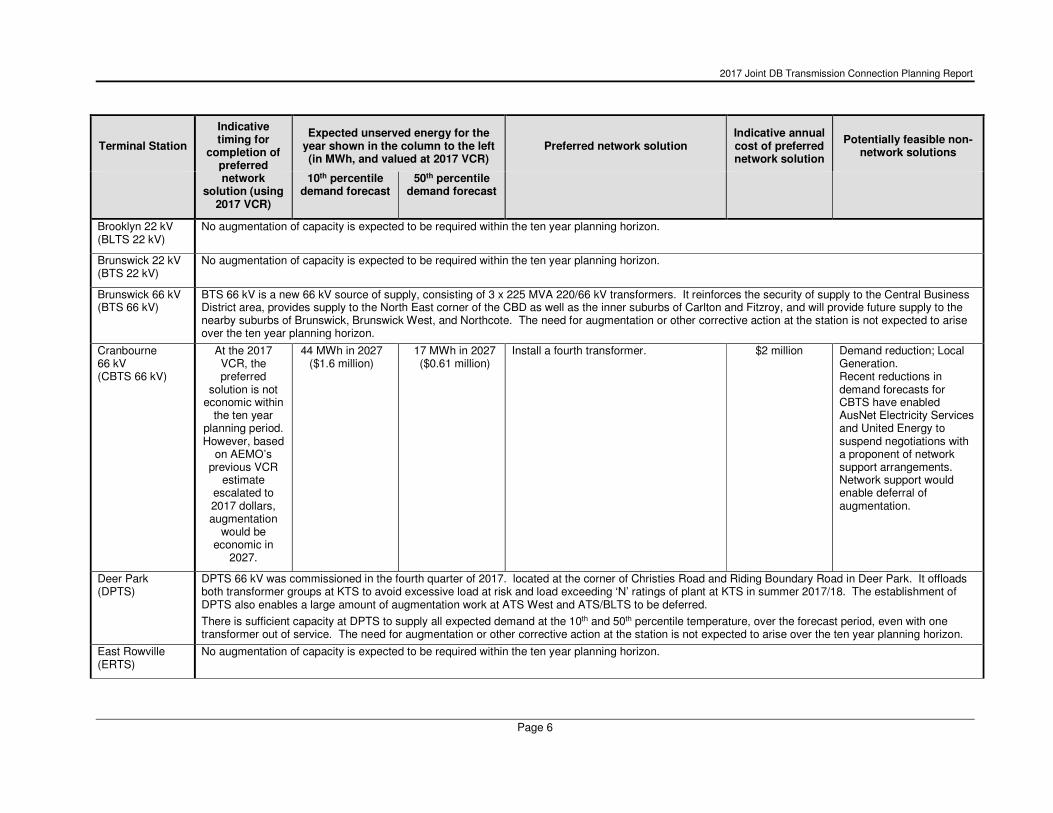
Terminal Station
Indicative timing for
completion of preferred
Expected unserved energy for the year shown in the column to the left (in MWh, and valued at 2017 VCR)
Preferred network solution Indicative annual cost of preferred network solution
Potentially feasible non-network solutions
network solution (using
2017 VCR)
10th percentile demand forecast
50th percentile demand forecast
Brooklyn 22 kV (BLTS 22 kV)
No augmentation of capacity is expected to be required within the ten year planning horizon.
Brunswick 22 kV (BTS 22 kV)
No augmentation of capacity is expected to be required within the ten year planning horizon.
Brunswick 66 kV (BTS 66 kV)
BTS 66 kV is a new 66 kV source of supply, consisting of 3 x 225 MVA 220/66 kV transformers. It reinforces the security of supply to the Central Business District area, provides supply to the North East corner of the CBD as well as the inner suburbs of Carlton and Fitzroy, and will provide future supply to the nearby suburbs of Brunswick, Brunswick West, and Northcote. The need for augmentation or other corrective action at the station is not expected to arise over the ten year planning horizon.
Cranbourne 66 kV (CBTS 66 kV)
At the 2017 VCR, the preferred
solution is not economic within
the ten year planning period. However, based
on AEMO’s previous VCR
estimate escalated to 2017 dollars, augmentation
would be economic in
2027.
44 MWh in 2027 ($1.6 million)
17 MWh in 2027 ($0.61 million)
Install a fourth transformer.
$2 million Demand reduction; Local Generation. Recent reductions in demand forecasts for CBTS have enabled AusNet Electricity Services and United Energy to suspend negotiations with a proponent of network support arrangements. Network support would enable deferral of augmentation.
Deer Park (DPTS)
DPTS 66 kV was commissioned in the fourth quarter of 2017. located at the corner of Christies Road and Riding Boundary Road in Deer Park. It offloads both transformer groups at KTS to avoid excessive load at risk and load exceeding ‘N’ ratings of plant at KTS in summer 2017/18. The establishment of DPTS also enables a large amount of augmentation work at ATS West and ATS/BLTS to be deferred.
There is sufficient capacity at DPTS to supply all expected demand at the 10th and 50th percentile temperature, over the forecast period, even with one transformer out of service. The need for augmentation or other corrective action at the station is not expected to arise over the ten year planning horizon.
East Rowville (ERTS)
No augmentation of capacity is expected to be required within the ten year planning horizon.
2017 Joint DB Transmission Connection Planning Report
Page 7
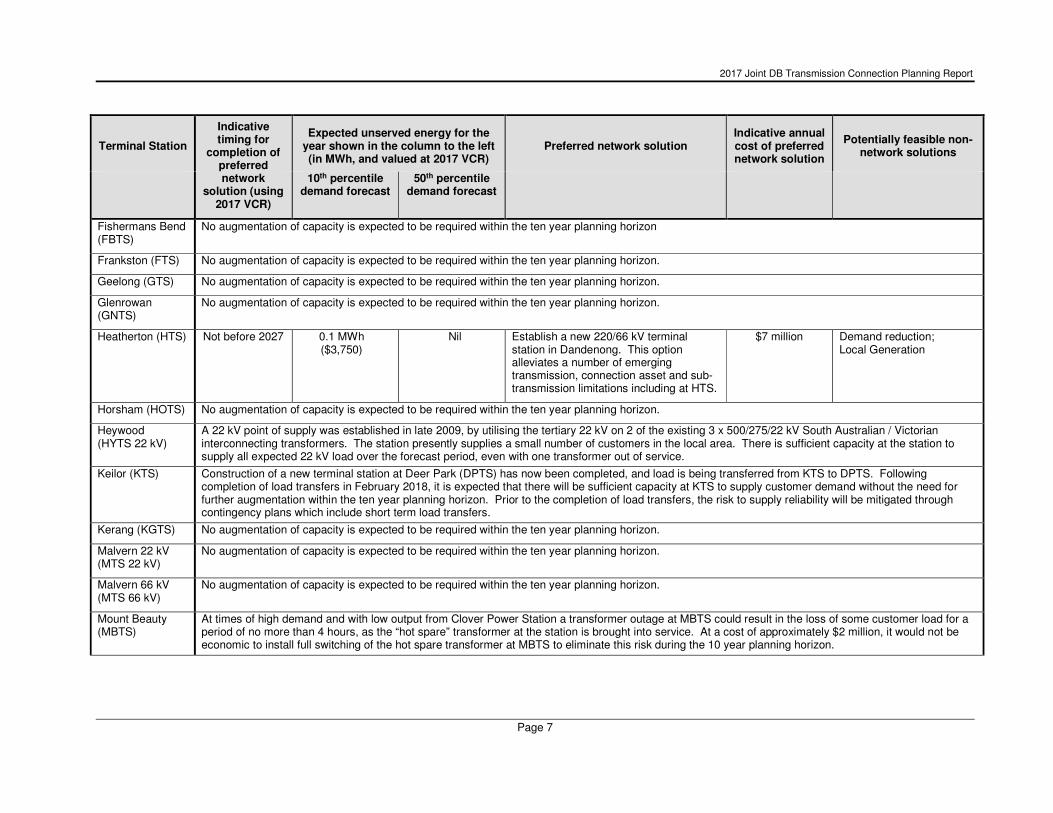
Terminal Station
Indicative timing for
completion of preferred
Expected unserved energy for the year shown in the column to the left (in MWh, and valued at 2017 VCR)
Preferred network solution Indicative annual cost of preferred network solution
Potentially feasible non-network solutions
network solution (using
2017 VCR)
10th percentile demand forecast
50th percentile demand forecast
Fishermans Bend (FBTS)
No augmentation of capacity is expected to be required within the ten year planning horizon
Frankston (FTS) No augmentation of capacity is expected to be required within the ten year planning horizon.
Geelong (GTS) No augmentation of capacity is expected to be required within the ten year planning horizon.
Glenrowan (GNTS)
No augmentation of capacity is expected to be required within the ten year planning horizon.
Heatherton (HTS) Not before 2027 0.1 MWh ($3,750)
Nil Establish a new 220/66 kV terminal station in Dandenong. This option alleviates a number of emerging transmission, connection asset and sub-transmission limitations including at HTS.
$7 million Demand reduction; Local Generation
Horsham (HOTS) No augmentation of capacity is expected to be required within the ten year planning horizon.
Heywood (HYTS 22 kV)
A 22 kV point of supply was established in late 2009, by utilising the tertiary 22 kV on 2 of the existing 3 x 500/275/22 kV South Australian / Victorian interconnecting transformers. The station presently supplies a small number of customers in the local area. There is sufficient capacity at the station to supply all expected 22 kV load over the forecast period, even with one transformer out of service.
Keilor (KTS) Construction of a new terminal station at Deer Park (DPTS) has now been completed, and load is being transferred from KTS to DPTS. Following completion of load transfers in February 2018, it is expected that there will be sufficient capacity at KTS to supply customer demand without the need for further augmentation within the ten year planning horizon. Prior to the completion of load transfers, the risk to supply reliability will be mitigated through contingency plans which include short term load transfers.
Kerang (KGTS) No augmentation of capacity is expected to be required within the ten year planning horizon.
Malvern 22 kV (MTS 22 kV)
No augmentation of capacity is expected to be required within the ten year planning horizon.
Malvern 66 kV (MTS 66 kV)
No augmentation of capacity is expected to be required within the ten year planning horizon.
Mount Beauty (MBTS)
At times of high demand and with low output from Clover Power Station a transformer outage at MBTS could result in the loss of some customer load for a period of no more than 4 hours, as the “hot spare” transformer at the station is brought into service. At a cost of approximately $2 million, it would not be economic to install full switching of the hot spare transformer at MBTS to eliminate this risk during the 10 year planning horizon.
2017 Joint DB Transmission Connection Planning Report
Page 8
Terminal Station
Indicative timing for
completion of preferred
Expected unserved energy for the year shown in the column to the left (in MWh, and valued at 2017 VCR)
Preferred network solution Indicative annual cost of preferred network solution
Potentially feasible non-network solutions
network solution (using
2017 VCR)
10th percentile demand forecast
50th percentile demand forecast
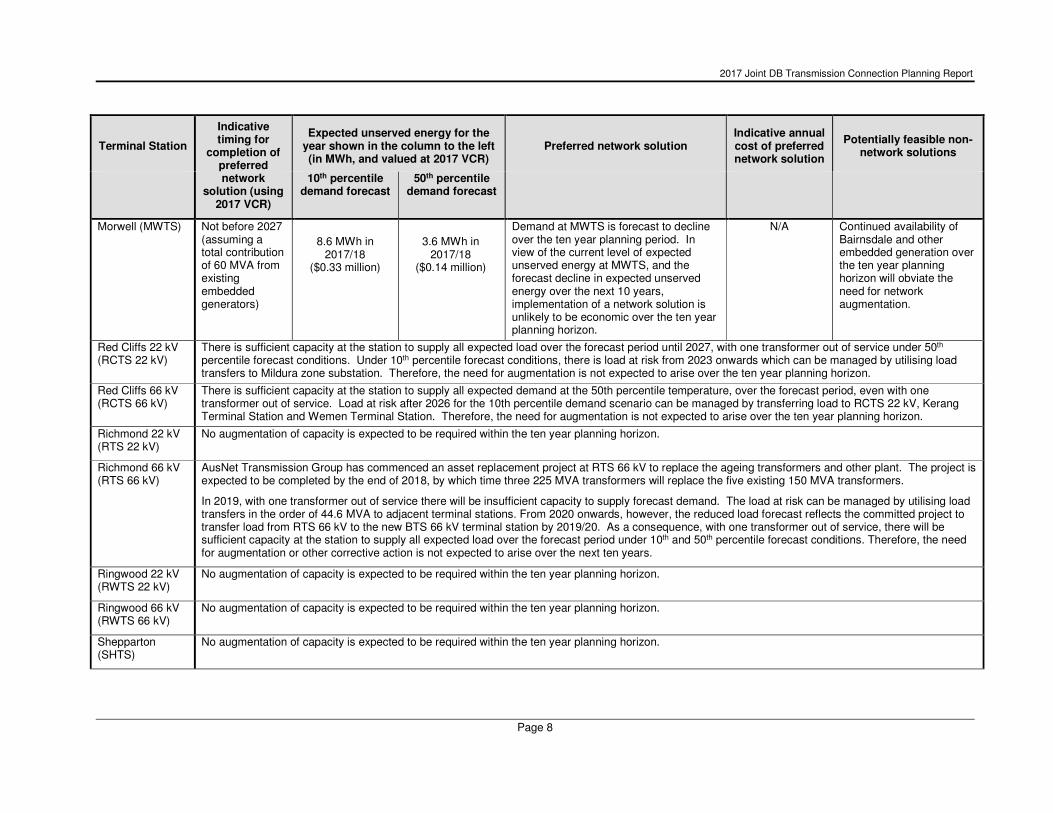
Morwell (MWTS) Not before 2027 (assuming a total contribution of 60 MVA from existing embedded generators)
8.6 MWh in 2017/18
($0.33 million)
3.6 MWh in 2017/18
($0.14 million)
Demand at MWTS is forecast to decline over the ten year planning period. In view of the current level of expected unserved energy at MWTS, and the forecast decline in expected unserved energy over the next 10 years, implementation of a network solution is unlikely to be economic over the ten year planning horizon.
N/A Continued availability of Bairnsdale and other embedded generation over the ten year planning horizon will obviate the need for network augmentation.
Red Cliffs 22 kV (RCTS 22 kV)
There is sufficient capacity at the station to supply all expected load over the forecast period until 2027, with one transformer out of service under 50th percentile forecast conditions. Under 10th percentile forecast conditions, there is load at risk from 2023 onwards which can be managed by utilising load transfers to Mildura zone substation. Therefore, the need for augmentation is not expected to arise over the ten year planning horizon.
Red Cliffs 66 kV (RCTS 66 kV)
There is sufficient capacity at the station to supply all expected demand at the 50th percentile temperature, over the forecast period, even with one transformer out of service. Load at risk after 2026 for the 10th percentile demand scenario can be managed by transferring load to RCTS 22 kV, Kerang Terminal Station and Wemen Terminal Station. Therefore, the need for augmentation is not expected to arise over the ten year planning horizon.
Richmond 22 kV (RTS 22 kV)
No augmentation of capacity is expected to be required within the ten year planning horizon.
Richmond 66 kV (RTS 66 kV)
AusNet Transmission Group has commenced an asset replacement project at RTS 66 kV to replace the ageing transformers and other plant. The project is expected to be completed by the end of 2018, by which time three 225 MVA transformers will replace the five existing 150 MVA transformers.
In 2019, with one transformer out of service there will be insufficient capacity to supply forecast demand. The load at risk can be managed by utilising load transfers in the order of 44.6 MVA to adjacent terminal stations. From 2020 onwards, however, the reduced load forecast reflects the committed project to transfer load from RTS 66 kV to the new BTS 66 kV terminal station by 2019/20. As a consequence, with one transformer out of service, there will be sufficient capacity at the station to supply all expected load over the forecast period under 10th and 50th percentile forecast conditions. Therefore, the need for augmentation or other corrective action is not expected to arise over the next ten years.
Ringwood 22 kV (RWTS 22 kV)
No augmentation of capacity is expected to be required within the ten year planning horizon.
Ringwood 66 kV (RWTS 66 kV)
No augmentation of capacity is expected to be required within the ten year planning horizon.
Shepparton (SHTS)
No augmentation of capacity is expected to be required within the ten year planning horizon.
2017 Joint DB Transmission Connection Planning Report
Page 9
Terminal Station
Indicative timing for
completion of preferred
Expected unserved energy for the year shown in the column to the left (in MWh, and valued at 2017 VCR)
Preferred network solution Indicative annual cost of preferred network solution
Potentially feasible non-network solutions
network solution (using
2017 VCR)
10th percentile demand forecast
50th percentile demand forecast
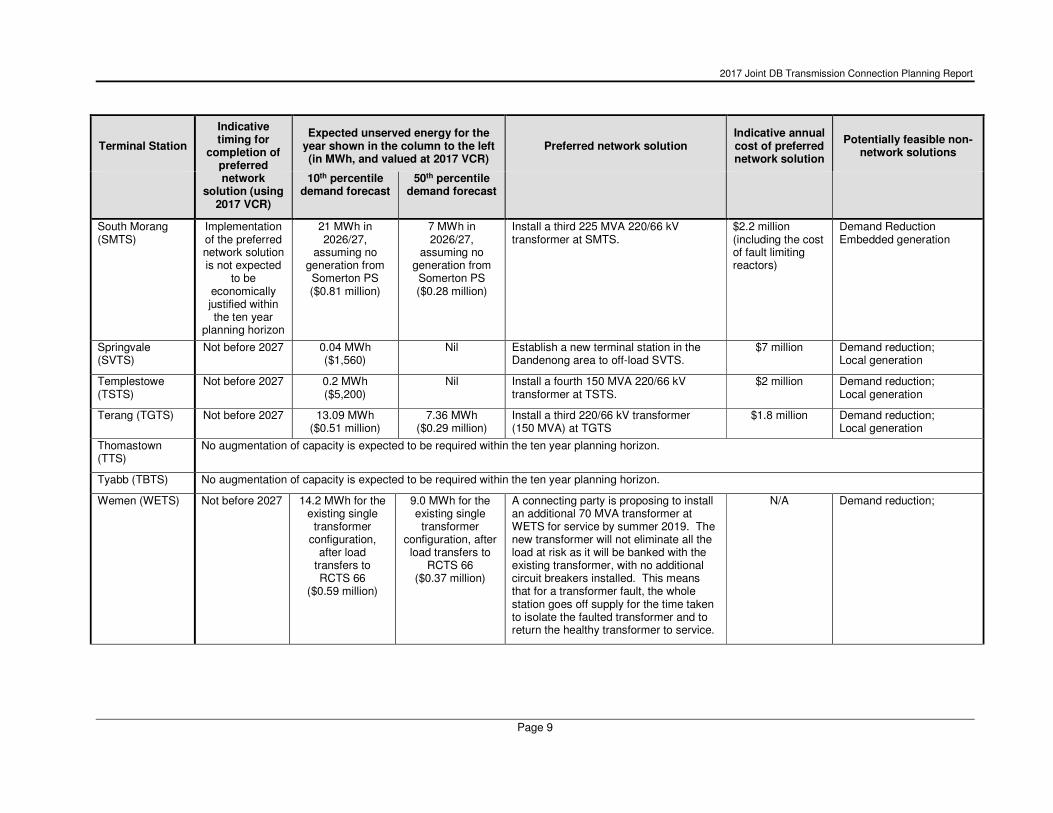
South Morang (SMTS)
Implementation of the preferred network solution is not expected
to be economically justified within the ten year
planning horizon
21 MWh in 2026/27,
assuming no generation from Somerton PS ($0.81 million)
7 MWh in 2026/27,
assuming no generation from Somerton PS ($0.28 million)
Install a third 225 MVA 220/66 kV transformer at SMTS.
$2.2 million (including the cost of fault limiting reactors)
Demand Reduction Embedded generation
Springvale (SVTS)
Not before 2027 0.04 MWh ($1,560)
Nil Establish a new terminal station in the Dandenong area to off-load SVTS.
$7 million Demand reduction; Local generation
Templestowe (TSTS)
Not before 2027 0.2 MWh ($5,200)
Nil Install a fourth 150 MVA 220/66 kV transformer at TSTS.
$2 million Demand reduction; Local generation
Terang (TGTS) Not before 2027 13.09 MWh ($0.51 million)
7.36 MWh ($0.29 million)
Install a third 220/66 kV transformer (150 MVA) at TGTS
$1.8 million Demand reduction; Local generation
Thomastown (TTS)
No augmentation of capacity is expected to be required within the ten year planning horizon.
Tyabb (TBTS) No augmentation of capacity is expected to be required within the ten year planning horizon.
Wemen (WETS) Not before 2027 14.2 MWh for the existing single
transformer configuration,
after load transfers to RCTS 66
($0.59 million)
9.0 MWh for the existing single
transformer configuration, after load transfers to
RCTS 66 ($0.37 million)
A connecting party is proposing to install an additional 70 MVA transformer at WETS for service by summer 2019. The new transformer will not eliminate all the load at risk as it will be banked with the existing transformer, with no additional circuit breakers installed. This means that for a transformer fault, the whole station goes off supply for the time taken to isolate the faulted transformer and to return the healthy transformer to service.
N/A Demand reduction;
2017 Joint DB Transmission Connection Planning Report
Page 10
Terminal Station
Indicative timing for
completion of preferred
Expected unserved energy for the year shown in the column to the left (in MWh, and valued at 2017 VCR)
Preferred network solution Indicative annual cost of preferred network solution
Potentially feasible non-network solutions
network solution (using
2017 VCR)
10th percentile demand forecast
50th percentile demand forecast
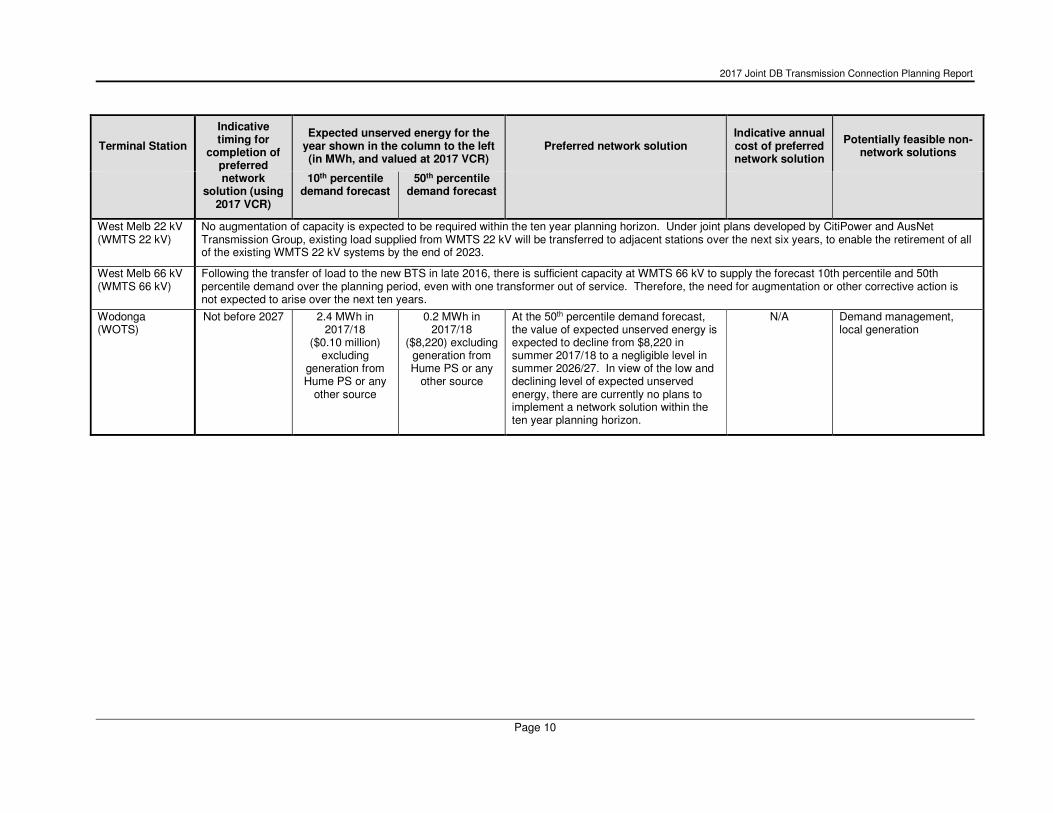
West Melb 22 kV (WMTS 22 kV)
No augmentation of capacity is expected to be required within the ten year planning horizon. Under joint plans developed by CitiPower and AusNet Transmission Group, existing load supplied from WMTS 22 kV will be transferred to adjacent stations over the next six years, to enable the retirement of all of the existing WMTS 22 kV systems by the end of 2023.
West Melb 66 kV (WMTS 66 kV)
Following the transfer of load to the new BTS in late 2016, there is sufficient capacity at WMTS 66 kV to supply the forecast 10th percentile and 50th percentile demand over the planning period, even with one transformer out of service. Therefore, the need for augmentation or other corrective action is not expected to arise over the next ten years.
Wodonga (WOTS)
Not before 2027 2.4 MWh in 2017/18
($0.10 million) excluding
generation from Hume PS or any
other source
0.2 MWh in 2017/18
($8,220) excluding generation from Hume PS or any
other source
At the 50th percentile demand forecast, the value of expected unserved energy is expected to decline from $8,220 in summer 2017/18 to a negligible level in summer 2026/27. In view of the low and declining level of expected unserved energy, there are currently no plans to implement a network solution within the ten year planning horizon.
N/A Demand management, local generation
2017 Joint DB Transmission Connection Planning Report
Page 11
DP
TS
2017 Joint DB Transmission Connection Planning Report
Page 12
1 INTRODUCTION AND BACKGROUND
1.1 Purpose of this report
This document sets out a joint report on transmission connection asset planning in Victoria, prepared by the five Victorian electricity Distribution Businesses (the DBs)6, in accordance with the requirements of clause 3.4 of the Victorian Electricity Distribution Code7 and clause 5.13.2 of the National Electricity Rules (the Rules)8.
It is emphasised that this report does not present detailed investment decision analyses. Rather, the report presents a high-level indication of the expected balance between capacity and demand at each terminal station9 over the forecast period and the likely investment requirements.
Data presented in this report may indicate an emerging major constraint. Therefore, this report provides a means of identifying those terminal stations where further consultation and detailed analysis - in accordance with the Regulatory Investment Test for Transmission - is required. This report also provides preliminary information on potential opportunities to prospective proponents of alternatives to network augmentations at terminal stations where remedial action may be required. Providing this information to the market should facilitate the efficient development of network and non-network solutions to best meet the needs of customers.
1.2 Victorian joint planning arrangements for transmission connection assets
In Victoria:
• as explained in further detail in section 1.3.1 below, the DBs have responsibility for planning and directing the augmentation of the facilities that connect their distribution systems to the Victorian shared transmission network;10 and
• the Australian Energy Market Operator (AEMO) is responsible for planning and directing the augmentation of the shared transmission network.
It is noted that pursuant to Chapter 6A of the Rules, transmission connection assets are used to provide prescribed transmission services.
6 The five DBs are: Jemena Electricity Networks (Vic) Ltd, CitiPower, Powercor Australia, United
Energy, and AusNet Electricity Services Pty Ltd. AusNet Electricity Services is owned by AusNet Services, a diversified energy infrastructure business that also owns the Victorian electricity transmission system. Throughout this document “AusNet Transmission Group” refers to the transmission business of AusNet Services and “AusNet Electricity Services” refers to the electricity distribution business of AusNet Services.
7 Version 9, effective from December 2015.
8 Version 100 of the Rules was in force at the time of preparing this report.
9 A terminal station is a facility that connects a distribution network to the shared transmission network.
10 The shared transmission network is the main extra high voltage network that provides or potentially provides supply to more than a single point. This network includes all lines rated above 66 kV and main system tie transformers that operate at two or three voltage levels above 66 kV.
2017 Joint DB Transmission Connection Planning Report
Page 13
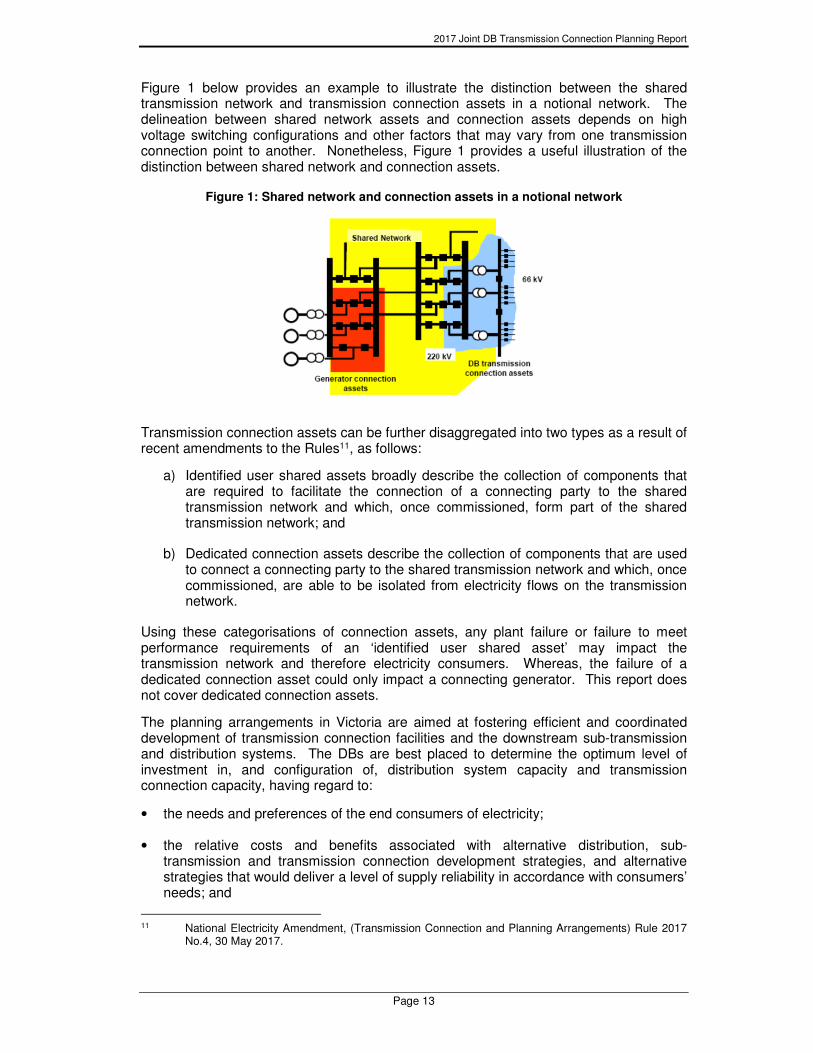
Figure 1 below provides an example to illustrate the distinction between the shared transmission network and transmission connection assets in a notional network. The delineation between shared network assets and connection assets depends on high voltage switching configurations and other factors that may vary from one transmission connection point to another. Nonetheless, Figure 1 provides a useful illustration of the distinction between shared network and connection assets.
Figure 1: Shared network and connection assets in a notional network
Transmission connection assets can be further disaggregated into two types as a result of recent amendments to the Rules11, as follows:
a) Identified user shared assets broadly describe the collection of components that are required to facilitate the connection of a connecting party to the shared transmission network and which, once commissioned, form part of the shared transmission network; and
b) Dedicated connection assets describe the collection of components that are used to connect a connecting party to the shared transmission network and which, once commissioned, are able to be isolated from electricity flows on the transmission network.
Using these categorisations of connection assets, any plant failure or failure to meet performance requirements of an ‘identified user shared asset’ may impact the transmission network and therefore electricity consumers. Whereas, the failure of a dedicated connection asset could only impact a connecting generator. This report does not cover dedicated connection assets.
The planning arrangements in Victoria are aimed at fostering efficient and coordinated development of transmission connection facilities and the downstream sub-transmission and distribution systems. The DBs are best placed to determine the optimum level of investment in, and configuration of, distribution system capacity and transmission connection capacity, having regard to:
• the needs and preferences of the end consumers of electricity;
• the relative costs and benefits associated with alternative distribution, sub-transmission and transmission connection development strategies, and alternative strategies that would deliver a level of supply reliability in accordance with consumers’ needs; and
11 National Electricity Amendment, (Transmission Connection and Planning Arrangements) Rule 2017
No.4, 30 May 2017.
2017 Joint DB Transmission Connection Planning Report
Page 14
• the incentives and penalties faced by the DBs in relation to the reliability of their distribution networks and the transmission connection facilities that they plan.
The transmission planning responsibilities of AEMO are set out in section 50C(1) of the National Electricity (South Australia) (National Electricity Law—Australian Energy Market Operator) Amendment Act 2009. Under that act, AEMO’s functions include:
“to plan, authorise, contract for, and direct, augmentation of the declared shared network, where the declared shared network is defined as “the adoptive jurisdiction’s [in this case, Victoria’s] declared transmission system excluding any part of it that is a connection asset within the meaning of the Rules”.
In accordance with clause 5.14.1(a)(1) of the Rules, AEMO and the DBs undertake joint planning to ensure the efficient development of the shared transmission and distribution networks and the transmission connection facilities. To formalise these arrangements, the parties have agreed a Memorandum of Understanding (MoU).
The MoU sets out a framework for cooperation and liaison between AEMO and the DBs with regard to the joint planning of the shared network and connection assets in Victoria. In particular, the MoU sets out the approach to be applied by AEMO and the DBs in the assessment of options to address limitations in a distribution network where one of the options consists of investment in dual function assets or transmission investment, including connection assets and the shared transmission network. Under the MoU, the DBs and AEMO have agreed that subject to the thresholds set out in the Rules, joint planning projects should be assessed by applying the Regulatory Investment Test for Transmission.
The DBs also liaise regularly with AusNet Transmission Group to coordinate their transmission connection augmentation plans with AusNet Transmission Group’s asset renewal and replacement plans12.
1.3 DBs’ obligations as transmission connection planners
1.3.1 Victorian regulatory instruments
Clause 14 of each DB’s Distribution Licence states:
“The Licensee is responsible for planning, and directing the augmentation of, transmission connection assets to assist it to fulfil its obligations [to offer connection services and supply to customers] under clause 6.”
The licence defines “transmission connection assets” as:
“those parts of an electricity transmission network which are dedicated to the connection of customers at a single point, including transformers, associated switchgear and plant and equipment.”
12 AusNet Transmission Group’s current asset replacement program is published by AEMO alongside
the Victorian Annual Planning Review, which is available from: http://www.aemo.com.au/-/media/Files/Electricity/NEM/Planning_and_Forecasting/VAPR/2017/2017-VICTORIAN-ANNUAL-PLANNING-REPORT.pdf. AusNet Transmission Group’s Asset Renewal Plan is available from: http://www.aemo.com.au/-/media/Files/Electricity/NEM/Planning_and_Forecasting/VAPR/2017/AusNet-Services-2017-asset-renewal-plan.pdf
2017 Joint DB Transmission Connection Planning Report
Page 15
In accordance with their obligations under clause 3.1(b) of the Victorian Electricity Distribution Code, the DBs plan and direct the augmentation of the transmission connection assets in a way which minimises costs to customers taking into account distribution losses and transmission losses.
Clause 3.4 of the Victorian Electricity Distribution Code states:
“3.4.1 Together with each other distributor, a distributor must submit to the Commission a joint annual report called the ‘Transmission Connection Planning Report’ detailing how together all distributors plan to meet predicted demand for electricity supplied into their distribution networks from transmission connections over the following ten calendar years.
3.4.2 The report must include the following information:
• the historical and forecast demand from, and capacity of, each transmission connection;
• an assessment of the magnitude, probability and impact of loss of load for each transmission connection;
• each distributor’s planning standards;
• a description of feasible options for meeting forecast demand at each transmission connection including opportunities for embedded generation and demand management and information on land acquisition where the possible options are constrained by land access or use issues;
• the availability of any contribution from each distributor including where feasible, an estimate of its size, which is available to embedded generators or customers to reduce forecast demand and defer or avoid augmentation of a transmission connection; and
• where a preferred option for meeting forecast demand has been identified, a description of that option, including its estimated cost, to a reasonable level of detail.
3.4.3 Each distributor must publish the Transmission Connection Planning Report on its website and, on request by a customer, provide the customer with a copy. The distributor may impose a charge (determined by reference to its Approved Statement of Charges) for providing a customer with a copy of the report.”
The Victorian Electricity Distribution Code was amended in March 2008 to include an additional provision (clause 3.1A) relating to the security of supply of the Melbourne CBD. This provision describes the circumstances in which the Melbourne CBD distributor (currently CitiPower) is required to prepare a CBD security of supply upgrade plan and also sets out the required scope of that plan. In particular, the CBD security of supply upgrade plan must:
• specify strengthened security of supply objectives for the Melbourne CBD and a date or dates by which those objectives must be met;
• specify the capital and other works proposed by the Melbourne CBD distributor in order to achieve the security of supply objectives for the Melbourne CBD that are specified in the plan; and
• meet the regulatory test (which is discussed in further detail in section 1.3.2 below).
2017 Joint DB Transmission Connection Planning Report
Page 16
This provision establishes a separate planning process that applies to the network supplying the Melbourne CBD only. Details of the CBD security of supply upgrade plan are available from CitiPower’s website at the following address:
http://www.citipower.com.au/Electricity_Networks/CitiPower_Network/CBDSupply/
The upgrade will protect Melbourne's electricity supply from a prolonged blackout should there be major failures (i.e. the loss of two or more 66 kV subtransmission elements) within the electricity networks supplying the CBD and inner Melbourne area.
1.3.2 National Electricity Rules
Part B of Chapter 5 of the Rules13 sets out provisions governing the planning and development of networks. These provisions require, amongst other things, Transmission and Distribution Network Service Providers to:
• prepare and publish annual planning reports;
• consult with interested parties on the possible options, including but not limited to demand side options, generation options and market network service options to address any projected network limitations; and
• undertake analysis of proposed network investments using the Regulatory Investment Test for Distribution or the Regulatory Investment Test for Transmission, as appropriate.
As noted in section 1.2, the DBs and AEMO have agreed that joint planning projects involving transmission connection and distribution investment should be assessed by applying the Regulatory Investment Test for Transmission (RIT-T).
Clause 5.13.2 of the Rules requires Distribution Network Service Providers to publish a Distribution Annual Planning Report (DAPR). The DAPR must contain the information specified in schedule 5.8 of the Rules, unless that information is provided in accordance with jurisdictional electricity legislation14.
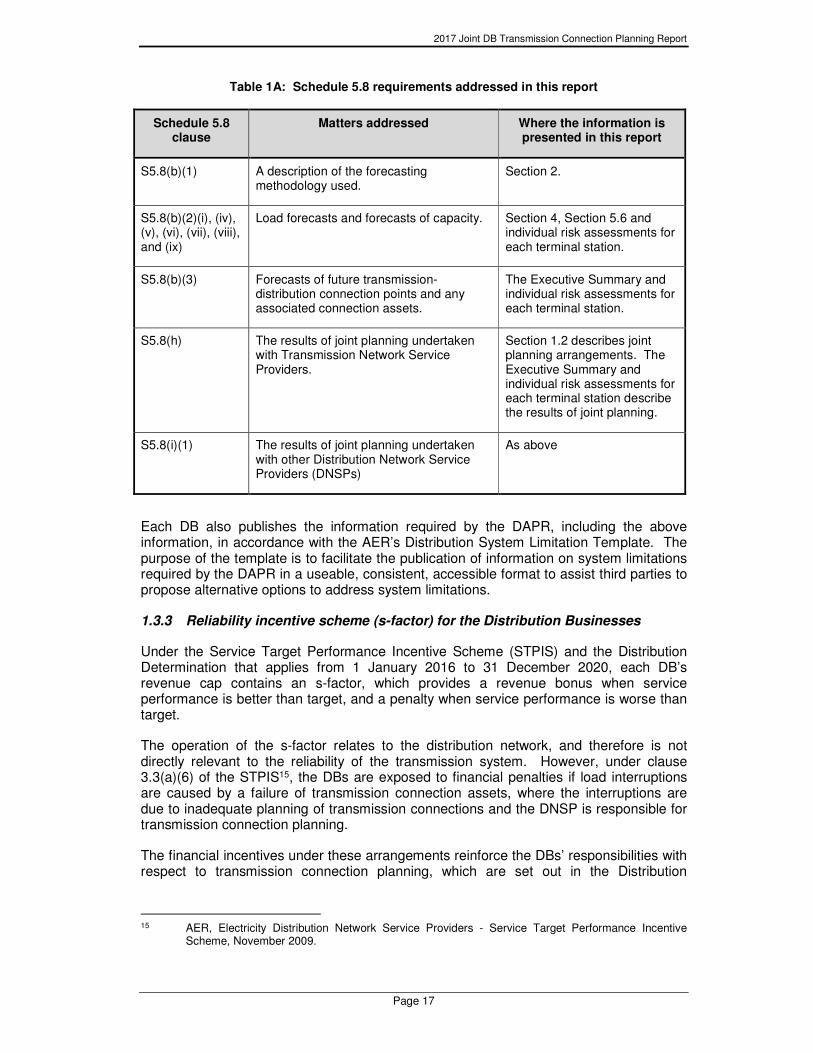
Pursuant to clause 5.13.2(d) of the Rules, this Transmission Connection Planning Report presents all of the information on transmission connection planning required under schedule 5.8. The table below lists the relevant clause of schedule 5.8, and provides a cross reference to the section of this report where the required information is presented in relation to the transmission-distribution connection points.
13 Version 100 of the Rules was in force at the time of preparing this report.
14 Clause 5.13.2(d) of the Rules states: “a Distribution Network Service Provider is not required to include in its Distribution Annual Planning Report information required in relation to transmission-distribution connection points if it is required to do so under jurisdictional electricity legislation.”
2017 Joint DB Transmission Connection Planning Report
Page 17
Table 1A: Schedule 5.8 requirements addressed in this report
Schedule 5.8 clause
Matters addressed Where the information is presented in this report
S5.8(b)(1) A description of the forecasting methodology used.
Section 2.
S5.8(b)(2)(i), (iv), (v), (vi), (vii), (viii), and (ix)
Load forecasts and forecasts of capacity. Section 4, Section 5.6 and individual risk assessments for each terminal station.
S5.8(b)(3) Forecasts of future transmission-distribution connection points and any associated connection assets.
The Executive Summary and individual risk assessments for each terminal station.
S5.8(h) The results of joint planning undertaken with Transmission Network Service Providers.
Section 1.2 describes joint planning arrangements. The Executive Summary and individual risk assessments for each terminal station describe the results of joint planning.
S5.8(i)(1) The results of joint planning undertaken with other Distribution Network Service Providers (DNSPs)
As above
Each DB also publishes the information required by the DAPR, including the above information, in accordance with the AER’s Distribution System Limitation Template. The purpose of the template is to facilitate the publication of information on system limitations required by the DAPR in a useable, consistent, accessible format to assist third parties to propose alternative options to address system limitations.
1.3.3 Reliability incentive scheme (s-factor) for the Distribution Businesses
Under the Service Target Performance Incentive Scheme (STPIS) and the Distribution Determination that applies from 1 January 2016 to 31 December 2020, each DB’s revenue cap contains an s-factor, which provides a revenue bonus when service performance is better than target, and a penalty when service performance is worse than target.
The operation of the s-factor relates to the distribution network, and therefore is not directly relevant to the reliability of the transmission system. However, under clause 3.3(a)(6) of the STPIS15, the DBs are exposed to financial penalties if load interruptions are caused by a failure of transmission connection assets, where the interruptions are due to inadequate planning of transmission connections and the DNSP is responsible for transmission connection planning.
The financial incentives under these arrangements reinforce the DBs’ responsibilities with respect to transmission connection planning, which are set out in the Distribution
15 AER, Electricity Distribution Network Service Providers - Service Target Performance Incentive
Scheme, November 2009.
2017 Joint DB Transmission Connection Planning Report
Page 18
Licences and the Victorian Electricity Distribution Code as explained in section 1.3.1 above.
1.3.4 Role of transmission connection asset owners in delivering connection services
With the exception of the connection assets at the Deer Park terminal station, the transmission assets that provide DB connection services are located within terminal stations which are owned, operated, and maintained by AusNet Transmission Group16. Connection services are provided by the owners of the transmission connection assets in accordance with their connection agreements with the relevant DBs. These agreements set out, amongst other things, the standard of connection services to be provided.
In addition, the revenue caps applying to AusNet Transmission Group and TransGrid contain a Service Target Performance Incentive Scheme (STPIS), in accordance with clause 6A.7.4 of the National Electricity Rules. The STPIS aims to balance the incentive to minimise expenditure against the benefits of improving reliability for customers, by providing the transmission connection asset owners with a financial incentive to improve service performance.
1.4 Matters to be addressed by proponents of non-network alternatives
One of the purposes of this document is to provide information to proponents of non-network solutions (such as embedded generation or demand management) regarding emerging network constraints. As noted in further detail in Chapter 2 below, the DBs aim to develop their networks and the associated transmission connection assets in a manner that minimises total costs (or maximises net economic benefit). To this end, proponents of non-network solutions to the emerging network constraints identified in this report are encouraged to lodge expressions of interest with the relevant DB(s).
Proponents of non-network proposals should make initial contact with the relevant DB as soon as possible, to ensure that sufficient time is available to the DB to fully assess feasible network and non-network potential solutions, having regard to the lead times associated with the evaluation, planning and implementation of various options. Indicative timeframes for the network solutions are provided in the table in the Executive Summary.
To assist in the assessment of non-network solutions, proponents are invited to make a detailed submission to the relevant DB. This submission should be informed by earlier discussions with the relevant DB, and should include all of the following details about the proposal:
(a) proponent name and contact details;
(b) a detailed description of the proposal;
(c) electrical layout schematics;
(d) a firm nominated site;
(e) capacity in MW to be provided and number of units to be installed (if applicable);
16 The connection assets at Deer Park Terminal Station were commissioned in September 2017, and
are owned, operated and maintained by TransGrid.
2017 Joint DB Transmission Connection Planning Report
Page 19
(f) fault level contribution, load flows, and stability studies (if applicable);
(g) a commissioning date with contingency specified;
(h) availability and reliability performance benchmarks;
(i) network interface requirements (as agreed with the relevant DBs);
(j) the economic life of the proposal;
(k) banker / financier commitment;
(l) proposed operational and contractual arrangements that the proponent would be prepared to enter into with the relevant DBs;
(m) any special conditions to be included in a contract with the responsible DBs; and
(n) evidence of a planning application having been lodged, where appropriate.
All proposals must satisfy the requirements of any applicable Codes and Regulations.
In addition, as a general rule of thumb, any network reinforcement costs required to accommodate the non-network solution will typically be borne by the proponent(s) of the non-network project. Some non-network alternatives such as embedded generation may raise issues relating to fault level control. In particular, connection of additional embedded generators will result in an increase in fault levels. Therefore, fault level mitigation measures may be required because of the installation of embedded generation, in which case it would be equitable and efficient for the proponents of such projects to bear the costs of fault level mitigation works.
1.5 Implementing Transmission Connection Projects
In the absence of any commitment by interested parties to offer non-network solutions such as embedded generation or demand side management, the process to implement the preferred network solution will commence. A brief description of the implementation process for network solutions and the issues involved is presented below.
1.5.1 Land Acquisition
Network solutions may require land acquisition. The process of land acquisition for new terminal stations may be complex especially in metropolitan areas. A detailed consideration of land acquisition issues and processes is beyond the scope of this document.
A limited number of vacant sites, currently owned by AusNet Transmission Group, have been reserved for possible future terminal station development in Victoria. DBs would need to seek AusNet Transmission Group’s consent to use any reserved land for transmission connection development.17
The granting of a town planning permit on lands reserved for future terminal station development is by no means certain. In some municipalities, town planning approval may also be required for network augmentation on existing developed sites.
17 Electricity Industry Guideline No. 18 (Augmentation and Land Access Guidelines) issued by the ESC
on 1 April 2005 may govern access to such sites, in some circumstances. See: http://www.esc.vic.gov.au/document/energy/25292-guideline-18-final-guidelines-2005/
2017 Joint DB Transmission Connection Planning Report
Page 20
1.5.2 Connection Application to AEMO
Where a network solution requires new connection points with the shared transmission network to be established, a connection agreement with AEMO is required in accordance with clause 5.3 (Establishing or Modifying Connection) of the National Electricity Rules. As noted in section 1.2, the assets that form part of the Victorian shared transmission network fall under the planning jurisdiction of AEMO. Hence, issues associated with 220 kV switching arrangements and connection to the shared transmission system would be clarified with AEMO at the connection application stage. It is also noted that AEMO’s requirements regarding new connections must be finalised through a joint planning process involving AEMO and the relevant DBs. These activities can increase the lead time for delivery of projects by some months.
For augmentations to existing connection points, a connection application to AEMO may be required so that the effect on the shared transmission network, if any, can be taken into consideration. In some cases, AEMO and the relevant DBs may undertake a public consultation process in relation to the proposed development, in addition to the consultation processes that must be undertaken if the RIT-T applies. Similar to new connections, AEMO’s requirements regarding any augmentation of shared transmission network assets must be finalised through a joint planning process involving AEMO and the relevant DBs.
A more detailed overview of the Victorian transmission connections process is available from AEMO’s web page at: https://www.aemo.com.au/Electricity/National-Electricity-Market-NEM/~/link.aspx?_id=8F98AAFA209C481E96617AFFCC30C88B&_z=z.
1.5.3 Connection Application to AusNet Transmission Group
It is most likely that establishment of new transmission connections, or augmentation of existing transmission connections will require interface to transmission assets owned by AusNet Transmission Group. In accordance with AusNet Transmission Group’s negotiating framework, an initial “Connection Inquiry” outlining the broad scope of service sought should be submitted to AusNet Transmission Group, followed by a “Connection Application” when the scope of the service has been accurately defined in consultation with AEMO and the relevant DB(s).
1.5.4 Town Planning Permit
For greenfield sites, DBs may need to engage the services of experienced town planning consultants, because very extensive planning requirements are usually laid down by local planning authorities. In most cases, the town planning permit application would need to be accompanied by extensive supporting documents such as:
• flora and fauna study;
• archaeological and cultural assessment;
• noise study;
• electromagnetic field (EMF) assessment;
• traffic analysis;
• layouts and elevation plans; and
• landscaping and fencing plans.
2017 Joint DB Transmission Connection Planning Report
Page 21
The choice of appropriate town planning consultants is very important, as they may need to provide expert witness statements to the Victorian Civil and Administrative Tribunal (VCAT) if objections to the transmission connection application are received. Due to the possibility of simultaneous shared network development by AEMO on the same site, it may become necessary to invite AEMO to participate in the town planning process at the same time so that both the council and the public are made aware of the entire proposed development on the site.
For augmentation to existing transmission connection assets, the requirement for a town planning permit varies from council to council, and depends on the extent of the proposed work. AusNet Transmission Group is likely to be the initiator of the planning permit application for augmentation work at an existing terminal station.
1.5.5 Public Consultation Strategy
A key aspect of the public consultation strategy is the positive engagement of various stakeholders in the project from the initial stages of the development. The strategy may include:
• distribution of leaflets that provide information on the proposal in clear, concise, non-technical language to every nearby resident;
• presentations to the councillors of the local municipality and the local members of parliament; and
• public consultation such as display stands in local shopping centres to highlight the need for such a project and the resultant benefits to the community, and invitation of public comments on the proposal.
Feedback from stakeholders is then considered in the design of the transmission connection work to ensure the resultant project is acceptable to the local community.
1.5.6 Project Implementation
As noted in section 1.3.1, the DBs are required by the Victorian Electricity Distribution Code to augment the transmission connections in a way which minimises costs to customers. This can be achieved by a variety of means, including competitive tendering and cost benchmarking.
Transmission connection augmentation works will be arranged by the relevant DBs in accordance with the requirements of any applicable guidelines in force.
1.5.7 Project lead times
The lead-time required for the implementation of connection asset augmentation projects depends on the number of interdependent activities involved in the project, and varies from between 3 to 5 years.
The critical path activities in the delivery of such projects include the following:
• Finalisation of any requirements for shared network augmentation due to planned connection asset augmentation works. These requirements are assessed through the
2017 Joint DB Transmission Connection Planning Report
Page 22
joint planning process, which involves AEMO, AusNet Transmission Group and the DBs in Victoria.
• Procurement of a planning permit in relation to the proposed works. In order to obtain planning consent for proposed works, the statutory planning requirements of the local council(s) must be met, and community expectations must be addressed. For connection asset augmentations involving either major augmentations on an established site or the development of new terminal station(s) on new site(s), a period of at least 24 to 36 months is required for land planning and associated community issues to be resolved. The timely completion of this task requires effective coordination and cooperation between AEMO, AusNet Transmission Group and the DBs through the joint planning process in Victoria.
• After completing the above two tasks successfully, the next important tasks are:
• finalisation of the scope of works;
• preparation of cost estimates (including invitation to tender if the project is contestable); and
• finalisation and execution of all contracts and agreements between distribution and transmission network service providers after obtaining all the necessary internal business approvals.
Once the project contracts are signed, the next important task is the delivery of the project itself, including installation and commissioning of the assets into service. AusNet Transmission Group’s recent experience indicates that the lead-time required for the delivery of a connection asset augmentation involving power transformers is between 18 and 24 months. In some cases, issues identified during testing of completed units have resulted in further delays. In view of this, for planning purposes it is assumed that approximately 24 months would be required to procure, install and commission power transformers from the time that a commercial contract is signed between the parties to complete the project works.
2017 Joint DB Transmission Connection Planning Report
Page 23
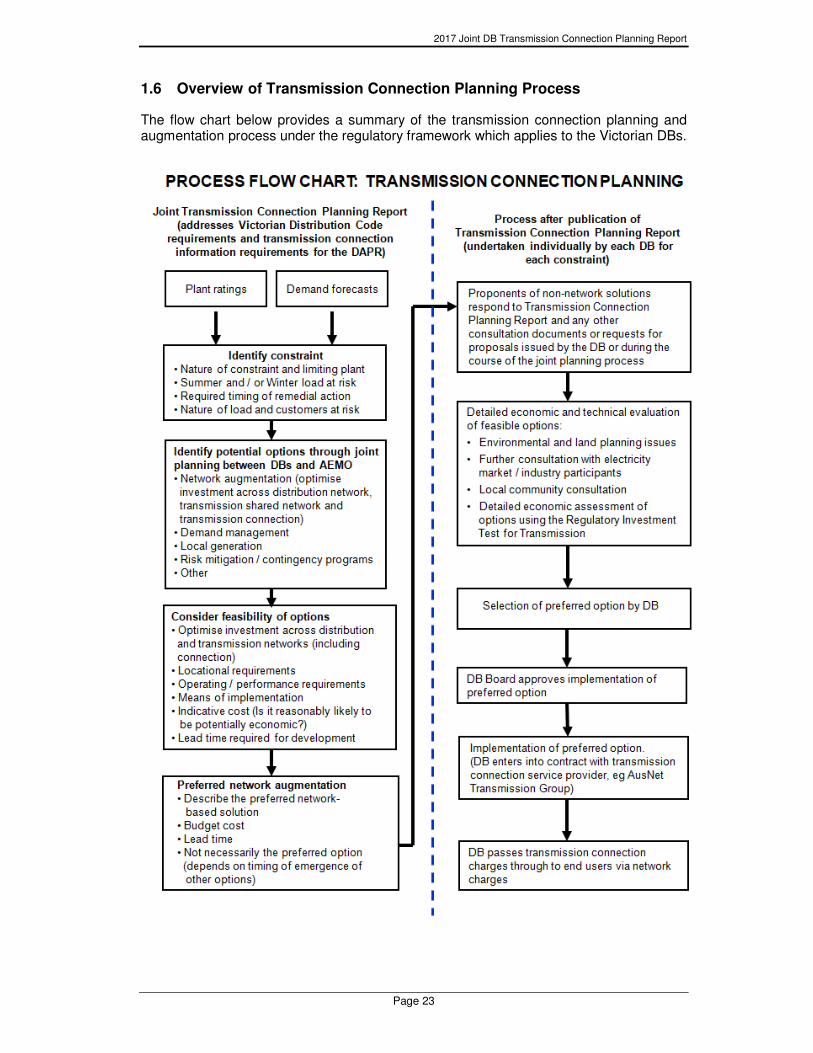
1.6 Overview of Transmission Connection Planning Process
The flow chart below provides a summary of the transmission connection planning and augmentation process under the regulatory framework which applies to the Victorian DBs.
2017 Joint DB Transmission Connection Planning Report
Page 24
2 PLANNING STANDARDS
2.1 Planning standard applying to transmission connection assets
Clause 3.4.2(c) of the Victorian Electricity Distribution Code requires this report to set out the planning standards applying to transmission connection assets. The planning standard applied by the DBs is the Regulatory Investment Test for Transmission (RIT-T), the purpose of which is set out in clause 5.16.1(b) of the Rules as follows:
“To identify the credible option that maximises the present value of net economic benefit to all those who produce, consume and transport electricity in the market (the preferred option). For the avoidance of doubt, a preferred option may, in the relevant circumstances, have a negative net economic benefit (that is, a net economic cost) where the identified need is for reliability corrective action.”
Clause 5.10.2 of the Rules defines “reliability corrective action” as follows:
“Investment by a Transmission Network Service Provider or a Distribution Network Service Provider in respect of its transmission network or distribution network for the purpose of meeting the service standards linked to the technical requirements of schedule 5.1 or in applicable regulatory instruments and which may consist of network options or non-network options.”
The terms “applicable regulatory instruments” is defined in the Rules as follows:
“All laws, regulations, orders, licences, codes, determinations and other regulatory instruments (other than the Rules) which apply to Registered Participants from time to time, including those applicable in each participating jurisdiction as listed below, to the extent that they regulate or contain terms and conditions relating to access to a network, connection to a network, the provision of network services, network service price or augmentation of a network.”
Under the definition contained in the Rules, “applicable regulatory instruments” in Victoria include:
• the Electricity Industry Act 2000 (EI Act);
• all regulations made and licences (Licences) issued under the EI Act;
• the Essential Services Commission Act 2001 (ESCV Act);
• all regulations and determinations made under the ESCV Act;
• all regulatory instruments applicable under the Licences; and
• the Tariff Order made under section 158A(1) of the Electricity Industry Act 1993 and continued in effect by clause 6(1) of Schedule 4 to the Electricity Industry (Residual Provisions) Act 1993, as amended or varied in accordance with section 14 of the Electricity Industry Act.
Further background information on the planning standard applying to transmission connection assets, and the probabilistic planning approach applied by the DBs for the purpose of evaluating net economic benefits is set out in sections 2.2 to 2.5 below.
2017 Joint DB Transmission Connection Planning Report
Page 25
2.2 Overall objective of transmission connection planning
The planning standards and criteria applied in network development are a significant determinant of network-related costs. Costs associated with transmission connection facilities can be considered to be comprised of two parts:
• the direct cost of the service (as reflected in network charges and the costs of losses); and
• indirect costs borne by customers as a consequence of supply interruptions caused by network faults and / or insufficient network capacity.
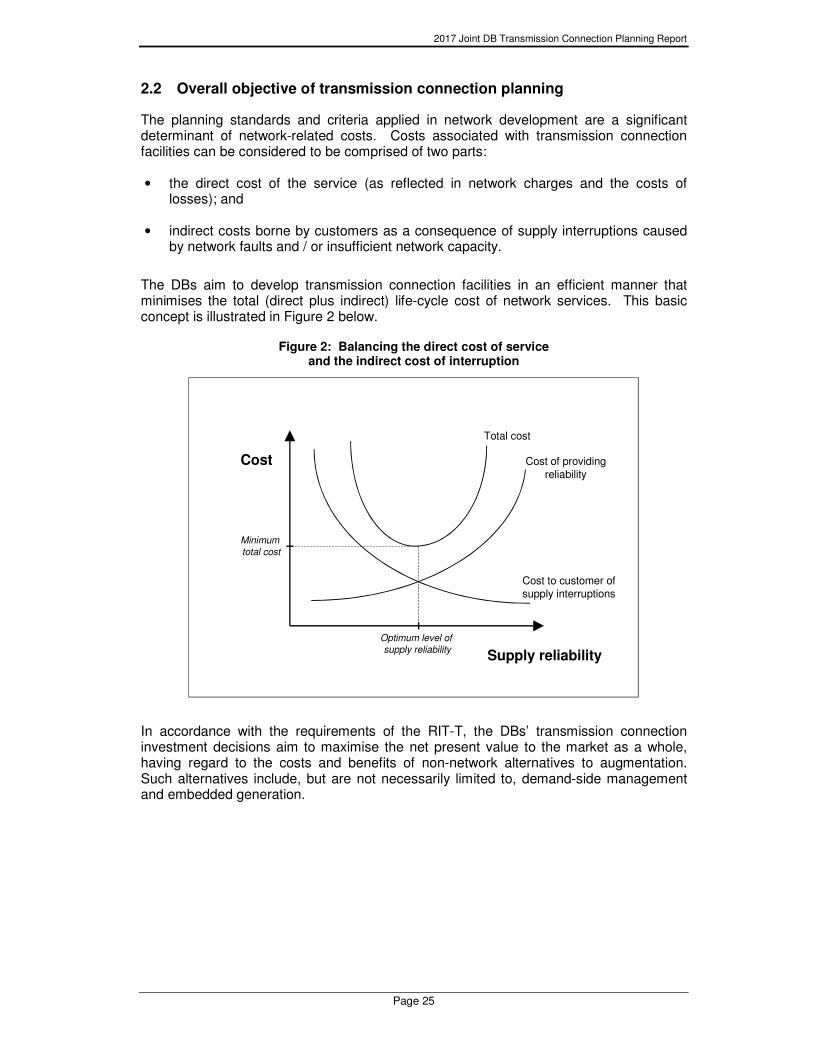
The DBs aim to develop transmission connection facilities in an efficient manner that minimises the total (direct plus indirect) life-cycle cost of network services. This basic concept is illustrated in Figure 2 below.
Figure 2: Balancing the direct cost of service and the indirect cost of interruption
In accordance with the requirements of the RIT-T, the DBs’ transmission connection investment decisions aim to maximise the net present value to the market as a whole, having regard to the costs and benefits of non-network alternatives to augmentation. Such alternatives include, but are not necessarily limited to, demand-side management and embedded generation.
Supply reliability
Cost
Cost to customer of supply interruptions
Cost of providingreliability
Total cost
Optimum level of
supply reliability
Minimum
total cost
2017 Joint DB Transmission Connection Planning Report
Page 26
2.3 Overall approach to transmission planning and investment evaluation
In Victoria, pursuant to section 50C of the National Electricity Law, AEMO applies a probabilistic approach18 to planning the shared transmission network19.
Under the probabilistic approach, deterministic standards (such as N-1) are not applied. Instead, simulation studies are undertaken to assess the amount of energy that would not be supplied if an element of the network is out of service. The application of this approach can lead to the deferral of transmission capital works that might otherwise proceed if a deterministic standard were strictly applied. This is because:
• in a network planned using the probabilistic approach, there may be conditions under which all the load cannot be supplied with a network element out of service (hence the N-1 standard is not met); however
• under these conditions, the value of the energy that is expected to be not supplied is not high enough to justify additional investment, taking into account the probability of a forced outage of a particular element of the transmission network.
However, implicit in the use of a probabilistic approach is acceptance of the risk that there may be circumstances (such as the loss of a transformer during a high demand period) when the available terminal station capacity will be insufficient to meet actual demand, and significant load shedding could be required.
In Victoria, the jurisdiction has not set deterministic standards applying to transmission connection assets. However, clause 5.2 of the Victorian Electricity Distribution Code sets out the following requirements relating to reliability of supply:
“A distributor must use best endeavours to meet targets required by the Price Determination and targets published under clause 5.1 and otherwise meet reasonable customer expectations of reliability of supply.”
In light of these considerations and the requirements of the RIT-T, the DBs apply probabilistic planning and economic investment decision analysis to transmission connection assets, subject to meeting the technical and other standards set out in the Rules and other applicable regulatory instruments including the Victorian Electricity Distribution Code.
2.4 Valuing supply reliability from the customers’ perspective
In order to determine the economically optimal level and configuration of connection capacity (and hence to deliver a level of supply reliability that will meet customers’ reasonable expectations), it is necessary to place a value on supply reliability from the perspective of customers.
18 A copy of the Victorian transmission planning criteria can be obtained from AEMO’s web site at:
http://www.aemo.com.au/-/media/Files/Electricity/NEM/Planning_and_Forecasting/Victorian_Transmission/2016/Victorian-Electricity-Planning-Approach.pdf
19 As explained in section 1, the “shared transmission network” is the Victorian transmission system, excluding the transmission facilities that connect the distribution networks (and the generators) to the high voltage network. The distribution businesses are responsible for the planning and development of the transmission facilities that connect their distribution networks to the shared transmission network. These arrangements are set out in the distribution licences issued by the ESC.
2017 Joint DB Transmission Connection Planning Report
Page 27
Estimating the marginal value to customers of reliability is inherently difficult, and ultimately requires the application of some judgement. Nonetheless, there is information available (principally, surveys designed to estimate the costs faced by customers from electricity supply interruptions) that provides a guide to the likely value.
In September 2014, AEMO published its final report on its 2013-2014 review of the Value of Customer Reliability (VCR). AEMO conducted the review at the request of the former Standing Council on Energy and Resources (SCER), now the Council of Australian Governments’ (COAG) Energy Council. AEMO’s final report explained that20:
“The VCR represents, in dollar terms, the estimated aggregated value that customers place on the reliable supply of electricity. The actual value will vary by the type of customer and the characteristics of the outages being considered. The VCR at different points on the grid would then vary based on the mix of customer types at that point. As customers cannot directly specify the value they place on reliability, the VCR plays an important role in determining the efficient level of investment in, and efficient operation and use of, electricity services required by customers in the National Electricity Market (NEM).”
AEMO’s final report summarised its findings as follows21:
“AEMO’s assessment of the survey findings includes the following:
1. Residential VCR values are similar across all NEM states.
2. The most important outage characteristics affecting residential VCR values are length of outage and whether the outage occurred at the time of the NEM daily peak.
3. Residential VCR values have not substantially changed since the 2007–08 values. However, survey feedback indicates that residential customers are concerned about the rise in electricity prices since 2007–08, which has resulted in an increased customer focus on implementing energy efficiency measures.
4. Business VCR values on average continue to be higher than the residential values, consistent with other Australian and international studies.
5. Business VCR values for the commercial and agricultural sectors are notably lower than the 2007–08 values.
6. Drivers include increased electricity costs since 2007–08 and the implementation of energy efficiency savings by businesses in these sectors.
7. Larger businesses tend to have a lower VCR value than smaller businesses, reflecting the likelihood that larger businesses are better equipped to mitigate against the impact of power outages.
8. The survey indicates the majority of residential and business customers are satisfied with their current level of reliability and consider it to be of a high standard.
9. The VCR values are broadly consistent with international and Australian VCR studies, where a similar survey methodology and approach has been used.”
20 AEMO, Value of Customer Reliability Review Final Report, September 2014, page 6. The report is
available from AEMO’s website at the following address: http://www.aemo.com.au/Electricity/Planning/Value-of-Customer-Reliability-review
21 Ibid, page 1.
2017 Joint DB Transmission Connection Planning Report
Page 28
In December 2014, AEMO published its final Application Guide on the VCR22. Section 5 of the Application Guide explains that:
• It is AEMO’s intention to conduct surveys every 5 years to estimate the VCR.
• To help maintain the currency of VCR estimates over time, AEMO considers it is appropriate to index VCR values between surveys using the Consumer Price Index (CPI).
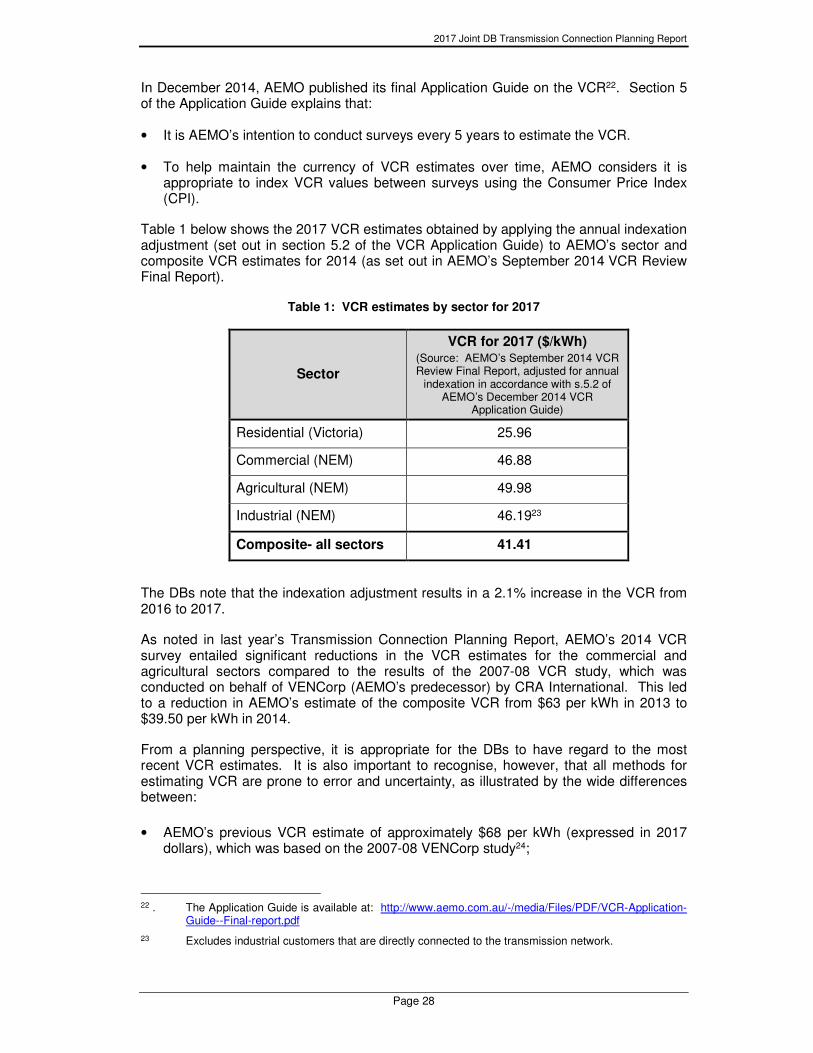
Table 1 below shows the 2017 VCR estimates obtained by applying the annual indexation adjustment (set out in section 5.2 of the VCR Application Guide) to AEMO’s sector and composite VCR estimates for 2014 (as set out in AEMO’s September 2014 VCR Review Final Report).
Table 1: VCR estimates by sector for 2017
Sector
VCR for 2017 ($/kWh) (Source: AEMO’s September 2014 VCR Review Final Report, adjusted for annual
indexation in accordance with s.5.2 of AEMO’s December 2014 VCR
Application Guide)
Residential (Victoria) 25.96
Commercial (NEM) 46.88
Agricultural (NEM) 49.98
Industrial (NEM) 46.1923
Composite- all sectors 41.41
The DBs note that the indexation adjustment results in a 2.1% increase in the VCR from 2016 to 2017.
As noted in last year’s Transmission Connection Planning Report, AEMO’s 2014 VCR survey entailed significant reductions in the VCR estimates for the commercial and agricultural sectors compared to the results of the 2007-08 VCR study, which was conducted on behalf of VENCorp (AEMO’s predecessor) by CRA International. This led to a reduction in AEMO’s estimate of the composite VCR from $63 per kWh in 2013 to $39.50 per kWh in 2014.
From a planning perspective, it is appropriate for the DBs to have regard to the most recent VCR estimates. It is also important to recognise, however, that all methods for estimating VCR are prone to error and uncertainty, as illustrated by the wide differences between:
• AEMO’s previous VCR estimate of approximately $68 per kWh (expressed in 2017 dollars), which was based on the 2007-08 VENCorp study24;
22 . The Application Guide is available at: http://www.aemo.com.au/-/media/Files/PDF/VCR-Application-
Guide--Final-report.pdf
23 Excludes industrial customers that are directly connected to the transmission network.
2017 Joint DB Transmission Connection Planning Report
Page 29
• Oakley Greenwood’s 2012 estimate of the New South Wales VCR25, of approximately $104 per kWh (expressed in 2016 prices); and
• AEMO’s 2017 Victorian VCR estimate of $41.41 per kWh.
The wide range of VCR estimates produced by these three studies is likely to reflect estimation errors and methodological differences between the studies, rather than changes in the actual value that customers place on reliability26. Moreover, the magnitude of the recent reduction in AEMO’s VCR estimates raises concerns that the investment decisions signalled by applying the most recent VCR estimate may fail to meet customers’ reasonable expectations of supply reliability.
In view of these considerations, the risk assessments presented in this report test the investment evaluation against AEMO’s previous VCR estimate. Where application of the earlier VCR estimate produces a materially different investment signal over the next five years (and hence different reliability outcomes for customers) compared to the updated estimate, the DBs will undertake further analysis. Customer consultation may also assist in determining how best to meet customers’ reasonable expectations of supply reliability in accordance with clause 5.2 of the Victorian Electricity Distribution Code.
In applying the VCR, it is also important to recognise that VCR is a composite (or weighted average) measure of customer interruption costs:
• for a wide range of different customers; and
• across a wide range of supply interruption attributes including time of day, duration, frequency, and season.
The range of sector VCR values has potentially significant implications for transmission connection investment decisions, especially where the composition of the load supplied from a constrained terminal station is dominated by a particular sector. These considerations suggest there is a case for applying sector-specific VCR values in transmission connection investment analysis, where a constraint affects a readily identifiable group of consumers. It may also be appropriate to calibrate the VCR estimate to take into account the outage scenario, as noted by AEMO27:
“[…] customer class VCRs are aggregated values derived by probability-weighting the VCR of 24 outage scenarios. However, in some cases network planning may only be concerned with specific outage scenarios (i.e. ones occurring during peak times). Then, it may be appropriate to re-weight the outage probabilities to create an aggregate customer class VCR that better reflects the outage scenarios considered. For example, where network planning identifies that an outage in peak conditions results in a loss of supply to a connection point, customer class VCRs are re-weighted by removing off-peak outage scenarios and changing peak demand scenario probabilities.
For example, consider a 22 kV underground feeder which serves residential customers only. Based on historical data, outages on this part of the network mainly occur during peak demand periods, with few occurring at other times. Further, most outages are
24 See section 2.4 of the Victorian DB’s 2013 Transmission Connection Planning Report.
25 AEMO, Value of Customer Reliability Review Appendices, Appendix G, September 2014.
26 A further source of differences in the composite VCR estimates is the estimated composition of load by sector.
27 AEMO, Value of Customer Reliability - Application Guide, Final Report, December 2014, page 9.
2017 Joint DB Transmission Connection Planning Report
Page 30
restored within three hours. Here it may be appropriate to re-weight the VCR based on revised outage probabilities that reflect actual outage times and durations.
A re-weighted residential VCR for a similar scenario may be in the range of $32/kWh, which is about 30% higher than the aggregate Victoria residential VCR value.”
In general, this report provides details of the VCR values used for each terminal station, based on the composition of station load by sector, and the sector VCR estimates provided by AEMO and set out in Table 1 above. However, in accordance with the approach outlined in AEMO’s VCR Application Guide, where it is appropriate to apply a VCR to reflect a particular outage scenario, this approach is noted in the relevant risk assessment for each terminal station.
2.5 Application of the probabilistic approach to transmission connection planning
The probabilistic planning approach involves estimating the probability of a plant outage occurring, and weighting the costs of such an occurrence by its probability to assess:
• the expected cost that will be incurred if no action is taken to address an emerging constraint,28 and therefore
• whether it is economic to augment terminal station capacity to reduce expected supply interruptions.
The quantity and value of energy at risk is a critical parameter in assessing a prospective network investment or other action in response to an emerging constraint. Probabilistic network planning aims to ensure that an economic balance is struck between:
• the cost of providing additional network capacity to remove constraints; and
• the cost of having some exposure to loading levels beyond the network’s capability.
In other words, recognising that very high loading conditions may occur for only a few hours in each year, it may be uneconomic to provide additional capacity to cover the possibility that an outage of an item of network plant may occur under conditions of very high loading. The probabilistic approach requires expenditure to be justified with reference to the expected benefits of lower volumes of unserved energy.
This approach provides a reasonable estimate of the expected net present value to consumers of terminal station augmentation for planning purposes. However, implicit in its use is acceptance of the risk that there may be circumstances (such as the loss of a transformer during a high demand period) when the available terminal station capacity will be insufficient to meet actual demand, and significant load shedding could be required. The level of investment that should be committed to mitigate that risk is ultimately a matter of judgment, having regard to:
• the results of studies of possible outcomes, and the inherent uncertainty of those outcomes;
• the potential costs and other impacts that may be associated with very low probability events, such as single or coincident transformer outages at times of peak demand,
28 The energy that would not be supplied in the event of an interruption is valued in accordance with
the approach outlined in Section 2.4 above.

2017 Joint DB Transmission Connection Planning Report
Page 31
and catastrophic plant failure leading to increased safety risk, increased risk of property damage, and/or extended periods of plant non-availability;
• the availability and technical feasibility of cost-effective contingency plans and other arrangements for management and mitigation of risk; and
• the Victorian DBs’ obligation (under clause 5.2 of the Victorian Electricity Distribution Code) to use best endeavours to meet, among other things, reasonable customer expectations of reliability of supply.
2017 Joint DB Transmission Connection Planning Report
Page 32
3 CURRENT AND EMERGING PLANNING CONSIDERATIONS
The purpose of this chapter is to outline current electricity market developments or recent events in Victoria that may have a bearing on the DBs’ transmission connection planning activities. While such matters are considered routinely in preparing this report, the DBs recognise that stakeholders may value a short discussion of recent developments and how they relate to transmission connection planning.
3.1 Electricity market changes, and the emergence of embedded generation
Electricity transmission and distribution networks play an essential role in the delivery of electricity to end consumers. In recent years, the electricity market has changed significantly. These changes follow a long period of a relatively stable energy market characterised by steady growth in consumption and demand.
The changes include:
• a decline in market-wide electricity consumption from historically high levels, with minimal growth in consumption expected over the medium term29;
• increased variability in peak demand growth rates across regions, with some regions exhibiting comparatively strong demand growth, and other regions exhibiting very low or in some cases negative demand growth;
• increased prominence of distributed and renewable generation at both the consumer end of the supply chain (for example, residential solar panels) and in the wholesale generation market (for example, wind and solar farms); and
• the development of other technologies that enable consumers to generate and store their own electricity.
The significant increase in connection applications for low carbon generation in recent years has given rise to the need for the DBs’ transmission connection planning activities to include:
• analysis and management of voltage compliance issues associated with the connection of new low carbon generation to the distribution network;
• specifying connection requirements and operating the distribution system to ensure that generating stations remain stable and connected during system disturbances;
• determining the design specifications for new transformers so that any new plant installed enables the efficient mitigation of emerging voltage management issues; and
• assessing the impacts of possible reverse power flows through transmission connection assets30.
The Government’s Victorian Renewable Energy Target is expected to be a key driver of further growth in renewable generation. The Victorian Government recently introduced
29 AEMO’s June 2017 Electricity Forecasting Insights for the National Electricity Market (page 3)
states: “Consumption of grid-supplied electricity is forecast to remain flat for the next 20 years, despite projected 30% growth in population and average growth in the Australian economy”.
30 Section 3.2 provides further information on the challenges arising from reverse power flows.
2017 Joint DB Transmission Connection Planning Report
Page 33
into parliament the Renewable Energy (Jobs and Investment) Bill 2017, which will legislate the Victorian Renewable Energy Target (VRET), to provide for renewable generation of 25 per cent by 2020 and 40 per cent by 2025.31
AEMO estimates that over 3,000 MW of new renewable generation may be constructed in Western Victoria as a result of the Victorian Government’s VRET target. In April 2017, AEMO published the first stage of a RIT-T to assess the technical and economic viability of increasing transmission network capability in Western Victoria to address the transmission constraints that are likely to arise. The second stage of the RIT-T process, full options analysis and the Project Assessment Draft Report will be completed by July 2018.
In October 2017, the Commonwealth Government announced its intention introduce a new National Energy Guarantee, the aim of which is to deliver more affordable and reliable electricity while meeting Australia’s international greenhouse gas emission commitments. The Commonwealth Government will work with the states through COAG to implement the National Energy Guarantee.
In addition to considering these developments, our planning also takes account of the specific peak demand forecasts across each region in assessing the need for transmission connection augmentation at each terminal station.
The DBs will continue to monitor the changing role of the network and the increasing contribution from distributed generation, as well as on-going energy policy developments at both the State and national levels. Our aim is to ensure that the network continues to provide cost effective and reliable services that meet the needs of all users, including low carbon generators.
3.2 Impacts of increased embedded generation on transformer ratings
Recent increases in the amount of committed and forecast new intermittent embedded generation are expected to lead to significant reverse power flows through some terminal station transformers. Reverse flows associated with substantial intermittent generation output may result in significantly increased variability of transformer loadings, increased transformer utilisation, and reduced time for transformers to cool down between periods of high loading.
AusNet Transmission Services has advised that in these circumstances, the existing cyclic ratings may no longer be applicable to these transformers because they no longer exhibit a predictable cyclic loading pattern. Instead, it may be necessary to adopt the transformer’s name plate rating (rather than the higher cyclic rating) for planning and operational purposes.
AusNet Transmission Services is currently reviewing the ratings of transformers affected by significant reverse flows. It is expected that these ratings may be reduced, which would result in potentially significant increases in load at risk at the affected stations. It is noted that some of the increased load at risk would likely be offset by the output from intermittent generation. However, it is also noted that deriving forecasts of intermittent generator output is complex, and particularly challenging given the limited data available to forecast that output at times of high demand.
31 https://www.energy.vic.gov.au/renewable-energy/victorias-renewable-energy-targets.
2017 Joint DB Transmission Connection Planning Report
Page 34
In advance of the completion of AusNet Transmission Services’ review of transformer ratings at the affected stations, the Risk Assessments in this 2017 report continue to adopt each station’s current cyclic rating.
3.3 Management of system fault levels
As noted above, there have been significant changes in the mix of generation in the Victorian power system, and across the National Electricity Market over recent years. These changes are expected to continue. The increasing proportion of non-synchronous generation (both large-scale and distributed) creates a number of operational challenges32. One such challenge is the management of changing fault levels33 across the power system.
Further changes in the generation mix in Victoria are expected in the immediate future and over the medium term, with:
• the closure of Hazelwood Power Station earlier this year;
• further increases in the connection of new low carbon generation to the network, driven by, amongst other things, the Victorian Renewable Energy Target; and
• the possible development of increased interconnector capacity.
These developments will drive further changes in fault levels across the system. The DBs are acutely aware of the need to closely monitor changes in fault levels, and to ensure that transmission connection plans take account of present and likely future changes in fault levels.
3.4 Managing the risk of transformer failure
Over the past three years, three transmission connection transformers have failed unexpectedly. In each of these cases, adverse impacts on customers have been mitigated through the installation of spare transformers that AusNet Transmission Group holds for this purpose.
AusNet Transmission Group has undertaken a study to review the current arrangements for spare transformers, and to determine the optimal number and type of spares that should be held. Further information on spare transformers is provided in section 5.5.
3.5. Maintaining security of supply during major terminal station renewals
Over recent years, AusNet Transmission Group has been undertaking an asset renewal program. As noted in more detail in the risk assessments in this report, a number of terminal station renewals have been completed, while others are planned or in progress.
32 AEMO, Consultation Paper: Material Issues and Proposed Inputs for the 2016 National
Transmission Network Development Plan, January 2016, pages 1 and 5.
33 In an electric power system, a fault or fault current is any abnormal electric current. For example, a short circuit is a fault in which current bypasses the normal load. In power systems, protective devices detect fault conditions and operate circuit breakers to protect an electrical circuit from damage caused by overload or short circuit. In order for a circuit breaker to operate safely and reliably, the current that flows in the event of a fault must be within the rating or short-circuit limits of the circuit breaker and other terminal station equipment.
2017 Joint DB Transmission Connection Planning Report
Page 35
AusNet Transmission Group’s asset renewal plan provides details of the work that is planned for the next ten years. The report can be downloaded from AEMO’s website at: http://www.aemo.com.au/-/media/Files/Electricity/NEM/Planning_and_Forecasting/VAPR/2017/AusNet-Services-2017-asset-renewal-plan.pdf.
The larger terminal station renewals require careful outage and construction sequencing to ensure security of supply to the distribution networks is not compromised. Security of supply risks can also be mitigated efficiently by planning some temporary or permanent reconfigurations of the distribution networks supplied from the terminal station.
As AusNet Transmission Group’s asset renewal program continues to progress, the DBs will continue to work collaboratively to manage the reliability risks during construction, and to minimise total costs to customers.
2017 Joint DB Transmission Connection Planning Report
Page 36
4 HISTORIC AND FORECAST DEMAND
In accordance with the requirements of clause 3.4.2 of the Victorian Electricity Distribution Code, data showing the historical and forecast demand from, and capacity of, each transmission connection are presented for each terminal station in the individual risk assessments that form part of this Transmission Connection Planning Report.
The demand forecasts used in the preparation of this report are referred to as the Victorian Terminal Station Demand Forecasts (TSDF). The TSDF report is prepared by the Victorian DBs, and is published alongside this Transmission Connection Planning Report.
As noted in last year’s Transmission Connection Planning Report, AEMO commenced publishing a separate connection point forecast report for Victoria in 2014. AEMO’s forecasts are derived from State-based aggregate demand forecasts. A copy of AEMO’s 2017 Victorian Connection Point Forecasting Report is available from its website at:
http://www.aemo.com.au/Electricity/National-Electricity-Market-NEM/Planning-and-forecasting/Transmission-Connection-Point-Forecasting/Victoria
It is noted that there are some differences between the demand forecasts in the DBs’ TSDF and AEMO’s Victorian connection point forecasts. These differences primarily reflect:
• different approaches to weather normalisation, which result in the two sets of forecasts adopting different starting points for many terminal stations; and
• AEMO’s approach to State-wide demand forecasts and its reconciliation of these to individual terminal station forecasts, which results in different forecast demand growth rates being adopted by AEMO for some terminal stations, compared to the growth rates adopted in the TSDF.
As in previous years, the DBs consider it appropriate to continue to adopt the TSDF forecasts for the purpose of preparing this Transmission Connection Planning Report. It is noted that the TSDF forecasts have been applied in all previous Transmission Connection Planning Reports.
2017 Joint DB Transmission Connection Planning Report
Page 37
5 RISK ASSESSMENT AND OPTIONS FOR ALLEVIATION OF CONSTRAINTS
5.1 Preamble
This section presents an overview of the magnitude, probability and impact of loss of load at each transmission connection, in accordance with the requirements of clause 3.4.2(b) of the Victorian Electricity Distribution Code.
The assessment presented is not a detailed planning analysis, but a high-level description of the expected balance between capacity and demand over the forecast period and the likely investment requirements. Data presented in this high-level analysis may indicate an emerging major constraint. Therefore, this high-level assessment provides a means of identifying those terminal stations where further detailed analysis of risks and options for remedial action, in accordance with the RIT-T, is required.
It is emphasised that this high-level analysis focuses on risks to supply reliability that relate to the capacity and reliability of transformers only. There are typically risks to supply reliability associated with the performance and capacity of smaller plant items. However, these smaller items involve relatively low capital expenditure, the deferral of which is unlikely to entail a sufficiently high avoided cost to justify the employment of non-network alternatives.
In addition, capital expenditure is required from time to time to address fault level issues. This expenditure is driven chiefly by mandatory health and safety standards, and does not relate to terminal station capacity, per se. Fault level issues are therefore not within the scope of this report, however, the analysis of feasible and preferred options for increasing capacity will, where appropriate have due regard to issues relating to fault level control34.
The following key data are presented in this section for each Terminal Station:
• Energy at risk: For a given demand forecast, this is the amount of energy that would not be supplied from a terminal station if a major outage35 of a transformer occurs at that station in that particular year, the outage has a mean duration of 2.6 months (as discussed in section 5.4 below), and no other mitigation action is taken. This statistic provides an indication of the magnitude of loss of load that would arise in the unlikely event of a major outage of a transformer.
• Expected unserved energy: For a given demand forecast, this is the energy at risk weighted by the probability of a major outage of a transformer. A load duration curve is used to estimate the unserved energy in each hour of the year for a major transformer outage. The estimated unserved energy for each hour is then multiplied by the probability of the outage occurring in any hour of the year. The total expected unserved energy in a year is obtained by summing the probability-weighted estimates of unserved energy for each hour of the year. This statistic provides an indication of the amount of energy, on average, that will not be supplied in a year, taking into
34 Some non-network alternatives such as embedded generation may raise issues relating to fault level
control. A further discussion of this issue is set out in Section 1.4 of this report.
35 The term “major outage” refers to an outage that has a mean duration of 2.6 months, typically due to a significant failure within the transformer. The actual duration of an individual major outage may vary from under 1 month up to 9 months. Further details are provided in section 5.4 below.
2017 Joint DB Transmission Connection Planning Report
Page 38
account the very low probability that one transformer at the station will not be available for 2.6 months because of a major outage.
Risk assessments for each individual terminal station provide estimates of energy at risk and expected unserved energy based on the 50th percentile and 10th percentile demand forecasts set out in Section 4. Consideration of energy at risk and expected unserved energy at these two demand forecast levels provides:
• an indication of the sensitivity of these two parameters to temperature variation over the peak period; and
• an indication of the level of exposure to supply interruption costs at higher demand conditions (namely, 10th percentile levels).
As already noted, this information provides an aid to identifying the likely timing of economically justified augmentations or other actions. However, the precise timing of augmentation or any other non-network solutions aimed at alleviating emerging constraints will be a matter for more detailed analysis prepared in accordance with the RIT-T requirements.
In interpreting the information set out in this report, it is important to recognise that in the case of a Summer peaking station, the 50th percentile demand forecast relates to a maximum average temperature that will be exceeded, on average, once every two years. By definition therefore, actual demand in any given year has a 50% probability of being higher than the 50th percentile demand forecast.36
5.2 Interpreting “energy at risk”
As noted above, “energy at risk” is an estimate of the amount of energy that would not be supplied if one transformer was out of service due to a major failure during the critical loading season(s), for a given demand forecast.
The capability of a terminal station with one transformer out of service is referred to as its “N minus 1” rating. The capability of the station with all transformers in service is referred to as its “N” rating. The relationship between the N and N-1 ratings of a station and the energy at risk is depicted in the diagram below.
36 Conversely, there is also a 50% chance that actual demand will be lower than the forecast in any
one year.
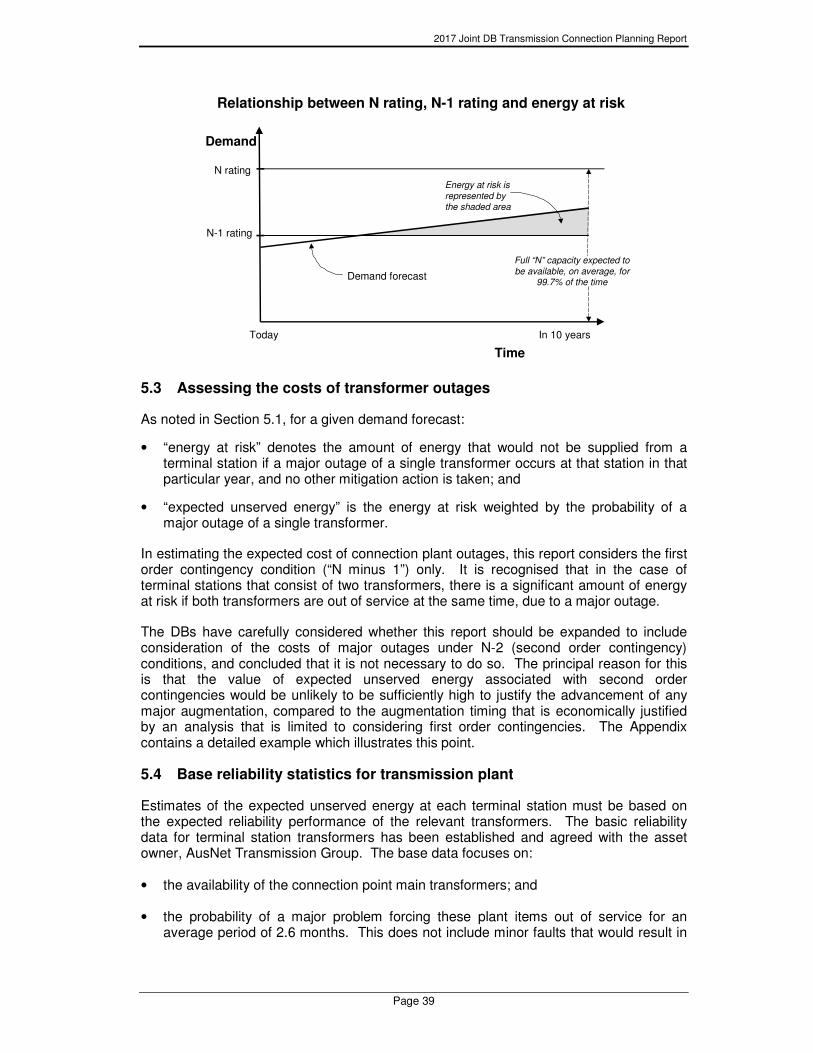
2017 Joint DB Transmission Connection Planning Report
Page 39
5.3 Assessing the costs of transformer outages
As noted in Section 5.1, for a given demand forecast:
• “energy at risk” denotes the amount of energy that would not be supplied from a terminal station if a major outage of a single transformer occurs at that station in that particular year, and no other mitigation action is taken; and
• “expected unserved energy” is the energy at risk weighted by the probability of a major outage of a single transformer.
In estimating the expected cost of connection plant outages, this report considers the first order contingency condition (“N minus 1”) only. It is recognised that in the case of terminal stations that consist of two transformers, there is a significant amount of energy at risk if both transformers are out of service at the same time, due to a major outage.
The DBs have carefully considered whether this report should be expanded to include consideration of the costs of major outages under N-2 (second order contingency) conditions, and concluded that it is not necessary to do so. The principal reason for this is that the value of expected unserved energy associated with second order contingencies would be unlikely to be sufficiently high to justify the advancement of any major augmentation, compared to the augmentation timing that is economically justified by an analysis that is limited to considering first order contingencies. The Appendix contains a detailed example which illustrates this point.
5.4 Base reliability statistics for transmission plant
Estimates of the expected unserved energy at each terminal station must be based on the expected reliability performance of the relevant transformers. The basic reliability data for terminal station transformers has been established and agreed with the asset owner, AusNet Transmission Group. The base data focuses on:
• the availability of the connection point main transformers; and
• the probability of a major problem forcing these plant items out of service for an average period of 2.6 months. This does not include minor faults that would result in
Time
Today In 10 years
N-1 rating
N rating
Demand forecast
Energy at risk is
represented bythe shaded area
Full “N” capacity expected to
be available, on average, for99.7% of the time
Relationship between N rating, N-1 rating and energy at risk
Demand
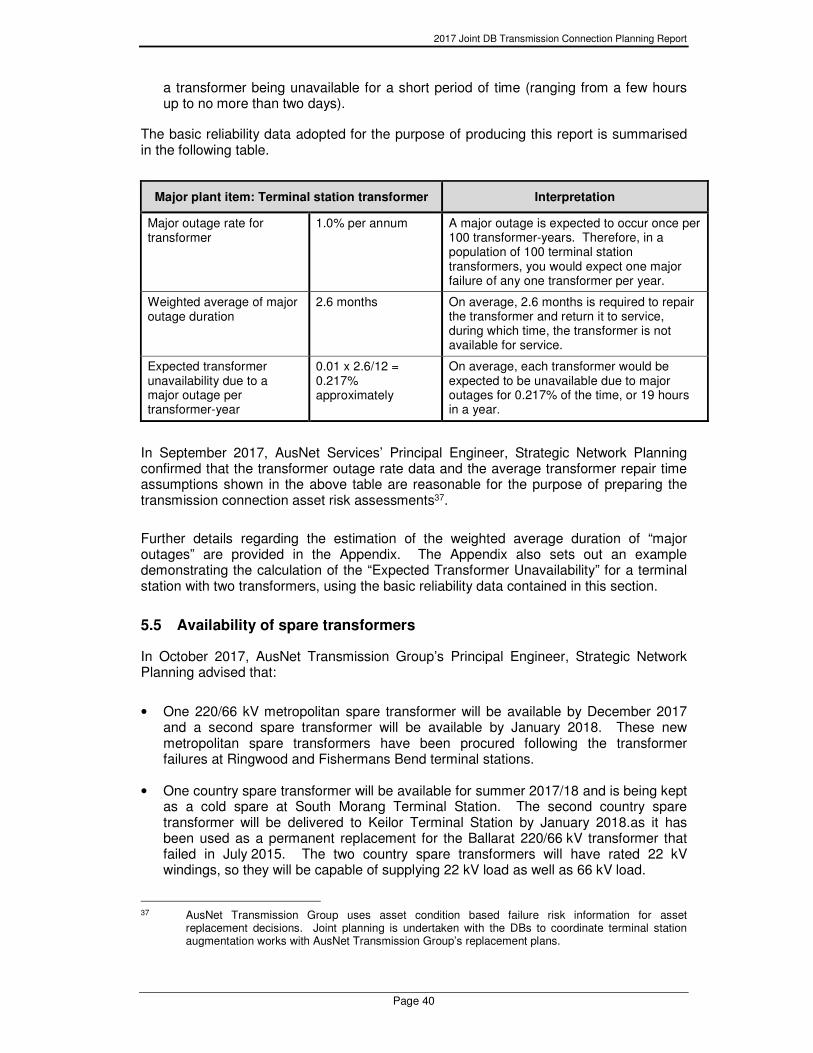
2017 Joint DB Transmission Connection Planning Report
Page 40
a transformer being unavailable for a short period of time (ranging from a few hours up to no more than two days).
The basic reliability data adopted for the purpose of producing this report is summarised in the following table.
Major plant item: Terminal station transformer Interpretation
Major outage rate for transformer
1.0% per annum A major outage is expected to occur once per 100 transformer-years. Therefore, in a population of 100 terminal station transformers, you would expect one major failure of any one transformer per year.
Weighted average of major outage duration
2.6 months On average, 2.6 months is required to repair the transformer and return it to service, during which time, the transformer is not available for service.
Expected transformer unavailability due to a major outage per transformer-year
0.01 x 2.6/12 = 0.217% approximately
On average, each transformer would be expected to be unavailable due to major outages for 0.217% of the time, or 19 hours in a year.
In September 2017, AusNet Services’ Principal Engineer, Strategic Network Planning confirmed that the transformer outage rate data and the average transformer repair time assumptions shown in the above table are reasonable for the purpose of preparing the transmission connection asset risk assessments37.
Further details regarding the estimation of the weighted average duration of “major outages” are provided in the Appendix. The Appendix also sets out an example demonstrating the calculation of the “Expected Transformer Unavailability” for a terminal station with two transformers, using the basic reliability data contained in this section.
5.5 Availability of spare transformers
In October 2017, AusNet Transmission Group’s Principal Engineer, Strategic Network Planning advised that:
• One 220/66 kV metropolitan spare transformer will be available by December 2017 and a second spare transformer will be available by January 2018. These new metropolitan spare transformers have been procured following the transformer failures at Ringwood and Fishermans Bend terminal stations.
• One country spare transformer will be available for summer 2017/18 and is being kept as a cold spare at South Morang Terminal Station. The second country spare transformer will be delivered to Keilor Terminal Station by January 2018.as it has been used as a permanent replacement for the Ballarat 220/66 kV transformer that failed in July 2015. The two country spare transformers will have rated 22 kV windings, so they will be capable of supplying 22 kV load as well as 66 kV load.
37 AusNet Transmission Group uses asset condition based failure risk information for asset
replacement decisions. Joint planning is undertaken with the DBs to coordinate terminal station augmentation works with AusNet Transmission Group’s replacement plans.
2017 Joint DB Transmission Connection Planning Report
Page 41
• Spare transformers held by AusNet Transmission Group may be used to support essential maintenance activities including refurbishment programs. Any transformer used in this way would no longer be available to replace a failed transformer.
• AusNet Transmission Group will aim to install a spare transformer to replace a unit that is subject to a long term outage within one calendar month. However, it is not possible to provide a guaranteed time for installation of the temporary replacement, because the particular circumstances of each transformer failure will determine the replacement timeframe.
• There is a small number of AusNet Transmission Group stations for which a stock of spare transformers is not held. These stations are the metropolitan 220/22 kV connection stations (being Ringwood, Brunswick, Richmond, West Melbourne and Brooklyn) and Wodonga 330/66/22 kV Terminal Station. For the metropolitan stations, an in-service ‘hot’ spare is provided by one of the 220/22 kV transformers at Brunswick. The timeframes for deploying the ‘hot’ spare are likely to exceed one calendar month. In the case of Wodonga 330/66/22 kV Terminal Station, the energy at risk does not warrant the procurement of a dedicated spare transformer.
In the case of Deer Park Terminal Station (which is owned and operated by TransGrid), total load at this two-transformer station is not expected to exceed the rating of a single transformer until 2024. It is therefore considered acceptable during the period prior to 2024 to operate the station without procuring further backup capacity. This approach is reviewed annually.
The risk analysis in this report assumes that a spare transformer will not be available if an existing transformer fails. The DBs regard this assumption as appropriately conservative, as there can be no guarantee that a spare will be available. As explained in section 5.4, the risk analysis assumes that the average outage duration is 2.6 months, which is the estimated repair time for a major failure of a transformer.
5.6 Treatment of Load Transfer Capability
Many terminal stations have some capability to transfer load from one station to adjacent ones using the distribution network. The amount of load that can be transferred varies from minimal amounts at most country terminal stations to significant amounts at some urban terminal stations. Some load transfers are able to be made at 66 kV and/or 22 kV and lower voltage levels.
In the event of a transformer failure at a terminal station, load could be transferred away (where short-term transfer capability is available) and this would reduce the unserved energy and the impact of an outage. The risk assessments presented in this planning report assume normal network operating conditions, and therefore they show estimates of load at risk and expected unserved energy before any potential short-term load transfers. The reasons for this approach are:
• There is no guarantee that capacity will be available at an adjacent terminal station to accept load transfers, due to uncertainty of the availability of transformation capacity at that station.
• The capability of the distribution network to affect load transfers is always changing. It will vary depending on network loading conditions and is usually at a minimum during peak demand times. The transfer capability can also be adversely affected by
2017 Joint DB Transmission Connection Planning Report
Page 42
any abnormal configurations which may be implemented from time to time to manage power flows across the distribution network.
• Implementing short term transfers places the network in a suboptimal operating condition, thereby increasing operational risks. As already noted, the network planning studies presented in this report evaluate load at risk for a single contingency under otherwise normal network operating conditions. This approach accords with sound network planning practices.
The one exception to this approach is Wemen Terminal Station, which is the only single transformer station considered in this report. Wemen was planned on the basis that some load transfer capability at 66 kV would be available to Red Cliffs Terminal Station (RCTS 66) in the event of a transformer outage at Wemen. Accordingly, the risk assessment for Wemen takes into account the load forecasts for RCTS 66 and an assessment of the post-contingent load transfer capability.
For the other stations where there is short-term load transfer capability available, the relevant risk assessment identifies load transfer as an operational solution to mitigate the severity of a major outage.
5.7 Detailed risk assessments and options for alleviation of constraints, by terminal station
Set out on the following pages are the detailed risk assessments and a description of the options available for alleviation of constraints, for each individual terminal station. The assessments, by station, are set out in alphabetical order. For each station, the network augmentation requirements (if any) and the estimated annual costs of the augmentation works are identified. This cost estimate provides a broad indication of the maximum potential value available to proponents of non-network solutions in deferring or avoiding network augmentation.
However, it should be noted that the value of a non-network solution depends on the extent to which it defers or avoids a network augmentation, and the expected timing of the network augmentation. For example, a non-network solution that defers a network augmentation from 2021 to 2024 is less valuable today than one which defers a similar network augmentation from, say, 2018 to 2021. These issues should be considered by proponents of non-network solutions in assessing the implications of this report.
In addition, any potential proponents of non-network solutions to emerging constraints should note that the lead time for completion of a major network augmentation (such as the development of a new station, or the installation of a new transformer) can easily be up to two to three years, taking into account the need to obtain local authority planning consent38. In view of this consideration, the individual risk assessment commentaries for each terminal station will:
• identify the estimated lead time for delivery of the preferred network solution; and/or
• identify the latest date by which the relevant DB(s) will generally require a firm commitment from proponents of non-network alternatives, in order to be confident that the network augmentation can be displaced or deferred without compromising supply reliability in the future.
38 Section 1.5 provides a more detailed description of the processes and timeframes involved in
implementing transmission connection projects.
2017 Joint DB Transmission Connection Planning Report
Page 43
5.8 Interpreting the dates shown in the risk assessments
All charts and tables in the following risk assessments present data on a calendar year basis. However, the narrative within some of the risk assessments may refer to composite years; for instance “2018/19”, or “summer of 2018/19”.
References to composite years may be made in risk assessments relating to summer peaking stations. In these cases, the peak annual demand would typically be expected to occur around mid to late summer (that is, early in the calendar year, say, from late January to March).
Therefore, where a risk assessment refers to a peak demand occurring in a composite year (such as 2018/19, for instance), the peak would typically be expected to occur in the second year (in this example, 2019), and the relevant data for 2018/19 would be shown in the accompanying tables and charts as 2019.
2017 Joint DB Transmission Connection Planning Report
Page 44
APPENDIX: ESTIMATION OF BASIC TRANSFORMER RELIABILITY DATA AND EXAMPLE OF EXPECTED TRANSFORMER UNAVAILABILITY CALCULATION
1. Estimation of basic transformer reliability data
The basic transformer reliability data adopted for the risk assessment is estimated as follows:
Based on historic data, a major outage is expected to occur once per 100 transformer-years (reflecting a 1% per annum failure rate). Therefore, in a population of 100 transformers, you would expect one major failure of any one transformer per year.
The mean duration of a major failure is derived from the following data:
PROPORTION OF MAJOR FAILURES
MEAN OUTAGE DURATION
Costly Major Failures39 0.4 of failures 5.0 months
Other Major Failures 0.6 of failures 1.0 month
Mean duration of a major failure = (0.4*5.0 months) + (0.6*1.0 month) = 2.6 months
2. Sample of expected transformer unavailability calculation
This appendix sets out an example demonstrating the calculation of the “Expected Transformer Unavailability” for a terminal station with two transformers, using the basic reliability data contained in Section 5.4.
Expected transformer unavailability due to major outage per transformer-year (Refer to Section 5.4 for the base reliability statistics)
A 0.217%
Number of transformers B 2
Expected unavailability of one transformer (probability of being in state N-1)
C=A*B 0.434%
Expected unavailability of both transformers (probability of being in state N-2)40
D=A*A 0.00047%
39 The costly major failures are those that would result in repair costs greater than 2% of the
replacement value of the failed transformer, with a relatively long duration of outage for repair.
40 The coincident outages of two transformers are considered to be “independent events”. This means that the failure of one transformer is assumed to not affect the availability of the other.
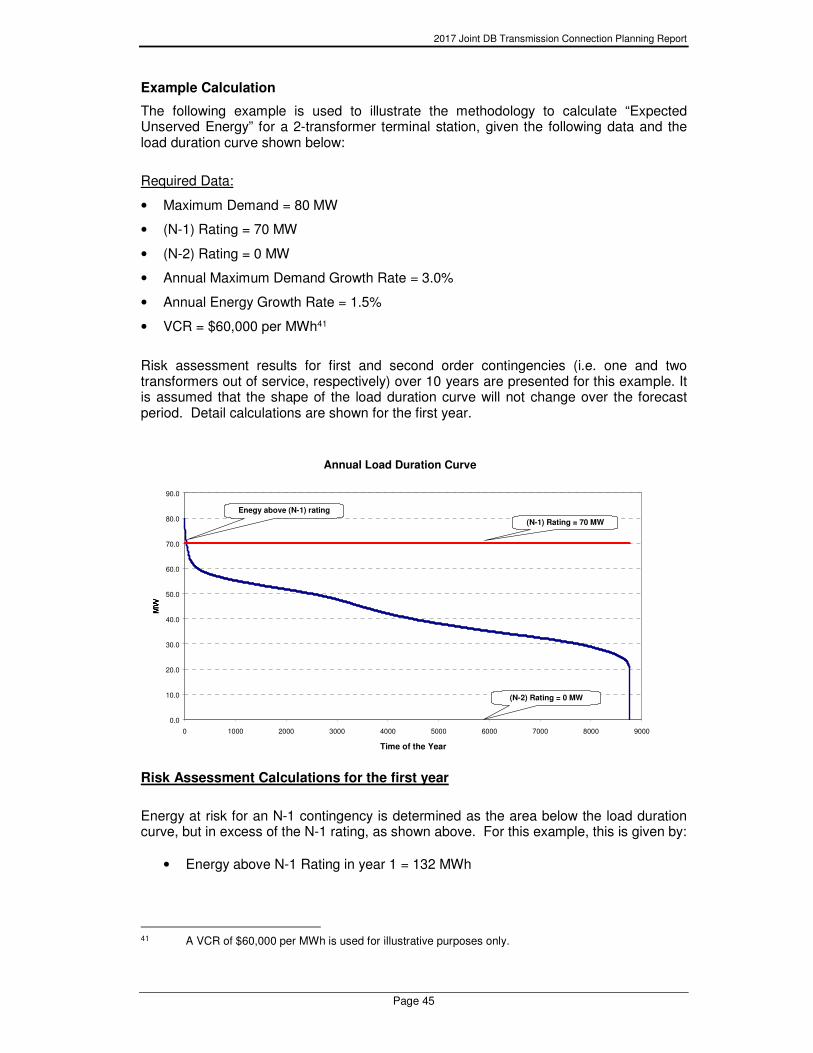
2017 Joint DB Transmission Connection Planning Report
Page 45
Example Calculation
The following example is used to illustrate the methodology to calculate “Expected Unserved Energy” for a 2-transformer terminal station, given the following data and the load duration curve shown below:
Required Data:
• Maximum Demand = 80 MW
• (N-1) Rating = 70 MW
• (N-2) Rating = 0 MW
• Annual Maximum Demand Growth Rate = 3.0%
• Annual Energy Growth Rate = 1.5%
• VCR = $60,000 per MWh41
Risk assessment results for first and second order contingencies (i.e. one and two transformers out of service, respectively) over 10 years are presented for this example. It is assumed that the shape of the load duration curve will not change over the forecast period. Detail calculations are shown for the first year.
Risk Assessment Calculations for the first year
Energy at risk for an N-1 contingency is determined as the area below the load duration curve, but in excess of the N-1 rating, as shown above. For this example, this is given by:
• Energy above N-1 Rating in year 1 = 132 MWh
41 A VCR of $60,000 per MWh is used for illustrative purposes only.
Annual Load Duration Curve
0.0
10.0
20.0
30.0
40.0
50.0
60.0
70.0
80.0
90.0
0 1000 2000 3000 4000 5000 6000 7000 8000 9000
Time of the Year
(N-1) Rating = 70 MW
(N-2) Rating = 0 MW
Enegy above (N-1) rating
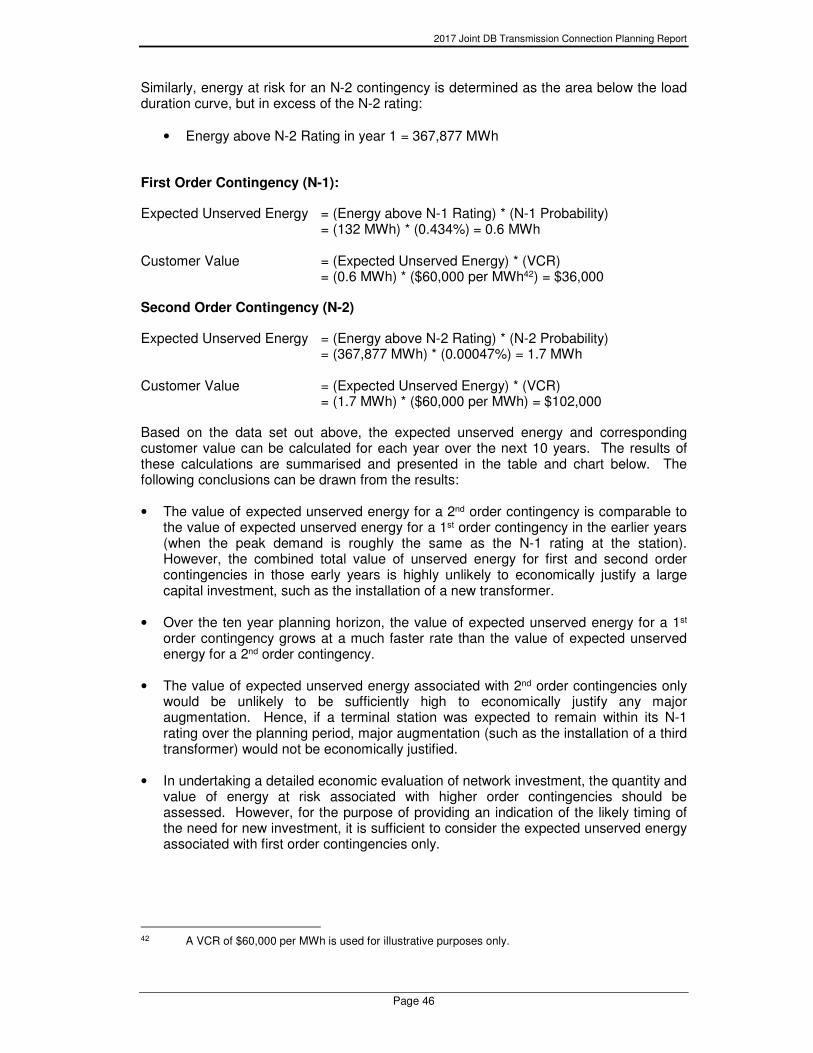
2017 Joint DB Transmission Connection Planning Report
Page 46
Similarly, energy at risk for an N-2 contingency is determined as the area below the load duration curve, but in excess of the N-2 rating:
• Energy above N-2 Rating in year 1 = 367,877 MWh
First Order Contingency (N-1):
Expected Unserved Energy = (Energy above N-1 Rating) * (N-1 Probability) = (132 MWh) * (0.434%) = 0.6 MWh Customer Value = (Expected Unserved Energy) * (VCR) = (0.6 MWh) * ($60,000 per MWh42) = $36,000
Second Order Contingency (N-2)
Expected Unserved Energy = (Energy above N-2 Rating) * (N-2 Probability) = (367,877 MWh) * (0.00047%) = 1.7 MWh Customer Value = (Expected Unserved Energy) * (VCR) = (1.7 MWh) * ($60,000 per MWh) = $102,000
Based on the data set out above, the expected unserved energy and corresponding customer value can be calculated for each year over the next 10 years. The results of these calculations are summarised and presented in the table and chart below. The following conclusions can be drawn from the results:
• The value of expected unserved energy for a 2nd order contingency is comparable to the value of expected unserved energy for a 1st order contingency in the earlier years (when the peak demand is roughly the same as the N-1 rating at the station). However, the combined total value of unserved energy for first and second order contingencies in those early years is highly unlikely to economically justify a large capital investment, such as the installation of a new transformer.
• Over the ten year planning horizon, the value of expected unserved energy for a 1st order contingency grows at a much faster rate than the value of expected unserved energy for a 2nd order contingency.
• The value of expected unserved energy associated with 2nd order contingencies only would be unlikely to be sufficiently high to economically justify any major augmentation. Hence, if a terminal station was expected to remain within its N-1 rating over the planning period, major augmentation (such as the installation of a third transformer) would not be economically justified.
• In undertaking a detailed economic evaluation of network investment, the quantity and value of energy at risk associated with higher order contingencies should be assessed. However, for the purpose of providing an indication of the likely timing of the need for new investment, it is sufficient to consider the expected unserved energy associated with first order contingencies only.
42 A VCR of $60,000 per MWh is used for illustrative purposes only.
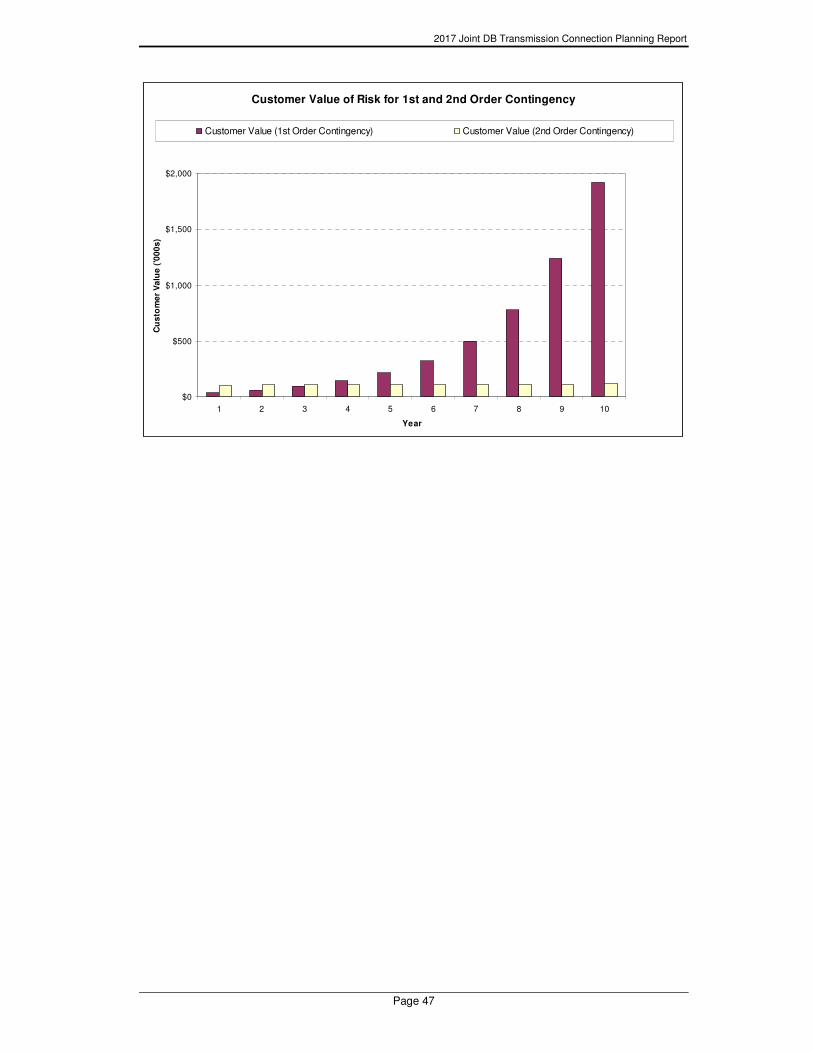
2017 Joint DB Transmission Connection Planning Report
Page 47
Customer Value of Risk for 1st and 2nd Order Contingency
$0
$500
$1,000
$1,500
$2,000
1 2 3 4 5 6 7 8 9 10
Year
Cu
sto
me
r V
alu
e (
'00
0s
)
Customer Value (1st Order Contingency) Customer Value (2nd Order Contingency)
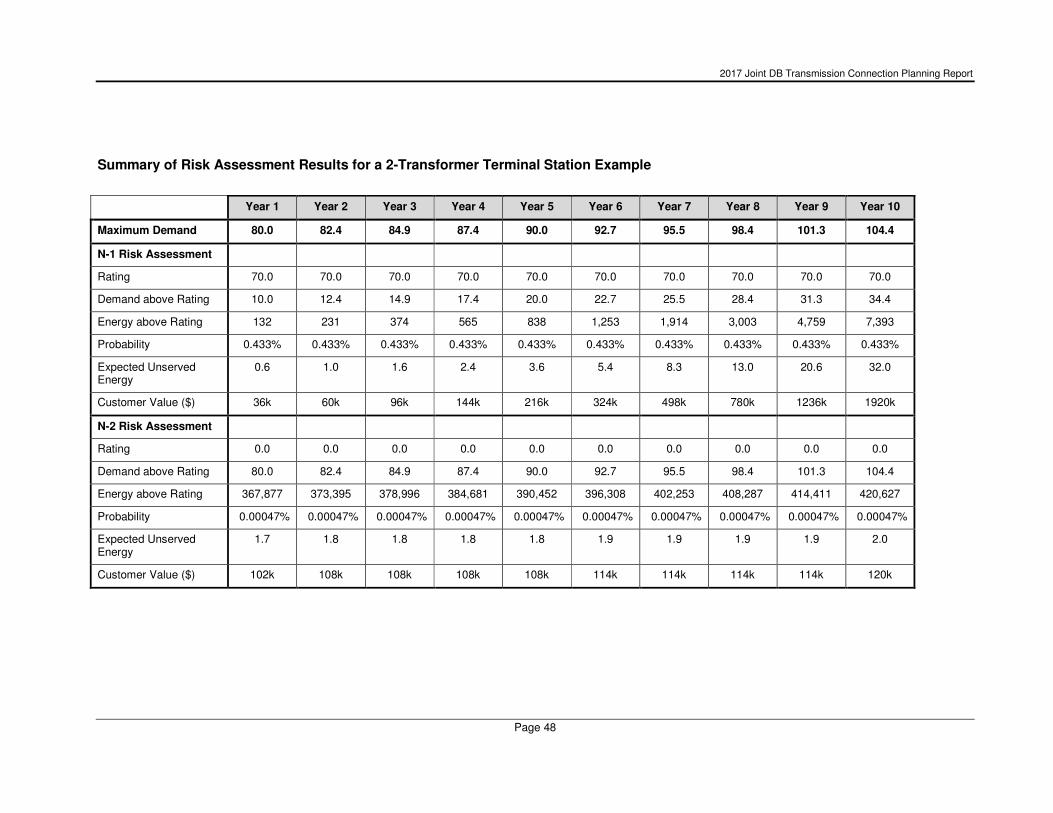
2017 Joint DB Transmission Connection Planning Report
Page 48
Summary of Risk Assessment Results for a 2-Transformer Terminal Station Example
Year 1 Year 2 Year 3 Year 4 Year 5 Year 6 Year 7 Year 8 Year 9 Year 10
Maximum Demand 80.0 82.4 84.9 87.4 90.0 92.7 95.5 98.4 101.3 104.4
N-1 Risk Assessment
Rating 70.0 70.0 70.0 70.0 70.0 70.0 70.0 70.0 70.0 70.0
Demand above Rating 10.0 12.4 14.9 17.4 20.0 22.7 25.5 28.4 31.3 34.4
Energy above Rating 132 231 374 565 838 1,253 1,914 3,003 4,759 7,393
Probability 0.433% 0.433% 0.433% 0.433% 0.433% 0.433% 0.433% 0.433% 0.433% 0.433%
Expected Unserved Energy
0.6 1.0 1.6 2.4 3.6 5.4 8.3 13.0 20.6 32.0
Customer Value ($) 36k 60k 96k 144k 216k 324k 498k 780k 1236k 1920k
N-2 Risk Assessment
Rating 0.0 0.0 0.0 0.0 0.0 0.0 0.0 0.0 0.0 0.0
Demand above Rating 80.0 82.4 84.9 87.4 90.0 92.7 95.5 98.4 101.3 104.4
Energy above Rating 367,877 373,395 378,996 384,681 390,452 396,308 402,253 408,287 414,411 420,627
Probability 0.00047% 0.00047% 0.00047% 0.00047% 0.00047% 0.00047% 0.00047% 0.00047% 0.00047% 0.00047%
Expected Unserved Energy
1.7 1.8 1.8 1.8 1.8 1.9 1.9 1.9 1.9 2.0
Customer Value ($) 102k 108k 108k 108k 108k 114k 114k 114k 114k 120k
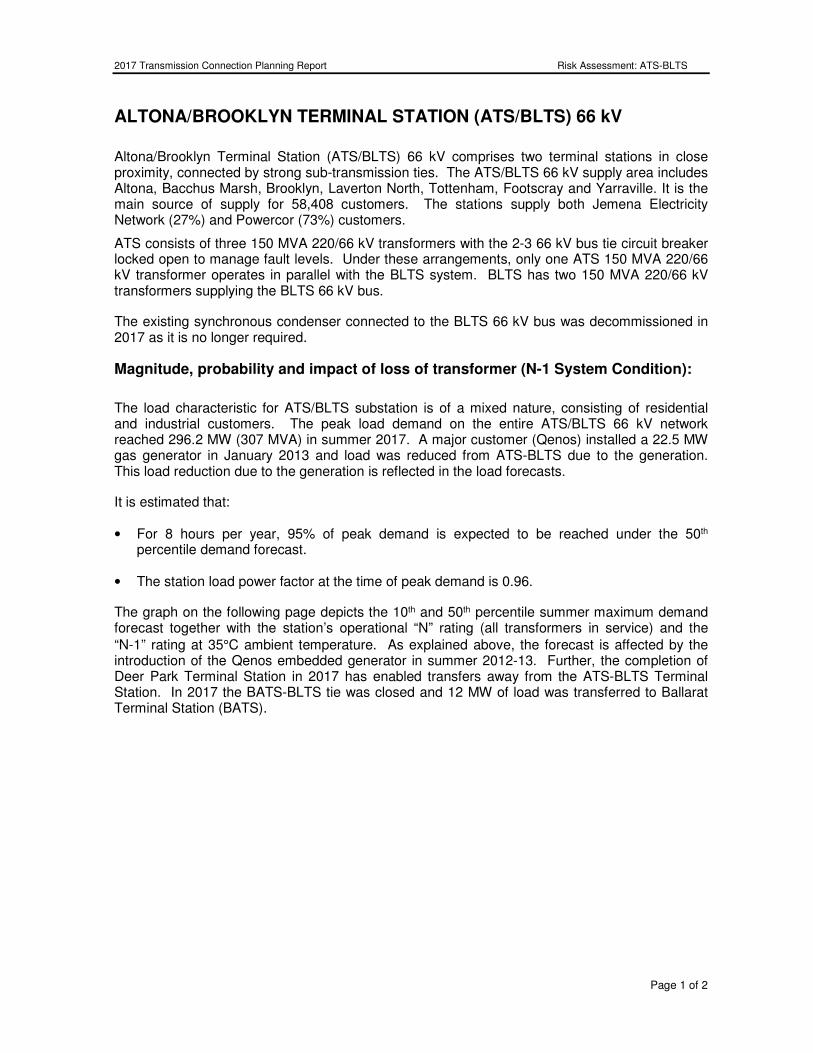
2017 Transmission Connection Planning Report Risk Assessment: ATS-BLTS
Page 1 of 2
ALTONA/BROOKLYN TERMINAL STATION (ATS/BLTS) 66 kV
Altona/Brooklyn Terminal Station (ATS/BLTS) 66 kV comprises two terminal stations in close proximity, connected by strong sub-transmission ties. The ATS/BLTS 66 kV supply area includes Altona, Bacchus Marsh, Brooklyn, Laverton North, Tottenham, Footscray and Yarraville. It is the main source of supply for 58,408 customers. The stations supply both Jemena Electricity Network (27%) and Powercor (73%) customers.
ATS consists of three 150 MVA 220/66 kV transformers with the 2-3 66 kV bus tie circuit breaker locked open to manage fault levels. Under these arrangements, only one ATS 150 MVA 220/66 kV transformer operates in parallel with the BLTS system. BLTS has two 150 MVA 220/66 kV transformers supplying the BLTS 66 kV bus.
The existing synchronous condenser connected to the BLTS 66 kV bus was decommissioned in 2017 as it is no longer required.
Magnitude, probability and impact of loss of transformer (N-1 System Condition):
The load characteristic for ATS/BLTS substation is of a mixed nature, consisting of residential and industrial customers. The peak load demand on the entire ATS/BLTS 66 kV network reached 296.2 MW (307 MVA) in summer 2017. A major customer (Qenos) installed a 22.5 MW gas generator in January 2013 and load was reduced from ATS-BLTS due to the generation. This load reduction due to the generation is reflected in the load forecasts.
It is estimated that:
• For 8 hours per year, 95% of peak demand is expected to be reached under the 50th percentile demand forecast.
• The station load power factor at the time of peak demand is 0.96.
The graph on the following page depicts the 10th and 50th percentile summer maximum demand forecast together with the station’s operational “N” rating (all transformers in service) and the
“N-1” rating at 35°C ambient temperature. As explained above, the forecast is affected by the introduction of the Qenos embedded generator in summer 2012-13. Further, the completion of Deer Park Terminal Station in 2017 has enabled transfers away from the ATS-BLTS Terminal Station. In 2017 the BATS-BLTS tie was closed and 12 MW of load was transferred to Ballarat Terminal Station (BATS).
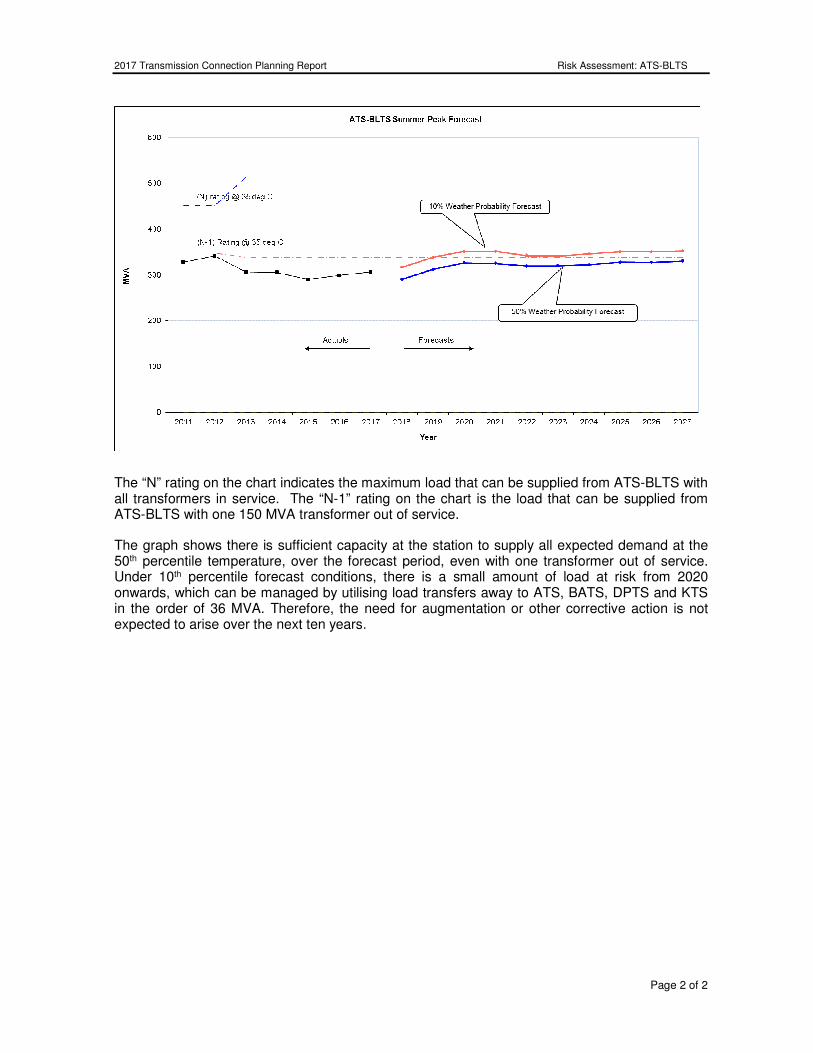
2017 Transmission Connection Planning Report Risk Assessment: ATS-BLTS
Page 2 of 2
The “N” rating on the chart indicates the maximum load that can be supplied from ATS-BLTS with all transformers in service. The “N-1” rating on the chart is the load that can be supplied from ATS-BLTS with one 150 MVA transformer out of service.
The graph shows there is sufficient capacity at the station to supply all expected demand at the 50th percentile temperature, over the forecast period, even with one transformer out of service. Under 10th percentile forecast conditions, there is a small amount of load at risk from 2020 onwards, which can be managed by utilising load transfers away to ATS, BATS, DPTS and KTS in the order of 36 MVA. Therefore, the need for augmentation or other corrective action is not expected to arise over the next ten years.
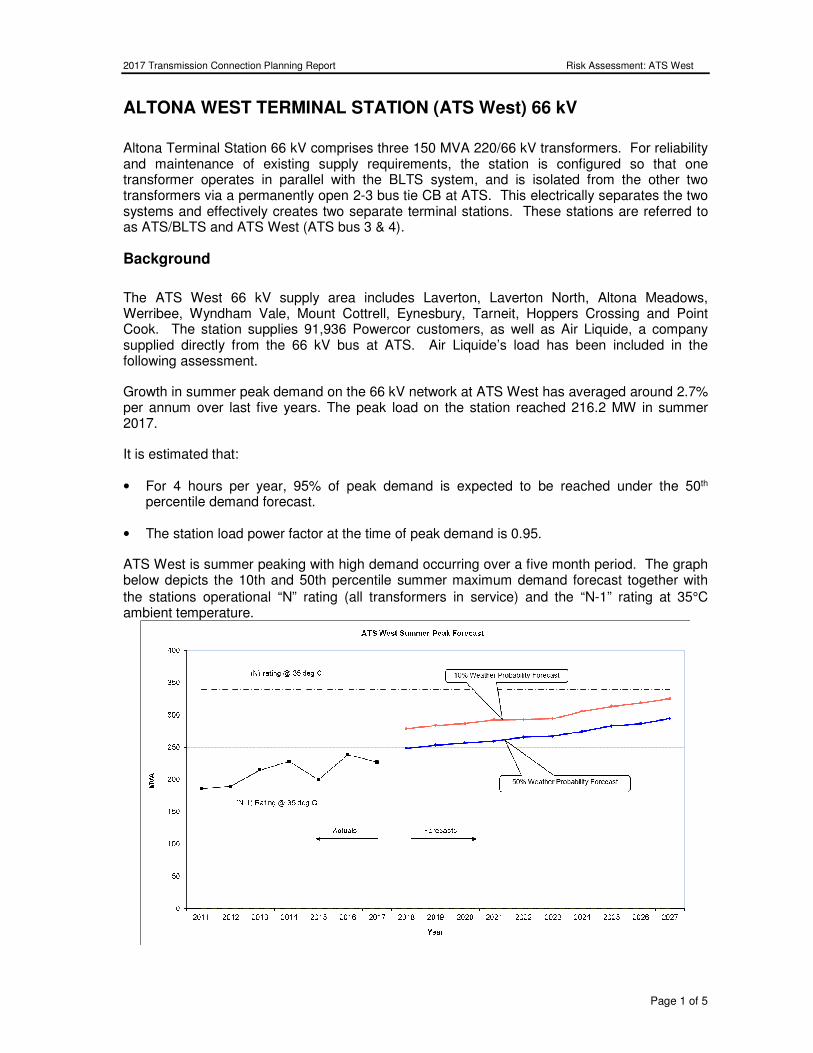
2017 Transmission Connection Planning Report Risk Assessment: ATS West
Page 1 of 5
ALTONA WEST TERMINAL STATION (ATS West) 66 kV
Altona Terminal Station 66 kV comprises three 150 MVA 220/66 kV transformers. For reliability and maintenance of existing supply requirements, the station is configured so that one transformer operates in parallel with the BLTS system, and is isolated from the other two transformers via a permanently open 2-3 bus tie CB at ATS. This electrically separates the two systems and effectively creates two separate terminal stations. These stations are referred to as ATS/BLTS and ATS West (ATS bus 3 & 4).
Background
The ATS West 66 kV supply area includes Laverton, Laverton North, Altona Meadows, Werribee, Wyndham Vale, Mount Cottrell, Eynesbury, Tarneit, Hoppers Crossing and Point Cook. The station supplies 91,936 Powercor customers, as well as Air Liquide, a company supplied directly from the 66 kV bus at ATS. Air Liquide’s load has been included in the following assessment.
Growth in summer peak demand on the 66 kV network at ATS West has averaged around 2.7% per annum over last five years. The peak load on the station reached 216.2 MW in summer 2017.
It is estimated that:
• For 4 hours per year, 95% of peak demand is expected to be reached under the 50th percentile demand forecast.
• The station load power factor at the time of peak demand is 0.95.
ATS West is summer peaking with high demand occurring over a five month period. The graph below depicts the 10th and 50th percentile summer maximum demand forecast together with the stations operational “N” rating (all transformers in service) and the “N-1” rating at 35°C ambient temperature.
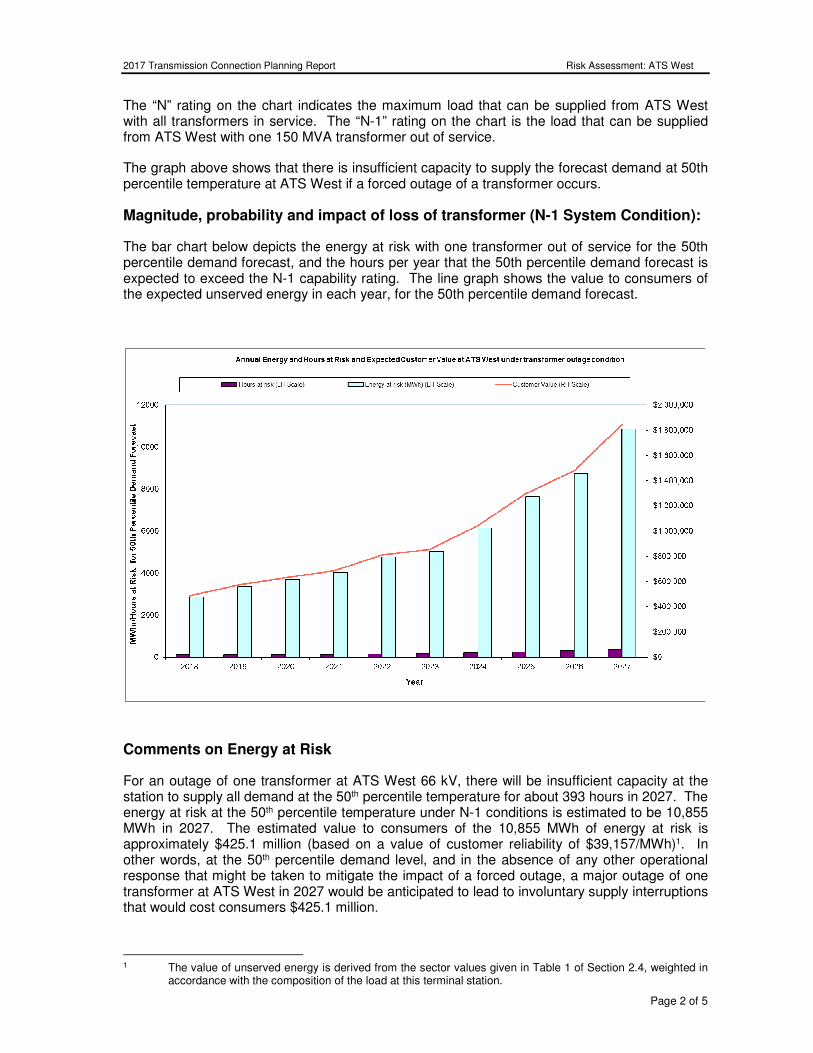
2017 Transmission Connection Planning Report Risk Assessment: ATS West
Page 2 of 5
The “N” rating on the chart indicates the maximum load that can be supplied from ATS West with all transformers in service. The “N-1” rating on the chart is the load that can be supplied from ATS West with one 150 MVA transformer out of service.
The graph above shows that there is insufficient capacity to supply the forecast demand at 50th percentile temperature at ATS West if a forced outage of a transformer occurs.
Magnitude, probability and impact of loss of transformer (N-1 System Condition):
The bar chart below depicts the energy at risk with one transformer out of service for the 50th percentile demand forecast, and the hours per year that the 50th percentile demand forecast is expected to exceed the N-1 capability rating. The line graph shows the value to consumers of the expected unserved energy in each year, for the 50th percentile demand forecast.
Comments on Energy at Risk
For an outage of one transformer at ATS West 66 kV, there will be insufficient capacity at the station to supply all demand at the 50th percentile temperature for about 393 hours in 2027. The energy at risk at the 50th percentile temperature under N-1 conditions is estimated to be 10,855 MWh in 2027. The estimated value to consumers of the 10,855 MWh of energy at risk is approximately $425.1 million (based on a value of customer reliability of $39,157/MWh)1. In other words, at the 50th percentile demand level, and in the absence of any other operational response that might be taken to mitigate the impact of a forced outage, a major outage of one transformer at ATS West in 2027 would be anticipated to lead to involuntary supply interruptions that would cost consumers $425.1 million.
1 The value of unserved energy is derived from the sector values given in Table 1 of Section 2.4, weighted in
accordance with the composition of the load at this terminal station.
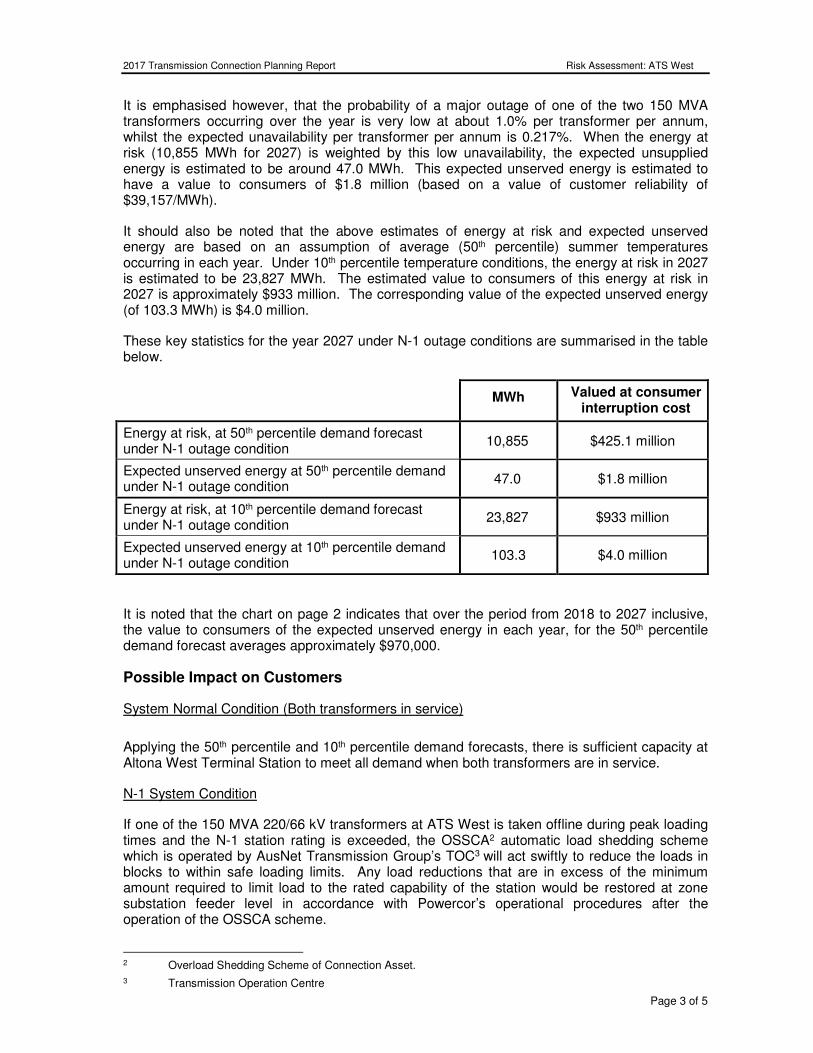
2017 Transmission Connection Planning Report Risk Assessment: ATS West
Page 3 of 5
It is emphasised however, that the probability of a major outage of one of the two 150 MVA transformers occurring over the year is very low at about 1.0% per transformer per annum, whilst the expected unavailability per transformer per annum is 0.217%. When the energy at risk (10,855 MWh for 2027) is weighted by this low unavailability, the expected unsupplied energy is estimated to be around 47.0 MWh. This expected unserved energy is estimated to have a value to consumers of $1.8 million (based on a value of customer reliability of $39,157/MWh).
It should also be noted that the above estimates of energy at risk and expected unserved energy are based on an assumption of average (50th percentile) summer temperatures occurring in each year. Under 10th percentile temperature conditions, the energy at risk in 2027 is estimated to be 23,827 MWh. The estimated value to consumers of this energy at risk in 2027 is approximately $933 million. The corresponding value of the expected unserved energy (of 103.3 MWh) is $4.0 million.
These key statistics for the year 2027 under N-1 outage conditions are summarised in the table below.
MWh Valued at consumer interruption cost
Energy at risk, at 50th percentile demand forecast under N-1 outage condition
10,855 $425.1 million
Expected unserved energy at 50th percentile demand under N-1 outage condition
47.0 $1.8 million
Energy at risk, at 10th percentile demand forecast under N-1 outage condition
23,827 $933 million
Expected unserved energy at 10th percentile demand under N-1 outage condition
103.3 $4.0 million
It is noted that the chart on page 2 indicates that over the period from 2018 to 2027 inclusive, the value to consumers of the expected unserved energy in each year, for the 50th percentile demand forecast averages approximately $970,000.
Possible Impact on Customers
System Normal Condition (Both transformers in service)
Applying the 50th percentile and 10th percentile demand forecasts, there is sufficient capacity at Altona West Terminal Station to meet all demand when both transformers are in service.
N-1 System Condition
If one of the 150 MVA 220/66 kV transformers at ATS West is taken offline during peak loading times and the N-1 station rating is exceeded, the OSSCA2 automatic load shedding scheme which is operated by AusNet Transmission Group’s TOC3 will act swiftly to reduce the loads in blocks to within safe loading limits. Any load reductions that are in excess of the minimum amount required to limit load to the rated capability of the station would be restored at zone substation feeder level in accordance with Powercor’s operational procedures after the operation of the OSSCA scheme.
2 Overload Shedding Scheme of Connection Asset. 3 Transmission Operation Centre
2017 Transmission Connection Planning Report Risk Assessment: ATS West
Page 4 of 5
Possible load transfers away to ATS/BLTS and DPTS terminal stations in the event of a transformer failure at ATS West total 13.6 MVA in summer 2018.
Feasible options for alleviation of constraints
The following options are technically feasible and potentially economic to mitigate the risk of supply interruption and/or to alleviate the emerging constraint:
1. Install additional transformation capacity and reconfigure 66 kV exits at ATS, at an estimated indicative capital cost of $18 million (equating to a total annual cost of approximately $1.8 million per annum). This would result in the station being configured so that three transformers are supplying the ATS West load, and one transformer will continue to provide capacity to the ATS/BLTS system.
2. A new Tarneit zone substation is planned for 2023; however it is not a committed project at this point in time. This zone substation would be supplied from DPTS and will offload Werribee and Laverton zones substations in the order of 40 MW. This will not eliminate the load at risk at ATS West, only reduce it.
3. Demand reduction: There is an opportunity to develop innovative customer schemes to encourage voluntary demand reduction during times of network constraint. The amount of potential demand reduction depends on the customer uptake and would be taken into consideration when determining the optimum timing of any network capacity augmentation.
4. Embedded generation, connected to the ATS 66 kV bus, may substitute capacity augmentations.
Preferred network option(s) for alleviation of constraints
In the absence of commitment by interested parties to offer network support services by installing local generation or through demand side management initiatives that would reduce load at ATS, it is proposed to install additional transformation capacity and to reconfigure 66 kV exits at ATS.
On the basis of the present demand forecasts and applying the 2017 VCR estimates, the installation of an additional transformer and the 66 kV exit reconfiguration works at ATS would be expected to be economically justified by 2026. As already noted, the chart on page 2 indicates that over the period from 2018 to 2027 inclusive, the value to consumers of the expected unserved energy in each year, for the 50th percentile demand forecast averages approximately $970,000 when the 2017 VCR estimate is used. Applying the 2013 VCR estimate, the average annual expected unserved energy value at the 50th percentile demand forecast is approximately $2.2 million per year over the period from 2018 to 2027 inclusive. At the higher VCR value, the preferred network option would be likely to be economically justified by around 2022.
The tables on the following pages provide more detailed data on the station rating, demand forecasts, energy at risk and expected unserved energy.
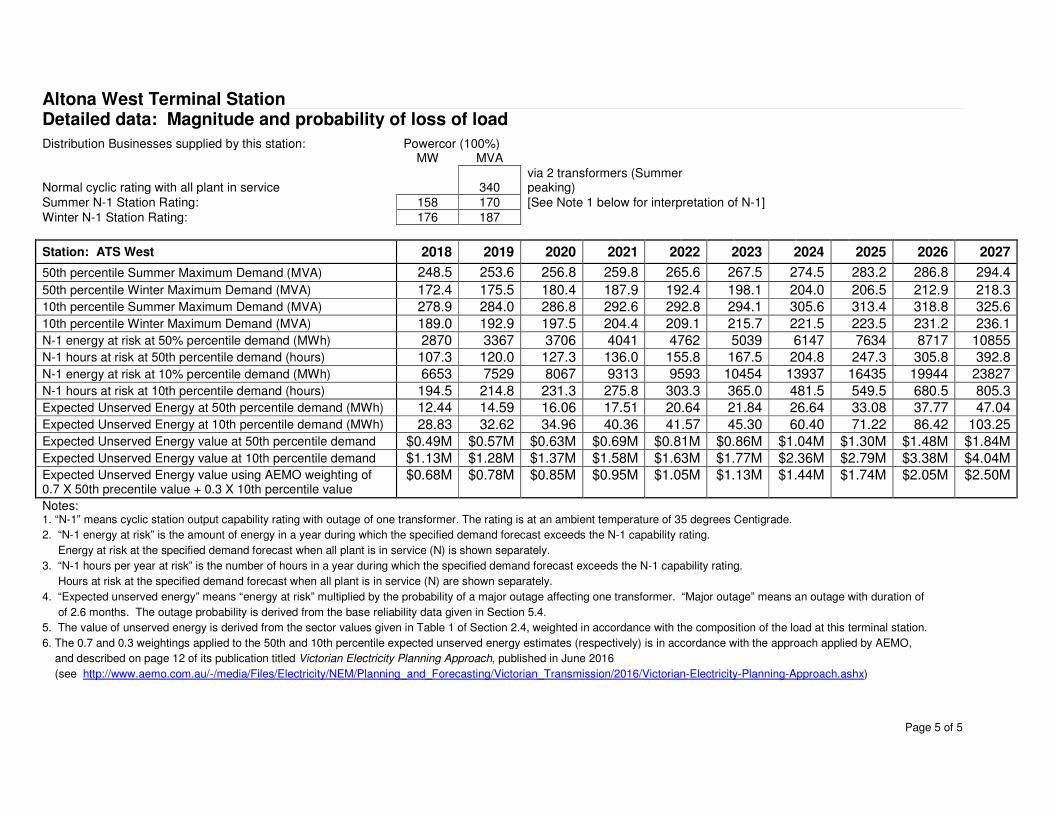
2012 Transmission Connection Planning Report Risk Assessment: ATS West
Page 5 of 5
Altona West Terminal Station Detailed data: Magnitude and probability of loss of load
Distribution Businesses supplied by this station: Powercor (100%) MW MVA
Normal cyclic rating with all plant in service 340 via 2 transformers (Summer peaking)
Summer N-1 Station Rating: 158 170 [See Note 1 below for interpretation of N-1] Winter N-1 Station Rating: 176 187
Station: ATS West 2018 2019 2020 2021 2022 2023 2024 2025 2026 2027
50th percentile Summer Maximum Demand (MVA) 248.5 253.6 256.8 259.8 265.6 267.5 274.5 283.2 286.8 294.4
50th percentile Winter Maximum Demand (MVA) 172.4 175.5 180.4 187.9 192.4 198.1 204.0 206.5 212.9 218.3
10th percentile Summer Maximum Demand (MVA) 278.9 284.0 286.8 292.6 292.8 294.1 305.6 313.4 318.8 325.6
10th percentile Winter Maximum Demand (MVA) 189.0 192.9 197.5 204.4 209.1 215.7 221.5 223.5 231.2 236.1
N-1 energy at risk at 50% percentile demand (MWh) 2870 3367 3706 4041 4762 5039 6147 7634 8717 10855
N-1 hours at risk at 50th percentile demand (hours) 107.3 120.0 127.3 136.0 155.8 167.5 204.8 247.3 305.8 392.8
N-1 energy at risk at 10% percentile demand (MWh) 6653 7529 8067 9313 9593 10454 13937 16435 19944 23827
N-1 hours at risk at 10th percentile demand (hours) 194.5 214.8 231.3 275.8 303.3 365.0 481.5 549.5 680.5 805.3
Expected Unserved Energy at 50th percentile demand (MWh) 12.44 14.59 16.06 17.51 20.64 21.84 26.64 33.08 37.77 47.04
Expected Unserved Energy at 10th percentile demand (MWh) 28.83 32.62 34.96 40.36 41.57 45.30 60.40 71.22 86.42 103.25
Expected Unserved Energy value at 50th percentile demand $0.49M $0.57M $0.63M $0.69M $0.81M $0.86M $1.04M $1.30M $1.48M $1.84M
Expected Unserved Energy value at 10th percentile demand $1.13M $1.28M $1.37M $1.58M $1.63M $1.77M $2.36M $2.79M $3.38M $4.04M
Expected Unserved Energy value using AEMO weighting of 0.7 X 50th precentile value + 0.3 X 10th percentile value
$0.68M $0.78M $0.85M $0.95M $1.05M $1.13M $1.44M $1.74M $2.05M $2.50M
Notes: 1. “N-1” means cyclic station output capability rating with outage of one transformer. The rating is at an ambient temperature of 35 degrees Centigrade.
2. “N-1 energy at risk” is the amount of energy in a year during which the specified demand forecast exceeds the N-1 capability rating.
Energy at risk at the specified demand forecast when all plant is in service (N) is shown separately.
3. “N-1 hours per year at risk” is the number of hours in a year during which the specified demand forecast exceeds the N-1 capability rating.
Hours at risk at the specified demand forecast when all plant is in service (N) are shown separately.
4. “Expected unserved energy” means “energy at risk” multiplied by the probability of a major outage affecting one transformer. “Major outage” means an outage with duration of
of 2.6 months. The outage probability is derived from the base reliability data given in Section 5.4.
5. The value of unserved energy is derived from the sector values given in Table 1 of Section 2.4, weighted in accordance with the composition of the load at this terminal station.
6. The 0.7 and 0.3 weightings applied to the 50th and 10th percentile expected unserved energy estimates (respectively) is in accordance with the approach applied by AEMO,
and described on page 12 of its publication titled Victorian Electricity Planning Approach, published in June 2016
(see http://www.aemo.com.au/-/media/Files/Electricity/NEM/Planning_and_Forecasting/Victorian_Transmission/2016/Victorian-Electricity-Planning-Approach.ashx)
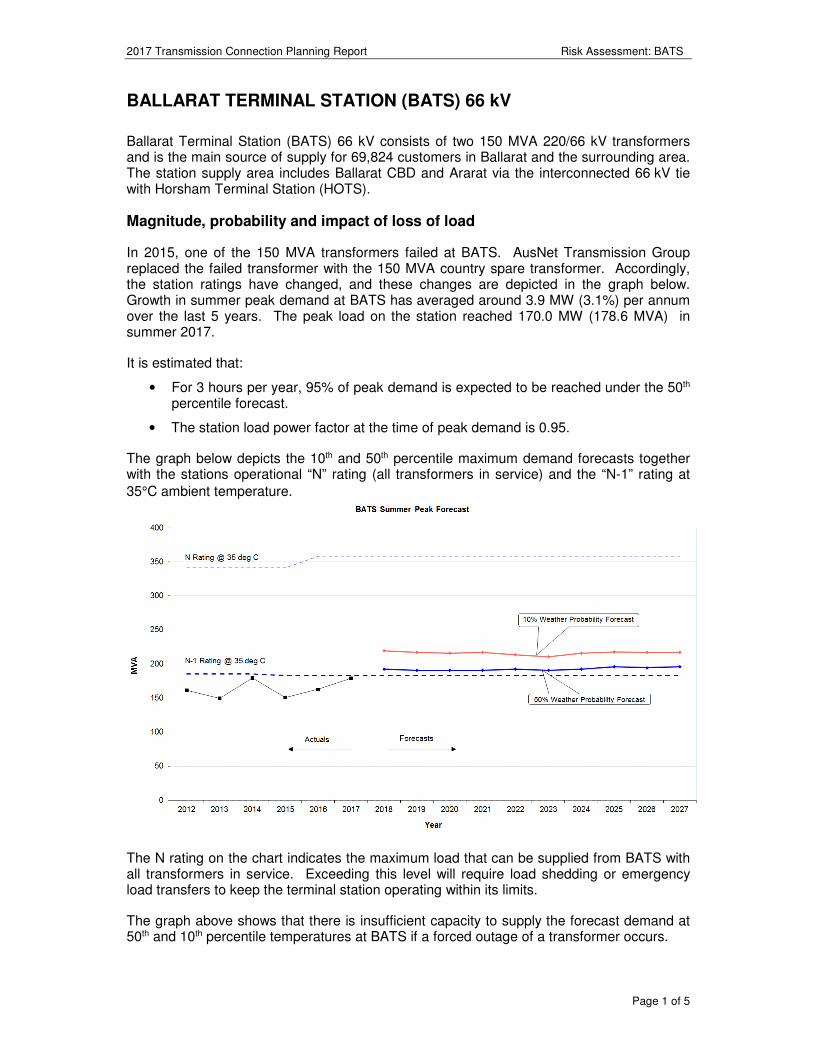
2017 Transmission Connection Planning Report Risk Assessment: BATS
Page 1 of 5
BALLARAT TERMINAL STATION (BATS) 66 kV
Ballarat Terminal Station (BATS) 66 kV consists of two 150 MVA 220/66 kV transformers and is the main source of supply for 69,824 customers in Ballarat and the surrounding area. The station supply area includes Ballarat CBD and Ararat via the interconnected 66 kV tie with Horsham Terminal Station (HOTS).
Magnitude, probability and impact of loss of load
In 2015, one of the 150 MVA transformers failed at BATS. AusNet Transmission Group replaced the failed transformer with the 150 MVA country spare transformer. Accordingly, the station ratings have changed, and these changes are depicted in the graph below. Growth in summer peak demand at BATS has averaged around 3.9 MW (3.1%) per annum over the last 5 years. The peak load on the station reached 170.0 MW (178.6 MVA) in summer 2017.
It is estimated that:
• For 3 hours per year, 95% of peak demand is expected to be reached under the 50th percentile forecast.
• The station load power factor at the time of peak demand is 0.95.
The graph below depicts the 10th and 50th percentile maximum demand forecasts together with the stations operational “N” rating (all transformers in service) and the “N-1” rating at
35°C ambient temperature.
The N rating on the chart indicates the maximum load that can be supplied from BATS with all transformers in service. Exceeding this level will require load shedding or emergency load transfers to keep the terminal station operating within its limits.
The graph above shows that there is insufficient capacity to supply the forecast demand at 50th and 10th percentile temperatures at BATS if a forced outage of a transformer occurs.
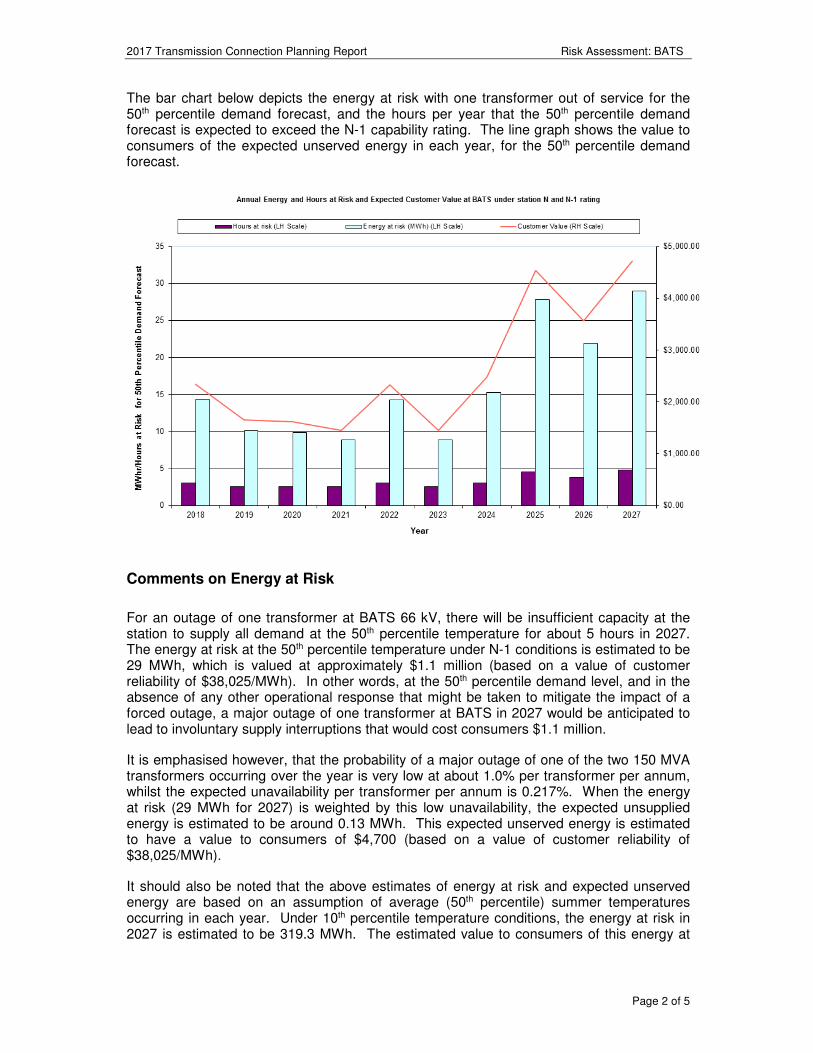
2017 Transmission Connection Planning Report Risk Assessment: BATS
Page 2 of 5
The bar chart below depicts the energy at risk with one transformer out of service for the 50th percentile demand forecast, and the hours per year that the 50th percentile demand forecast is expected to exceed the N-1 capability rating. The line graph shows the value to consumers of the expected unserved energy in each year, for the 50th percentile demand forecast.
Comments on Energy at Risk
For an outage of one transformer at BATS 66 kV, there will be insufficient capacity at the station to supply all demand at the 50th percentile temperature for about 5 hours in 2027. The energy at risk at the 50th percentile temperature under N-1 conditions is estimated to be 29 MWh, which is valued at approximately $1.1 million (based on a value of customer reliability of $38,025/MWh). In other words, at the 50th percentile demand level, and in the absence of any other operational response that might be taken to mitigate the impact of a forced outage, a major outage of one transformer at BATS in 2027 would be anticipated to lead to involuntary supply interruptions that would cost consumers $1.1 million.
It is emphasised however, that the probability of a major outage of one of the two 150 MVA transformers occurring over the year is very low at about 1.0% per transformer per annum, whilst the expected unavailability per transformer per annum is 0.217%. When the energy at risk (29 MWh for 2027) is weighted by this low unavailability, the expected unsupplied energy is estimated to be around 0.13 MWh. This expected unserved energy is estimated to have a value to consumers of $4,700 (based on a value of customer reliability of $38,025/MWh).
It should also be noted that the above estimates of energy at risk and expected unserved energy are based on an assumption of average (50th percentile) summer temperatures occurring in each year. Under 10th percentile temperature conditions, the energy at risk in 2027 is estimated to be 319.3 MWh. The estimated value to consumers of this energy at
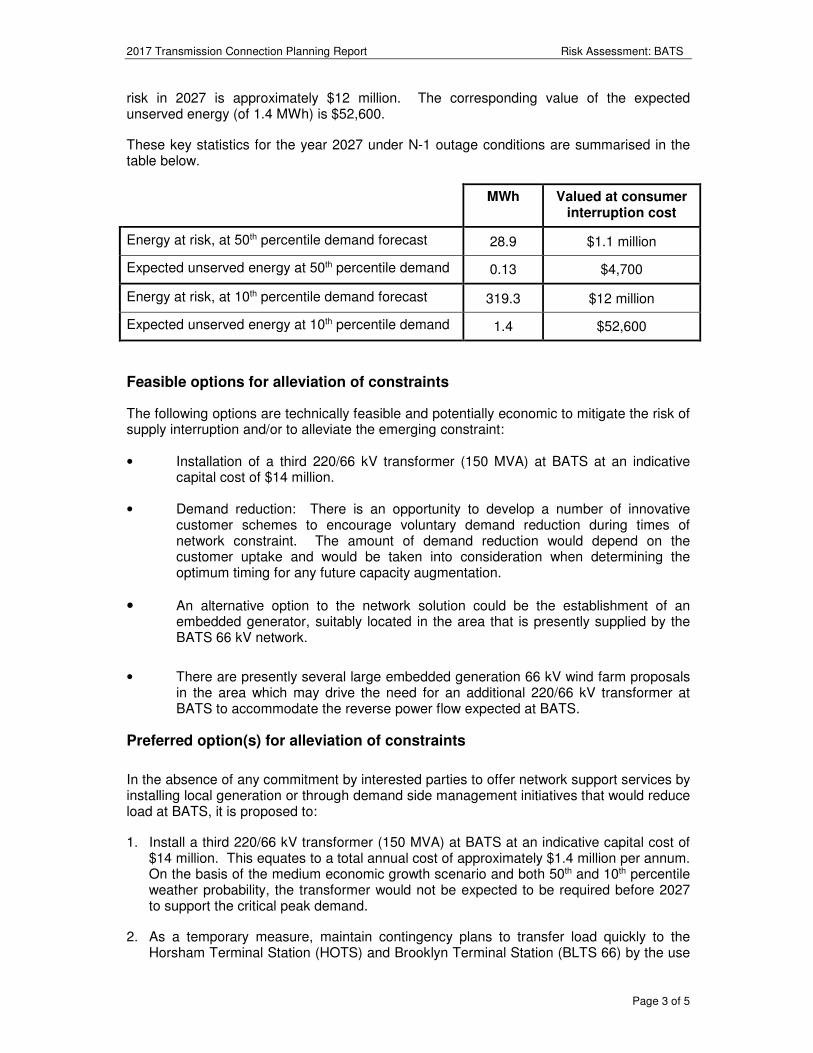
2017 Transmission Connection Planning Report Risk Assessment: BATS
Page 3 of 5
risk in 2027 is approximately $12 million. The corresponding value of the expected unserved energy (of 1.4 MWh) is $52,600.
These key statistics for the year 2027 under N-1 outage conditions are summarised in the table below.
MWh Valued at consumer interruption cost
Energy at risk, at 50th percentile demand forecast 28.9 $1.1 million
Expected unserved energy at 50th percentile demand 0.13 $4,700
Energy at risk, at 10th percentile demand forecast 319.3 $12 million
Expected unserved energy at 10th percentile demand 1.4 $52,600
Feasible options for alleviation of constraints
The following options are technically feasible and potentially economic to mitigate the risk of supply interruption and/or to alleviate the emerging constraint:
• Installation of a third 220/66 kV transformer (150 MVA) at BATS at an indicative capital cost of $14 million.
• Demand reduction: There is an opportunity to develop a number of innovative customer schemes to encourage voluntary demand reduction during times of network constraint. The amount of demand reduction would depend on the customer uptake and would be taken into consideration when determining the optimum timing for any future capacity augmentation.
• An alternative option to the network solution could be the establishment of an embedded generator, suitably located in the area that is presently supplied by the BATS 66 kV network.
• There are presently several large embedded generation 66 kV wind farm proposals in the area which may drive the need for an additional 220/66 kV transformer at BATS to accommodate the reverse power flow expected at BATS.
Preferred option(s) for alleviation of constraints
In the absence of any commitment by interested parties to offer network support services by installing local generation or through demand side management initiatives that would reduce load at BATS, it is proposed to:
1. Install a third 220/66 kV transformer (150 MVA) at BATS at an indicative capital cost of $14 million. This equates to a total annual cost of approximately $1.4 million per annum. On the basis of the medium economic growth scenario and both 50th and 10th percentile weather probability, the transformer would not be expected to be required before 2027 to support the critical peak demand.
2. As a temporary measure, maintain contingency plans to transfer load quickly to the Horsham Terminal Station (HOTS) and Brooklyn Terminal Station (BLTS 66) by the use
2017 Transmission Connection Planning Report Risk Assessment: BATS
Page 4 of 5
of the 66 kV tie lines that run from BATS to HOTS and BATS to BLTS 66 in the event of an unplanned outage of one transformer at BATS under critical loading conditions. This load transfer is in the order of 22 MVA. Under these temporary measures, affected customers would be supplied from the 66 kV tie line infrastructure on a radial network, thereby reducing the level of supply reliability they receive.
3. Subject to the availability of an AusNet Transmission Group spare 220/66 kV transformer for rural areas (refer Section 5.5), this spare transformer can be used to temporarily replace a failed transformer to minimise the transformer outage period.
The table on the following page provides more detailed data on the station rating, demand forecasts, energy at risk and expected unserved energy.
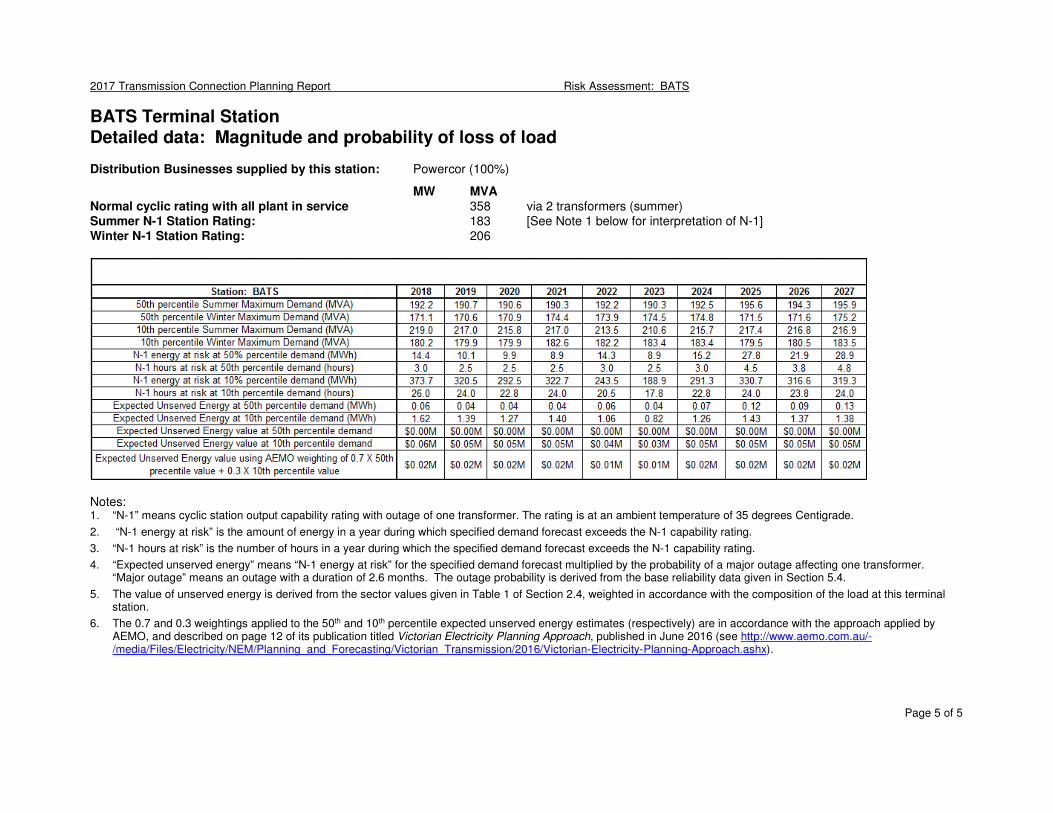
2017 Transmission Connection Planning Report Risk Assessment: BATS
Page 5 of 5
BATS Terminal Station
Detailed data: Magnitude and probability of loss of load Distribution Businesses supplied by this station: Powercor (100%)
MW MVA Normal cyclic rating with all plant in service 358 via 2 transformers (summer) Summer N-1 Station Rating: 183 [See Note 1 below for interpretation of N-1] Winter N-1 Station Rating: 206
Notes: 1. “N-1” means cyclic station output capability rating with outage of one transformer. The rating is at an ambient temperature of 35 degrees Centigrade.
2. “N-1 energy at risk” is the amount of energy in a year during which specified demand forecast exceeds the N-1 capability rating.
3. “N-1 hours at risk” is the number of hours in a year during which the specified demand forecast exceeds the N-1 capability rating.
4. “Expected unserved energy” means “N-1 energy at risk” for the specified demand forecast multiplied by the probability of a major outage affecting one transformer. “Major outage” means an outage with a duration of 2.6 months. The outage probability is derived from the base reliability data given in Section 5.4.
5. The value of unserved energy is derived from the sector values given in Table 1 of Section 2.4, weighted in accordance with the composition of the load at this terminal station.
6. The 0.7 and 0.3 weightings applied to the 50th and 10th percentile expected unserved energy estimates (respectively) are in accordance with the approach applied by AEMO, and described on page 12 of its publication titled Victorian Electricity Planning Approach, published in June 2016 (see http://www.aemo.com.au/-/media/Files/Electricity/NEM/Planning_and_Forecasting/Victorian_Transmission/2016/Victorian-Electricity-Planning-Approach.ashx).
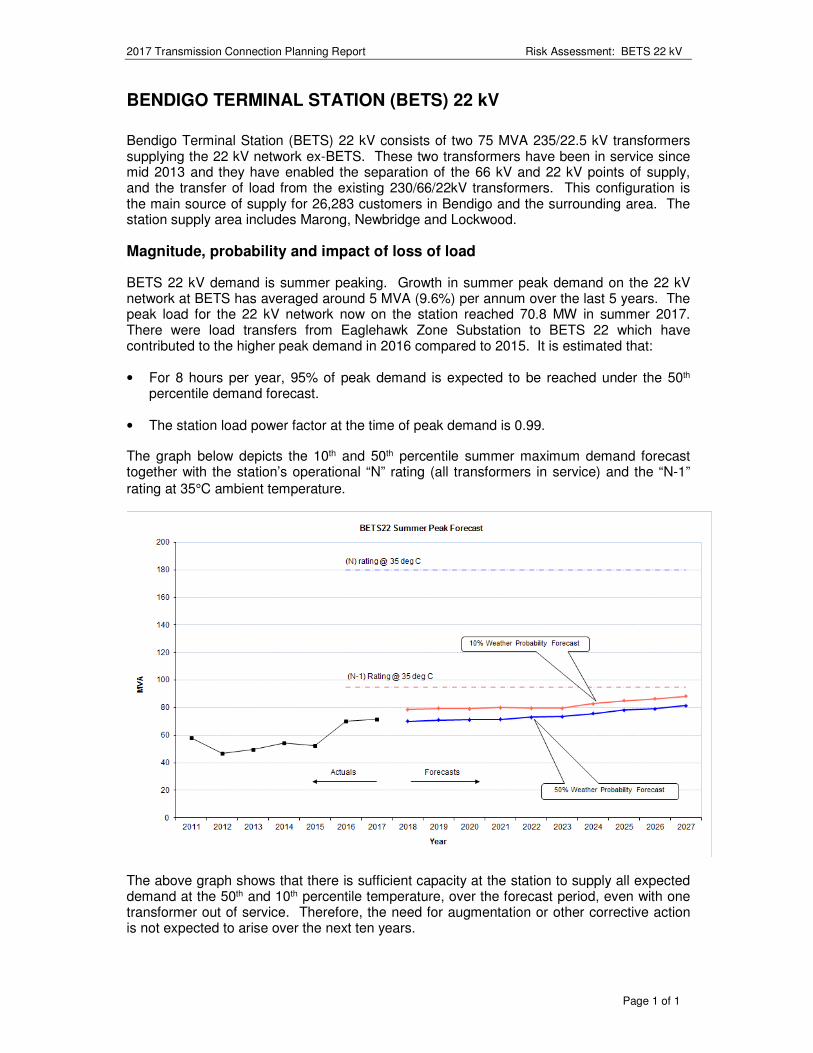
2017 Transmission Connection Planning Report Risk Assessment: BETS 22 kV
Page 1 of 1
BENDIGO TERMINAL STATION (BETS) 22 kV
Bendigo Terminal Station (BETS) 22 kV consists of two 75 MVA 235/22.5 kV transformers supplying the 22 kV network ex-BETS. These two transformers have been in service since mid 2013 and they have enabled the separation of the 66 kV and 22 kV points of supply, and the transfer of load from the existing 230/66/22kV transformers. This configuration is the main source of supply for 26,283 customers in Bendigo and the surrounding area. The station supply area includes Marong, Newbridge and Lockwood.
Magnitude, probability and impact of loss of load
BETS 22 kV demand is summer peaking. Growth in summer peak demand on the 22 kV network at BETS has averaged around 5 MVA (9.6%) per annum over the last 5 years. The peak load for the 22 kV network now on the station reached 70.8 MW in summer 2017. There were load transfers from Eaglehawk Zone Substation to BETS 22 which have contributed to the higher peak demand in 2016 compared to 2015. It is estimated that:
• For 8 hours per year, 95% of peak demand is expected to be reached under the 50th percentile demand forecast.
• The station load power factor at the time of peak demand is 0.99.
The graph below depicts the 10th and 50th percentile summer maximum demand forecast together with the station’s operational “N” rating (all transformers in service) and the “N-1”
rating at 35°C ambient temperature.
The above graph shows that there is sufficient capacity at the station to supply all expected demand at the 50th and 10th percentile temperature, over the forecast period, even with one transformer out of service. Therefore, the need for augmentation or other corrective action is not expected to arise over the next ten years.
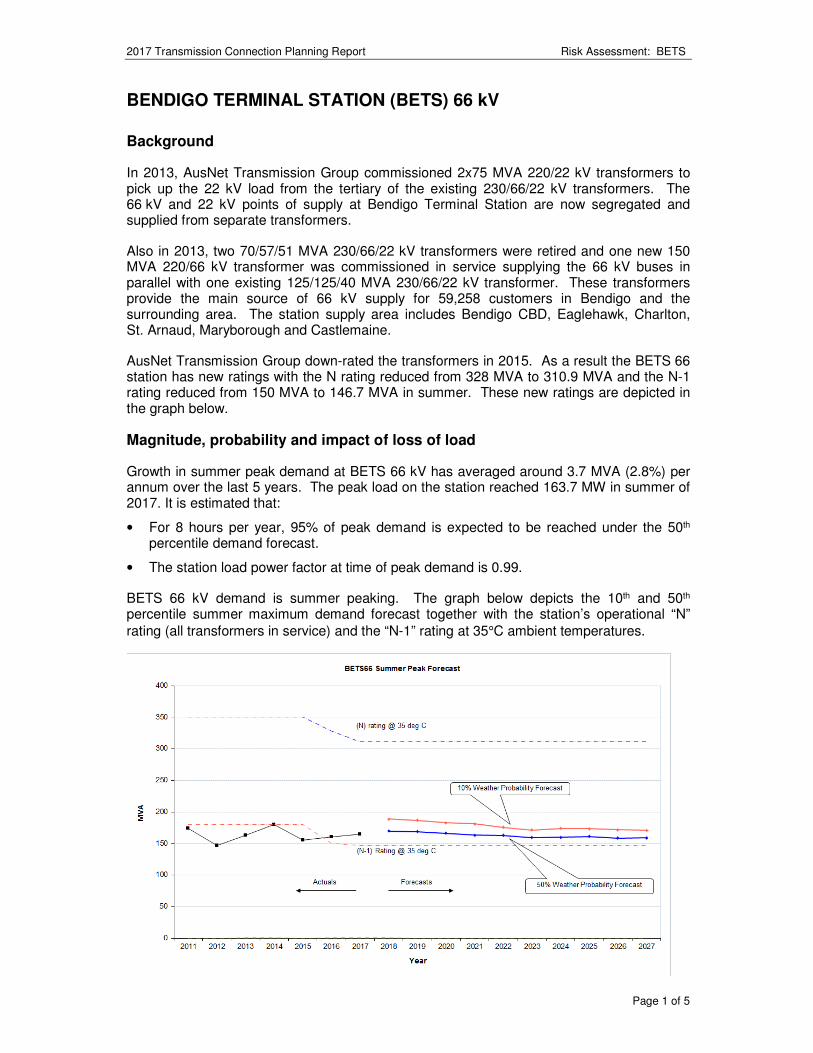
2017 Transmission Connection Planning Report Risk Assessment: BETS
Page 1 of 5
BENDIGO TERMINAL STATION (BETS) 66 kV
Background
In 2013, AusNet Transmission Group commissioned 2x75 MVA 220/22 kV transformers to pick up the 22 kV load from the tertiary of the existing 230/66/22 kV transformers. The 66 kV and 22 kV points of supply at Bendigo Terminal Station are now segregated and supplied from separate transformers.
Also in 2013, two 70/57/51 MVA 230/66/22 kV transformers were retired and one new 150 MVA 220/66 kV transformer was commissioned in service supplying the 66 kV buses in parallel with one existing 125/125/40 MVA 230/66/22 kV transformer. These transformers provide the main source of 66 kV supply for 59,258 customers in Bendigo and the surrounding area. The station supply area includes Bendigo CBD, Eaglehawk, Charlton, St. Arnaud, Maryborough and Castlemaine.
AusNet Transmission Group down-rated the transformers in 2015. As a result the BETS 66 station has new ratings with the N rating reduced from 328 MVA to 310.9 MVA and the N-1 rating reduced from 150 MVA to 146.7 MVA in summer. These new ratings are depicted in the graph below.
Magnitude, probability and impact of loss of load
Growth in summer peak demand at BETS 66 kV has averaged around 3.7 MVA (2.8%) per annum over the last 5 years. The peak load on the station reached 163.7 MW in summer of 2017. It is estimated that:
• For 8 hours per year, 95% of peak demand is expected to be reached under the 50th percentile demand forecast.
• The station load power factor at time of peak demand is 0.99.
BETS 66 kV demand is summer peaking. The graph below depicts the 10th and 50th percentile summer maximum demand forecast together with the station’s operational “N” rating (all transformers in service) and the “N-1” rating at 35°C ambient temperatures.
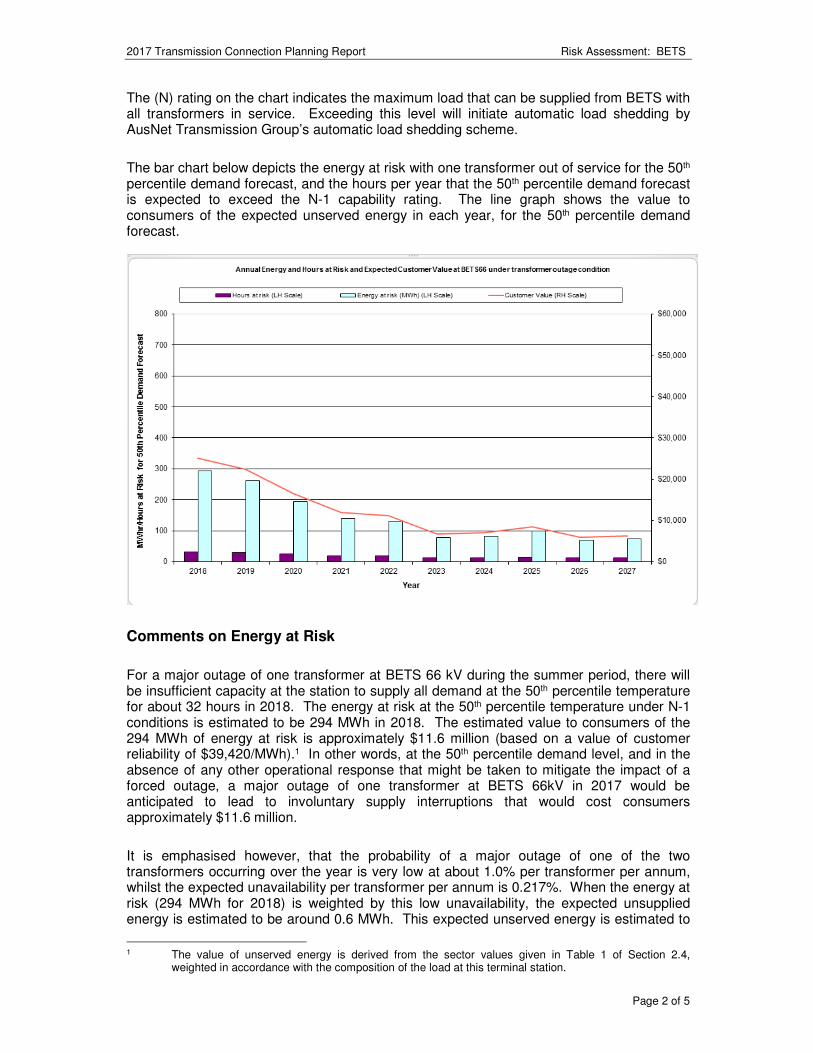
2017 Transmission Connection Planning Report Risk Assessment: BETS
Page 2 of 5
The (N) rating on the chart indicates the maximum load that can be supplied from BETS with all transformers in service. Exceeding this level will initiate automatic load shedding by AusNet Transmission Group’s automatic load shedding scheme.
The bar chart below depicts the energy at risk with one transformer out of service for the 50th percentile demand forecast, and the hours per year that the 50th percentile demand forecast is expected to exceed the N-1 capability rating. The line graph shows the value to consumers of the expected unserved energy in each year, for the 50th percentile demand forecast.
Comments on Energy at Risk
For a major outage of one transformer at BETS 66 kV during the summer period, there will be insufficient capacity at the station to supply all demand at the 50th percentile temperature for about 32 hours in 2018. The energy at risk at the 50th percentile temperature under N-1 conditions is estimated to be 294 MWh in 2018. The estimated value to consumers of the 294 MWh of energy at risk is approximately $11.6 million (based on a value of customer reliability of $39,420/MWh).1 In other words, at the 50th percentile demand level, and in the absence of any other operational response that might be taken to mitigate the impact of a forced outage, a major outage of one transformer at BETS 66kV in 2017 would be anticipated to lead to involuntary supply interruptions that would cost consumers approximately $11.6 million.
It is emphasised however, that the probability of a major outage of one of the two transformers occurring over the year is very low at about 1.0% per transformer per annum, whilst the expected unavailability per transformer per annum is 0.217%. When the energy at risk (294 MWh for 2018) is weighted by this low unavailability, the expected unsupplied energy is estimated to be around 0.6 MWh. This expected unserved energy is estimated to
1 The value of unserved energy is derived from the sector values given in Table 1 of Section 2.4,
weighted in accordance with the composition of the load at this terminal station.
2017 Transmission Connection Planning Report Risk Assessment: BETS
Page 3 of 5
have a value to consumers of around $23,600, (based on a value of customer reliability of $39,420/MWh).
It should also be noted that the above estimates of energy at risk and expected unserved energy are based on an assumption of average (50th percentile) summer temperatures occurring in each year. Under 10th percentile temperature conditions, the energy at risk in 2018 is estimated to be 1,277 MWh. The estimated value to consumers of this energy at risk in 2018 is approximately $50.4 million. The corresponding value of the expected unserved energy (of 2.8 MWh) is approximately $0.11 million.
These key statistics for the year 2018 under N-1 outage conditions are summarised in the table below.
MWh Valued at consumer interruption cost
Energy at risk, at 50th percentile demand forecast 294 $11.6 million
Expected unserved energy at 50th percentile demand 0.6 $23,600
Energy at risk, at 10th percentile demand forecast 1,277 $50.4 million
Expected unserved energy at 10th percentile demand 2.8 $0.11 million
It is noted that the demand at BETS 66 is expected to decrease over the forecast period. Therefore, over the forecast period, the energy at risk and expected unserved energy are also expected to decline from the levels forecast for 2018.
Possible impacts of a transformer outage on customers
If one of the 230/66/22 kV transformers at BETS 66 kV is taken off line during peak loading times and the N-1 station rating is exceeded, the OSSCA2 automatic load shedding scheme which is operated by AusNet Transmission Group’s TOC3 will act swiftly to reduce the loads in blocks to within safe loading limits. Any load reductions that are in excess of the minimum amount required to limit load to the rated capability of the station would be restored at zone substation feeder level in accordance with Powercor’s operational procedures after the operation of the OSSCA scheme.
Feasible options for alleviation of constraints
The following options are technically feasible and potentially economic to mitigate the risk of supply interruption and/or alleviate the emerging constraint over the next ten year planning horizon:
1. Implement a contingency plan to transfer 22 MVA of load away to BETS 22 kV, WETS, KTS East and SHTS in the event of loss of a transformer at BETS 66 kV.
2. Install an additional 150 MVA 220/66 kV transformer at BETS 66 kV.
3. Demand reduction: There is an opportunity for voluntary demand reduction to reduce peak demand during times of network constraint. The amount of demand reduction
2 Overload Shedding Scheme of Connection Asset.
3 Transmission Operation Centre.
2017 Transmission Connection Planning Report Risk Assessment: BETS
Page 4 of 5
would be taken into consideration when determining the optimum timing for the capacity augmentation.
4. Embedded generation, connected to the BETS 66 kV bus, may defer the need for an additional 220/66 kV transformer at BETS 66 kV.
Preferred option(s) for alleviation of constraints
As already noted, a contingency plan to transfer 22 MVA of load to BETS 22 kV, WETS, KTS East and SHTS will be implemented in the event of the loss of one of the BETS 220/66 kV transformers.
Due to the declining load forecast it is unlikely that additional capacity can be economically justified during the forecast period. Demand reduction to reduce the load below the N-1 rating would be the preferred option.
Subject to the availability of an AusNet Transmission Group spare 220/66 kV transformer for rural areas (refer to Section 5.5), a spare transformer can be used to temporarily replace a failed transformer to minimise the transformer outage period.
The table on the following page provides more detailed data on the station rating, demand forecasts, energy at risk and expected unserved energy.
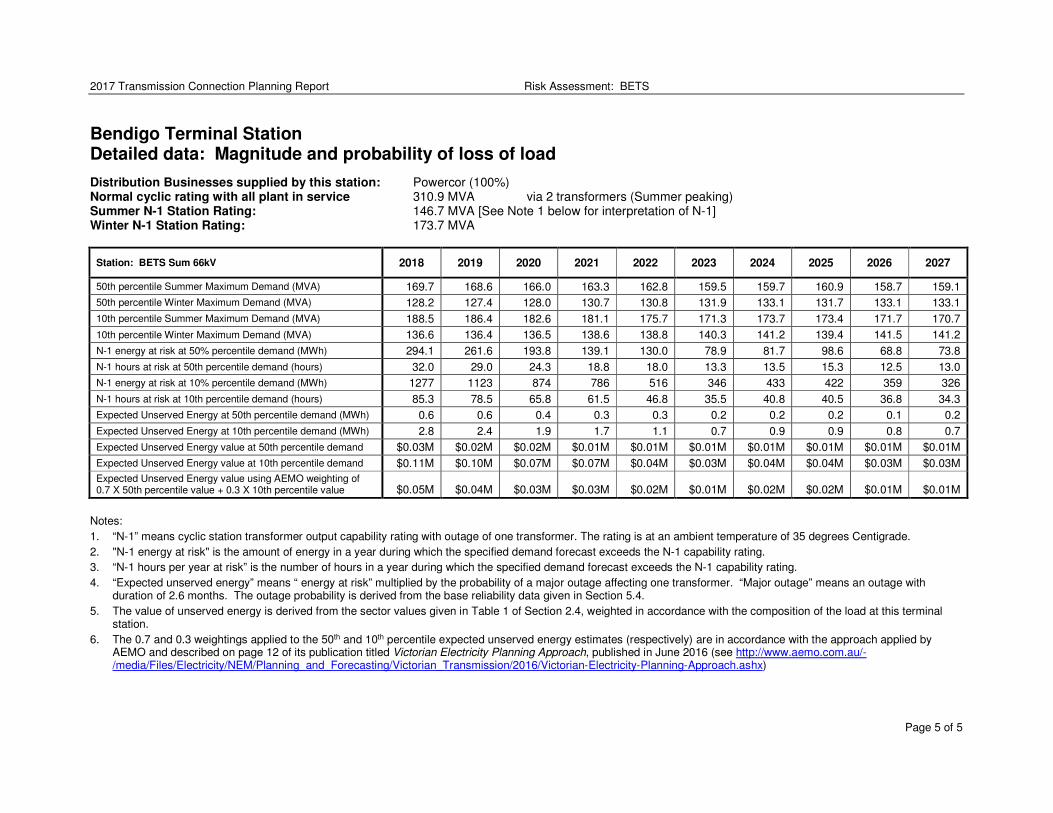
2017 Transmission Connection Planning Report Risk Assessment: BETS
Page 5 of 5
Bendigo Terminal Station
Detailed data: Magnitude and probability of loss of load
Distribution Businesses supplied by this station: Powercor (100%) Normal cyclic rating with all plant in service 310.9 MVA via 2 transformers (Summer peaking) Summer N-1 Station Rating: 146.7 MVA [See Note 1 below for interpretation of N-1] Winter N-1 Station Rating: 173.7 MVA
Station: BETS Sum 66kV 2018 2019 2020 2021 2022 2023 2024 2025 2026 2027
50th percentile Summer Maximum Demand (MVA) 169.7 168.6 166.0 163.3 162.8 159.5 159.7 160.9 158.7 159.1
50th percentile Winter Maximum Demand (MVA) 128.2 127.4 128.0 130.7 130.8 131.9 133.1 131.7 133.1 133.1
10th percentile Summer Maximum Demand (MVA) 188.5 186.4 182.6 181.1 175.7 171.3 173.7 173.4 171.7 170.7
10th percentile Winter Maximum Demand (MVA) 136.6 136.4 136.5 138.6 138.8 140.3 141.2 139.4 141.5 141.2
N-1 energy at risk at 50% percentile demand (MWh) 294.1 261.6 193.8 139.1 130.0 78.9 81.7 98.6 68.8 73.8
N-1 hours at risk at 50th percentile demand (hours) 32.0 29.0 24.3 18.8 18.0 13.3 13.5 15.3 12.5 13.0
N-1 energy at risk at 10% percentile demand (MWh) 1277 1123 874 786 516 346 433 422 359 326
N-1 hours at risk at 10th percentile demand (hours) 85.3 78.5 65.8 61.5 46.8 35.5 40.8 40.5 36.8 34.3
Expected Unserved Energy at 50th percentile demand (MWh) 0.6 0.6 0.4 0.3 0.3 0.2 0.2 0.2 0.1 0.2
Expected Unserved Energy at 10th percentile demand (MWh) 2.8 2.4 1.9 1.7 1.1 0.7 0.9 0.9 0.8 0.7
Expected Unserved Energy value at 50th percentile demand $0.03M $0.02M $0.02M $0.01M $0.01M $0.01M $0.01M $0.01M $0.01M $0.01M
Expected Unserved Energy value at 10th percentile demand $0.11M $0.10M $0.07M $0.07M $0.04M $0.03M $0.04M $0.04M $0.03M $0.03M
Expected Unserved Energy value using AEMO weighting of 0.7 X 50th percentile value + 0.3 X 10th percentile value $0.05M $0.04M $0.03M $0.03M $0.02M $0.01M $0.02M $0.02M $0.01M $0.01M
Notes:
1. “N-1” means cyclic station transformer output capability rating with outage of one transformer. The rating is at an ambient temperature of 35 degrees Centigrade.
2. "N-1 energy at risk" is the amount of energy in a year during which the specified demand forecast exceeds the N-1 capability rating.
3. “N-1 hours per year at risk” is the number of hours in a year during which the specified demand forecast exceeds the N-1 capability rating.
4. “Expected unserved energy” means “ energy at risk” multiplied by the probability of a major outage affecting one transformer. “Major outage” means an outage with duration of 2.6 months. The outage probability is derived from the base reliability data given in Section 5.4.
5. The value of unserved energy is derived from the sector values given in Table 1 of Section 2.4, weighted in accordance with the composition of the load at this terminal station.
6. The 0.7 and 0.3 weightings applied to the 50th and 10th percentile expected unserved energy estimates (respectively) are in accordance with the approach applied by AEMO and described on page 12 of its publication titled Victorian Electricity Planning Approach, published in June 2016 (see http://www.aemo.com.au/-/media/Files/Electricity/NEM/Planning_and_Forecasting/Victorian_Transmission/2016/Victorian-Electricity-Planning-Approach.ashx)
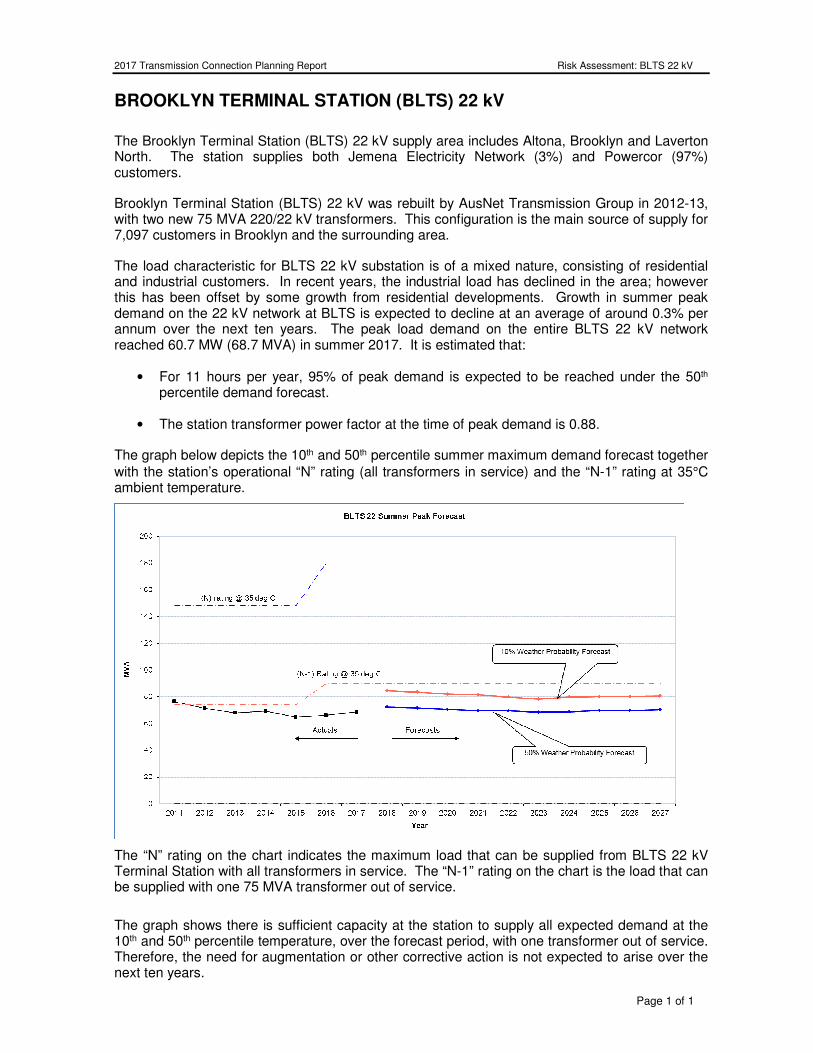
2017 Transmission Connection Planning Report Risk Assessment: BLTS 22 kV
Page 1 of 1
BROOKLYN TERMINAL STATION (BLTS) 22 kV
The Brooklyn Terminal Station (BLTS) 22 kV supply area includes Altona, Brooklyn and Laverton North. The station supplies both Jemena Electricity Network (3%) and Powercor (97%) customers.
Brooklyn Terminal Station (BLTS) 22 kV was rebuilt by AusNet Transmission Group in 2012-13, with two new 75 MVA 220/22 kV transformers. This configuration is the main source of supply for 7,097 customers in Brooklyn and the surrounding area.
The load characteristic for BLTS 22 kV substation is of a mixed nature, consisting of residential and industrial customers. In recent years, the industrial load has declined in the area; however this has been offset by some growth from residential developments. Growth in summer peak demand on the 22 kV network at BLTS is expected to decline at an average of around 0.3% per annum over the next ten years. The peak load demand on the entire BLTS 22 kV network reached 60.7 MW (68.7 MVA) in summer 2017. It is estimated that:
• For 11 hours per year, 95% of peak demand is expected to be reached under the 50th percentile demand forecast.
• The station transformer power factor at the time of peak demand is 0.88.
The graph below depicts the 10th and 50th percentile summer maximum demand forecast together
with the station’s operational “N” rating (all transformers in service) and the “N-1” rating at 35°C ambient temperature.
The “N” rating on the chart indicates the maximum load that can be supplied from BLTS 22 kV Terminal Station with all transformers in service. The “N-1” rating on the chart is the load that can be supplied with one 75 MVA transformer out of service.
The graph shows there is sufficient capacity at the station to supply all expected demand at the 10th and 50th percentile temperature, over the forecast period, with one transformer out of service. Therefore, the need for augmentation or other corrective action is not expected to arise over the next ten years.
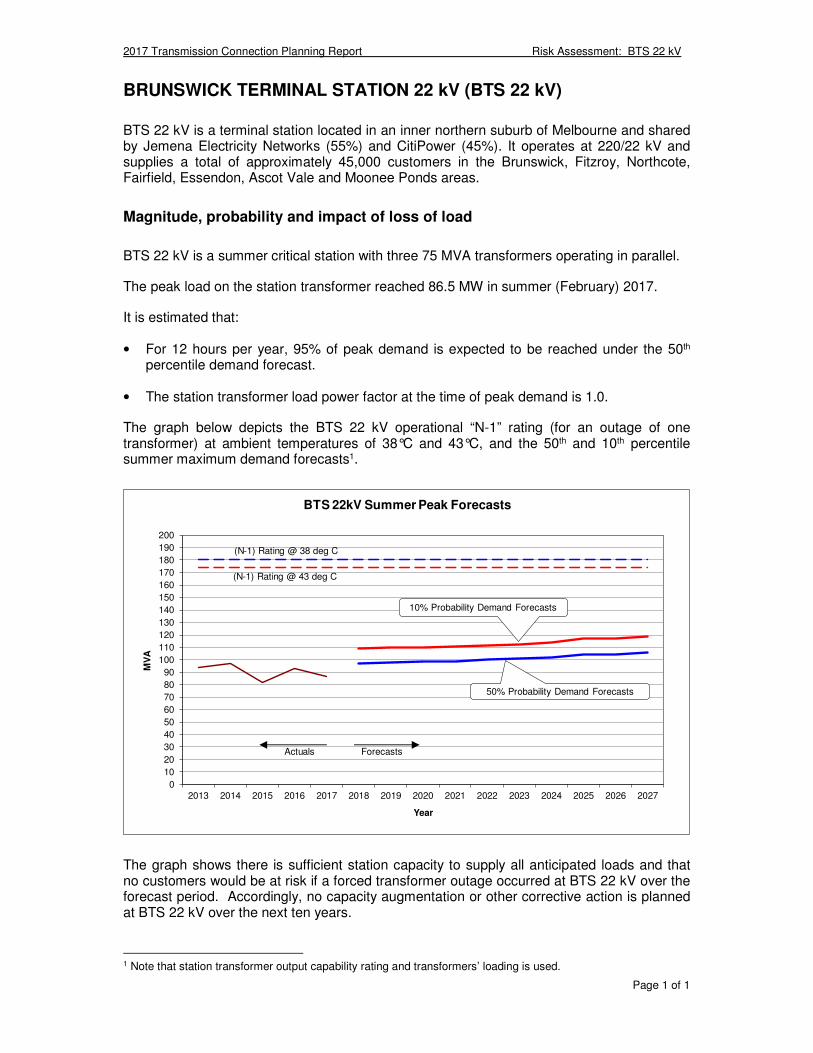
2017 Transmission Connection Planning Report Risk Assessment: BTS 22 kV
Page 1 of 1
BRUNSWICK TERMINAL STATION 22 kV (BTS 22 kV)
BTS 22 kV is a terminal station located in an inner northern suburb of Melbourne and shared by Jemena Electricity Networks (55%) and CitiPower (45%). It operates at 220/22 kV and supplies a total of approximately 45,000 customers in the Brunswick, Fitzroy, Northcote, Fairfield, Essendon, Ascot Vale and Moonee Ponds areas.
Magnitude, probability and impact of loss of load
BTS 22 kV is a summer critical station with three 75 MVA transformers operating in parallel.
The peak load on the station transformer reached 86.5 MW in summer (February) 2017.
It is estimated that:
• For 12 hours per year, 95% of peak demand is expected to be reached under the 50th percentile demand forecast.
• The station transformer load power factor at the time of peak demand is 1.0.
The graph below depicts the BTS 22 kV operational “N-1” rating (for an outage of one transformer) at ambient temperatures of 38°C and 43°C, and the 50th and 10th percentile summer maximum demand forecasts1.
0
10
20
30
40
50
60
70
80
90
100
110
120
130
140
150
160
170
180
190
200
2013 2014 2015 2016 2017 2018 2019 2020 2021 2022 2023 2024 2025 2026 2027
MV
A
Year
BTS 22kV Summer Peak Forecasts
50% Probability Demand Forecasts
10% Probability Demand Forecasts
Actuals Forecasts
(N-1) Rating @ 38 deg C
(N-1) Rating @ 43 deg C
The graph shows there is sufficient station capacity to supply all anticipated loads and that no customers would be at risk if a forced transformer outage occurred at BTS 22 kV over the forecast period. Accordingly, no capacity augmentation or other corrective action is planned at BTS 22 kV over the next ten years.
1 Note that station transformer output capability rating and transformers’ loading is used.
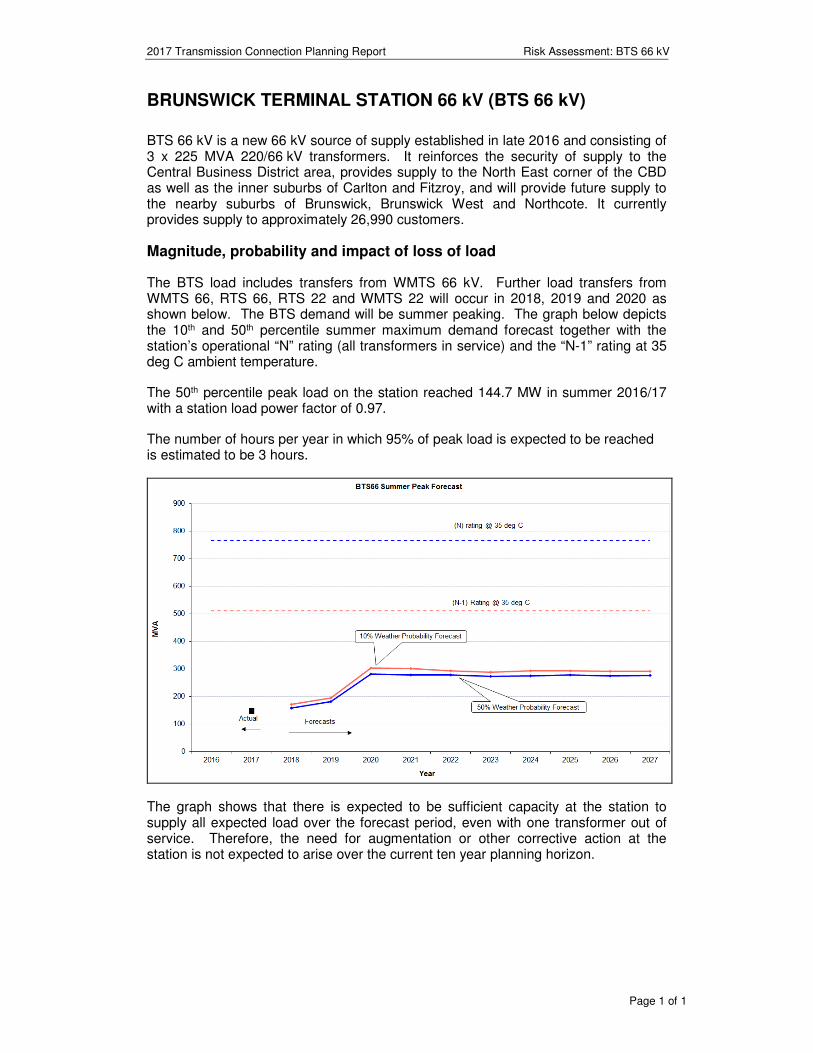
2017 Transmission Connection Planning Report Risk Assessment: BTS 66 kV
Page 1 of 1
BRUNSWICK TERMINAL STATION 66 kV (BTS 66 kV)
BTS 66 kV is a new 66 kV source of supply established in late 2016 and consisting of 3 x 225 MVA 220/66 kV transformers. It reinforces the security of supply to the Central Business District area, provides supply to the North East corner of the CBD as well as the inner suburbs of Carlton and Fitzroy, and will provide future supply to the nearby suburbs of Brunswick, Brunswick West and Northcote. It currently provides supply to approximately 26,990 customers.
Magnitude, probability and impact of loss of load
The BTS load includes transfers from WMTS 66 kV. Further load transfers from WMTS 66, RTS 66, RTS 22 and WMTS 22 will occur in 2018, 2019 and 2020 as shown below. The BTS demand will be summer peaking. The graph below depicts the 10th and 50th percentile summer maximum demand forecast together with the station’s operational “N” rating (all transformers in service) and the “N-1” rating at 35 deg C ambient temperature.
The 50th percentile peak load on the station reached 144.7 MW in summer 2016/17 with a station load power factor of 0.97.
The number of hours per year in which 95% of peak load is expected to be reached is estimated to be 3 hours.
The graph shows that there is expected to be sufficient capacity at the station to supply all expected load over the forecast period, even with one transformer out of service. Therefore, the need for augmentation or other corrective action at the station is not expected to arise over the current ten year planning horizon.
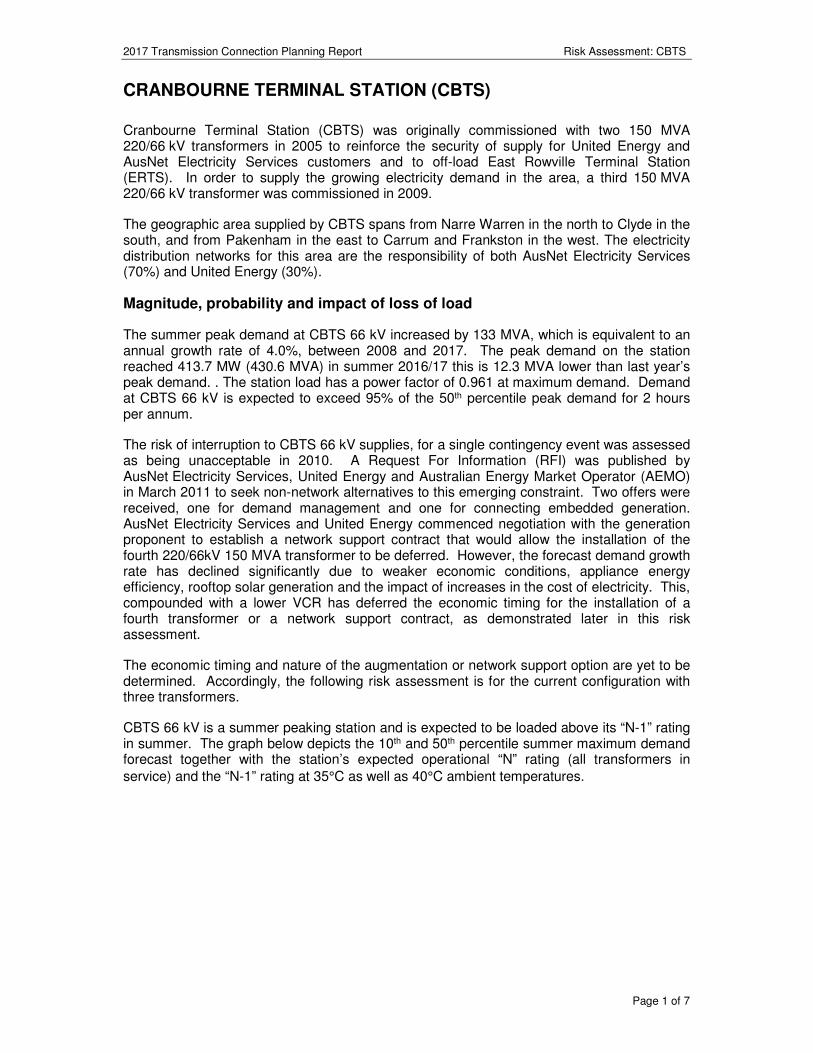
2017 Transmission Connection Planning Report Risk Assessment: CBTS
Page 1 of 7
CRANBOURNE TERMINAL STATION (CBTS)
Cranbourne Terminal Station (CBTS) was originally commissioned with two 150 MVA 220/66 kV transformers in 2005 to reinforce the security of supply for United Energy and AusNet Electricity Services customers and to off-load East Rowville Terminal Station (ERTS). In order to supply the growing electricity demand in the area, a third 150 MVA 220/66 kV transformer was commissioned in 2009.
The geographic area supplied by CBTS spans from Narre Warren in the north to Clyde in the south, and from Pakenham in the east to Carrum and Frankston in the west. The electricity distribution networks for this area are the responsibility of both AusNet Electricity Services (70%) and United Energy (30%).
Magnitude, probability and impact of loss of load
The summer peak demand at CBTS 66 kV increased by 133 MVA, which is equivalent to an annual growth rate of 4.0%, between 2008 and 2017. The peak demand on the station reached 413.7 MW (430.6 MVA) in summer 2016/17 this is 12.3 MVA lower than last year’s peak demand. . The station load has a power factor of 0.961 at maximum demand. Demand at CBTS 66 kV is expected to exceed 95% of the 50th percentile peak demand for 2 hours per annum.
The risk of interruption to CBTS 66 kV supplies, for a single contingency event was assessed as being unacceptable in 2010. A Request For Information (RFI) was published by AusNet Electricity Services, United Energy and Australian Energy Market Operator (AEMO) in March 2011 to seek non-network alternatives to this emerging constraint. Two offers were received, one for demand management and one for connecting embedded generation. AusNet Electricity Services and United Energy commenced negotiation with the generation proponent to establish a network support contract that would allow the installation of the fourth 220/66kV 150 MVA transformer to be deferred. However, the forecast demand growth rate has declined significantly due to weaker economic conditions, appliance energy efficiency, rooftop solar generation and the impact of increases in the cost of electricity. This, compounded with a lower VCR has deferred the economic timing for the installation of a fourth transformer or a network support contract, as demonstrated later in this risk assessment.
The economic timing and nature of the augmentation or network support option are yet to be determined. Accordingly, the following risk assessment is for the current configuration with three transformers.
CBTS 66 kV is a summer peaking station and is expected to be loaded above its “N-1” rating in summer. The graph below depicts the 10th and 50th percentile summer maximum demand forecast together with the station’s expected operational “N” rating (all transformers in
service) and the “N-1” rating at 35°C as well as 40°C ambient temperatures.
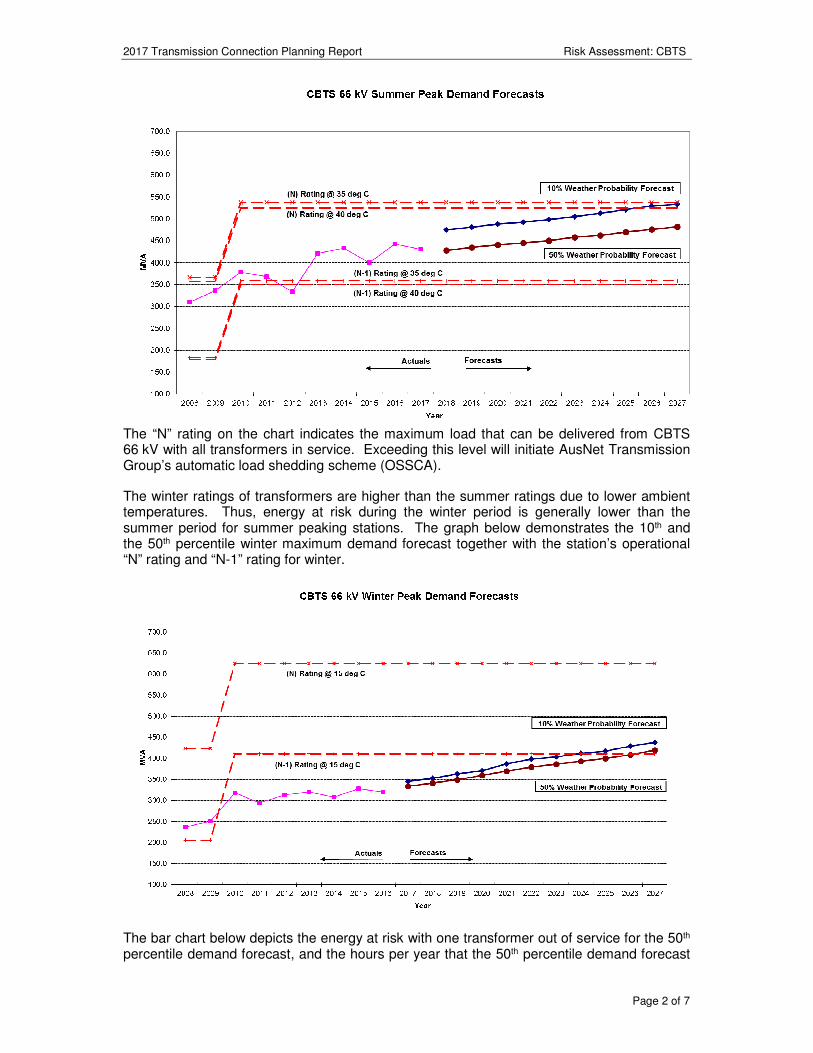
2017 Transmission Connection Planning Report Risk Assessment: CBTS
Page 2 of 7
The “N” rating on the chart indicates the maximum load that can be delivered from CBTS 66 kV with all transformers in service. Exceeding this level will initiate AusNet Transmission Group’s automatic load shedding scheme (OSSCA).
The winter ratings of transformers are higher than the summer ratings due to lower ambient temperatures. Thus, energy at risk during the winter period is generally lower than the summer period for summer peaking stations. The graph below demonstrates the 10th and the 50th percentile winter maximum demand forecast together with the station’s operational “N” rating and “N-1” rating for winter.
The bar chart below depicts the energy at risk with one transformer out of service for the 50th percentile demand forecast, and the hours per year that the 50th percentile demand forecast
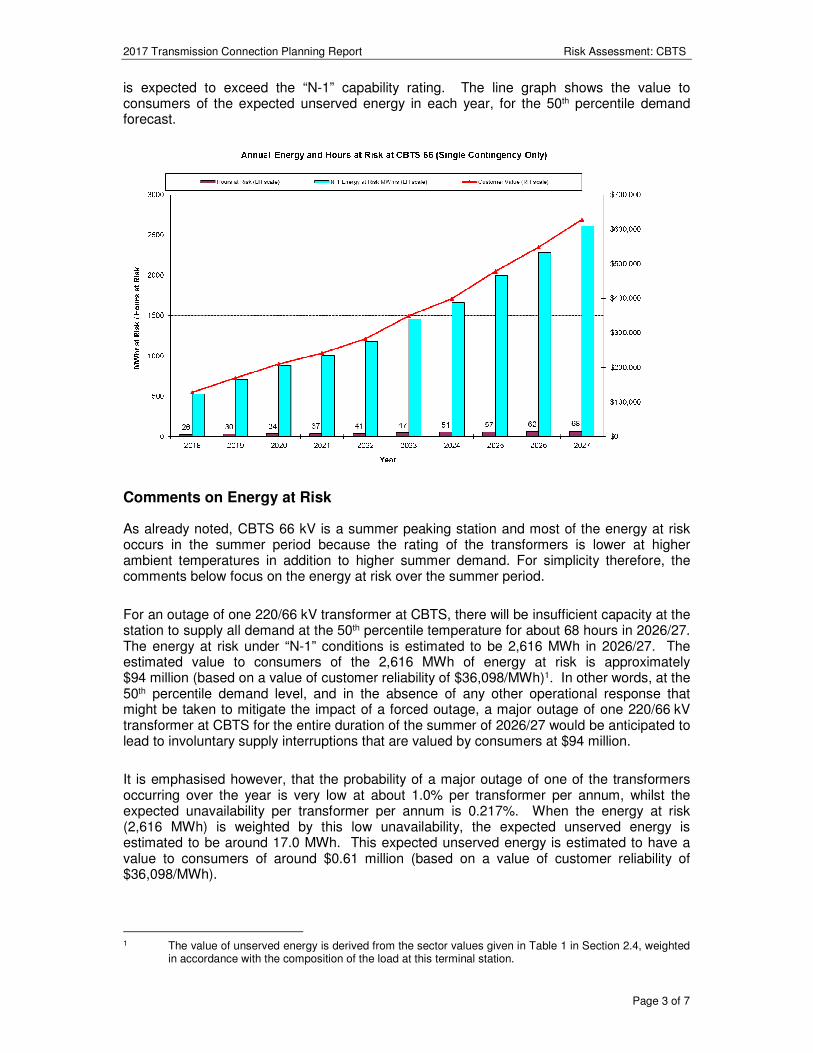
2017 Transmission Connection Planning Report Risk Assessment: CBTS
Page 3 of 7
is expected to exceed the “N-1” capability rating. The line graph shows the value to consumers of the expected unserved energy in each year, for the 50th percentile demand forecast.
Comments on Energy at Risk
As already noted, CBTS 66 kV is a summer peaking station and most of the energy at risk occurs in the summer period because the rating of the transformers is lower at higher ambient temperatures in addition to higher summer demand. For simplicity therefore, the comments below focus on the energy at risk over the summer period.
For an outage of one 220/66 kV transformer at CBTS, there will be insufficient capacity at the station to supply all demand at the 50th percentile temperature for about 68 hours in 2026/27. The energy at risk under “N-1” conditions is estimated to be 2,616 MWh in 2026/27. The estimated value to consumers of the 2,616 MWh of energy at risk is approximately $94 million (based on a value of customer reliability of $36,098/MWh)1. In other words, at the 50th percentile demand level, and in the absence of any other operational response that might be taken to mitigate the impact of a forced outage, a major outage of one 220/66 kV transformer at CBTS for the entire duration of the summer of 2026/27 would be anticipated to lead to involuntary supply interruptions that are valued by consumers at $94 million.
It is emphasised however, that the probability of a major outage of one of the transformers occurring over the year is very low at about 1.0% per transformer per annum, whilst the expected unavailability per transformer per annum is 0.217%. When the energy at risk (2,616 MWh) is weighted by this low unavailability, the expected unserved energy is estimated to be around 17.0 MWh. This expected unserved energy is estimated to have a value to consumers of around $0.61 million (based on a value of customer reliability of $36,098/MWh).
1 The value of unserved energy is derived from the sector values given in Table 1 in Section 2.4, weighted
in accordance with the composition of the load at this terminal station.
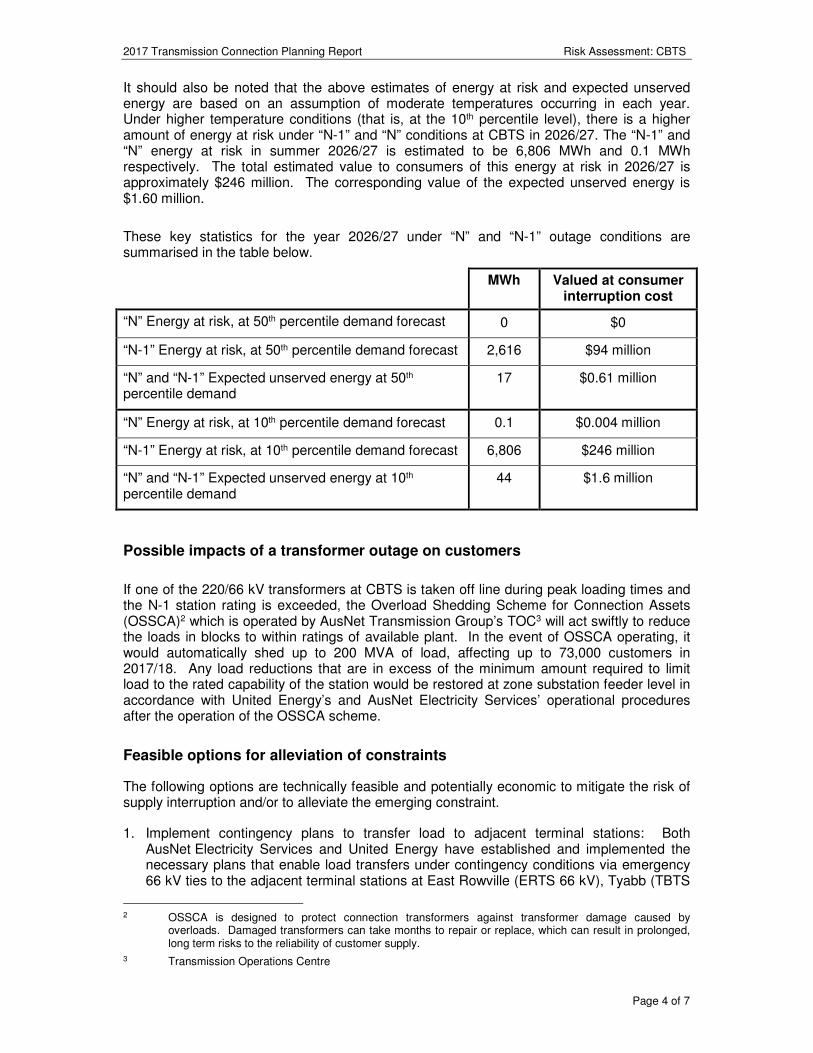
2017 Transmission Connection Planning Report Risk Assessment: CBTS
Page 4 of 7
It should also be noted that the above estimates of energy at risk and expected unserved energy are based on an assumption of moderate temperatures occurring in each year. Under higher temperature conditions (that is, at the 10th percentile level), there is a higher amount of energy at risk under “N-1” and “N” conditions at CBTS in 2026/27. The “N-1” and “N” energy at risk in summer 2026/27 is estimated to be 6,806 MWh and 0.1 MWh respectively. The total estimated value to consumers of this energy at risk in 2026/27 is approximately $246 million. The corresponding value of the expected unserved energy is $1.60 million.
These key statistics for the year 2026/27 under “N” and “N-1” outage conditions are summarised in the table below.
MWh Valued at consumer interruption cost
“N” Energy at risk, at 50th percentile demand forecast 0 $0
“N-1” Energy at risk, at 50th percentile demand forecast 2,616 $94 million
“N” and “N-1” Expected unserved energy at 50th percentile demand
17 $0.61 million
“N” Energy at risk, at 10th percentile demand forecast 0.1 $0.004 million
“N-1” Energy at risk, at 10th percentile demand forecast 6,806 $246 million
“N” and “N-1” Expected unserved energy at 10th percentile demand
44 $1.6 million
Possible impacts of a transformer outage on customers
If one of the 220/66 kV transformers at CBTS is taken off line during peak loading times and the N-1 station rating is exceeded, the Overload Shedding Scheme for Connection Assets (OSSCA)2 which is operated by AusNet Transmission Group’s TOC3 will act swiftly to reduce the loads in blocks to within ratings of available plant. In the event of OSSCA operating, it would automatically shed up to 200 MVA of load, affecting up to 73,000 customers in 2017/18. Any load reductions that are in excess of the minimum amount required to limit load to the rated capability of the station would be restored at zone substation feeder level in accordance with United Energy’s and AusNet Electricity Services’ operational procedures after the operation of the OSSCA scheme.
Feasible options for alleviation of constraints
The following options are technically feasible and potentially economic to mitigate the risk of supply interruption and/or to alleviate the emerging constraint.
1. Implement contingency plans to transfer load to adjacent terminal stations: Both AusNet Electricity Services and United Energy have established and implemented the necessary plans that enable load transfers under contingency conditions via emergency 66 kV ties to the adjacent terminal stations at East Rowville (ERTS 66 kV), Tyabb (TBTS
2 OSSCA is designed to protect connection transformers against transformer damage caused by
overloads. Damaged transformers can take months to repair or replace, which can result in prolonged, long term risks to the reliability of customer supply.
3 Transmission Operations Centre
2017 Transmission Connection Planning Report Risk Assessment: CBTS
Page 5 of 7
66 kV) and Heatherton (HTS 66 kV). The emergency 66 kV ties can be in operation within 2 hours and have a combined capability to transfer up to 150 MVA of load. The 22 kV distribution network is also capable of transferring a further 55 MVA.
2. Establish a new 220/66 kV terminal station: AusNet Electricity Services expects that a new terminal station in the Pakenham area (with a site yet to be acquired) will be required in around 10 to 20 years to service demand growth in the region. This development will help to off-load CBTS as well as addressing constraints on the existing 66 kV sub-transmission network from CBTS to the Pakenham area. AusNet Electricity Services will carry out planning studies to assess whether this option is economic, and if so, to determine the optimal timing of any investment. An alternative would be to develop a new terminal station on a reserved site in North Pearcedale. The North Pearcedale site, however, is not located within the growth area and is considered suboptimal at this time.
3. Install a 4th 220/66 kV transformer at Cranbourne Terminal Station: The site has provision for a 4th transformer and implementing this option is relatively straight forward, however it would require 66 kV lines to be re-arranged so that the station can operate with split 66 kV buses in order to maintain fault levels within equipment ratings.
4. Install two new 50 MVAR 66 kV capacitor banks: CBTS currently does not have 66 kV capacitor banks and the station operates with a power factor around 0.961 lagging in summer. Two 50 MVAR 66 kV capacitor banks will help to reduce the net MVA supplied by the transformers by approximately 13 MVA and would defer a network augmentation by one to two years. AEMO have also been considering installing capacitors at CBTS to support the transmission network and any opportunity to install 66 kV capacitors at CBTS to provide benefits in both areas will be identified through joint planning with AEMO.
5. Demand Management: United Energy and AusNet Electricity Services have developed a number of innovative network tariffs that encourage voluntary demand reduction during times of network constraints. The amount of demand reduction depends on the tariff uptake and the subsequent change in the load pattern and will be taken into consideration when determining the optimum timing for the capacity augmentation.
6. Embedded Generation: Embedded generation, with a capacity in the order of 20 MW, connected to the CBTS 66 kV bus, will defer the need for augmentation by one to two years.
Preferred network option for alleviation of constraints
Although AusNet Electricity Services and United Energy have commenced the process of addressing the supply risks at CBTS, as discussed earlier, the recent reduction in demand forecasts coupled with the reduction in AEMO’s VCR estimate in 20144 indicate that these activities can be deferred. The preferred option of network support and then the installation of a fourth 150 MVA 220/66 kV transformer can be deferred until after 2027 based on the latest demand forecasts, and the 2017 VCR estimate. The installation of fourth transformer would be economic in around 2027 based on AEMO’s previous VCR estimate (escalated to 2017 dollars). The installation of two new 50 MVAR 66 kV capacitor banks at CBTS could be economic earlier if they also supported the needs of the transmission network.
Prior to implementing any augmentation option it is proposed to implement the following temporary measures to cater for an unplanned outage of one transformer at CBTS under critical loading conditions:
4 See section 2.4.
2017 Transmission Connection Planning Report Risk Assessment: CBTS
Page 6 of 7
• maintain contingency plans to transfer load to adjacent terminal stations;
• fine-tune the OSSCA scheme settings to minimise the impact on customers of any automatic load shedding that may take place; and
• subject to the availability of a spare 220/66 kV transformer for metropolitan areas (refer Section 5.5), a spare transformer can be used to temporarily replace a failed transformer.
The capital cost of installing a fourth 150 MVA 220/66 kV transformer at CBTS is estimated to be $20 million. The cost of establishing, operating and maintaining a new transformer would be recovered from network users through network charges, over the life of the asset. The estimated total annual cost of this network augmentation is approximately $2 million. This cost provides a broad upper bound for the maximum annual network support payment which may be available to embedded generators or customers to reduce forecast demand, and to defer or avoid the transmission connection component of this augmentation. Any non-network solution that defers this augmentation for say 1-2 years, will not have as much potential value (and contribution available from distributors) as a solution that eliminates or defers the augmentation for, say, 10 years.
The table on the following page provides more detailed data on the station rating, demand forecasts, energy at risk and expected unserved energy.
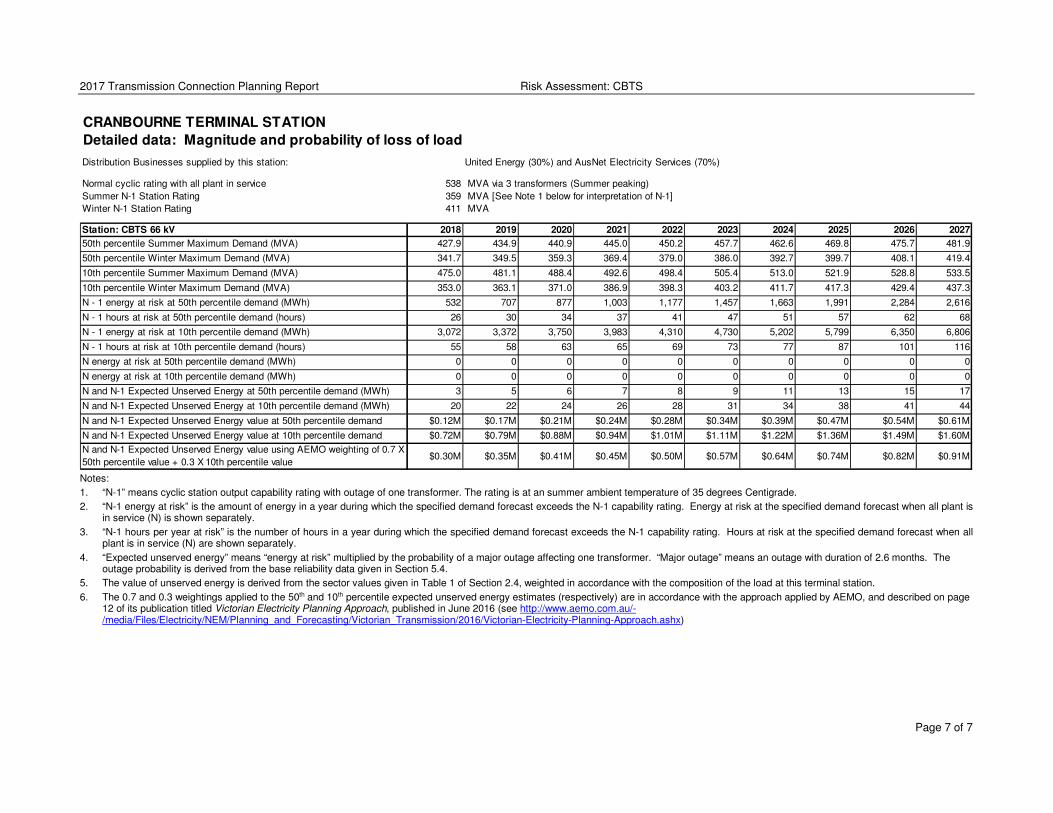
2017 Transmission Connection Planning Report Risk Assessment: CBTS
Page 7 of 7
CRANBOURNE TERMINAL STATION
Detailed data: Magnitude and probability of loss of load
Distribution Businesses supplied by this station: United Energy (30%) and AusNet Electricity Services (70%)
Normal cyclic rating with all plant in service 538 MVA via 3 transformers (Summer peaking)
Summer N-1 Station Rating 359 MVA [See Note 1 below for interpretation of N-1]
Winter N-1 Station Rating 411 MVA
Station: CBTS 66 kV 2018 2019 2020 2021 2022 2023 2024 2025 2026 2027
50th percentile Summer Maximum Demand (MVA) 427.9 434.9 440.9 445.0 450.2 457.7 462.6 469.8 475.7 481.9
50th percentile Winter Maximum Demand (MVA) 341.7 349.5 359.3 369.4 379.0 386.0 392.7 399.7 408.1 419.4
10th percentile Summer Maximum Demand (MVA) 475.0 481.1 488.4 492.6 498.4 505.4 513.0 521.9 528.8 533.5
10th percentile Winter Maximum Demand (MVA) 353.0 363.1 371.0 386.9 398.3 403.2 411.7 417.3 429.4 437.3
N - 1 energy at risk at 50th percentile demand (MWh) 532 707 877 1,003 1,177 1,457 1,663 1,991 2,284 2,616
N - 1 hours at risk at 50th percentile demand (hours) 26 30 34 37 41 47 51 57 62 68
N - 1 energy at risk at 10th percentile demand (MWh) 3,072 3,372 3,750 3,983 4,310 4,730 5,202 5,799 6,350 6,806
N - 1 hours at risk at 10th percentile demand (hours) 55 58 63 65 69 73 77 87 101 116
N energy at risk at 50th percentile demand (MWh) 0 0 0 0 0 0 0 0 0 0
N energy at risk at 10th percentile demand (MWh) 0 0 0 0 0 0 0 0 0 0
N and N-1 Expected Unserved Energy at 50th percentile demand (MWh) 3 5 6 7 8 9 11 13 15 17
N and N-1 Expected Unserved Energy at 10th percentile demand (MWh) 20 22 24 26 28 31 34 38 41 44
N and N-1 Expected Unserved Energy value at 50th percentile demand $0.12M $0.17M $0.21M $0.24M $0.28M $0.34M $0.39M $0.47M $0.54M $0.61M
N and N-1 Expected Unserved Energy value at 10th percentile demand $0.72M $0.79M $0.88M $0.94M $1.01M $1.11M $1.22M $1.36M $1.49M $1.60M
N and N-1 Expected Unserved Energy value using AEMO weighting of 0.7 X
50th percentile value + 0.3 X 10th percentile value$0.30M $0.35M $0.41M $0.45M $0.50M $0.57M $0.64M $0.74M $0.82M $0.91M
Notes:
1. “N-1” means cyclic station output capability rating with outage of one transformer. The rating is at an summer ambient temperature of 35 degrees Centigrade.
2. “N-1 energy at risk” is the amount of energy in a year during which the specified demand forecast exceeds the N-1 capability rating. Energy at risk at the specified demand forecast when all plant is in service (N) is shown separately.
3. “N-1 hours per year at risk” is the number of hours in a year during which the specified demand forecast exceeds the N-1 capability rating. Hours at risk at the specified demand forecast when all plant is in service (N) are shown separately.
4. “Expected unserved energy” means “energy at risk” multiplied by the probability of a major outage affecting one transformer. “Major outage” means an outage with duration of 2.6 months. The outage probability is derived from the base reliability data given in Section 5.4.
5. The value of unserved energy is derived from the sector values given in Table 1 of Section 2.4, weighted in accordance with the composition of the load at this terminal station.
6. The 0.7 and 0.3 weightings applied to the 50th and 10th percentile expected unserved energy estimates (respectively) are in accordance with the approach applied by AEMO, and described on page 12 of its publication titled Victorian Electricity Planning Approach, published in June 2016 (see http://www.aemo.com.au/-/media/Files/Electricity/NEM/Planning_and_Forecasting/Victorian_Transmission/2016/Victorian-Electricity-Planning-Approach.ashx)
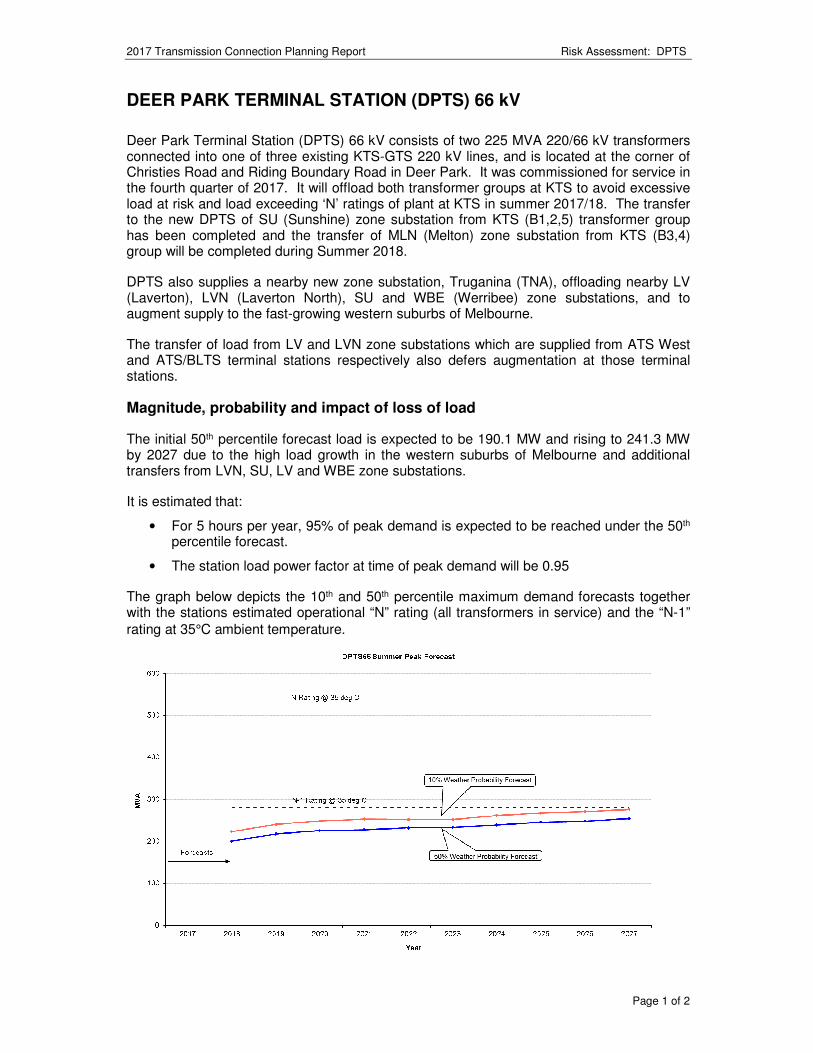
2017 Transmission Connection Planning Report Risk Assessment: DPTS
Page 1 of 2
DEER PARK TERMINAL STATION (DPTS) 66 kV
Deer Park Terminal Station (DPTS) 66 kV consists of two 225 MVA 220/66 kV transformers connected into one of three existing KTS-GTS 220 kV lines, and is located at the corner of Christies Road and Riding Boundary Road in Deer Park. It was commissioned for service in the fourth quarter of 2017. It will offload both transformer groups at KTS to avoid excessive load at risk and load exceeding ‘N’ ratings of plant at KTS in summer 2017/18. The transfer to the new DPTS of SU (Sunshine) zone substation from KTS (B1,2,5) transformer group has been completed and the transfer of MLN (Melton) zone substation from KTS (B3,4) group will be completed during Summer 2018.
DPTS also supplies a nearby new zone substation, Truganina (TNA), offloading nearby LV (Laverton), LVN (Laverton North), SU and WBE (Werribee) zone substations, and to augment supply to the fast-growing western suburbs of Melbourne.
The transfer of load from LV and LVN zone substations which are supplied from ATS West and ATS/BLTS terminal stations respectively also defers augmentation at those terminal stations.
Magnitude, probability and impact of loss of load
The initial 50th percentile forecast load is expected to be 190.1 MW and rising to 241.3 MW by 2027 due to the high load growth in the western suburbs of Melbourne and additional transfers from LVN, SU, LV and WBE zone substations.
It is estimated that:
• For 5 hours per year, 95% of peak demand is expected to be reached under the 50th percentile forecast.
• The station load power factor at time of peak demand will be 0.95
The graph below depicts the 10th and 50th percentile maximum demand forecasts together with the stations estimated operational “N” rating (all transformers in service) and the “N-1”
rating at 35°C ambient temperature.

2017 Transmission Connection Planning Report Risk Assessment: DPTS
Page 2 of 2
The (N) rating on the chart indicates the maximum load that can be supplied from DPTS with all transformers in service. The “N-1” rating on the chart is the load that can be supplied from DPTS with one 225 MVA transformer out of service.
The graph shows there is sufficient capacity at the station to supply all expected demand at the 10th and 50th percentile temperature, over the forecast period, even with one transformer out of service. Therefore, the need for augmentation or other corrective action is not expected to arise over the next ten years.
2017 Transmission Connection Planning Report Risk Assessment: ERTS
Page 1 of 5
EAST ROWVILLE TERMINAL STATION (ERTS)
ERTS is the main source of supply for part of the outer south-eastern corridor of Melbourne. The geographic coverage of the area supplied by this station spans from Scoresby in the north to Lyndhurst in the south, and from Belgrave in the east to Mulgrave in the west. The electricity supply network for this large region is split between United Energy (UE) and AusNet Electricity Services.
ERTS 66 kV is a summer critical station. The station reached its highest recorded peak demand of 504.9 MW (523.4 MVA) in summer 2009 under extreme weather conditions. The recorded demand in summer 2017 was 436.9 MW (453.4 MVA). Five embedded generation units over 1 MW are connected at ERTS 66 kV.1
The risk of supply interruption at ERTS 66 kV for a single contingency event was assessed as being unacceptable in 2007. As a result, a Regulatory Test was undertaken by both AusNet Electricity Services and United Energy which identified the installation of a fourth 150 MVA 220/66 kV transformer as the most economic network solution. A new fourth transformer was installed at ERTS and commissioned in January 2012.
In 2012, AusNet Electricity Services transferred approximately 15 MVA of load away from ERTS to CBTS. This load transfer is reflected in the figure below.
When United Energy’s new Keysborough zone substation was commissioned in 2014-15, approximately 7 MW of demand was transferred away from ERTS to HTS. This load transfer is also reflected in the figure below.
Magnitude, probability and impact of loss of load
The graph below depicts the 10th and 50th percentile total summer maximum demand forecasts together with the station’s expected operational N rating (all transformers in service) and the (N-1) rating at 35°C as well as 40°C ambient temperature.
1 The maximum demand forecasts adopted in this risk analysis excludes the impact of the five generation schemes.
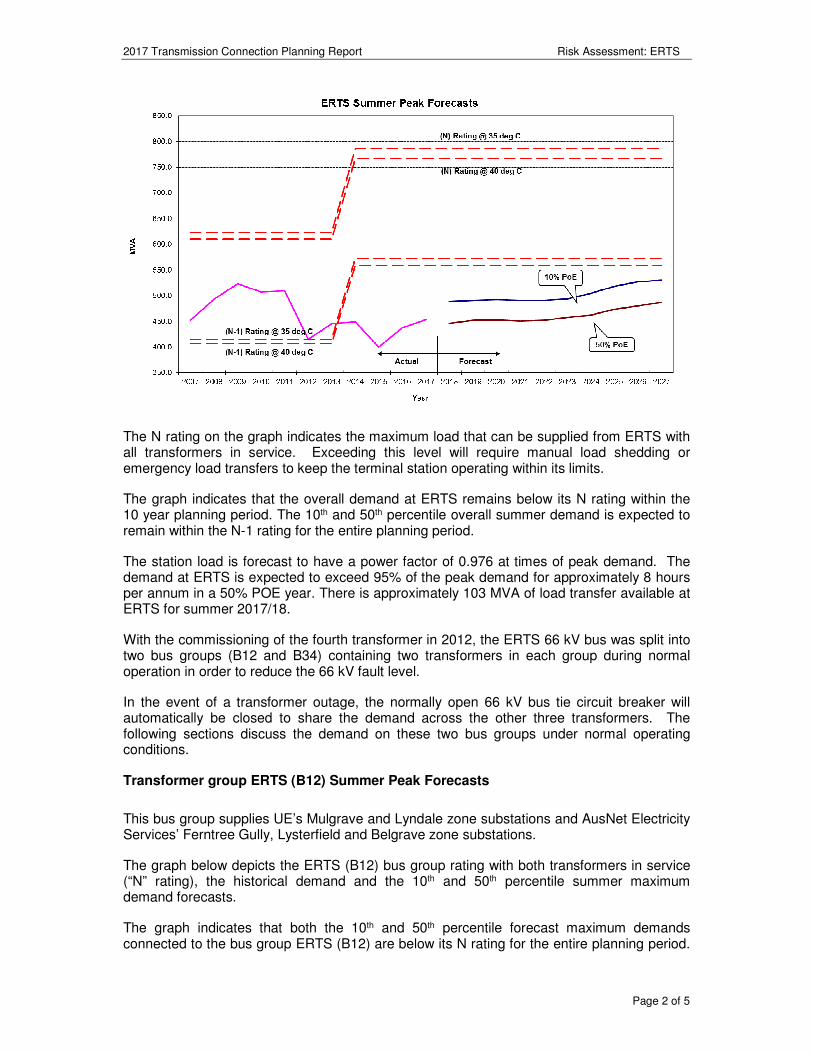
2017 Transmission Connection Planning Report Risk Assessment: ERTS
Page 2 of 5
The N rating on the graph indicates the maximum load that can be supplied from ERTS with all transformers in service. Exceeding this level will require manual load shedding or emergency load transfers to keep the terminal station operating within its limits.
The graph indicates that the overall demand at ERTS remains below its N rating within the 10 year planning period. The 10th and 50th percentile overall summer demand is expected to remain within the N-1 rating for the entire planning period.
The station load is forecast to have a power factor of 0.976 at times of peak demand. The demand at ERTS is expected to exceed 95% of the peak demand for approximately 8 hours per annum in a 50% POE year. There is approximately 103 MVA of load transfer available at ERTS for summer 2017/18.
With the commissioning of the fourth transformer in 2012, the ERTS 66 kV bus was split into two bus groups (B12 and B34) containing two transformers in each group during normal operation in order to reduce the 66 kV fault level.
In the event of a transformer outage, the normally open 66 kV bus tie circuit breaker will automatically be closed to share the demand across the other three transformers. The following sections discuss the demand on these two bus groups under normal operating conditions.
Transformer group ERTS (B12) Summer Peak Forecasts
This bus group supplies UE’s Mulgrave and Lyndale zone substations and AusNet Electricity Services’ Ferntree Gully, Lysterfield and Belgrave zone substations.
The graph below depicts the ERTS (B12) bus group rating with both transformers in service (“N” rating), the historical demand and the 10th and 50th percentile summer maximum demand forecasts.
The graph indicates that both the 10th and 50th percentile forecast maximum demands connected to the bus group ERTS (B12) are below its N rating for the entire planning period.
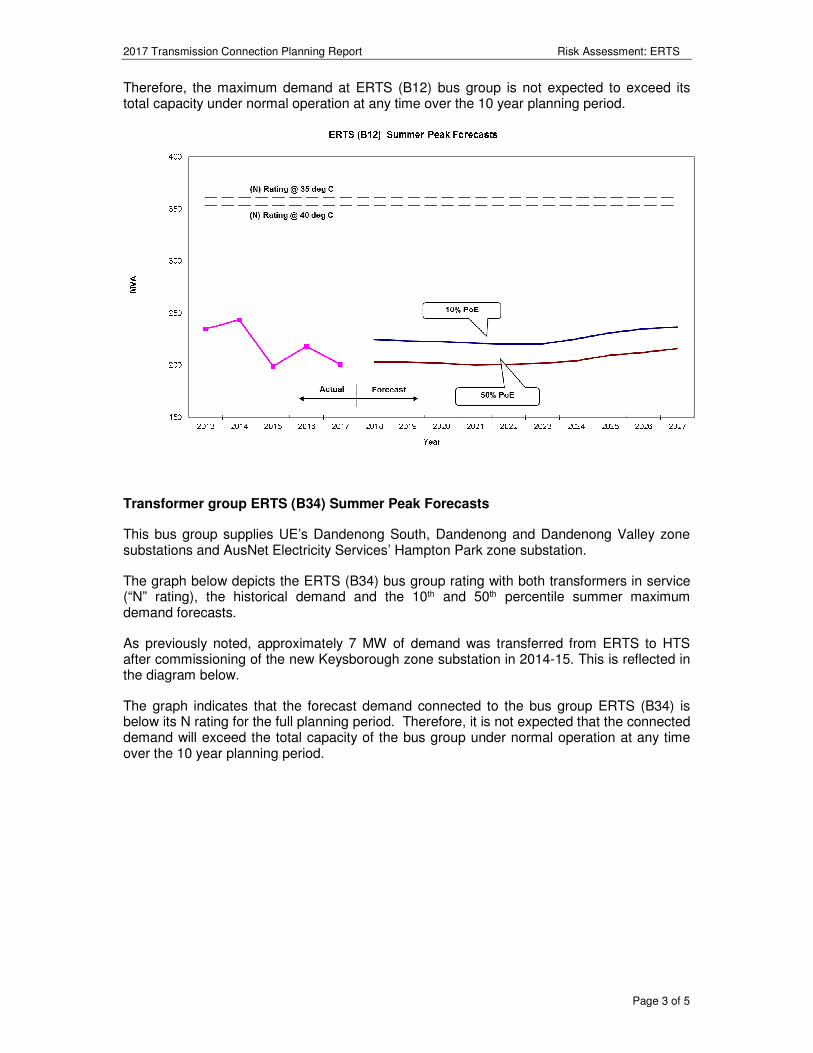
2017 Transmission Connection Planning Report Risk Assessment: ERTS
Page 3 of 5
Therefore, the maximum demand at ERTS (B12) bus group is not expected to exceed its total capacity under normal operation at any time over the 10 year planning period.
Transformer group ERTS (B34) Summer Peak Forecasts
This bus group supplies UE’s Dandenong South, Dandenong and Dandenong Valley zone substations and AusNet Electricity Services’ Hampton Park zone substation.
The graph below depicts the ERTS (B34) bus group rating with both transformers in service (“N” rating), the historical demand and the 10th and 50th percentile summer maximum demand forecasts.
As previously noted, approximately 7 MW of demand was transferred from ERTS to HTS after commissioning of the new Keysborough zone substation in 2014-15. This is reflected in the diagram below.
The graph indicates that the forecast demand connected to the bus group ERTS (B34) is below its N rating for the full planning period. Therefore, it is not expected that the connected demand will exceed the total capacity of the bus group under normal operation at any time over the 10 year planning period.
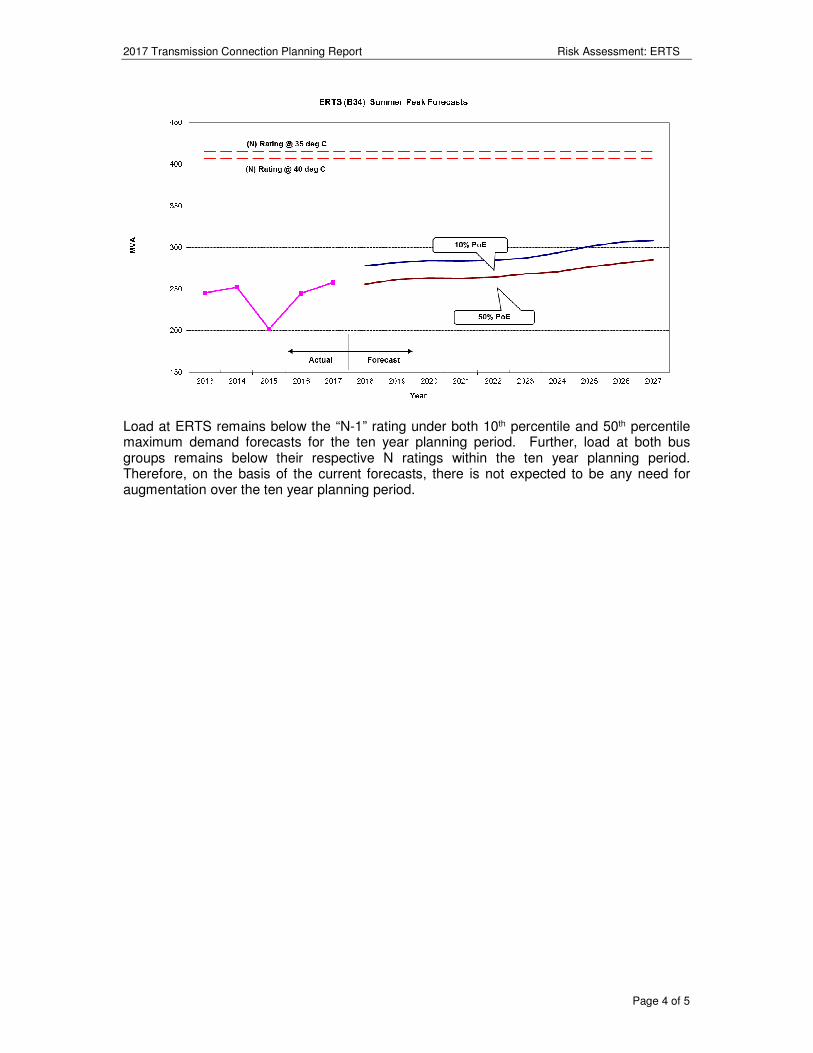
2017 Transmission Connection Planning Report Risk Assessment: ERTS
Page 4 of 5
Load at ERTS remains below the “N-1” rating under both 10th percentile and 50th percentile maximum demand forecasts for the ten year planning period. Further, load at both bus groups remains below their respective N ratings within the ten year planning period. Therefore, on the basis of the current forecasts, there is not expected to be any need for augmentation over the ten year planning period.
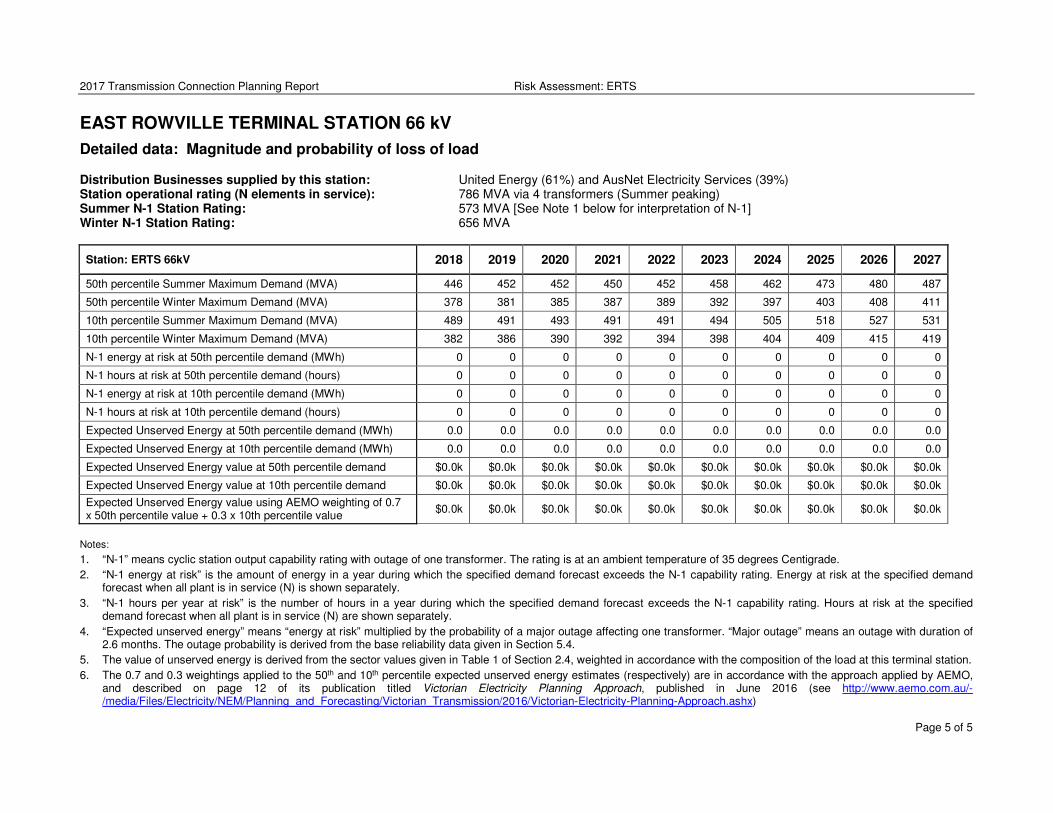
2017 Transmission Connection Planning Report Risk Assessment: ERTS
Page 5 of 5
EAST ROWVILLE TERMINAL STATION 66 kV
Detailed data: Magnitude and probability of loss of load
Distribution Businesses supplied by this station: United Energy (61%) and AusNet Electricity Services (39%) Station operational rating (N elements in service): 786 MVA via 4 transformers (Summer peaking) Summer N-1 Station Rating: 573 MVA [See Note 1 below for interpretation of N-1] Winter N-1 Station Rating: 656 MVA
Station: ERTS 66kV 2018 2019 2020 2021 2022 2023 2024 2025 2026 2027
50th percentile Summer Maximum Demand (MVA) 446 452 452 450 452 458 462 473 480 487
50th percentile Winter Maximum Demand (MVA) 378 381 385 387 389 392 397 403 408 411
10th percentile Summer Maximum Demand (MVA) 489 491 493 491 491 494 505 518 527 531
10th percentile Winter Maximum Demand (MVA) 382 386 390 392 394 398 404 409 415 419
N-1 energy at risk at 50th percentile demand (MWh) 0 0 0 0 0 0 0 0 0 0
N-1 hours at risk at 50th percentile demand (hours) 0 0 0 0 0 0 0 0 0 0
N-1 energy at risk at 10th percentile demand (MWh) 0 0 0 0 0 0 0 0 0 0
N-1 hours at risk at 10th percentile demand (hours) 0 0 0 0 0 0 0 0 0 0
Expected Unserved Energy at 50th percentile demand (MWh) 0.0 0.0 0.0 0.0 0.0 0.0 0.0 0.0 0.0 0.0
Expected Unserved Energy at 10th percentile demand (MWh) 0.0 0.0 0.0 0.0 0.0 0.0 0.0 0.0 0.0 0.0
Expected Unserved Energy value at 50th percentile demand $0.0k $0.0k $0.0k $0.0k $0.0k $0.0k $0.0k $0.0k $0.0k $0.0k
Expected Unserved Energy value at 10th percentile demand $0.0k $0.0k $0.0k $0.0k $0.0k $0.0k $0.0k $0.0k $0.0k $0.0k
Expected Unserved Energy value using AEMO weighting of 0.7 x 50th percentile value + 0.3 x 10th percentile value
$0.0k $0.0k $0.0k $0.0k $0.0k $0.0k $0.0k $0.0k $0.0k $0.0k
Notes:
1. “N-1” means cyclic station output capability rating with outage of one transformer. The rating is at an ambient temperature of 35 degrees Centigrade.
2. “N-1 energy at risk” is the amount of energy in a year during which the specified demand forecast exceeds the N-1 capability rating. Energy at risk at the specified demand forecast when all plant is in service (N) is shown separately.
3. “N-1 hours per year at risk” is the number of hours in a year during which the specified demand forecast exceeds the N-1 capability rating. Hours at risk at the specified demand forecast when all plant is in service (N) are shown separately.
4. “Expected unserved energy” means “energy at risk” multiplied by the probability of a major outage affecting one transformer. “Major outage” means an outage with duration of 2.6 months. The outage probability is derived from the base reliability data given in Section 5.4.
5. The value of unserved energy is derived from the sector values given in Table 1 of Section 2.4, weighted in accordance with the composition of the load at this terminal station.
6. The 0.7 and 0.3 weightings applied to the 50th and 10th percentile expected unserved energy estimates (respectively) are in accordance with the approach applied by AEMO, and described on page 12 of its publication titled Victorian Electricity Planning Approach, published in June 2016 (see http://www.aemo.com.au/-/media/Files/Electricity/NEM/Planning_and_Forecasting/Victorian_Transmission/2016/Victorian-Electricity-Planning-Approach.ashx)
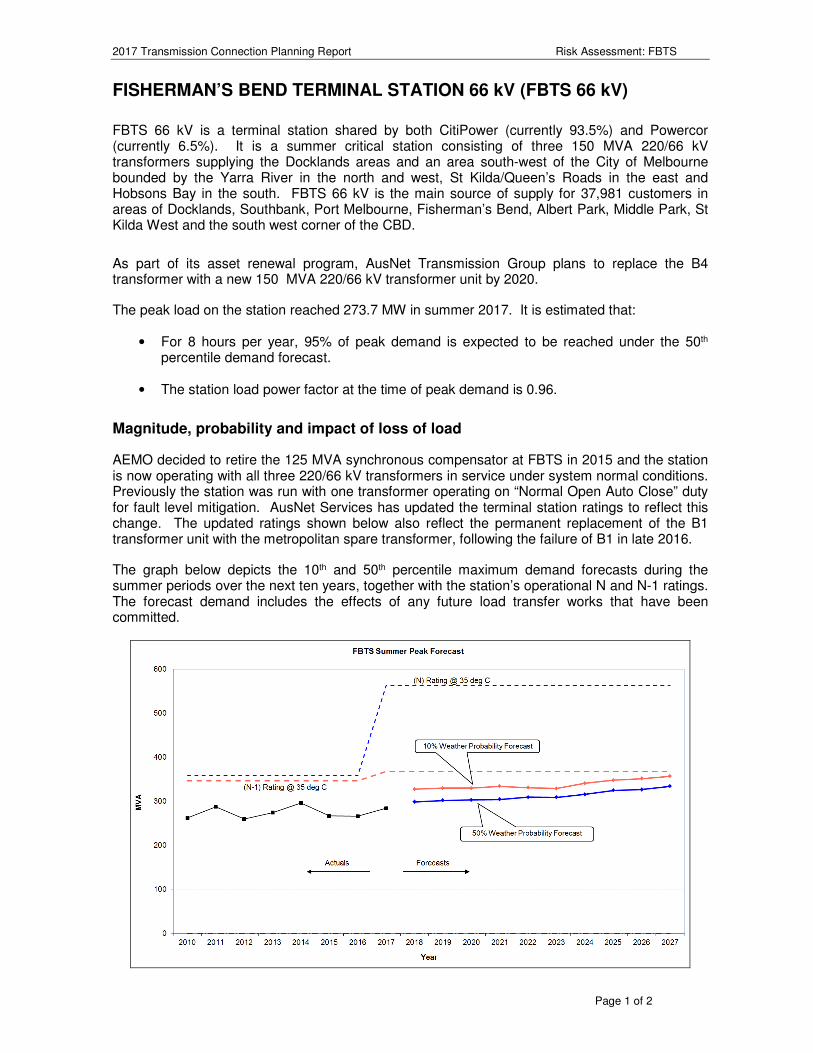
2017 Transmission Connection Planning Report Risk Assessment: FBTS
Page 1 of 2
FISHERMAN’S BEND TERMINAL STATION 66 kV (FBTS 66 kV)
FBTS 66 kV is a terminal station shared by both CitiPower (currently 93.5%) and Powercor (currently 6.5%). It is a summer critical station consisting of three 150 MVA 220/66 kV transformers supplying the Docklands areas and an area south-west of the City of Melbourne bounded by the Yarra River in the north and west, St Kilda/Queen’s Roads in the east and Hobsons Bay in the south. FBTS 66 kV is the main source of supply for 37,981 customers in areas of Docklands, Southbank, Port Melbourne, Fisherman’s Bend, Albert Park, Middle Park, St Kilda West and the south west corner of the CBD.
As part of its asset renewal program, AusNet Transmission Group plans to replace the B4 transformer with a new 150 MVA 220/66 kV transformer unit by 2020.
The peak load on the station reached 273.7 MW in summer 2017. It is estimated that:
• For 8 hours per year, 95% of peak demand is expected to be reached under the 50th percentile demand forecast.
• The station load power factor at the time of peak demand is 0.96.
Magnitude, probability and impact of loss of load
AEMO decided to retire the 125 MVA synchronous compensator at FBTS in 2015 and the station is now operating with all three 220/66 kV transformers in service under system normal conditions. Previously the station was run with one transformer operating on “Normal Open Auto Close” duty for fault level mitigation. AusNet Services has updated the terminal station ratings to reflect this change. The updated ratings shown below also reflect the permanent replacement of the B1 transformer unit with the metropolitan spare transformer, following the failure of B1 in late 2016.
The graph below depicts the 10th and 50th percentile maximum demand forecasts during the summer periods over the next ten years, together with the station’s operational N and N-1 ratings. The forecast demand includes the effects of any future load transfer works that have been committed.

2017 Transmission Connection Planning Report Risk Assessment: FBTS
Page 2 of 2
The graph shows that there would be sufficient capacity at FBTS 66 kV to supply the forecast 50th percentile and 10th percentile demands over the forecast period, even with one transformer out of service. Therefore, the need for augmentation or other corrective action is not expected to arise over the next ten years.
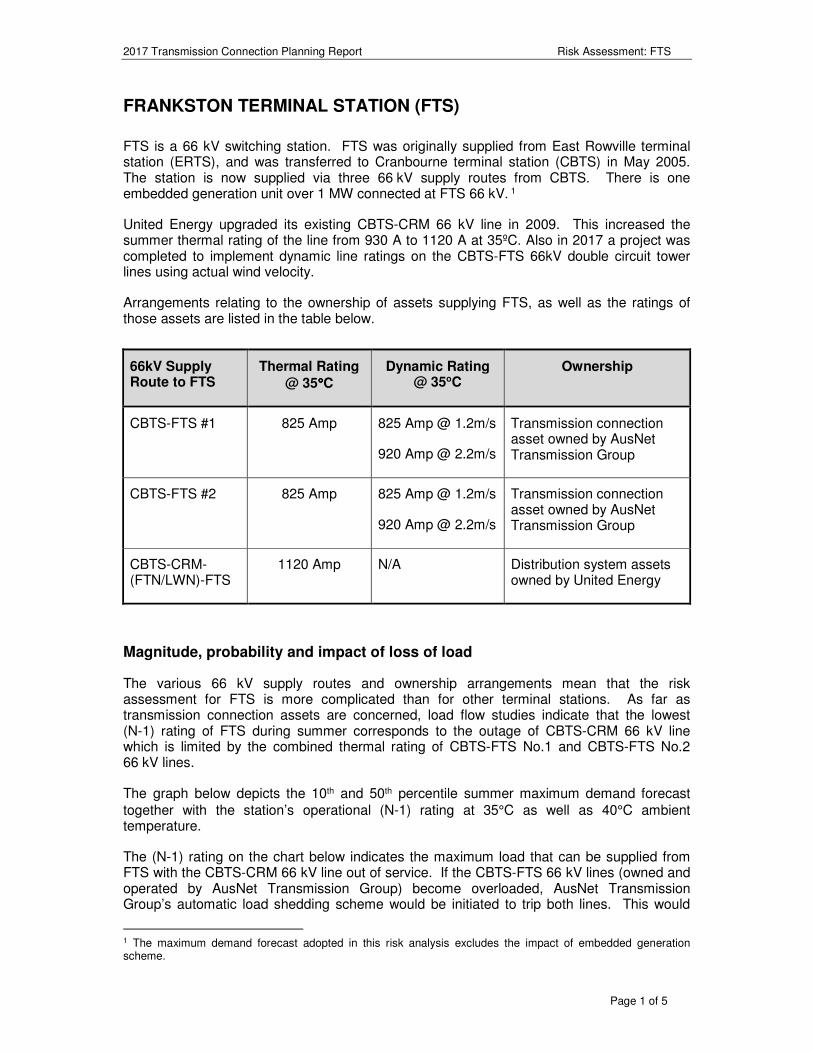
2017 Transmission Connection Planning Report Risk Assessment: FTS
Page 1 of 5
FRANKSTON TERMINAL STATION (FTS)
FTS is a 66 kV switching station. FTS was originally supplied from East Rowville terminal station (ERTS), and was transferred to Cranbourne terminal station (CBTS) in May 2005. The station is now supplied via three 66 kV supply routes from CBTS. There is one embedded generation unit over 1 MW connected at FTS 66 kV. 1
United Energy upgraded its existing CBTS-CRM 66 kV line in 2009. This increased the summer thermal rating of the line from 930 A to 1120 A at 35ºC. Also in 2017 a project was completed to implement dynamic line ratings on the CBTS-FTS 66kV double circuit tower lines using actual wind velocity.
Arrangements relating to the ownership of assets supplying FTS, as well as the ratings of those assets are listed in the table below.
66kV Supply Route to FTS
Thermal Rating
@ 35°°°°C
Dynamic Rating @ 35oC
Ownership
CBTS-FTS #1 825 Amp 825 Amp @ 1.2m/s
920 Amp @ 2.2m/s
Transmission connection asset owned by AusNet Transmission Group
CBTS-FTS #2 825 Amp 825 Amp @ 1.2m/s
920 Amp @ 2.2m/s
Transmission connection asset owned by AusNet Transmission Group
CBTS-CRM-(FTN/LWN)-FTS
1120 Amp N/A Distribution system assets owned by United Energy
Magnitude, probability and impact of loss of load
The various 66 kV supply routes and ownership arrangements mean that the risk assessment for FTS is more complicated than for other terminal stations. As far as transmission connection assets are concerned, load flow studies indicate that the lowest (N-1) rating of FTS during summer corresponds to the outage of CBTS-CRM 66 kV line which is limited by the combined thermal rating of CBTS-FTS No.1 and CBTS-FTS No.2 66 kV lines.
The graph below depicts the 10th and 50th percentile summer maximum demand forecast together with the station’s operational (N-1) rating at 35°C as well as 40°C ambient temperature.
The (N-1) rating on the chart below indicates the maximum load that can be supplied from FTS with the CBTS-CRM 66 kV line out of service. If the CBTS-FTS 66 kV lines (owned and operated by AusNet Transmission Group) become overloaded, AusNet Transmission Group’s automatic load shedding scheme would be initiated to trip both lines. This would
1 The maximum demand forecast adopted in this risk analysis excludes the impact of embedded generation scheme.
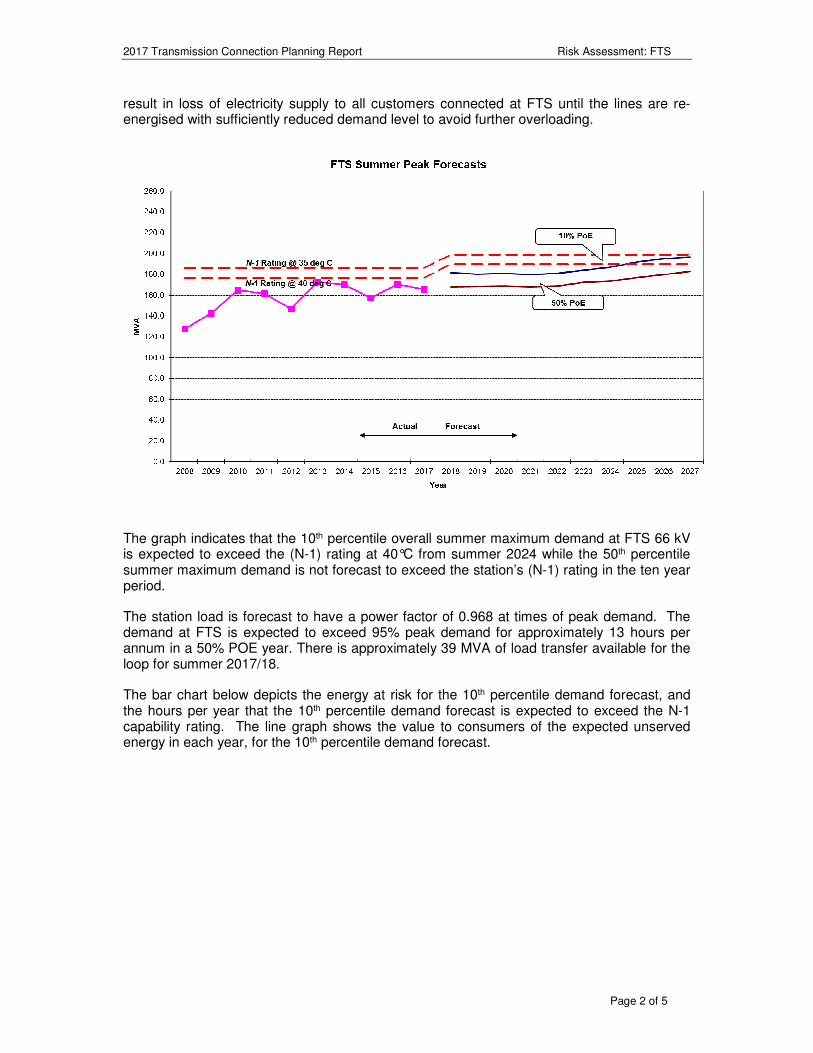
2017 Transmission Connection Planning Report Risk Assessment: FTS
Page 2 of 5
result in loss of electricity supply to all customers connected at FTS until the lines are re-energised with sufficiently reduced demand level to avoid further overloading.
The graph indicates that the 10th percentile overall summer maximum demand at FTS 66 kV is expected to exceed the (N-1) rating at 40°C from summer 2024 while the 50th percentile summer maximum demand is not forecast to exceed the station’s (N-1) rating in the ten year period.
The station load is forecast to have a power factor of 0.968 at times of peak demand. The demand at FTS is expected to exceed 95% peak demand for approximately 13 hours per annum in a 50% POE year. There is approximately 39 MVA of load transfer available for the loop for summer 2017/18.
The bar chart below depicts the energy at risk for the 10th percentile demand forecast, and the hours per year that the 10th percentile demand forecast is expected to exceed the N-1 capability rating. The line graph shows the value to consumers of the expected unserved energy in each year, for the 10th percentile demand forecast.
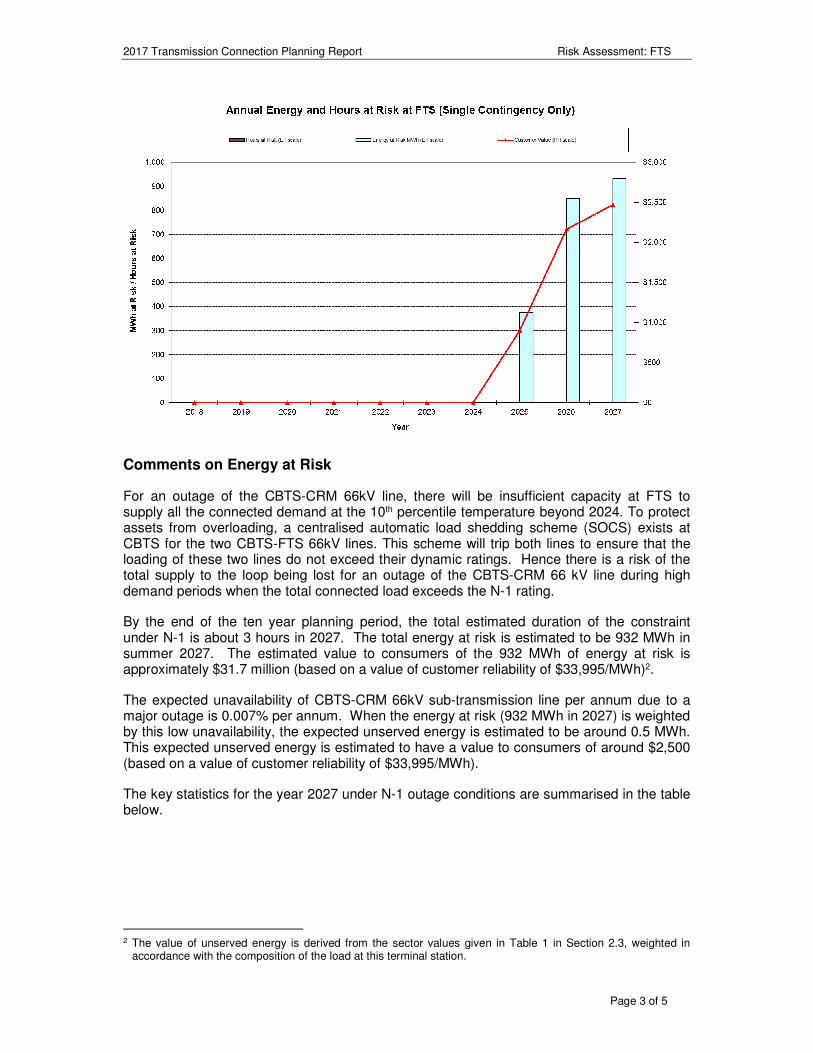
2017 Transmission Connection Planning Report Risk Assessment: FTS
Page 3 of 5
Comments on Energy at Risk
For an outage of the CBTS-CRM 66kV line, there will be insufficient capacity at FTS to supply all the connected demand at the 10th percentile temperature beyond 2024. To protect assets from overloading, a centralised automatic load shedding scheme (SOCS) exists at CBTS for the two CBTS-FTS 66kV lines. This scheme will trip both lines to ensure that the loading of these two lines do not exceed their dynamic ratings. Hence there is a risk of the total supply to the loop being lost for an outage of the CBTS-CRM 66 kV line during high demand periods when the total connected load exceeds the N-1 rating.
By the end of the ten year planning period, the total estimated duration of the constraint under N-1 is about 3 hours in 2027. The total energy at risk is estimated to be 932 MWh in summer 2027. The estimated value to consumers of the 932 MWh of energy at risk is approximately $31.7 million (based on a value of customer reliability of $33,995/MWh)2.
The expected unavailability of CBTS-CRM 66kV sub-transmission line per annum due to a major outage is 0.007% per annum. When the energy at risk (932 MWh in 2027) is weighted by this low unavailability, the expected unserved energy is estimated to be around 0.5 MWh. This expected unserved energy is estimated to have a value to consumers of around $2,500 (based on a value of customer reliability of $33,995/MWh).
The key statistics for the year 2027 under N-1 outage conditions are summarised in the table below.
2 The value of unserved energy is derived from the sector values given in Table 1 in Section 2.3, weighted in
accordance with the composition of the load at this terminal station.
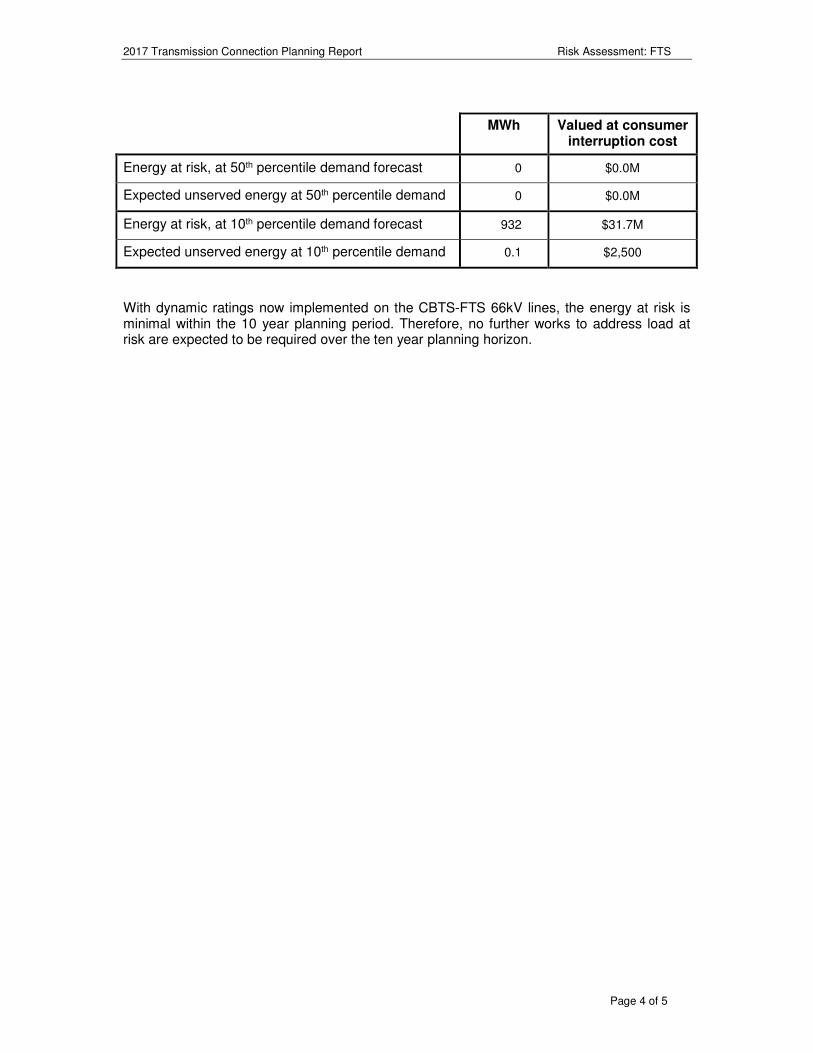
2017 Transmission Connection Planning Report Risk Assessment: FTS
Page 4 of 5
MWh Valued at consumer interruption cost
Energy at risk, at 50th percentile demand forecast 0 $0.0M
Expected unserved energy at 50th percentile demand 0 $0.0M
Energy at risk, at 10th percentile demand forecast 932 $31.7M
Expected unserved energy at 10th percentile demand 0.1 $2,500
With dynamic ratings now implemented on the CBTS-FTS 66kV lines, the energy at risk is minimal within the 10 year planning period. Therefore, no further works to address load at risk are expected to be required over the ten year planning horizon.
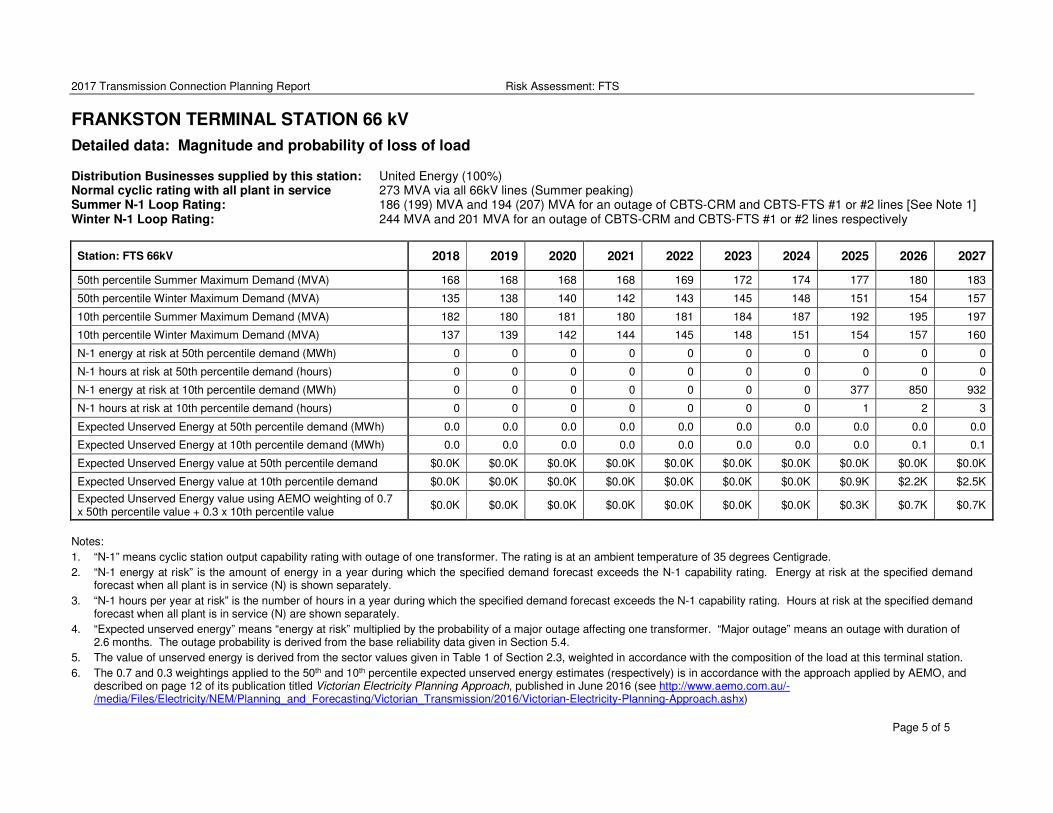
2017 Transmission Connection Planning Report Risk Assessment: FTS
Page 5 of 5
FRANKSTON TERMINAL STATION 66 kV
Detailed data: Magnitude and probability of loss of load
Distribution Businesses supplied by this station: United Energy (100%) Normal cyclic rating with all plant in service 273 MVA via all 66kV lines (Summer peaking) Summer N-1 Loop Rating: 186 (199) MVA and 194 (207) MVA for an outage of CBTS-CRM and CBTS-FTS #1 or #2 lines [See Note 1] Winter N-1 Loop Rating: 244 MVA and 201 MVA for an outage of CBTS-CRM and CBTS-FTS #1 or #2 lines respectively
Station: FTS 66kV 2018 2019 2020 2021 2022 2023 2024 2025 2026 2027
50th percentile Summer Maximum Demand (MVA) 168 168 168 168 169 172 174 177 180 183
50th percentile Winter Maximum Demand (MVA) 135 138 140 142 143 145 148 151 154 157
10th percentile Summer Maximum Demand (MVA) 182 180 181 180 181 184 187 192 195 197
10th percentile Winter Maximum Demand (MVA) 137 139 142 144 145 148 151 154 157 160
N-1 energy at risk at 50th percentile demand (MWh) 0 0 0 0 0 0 0 0 0 0
N-1 hours at risk at 50th percentile demand (hours) 0 0 0 0 0 0 0 0 0 0
N-1 energy at risk at 10th percentile demand (MWh) 0 0 0 0 0 0 0 377 850 932
N-1 hours at risk at 10th percentile demand (hours) 0 0 0 0 0 0 0 1 2 3
Expected Unserved Energy at 50th percentile demand (MWh) 0.0 0.0 0.0 0.0 0.0 0.0 0.0 0.0 0.0 0.0
Expected Unserved Energy at 10th percentile demand (MWh) 0.0 0.0 0.0 0.0 0.0 0.0 0.0 0.0 0.1 0.1
Expected Unserved Energy value at 50th percentile demand $0.0K $0.0K $0.0K $0.0K $0.0K $0.0K $0.0K $0.0K $0.0K $0.0K
Expected Unserved Energy value at 10th percentile demand $0.0K $0.0K $0.0K $0.0K $0.0K $0.0K $0.0K $0.9K $2.2K $2.5K
Expected Unserved Energy value using AEMO weighting of 0.7 x 50th percentile value + 0.3 x 10th percentile value
$0.0K $0.0K $0.0K $0.0K $0.0K $0.0K $0.0K $0.3K $0.7K $0.7K
Notes:
1. “N-1” means cyclic station output capability rating with outage of one transformer. The rating is at an ambient temperature of 35 degrees Centigrade.
2. “N-1 energy at risk” is the amount of energy in a year during which the specified demand forecast exceeds the N-1 capability rating. Energy at risk at the specified demand forecast when all plant is in service (N) is shown separately.
3. “N-1 hours per year at risk” is the number of hours in a year during which the specified demand forecast exceeds the N-1 capability rating. Hours at risk at the specified demand forecast when all plant is in service (N) are shown separately.
4. “Expected unserved energy” means “energy at risk” multiplied by the probability of a major outage affecting one transformer. “Major outage” means an outage with duration of 2.6 months. The outage probability is derived from the base reliability data given in Section 5.4.
5. The value of unserved energy is derived from the sector values given in Table 1 of Section 2.3, weighted in accordance with the composition of the load at this terminal station.
6. The 0.7 and 0.3 weightings applied to the 50th and 10th percentile expected unserved energy estimates (respectively) is in accordance with the approach applied by AEMO, and described on page 12 of its publication titled Victorian Electricity Planning Approach, published in June 2016 (see http://www.aemo.com.au/-/media/Files/Electricity/NEM/Planning_and_Forecasting/Victorian_Transmission/2016/Victorian-Electricity-Planning-Approach.ashx)
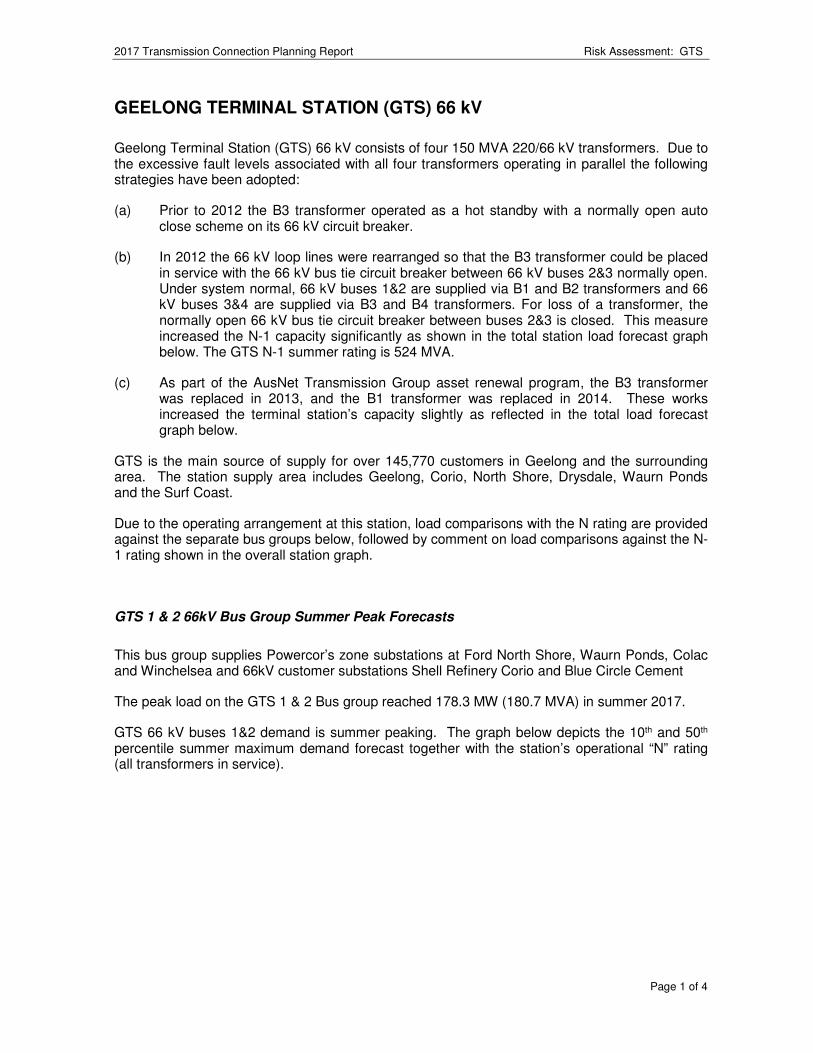
2017 Transmission Connection Planning Report Risk Assessment: GTS
Page 1 of 4
GEELONG TERMINAL STATION (GTS) 66 kV
Geelong Terminal Station (GTS) 66 kV consists of four 150 MVA 220/66 kV transformers. Due to the excessive fault levels associated with all four transformers operating in parallel the following strategies have been adopted:
(a) Prior to 2012 the B3 transformer operated as a hot standby with a normally open auto close scheme on its 66 kV circuit breaker.
(b) In 2012 the 66 kV loop lines were rearranged so that the B3 transformer could be placed in service with the 66 kV bus tie circuit breaker between 66 kV buses 2&3 normally open. Under system normal, 66 kV buses 1&2 are supplied via B1 and B2 transformers and 66 kV buses 3&4 are supplied via B3 and B4 transformers. For loss of a transformer, the normally open 66 kV bus tie circuit breaker between buses 2&3 is closed. This measure increased the N-1 capacity significantly as shown in the total station load forecast graph below. The GTS N-1 summer rating is 524 MVA.
(c) As part of the AusNet Transmission Group asset renewal program, the B3 transformer was replaced in 2013, and the B1 transformer was replaced in 2014. These works increased the terminal station’s capacity slightly as reflected in the total load forecast graph below.
GTS is the main source of supply for over 145,770 customers in Geelong and the surrounding area. The station supply area includes Geelong, Corio, North Shore, Drysdale, Waurn Ponds and the Surf Coast.
Due to the operating arrangement at this station, load comparisons with the N rating are provided against the separate bus groups below, followed by comment on load comparisons against the N-1 rating shown in the overall station graph.
GTS 1 & 2 66kV Bus Group Summer Peak Forecasts
This bus group supplies Powercor’s zone substations at Ford North Shore, Waurn Ponds, Colac and Winchelsea and 66kV customer substations Shell Refinery Corio and Blue Circle Cement
The peak load on the GTS 1 & 2 Bus group reached 178.3 MW (180.7 MVA) in summer 2017.
GTS 66 kV buses 1&2 demand is summer peaking. The graph below depicts the 10th and 50th percentile summer maximum demand forecast together with the station’s operational “N” rating (all transformers in service).
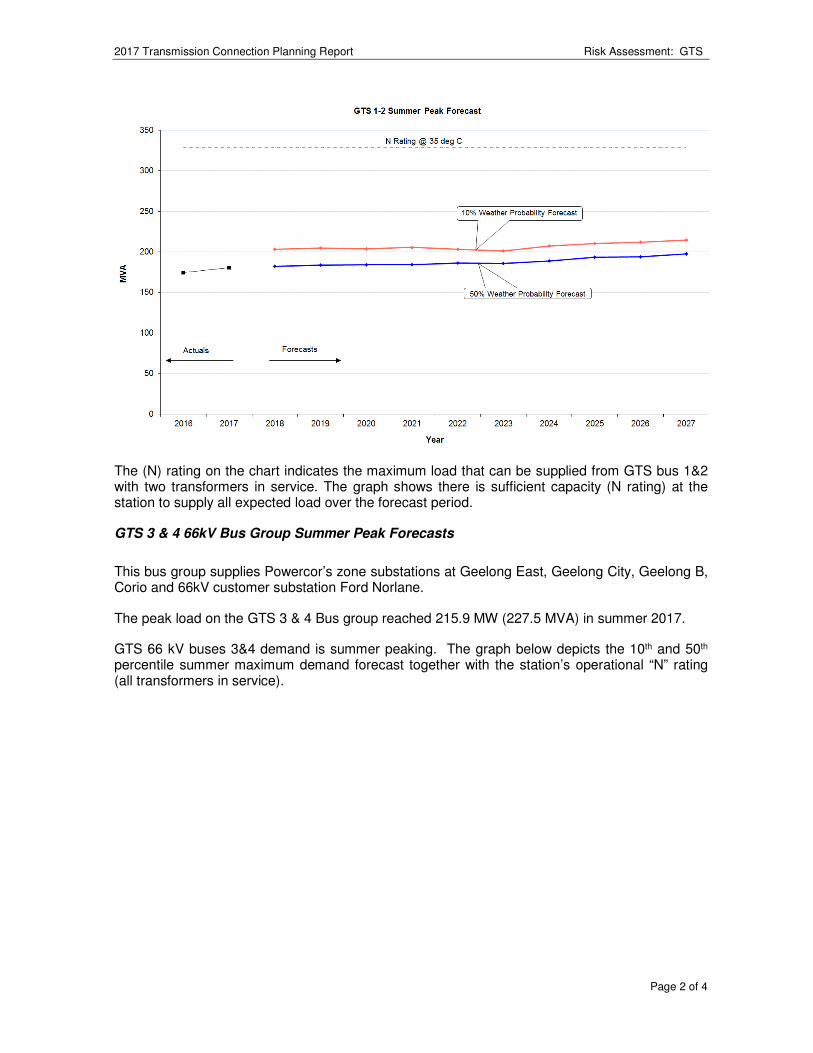
2017 Transmission Connection Planning Report Risk Assessment: GTS
Page 2 of 4
The (N) rating on the chart indicates the maximum load that can be supplied from GTS bus 1&2 with two transformers in service. The graph shows there is sufficient capacity (N rating) at the station to supply all expected load over the forecast period.
GTS 3 & 4 66kV Bus Group Summer Peak Forecasts
This bus group supplies Powercor’s zone substations at Geelong East, Geelong City, Geelong B, Corio and 66kV customer substation Ford Norlane.
The peak load on the GTS 3 & 4 Bus group reached 215.9 MW (227.5 MVA) in summer 2017.
GTS 66 kV buses 3&4 demand is summer peaking. The graph below depicts the 10th and 50th percentile summer maximum demand forecast together with the station’s operational “N” rating (all transformers in service).
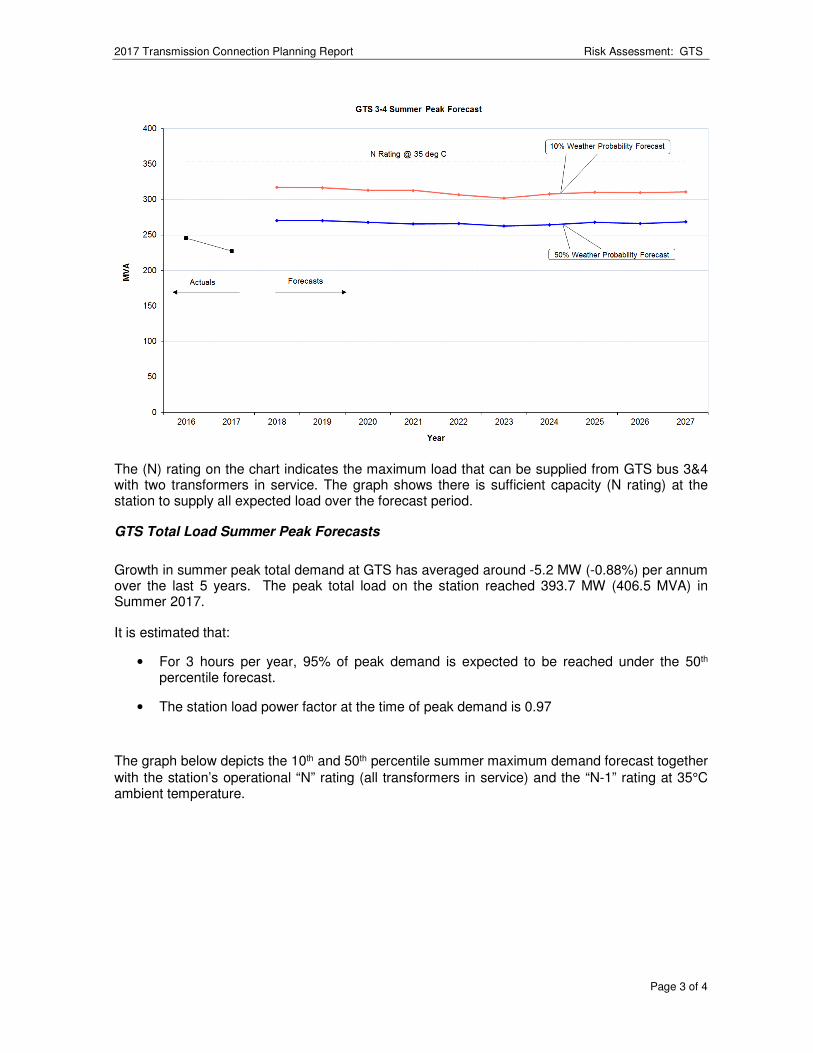
2017 Transmission Connection Planning Report Risk Assessment: GTS
Page 3 of 4
The (N) rating on the chart indicates the maximum load that can be supplied from GTS bus 3&4 with two transformers in service. The graph shows there is sufficient capacity (N rating) at the station to supply all expected load over the forecast period.
GTS Total Load Summer Peak Forecasts
Growth in summer peak total demand at GTS has averaged around -5.2 MW (-0.88%) per annum over the last 5 years. The peak total load on the station reached 393.7 MW (406.5 MVA) in Summer 2017.
It is estimated that:
• For 3 hours per year, 95% of peak demand is expected to be reached under the 50th percentile forecast.
• The station load power factor at the time of peak demand is 0.97
The graph below depicts the 10th and 50th percentile summer maximum demand forecast together
with the station’s operational “N” rating (all transformers in service) and the “N-1” rating at 35°C ambient temperature.
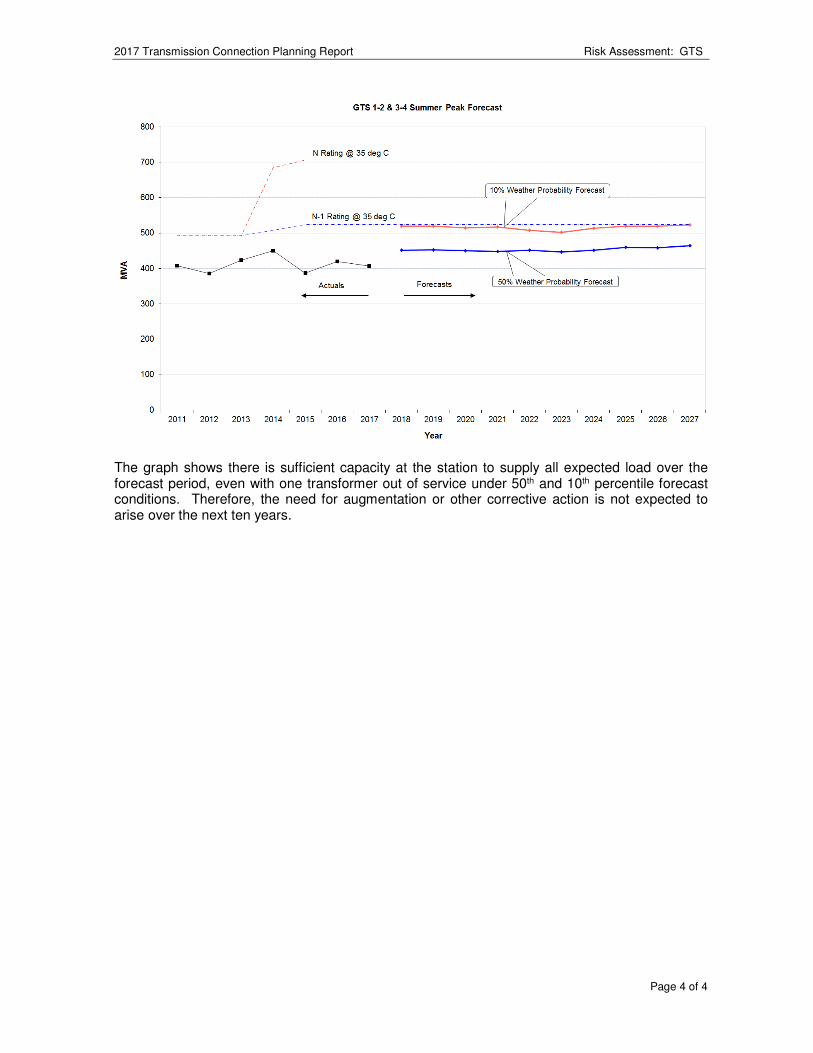
2017 Transmission Connection Planning Report Risk Assessment: GTS
Page 4 of 4
The graph shows there is sufficient capacity at the station to supply all expected load over the forecast period, even with one transformer out of service under 50th and 10th percentile forecast conditions. Therefore, the need for augmentation or other corrective action is not expected to arise over the next ten years.
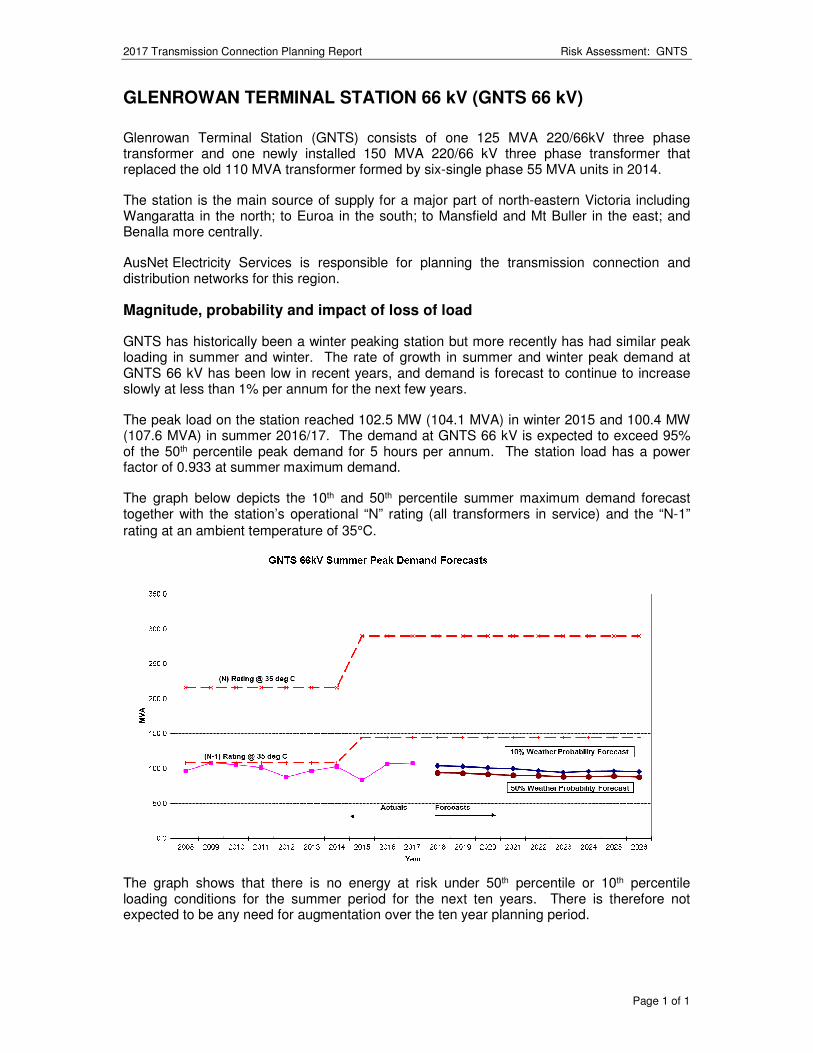
2017 Transmission Connection Planning Report Risk Assessment: GNTS
Page 1 of 1
GLENROWAN TERMINAL STATION 66 kV (GNTS 66 kV)
Glenrowan Terminal Station (GNTS) consists of one 125 MVA 220/66kV three phase transformer and one newly installed 150 MVA 220/66 kV three phase transformer that replaced the old 110 MVA transformer formed by six-single phase 55 MVA units in 2014.
The station is the main source of supply for a major part of north-eastern Victoria including Wangaratta in the north; to Euroa in the south; to Mansfield and Mt Buller in the east; and Benalla more centrally.
AusNet Electricity Services is responsible for planning the transmission connection and distribution networks for this region.
Magnitude, probability and impact of loss of load
GNTS has historically been a winter peaking station but more recently has had similar peak loading in summer and winter. The rate of growth in summer and winter peak demand at GNTS 66 kV has been low in recent years, and demand is forecast to continue to increase slowly at less than 1% per annum for the next few years.
The peak load on the station reached 102.5 MW (104.1 MVA) in winter 2015 and 100.4 MW (107.6 MVA) in summer 2016/17. The demand at GNTS 66 kV is expected to exceed 95% of the 50th percentile peak demand for 5 hours per annum. The station load has a power factor of 0.933 at summer maximum demand.
The graph below depicts the 10th and 50th percentile summer maximum demand forecast together with the station’s operational “N” rating (all transformers in service) and the “N-1”
rating at an ambient temperature of 35°C.
The graph shows that there is no energy at risk under 50th percentile or 10th percentile loading conditions for the summer period for the next ten years. There is therefore not expected to be any need for augmentation over the ten year planning period.
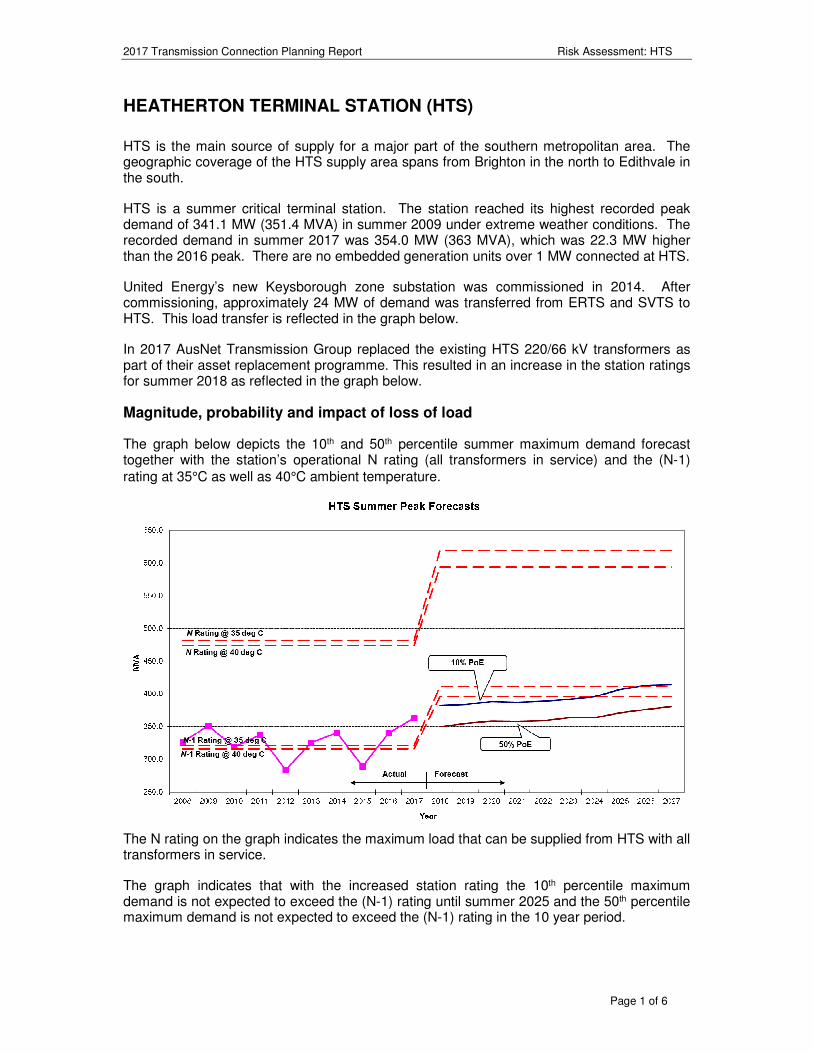
2017 Transmission Connection Planning Report Risk Assessment: HTS
Page 1 of 6
HEATHERTON TERMINAL STATION (HTS)
HTS is the main source of supply for a major part of the southern metropolitan area. The geographic coverage of the HTS supply area spans from Brighton in the north to Edithvale in the south.
HTS is a summer critical terminal station. The station reached its highest recorded peak demand of 341.1 MW (351.4 MVA) in summer 2009 under extreme weather conditions. The recorded demand in summer 2017 was 354.0 MW (363 MVA), which was 22.3 MW higher than the 2016 peak. There are no embedded generation units over 1 MW connected at HTS.
United Energy’s new Keysborough zone substation was commissioned in 2014. After commissioning, approximately 24 MW of demand was transferred from ERTS and SVTS to HTS. This load transfer is reflected in the graph below.
In 2017 AusNet Transmission Group replaced the existing HTS 220/66 kV transformers as part of their asset replacement programme. This resulted in an increase in the station ratings for summer 2018 as reflected in the graph below.
Magnitude, probability and impact of loss of load
The graph below depicts the 10th and 50th percentile summer maximum demand forecast together with the station’s operational N rating (all transformers in service) and the (N-1) rating at 35°C as well as 40°C ambient temperature.
The N rating on the graph indicates the maximum load that can be supplied from HTS with all transformers in service.
The graph indicates that with the increased station rating the 10th percentile maximum demand is not expected to exceed the (N-1) rating until summer 2025 and the 50th percentile maximum demand is not expected to exceed the (N-1) rating in the 10 year period.
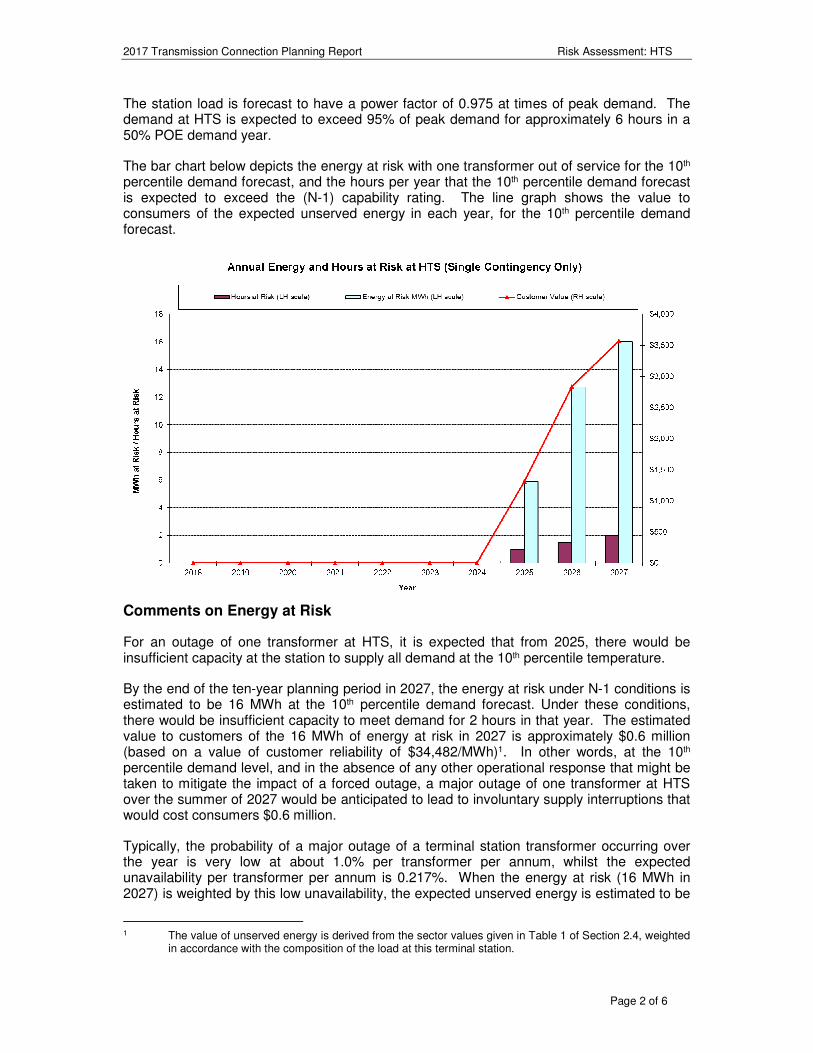
2017 Transmission Connection Planning Report Risk Assessment: HTS
Page 2 of 6
The station load is forecast to have a power factor of 0.975 at times of peak demand. The demand at HTS is expected to exceed 95% of peak demand for approximately 6 hours in a 50% POE demand year.
The bar chart below depicts the energy at risk with one transformer out of service for the 10th percentile demand forecast, and the hours per year that the 10th percentile demand forecast is expected to exceed the (N-1) capability rating. The line graph shows the value to consumers of the expected unserved energy in each year, for the 10th percentile demand forecast.
Comments on Energy at Risk
For an outage of one transformer at HTS, it is expected that from 2025, there would be insufficient capacity at the station to supply all demand at the 10th percentile temperature.
By the end of the ten-year planning period in 2027, the energy at risk under N-1 conditions is estimated to be 16 MWh at the 10th percentile demand forecast. Under these conditions, there would be insufficient capacity to meet demand for 2 hours in that year. The estimated value to customers of the 16 MWh of energy at risk in 2027 is approximately $0.6 million (based on a value of customer reliability of $34,482/MWh)1. In other words, at the 10th percentile demand level, and in the absence of any other operational response that might be taken to mitigate the impact of a forced outage, a major outage of one transformer at HTS over the summer of 2027 would be anticipated to lead to involuntary supply interruptions that would cost consumers $0.6 million.
Typically, the probability of a major outage of a terminal station transformer occurring over the year is very low at about 1.0% per transformer per annum, whilst the expected unavailability per transformer per annum is 0.217%. When the energy at risk (16 MWh in 2027) is weighted by this low unavailability, the expected unserved energy is estimated to be
1 The value of unserved energy is derived from the sector values given in Table 1 of Section 2.4, weighted
in accordance with the composition of the load at this terminal station.
2017 Transmission Connection Planning Report Risk Assessment: HTS
Page 3 of 6
around 0.1 MWh. This expected unserved energy is estimated to have a value to consumers of around $3,570 (based on a value of customer reliability of $34,482/MWh).
It should also be noted that the above estimates of energy at risk and expected unserved energy are based on an assumption of 10th percentile temperatures occurring in each year. Under 50th percentile temperature conditions, the energy at risk is expected to be zero in 2027. These key statistics for the year 2027 under N-1 outage conditions are summarised in the table below.
MWh Valued at consumer interruption cost
Energy at risk, at 50th percentile demand forecast 0 $0.0 million
Expected unserved energy at 50th percentile demand 0.0 $0
Energy at risk, at 10th percentile demand forecast 16 $0.6 million
Expected unserved energy at 10th percentile demand 0.1 $3,570
Possible impacts of a transformer outage on customers
If one of the 220/66 kV transformers at HTS is taken off line during peak loading times and the (N-1) station rating is exceeded, the OSSCA2 load shedding scheme which is operated by AusNet Transmission Group’s TOC3 will act swiftly to reduce the loads in blocks to within safe loading limits. Any load reductions that are in excess of the minimum amount required to limit load to the rated capability of the station would be restored at zone substation feeder level in accordance with United Energy’s operational procedures after the operation of the OSSCA scheme.
In the case of HTS supply at maximum loading periods, the OSSCA scheme would shed about 160 MVA of load, affecting up to approximately 47,360 customers.
Feasible options for alleviation of constraints
The following options are technically feasible and potentially economic to mitigate the risk of supply interruption and/or to alleviate the emerging constraint:
1. Implement a contingency plan to transfer load to adjacent terminal stations. United Energy has established and implemented the necessary plans that enable load transfers under contingency conditions, via both 66 kV subtransmission and 22/11 kV distribution networks. These plans are reviewed annually prior to the summer season. Transfer capability away from HTS 66 kV onto adjacent terminal stations via the distribution network is assessed at 70 MVA for summer 2018.
2. Install a fourth 220/66 kV transformer at HTS.
3. Establish a new 220/66 kV terminal station (DNTS) in the Dandenong area to off-load HTS.
2 Overload Shedding Scheme of Connection Asset. 3 Transmission Operations Centre
2017 Transmission Connection Planning Report Risk Assessment: HTS
Page 4 of 6
Prior to 2011, the TCPR identified that a 4th transformer at HTS would be the preferred network option to alleviate the increasing load at risk. It has now been determined that this may not be the most economic option for the following reasons:
• HTS is supplied on a radial double-circuit 220 kV transmission line from Rowville (ROTS) via Springvale (SVTS). The connected demand on these lines is presently reliant on emergency short time ratings to remain within the N-1 rating of the 220 kV circuits. Therefore, the capacity provided by a fourth transformer at HTS may not be able to be utilised because of the 220 kV line constraints.
• The anticipated timing of a 4th transformer at HTS coincides with a number of other significant sub-transmission and connection asset constraints in the Dandenong, Keysborough and Braeside areas, which a 4th transformer at HTS would not be able to resolve.
In early 2012 United Energy submitted a preliminary connection enquiry to AEMO for the establishment of a new connection point in the Dandenong area. Joint planning activities have been underway between the two organisations to quantify the risk of the emerging constraints in the area and to assess viable options for alleviating the constraints. The investigations identified that the need is driven mainly by load-at-risk associated with the 220kV line constraints in the area. Utilising the United Energy maximum demand forecasts, this assessment identified the timing requirement for a new Dandenong Terminal Station (DNTS) was to be before summer 2027.
The capital cost of installing a new 220/66 kV terminal station in Dandenong and related subtransmission works is estimated to be in excess of $70 million with an estimated total annual cost of approximately $7 million.
Since 2012 there has been a reduction in the maximum demand forecast at HTS and Springvale Terminal Station (SVTS) and so the new terminal station is not likely to be economically justified within the ten year planning horizon. Further analysis, including a Regulatory Investment Test for Transmission will be undertaken at a later time to determine the preferred option for addressing the constraints, but at this stage a new 220/66 kV terminal station in Dandenong is the preferred network option to address the emerging constraints. United Energy will continue to work with AEMO on this joint planning exercise.
Preferred network option(s) for alleviation of constraints
In the absence of any commitment by interested parties to offer network support services by installing local generation or through demand side management initiatives that would reduce load at HTS, it is proposed to:
1. Implement the following temporary measures to cater for an unplanned outage of one transformer at HTS under critical loading conditions:
• maintain contingency plans to transfer load quickly to adjacent terminal stations;
• fine-tune the OSSCA scheme settings in conjunction with TOC to minimise the impact on customers of any load shedding that may take place; and
• subject to the availability of AusNet Transmission Group’s spare 220/66 kV transformer for metropolitan areas (refer to Section 4.5), this spare transformer can be used to temporarily replace a failed transformer.

2017 Transmission Connection Planning Report Risk Assessment: HTS
Page 5 of 6
2. Establish a new 220/66 kV terminal station in the Dandenong area to off-load HTS. On the present forecasts, the new terminal station in the Dandenong area is unlikely to be economic within the ten year planning horizon.
The table on the following page provides more detailed data on the station rating, demand forecasts, energy at risk and expected unserved energy.
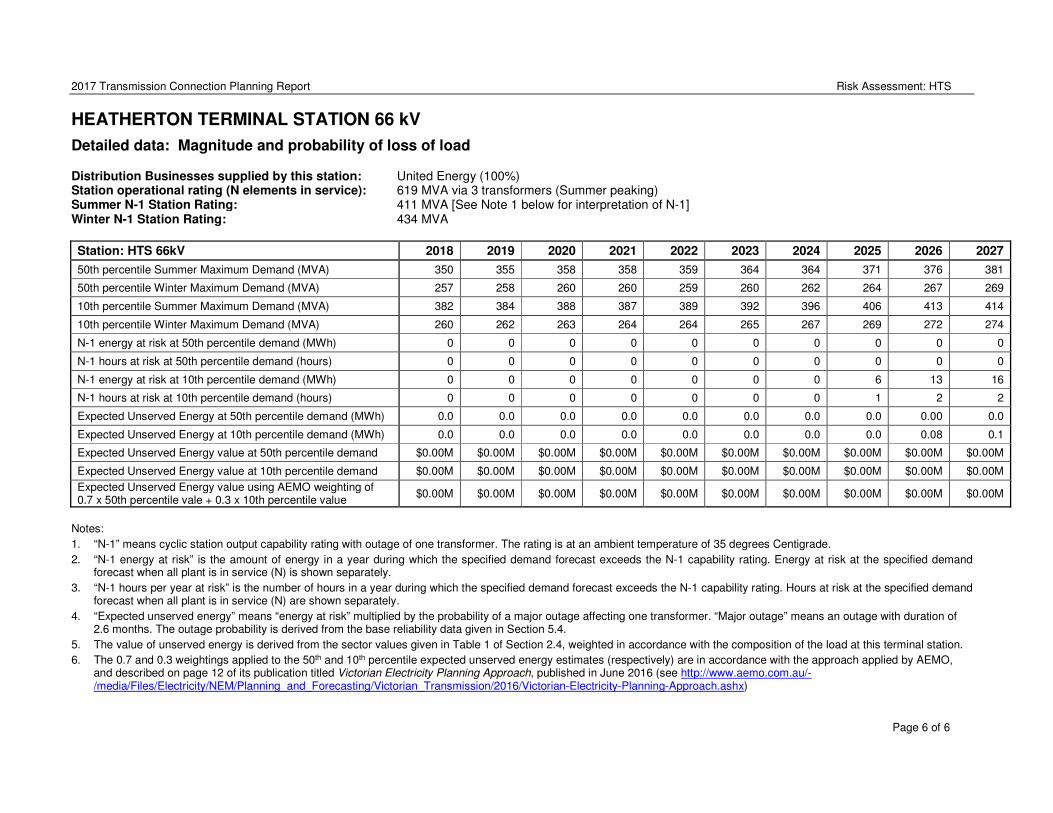
2017 Transmission Connection Planning Report Risk Assessment: HTS
Page 6 of 6
HEATHERTON TERMINAL STATION 66 kV
Detailed data: Magnitude and probability of loss of load
Distribution Businesses supplied by this station: United Energy (100%) Station operational rating (N elements in service): 619 MVA via 3 transformers (Summer peaking) Summer N-1 Station Rating: 411 MVA [See Note 1 below for interpretation of N-1] Winter N-1 Station Rating: 434 MVA
Station: HTS 66kV 2018 2019 2020 2021 2022 2023 2024 2025 2026 2027
50th percentile Summer Maximum Demand (MVA) 350 355 358 358 359 364 364 371 376 381
50th percentile Winter Maximum Demand (MVA) 257 258 260 260 259 260 262 264 267 269
10th percentile Summer Maximum Demand (MVA) 382 384 388 387 389 392 396 406 413 414
10th percentile Winter Maximum Demand (MVA) 260 262 263 264 264 265 267 269 272 274
N-1 energy at risk at 50th percentile demand (MWh) 0 0 0 0 0 0 0 0 0 0
N-1 hours at risk at 50th percentile demand (hours) 0 0 0 0 0 0 0 0 0 0
N-1 energy at risk at 10th percentile demand (MWh) 0 0 0 0 0 0 0 6 13 16
N-1 hours at risk at 10th percentile demand (hours) 0 0 0 0 0 0 0 1 2 2
Expected Unserved Energy at 50th percentile demand (MWh) 0.0 0.0 0.0 0.0 0.0 0.0 0.0 0.0 0.00 0.0
Expected Unserved Energy at 10th percentile demand (MWh) 0.0 0.0 0.0 0.0 0.0 0.0 0.0 0.0 0.08 0.1
Expected Unserved Energy value at 50th percentile demand $0.00M $0.00M $0.00M $0.00M $0.00M $0.00M $0.00M $0.00M $0.00M $0.00M
Expected Unserved Energy value at 10th percentile demand $0.00M $0.00M $0.00M $0.00M $0.00M $0.00M $0.00M $0.00M $0.00M $0.00M
Expected Unserved Energy value using AEMO weighting of 0.7 x 50th percentile vale + 0.3 x 10th percentile value
$0.00M $0.00M $0.00M $0.00M $0.00M $0.00M $0.00M $0.00M $0.00M $0.00M
Notes:
1. “N-1” means cyclic station output capability rating with outage of one transformer. The rating is at an ambient temperature of 35 degrees Centigrade.
2. “N-1 energy at risk” is the amount of energy in a year during which the specified demand forecast exceeds the N-1 capability rating. Energy at risk at the specified demand forecast when all plant is in service (N) is shown separately.
3. “N-1 hours per year at risk” is the number of hours in a year during which the specified demand forecast exceeds the N-1 capability rating. Hours at risk at the specified demand forecast when all plant is in service (N) are shown separately.
4. “Expected unserved energy” means “energy at risk” multiplied by the probability of a major outage affecting one transformer. “Major outage” means an outage with duration of 2.6 months. The outage probability is derived from the base reliability data given in Section 5.4.
5. The value of unserved energy is derived from the sector values given in Table 1 of Section 2.4, weighted in accordance with the composition of the load at this terminal station.
6. The 0.7 and 0.3 weightings applied to the 50th and 10th percentile expected unserved energy estimates (respectively) are in accordance with the approach applied by AEMO, and described on page 12 of its publication titled Victorian Electricity Planning Approach, published in June 2016 (see http://www.aemo.com.au/-/media/Files/Electricity/NEM/Planning_and_Forecasting/Victorian_Transmission/2016/Victorian-Electricity-Planning-Approach.ashx)
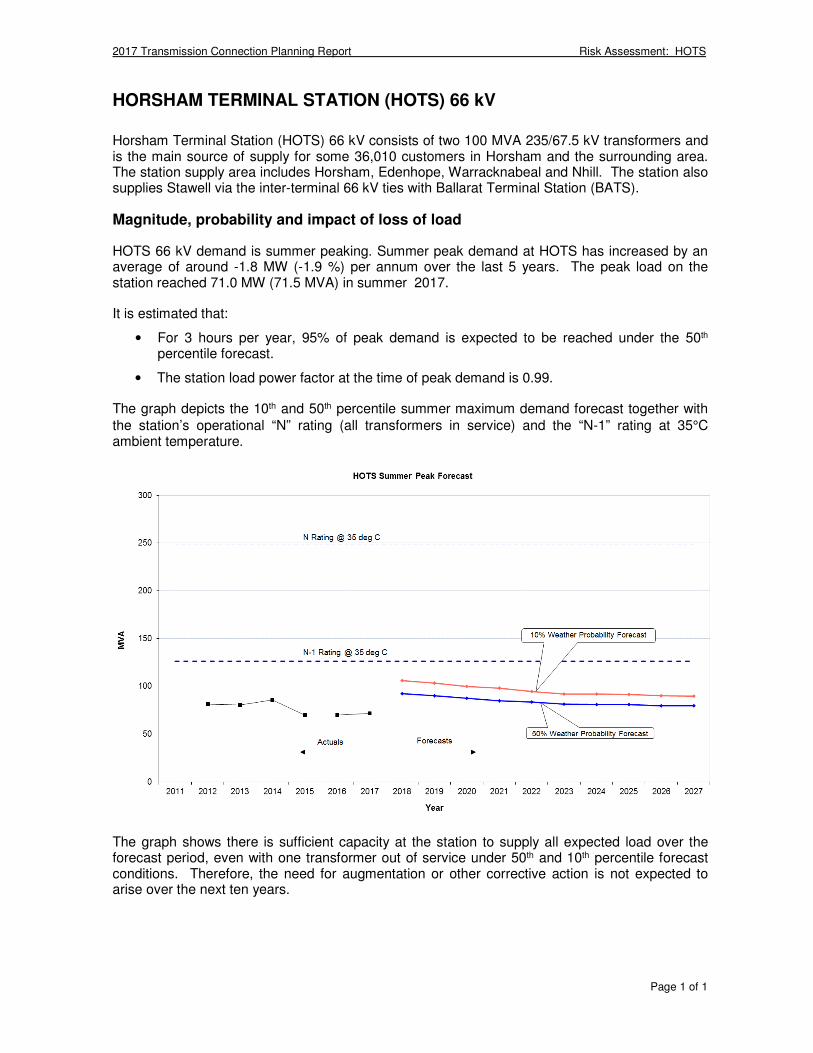
2017 Transmission Connection Planning Report Risk Assessment: HOTS
Page 1 of 1
HORSHAM TERMINAL STATION (HOTS) 66 kV
Horsham Terminal Station (HOTS) 66 kV consists of two 100 MVA 235/67.5 kV transformers and is the main source of supply for some 36,010 customers in Horsham and the surrounding area. The station supply area includes Horsham, Edenhope, Warracknabeal and Nhill. The station also supplies Stawell via the inter-terminal 66 kV ties with Ballarat Terminal Station (BATS).
Magnitude, probability and impact of loss of load
HOTS 66 kV demand is summer peaking. Summer peak demand at HOTS has increased by an average of around -1.8 MW (-1.9 %) per annum over the last 5 years. The peak load on the station reached 71.0 MW (71.5 MVA) in summer 2017.
It is estimated that:
• For 3 hours per year, 95% of peak demand is expected to be reached under the 50th percentile forecast.
• The station load power factor at the time of peak demand is 0.99.
The graph depicts the 10th and 50th percentile summer maximum demand forecast together with
the station’s operational “N” rating (all transformers in service) and the “N-1” rating at 35°C ambient temperature.
The graph shows there is sufficient capacity at the station to supply all expected load over the forecast period, even with one transformer out of service under 50th and 10th percentile forecast conditions. Therefore, the need for augmentation or other corrective action is not expected to arise over the next ten years.
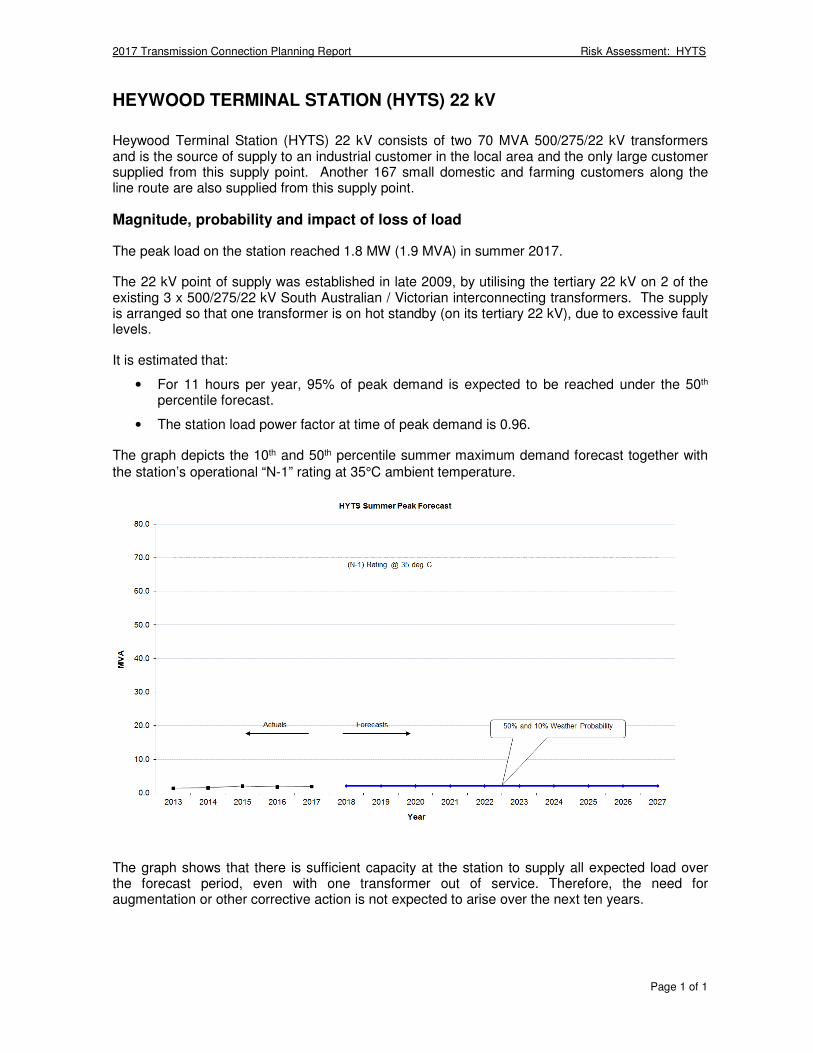
2017 Transmission Connection Planning Report Risk Assessment: HYTS
Page 1 of 1
HEYWOOD TERMINAL STATION (HYTS) 22 kV
Heywood Terminal Station (HYTS) 22 kV consists of two 70 MVA 500/275/22 kV transformers and is the source of supply to an industrial customer in the local area and the only large customer supplied from this supply point. Another 167 small domestic and farming customers along the line route are also supplied from this supply point.
Magnitude, probability and impact of loss of load
The peak load on the station reached 1.8 MW (1.9 MVA) in summer 2017.
The 22 kV point of supply was established in late 2009, by utilising the tertiary 22 kV on 2 of the existing 3 x 500/275/22 kV South Australian / Victorian interconnecting transformers. The supply is arranged so that one transformer is on hot standby (on its tertiary 22 kV), due to excessive fault levels.
It is estimated that:
• For 11 hours per year, 95% of peak demand is expected to be reached under the 50th percentile forecast.
• The station load power factor at time of peak demand is 0.96.
The graph depicts the 10th and 50th percentile summer maximum demand forecast together with
the station’s operational “N-1” rating at 35°C ambient temperature.
The graph shows that there is sufficient capacity at the station to supply all expected load over the forecast period, even with one transformer out of service. Therefore, the need for augmentation or other corrective action is not expected to arise over the next ten years.
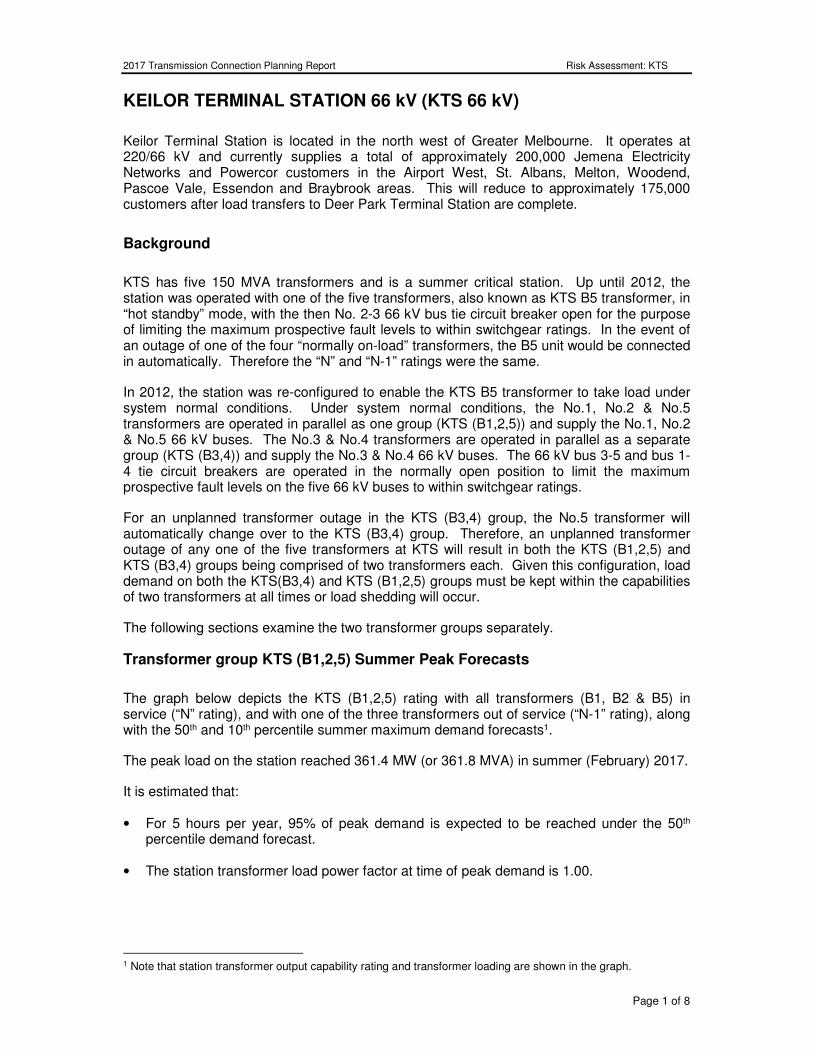
2017 Transmission Connection Planning Report Risk Assessment: KTS
Page 1 of 8
KEILOR TERMINAL STATION 66 kV (KTS 66 kV)
Keilor Terminal Station is located in the north west of Greater Melbourne. It operates at 220/66 kV and currently supplies a total of approximately 200,000 Jemena Electricity Networks and Powercor customers in the Airport West, St. Albans, Melton, Woodend, Pascoe Vale, Essendon and Braybrook areas. This will reduce to approximately 175,000 customers after load transfers to Deer Park Terminal Station are complete.
Background
KTS has five 150 MVA transformers and is a summer critical station. Up until 2012, the station was operated with one of the five transformers, also known as KTS B5 transformer, in “hot standby” mode, with the then No. 2-3 66 kV bus tie circuit breaker open for the purpose of limiting the maximum prospective fault levels to within switchgear ratings. In the event of an outage of one of the four “normally on-load” transformers, the B5 unit would be connected in automatically. Therefore the “N” and “N-1” ratings were the same.
In 2012, the station was re-configured to enable the KTS B5 transformer to take load under system normal conditions. Under system normal conditions, the No.1, No.2 & No.5 transformers are operated in parallel as one group (KTS (B1,2,5)) and supply the No.1, No.2 & No.5 66 kV buses. The No.3 & No.4 transformers are operated in parallel as a separate group (KTS (B3,4)) and supply the No.3 & No.4 66 kV buses. The 66 kV bus 3-5 and bus 1-4 tie circuit breakers are operated in the normally open position to limit the maximum prospective fault levels on the five 66 kV buses to within switchgear ratings.
For an unplanned transformer outage in the KTS (B3,4) group, the No.5 transformer will automatically change over to the KTS (B3,4) group. Therefore, an unplanned transformer outage of any one of the five transformers at KTS will result in both the KTS (B1,2,5) and KTS (B3,4) groups being comprised of two transformers each. Given this configuration, load demand on both the KTS(B3,4) and KTS (B1,2,5) groups must be kept within the capabilities of two transformers at all times or load shedding will occur.
The following sections examine the two transformer groups separately.
Transformer group KTS (B1,2,5) Summer Peak Forecasts
The graph below depicts the KTS (B1,2,5) rating with all transformers (B1, B2 & B5) in service (“N” rating), and with one of the three transformers out of service (“N-1” rating), along with the 50th and 10th percentile summer maximum demand forecasts1.
The peak load on the station reached 361.4 MW (or 361.8 MVA) in summer (February) 2017.
It is estimated that:
• For 5 hours per year, 95% of peak demand is expected to be reached under the 50th percentile demand forecast.
• The station transformer load power factor at time of peak demand is 1.00.
1 Note that station transformer output capability rating and transformer loading are shown in the graph.
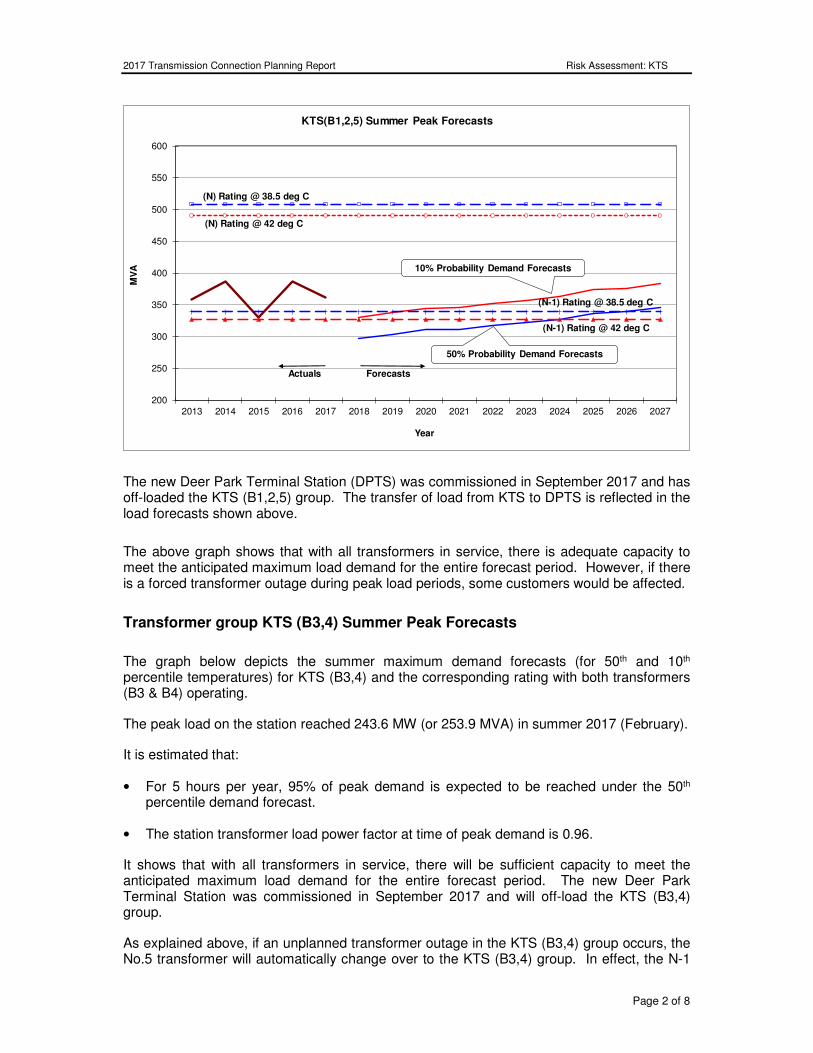
2017 Transmission Connection Planning Report Risk Assessment: KTS
Page 2 of 8
200
250
300
350
400
450
500
550
600
2013 2014 2015 2016 2017 2018 2019 2020 2021 2022 2023 2024 2025 2026 2027
MV
A
Year
KTS(B1,2,5) Summer Peak Forecasts
50% Probability Demand Forecasts
10% Probability Demand Forecasts
Forecasts
(N) Rating @ 38.5 deg C
(N-1) Rating @ 38.5 deg C
(N) Rating @ 42 deg C
(N-1) Rating @ 42 deg C
Actuals
The new Deer Park Terminal Station (DPTS) was commissioned in September 2017 and has off-loaded the KTS (B1,2,5) group. The transfer of load from KTS to DPTS is reflected in the load forecasts shown above.
The above graph shows that with all transformers in service, there is adequate capacity to meet the anticipated maximum load demand for the entire forecast period. However, if there is a forced transformer outage during peak load periods, some customers would be affected.
Transformer group KTS (B3,4) Summer Peak Forecasts
The graph below depicts the summer maximum demand forecasts (for 50th and 10th percentile temperatures) for KTS (B3,4) and the corresponding rating with both transformers (B3 & B4) operating.
The peak load on the station reached 243.6 MW (or 253.9 MVA) in summer 2017 (February).
It is estimated that:
• For 5 hours per year, 95% of peak demand is expected to be reached under the 50th percentile demand forecast.
• The station transformer load power factor at time of peak demand is 0.96.
It shows that with all transformers in service, there will be sufficient capacity to meet the anticipated maximum load demand for the entire forecast period. The new Deer Park Terminal Station was commissioned in September 2017 and will off-load the KTS (B3,4) group.
As explained above, if an unplanned transformer outage in the KTS (B3,4) group occurs, the No.5 transformer will automatically change over to the KTS (B3,4) group. In effect, the N-1
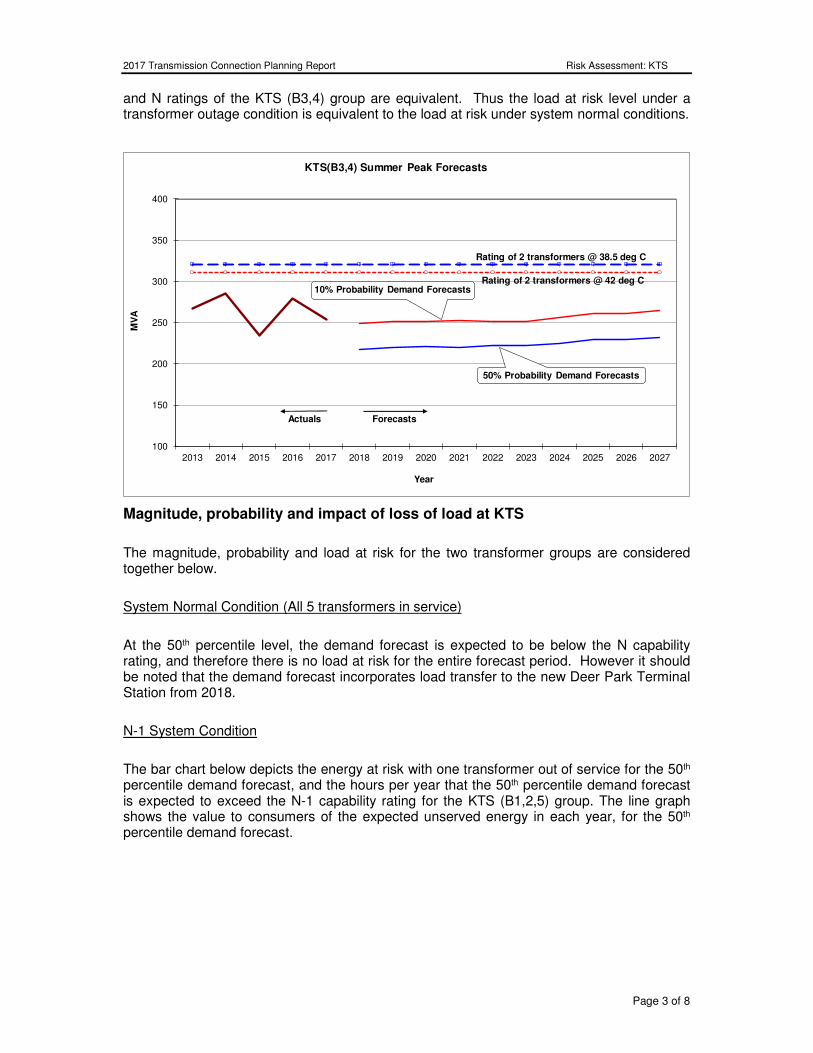
2017 Transmission Connection Planning Report Risk Assessment: KTS
Page 3 of 8
and N ratings of the KTS (B3,4) group are equivalent. Thus the load at risk level under a transformer outage condition is equivalent to the load at risk under system normal conditions.
100
150
200
250
300
350
400
2013 2014 2015 2016 2017 2018 2019 2020 2021 2022 2023 2024 2025 2026 2027
MV
A
Year
KTS(B3,4) Summer Peak Forecasts
50% Probability Demand Forecasts
10% Probability Demand Forecasts
Forecasts
Rating of 2 transformers @ 38.5 deg C
Rating of 2 transformers @ 42 deg C
Actuals
Magnitude, probability and impact of loss of load at KTS
The magnitude, probability and load at risk for the two transformer groups are considered together below.
System Normal Condition (All 5 transformers in service)
At the 50th percentile level, the demand forecast is expected to be below the N capability rating, and therefore there is no load at risk for the entire forecast period. However it should be noted that the demand forecast incorporates load transfer to the new Deer Park Terminal Station from 2018.
N-1 System Condition
The bar chart below depicts the energy at risk with one transformer out of service for the 50th percentile demand forecast, and the hours per year that the 50th percentile demand forecast is expected to exceed the N-1 capability rating for the KTS (B1,2,5) group. The line graph shows the value to consumers of the expected unserved energy in each year, for the 50th percentile demand forecast.
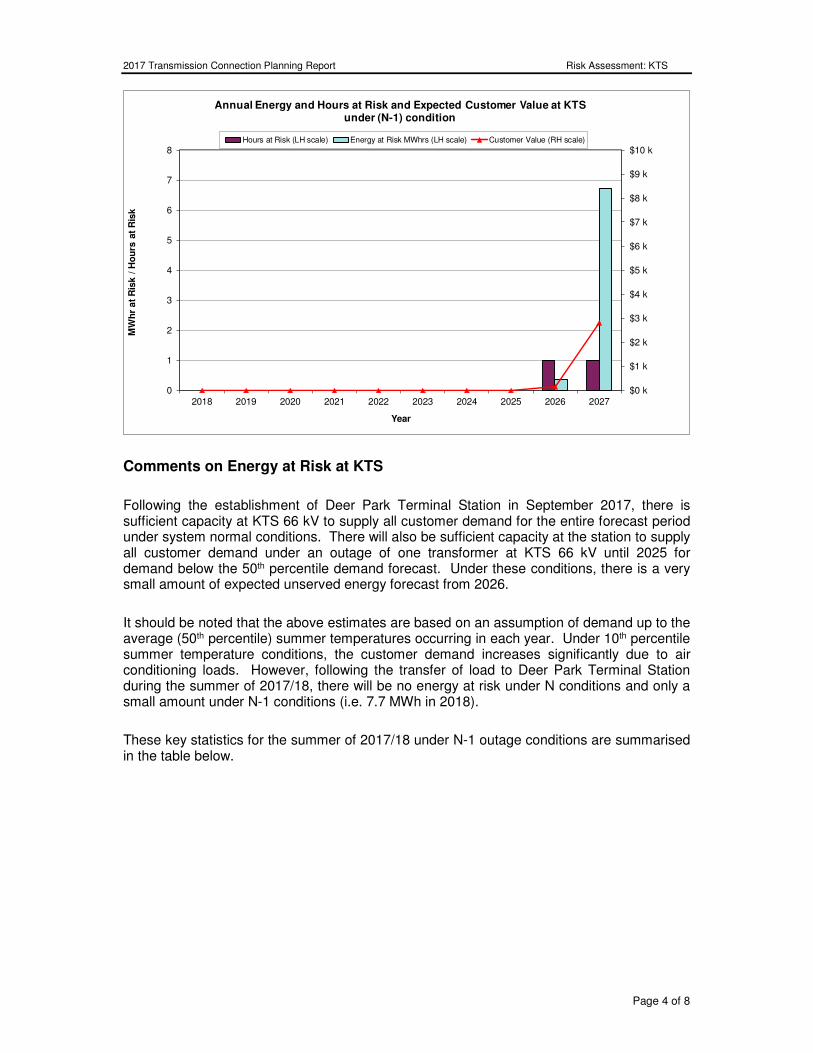
2017 Transmission Connection Planning Report Risk Assessment: KTS
Page 4 of 8
$0 k
$1 k
$2 k
$3 k
$4 k
$5 k
$6 k
$7 k
$8 k
$9 k
$10 k
0
1
2
3
4
5
6
7
8
2018 2019 2020 2021 2022 2023 2024 2025 2026 2027
MW
hr
at
Ris
k /
Ho
urs
at
Ris
k
Year
Annual Energy and Hours at Risk and Expected Customer Value at KTS under (N-1) condition
Hours at Risk (LH scale) Energy at Risk MWhrs (LH scale) Customer Value (RH scale)
Comments on Energy at Risk at KTS
Following the establishment of Deer Park Terminal Station in September 2017, there is sufficient capacity at KTS 66 kV to supply all customer demand for the entire forecast period under system normal conditions. There will also be sufficient capacity at the station to supply all customer demand under an outage of one transformer at KTS 66 kV until 2025 for demand below the 50th percentile demand forecast. Under these conditions, there is a very small amount of expected unserved energy forecast from 2026.
It should be noted that the above estimates are based on an assumption of demand up to the average (50th percentile) summer temperatures occurring in each year. Under 10th percentile summer temperature conditions, the customer demand increases significantly due to air conditioning loads. However, following the transfer of load to Deer Park Terminal Station during the summer of 2017/18, there will be no energy at risk under N conditions and only a small amount under N-1 conditions (i.e. 7.7 MWh in 2018).
These key statistics for the summer of 2017/18 under N-1 outage conditions are summarised in the table below.
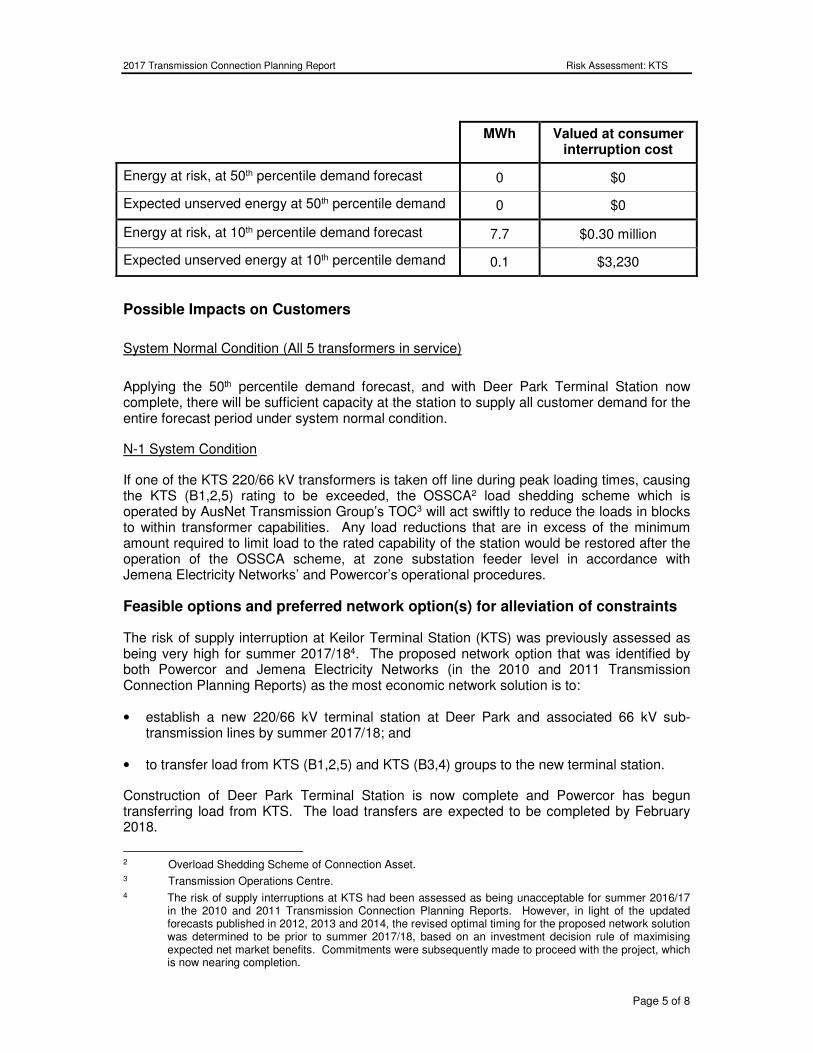
2017 Transmission Connection Planning Report Risk Assessment: KTS
Page 5 of 8
MWh Valued at consumer interruption cost
Energy at risk, at 50th percentile demand forecast 0 $0
Expected unserved energy at 50th percentile demand 0 $0
Energy at risk, at 10th percentile demand forecast 7.7 $0.30 million
Expected unserved energy at 10th percentile demand 0.1 $3,230
Possible Impacts on Customers
System Normal Condition (All 5 transformers in service)
Applying the 50th percentile demand forecast, and with Deer Park Terminal Station now complete, there will be sufficient capacity at the station to supply all customer demand for the entire forecast period under system normal condition.
N-1 System Condition
If one of the KTS 220/66 kV transformers is taken off line during peak loading times, causing the KTS (B1,2,5) rating to be exceeded, the OSSCA2 load shedding scheme which is operated by AusNet Transmission Group’s TOC3 will act swiftly to reduce the loads in blocks to within transformer capabilities. Any load reductions that are in excess of the minimum amount required to limit load to the rated capability of the station would be restored after the operation of the OSSCA scheme, at zone substation feeder level in accordance with Jemena Electricity Networks’ and Powercor’s operational procedures.
Feasible options and preferred network option(s) for alleviation of constraints
The risk of supply interruption at Keilor Terminal Station (KTS) was previously assessed as being very high for summer 2017/184. The proposed network option that was identified by both Powercor and Jemena Electricity Networks (in the 2010 and 2011 Transmission Connection Planning Reports) as the most economic network solution is to:
• establish a new 220/66 kV terminal station at Deer Park and associated 66 kV sub-transmission lines by summer 2017/18; and
• to transfer load from KTS (B1,2,5) and KTS (B3,4) groups to the new terminal station.
Construction of Deer Park Terminal Station is now complete and Powercor has begun transferring load from KTS. The load transfers are expected to be completed by February 2018.
2 Overload Shedding Scheme of Connection Asset. 3 Transmission Operations Centre. 4 The risk of supply interruptions at KTS had been assessed as being unacceptable for summer 2016/17
in the 2010 and 2011 Transmission Connection Planning Reports. However, in light of the updated forecasts published in 2012, 2013 and 2014, the revised optimal timing for the proposed network solution was determined to be prior to summer 2017/18, based on an investment decision rule of maximising expected net market benefits. Commitments were subsequently made to proceed with the project, which is now nearing completion.
2017 Transmission Connection Planning Report Risk Assessment: KTS
Page 6 of 8
Until the transfers are completed, the risk to supply reliability will be mitigated through the following temporary measures:
• Balance the load between the two bus groups at KTS so that the load on each bus group is kept below its N rating;
• Maintain contingency plans to transfer load quickly, where possible, to adjacent terminal stations. Jemena Electricity Networks has up to 44 MVA of load transfer capacity available and Powercor has up to 18 MVA of transfer capacity available. This option is able to partly reduce the interruption duration and load at risk resulting from a major transformer failure.
• Fine-tune the OSSCA scheme settings in conjunction with AusNet Transmission Group to minimise the impact on customers of any automatic load shedding that may take place; and
• Subject to the availability of an AusNet Transmission Group spare 220/66 kV transformer for urban areas (refer to section 5.5), a spare transformer could be installed at KTS and used to temporarily replace a failed transformer.
The tables on the following pages provide more detailed data on the station rating, demand forecasts, energy at risk and expected unserved energy.
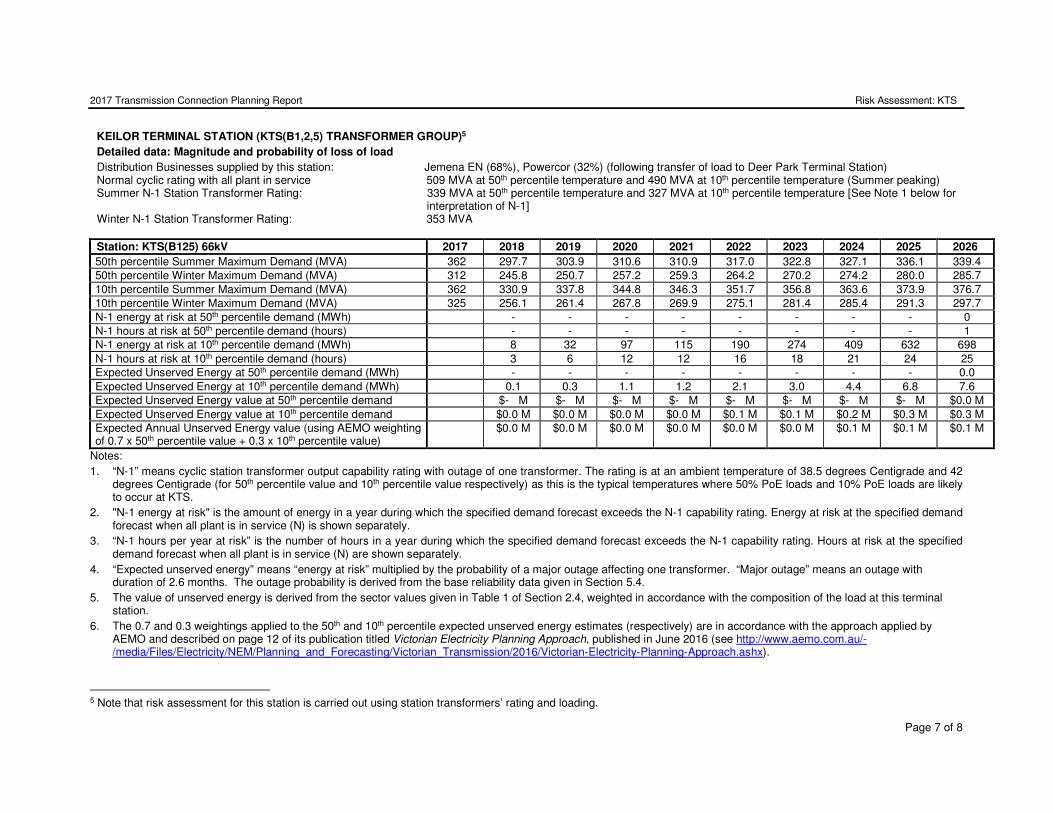
2017 Transmission Connection Planning Report Risk Assessment: KTS
Page 7 of 8
KEILOR TERMINAL STATION (KTS(B1,2,5) TRANSFORMER GROUP)5
Detailed data: Magnitude and probability of loss of load
Distribution Businesses supplied by this station: Jemena EN (68%), Powercor (32%) (following transfer of load to Deer Park Terminal Station) Normal cyclic rating with all plant in service 509 MVA at 50th percentile temperature and 490 MVA at 10th percentile temperature (Summer peaking) Summer N-1 Station Transformer Rating: 339 MVA at 50th percentile temperature and 327 MVA at 10th percentile temperature [See Note 1 below for
interpretation of N-1] Winter N-1 Station Transformer Rating: 353 MVA
Station: KTS(B125) 66kV 2017 2018 2019 2020 2021 2022 2023 2024 2025 2026
50th percentile Summer Maximum Demand (MVA) 362 297.7 303.9 310.6 310.9 317.0 322.8 327.1 336.1 339.4 50th percentile Winter Maximum Demand (MVA) 312 245.8 250.7 257.2 259.3 264.2 270.2 274.2 280.0 285.7 10th percentile Summer Maximum Demand (MVA) 362 330.9 337.8 344.8 346.3 351.7 356.8 363.6 373.9 376.7 10th percentile Winter Maximum Demand (MVA) 325 256.1 261.4 267.8 269.9 275.1 281.4 285.4 291.3 297.7 N-1 energy at risk at 50th percentile demand (MWh) - - - - - - - - 0 N-1 hours at risk at 50th percentile demand (hours) - - - - - - - - 1 N-1 energy at risk at 10th percentile demand (MWh) 8 32 97 115 190 274 409 632 698
N-1 hours at risk at 10th percentile demand (hours) 3 6 12 12 16 18 21 24 25 Expected Unserved Energy at 50th percentile demand (MWh) - - - - - - - - 0.0
Expected Unserved Energy at 10th percentile demand (MWh) 0.1 0.3 1.1 1.2 2.1 3.0 4.4 6.8 7.6 Expected Unserved Energy value at 50th percentile demand $- M $- M $- M $- M $- M $- M $- M $- M $0.0 M
Expected Unserved Energy value at 10th percentile demand $0.0 M $0.0 M $0.0 M $0.0 M $0.1 M $0.1 M $0.2 M $0.3 M $0.3 M Expected Annual Unserved Energy value (using AEMO weighting of 0.7 x 50th percentile value + 0.3 x 10th percentile value)
$0.0 M $0.0 M $0.0 M $0.0 M $0.0 M $0.0 M $0.1 M $0.1 M $0.1 M
Notes:
1. “N-1” means cyclic station transformer output capability rating with outage of one transformer. The rating is at an ambient temperature of 38.5 degrees Centigrade and 42 degrees Centigrade (for 50th percentile value and 10th percentile value respectively) as this is the typical temperatures where 50% PoE loads and 10% PoE loads are likely to occur at KTS.
2. "N-1 energy at risk" is the amount of energy in a year during which the specified demand forecast exceeds the N-1 capability rating. Energy at risk at the specified demand forecast when all plant is in service (N) is shown separately.
3. “N-1 hours per year at risk” is the number of hours in a year during which the specified demand forecast exceeds the N-1 capability rating. Hours at risk at the specified demand forecast when all plant is in service (N) are shown separately.
4. “Expected unserved energy” means “energy at risk” multiplied by the probability of a major outage affecting one transformer. “Major outage” means an outage with duration of 2.6 months. The outage probability is derived from the base reliability data given in Section 5.4.
5. The value of unserved energy is derived from the sector values given in Table 1 of Section 2.4, weighted in accordance with the composition of the load at this terminal station.
6. The 0.7 and 0.3 weightings applied to the 50th and 10th percentile expected unserved energy estimates (respectively) are in accordance with the approach applied by AEMO and described on page 12 of its publication titled Victorian Electricity Planning Approach, published in June 2016 (see http://www.aemo.com.au/-/media/Files/Electricity/NEM/Planning_and_Forecasting/Victorian_Transmission/2016/Victorian-Electricity-Planning-Approach.ashx).
5 Note that risk assessment for this station is carried out using station transformers’ rating and loading.
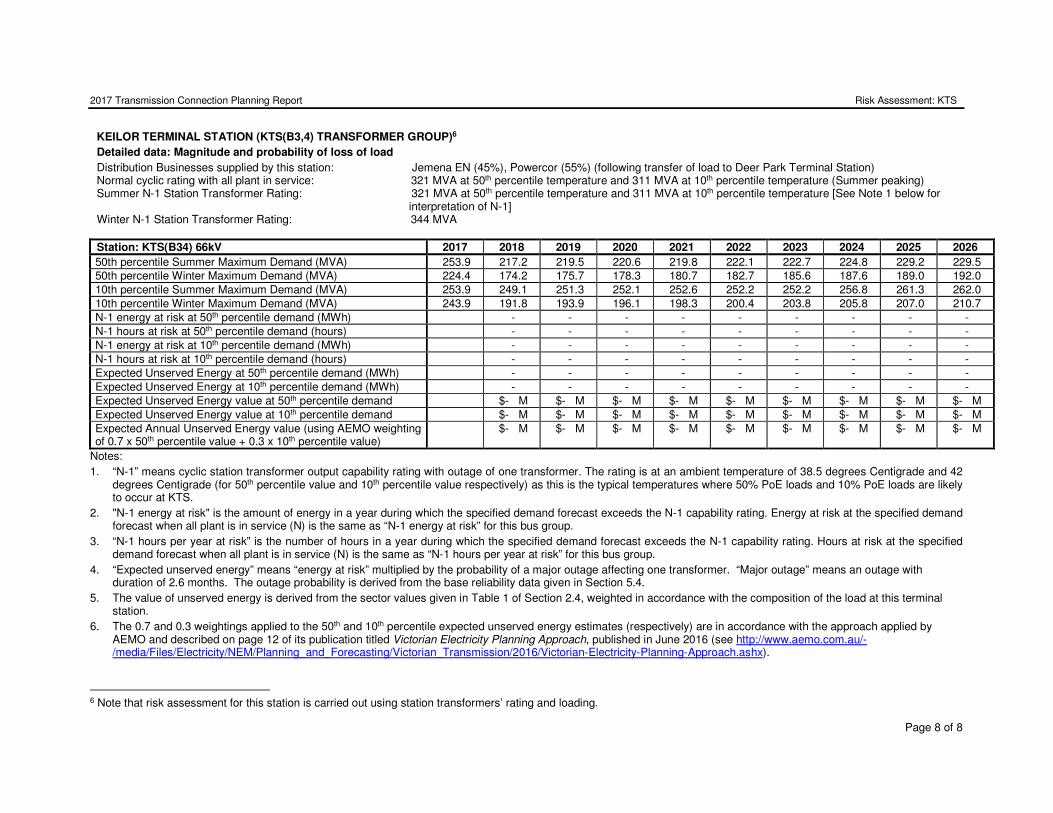
2017 Transmission Connection Planning Report Risk Assessment: KTS
Page 8 of 8
KEILOR TERMINAL STATION (KTS(B3,4) TRANSFORMER GROUP)6
Detailed data: Magnitude and probability of loss of load
Distribution Businesses supplied by this station: Jemena EN (45%), Powercor (55%) (following transfer of load to Deer Park Terminal Station) Normal cyclic rating with all plant in service: 321 MVA at 50th percentile temperature and 311 MVA at 10th percentile temperature (Summer peaking) Summer N-1 Station Transformer Rating: 321 MVA at 50th percentile temperature and 311 MVA at 10th percentile temperature [See Note 1 below for
interpretation of N-1] Winter N-1 Station Transformer Rating: 344 MVA
Station: KTS(B34) 66kV 2017 2018 2019 2020 2021 2022 2023 2024 2025 2026
50th percentile Summer Maximum Demand (MVA) 253.9 217.2 219.5 220.6 219.8 222.1 222.7 224.8 229.2 229.5 50th percentile Winter Maximum Demand (MVA) 224.4 174.2 175.7 178.3 180.7 182.7 185.6 187.6 189.0 192.0 10th percentile Summer Maximum Demand (MVA) 253.9 249.1 251.3 252.1 252.6 252.2 252.2 256.8 261.3 262.0 10th percentile Winter Maximum Demand (MVA) 243.9 191.8 193.9 196.1 198.3 200.4 203.8 205.8 207.0 210.7 N-1 energy at risk at 50th percentile demand (MWh) - - - - - - - - - N-1 hours at risk at 50th percentile demand (hours) - - - - - - - - - N-1 energy at risk at 10th percentile demand (MWh) - - - - - - - - - N-1 hours at risk at 10th percentile demand (hours) - - - - - - - - - Expected Unserved Energy at 50th percentile demand (MWh) - - - - - - - - - Expected Unserved Energy at 10th percentile demand (MWh) - - - - - - - - - Expected Unserved Energy value at 50th percentile demand $- M $- M $- M $- M $- M $- M $- M $- M $- M Expected Unserved Energy value at 10th percentile demand $- M $- M $- M $- M $- M $- M $- M $- M $- M Expected Annual Unserved Energy value (using AEMO weighting of 0.7 x 50th percentile value + 0.3 x 10th percentile value)
$- M $- M $- M $- M $- M $- M $- M $- M $- M
Notes:
1. “N-1” means cyclic station transformer output capability rating with outage of one transformer. The rating is at an ambient temperature of 38.5 degrees Centigrade and 42 degrees Centigrade (for 50th percentile value and 10th percentile value respectively) as this is the typical temperatures where 50% PoE loads and 10% PoE loads are likely to occur at KTS.
2. "N-1 energy at risk" is the amount of energy in a year during which the specified demand forecast exceeds the N-1 capability rating. Energy at risk at the specified demand forecast when all plant is in service (N) is the same as “N-1 energy at risk” for this bus group.
3. “N-1 hours per year at risk” is the number of hours in a year during which the specified demand forecast exceeds the N-1 capability rating. Hours at risk at the specified demand forecast when all plant is in service (N) is the same as “N-1 hours per year at risk” for this bus group.
4. “Expected unserved energy” means “energy at risk” multiplied by the probability of a major outage affecting one transformer. “Major outage” means an outage with duration of 2.6 months. The outage probability is derived from the base reliability data given in Section 5.4.
5. The value of unserved energy is derived from the sector values given in Table 1 of Section 2.4, weighted in accordance with the composition of the load at this terminal station.
6. The 0.7 and 0.3 weightings applied to the 50th and 10th percentile expected unserved energy estimates (respectively) are in accordance with the approach applied by AEMO and described on page 12 of its publication titled Victorian Electricity Planning Approach, published in June 2016 (see http://www.aemo.com.au/-/media/Files/Electricity/NEM/Planning_and_Forecasting/Victorian_Transmission/2016/Victorian-Electricity-Planning-Approach.ashx).
6 Note that risk assessment for this station is carried out using station transformers’ rating and loading.
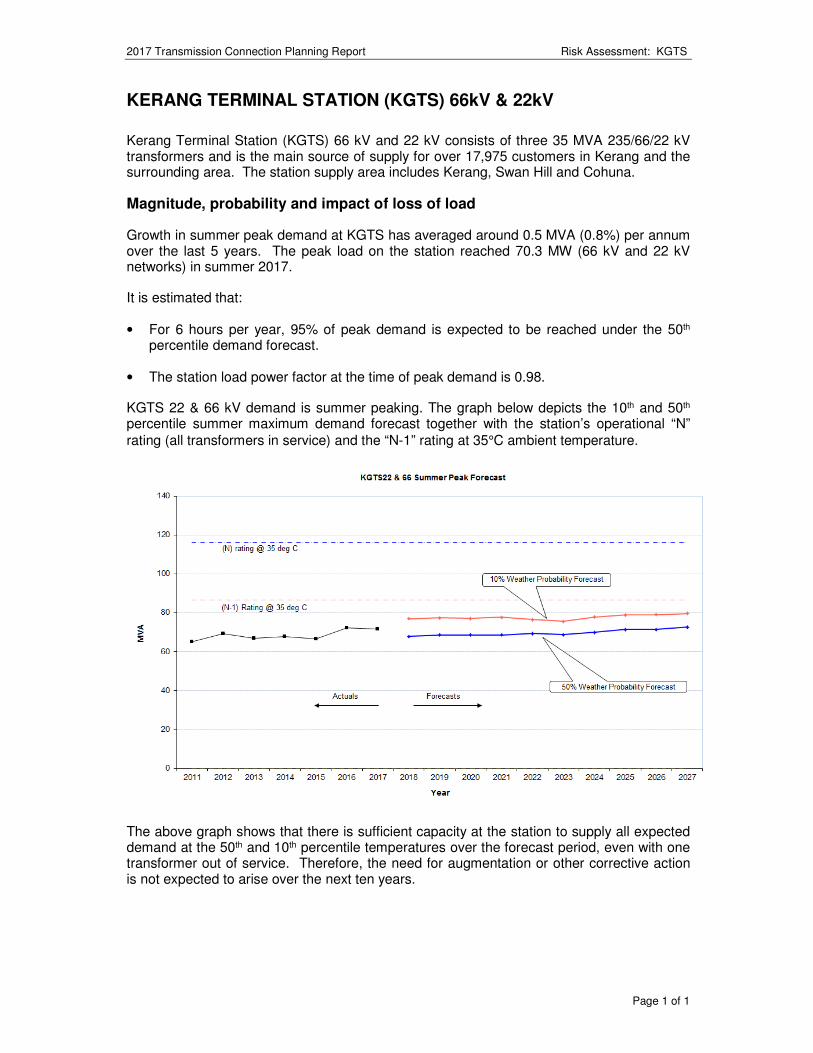
2017 Transmission Connection Planning Report Risk Assessment: KGTS
Page 1 of 1
KERANG TERMINAL STATION (KGTS) 66kV & 22kV
Kerang Terminal Station (KGTS) 66 kV and 22 kV consists of three 35 MVA 235/66/22 kV transformers and is the main source of supply for over 17,975 customers in Kerang and the surrounding area. The station supply area includes Kerang, Swan Hill and Cohuna.
Magnitude, probability and impact of loss of load
Growth in summer peak demand at KGTS has averaged around 0.5 MVA (0.8%) per annum over the last 5 years. The peak load on the station reached 70.3 MW (66 kV and 22 kV networks) in summer 2017.
It is estimated that:
• For 6 hours per year, 95% of peak demand is expected to be reached under the 50th percentile demand forecast.
• The station load power factor at the time of peak demand is 0.98.
KGTS 22 & 66 kV demand is summer peaking. The graph below depicts the 10th and 50th percentile summer maximum demand forecast together with the station’s operational “N”
rating (all transformers in service) and the “N-1” rating at 35°C ambient temperature.
The above graph shows that there is sufficient capacity at the station to supply all expected demand at the 50th and 10th percentile temperatures over the forecast period, even with one transformer out of service. Therefore, the need for augmentation or other corrective action is not expected to arise over the next ten years.
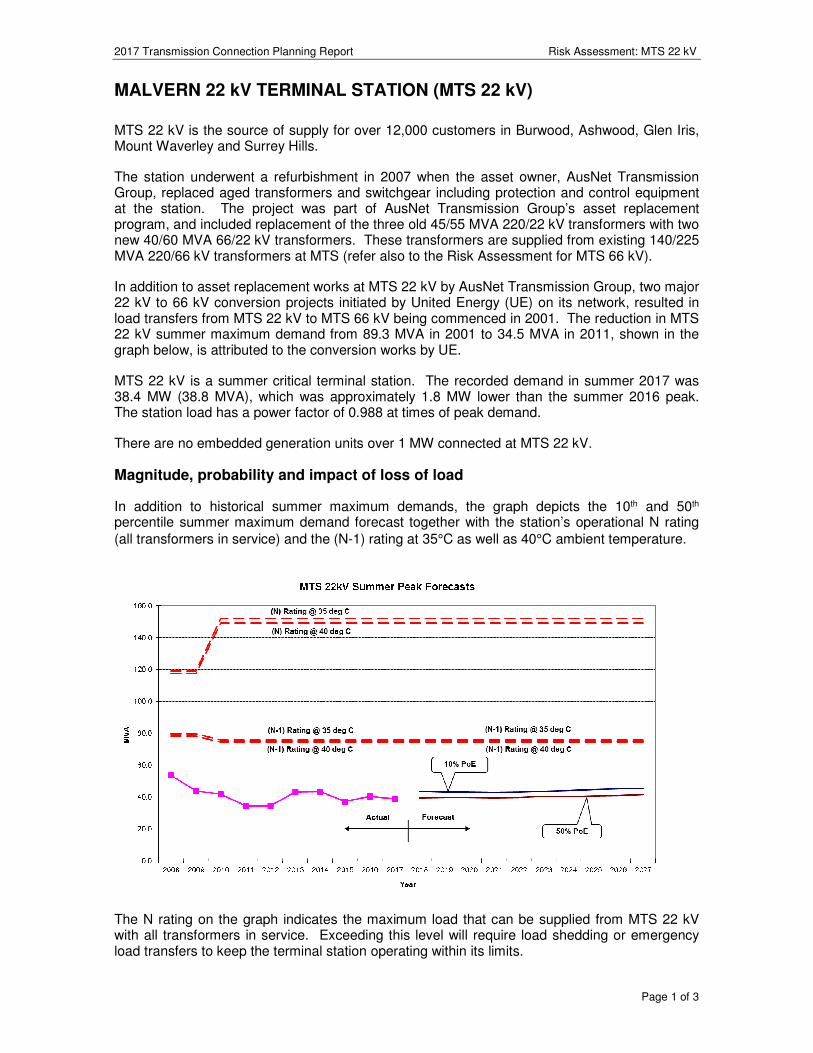
2017 Transmission Connection Planning Report Risk Assessment: MTS 22 kV
Page 1 of 3
MALVERN 22 kV TERMINAL STATION (MTS 22 kV)
MTS 22 kV is the source of supply for over 12,000 customers in Burwood, Ashwood, Glen Iris, Mount Waverley and Surrey Hills.
The station underwent a refurbishment in 2007 when the asset owner, AusNet Transmission Group, replaced aged transformers and switchgear including protection and control equipment at the station. The project was part of AusNet Transmission Group’s asset replacement program, and included replacement of the three old 45/55 MVA 220/22 kV transformers with two new 40/60 MVA 66/22 kV transformers. These transformers are supplied from existing 140/225 MVA 220/66 kV transformers at MTS (refer also to the Risk Assessment for MTS 66 kV).
In addition to asset replacement works at MTS 22 kV by AusNet Transmission Group, two major 22 kV to 66 kV conversion projects initiated by United Energy (UE) on its network, resulted in load transfers from MTS 22 kV to MTS 66 kV being commenced in 2001. The reduction in MTS 22 kV summer maximum demand from 89.3 MVA in 2001 to 34.5 MVA in 2011, shown in the graph below, is attributed to the conversion works by UE.
MTS 22 kV is a summer critical terminal station. The recorded demand in summer 2017 was 38.4 MW (38.8 MVA), which was approximately 1.8 MW lower than the summer 2016 peak. The station load has a power factor of 0.988 at times of peak demand.
There are no embedded generation units over 1 MW connected at MTS 22 kV.
Magnitude, probability and impact of loss of load
In addition to historical summer maximum demands, the graph depicts the 10th and 50th percentile summer maximum demand forecast together with the station’s operational N rating (all transformers in service) and the (N-1) rating at 35°C as well as 40°C ambient temperature.
The N rating on the graph indicates the maximum load that can be supplied from MTS 22 kV with all transformers in service. Exceeding this level will require load shedding or emergency load transfers to keep the terminal station operating within its limits.
2017 Transmission Connection Planning Report Risk Assessment: MTS 22 kV
Page 2 of 3
The graph above shows that with one transformer out of service, the demand at MTS 22 kV will remain well within the (N-1) station rating over the next ten years.
The station load is forecast to have a power factor of 0.988 at times of peak demand. The demand at MTS 22 kV is expected to exceed 95% of peak demand for approximately 5 hours per annum in a 50% POE year. There is approximately 3 MVA of load transfer available at MTS 22 kV for summer 2017/18.
On the basis of the current forecasts, the need for augmentation of transmission connection assets at MTS 22 kV is not expected to arise over the next decade.
The table on the following page provides more detailed data on the station rating and demand forecasts.

2017 Transmission Connection Planning Report Risk Assessment: MTS 22 kV
Page 3 of 3
MALVERN TERMINAL STATION 22 kV
Detailed data: Magnitude and probability of loss of load
Distribution Businesses supplied by this station: United Energy Distribution (100%)
Station operational rating (N elements in service): 152 MVA via 2 transformers (Summer peaking)
Summer N-1 Station Rating: 76 MVA [See Note 1 below for interpretation of N-1]
Winter N-1 Station Rating: 84 MVA
Station: MTS 22kV 2018 2019 2020 2021 2022 2023 2024 2025 2026 2027
50th percentile Summer Maximum Demand (MVA) 39.6 39.8 39.7 39.6 39.8 40.4 40.4 40.7 41.0 41.6
50th percentile Winter Maximum Demand (MVA) 31.6 31.6 31.6 31.5 31.5 31.5 31.5 31.6 31.7 31.7
10th percentile Summer Maximum Demand (MVA) 43.6 43.3 43.3 43.1 43.3 43.7 44.1 44.8 45.2 45.3
10th percentile Winter Maximum Demand (MVA) 32.9 33.0 33.0 33.0 32.9 32.9 33.0 33.1 33.2 33.2
N-1 energy at risk at 50th percentile demand (MWh) 0 0 0 0 0 0 0 0 0 0
N-1 hours at risk at 50th percentile demand (hours) 0 0 0 0 0 0 0 0 0 0
N-1 energy at risk at 10th percentile demand (MWh) 0 0 0 0 0 0 0 0 0 0
N-1 hours at risk at 10th percentile demand (hours) 0 0 0 0 0 0 0 0 0 0
Expected Unserved Energy at 50th percentile demand (MWh) 0.0 0.0 0.0 0.0 0.0 0.0 0.0 0.0 0.0 0.0
Expected Unserved Energy at 10th percentile demand (MWh) 0.0 0.0 0.0 0.0 0.0 0.0 0.0 0.0 0.0 0.0
Expected Unserved Energy value at 50th percentile demand $0.0k $0.0k $0.0k $0.0k $0.0k $0.0k $0.0k $0.0k $0.0k $0.0k
Expected Unserved Energy value at 10th percentile demand $0.0k $0.0k $0.0k $0.0k $0.0k $0.0k $0.0k $0.0k $0.0k $0.0k
Expected Unserved Energy value using AEMO weighting of 0.7 x 50th percentile value + 0.3 x 10th percentile value
$0.0k $0.0k $0.0k $0.0k $0.0k $0.0k $0.0k $0.0k $0.0k $0.0k
Notes:
1. “N-1” means cyclic station output capability rating with outage of one transformer. The rating is at an ambient temperature of 35 degrees Centigrade.
2. “N-1 energy at risk” is the amount of energy in a year during which the specified demand forecast exceeds the N-1 capability rating. Energy at risk at the specified demand forecast when all plant is in service (N) is shown separately.
3. “N-1 hours per year at risk” is the number of hours in a year during which the specified demand forecast exceeds the N-1 capability rating. Hours at risk at the specified demand forecast when all plant is in service (N) are shown separately.
4. “Expected unserved energy” means “energy at risk” multiplied by the probability of a major outage affecting one transformer. “Major outage” means an outage with duration of 2.6 months. The outage probability is derived from the base reliability data given in Section 5.4.
5. The value of unserved energy is derived from the sector values given in Table 1 of Section 2.4, weighted in accordance with the composition of the load at this terminal station.
6. The 0.7 and 0.3 weightings applied to the 50th and 10th percentile expected unserved energy estimates (respectively) are in accordance with the approach applied by AEMO, and described on page 12 of its publication titled Victorian Electricity Planning Approach, published in June 2016 (see http://www.aemo.com.au/-/media/Files/Electricity/NEM/Planning_and_Forecasting/Victorian_Transmission/2016/Victorian-Electricity-Planning-Approach.ashx)
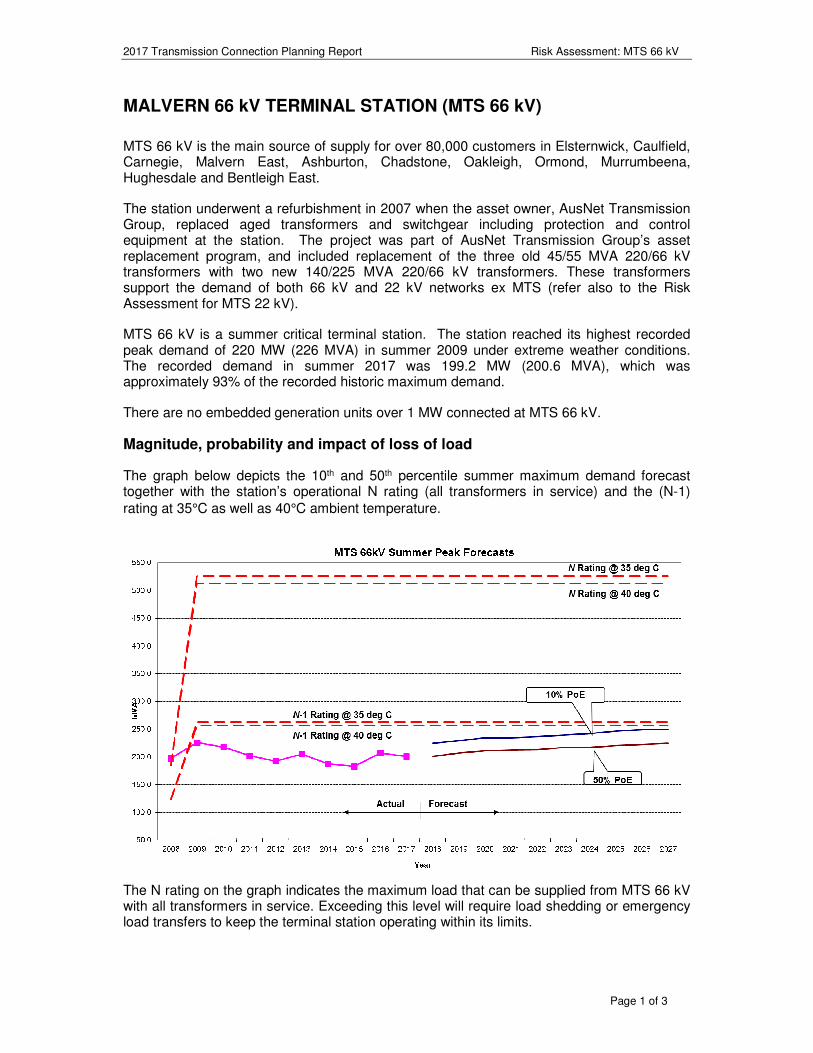
2017 Transmission Connection Planning Report Risk Assessment: MTS 66 kV
Page 1 of 3
MALVERN 66 kV TERMINAL STATION (MTS 66 kV)
MTS 66 kV is the main source of supply for over 80,000 customers in Elsternwick, Caulfield, Carnegie, Malvern East, Ashburton, Chadstone, Oakleigh, Ormond, Murrumbeena, Hughesdale and Bentleigh East.
The station underwent a refurbishment in 2007 when the asset owner, AusNet Transmission Group, replaced aged transformers and switchgear including protection and control equipment at the station. The project was part of AusNet Transmission Group’s asset replacement program, and included replacement of the three old 45/55 MVA 220/66 kV transformers with two new 140/225 MVA 220/66 kV transformers. These transformers support the demand of both 66 kV and 22 kV networks ex MTS (refer also to the Risk Assessment for MTS 22 kV).
MTS 66 kV is a summer critical terminal station. The station reached its highest recorded peak demand of 220 MW (226 MVA) in summer 2009 under extreme weather conditions. The recorded demand in summer 2017 was 199.2 MW (200.6 MVA), which was approximately 93% of the recorded historic maximum demand.
There are no embedded generation units over 1 MW connected at MTS 66 kV.
Magnitude, probability and impact of loss of load
The graph below depicts the 10th and 50th percentile summer maximum demand forecast together with the station’s operational N rating (all transformers in service) and the (N-1) rating at 35°C as well as 40°C ambient temperature.
The N rating on the graph indicates the maximum load that can be supplied from MTS 66 kV with all transformers in service. Exceeding this level will require load shedding or emergency load transfers to keep the terminal station operating within its limits.
2017 Transmission Connection Planning Report Risk Assessment: MTS 66 kV
Page 2 of 3
The graph above shows that with one transformer out of service, the demand at MTS 66 kV will remain well within the (N-1) station rating over the next ten years.
The station load is forecast to have a power factor of 0.994 at times of peak demand. The demand at MTS 66 kV is expected to exceed 95% of the peak demand for approximately 4 hours per annum in a 50% POE demand year. There is approximately 19MVA of load transfer available at MTS 66kV for summer 2017/18.
On the basis of the latest forecasts, the need for augmentation of transmission connection assets at MTS 66 kV is not expected to arise over the next decade.
The table on the following page provides more detailed data on the station rating and demand forecasts.
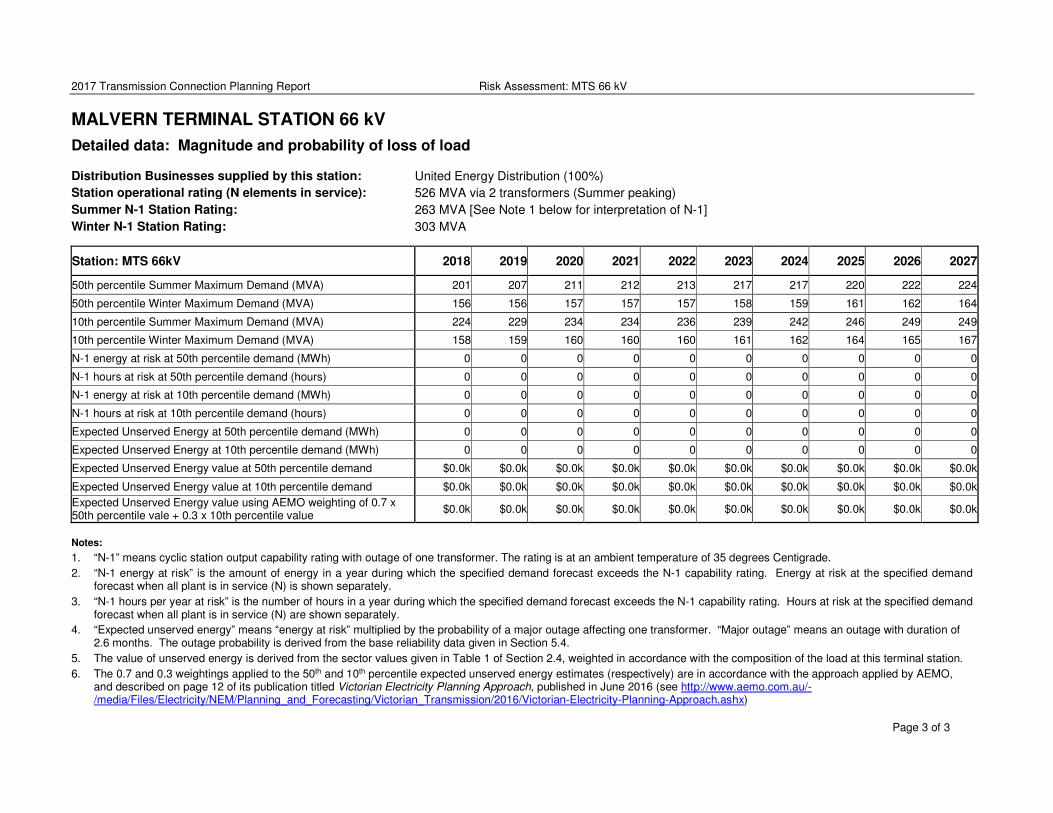
2017 Transmission Connection Planning Report Risk Assessment: MTS 66 kV
Page 3 of 3
MALVERN TERMINAL STATION 66 kV
Detailed data: Magnitude and probability of loss of load
Distribution Businesses supplied by this station: United Energy Distribution (100%)
Station operational rating (N elements in service): 526 MVA via 2 transformers (Summer peaking)
Summer N-1 Station Rating: 263 MVA [See Note 1 below for interpretation of N-1]
Winter N-1 Station Rating: 303 MVA
Station: MTS 66kV 2018 2019 2020 2021 2022 2023 2024 2025 2026 2027
50th percentile Summer Maximum Demand (MVA) 201 207 211 212 213 217 217 220 222 224
50th percentile Winter Maximum Demand (MVA) 156 156 157 157 157 158 159 161 162 164
10th percentile Summer Maximum Demand (MVA) 224 229 234 234 236 239 242 246 249 249
10th percentile Winter Maximum Demand (MVA) 158 159 160 160 160 161 162 164 165 167
N-1 energy at risk at 50th percentile demand (MWh) 0 0 0 0 0 0 0 0 0 0
N-1 hours at risk at 50th percentile demand (hours) 0 0 0 0 0 0 0 0 0 0
N-1 energy at risk at 10th percentile demand (MWh) 0 0 0 0 0 0 0 0 0 0
N-1 hours at risk at 10th percentile demand (hours) 0 0 0 0 0 0 0 0 0 0
Expected Unserved Energy at 50th percentile demand (MWh) 0 0 0 0 0 0 0 0 0 0
Expected Unserved Energy at 10th percentile demand (MWh) 0 0 0 0 0 0 0 0 0 0
Expected Unserved Energy value at 50th percentile demand $0.0k $0.0k $0.0k $0.0k $0.0k $0.0k $0.0k $0.0k $0.0k $0.0k
Expected Unserved Energy value at 10th percentile demand $0.0k $0.0k $0.0k $0.0k $0.0k $0.0k $0.0k $0.0k $0.0k $0.0k
Expected Unserved Energy value using AEMO weighting of 0.7 x 50th percentile vale + 0.3 x 10th percentile value
$0.0k $0.0k $0.0k $0.0k $0.0k $0.0k $0.0k $0.0k $0.0k $0.0k
Notes:
1. “N-1” means cyclic station output capability rating with outage of one transformer. The rating is at an ambient temperature of 35 degrees Centigrade.
2. “N-1 energy at risk” is the amount of energy in a year during which the specified demand forecast exceeds the N-1 capability rating. Energy at risk at the specified demand forecast when all plant is in service (N) is shown separately.
3. “N-1 hours per year at risk” is the number of hours in a year during which the specified demand forecast exceeds the N-1 capability rating. Hours at risk at the specified demand forecast when all plant is in service (N) are shown separately.
4. “Expected unserved energy” means “energy at risk” multiplied by the probability of a major outage affecting one transformer. “Major outage” means an outage with duration of 2.6 months. The outage probability is derived from the base reliability data given in Section 5.4.
5. The value of unserved energy is derived from the sector values given in Table 1 of Section 2.4, weighted in accordance with the composition of the load at this terminal station.
6. The 0.7 and 0.3 weightings applied to the 50th and 10th percentile expected unserved energy estimates (respectively) are in accordance with the approach applied by AEMO, and described on page 12 of its publication titled Victorian Electricity Planning Approach, published in June 2016 (see http://www.aemo.com.au/-/media/Files/Electricity/NEM/Planning_and_Forecasting/Victorian_Transmission/2016/Victorian-Electricity-Planning-Approach.ashx)
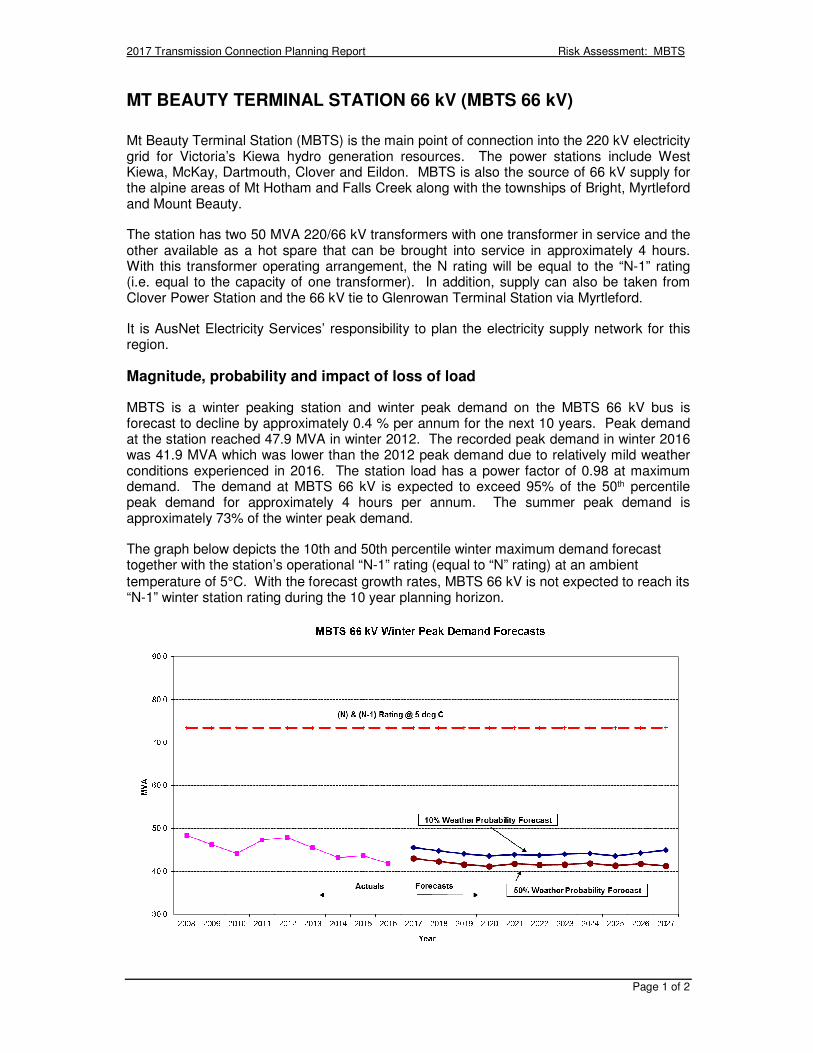
2017 Transmission Connection Planning Report Risk Assessment: MBTS
Page 1 of 2
MT BEAUTY TERMINAL STATION 66 kV (MBTS 66 kV)
Mt Beauty Terminal Station (MBTS) is the main point of connection into the 220 kV electricity grid for Victoria’s Kiewa hydro generation resources. The power stations include West Kiewa, McKay, Dartmouth, Clover and Eildon. MBTS is also the source of 66 kV supply for the alpine areas of Mt Hotham and Falls Creek along with the townships of Bright, Myrtleford and Mount Beauty.
The station has two 50 MVA 220/66 kV transformers with one transformer in service and the other available as a hot spare that can be brought into service in approximately 4 hours. With this transformer operating arrangement, the N rating will be equal to the “N-1” rating (i.e. equal to the capacity of one transformer). In addition, supply can also be taken from Clover Power Station and the 66 kV tie to Glenrowan Terminal Station via Myrtleford.
It is AusNet Electricity Services’ responsibility to plan the electricity supply network for this region.
Magnitude, probability and impact of loss of load
MBTS is a winter peaking station and winter peak demand on the MBTS 66 kV bus is forecast to decline by approximately 0.4 % per annum for the next 10 years. Peak demand at the station reached 47.9 MVA in winter 2012. The recorded peak demand in winter 2016 was 41.9 MVA which was lower than the 2012 peak demand due to relatively mild weather conditions experienced in 2016. The station load has a power factor of 0.98 at maximum demand. The demand at MBTS 66 kV is expected to exceed 95% of the 50th percentile peak demand for approximately 4 hours per annum. The summer peak demand is approximately 73% of the winter peak demand.
The graph below depicts the 10th and 50th percentile winter maximum demand forecast together with the station’s operational “N-1” rating (equal to “N” rating) at an ambient temperature of 5°C. With the forecast growth rates, MBTS 66 kV is not expected to reach its “N-1” winter station rating during the 10 year planning horizon.
2017 Transmission Connection Planning Report Risk Assessment: MBTS
Page 2 of 2
The above analysis does not include the possibility of loss of load for the short period of about 4 hours that it takes to change over from the in-service transformer to the hot spare transformer. The 66 kV tie line to Glenrowan Terminal Station can support about 25 MW of MBTS load and this tie line is operated normally closed so if the load is below this limit there will not be any loss of customer load during a transformer outage. The Clover power station can generate around 26 MW and so any generation would also minimise the likelihood of the loss of customer load during a transformer outage.
It is recognised that at times of high demand and with low output from Clover power station a transformer outage at MBTS could result in the loss of some customer load for a short period of no more than 4 hours.
The energy at risk for a major transformer outage1 in this situation (taking account of the limited 66 kV tie line capability) is significant at around 2,565 MWh in winter 2017 and reducing to 1,873 MWh by 2027 due to forecast negative demand growth. However, given that the hot spare transformer can be made available within 4 hours, the expected outage duration in the case of a major transformer failure at MBTS is 4 hours (rather than 2.6 months). Accordingly, the probability of the transformer being unavailable in this particular case is only 0.000457%. The expected unserved energy at MBTS is therefore approximately 0.009 MWh in 2026 and this is estimated to have a value to consumers of approximately $315 (based on a value of customer reliability of $36,895/MWh).
Full switching of the hot spare transformer with new 220 kV and 66 kV circuit breakers would eliminate this risk but this is estimated to cost around $2 million. The expected benefits of full switching of the hot spare transformer does not economically justify the cost of the project within the ten year planning horizon.
1 In this report, “major transformer outage” means an outage that has a mean duration of 2.6 months.
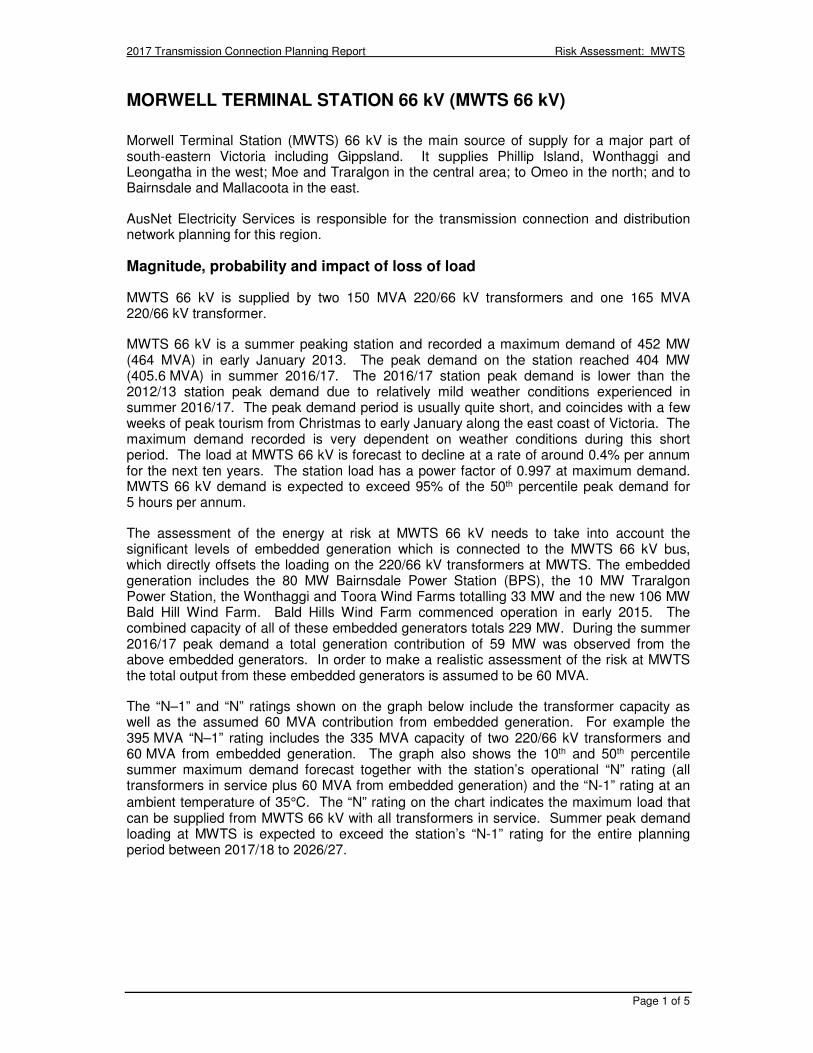
2017 Transmission Connection Planning Report Risk Assessment: MWTS
Page 1 of 5
MORWELL TERMINAL STATION 66 kV (MWTS 66 kV)
Morwell Terminal Station (MWTS) 66 kV is the main source of supply for a major part of south-eastern Victoria including Gippsland. It supplies Phillip Island, Wonthaggi and Leongatha in the west; Moe and Traralgon in the central area; to Omeo in the north; and to Bairnsdale and Mallacoota in the east.
AusNet Electricity Services is responsible for the transmission connection and distribution network planning for this region.
Magnitude, probability and impact of loss of load
MWTS 66 kV is supplied by two 150 MVA 220/66 kV transformers and one 165 MVA 220/66 kV transformer.
MWTS 66 kV is a summer peaking station and recorded a maximum demand of 452 MW (464 MVA) in early January 2013. The peak demand on the station reached 404 MW (405.6 MVA) in summer 2016/17. The 2016/17 station peak demand is lower than the 2012/13 station peak demand due to relatively mild weather conditions experienced in summer 2016/17. The peak demand period is usually quite short, and coincides with a few weeks of peak tourism from Christmas to early January along the east coast of Victoria. The maximum demand recorded is very dependent on weather conditions during this short period. The load at MWTS 66 kV is forecast to decline at a rate of around 0.4% per annum for the next ten years. The station load has a power factor of 0.997 at maximum demand. MWTS 66 kV demand is expected to exceed 95% of the 50th percentile peak demand for 5 hours per annum.
The assessment of the energy at risk at MWTS 66 kV needs to take into account the significant levels of embedded generation which is connected to the MWTS 66 kV bus, which directly offsets the loading on the 220/66 kV transformers at MWTS. The embedded generation includes the 80 MW Bairnsdale Power Station (BPS), the 10 MW Traralgon Power Station, the Wonthaggi and Toora Wind Farms totalling 33 MW and the new 106 MW Bald Hill Wind Farm. Bald Hills Wind Farm commenced operation in early 2015. The combined capacity of all of these embedded generators totals 229 MW. During the summer 2016/17 peak demand a total generation contribution of 59 MW was observed from the above embedded generators. In order to make a realistic assessment of the risk at MWTS the total output from these embedded generators is assumed to be 60 MVA.
The “N–1” and “N” ratings shown on the graph below include the transformer capacity as well as the assumed 60 MVA contribution from embedded generation. For example the 395 MVA “N–1” rating includes the 335 MVA capacity of two 220/66 kV transformers and 60 MVA from embedded generation. The graph also shows the 10th and 50th percentile summer maximum demand forecast together with the station’s operational “N” rating (all transformers in service plus 60 MVA from embedded generation) and the “N-1” rating at an ambient temperature of 35°C. The “N” rating on the chart indicates the maximum load that can be supplied from MWTS 66 kV with all transformers in service. Summer peak demand loading at MWTS is expected to exceed the station’s “N-1” rating for the entire planning period between 2017/18 to 2026/27.
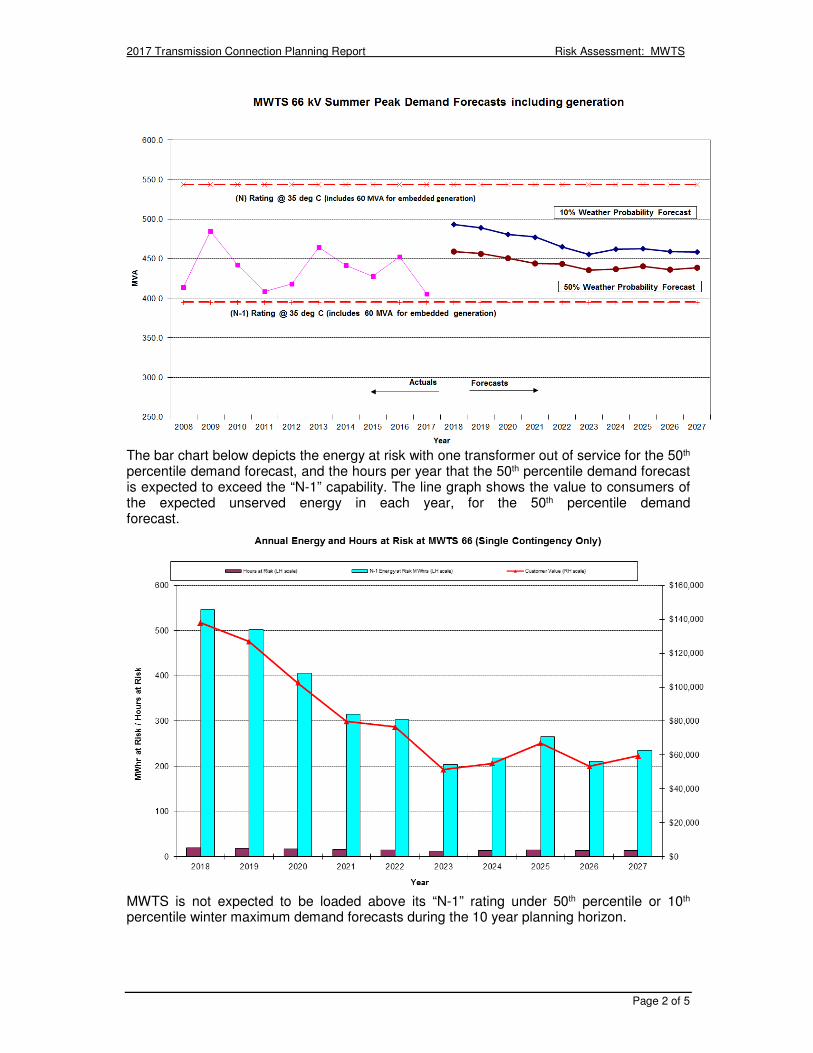
2017 Transmission Connection Planning Report Risk Assessment: MWTS
Page 2 of 5
The bar chart below depicts the energy at risk with one transformer out of service for the 50th percentile demand forecast, and the hours per year that the 50th percentile demand forecast is expected to exceed the “N-1” capability. The line graph shows the value to consumers of the expected unserved energy in each year, for the 50th percentile demand forecast.
MWTS is not expected to be loaded above its “N-1” rating under 50th percentile or 10th percentile winter maximum demand forecasts during the 10 year planning horizon.
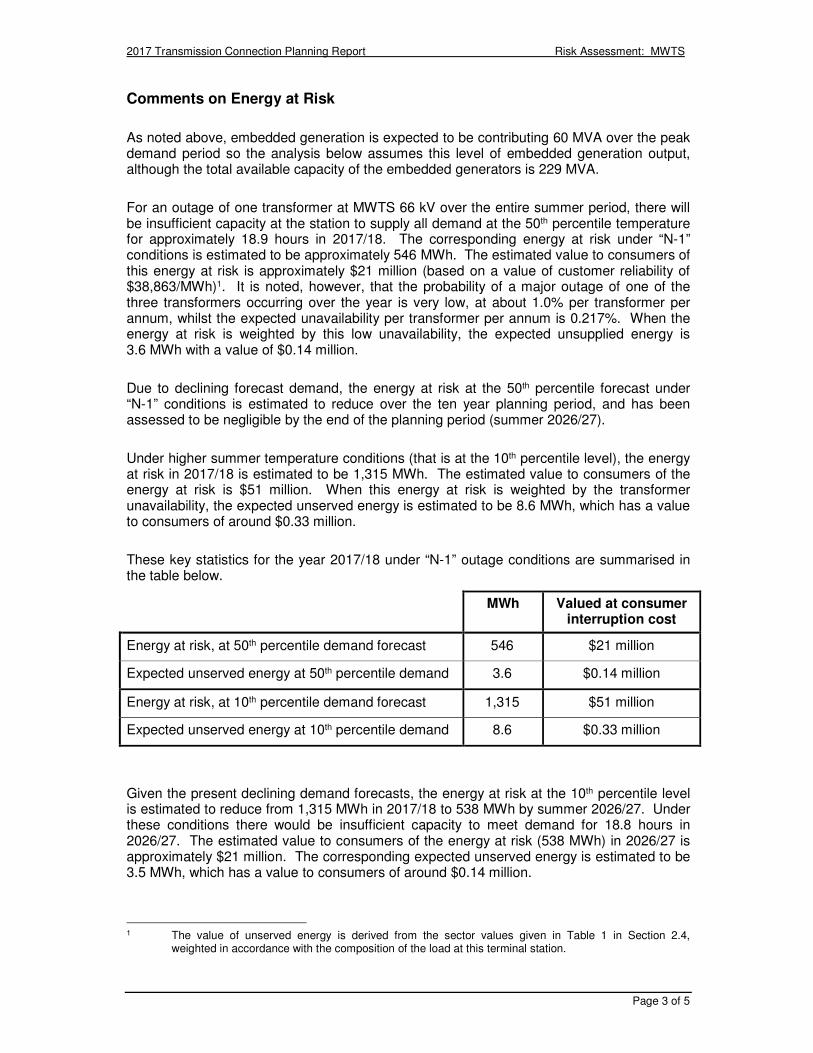
2017 Transmission Connection Planning Report Risk Assessment: MWTS
Page 3 of 5
Comments on Energy at Risk
As noted above, embedded generation is expected to be contributing 60 MVA over the peak demand period so the analysis below assumes this level of embedded generation output, although the total available capacity of the embedded generators is 229 MVA.
For an outage of one transformer at MWTS 66 kV over the entire summer period, there will be insufficient capacity at the station to supply all demand at the 50th percentile temperature for approximately 18.9 hours in 2017/18. The corresponding energy at risk under “N-1” conditions is estimated to be approximately 546 MWh. The estimated value to consumers of this energy at risk is approximately $21 million (based on a value of customer reliability of $38,863/MWh)1. It is noted, however, that the probability of a major outage of one of the three transformers occurring over the year is very low, at about 1.0% per transformer per annum, whilst the expected unavailability per transformer per annum is 0.217%. When the energy at risk is weighted by this low unavailability, the expected unsupplied energy is 3.6 MWh with a value of $0.14 million.
Due to declining forecast demand, the energy at risk at the 50th percentile forecast under “N-1” conditions is estimated to reduce over the ten year planning period, and has been assessed to be negligible by the end of the planning period (summer 2026/27).
Under higher summer temperature conditions (that is at the 10th percentile level), the energy at risk in 2017/18 is estimated to be 1,315 MWh. The estimated value to consumers of the energy at risk is $51 million. When this energy at risk is weighted by the transformer unavailability, the expected unserved energy is estimated to be 8.6 MWh, which has a value to consumers of around $0.33 million.
These key statistics for the year 2017/18 under “N-1” outage conditions are summarised in the table below.
MWh Valued at consumer interruption cost
Energy at risk, at 50th percentile demand forecast 546 $21 million
Expected unserved energy at 50th percentile demand 3.6 $0.14 million
Energy at risk, at 10th percentile demand forecast 1,315 $51 million
Expected unserved energy at 10th percentile demand 8.6 $0.33 million
Given the present declining demand forecasts, the energy at risk at the 10th percentile level is estimated to reduce from 1,315 MWh in 2017/18 to 538 MWh by summer 2026/27. Under these conditions there would be insufficient capacity to meet demand for 18.8 hours in 2026/27. The estimated value to consumers of the energy at risk (538 MWh) in 2026/27 is approximately $21 million. The corresponding expected unserved energy is estimated to be 3.5 MWh, which has a value to consumers of around $0.14 million.
1 The value of unserved energy is derived from the sector values given in Table 1 in Section 2.4,
weighted in accordance with the composition of the load at this terminal station.
2017 Transmission Connection Planning Report Risk Assessment: MWTS
Page 4 of 5
If one of the 220/66 kV transformers at MWTS is taken off line during peak loading times and the “N-1” station rating is exceeded, then the Overload Shedding Scheme for Connection Assets (OSSCA) which is operated by AusNet Transmission Group’s TOC2 to protect the connection assets from overloading3, will act swiftly to reduce the load in blocks to within safe loading limits. Any load reductions that are in excess of the minimum amount required to limit load to the rated capability of the station would be restored at zone substation feeder level in accordance with AusNet Electricity Services’ operational procedures after the operation of the OSSCA scheme. If OSSCA operates at MWTS, it would progressively shed up to about 110 MVA of load, affecting approximately 46,000 customers.
Feasible options for alleviation of constraints
The following options are technically feasible to mitigate the risk of supply interruption and/or to alleviate the emerging constraint:
1. Embedded generation: Bairnsdale Power Station is contracted to provide 20 MW over the night time hot water demand peak and during the afternoon peak demand period but it has the capacity to provide up to 80 MW if needed.
2. Subject to the availability of the AusNet Transmission Services’ spare 220/66 kV transformer for rural areas (refer section 5.5), this spare transformer can be used to temporarily replace a failed transformer.
3. Install a fourth 220/66 kV transformer at MWTS: Installation of a 4th transformer at MWTS is a technically feasible option. However, fault level constraints would make such a solution costly to implement.
4. Installation of Power Factor Correction Capacitors: As the station is currently running with a power factor of around 0.975 at the summer peak the use of additional capacitors to further improve the power factor and to reduce the MVA loading will provide only marginal benefits.
5. Load transfers: Only 5 MVA of load can be shifted away from MWTS using the existing 22 kV distribution network so this option does not make a material contribution to managing the risk at MWTS.
Preferred network option for alleviation of constraints
In view of the current level of expected unserved energy at MWTS, and the forecast decline in expected unserved energy over the next 10 years, implementation of a network solution is unlikely to be economic over the ten year planning horizon.
The table on the following page provides more detailed information on the station rating, demand forecasts, energy at risk and expected unserved energy assuming embedded generation is contributing 60 MVA.
2 Transmission Operation Centre. 3 OSSCA is designed to protect connection transformers against transformer damage caused by
overloads. Damaged transformers can take months to repair or replace, which can result in prolonged, long term risks to the reliability of customer supply.
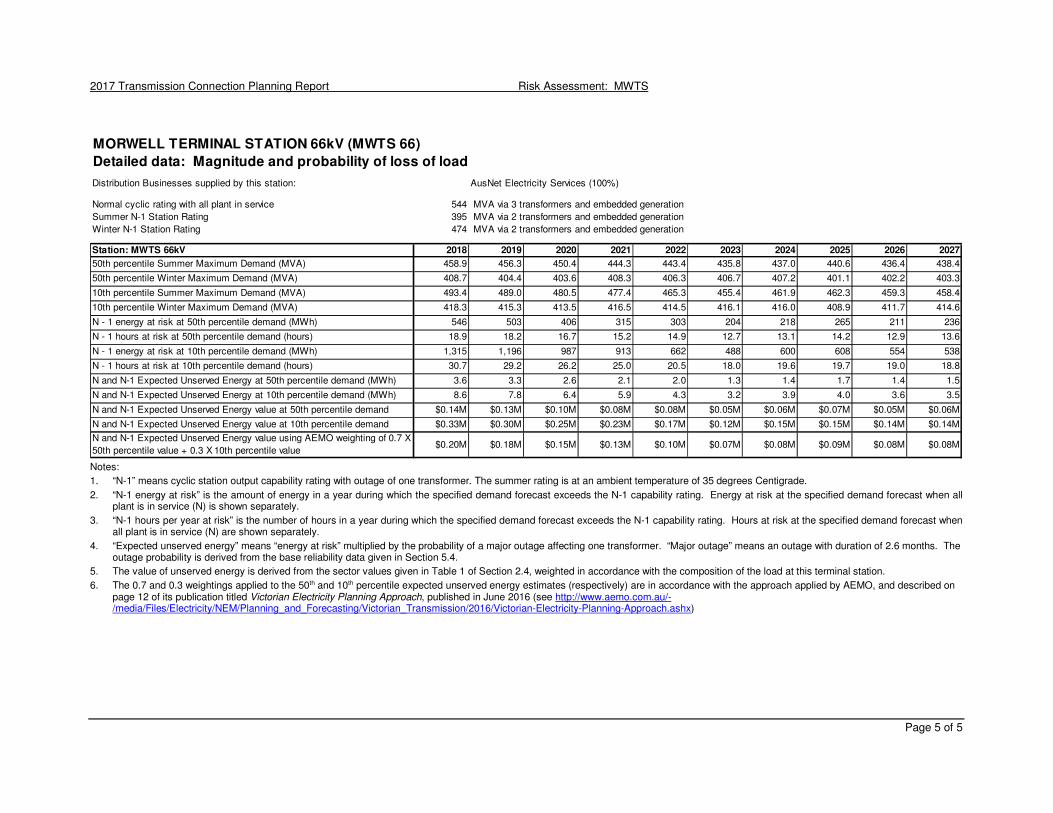
2017 Transmission Connection Planning Report Risk Assessment: MWTS
Page 5 of 5
MORWELL TERMINAL STATION 66kV (MWTS 66)
Detailed data: Magnitude and probability of loss of load
Distribution Businesses supplied by this station: AusNet Electricity Services (100%)
Normal cyclic rating with all plant in service 544 MVA via 3 transformers and embedded generation
Summer N-1 Station Rating 395 MVA via 2 transformers and embedded generation
Winter N-1 Station Rating 474 MVA via 2 transformers and embedded generation
Station: MWTS 66kV 2018 2019 2020 2021 2022 2023 2024 2025 2026 2027
50th percentile Summer Maximum Demand (MVA) 458.9 456.3 450.4 444.3 443.4 435.8 437.0 440.6 436.4 438.4
50th percentile Winter Maximum Demand (MVA) 408.7 404.4 403.6 408.3 406.3 406.7 407.2 401.1 402.2 403.3
10th percentile Summer Maximum Demand (MVA) 493.4 489.0 480.5 477.4 465.3 455.4 461.9 462.3 459.3 458.4
10th percentile Winter Maximum Demand (MVA) 418.3 415.3 413.5 416.5 414.5 416.1 416.0 408.9 411.7 414.6
N - 1 energy at risk at 50th percentile demand (MWh) 546 503 406 315 303 204 218 265 211 236
N - 1 hours at risk at 50th percentile demand (hours) 18.9 18.2 16.7 15.2 14.9 12.7 13.1 14.2 12.9 13.6
N - 1 energy at risk at 10th percentile demand (MWh) 1,315 1,196 987 913 662 488 600 608 554 538
N - 1 hours at risk at 10th percentile demand (hours) 30.7 29.2 26.2 25.0 20.5 18.0 19.6 19.7 19.0 18.8
N and N-1 Expected Unserved Energy at 50th percentile demand (MWh) 3.6 3.3 2.6 2.1 2.0 1.3 1.4 1.7 1.4 1.5
N and N-1 Expected Unserved Energy at 10th percentile demand (MWh) 8.6 7.8 6.4 5.9 4.3 3.2 3.9 4.0 3.6 3.5
N and N-1 Expected Unserved Energy value at 50th percentile demand $0.14M $0.13M $0.10M $0.08M $0.08M $0.05M $0.06M $0.07M $0.05M $0.06M
N and N-1 Expected Unserved Energy value at 10th percentile demand $0.33M $0.30M $0.25M $0.23M $0.17M $0.12M $0.15M $0.15M $0.14M $0.14M
N and N-1 Expected Unserved Energy value using AEMO weighting of 0.7 X
50th percentile value + 0.3 X 10th percentile value$0.20M $0.18M $0.15M $0.13M $0.10M $0.07M $0.08M $0.09M $0.08M $0.08M
Notes:
1. “N-1” means cyclic station output capability rating with outage of one transformer. The summer rating is at an ambient temperature of 35 degrees Centigrade.
2. “N-1 energy at risk” is the amount of energy in a year during which the specified demand forecast exceeds the N-1 capability rating. Energy at risk at the specified demand forecast when all plant is in service (N) is shown separately.
3. “N-1 hours per year at risk” is the number of hours in a year during which the specified demand forecast exceeds the N-1 capability rating. Hours at risk at the specified demand forecast when all plant is in service (N) are shown separately.
4. “Expected unserved energy” means “energy at risk” multiplied by the probability of a major outage affecting one transformer. “Major outage” means an outage with duration of 2.6 months. The outage probability is derived from the base reliability data given in Section 5.4.
5. The value of unserved energy is derived from the sector values given in Table 1 of Section 2.4, weighted in accordance with the composition of the load at this terminal station.
6. The 0.7 and 0.3 weightings applied to the 50th and 10th percentile expected unserved energy estimates (respectively) are in accordance with the approach applied by AEMO, and described on page 12 of its publication titled Victorian Electricity Planning Approach, published in June 2016 (see http://www.aemo.com.au/-/media/Files/Electricity/NEM/Planning_and_Forecasting/Victorian_Transmission/2016/Victorian-Electricity-Planning-Approach.ashx)
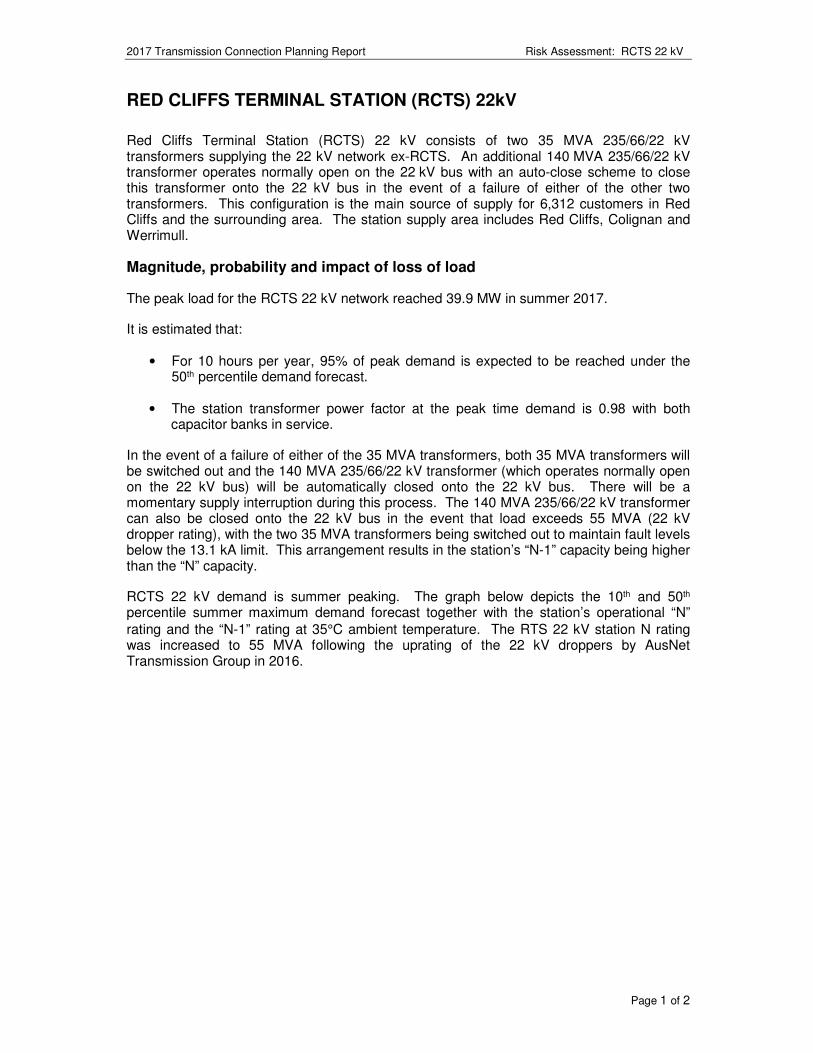
2017 Transmission Connection Planning Report Risk Assessment: RCTS 22 kV
Page 1 of 2
RED CLIFFS TERMINAL STATION (RCTS) 22kV
Red Cliffs Terminal Station (RCTS) 22 kV consists of two 35 MVA 235/66/22 kV transformers supplying the 22 kV network ex-RCTS. An additional 140 MVA 235/66/22 kV transformer operates normally open on the 22 kV bus with an auto-close scheme to close this transformer onto the 22 kV bus in the event of a failure of either of the other two transformers. This configuration is the main source of supply for 6,312 customers in Red Cliffs and the surrounding area. The station supply area includes Red Cliffs, Colignan and Werrimull.
Magnitude, probability and impact of loss of load
The peak load for the RCTS 22 kV network reached 39.9 MW in summer 2017.
It is estimated that:
• For 10 hours per year, 95% of peak demand is expected to be reached under the 50th percentile demand forecast.
• The station transformer power factor at the peak time demand is 0.98 with both capacitor banks in service.
In the event of a failure of either of the 35 MVA transformers, both 35 MVA transformers will be switched out and the 140 MVA 235/66/22 kV transformer (which operates normally open on the 22 kV bus) will be automatically closed onto the 22 kV bus. There will be a momentary supply interruption during this process. The 140 MVA 235/66/22 kV transformer can also be closed onto the 22 kV bus in the event that load exceeds 55 MVA (22 kV dropper rating), with the two 35 MVA transformers being switched out to maintain fault levels below the 13.1 kA limit. This arrangement results in the station’s “N-1” capacity being higher than the “N” capacity.
RCTS 22 kV demand is summer peaking. The graph below depicts the 10th and 50th percentile summer maximum demand forecast together with the station’s operational “N”
rating and the “N-1” rating at 35°C ambient temperature. The RTS 22 kV station N rating was increased to 55 MVA following the uprating of the 22 kV droppers by AusNet Transmission Group in 2016.
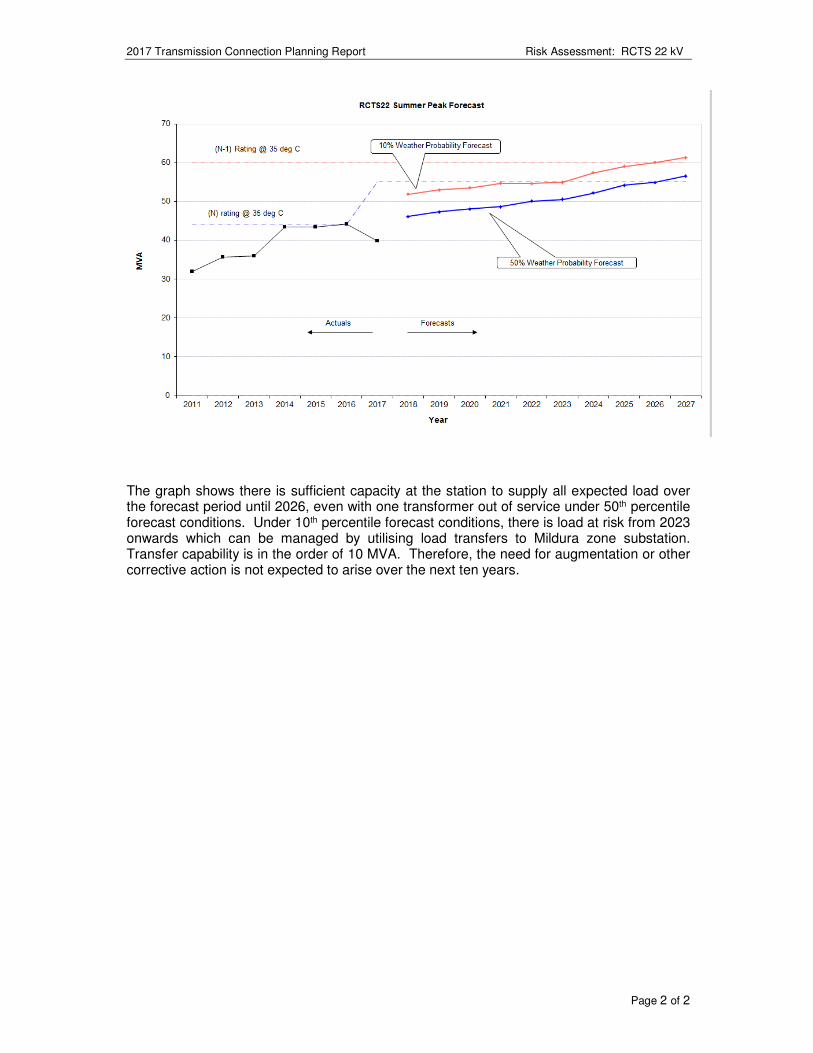
2017 Transmission Connection Planning Report Risk Assessment: RCTS 22 kV
Page 2 of 2
The graph shows there is sufficient capacity at the station to supply all expected load over the forecast period until 2026, even with one transformer out of service under 50th percentile forecast conditions. Under 10th percentile forecast conditions, there is load at risk from 2023 onwards which can be managed by utilising load transfers to Mildura zone substation. Transfer capability is in the order of 10 MVA. Therefore, the need for augmentation or other corrective action is not expected to arise over the next ten years.
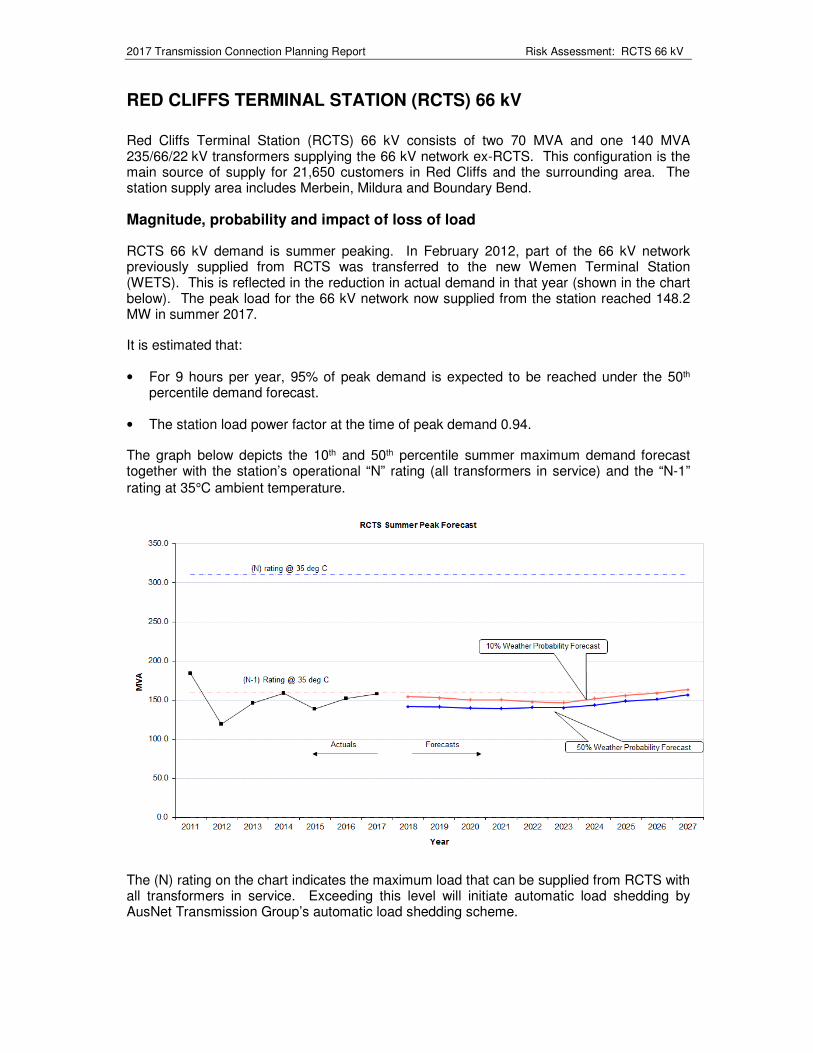
2017 Transmission Connection Planning Report Risk Assessment: RCTS 66 kV
RED CLIFFS TERMINAL STATION (RCTS) 66 kV
Red Cliffs Terminal Station (RCTS) 66 kV consists of two 70 MVA and one 140 MVA 235/66/22 kV transformers supplying the 66 kV network ex-RCTS. This configuration is the main source of supply for 21,650 customers in Red Cliffs and the surrounding area. The station supply area includes Merbein, Mildura and Boundary Bend.
Magnitude, probability and impact of loss of load
RCTS 66 kV demand is summer peaking. In February 2012, part of the 66 kV network previously supplied from RCTS was transferred to the new Wemen Terminal Station (WETS). This is reflected in the reduction in actual demand in that year (shown in the chart below). The peak load for the 66 kV network now supplied from the station reached 148.2 MW in summer 2017.
It is estimated that:
• For 9 hours per year, 95% of peak demand is expected to be reached under the 50th percentile demand forecast.
• The station load power factor at the time of peak demand 0.94.
The graph below depicts the 10th and 50th percentile summer maximum demand forecast together with the station’s operational “N” rating (all transformers in service) and the “N-1”
rating at 35°C ambient temperature.
The (N) rating on the chart indicates the maximum load that can be supplied from RCTS with all transformers in service. Exceeding this level will initiate automatic load shedding by AusNet Transmission Group’s automatic load shedding scheme.
2017 Transmission Connection Planning Report Risk Assessment: RCTS 66 kV
The graph shows there is sufficient capacity at the station to supply all expected demand at the 50th percentile temperature, over the forecast period, even with one transformer out of service. Load at risk after 2026 for the 10th percentile demand scenario can be managed by transferring load to RCTS 22 kV, Kerang Terminal Station, and Wemen Terminal Station. Total transfer capability is in the order of 13.5 MVA. Therefore, the need for augmentation or other corrective action is not expected to arise over the next ten years.
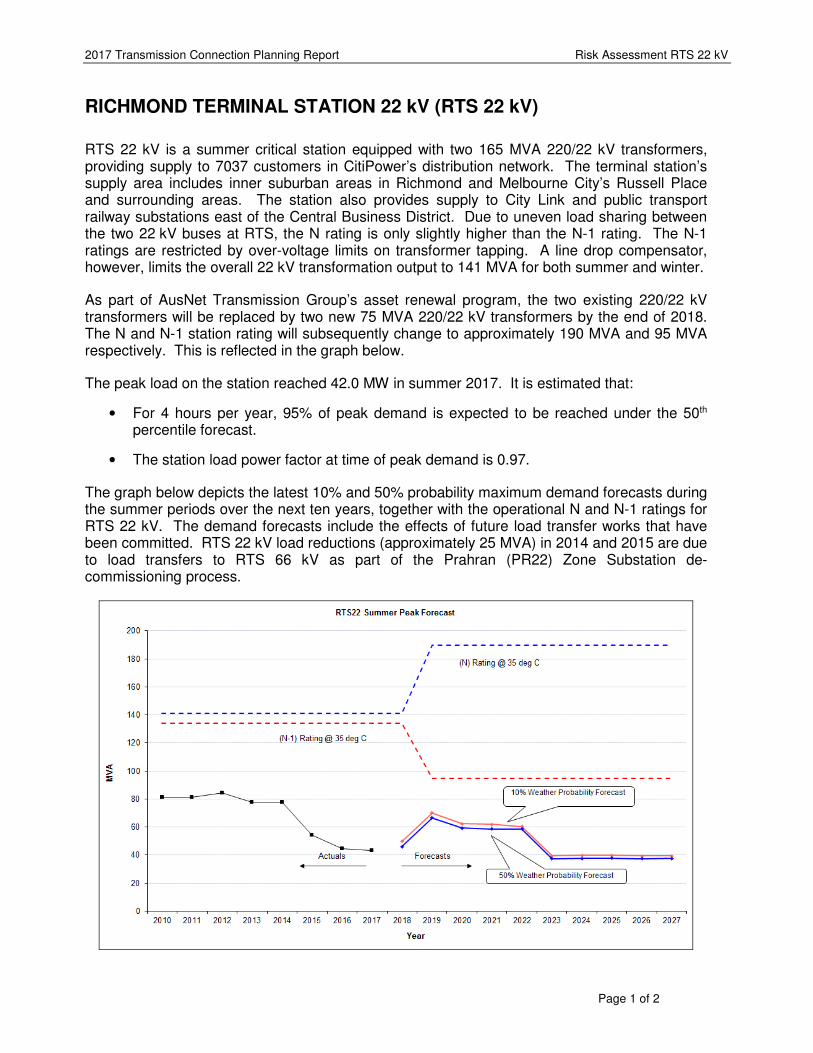
2017 Transmission Connection Planning Report Risk Assessment RTS 22 kV
Page 1 of 2
RICHMOND TERMINAL STATION 22 kV (RTS 22 kV)
RTS 22 kV is a summer critical station equipped with two 165 MVA 220/22 kV transformers, providing supply to 7037 customers in CitiPower’s distribution network. The terminal station’s supply area includes inner suburban areas in Richmond and Melbourne City’s Russell Place and surrounding areas. The station also provides supply to City Link and public transport railway substations east of the Central Business District. Due to uneven load sharing between the two 22 kV buses at RTS, the N rating is only slightly higher than the N-1 rating. The N-1 ratings are restricted by over-voltage limits on transformer tapping. A line drop compensator, however, limits the overall 22 kV transformation output to 141 MVA for both summer and winter.
As part of AusNet Transmission Group’s asset renewal program, the two existing 220/22 kV transformers will be replaced by two new 75 MVA 220/22 kV transformers by the end of 2018. The N and N-1 station rating will subsequently change to approximately 190 MVA and 95 MVA respectively. This is reflected in the graph below.
The peak load on the station reached 42.0 MW in summer 2017. It is estimated that:
• For 4 hours per year, 95% of peak demand is expected to be reached under the 50th percentile forecast.
• The station load power factor at time of peak demand is 0.97.
The graph below depicts the latest 10% and 50% probability maximum demand forecasts during the summer periods over the next ten years, together with the operational N and N-1 ratings for RTS 22 kV. The demand forecasts include the effects of future load transfer works that have been committed. RTS 22 kV load reductions (approximately 25 MVA) in 2014 and 2015 are due to load transfers to RTS 66 kV as part of the Prahran (PR22) Zone Substation de-commissioning process.

2017 Transmission Connection Planning Report Risk Assessment RTS 22 kV
Page 2 of 2
The graph shows there is sufficient station capacity to supply all anticipated load, and that no customers would be at risk if a forced transformer outage occurred at RTS 22 kV over the forecast period. Accordingly, no capacity augmentation is planned at RTS 22 kV over the next ten years.
2017 Transmission Connection Planning Report Risk Assessment: RTS 66 kV
Page 1 of 8
RICHMOND TERMINAL STATION 66 kV (RTS 66 kV)
RTS 66 kV is a summer critical station consisting of five 150 MVA 220/66 kV transformers. The terminal station is shared by CitiPower (91%) and United Energy (9%), providing supply to a total of 153,634 customers in the Eastern Central Business District and wide-spread inner suburban areas in the east and south-east of Melbourne, including Fitzroy, Collingwood, Abbotsford, Richmond, North Richmond, Hawthorn, Camberwell, Gardiner, Toorak, Armadale, South Yarra, St Kilda, Elwood and Balaclava.
To limit fault levels, the five transformers at RTS 66 kV are split into two separate groups (1 & 2 bus group, and 3 & 4 bus group).
AusNet Transmission Group has commenced an asset replacement project at RTS to replace the ageing transformers and other plant. AusNet Transmission Group has indicated that it expects the asset replacement project at RTS 66 kV to be completed by the end of 2018, by which time three 225 MVA transformers will replace the five existing 150 MVA transformers.
In December 2011, CitiPower made a connection application for the installation of a temporary 5th 220/66 kV transformer at RTS to reduce the potential for load shedding prior to the completion of the asset replacement work at RTS, or the transfer of load from RTS to the new Brunswick Terminal Station. The temporary 5th transformer (B6) with dual secondary legs has been in service since mid 2013.
With B6 in service, under system normal conditions the No.1, No.4 & No.6 transformers (B1, B4 & B6) are operated in parallel as one group and supply the No.1 & No.2 buses. The No.2 & No.3 transformers (B2 & B3) are operated as a separate group and supply the No.3 & No.4 buses. B6 also supplies the No.3 & No.4 buses with a normally open secondary leg. For an unplanned outage of any one of B2 or B3 transformers, the normally open secondary leg of B6 will close automatically and the normally closed leg of B6 will open automatically. Under this scenario the load demand on the RTS12 group should be kept within the capabilities of the two transformers B1 & B4.
The peak load on the station reached 490.9 MW in summer 2017. It is estimated that:
• For 5 hours per year, 95% of peak demand is expected to be reached in a 50th percentile summer.
• The station load power factor at time of peak demand is 0.98.
The following risk assessment is divided into two parts. Part 1 covers 2018, during which the asset replacement project is still in progress. Part 2 covers the period from 2019 to 2027, being the period after the asset replacement project is completed, and there are three 225 MVA transformers in service at RTS.
Part 1: For 2018 - with temporary transformer in service
Magnitude, probability and impact of loss of load for 2018
As noted above, AusNet Transmission Group is undertaking asset replacement works at RTS, which are expected to be completed by the end of 2018. The risk assessment below covers the year 2018, and reflects the impact of the temporary transformer in reducing the loads at risk at RTS.
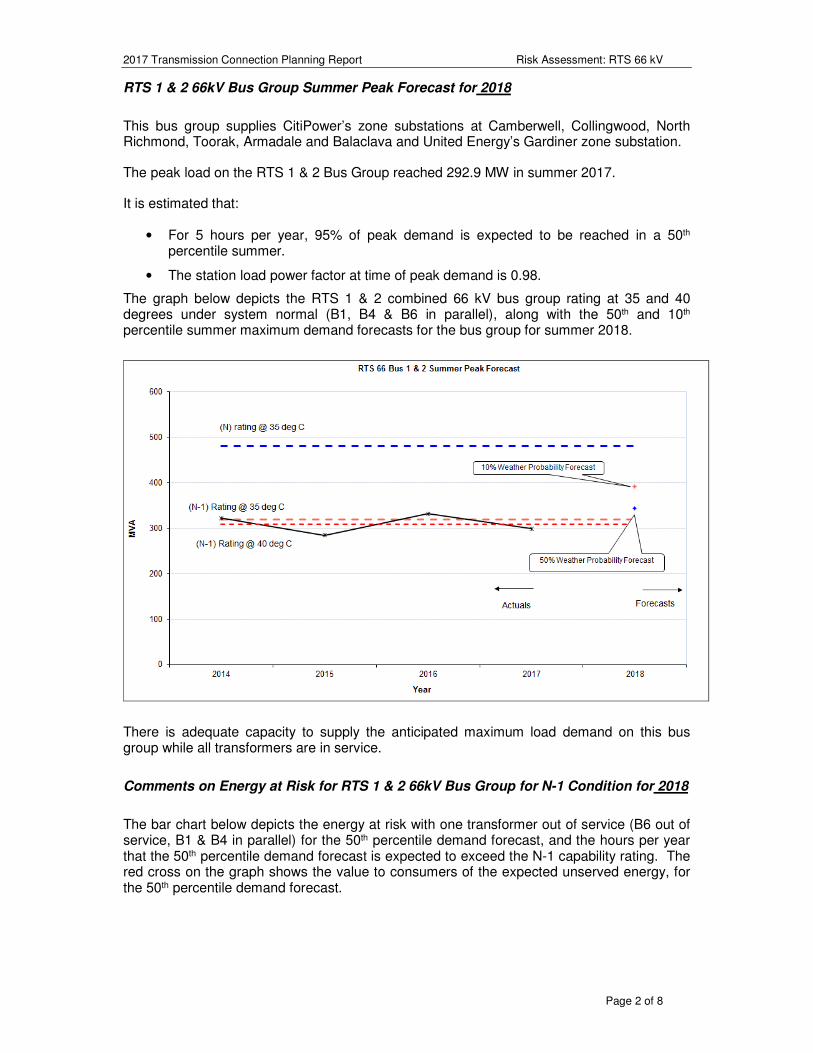
2017 Transmission Connection Planning Report Risk Assessment: RTS 66 kV
Page 2 of 8
RTS 1 & 2 66kV Bus Group Summer Peak Forecast for 2018
This bus group supplies CitiPower’s zone substations at Camberwell, Collingwood, North Richmond, Toorak, Armadale and Balaclava and United Energy’s Gardiner zone substation.
The peak load on the RTS 1 & 2 Bus Group reached 292.9 MW in summer 2017.
It is estimated that:
• For 5 hours per year, 95% of peak demand is expected to be reached in a 50th percentile summer.
• The station load power factor at time of peak demand is 0.98.
The graph below depicts the RTS 1 & 2 combined 66 kV bus group rating at 35 and 40 degrees under system normal (B1, B4 & B6 in parallel), along with the 50th and 10th percentile summer maximum demand forecasts for the bus group for summer 2018.
There is adequate capacity to supply the anticipated maximum load demand on this bus group while all transformers are in service.
Comments on Energy at Risk for RTS 1 & 2 66kV Bus Group for N-1 Condition for 2018
The bar chart below depicts the energy at risk with one transformer out of service (B6 out of service, B1 & B4 in parallel) for the 50th percentile demand forecast, and the hours per year that the 50th percentile demand forecast is expected to exceed the N-1 capability rating. The red cross on the graph shows the value to consumers of the expected unserved energy, for the 50th percentile demand forecast.
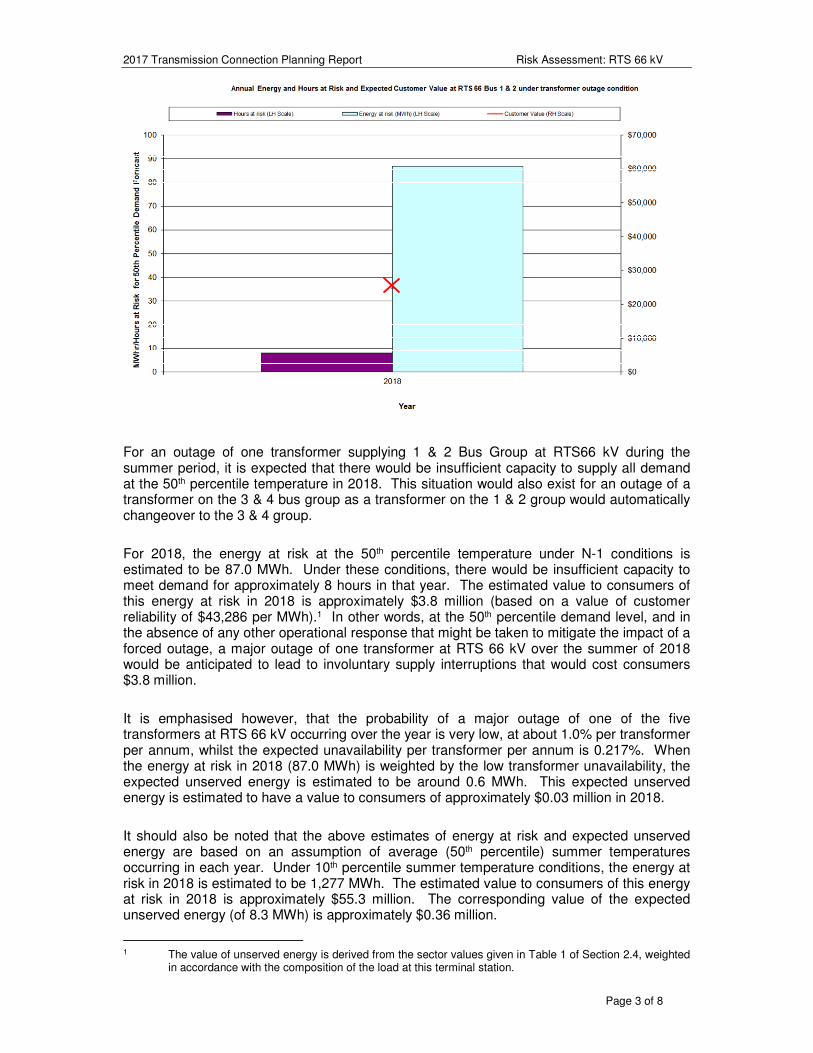
2017 Transmission Connection Planning Report Risk Assessment: RTS 66 kV
Page 3 of 8
For an outage of one transformer supplying 1 & 2 Bus Group at RTS66 kV during the summer period, it is expected that there would be insufficient capacity to supply all demand at the 50th percentile temperature in 2018. This situation would also exist for an outage of a transformer on the 3 & 4 bus group as a transformer on the 1 & 2 group would automatically changeover to the 3 & 4 group.
For 2018, the energy at risk at the 50th percentile temperature under N-1 conditions is estimated to be 87.0 MWh. Under these conditions, there would be insufficient capacity to meet demand for approximately 8 hours in that year. The estimated value to consumers of this energy at risk in 2018 is approximately $3.8 million (based on a value of customer reliability of $43,286 per MWh).1 In other words, at the 50th percentile demand level, and in the absence of any other operational response that might be taken to mitigate the impact of a forced outage, a major outage of one transformer at RTS 66 kV over the summer of 2018 would be anticipated to lead to involuntary supply interruptions that would cost consumers $3.8 million.
It is emphasised however, that the probability of a major outage of one of the five transformers at RTS 66 kV occurring over the year is very low, at about 1.0% per transformer per annum, whilst the expected unavailability per transformer per annum is 0.217%. When the energy at risk in 2018 (87.0 MWh) is weighted by the low transformer unavailability, the expected unserved energy is estimated to be around 0.6 MWh. This expected unserved energy is estimated to have a value to consumers of approximately $0.03 million in 2018.
It should also be noted that the above estimates of energy at risk and expected unserved energy are based on an assumption of average (50th percentile) summer temperatures occurring in each year. Under 10th percentile summer temperature conditions, the energy at risk in 2018 is estimated to be 1,277 MWh. The estimated value to consumers of this energy at risk in 2018 is approximately $55.3 million. The corresponding value of the expected unserved energy (of 8.3 MWh) is approximately $0.36 million.
1 The value of unserved energy is derived from the sector values given in Table 1 of Section 2.4, weighted
in accordance with the composition of the load at this terminal station.
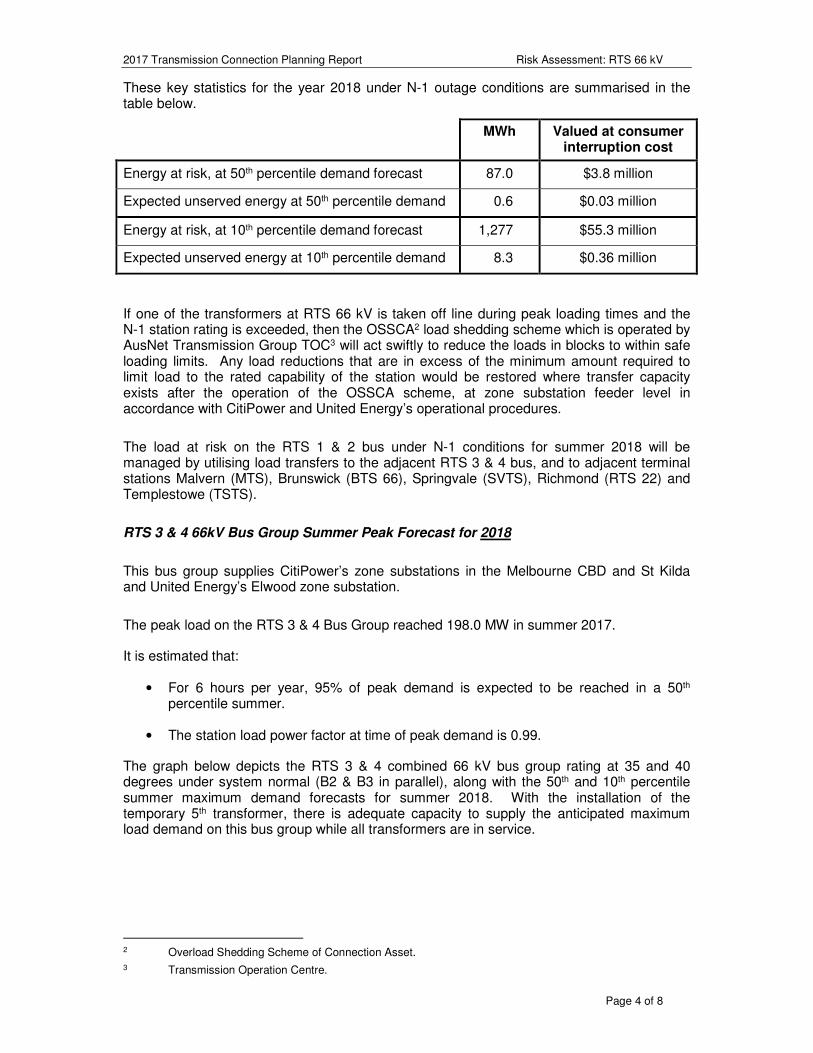
2017 Transmission Connection Planning Report Risk Assessment: RTS 66 kV
Page 4 of 8
These key statistics for the year 2018 under N-1 outage conditions are summarised in the table below.
MWh Valued at consumer interruption cost
Energy at risk, at 50th percentile demand forecast 87.0 $3.8 million
Expected unserved energy at 50th percentile demand 0.6 $0.03 million
Energy at risk, at 10th percentile demand forecast 1,277 $55.3 million
Expected unserved energy at 10th percentile demand 8.3 $0.36 million
If one of the transformers at RTS 66 kV is taken off line during peak loading times and the N-1 station rating is exceeded, then the OSSCA2 load shedding scheme which is operated by AusNet Transmission Group TOC3 will act swiftly to reduce the loads in blocks to within safe loading limits. Any load reductions that are in excess of the minimum amount required to limit load to the rated capability of the station would be restored where transfer capacity exists after the operation of the OSSCA scheme, at zone substation feeder level in accordance with CitiPower and United Energy’s operational procedures.
The load at risk on the RTS 1 & 2 bus under N-1 conditions for summer 2018 will be managed by utilising load transfers to the adjacent RTS 3 & 4 bus, and to adjacent terminal stations Malvern (MTS), Brunswick (BTS 66), Springvale (SVTS), Richmond (RTS 22) and Templestowe (TSTS).
RTS 3 & 4 66kV Bus Group Summer Peak Forecast for 2018
This bus group supplies CitiPower’s zone substations in the Melbourne CBD and St Kilda and United Energy’s Elwood zone substation.
The peak load on the RTS 3 & 4 Bus Group reached 198.0 MW in summer 2017.
It is estimated that:
• For 6 hours per year, 95% of peak demand is expected to be reached in a 50th percentile summer.
• The station load power factor at time of peak demand is 0.99.
The graph below depicts the RTS 3 & 4 combined 66 kV bus group rating at 35 and 40 degrees under system normal (B2 & B3 in parallel), along with the 50th and 10th percentile summer maximum demand forecasts for summer 2018. With the installation of the temporary 5th transformer, there is adequate capacity to supply the anticipated maximum load demand on this bus group while all transformers are in service.
2 Overload Shedding Scheme of Connection Asset.
3 Transmission Operation Centre.
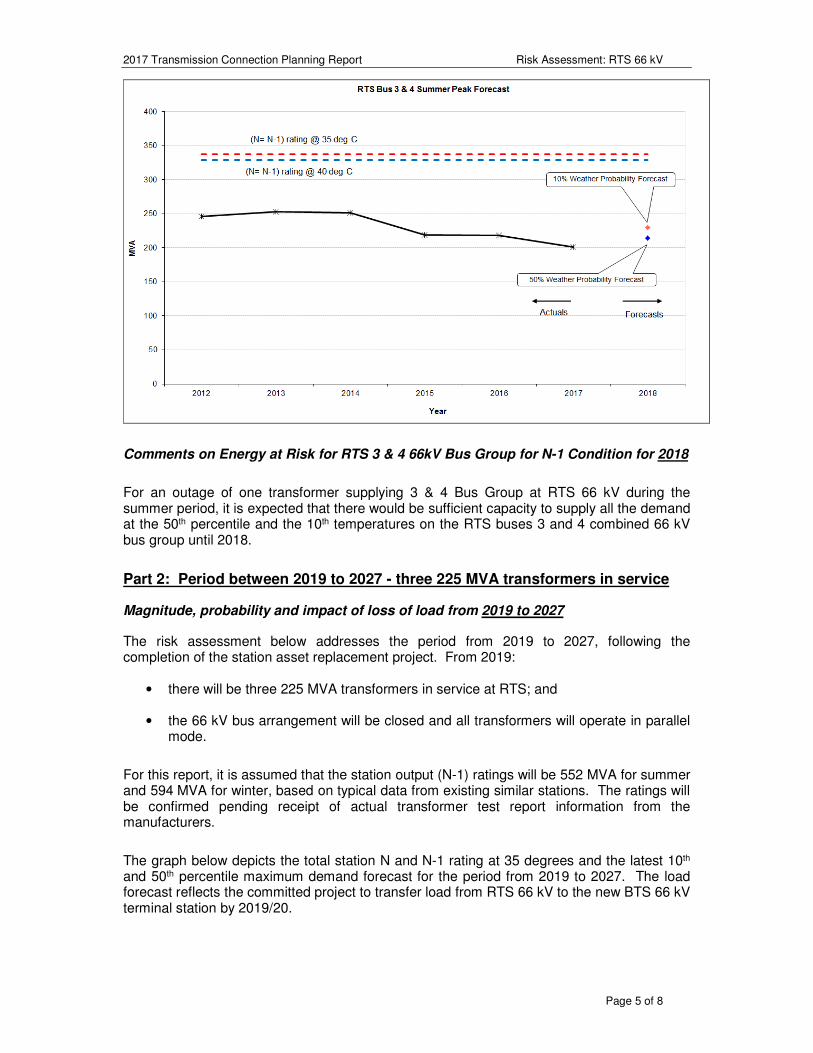
2017 Transmission Connection Planning Report Risk Assessment: RTS 66 kV
Page 5 of 8
Comments on Energy at Risk for RTS 3 & 4 66kV Bus Group for N-1 Condition for 2018
For an outage of one transformer supplying 3 & 4 Bus Group at RTS 66 kV during the summer period, it is expected that there would be sufficient capacity to supply all the demand at the 50th percentile and the 10th temperatures on the RTS buses 3 and 4 combined 66 kV bus group until 2018.
Part 2: Period between 2019 to 2027 - three 225 MVA transformers in service
Magnitude, probability and impact of loss of load from 2019 to 2027
The risk assessment below addresses the period from 2019 to 2027, following the completion of the station asset replacement project. From 2019:
• there will be three 225 MVA transformers in service at RTS; and
• the 66 kV bus arrangement will be closed and all transformers will operate in parallel mode.
For this report, it is assumed that the station output (N-1) ratings will be 552 MVA for summer and 594 MVA for winter, based on typical data from existing similar stations. The ratings will be confirmed pending receipt of actual transformer test report information from the manufacturers.
The graph below depicts the total station N and N-1 rating at 35 degrees and the latest 10th and 50th percentile maximum demand forecast for the period from 2019 to 2027. The load forecast reflects the committed project to transfer load from RTS 66 kV to the new BTS 66 kV terminal station by 2019/20.
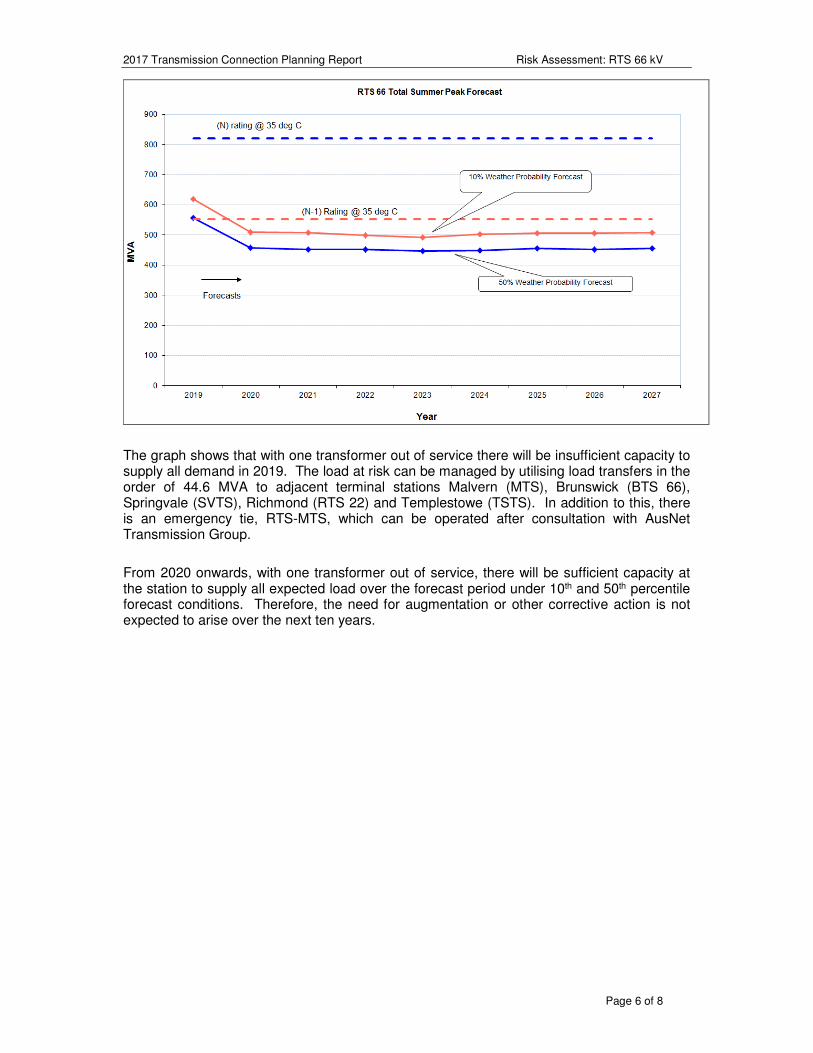
2017 Transmission Connection Planning Report Risk Assessment: RTS 66 kV
Page 6 of 8
The graph shows that with one transformer out of service there will be insufficient capacity to supply all demand in 2019. The load at risk can be managed by utilising load transfers in the order of 44.6 MVA to adjacent terminal stations Malvern (MTS), Brunswick (BTS 66), Springvale (SVTS), Richmond (RTS 22) and Templestowe (TSTS). In addition to this, there is an emergency tie, RTS-MTS, which can be operated after consultation with AusNet Transmission Group.
From 2020 onwards, with one transformer out of service, there will be sufficient capacity at the station to supply all expected load over the forecast period under 10th and 50th percentile forecast conditions. Therefore, the need for augmentation or other corrective action is not expected to arise over the next ten years.
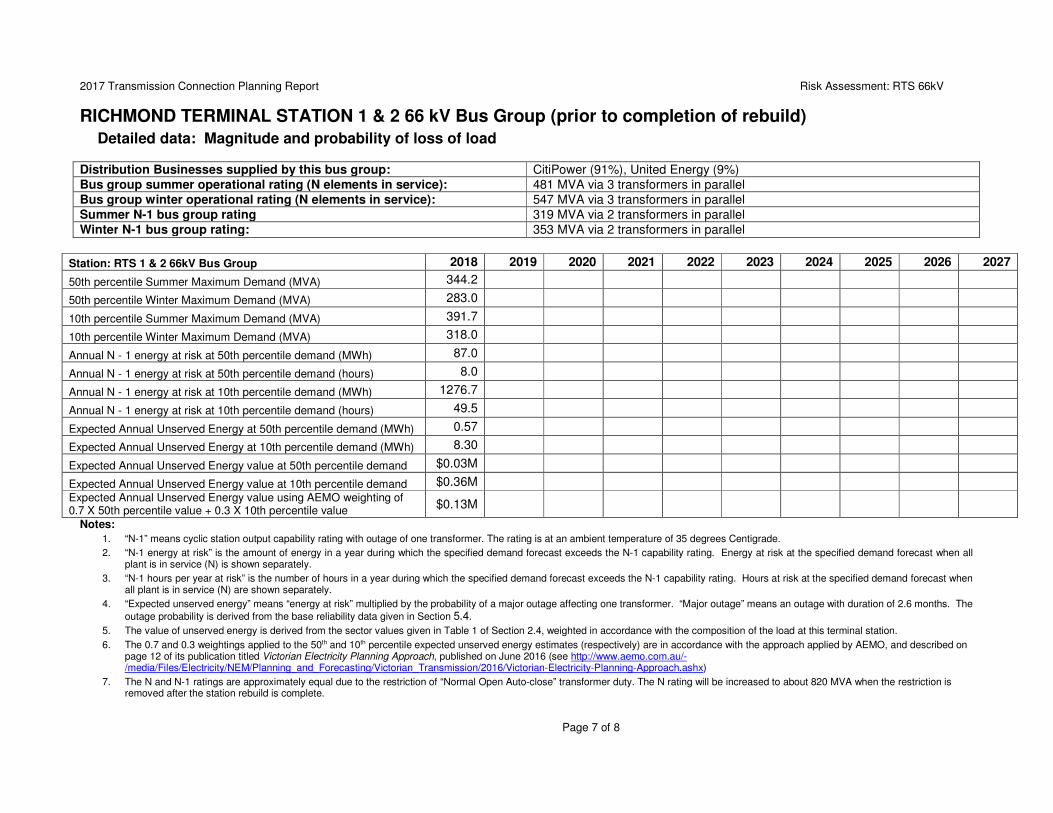
2017 Transmission Connection Planning Report Risk Assessment: RTS 66kV
Page 7 of 8
RICHMOND TERMINAL STATION 1 & 2 66 kV Bus Group (prior to completion of rebuild)
Detailed data: Magnitude and probability of loss of load
Distribution Businesses supplied by this bus group: CitiPower (91%), United Energy (9%) Bus group summer operational rating (N elements in service): 481 MVA via 3 transformers in parallel Bus group winter operational rating (N elements in service): 547 MVA via 3 transformers in parallel Summer N-1 bus group rating 319 MVA via 2 transformers in parallel Winter N-1 bus group rating: 353 MVA via 2 transformers in parallel
Station: RTS 1 & 2 66kV Bus Group 2018 2019 2020 2021 2022 2023 2024 2025 2026 2027
50th percentile Summer Maximum Demand (MVA) 344.2
50th percentile Winter Maximum Demand (MVA) 283.0
10th percentile Summer Maximum Demand (MVA) 391.7
10th percentile Winter Maximum Demand (MVA) 318.0
Annual N - 1 energy at risk at 50th percentile demand (MWh) 87.0
Annual N - 1 energy at risk at 50th percentile demand (hours) 8.0
Annual N - 1 energy at risk at 10th percentile demand (MWh) 1276.7
Annual N - 1 energy at risk at 10th percentile demand (hours) 49.5
Expected Annual Unserved Energy at 50th percentile demand (MWh) 0.57
Expected Annual Unserved Energy at 10th percentile demand (MWh) 8.30
Expected Annual Unserved Energy value at 50th percentile demand $0.03M
Expected Annual Unserved Energy value at 10th percentile demand $0.36M
Expected Annual Unserved Energy value using AEMO weighting of 0.7 X 50th percentile value + 0.3 X 10th percentile value
$0.13M
Notes:
1. “N-1” means cyclic station output capability rating with outage of one transformer. The rating is at an ambient temperature of 35 degrees Centigrade.
2. “N-1 energy at risk” is the amount of energy in a year during which the specified demand forecast exceeds the N-1 capability rating. Energy at risk at the specified demand forecast when all plant is in service (N) is shown separately.
3. “N-1 hours per year at risk” is the number of hours in a year during which the specified demand forecast exceeds the N-1 capability rating. Hours at risk at the specified demand forecast when all plant is in service (N) are shown separately.
4. “Expected unserved energy” means “energy at risk” multiplied by the probability of a major outage affecting one transformer. “Major outage” means an outage with duration of 2.6 months. The
outage probability is derived from the base reliability data given in Section 5.4.
5. The value of unserved energy is derived from the sector values given in Table 1 of Section 2.4, weighted in accordance with the composition of the load at this terminal station.
6. The 0.7 and 0.3 weightings applied to the 50th and 10th percentile expected unserved energy estimates (respectively) are in accordance with the approach applied by AEMO, and described on page 12 of its publication titled Victorian Electricity Planning Approach, published on June 2016 (see http://www.aemo.com.au/-/media/Files/Electricity/NEM/Planning_and_Forecasting/Victorian_Transmission/2016/Victorian-Electricity-Planning-Approach.ashx)
7. The N and N-1 ratings are approximately equal due to the restriction of “Normal Open Auto-close” transformer duty. The N rating will be increased to about 820 MVA when the restriction is removed after the station rebuild is complete.
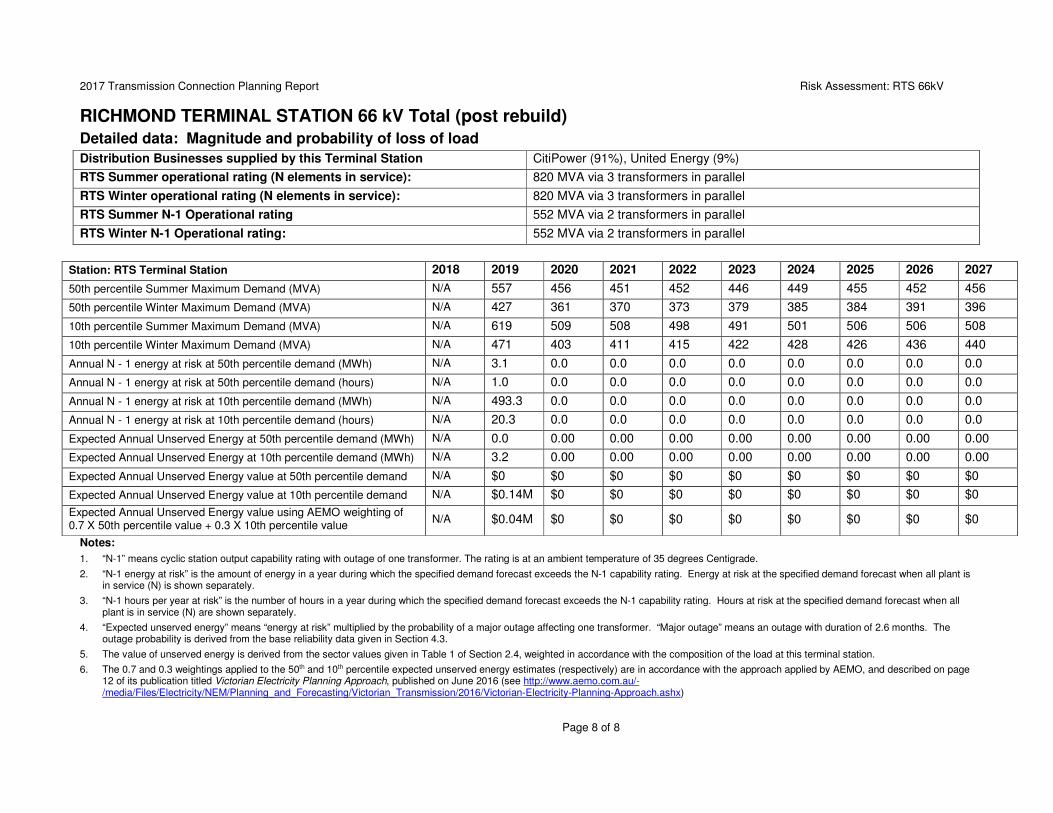
2017 Transmission Connection Planning Report Risk Assessment: RTS 66kV
Page 8 of 8
RICHMOND TERMINAL STATION 66 kV Total (post rebuild)
Detailed data: Magnitude and probability of loss of load
Distribution Businesses supplied by this Terminal Station CitiPower (91%), United Energy (9%)
RTS Summer operational rating (N elements in service): 820 MVA via 3 transformers in parallel
RTS Winter operational rating (N elements in service): 820 MVA via 3 transformers in parallel
RTS Summer N-1 Operational rating 552 MVA via 2 transformers in parallel
RTS Winter N-1 Operational rating: 552 MVA via 2 transformers in parallel
Station: RTS Terminal Station 2018 2019 2020 2021 2022 2023 2024 2025 2026 2027
50th percentile Summer Maximum Demand (MVA) N/A 557 456 451 452 446 449 455 452 456
50th percentile Winter Maximum Demand (MVA) N/A 427 361 370 373 379 385 384 391 396
10th percentile Summer Maximum Demand (MVA) N/A 619 509 508 498 491 501 506 506 508
10th percentile Winter Maximum Demand (MVA) N/A 471 403 411 415 422 428 426 436 440
Annual N - 1 energy at risk at 50th percentile demand (MWh) N/A 3.1 0.0 0.0 0.0 0.0 0.0 0.0 0.0 0.0
Annual N - 1 energy at risk at 50th percentile demand (hours) N/A 1.0 0.0 0.0 0.0 0.0 0.0 0.0 0.0 0.0
Annual N - 1 energy at risk at 10th percentile demand (MWh) N/A 493.3 0.0 0.0 0.0 0.0 0.0 0.0 0.0 0.0
Annual N - 1 energy at risk at 10th percentile demand (hours) N/A 20.3 0.0 0.0 0.0 0.0 0.0 0.0 0.0 0.0
Expected Annual Unserved Energy at 50th percentile demand (MWh) N/A 0.0 0.00 0.00 0.00 0.00 0.00 0.00 0.00 0.00
Expected Annual Unserved Energy at 10th percentile demand (MWh) N/A 3.2 0.00 0.00 0.00 0.00 0.00 0.00 0.00 0.00
Expected Annual Unserved Energy value at 50th percentile demand N/A $0 $0 $0 $0 $0 $0 $0 $0 $0
Expected Annual Unserved Energy value at 10th percentile demand N/A $0.14M $0 $0 $0 $0 $0 $0 $0 $0
Expected Annual Unserved Energy value using AEMO weighting of 0.7 X 50th percentile value + 0.3 X 10th percentile value
N/A $0.04M $0 $0 $0 $0 $0 $0 $0 $0
Notes:
1. “N-1” means cyclic station output capability rating with outage of one transformer. The rating is at an ambient temperature of 35 degrees Centigrade.
2. “N-1 energy at risk” is the amount of energy in a year during which the specified demand forecast exceeds the N-1 capability rating. Energy at risk at the specified demand forecast when all plant is in service (N) is shown separately.
3. “N-1 hours per year at risk” is the number of hours in a year during which the specified demand forecast exceeds the N-1 capability rating. Hours at risk at the specified demand forecast when all plant is in service (N) are shown separately.
4. “Expected unserved energy” means “energy at risk” multiplied by the probability of a major outage affecting one transformer. “Major outage” means an outage with duration of 2.6 months. The outage probability is derived from the base reliability data given in Section 4.3.
5. The value of unserved energy is derived from the sector values given in Table 1 of Section 2.4, weighted in accordance with the composition of the load at this terminal station.
6. The 0.7 and 0.3 weightings applied to the 50th and 10th percentile expected unserved energy estimates (respectively) are in accordance with the approach applied by AEMO, and described on page 12 of its publication titled Victorian Electricity Planning Approach, published on June 2016 (see http://www.aemo.com.au/-/media/Files/Electricity/NEM/Planning_and_Forecasting/Victorian_Transmission/2016/Victorian-Electricity-Planning-Approach.ashx)
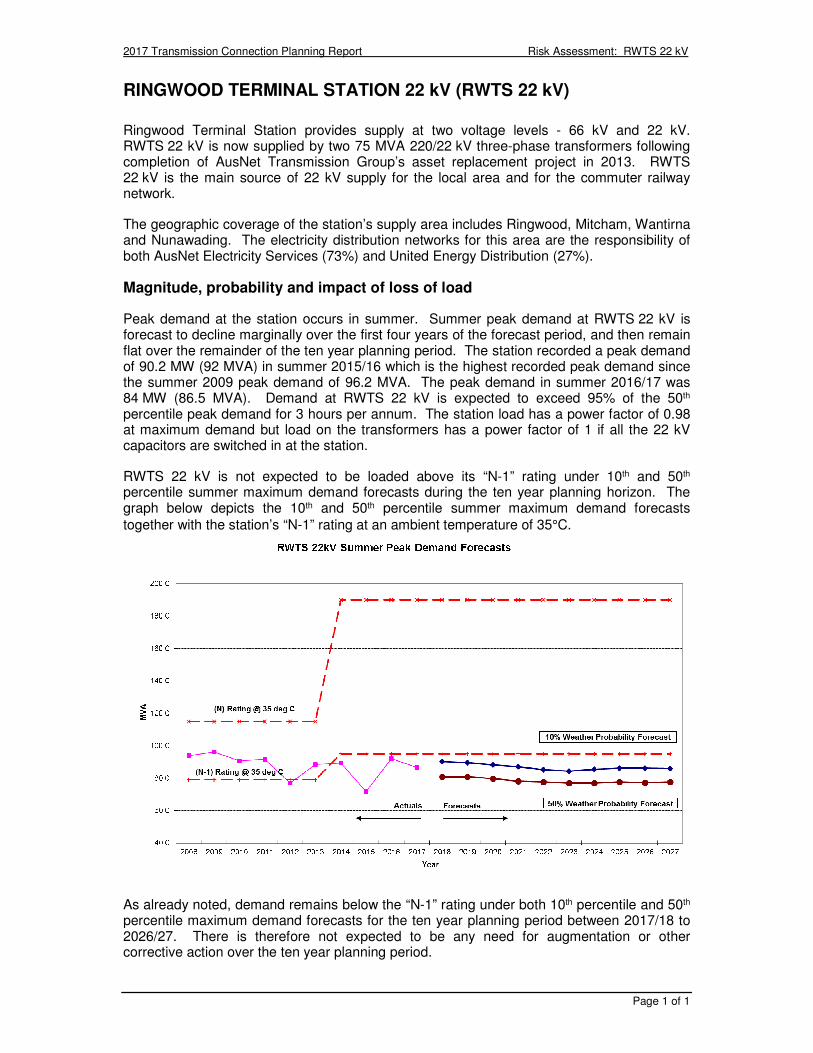
2017 Transmission Connection Planning Report Risk Assessment: RWTS 22 kV
Page 1 of 1
RINGWOOD TERMINAL STATION 22 kV (RWTS 22 kV)
Ringwood Terminal Station provides supply at two voltage levels - 66 kV and 22 kV. RWTS 22 kV is now supplied by two 75 MVA 220/22 kV three-phase transformers following completion of AusNet Transmission Group’s asset replacement project in 2013. RWTS 22 kV is the main source of 22 kV supply for the local area and for the commuter railway network.
The geographic coverage of the station’s supply area includes Ringwood, Mitcham, Wantirna and Nunawading. The electricity distribution networks for this area are the responsibility of both AusNet Electricity Services (73%) and United Energy Distribution (27%).
Magnitude, probability and impact of loss of load
Peak demand at the station occurs in summer. Summer peak demand at RWTS 22 kV is forecast to decline marginally over the first four years of the forecast period, and then remain flat over the remainder of the ten year planning period. The station recorded a peak demand of 90.2 MW (92 MVA) in summer 2015/16 which is the highest recorded peak demand since the summer 2009 peak demand of 96.2 MVA. The peak demand in summer 2016/17 was 84 MW (86.5 MVA). Demand at RWTS 22 kV is expected to exceed 95% of the 50th percentile peak demand for 3 hours per annum. The station load has a power factor of 0.98 at maximum demand but load on the transformers has a power factor of 1 if all the 22 kV capacitors are switched in at the station.
RWTS 22 kV is not expected to be loaded above its “N-1” rating under 10th and 50th percentile summer maximum demand forecasts during the ten year planning horizon. The graph below depicts the 10th and 50th percentile summer maximum demand forecasts
together with the station’s “N-1” rating at an ambient temperature of 35°C.
As already noted, demand remains below the “N-1” rating under both 10th percentile and 50th percentile maximum demand forecasts for the ten year planning period between 2017/18 to 2026/27. There is therefore not expected to be any need for augmentation or other corrective action over the ten year planning period.
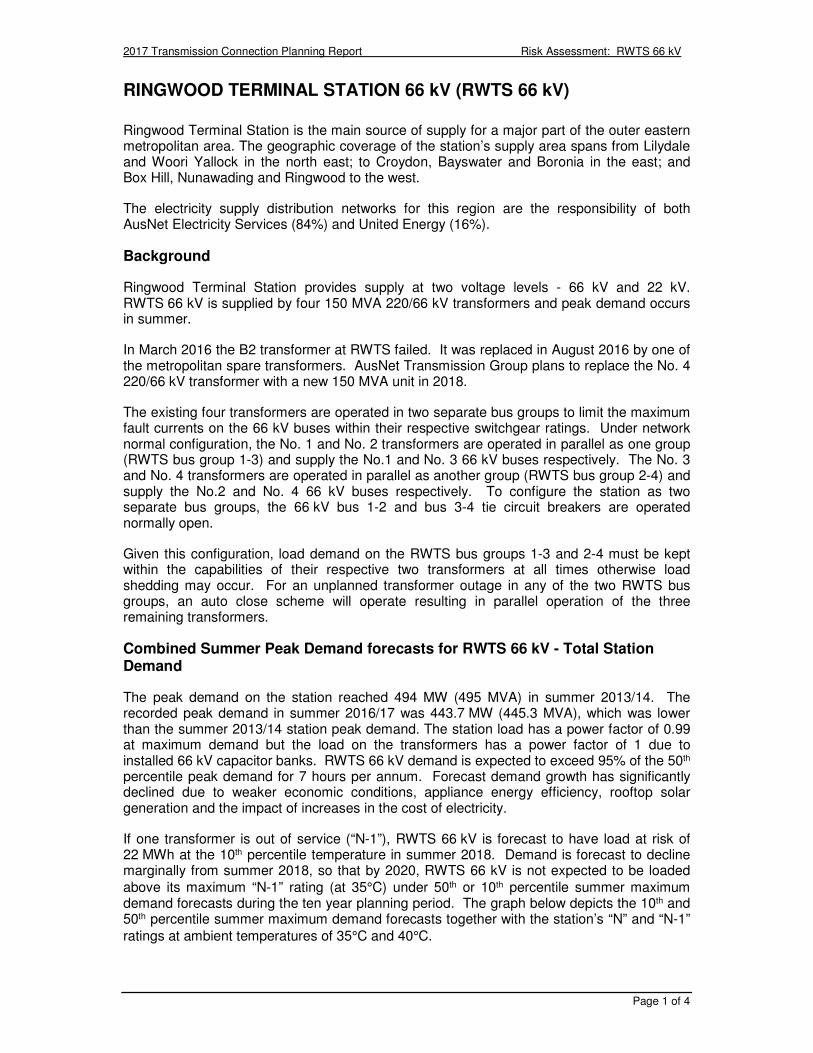
2017 Transmission Connection Planning Report Risk Assessment: RWTS 66 kV
Page 1 of 4
RINGWOOD TERMINAL STATION 66 kV (RWTS 66 kV)
Ringwood Terminal Station is the main source of supply for a major part of the outer eastern metropolitan area. The geographic coverage of the station’s supply area spans from Lilydale and Woori Yallock in the north east; to Croydon, Bayswater and Boronia in the east; and Box Hill, Nunawading and Ringwood to the west.
The electricity supply distribution networks for this region are the responsibility of both AusNet Electricity Services (84%) and United Energy (16%).
Background
Ringwood Terminal Station provides supply at two voltage levels - 66 kV and 22 kV. RWTS 66 kV is supplied by four 150 MVA 220/66 kV transformers and peak demand occurs in summer.
In March 2016 the B2 transformer at RWTS failed. It was replaced in August 2016 by one of the metropolitan spare transformers. AusNet Transmission Group plans to replace the No. 4 220/66 kV transformer with a new 150 MVA unit in 2018.
The existing four transformers are operated in two separate bus groups to limit the maximum fault currents on the 66 kV buses within their respective switchgear ratings. Under network normal configuration, the No. 1 and No. 2 transformers are operated in parallel as one group (RWTS bus group 1-3) and supply the No.1 and No. 3 66 kV buses respectively. The No. 3 and No. 4 transformers are operated in parallel as another group (RWTS bus group 2-4) and supply the No.2 and No. 4 66 kV buses respectively. To configure the station as two separate bus groups, the 66 kV bus 1-2 and bus 3-4 tie circuit breakers are operated normally open.
Given this configuration, load demand on the RWTS bus groups 1-3 and 2-4 must be kept within the capabilities of their respective two transformers at all times otherwise load shedding may occur. For an unplanned transformer outage in any of the two RWTS bus groups, an auto close scheme will operate resulting in parallel operation of the three remaining transformers.
Combined Summer Peak Demand forecasts for RWTS 66 kV - Total Station Demand
The peak demand on the station reached 494 MW (495 MVA) in summer 2013/14. The recorded peak demand in summer 2016/17 was 443.7 MW (445.3 MVA), which was lower than the summer 2013/14 station peak demand. The station load has a power factor of 0.99 at maximum demand but the load on the transformers has a power factor of 1 due to installed 66 kV capacitor banks. RWTS 66 kV demand is expected to exceed 95% of the 50th percentile peak demand for 7 hours per annum. Forecast demand growth has significantly declined due to weaker economic conditions, appliance energy efficiency, rooftop solar generation and the impact of increases in the cost of electricity.
If one transformer is out of service (“N-1”), RWTS 66 kV is forecast to have load at risk of 22 MWh at the 10th percentile temperature in summer 2018. Demand is forecast to decline marginally from summer 2018, so that by 2020, RWTS 66 kV is not expected to be loaded
above its maximum “N-1” rating (at 35°C) under 50th or 10th percentile summer maximum demand forecasts during the ten year planning period. The graph below depicts the 10th and 50th percentile summer maximum demand forecasts together with the station’s “N” and “N-1”
ratings at ambient temperatures of 35°C and 40°C.
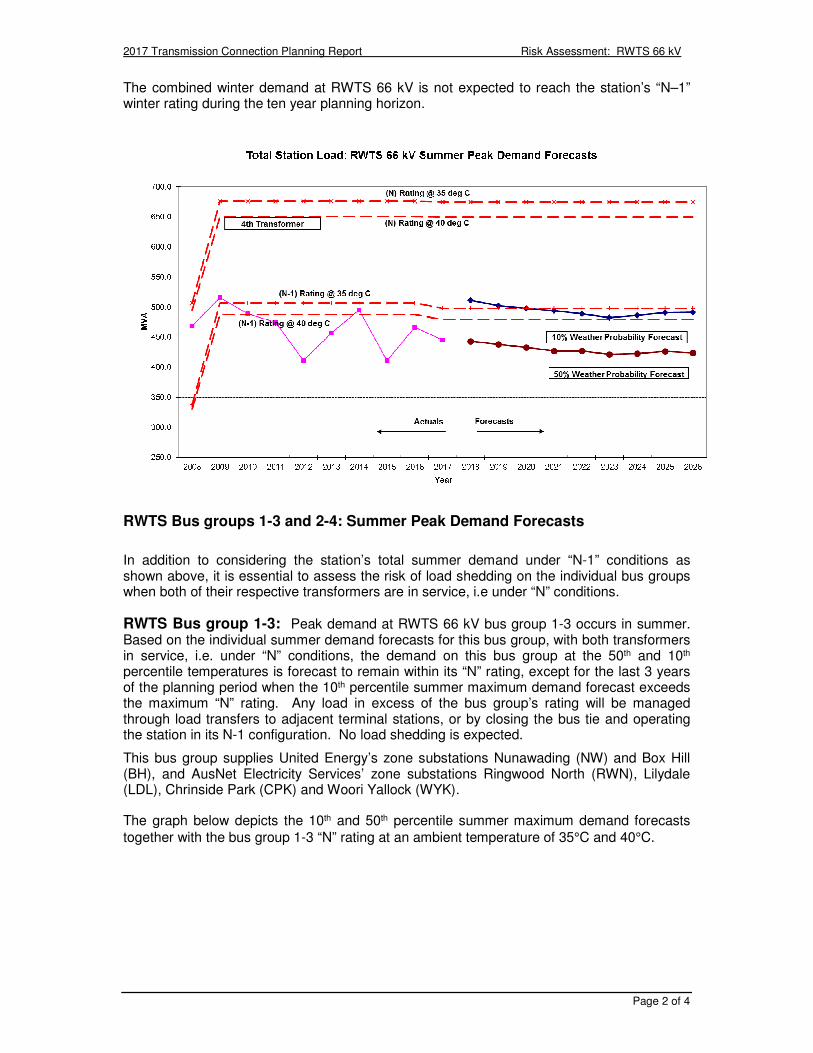
2017 Transmission Connection Planning Report Risk Assessment: RWTS 66 kV
Page 2 of 4
The combined winter demand at RWTS 66 kV is not expected to reach the station’s “N–1” winter rating during the ten year planning horizon.
RWTS Bus groups 1-3 and 2-4: Summer Peak Demand Forecasts
In addition to considering the station’s total summer demand under “N-1” conditions as shown above, it is essential to assess the risk of load shedding on the individual bus groups when both of their respective transformers are in service, i.e under “N” conditions.
RWTS Bus group 1-3: Peak demand at RWTS 66 kV bus group 1-3 occurs in summer. Based on the individual summer demand forecasts for this bus group, with both transformers in service, i.e. under “N” conditions, the demand on this bus group at the 50th and 10th percentile temperatures is forecast to remain within its “N” rating, except for the last 3 years of the planning period when the 10th percentile summer maximum demand forecast exceeds the maximum “N” rating. Any load in excess of the bus group’s rating will be managed through load transfers to adjacent terminal stations, or by closing the bus tie and operating the station in its N-1 configuration. No load shedding is expected.
This bus group supplies United Energy’s zone substations Nunawading (NW) and Box Hill (BH), and AusNet Electricity Services’ zone substations Ringwood North (RWN), Lilydale (LDL), Chrinside Park (CPK) and Woori Yallock (WYK).
The graph below depicts the 10th and 50th percentile summer maximum demand forecasts
together with the bus group 1-3 “N” rating at an ambient temperature of 35°C and 40°C.
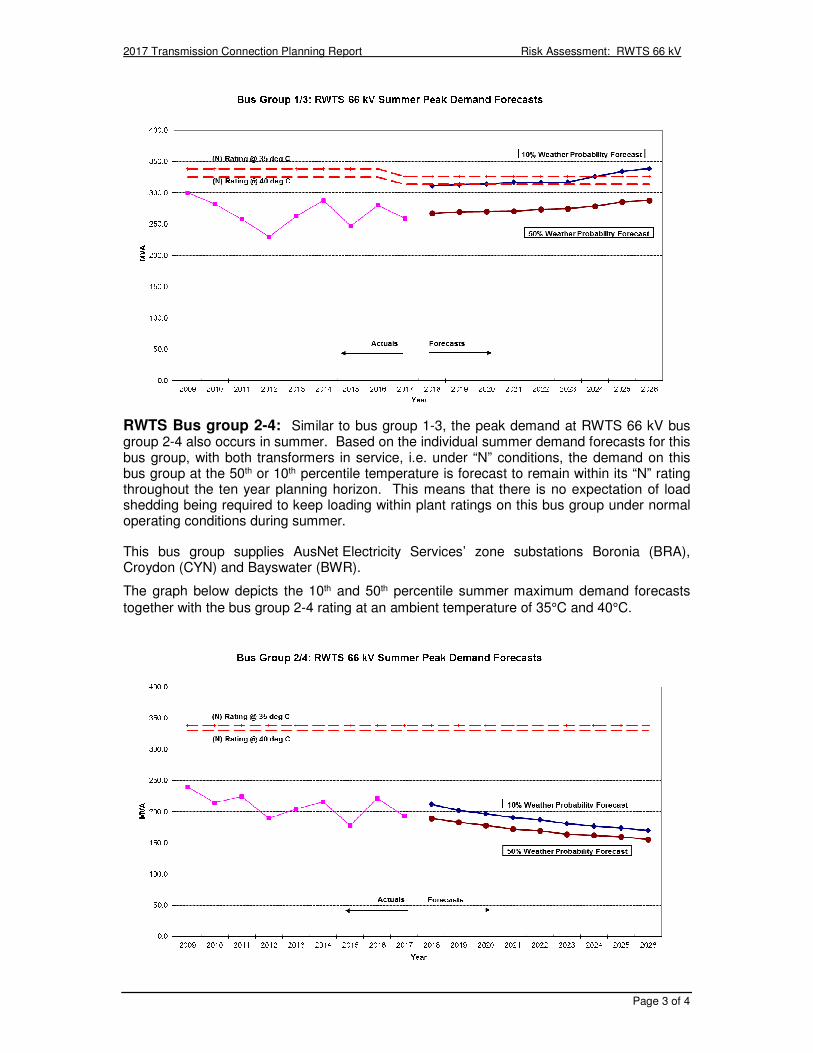
2017 Transmission Connection Planning Report Risk Assessment: RWTS 66 kV
Page 3 of 4
RWTS Bus group 2-4: Similar to bus group 1-3, the peak demand at RWTS 66 kV bus group 2-4 also occurs in summer. Based on the individual summer demand forecasts for this bus group, with both transformers in service, i.e. under “N” conditions, the demand on this bus group at the 50th or 10th percentile temperature is forecast to remain within its “N” rating throughout the ten year planning horizon. This means that there is no expectation of load shedding being required to keep loading within plant ratings on this bus group under normal operating conditions during summer.
This bus group supplies AusNet Electricity Services’ zone substations Boronia (BRA), Croydon (CYN) and Bayswater (BWR).
The graph below depicts the 10th and 50th percentile summer maximum demand forecasts
together with the bus group 2-4 rating at an ambient temperature of 35°C and 40°C.
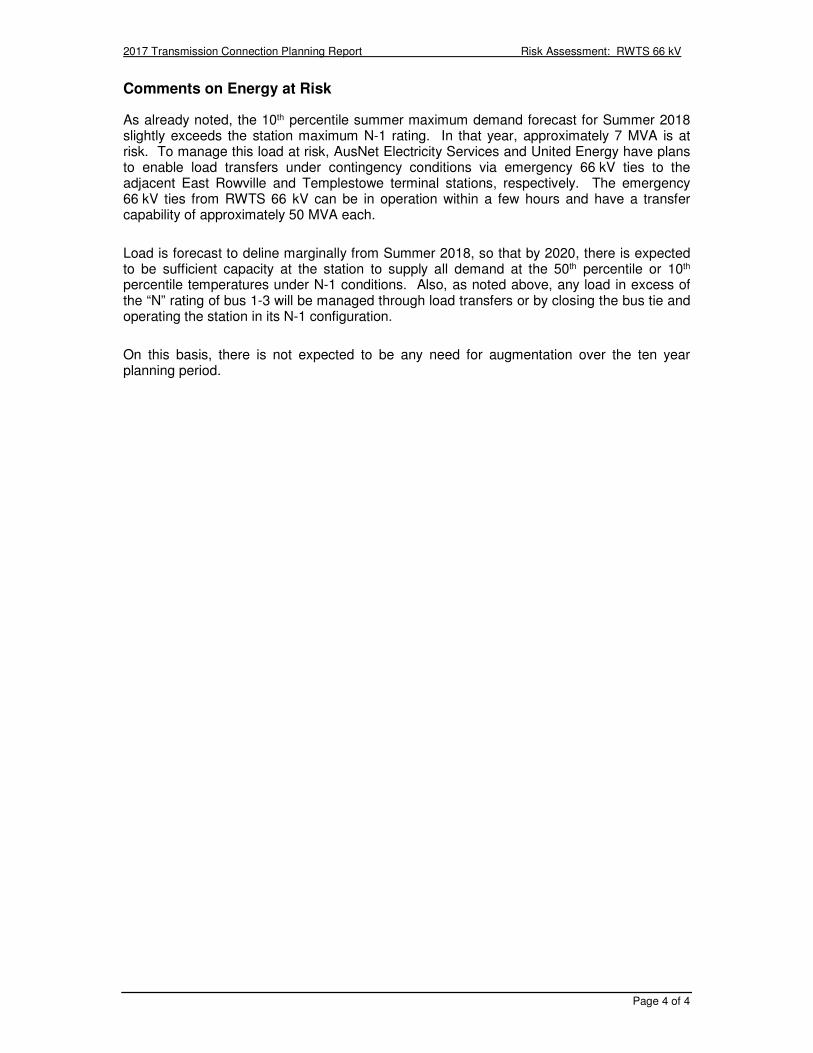
2017 Transmission Connection Planning Report Risk Assessment: RWTS 66 kV
Page 4 of 4
Comments on Energy at Risk
As already noted, the 10th percentile summer maximum demand forecast for Summer 2018 slightly exceeds the station maximum N-1 rating. In that year, approximately 7 MVA is at risk. To manage this load at risk, AusNet Electricity Services and United Energy have plans to enable load transfers under contingency conditions via emergency 66 kV ties to the adjacent East Rowville and Templestowe terminal stations, respectively. The emergency 66 kV ties from RWTS 66 kV can be in operation within a few hours and have a transfer capability of approximately 50 MVA each.
Load is forecast to deline marginally from Summer 2018, so that by 2020, there is expected to be sufficient capacity at the station to supply all demand at the 50th percentile or 10th percentile temperatures under N-1 conditions. Also, as noted above, any load in excess of the “N” rating of bus 1-3 will be managed through load transfers or by closing the bus tie and operating the station in its N-1 configuration.
On this basis, there is not expected to be any need for augmentation over the ten year planning period.
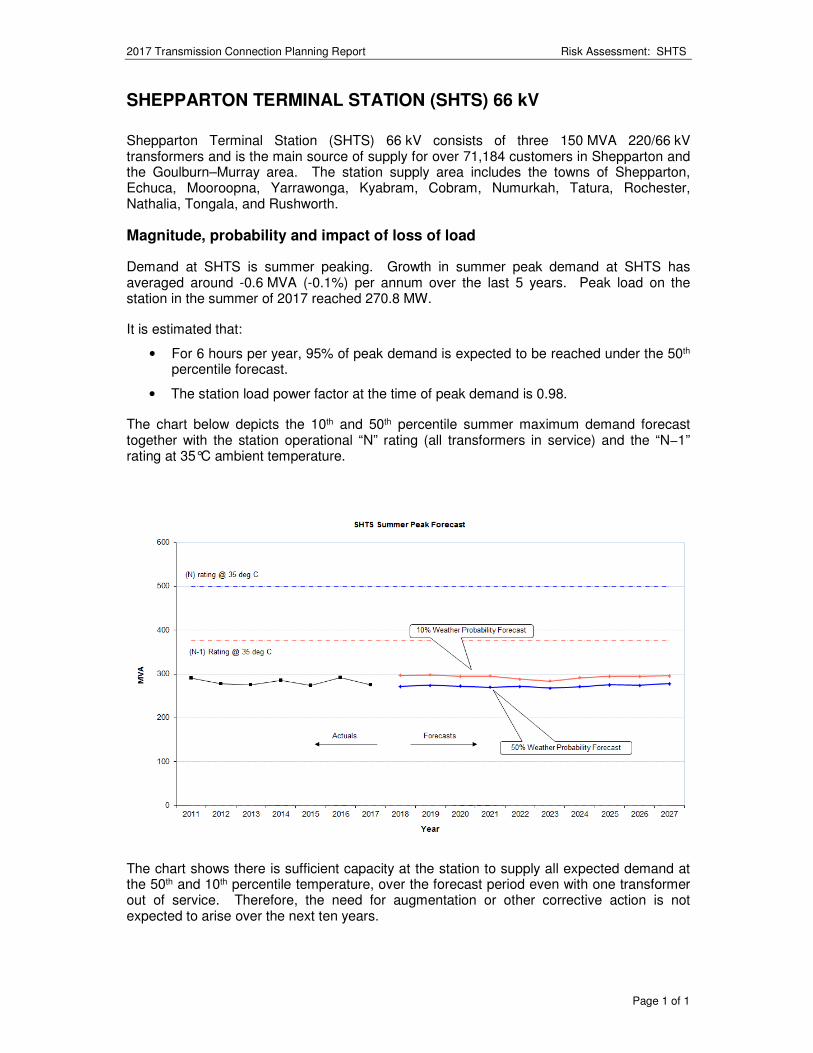
2017 Transmission Connection Planning Report Risk Assessment: SHTS
Page 1 of 1
SHEPPARTON TERMINAL STATION (SHTS) 66 kV
Shepparton Terminal Station (SHTS) 66 kV consists of three 150 MVA 220/66 kV transformers and is the main source of supply for over 71,184 customers in Shepparton and the Goulburn–Murray area. The station supply area includes the towns of Shepparton, Echuca, Mooroopna, Yarrawonga, Kyabram, Cobram, Numurkah, Tatura, Rochester, Nathalia, Tongala, and Rushworth.
Magnitude, probability and impact of loss of load
Demand at SHTS is summer peaking. Growth in summer peak demand at SHTS has averaged around -0.6 MVA (-0.1%) per annum over the last 5 years. Peak load on the station in the summer of 2017 reached 270.8 MW.
It is estimated that:
• For 6 hours per year, 95% of peak demand is expected to be reached under the 50th percentile forecast.
• The station load power factor at the time of peak demand is 0.98.
The chart below depicts the 10th and 50th percentile summer maximum demand forecast together with the station operational “N” rating (all transformers in service) and the “N−1” rating at 35°C ambient temperature.
The chart shows there is sufficient capacity at the station to supply all expected demand at the 50th and 10th percentile temperature, over the forecast period even with one transformer out of service. Therefore, the need for augmentation or other corrective action is not expected to arise over the next ten years.
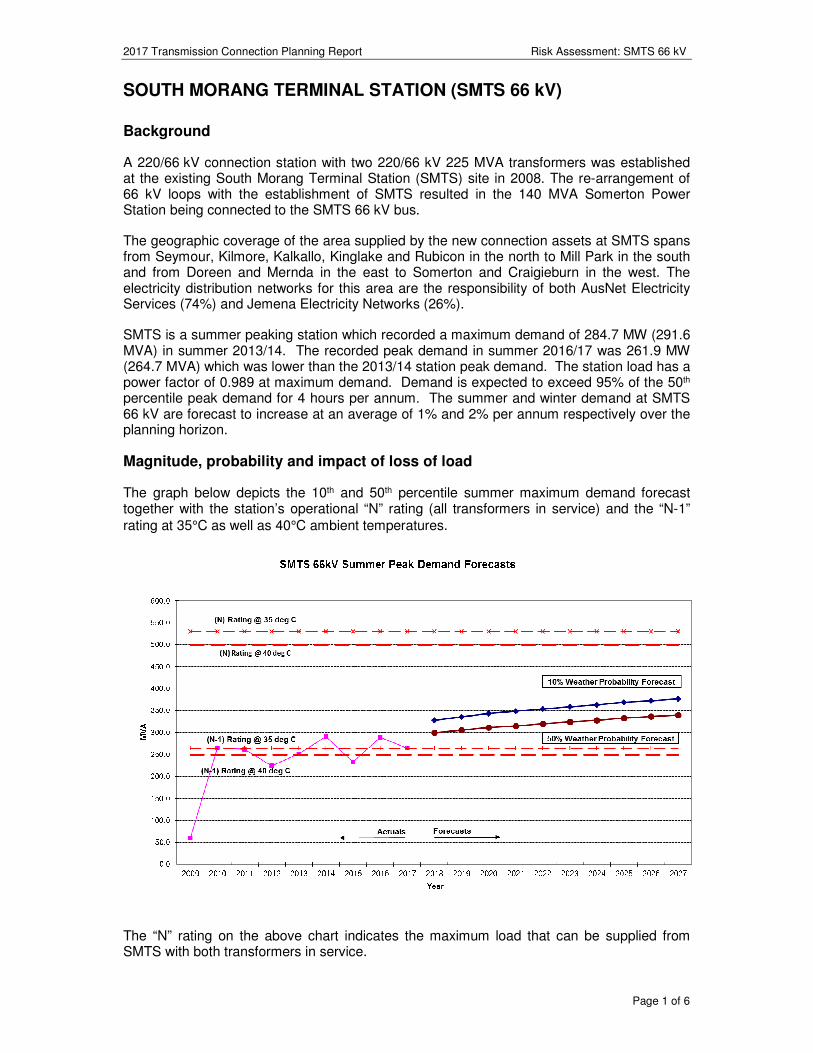
2017 Transmission Connection Planning Report Risk Assessment: SMTS 66 kV
Page 1 of 6
SOUTH MORANG TERMINAL STATION (SMTS 66 kV)
Background
A 220/66 kV connection station with two 220/66 kV 225 MVA transformers was established at the existing South Morang Terminal Station (SMTS) site in 2008. The re-arrangement of 66 kV loops with the establishment of SMTS resulted in the 140 MVA Somerton Power Station being connected to the SMTS 66 kV bus.
The geographic coverage of the area supplied by the new connection assets at SMTS spans from Seymour, Kilmore, Kalkallo, Kinglake and Rubicon in the north to Mill Park in the south and from Doreen and Mernda in the east to Somerton and Craigieburn in the west. The electricity distribution networks for this area are the responsibility of both AusNet Electricity Services (74%) and Jemena Electricity Networks (26%).
SMTS is a summer peaking station which recorded a maximum demand of 284.7 MW (291.6 MVA) in summer 2013/14. The recorded peak demand in summer 2016/17 was 261.9 MW (264.7 MVA) which was lower than the 2013/14 station peak demand. The station load has a power factor of 0.989 at maximum demand. Demand is expected to exceed 95% of the 50th percentile peak demand for 4 hours per annum. The summer and winter demand at SMTS 66 kV are forecast to increase at an average of 1% and 2% per annum respectively over the planning horizon.
Magnitude, probability and impact of loss of load
The graph below depicts the 10th and 50th percentile summer maximum demand forecast together with the station’s operational “N” rating (all transformers in service) and the “N-1” rating at 35°C as well as 40°C ambient temperatures.
The “N” rating on the above chart indicates the maximum load that can be supplied from SMTS with both transformers in service.
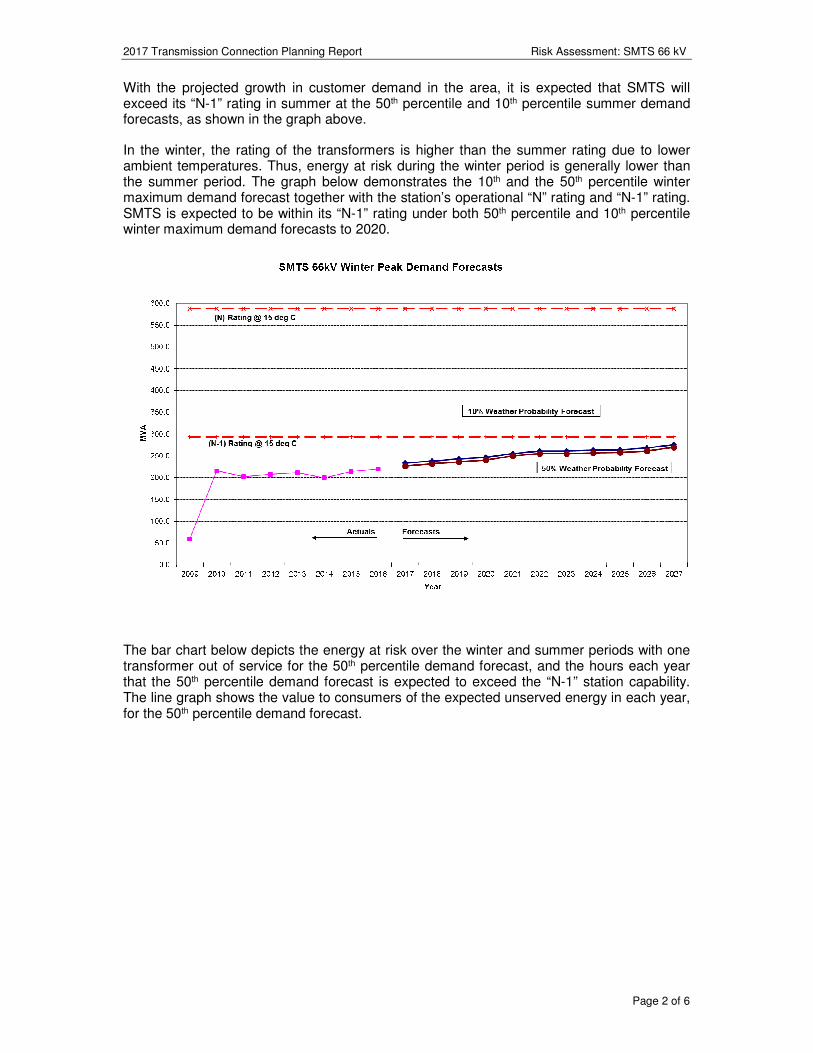
2017 Transmission Connection Planning Report Risk Assessment: SMTS 66 kV
Page 2 of 6
With the projected growth in customer demand in the area, it is expected that SMTS will exceed its “N-1” rating in summer at the 50th percentile and 10th percentile summer demand forecasts, as shown in the graph above.
In the winter, the rating of the transformers is higher than the summer rating due to lower ambient temperatures. Thus, energy at risk during the winter period is generally lower than the summer period. The graph below demonstrates the 10th and the 50th percentile winter maximum demand forecast together with the station’s operational “N” rating and “N-1” rating. SMTS is expected to be within its “N-1” rating under both 50th percentile and 10th percentile winter maximum demand forecasts to 2020.
The bar chart below depicts the energy at risk over the winter and summer periods with one transformer out of service for the 50th percentile demand forecast, and the hours each year that the 50th percentile demand forecast is expected to exceed the “N-1” station capability. The line graph shows the value to consumers of the expected unserved energy in each year, for the 50th percentile demand forecast.
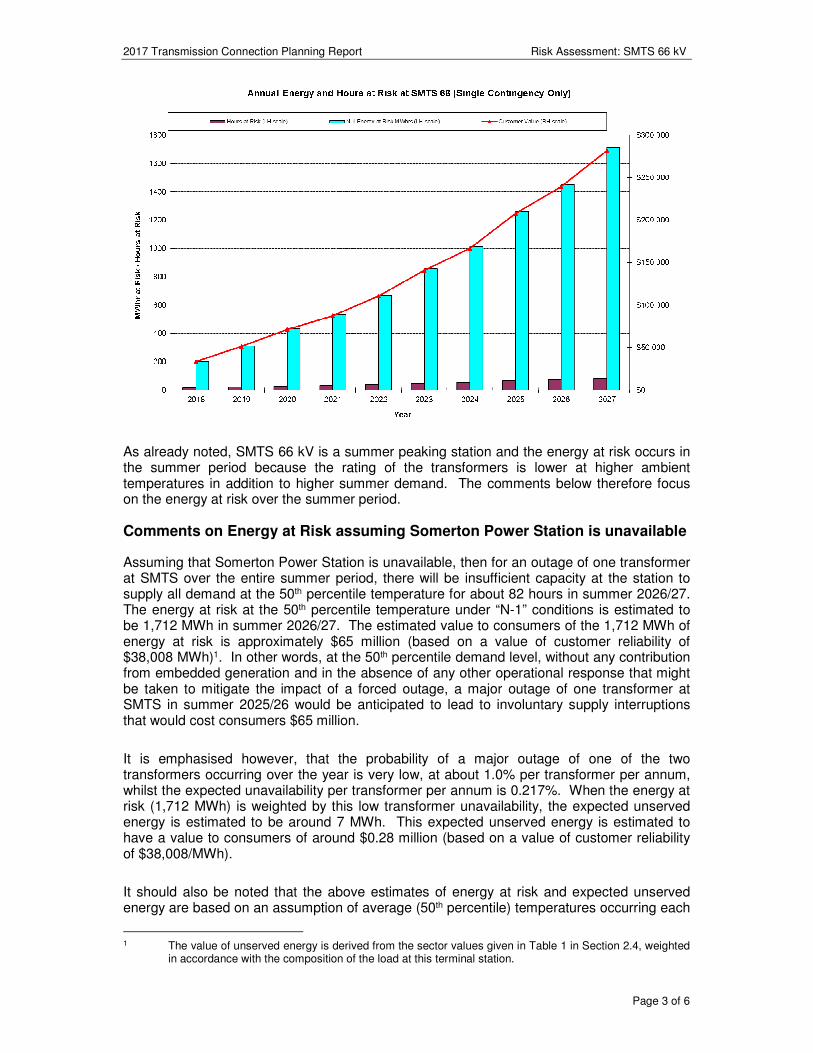
2017 Transmission Connection Planning Report Risk Assessment: SMTS 66 kV
Page 3 of 6
As already noted, SMTS 66 kV is a summer peaking station and the energy at risk occurs in the summer period because the rating of the transformers is lower at higher ambient temperatures in addition to higher summer demand. The comments below therefore focus on the energy at risk over the summer period.
Comments on Energy at Risk assuming Somerton Power Station is unavailable
Assuming that Somerton Power Station is unavailable, then for an outage of one transformer at SMTS over the entire summer period, there will be insufficient capacity at the station to supply all demand at the 50th percentile temperature for about 82 hours in summer 2026/27. The energy at risk at the 50th percentile temperature under “N-1” conditions is estimated to be 1,712 MWh in summer 2026/27. The estimated value to consumers of the 1,712 MWh of energy at risk is approximately $65 million (based on a value of customer reliability of $38,008 MWh)1. In other words, at the 50th percentile demand level, without any contribution from embedded generation and in the absence of any other operational response that might be taken to mitigate the impact of a forced outage, a major outage of one transformer at SMTS in summer 2025/26 would be anticipated to lead to involuntary supply interruptions that would cost consumers $65 million.
It is emphasised however, that the probability of a major outage of one of the two transformers occurring over the year is very low, at about 1.0% per transformer per annum, whilst the expected unavailability per transformer per annum is 0.217%. When the energy at risk (1,712 MWh) is weighted by this low transformer unavailability, the expected unserved energy is estimated to be around 7 MWh. This expected unserved energy is estimated to have a value to consumers of around $0.28 million (based on a value of customer reliability of $38,008/MWh).
It should also be noted that the above estimates of energy at risk and expected unserved energy are based on an assumption of average (50th percentile) temperatures occurring each
1 The value of unserved energy is derived from the sector values given in Table 1 in Section 2.4, weighted
in accordance with the composition of the load at this terminal station.
2017 Transmission Connection Planning Report Risk Assessment: SMTS 66 kV
Page 4 of 6
year. Under higher temperature conditions (that is, at the 10th percentile level), the energy at risk in 2026/27 summer is estimated to be 4,943 MWh. The estimated value to consumers of the energy at risk in 2025/26 summer is approximately $188 million. The corresponding value of the expected unserved energy (of 21 MWh) is approximately $0.81 million.
These key statistics for the summer of 2026/27 under “N-1” outage conditions are summarised in the table below.
MWh Valued at consumer interruption cost
Energy at risk, at 50th percentile demand forecast 1,712 $65 million
Expected unserved energy at 50th percentile demand 7 $0.28 million
Energy at risk, at 10th percentile demand forecast 4,943 $188 million
Expected unserved energy at 10th percentile demand 21 $0.81 million
If one of the 220/66 kV transformers at SMTS is taken off line during peak loading times and the “N-1” station rating is exceeded, then the Overload Shedding Scheme for Connection Assets (OSSCA), which is operated by AusNet Transmission Group’s TOC2 to protect the connection assets from overloading3, will act swiftly to reduce the loads in blocks to within safe loading limits. In the event of OSSCA operating, it would automatically shed up to 40 MVA of load, affecting approximately 15,000 customers in 2017/18. Any load reductions that are in excess of the minimum amount required to limit load to the rated capability of the station would be restored at feeder level in accordance with AusNet Electricity Services and Jemena’s operational procedures after the operation of the OSSCA scheme.
Comments on Energy at Risk assuming Somerton Power Station is available
The previous comments on energy at risk are based on the assumption that there is no embedded generation available to offset the 220/66 kV transformer loading. The Somerton Power Station (SPS) is capable of generating up to 140 MVA and this generation is connected to the SMTS 66 kV bus via the SMTS-ST-SSS-SMTS 66 kV loop. There is no firm commitment that generation will be available to offset transformer loading at SMTS; however it is most likely that the times of peak demand at SMTS will coincide with periods of high wholesale electricity prices, resulting in a high likelihood that SPS will be generating. If SPS is generating to its full capacity there would be no energy at risk at SMTS over the ten year planning horizon for both the 50th and 10th percentile summer maximum demand forecast.
Feasible options for alleviation of constraints
The following options are technically feasible and potentially economic to mitigate the risk of a supply interruption and/or to alleviate the emerging capacity constraints:
1. Implement contingency plans to transfer load to adjacent terminal stations. AusNet Electricity Services has established and implemented the necessary plans that enable up
2 Transmission Operation Centre.
3 OSSCA is designed to protect connection transformers against transformer damage caused by overloads. Damaged transformers can take months to repair or replace which can result in prolonged, long term risks to the reliability of customer supply.
2017 Transmission Connection Planning Report Risk Assessment: SMTS 66 kV
Page 5 of 6
to 20 MVA of load transfers via existing 22 kV feeders to adjoining zone substations. Jemena has plans and the capability to transfer an additional 13 MVA. This option is able to partly reduce the interruption duration and load at risk resulting from a major transformer failure.
2. Install a third 225 MVA 220/66 kV transformer at South Morang Terminal Station (SMTS), which would also require the installation of fault limiting reactors.
3. Demand Management. AusNet Electricity Services is currently using an MVA tariff to encourage large customers to improve their power factor as well as a critical peak pricing tariff to encourage them to reduce load at peak demand times and thus reduce the station loading. Up to 50% of the maximum demand at SMTS 66 kV is expected to be summer residential load, largely air conditioning. With the existing load mix it is likely that demand reduction initiatives can play a limited role in reducing the peak summer load at SMTS 66 kV.
4. Embedded Generation. As mentioned above, the Somerton power station is connected to SMTS. A network support agreement with SPS or other generator connected to the SMTS 66 kV bus will help to defer the need for augmentation.
Preferred network option for alleviation of constraints
1. In the event that there are no firm commitments by interested parties to offer network support services by installing local generation or through demand side management initiatives that would reduce future load at SMTS 66 kV; it will be proposed to install a new third 220/66 kV transformer at SMTS 66 kV. The capital cost of this option is estimated at $22 million, which includes the cost of installing three fault limiting reactors. This equates to a total annual cost of approximately $2.2 million per annum. Under the latest demand forecast, the installation of the third transformer at SMTS would not be economically justified in the forecast period.
2. Implement the following temporary measures to cater for an unplanned outage of one transformer at SMTS under critical loading conditions until the new 220/66 kV transformer is commissioned:
• maintain contingency plans to transfer load quickly to adjacent terminal stations;
• rely on Somerton Power Station (SPS) generation to reduce loading at SMTS 66 kV, and investigate the option of formalising a network support agreement with SPS;
• fine-tune the OSSCA scheme settings in conjunction with TOC to minimise the impact on customers of any load shedding that may take place to protect the connection assets from overloading; and
• subject to the availability of AusNet Transmission Group’s spare 220/66 kV transformer for the metropolitan area (refer Section 5.5), this spare transformer can be used to temporarily replace a failed transformer at SMTS. It is noted that AusNet Transmission Group currently has two 150 MVA spare transformers. Load sharing with a metro spare transformer will not be optimal, so the SMTS 66 kV capacity will be reduced under these emergency conditions.
The table on the following page provides more detailed data on the station rating, demand forecast, energy at risk and expected unserved energy assuming embedded generation is not available.
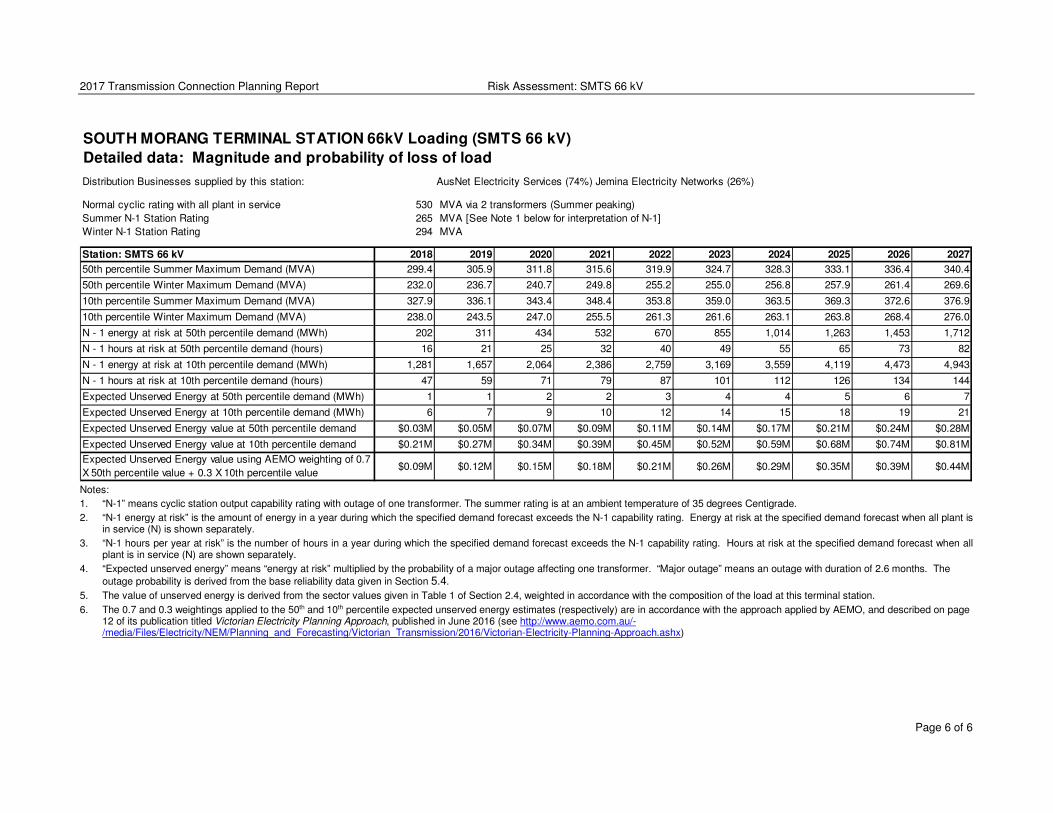
2017 Transmission Connection Planning Report Risk Assessment: SMTS 66 kV
Page 6 of 6
SOUTH MORANG TERMINAL STATION 66kV Loading (SMTS 66 kV)
Detailed data: Magnitude and probability of loss of load
Distribution Businesses supplied by this station: AusNet Electricity Services (74%) Jemina Electricity Networks (26%)
Normal cyclic rating with all plant in service 530 MVA via 2 transformers (Summer peaking)
Summer N-1 Station Rating 265 MVA [See Note 1 below for interpretation of N-1]
Winter N-1 Station Rating 294 MVA
Station: SMTS 66 kV 2018 2019 2020 2021 2022 2023 2024 2025 2026 2027
50th percentile Summer Maximum Demand (MVA) 299.4 305.9 311.8 315.6 319.9 324.7 328.3 333.1 336.4 340.4
50th percentile Winter Maximum Demand (MVA) 232.0 236.7 240.7 249.8 255.2 255.0 256.8 257.9 261.4 269.6
10th percentile Summer Maximum Demand (MVA) 327.9 336.1 343.4 348.4 353.8 359.0 363.5 369.3 372.6 376.9
10th percentile Winter Maximum Demand (MVA) 238.0 243.5 247.0 255.5 261.3 261.6 263.1 263.8 268.4 276.0
N - 1 energy at risk at 50th percentile demand (MWh) 202 311 434 532 670 855 1,014 1,263 1,453 1,712
N - 1 hours at risk at 50th percentile demand (hours) 16 21 25 32 40 49 55 65 73 82
N - 1 energy at risk at 10th percentile demand (MWh) 1,281 1,657 2,064 2,386 2,759 3,169 3,559 4,119 4,473 4,943
N - 1 hours at risk at 10th percentile demand (hours) 47 59 71 79 87 101 112 126 134 144
Expected Unserved Energy at 50th percentile demand (MWh) 1 1 2 2 3 4 4 5 6 7
Expected Unserved Energy at 10th percentile demand (MWh) 6 7 9 10 12 14 15 18 19 21
Expected Unserved Energy value at 50th percentile demand $0.03M $0.05M $0.07M $0.09M $0.11M $0.14M $0.17M $0.21M $0.24M $0.28M
Expected Unserved Energy value at 10th percentile demand $0.21M $0.27M $0.34M $0.39M $0.45M $0.52M $0.59M $0.68M $0.74M $0.81M
Expected Unserved Energy value using AEMO weighting of 0.7
X 50th percentile value + 0.3 X 10th percentile value$0.09M $0.12M $0.15M $0.18M $0.21M $0.26M $0.29M $0.35M $0.39M $0.44M
Notes:
1. “N-1” means cyclic station output capability rating with outage of one transformer. The summer rating is at an ambient temperature of 35 degrees Centigrade.
2. “N-1 energy at risk” is the amount of energy in a year during which the specified demand forecast exceeds the N-1 capability rating. Energy at risk at the specified demand forecast when all plant is in service (N) is shown separately.
3. “N-1 hours per year at risk” is the number of hours in a year during which the specified demand forecast exceeds the N-1 capability rating. Hours at risk at the specified demand forecast when all plant is in service (N) are shown separately.
4. “Expected unserved energy” means “energy at risk” multiplied by the probability of a major outage affecting one transformer. “Major outage” means an outage with duration of 2.6 months. The
outage probability is derived from the base reliability data given in Section 5.4.
5. The value of unserved energy is derived from the sector values given in Table 1 of Section 2.4, weighted in accordance with the composition of the load at this terminal station.
6. The 0.7 and 0.3 weightings applied to the 50th and 10th percentile expected unserved energy estimates (respectively) are in accordance with the approach applied by AEMO, and described on page 12 of its publication titled Victorian Electricity Planning Approach, published in June 2016 (see http://www.aemo.com.au/-/media/Files/Electricity/NEM/Planning_and_Forecasting/Victorian_Transmission/2016/Victorian-Electricity-Planning-Approach.ashx)
2017 Transmission Connection Planning Report Risk Assessment: SVTS
Page 1 of 8
SPRINGVALE TERMINAL STATION (SVTS)
Springvale Terminal Station (SVTS) is located in the south east of greater Melbourne. The geographic coverage of the station’s supply area spans from Blackburn in the north to Noble Park in the south and from Wantirna South in the east to Riversdale in the west. The electricity supply network for this large region is split between United Energy (UE) and CitiPower (CP).
Background
SVTS was augmented with a new 150 MVA 220/66 kV transformer in 2006 to reinforce the security and reliability of supply for customers in the area. The station now has four 150 MVA 220/66 kV transformers and operates in a split bus arrangement. Under system normal conditions the No.1 & No.2 transformers (B1 & B2) are operated in parallel as one group (SVTS1266) and supply the No.1 & No.2 buses. The No.3 & No.4 transformers (B3 & B4) are operated in parallel as a separate group (SVTS3466) and supply the No.3 & No.4 buses. Connection between No.1 & No.4 buses is maintained via transfer buses No.5 & No.6. The 66 kV bus 2-3 and bus 4-5 tie circuit breakers are operated normally open to limit the fault levels on the 66 kV buses to within switchgear ratings. For an unplanned outage of any one of the four transformers, 66 kV bus 2-3 and bus 4-5 tie circuit breakers will close automatically and maintain the station in a 3-transformer closed loop arrangement. Given this configuration, the demand on the station will therefore need to be controlled as follows:
• Load demand on the SVTS1266 group should be kept within the capabilities of the two transformers B1 & B2 at all times.
• Load demand on the SVTS3466 group should be kept within the capabilities of the two transformers B3 & B4 at all times.
• Load demand on the total station should be kept within the capabilities of any three transformers when one transformer is out of service.
SVTS 66 kV is a summer critical terminal station. The station reached its highest recorded peak demand of 478 MW (491 MVA) in summer 2009 under extreme weather conditions. The peak demand in summer 2017 was 392.3 MW (399.3 MVA). Six embedded generation units (3 which operate only as a backup supply) over 1 MW are connected at SVTS 66 kV.1
The magnitude, probability and load at risk for the two transformer groups are considered below.
SVTS 1266 (B12) Bus Group Summer Peak Forecasts
This bus group supplies Noble Park, Springvale South, Clarinda, Oakleigh East, Springvale and Springvale West zone substations owned by United Energy. Four generation units over 1 MW are connected at SVTS 1266 (B12) bus group.1
The recorded peak demand in summer 2017 for the SVTS 1266 group was 201.3 MW (206.6 MVA). The load at SVTS 1266 (B12) is forecast to have a power factor of 0.976 at times of peak demand.
United Energy’s new Keysborough zone substation was commissioned in 2014. Approximately 15 MW of demand was transferred away from SVTS to HTS. This load transfer is reflected in the graph below.
1 The maximum demand forecasts adopted in this risk analysis exclude the impact of generation schemes.
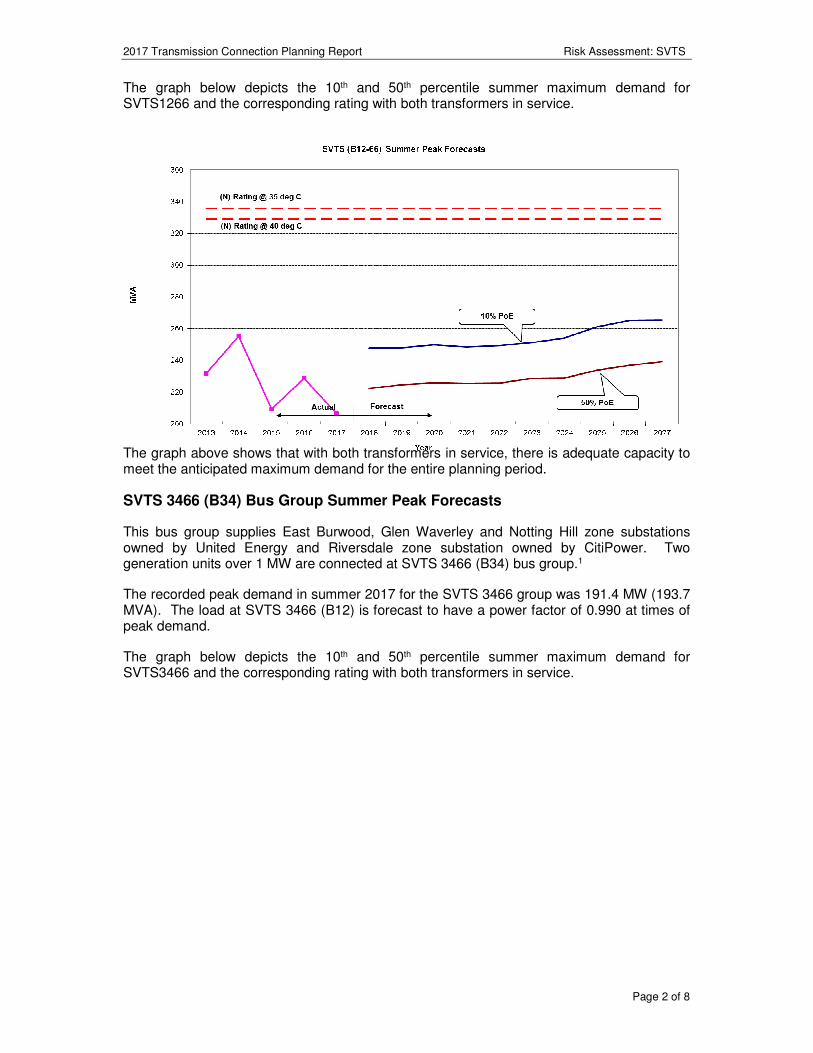
2017 Transmission Connection Planning Report Risk Assessment: SVTS
Page 2 of 8
The graph below depicts the 10th and 50th percentile summer maximum demand for SVTS1266 and the corresponding rating with both transformers in service.
The graph above shows that with both transformers in service, there is adequate capacity to meet the anticipated maximum demand for the entire planning period.
SVTS 3466 (B34) Bus Group Summer Peak Forecasts
This bus group supplies East Burwood, Glen Waverley and Notting Hill zone substations owned by United Energy and Riversdale zone substation owned by CitiPower. Two generation units over 1 MW are connected at SVTS 3466 (B34) bus group.1
The recorded peak demand in summer 2017 for the SVTS 3466 group was 191.4 MW (193.7 MVA). The load at SVTS 3466 (B12) is forecast to have a power factor of 0.990 at times of peak demand.
The graph below depicts the 10th and 50th percentile summer maximum demand for SVTS3466 and the corresponding rating with both transformers in service.
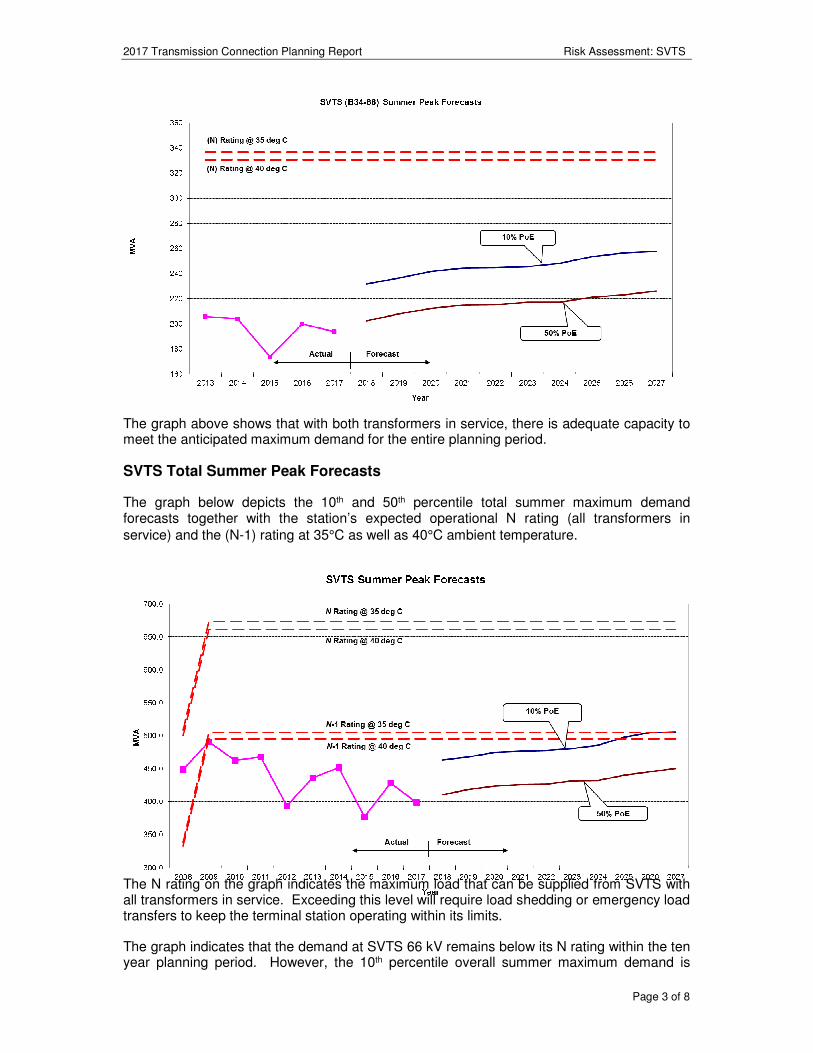
2017 Transmission Connection Planning Report Risk Assessment: SVTS
Page 3 of 8
The graph above shows that with both transformers in service, there is adequate capacity to meet the anticipated maximum demand for the entire planning period.
SVTS Total Summer Peak Forecasts
The graph below depicts the 10th and 50th percentile total summer maximum demand forecasts together with the station’s expected operational N rating (all transformers in service) and the (N-1) rating at 35°C as well as 40°C ambient temperature.
The N rating on the graph indicates the maximum load that can be supplied from SVTS with all transformers in service. Exceeding this level will require load shedding or emergency load transfers to keep the terminal station operating within its limits.
The graph indicates that the demand at SVTS 66 kV remains below its N rating within the ten year planning period. However, the 10th percentile overall summer maximum demand is
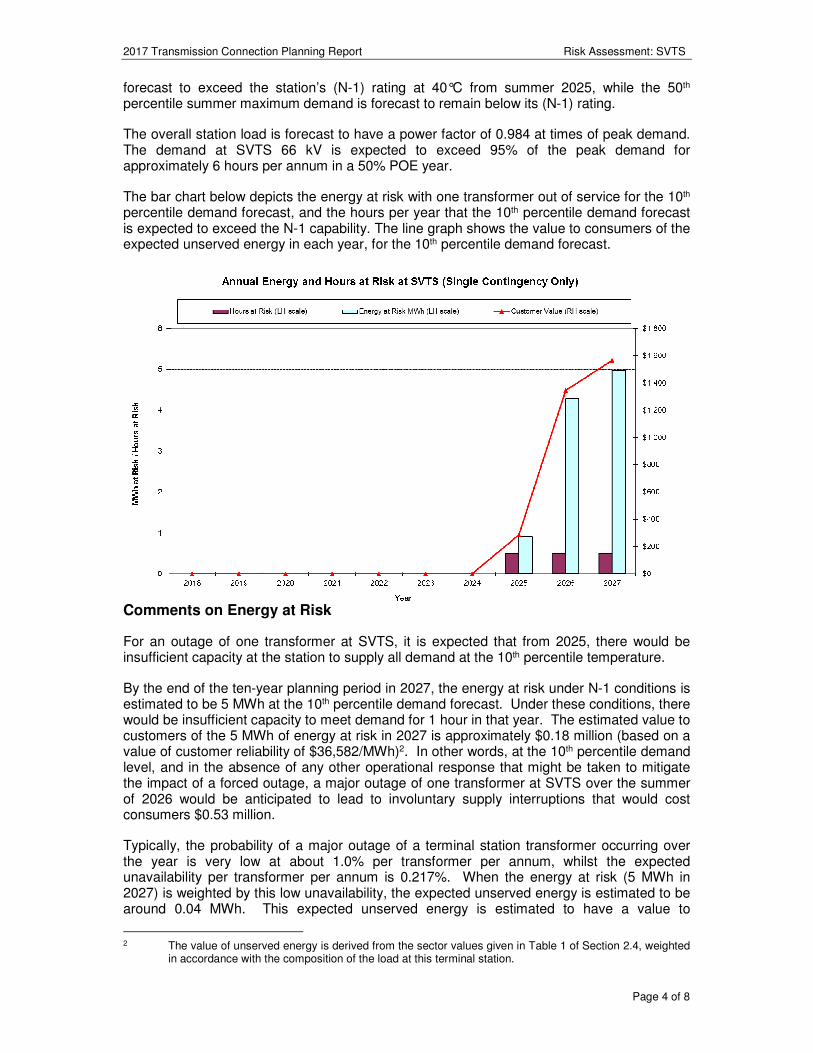
2017 Transmission Connection Planning Report Risk Assessment: SVTS
Page 4 of 8
forecast to exceed the station’s (N-1) rating at 40°C from summer 2025, while the 50th percentile summer maximum demand is forecast to remain below its (N-1) rating.
The overall station load is forecast to have a power factor of 0.984 at times of peak demand. The demand at SVTS 66 kV is expected to exceed 95% of the peak demand for approximately 6 hours per annum in a 50% POE year.
The bar chart below depicts the energy at risk with one transformer out of service for the 10th percentile demand forecast, and the hours per year that the 10th percentile demand forecast is expected to exceed the N-1 capability. The line graph shows the value to consumers of the expected unserved energy in each year, for the 10th percentile demand forecast.
Comments on Energy at Risk
For an outage of one transformer at SVTS, it is expected that from 2025, there would be insufficient capacity at the station to supply all demand at the 10th percentile temperature.
By the end of the ten-year planning period in 2027, the energy at risk under N-1 conditions is estimated to be 5 MWh at the 10th percentile demand forecast. Under these conditions, there would be insufficient capacity to meet demand for 1 hour in that year. The estimated value to customers of the 5 MWh of energy at risk in 2027 is approximately $0.18 million (based on a value of customer reliability of $36,582/MWh)2. In other words, at the 10th percentile demand level, and in the absence of any other operational response that might be taken to mitigate the impact of a forced outage, a major outage of one transformer at SVTS over the summer of 2026 would be anticipated to lead to involuntary supply interruptions that would cost consumers $0.53 million.
Typically, the probability of a major outage of a terminal station transformer occurring over the year is very low at about 1.0% per transformer per annum, whilst the expected unavailability per transformer per annum is 0.217%. When the energy at risk (5 MWh in 2027) is weighted by this low unavailability, the expected unserved energy is estimated to be around 0.04 MWh. This expected unserved energy is estimated to have a value to
2 The value of unserved energy is derived from the sector values given in Table 1 of Section 2.4, weighted
in accordance with the composition of the load at this terminal station.
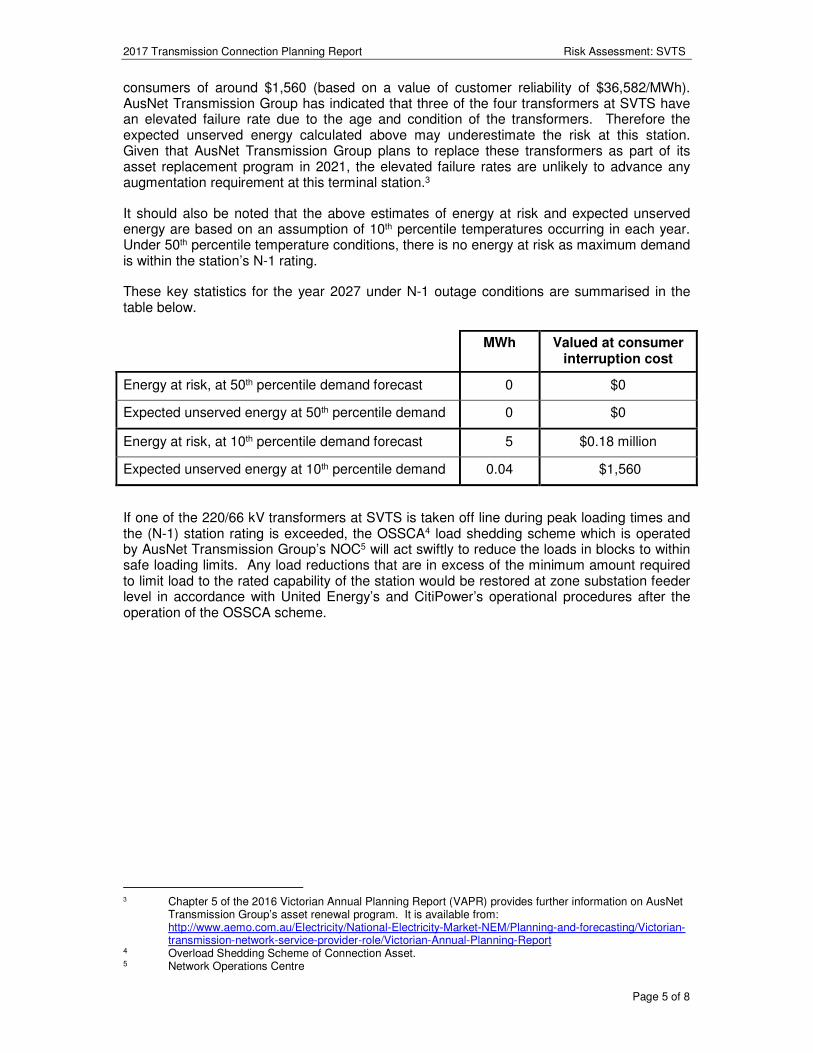
2017 Transmission Connection Planning Report Risk Assessment: SVTS
Page 5 of 8
consumers of around $1,560 (based on a value of customer reliability of $36,582/MWh). AusNet Transmission Group has indicated that three of the four transformers at SVTS have an elevated failure rate due to the age and condition of the transformers. Therefore the expected unserved energy calculated above may underestimate the risk at this station. Given that AusNet Transmission Group plans to replace these transformers as part of its asset replacement program in 2021, the elevated failure rates are unlikely to advance any augmentation requirement at this terminal station.3
It should also be noted that the above estimates of energy at risk and expected unserved energy are based on an assumption of 10th percentile temperatures occurring in each year. Under 50th percentile temperature conditions, there is no energy at risk as maximum demand is within the station’s N-1 rating.
These key statistics for the year 2027 under N-1 outage conditions are summarised in the table below.
MWh Valued at consumer interruption cost
Energy at risk, at 50th percentile demand forecast 0 $0
Expected unserved energy at 50th percentile demand 0 $0
Energy at risk, at 10th percentile demand forecast 5 $0.18 million
Expected unserved energy at 10th percentile demand 0.04 $1,560
If one of the 220/66 kV transformers at SVTS is taken off line during peak loading times and the (N-1) station rating is exceeded, the OSSCA4 load shedding scheme which is operated by AusNet Transmission Group’s NOC5 will act swiftly to reduce the loads in blocks to within safe loading limits. Any load reductions that are in excess of the minimum amount required to limit load to the rated capability of the station would be restored at zone substation feeder level in accordance with United Energy’s and CitiPower’s operational procedures after the operation of the OSSCA scheme.
3 Chapter 5 of the 2016 Victorian Annual Planning Report (VAPR) provides further information on AusNet
Transmission Group’s asset renewal program. It is available from: http://www.aemo.com.au/Electricity/National-Electricity-Market-NEM/Planning-and-forecasting/Victorian-transmission-network-service-provider-role/Victorian-Annual-Planning-Report
4 Overload Shedding Scheme of Connection Asset. 5 Network Operations Centre
2017 Transmission Connection Planning Report Risk Assessment: SVTS
Page 6 of 8
Feasible options for alleviation of constraints
The following options are technically feasible and potentially economic to mitigate the risk of supply interruption and/or to alleviate the emerging constraint:
1. Implement a contingency plan to transfer load to adjacent terminal stations. Both United Energy and CitiPower have established and implemented the necessary plans that enable load transfers under contingency conditions via the 66 kV subtransmission and/or the high voltage 22 kV and 11 kV distribution networks. These plans are reviewed annually prior to the summer season. The total transfer capability away from SVTS 66 kV onto adjacent terminal stations via distribution network is assessed at 70 MVA for summer 2018.
2. Establish a new 220/66 kV terminal station (DNTS) in the Dandenong area to off-load SVTS.
In early 2012 United Energy submitted a preliminary connection enquiry to AEMO for the establishment of a new connection point in the Dandenong area. Joint planning activities have been underway between the two organisations to quantify the risk of the emerging constraints in the area and to assess viable options for alleviating the constraints. The investigations to date have identified that the need is driven mainly by load-at-risk associated with the 220kV line constraints in the area. This assessment identified the timing requirement for a new Dandenong Terminal Station (DNTS) to be before summer 2027 with associated sub-transmission works carried out to transfer load from zone substations in the vicinity to the new connection point.
The capital cost of installing a new 220/66 kV terminal station in Dandenong is estimated to be in excess of $70 million. The estimated total annual cost of this network augmentation is approximately $7 million.
Since this study was completed there has been a reduction in the maximum demand forecast at Heatherton Terminal Station (HTS) and SVTS and so the new terminal station is not likely to be economically justified within the ten year planning horizon. Further analysis, including a Regulatory Investment Test for Transmission will be undertaken at a later time to determine the preferred option for addressing the constraints, but at this stage a new 220/66 kV terminal station in Dandenong is the planned network option to address the emerging constraints. United Energy will continue to work with AEMO on this joint planning exercise.
3. Install a third 225 MVA 220/66 kV transformer at Malvern terminal station (MTS) to off-load SVTS.
4. Install a fifth 150 MVA 220/66 kV transformer at SVTS.
5. Replace three of the four SVTS ‘B’ transformers in 2021, as part of AusNet Transmission Group’s asset replacement programme. AusNet Transmission Group intends to replace the existing transformers with like-for-like transformers. AusNet Transmission Group has indicated that the station’s (N-1) rating is expected to be similar to (or marginally higher than) the current level.
2017 Transmission Connection Planning Report Risk Assessment: SVTS
Page 7 of 8
Preferred network option(s) for alleviation of constraints
1. Implement the following temporary measures to cater for an unplanned outage of one transformer at SVTS under critical loading conditions:
• maintain contingency plans to transfer load quickly to adjacent terminal stations;
• fine-tune the OSSCA scheme settings in conjunction with TOC to minimise the impact on customers of any automatic load shedding that may take place; and
• subject to the availability of an AusNet Transmission Group’s spare 220/66 kV transformer for metropolitan areas (refer to Section 4.5), this spare transformer can be used to temporarily replace the failed transformer.
2. Replace three of the four SVTS ‘B’ transformers in 2021, as part of AusNet Transmission Group’s asset replacement program.
3. Establish a new 220/66 kV terminal station in the Dandenong area to off-load SVTS.
On the present forecasts, establishment of a new terminal station in the Dandenong area is unlikely to be economically justified within the ten year planning horizon, but may be economically viable shortly after.
The table on the following page provides more detailed data on the station rating, demand forecasts, energy at risk and expected unserved energy.
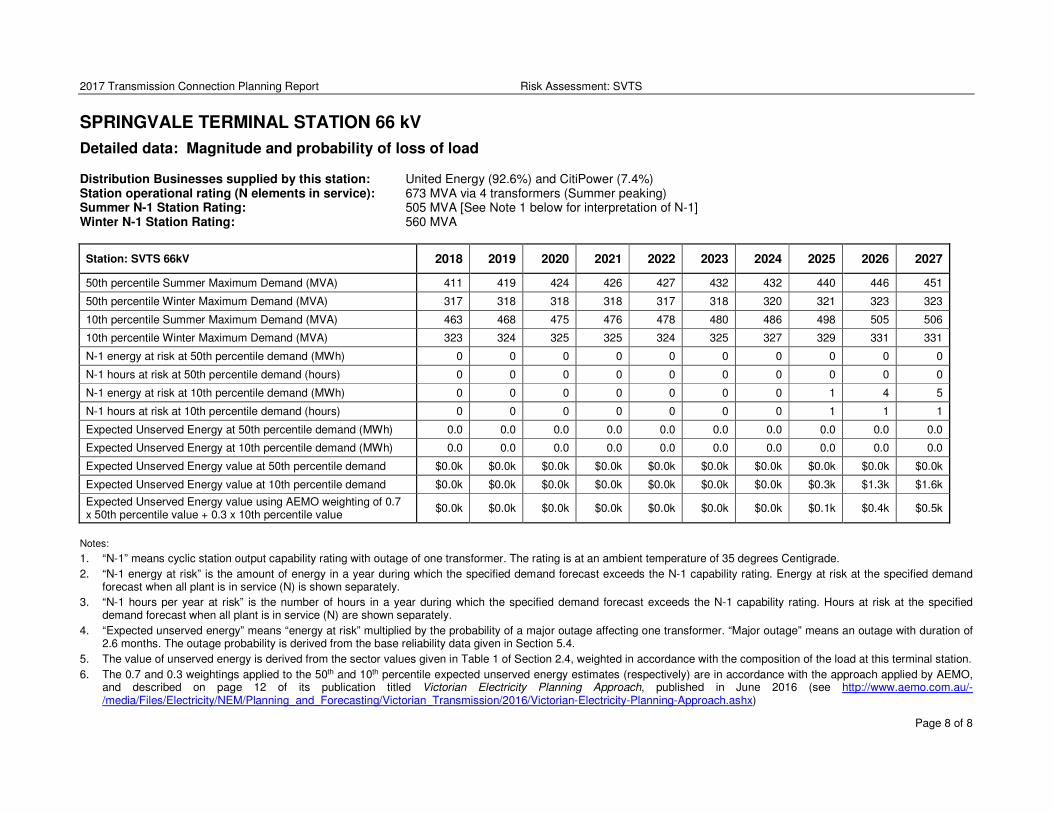
2017 Transmission Connection Planning Report Risk Assessment: SVTS
Page 8 of 8
SPRINGVALE TERMINAL STATION 66 kV
Detailed data: Magnitude and probability of loss of load
Distribution Businesses supplied by this station: United Energy (92.6%) and CitiPower (7.4%) Station operational rating (N elements in service): 673 MVA via 4 transformers (Summer peaking) Summer N-1 Station Rating: 505 MVA [See Note 1 below for interpretation of N-1] Winter N-1 Station Rating: 560 MVA
Station: SVTS 66kV 2018 2019 2020 2021 2022 2023 2024 2025 2026 2027
50th percentile Summer Maximum Demand (MVA) 411 419 424 426 427 432 432 440 446 451
50th percentile Winter Maximum Demand (MVA) 317 318 318 318 317 318 320 321 323 323
10th percentile Summer Maximum Demand (MVA) 463 468 475 476 478 480 486 498 505 506
10th percentile Winter Maximum Demand (MVA) 323 324 325 325 324 325 327 329 331 331
N-1 energy at risk at 50th percentile demand (MWh) 0 0 0 0 0 0 0 0 0 0
N-1 hours at risk at 50th percentile demand (hours) 0 0 0 0 0 0 0 0 0 0
N-1 energy at risk at 10th percentile demand (MWh) 0 0 0 0 0 0 0 1 4 5
N-1 hours at risk at 10th percentile demand (hours) 0 0 0 0 0 0 0 1 1 1
Expected Unserved Energy at 50th percentile demand (MWh) 0.0 0.0 0.0 0.0 0.0 0.0 0.0 0.0 0.0 0.0
Expected Unserved Energy at 10th percentile demand (MWh) 0.0 0.0 0.0 0.0 0.0 0.0 0.0 0.0 0.0 0.0
Expected Unserved Energy value at 50th percentile demand $0.0k $0.0k $0.0k $0.0k $0.0k $0.0k $0.0k $0.0k $0.0k $0.0k
Expected Unserved Energy value at 10th percentile demand $0.0k $0.0k $0.0k $0.0k $0.0k $0.0k $0.0k $0.3k $1.3k $1.6k
Expected Unserved Energy value using AEMO weighting of 0.7 x 50th percentile value + 0.3 x 10th percentile value
$0.0k $0.0k $0.0k $0.0k $0.0k $0.0k $0.0k $0.1k $0.4k $0.5k
Notes:
1. “N-1” means cyclic station output capability rating with outage of one transformer. The rating is at an ambient temperature of 35 degrees Centigrade.
2. “N-1 energy at risk” is the amount of energy in a year during which the specified demand forecast exceeds the N-1 capability rating. Energy at risk at the specified demand forecast when all plant is in service (N) is shown separately.
3. “N-1 hours per year at risk” is the number of hours in a year during which the specified demand forecast exceeds the N-1 capability rating. Hours at risk at the specified demand forecast when all plant is in service (N) are shown separately.
4. “Expected unserved energy” means “energy at risk” multiplied by the probability of a major outage affecting one transformer. “Major outage” means an outage with duration of 2.6 months. The outage probability is derived from the base reliability data given in Section 5.4.
5. The value of unserved energy is derived from the sector values given in Table 1 of Section 2.4, weighted in accordance with the composition of the load at this terminal station.
6. The 0.7 and 0.3 weightings applied to the 50th and 10th percentile expected unserved energy estimates (respectively) are in accordance with the approach applied by AEMO, and described on page 12 of its publication titled Victorian Electricity Planning Approach, published in June 2016 (see http://www.aemo.com.au/-/media/Files/Electricity/NEM/Planning_and_Forecasting/Victorian_Transmission/2016/Victorian-Electricity-Planning-Approach.ashx)
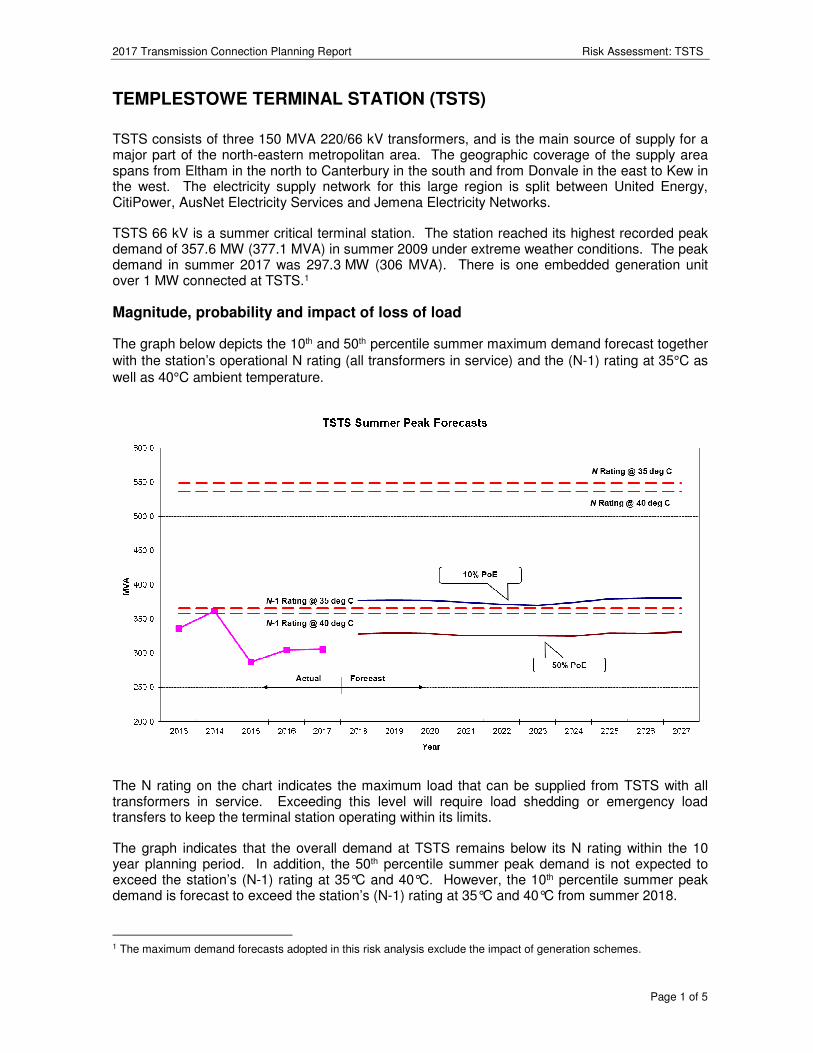
2017 Transmission Connection Planning Report Risk Assessment: TSTS
Page 1 of 5
TEMPLESTOWE TERMINAL STATION (TSTS)
TSTS consists of three 150 MVA 220/66 kV transformers, and is the main source of supply for a major part of the north-eastern metropolitan area. The geographic coverage of the supply area spans from Eltham in the north to Canterbury in the south and from Donvale in the east to Kew in the west. The electricity supply network for this large region is split between United Energy, CitiPower, AusNet Electricity Services and Jemena Electricity Networks.
TSTS 66 kV is a summer critical terminal station. The station reached its highest recorded peak demand of 357.6 MW (377.1 MVA) in summer 2009 under extreme weather conditions. The peak demand in summer 2017 was 297.3 MW (306 MVA). There is one embedded generation unit over 1 MW connected at TSTS.1
Magnitude, probability and impact of loss of load
The graph below depicts the 10th and 50th percentile summer maximum demand forecast together with the station’s operational N rating (all transformers in service) and the (N-1) rating at 35°C as well as 40°C ambient temperature.
The N rating on the chart indicates the maximum load that can be supplied from TSTS with all transformers in service. Exceeding this level will require load shedding or emergency load transfers to keep the terminal station operating within its limits.
The graph indicates that the overall demand at TSTS remains below its N rating within the 10 year planning period. In addition, the 50th percentile summer peak demand is not expected to exceed the station’s (N-1) rating at 35°C and 40°C. However, the 10th percentile summer peak demand is forecast to exceed the station’s (N-1) rating at 35°C and 40°C from summer 2018.
1 The maximum demand forecasts adopted in this risk analysis exclude the impact of generation schemes.
2017 Transmission Connection Planning Report Risk Assessment: TSTS
Page 2 of 5
The demand at TSTS 66 kV is expected to exceed 95% of the peak demand for approximately 3 hours per annum in a 50% POE year. The station load has a power factor of 0.973 at times of peak demand.
Comments on Energy at Risk
The below table indicates that for an outage of one transformer at TSTS, it is expected that there would be sufficient capacity at the station to supply all demand at the 50th percentile temperature.
However, for an outage of one transformer at TSTS, it is expected that from summer 2018, there would be insufficient capacity at the station to supply all demand at the 10th percentile temperature. By the end of the ten-year planning period in 2027, the energy at risk under N-1 conditions is 24 MWh at the 10th percentile demand forecast. Under these conditions, there would be insufficient capacity to meet demand for 2 hours in that year. The estimated value to customers of the 24 MWh of energy at risk in 2027 is approximately $0.81 million (based on a value of customer reliability of $33,688/MWh)2. In other words, at the 10th percentile demand level, and in the absence of any other operational response that might be taken to mitigate the impact of a forced outage, a major outage of one transformer at TSTS over the summer of 2027 would be anticipated to lead to involuntary supply interruptions that would cost consumers $0.81 million.
It is emphasised however, that the probability of a major outage of one of the three transformers occurring over the year is very low at about 1.0% per transformer per annum, whilst the expected unavailability per transformer per annum is 0.217%. When the energy at risk (24 MWh in 2027) is weighted by this low unavailability, the expected unserved energy is estimated to be around 0.2 MWh. This expected unserved energy is estimated to have a value to consumers of around $5,200 (based on a value of customer reliability of $33,688/MWh). AusNet Transmission Group indicated that two of the three transformers at TSTS have failure rates that are above average due to condition. Therefore, the expected unserved energy calculated above may under-estimate the risk at this station. AusNet Transmission Group is evaluating the economic feasibility of replacing both or only one of the two transformers, and will initiate an asset replacement project in 2018/2019 to address the asset failure risk. Given that AusNet Transmission Group plans to replace at least one of the transformers as part of its asset replacement programme, the elevated failure rates are unlikely to advance any augmentation requirements at this terminal station.3
These key statistics for the year 2027 under N-1 outage conditions are summarised in the table below.
2 The value of unserved energy is derived from the sector values given in Table 1 of Section 2.4, weighted in
accordance with the composition of the load at this terminal station. 3 Chapter 5 of the 2016 Victorian Annual Planning Report provides further details of AusNet Transmission
Group’s asset renewal program. It is available from: http://www.aemo.com.au/Electricity/National-Electricity-Market-NEM/Planning-and-forecasting/Victorian-transmission-network-service-provider-role/Victorian-Annual-Planning-Report
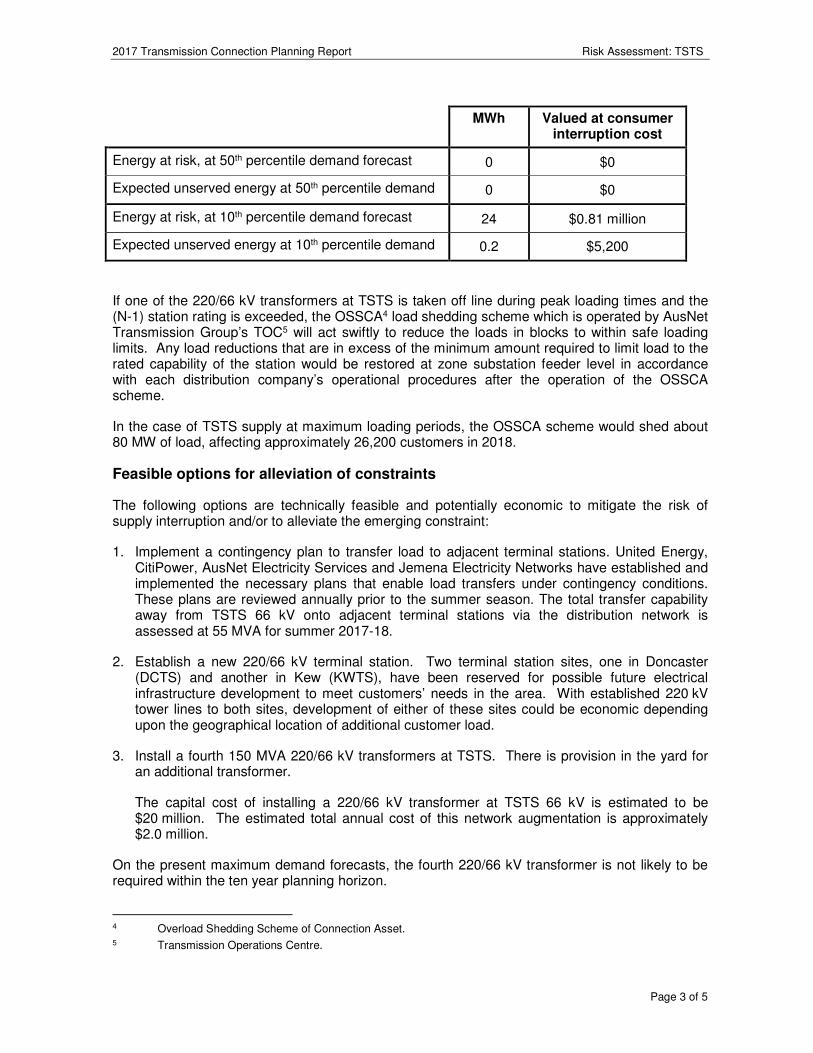
2017 Transmission Connection Planning Report Risk Assessment: TSTS
Page 3 of 5
MWh Valued at consumer interruption cost
Energy at risk, at 50th percentile demand forecast 0 $0
Expected unserved energy at 50th percentile demand 0 $0
Energy at risk, at 10th percentile demand forecast 24 $0.81 million
Expected unserved energy at 10th percentile demand 0.2 $5,200
If one of the 220/66 kV transformers at TSTS is taken off line during peak loading times and the (N-1) station rating is exceeded, the OSSCA4 load shedding scheme which is operated by AusNet Transmission Group’s TOC5 will act swiftly to reduce the loads in blocks to within safe loading limits. Any load reductions that are in excess of the minimum amount required to limit load to the rated capability of the station would be restored at zone substation feeder level in accordance with each distribution company’s operational procedures after the operation of the OSSCA scheme.
In the case of TSTS supply at maximum loading periods, the OSSCA scheme would shed about 80 MW of load, affecting approximately 26,200 customers in 2018.
Feasible options for alleviation of constraints
The following options are technically feasible and potentially economic to mitigate the risk of supply interruption and/or to alleviate the emerging constraint:
1. Implement a contingency plan to transfer load to adjacent terminal stations. United Energy, CitiPower, AusNet Electricity Services and Jemena Electricity Networks have established and implemented the necessary plans that enable load transfers under contingency conditions. These plans are reviewed annually prior to the summer season. The total transfer capability away from TSTS 66 kV onto adjacent terminal stations via the distribution network is assessed at 55 MVA for summer 2017-18.
2. Establish a new 220/66 kV terminal station. Two terminal station sites, one in Doncaster (DCTS) and another in Kew (KWTS), have been reserved for possible future electrical infrastructure development to meet customers’ needs in the area. With established 220 kV tower lines to both sites, development of either of these sites could be economic depending upon the geographical location of additional customer load.
3. Install a fourth 150 MVA 220/66 kV transformers at TSTS. There is provision in the yard for an additional transformer.
The capital cost of installing a 220/66 kV transformer at TSTS 66 kV is estimated to be $20 million. The estimated total annual cost of this network augmentation is approximately $2.0 million.
On the present maximum demand forecasts, the fourth 220/66 kV transformer is not likely to be required within the ten year planning horizon.
4 Overload Shedding Scheme of Connection Asset. 5 Transmission Operations Centre.
2017 Transmission Connection Planning Report Risk Assessment: TSTS
Page 4 of 5
Preferred network option(s) for alleviation of constraints
1. Implement the following temporary measures to cater for an unplanned outage of one transformer at TSTS under critical loading conditions:
• maintain contingency plans to transfer load quickly to adjacent terminal stations;
• fine-tune the OSSCA scheme settings in conjunction with TOC to minimise the impact on customers of any load shedding that may take place; and
• subject to the availability of AusNet Transmission Group’s spare 220/66 kV transformer for metropolitan areas (refer to Section 4.5), this spare transformer can be used to temporarily replace the failed transformer.
2. Install a fourth 150 MVA 220/66 kV transformers at TSTS.
In the absence of any commitment by interested parties to offer network support services by installing local generation or through demand side management initiatives that would reduce load at TSTS, it is proposed to install a fourth 220/66 kV transformer at TSTS. On the present forecasts, an additional 220/66 kV transformer is unlikely to be economic within the ten year planning horizon.
The table on the following page provides more detailed data on the station rating, demand forecasts, energy at risk and expected unserved energy.
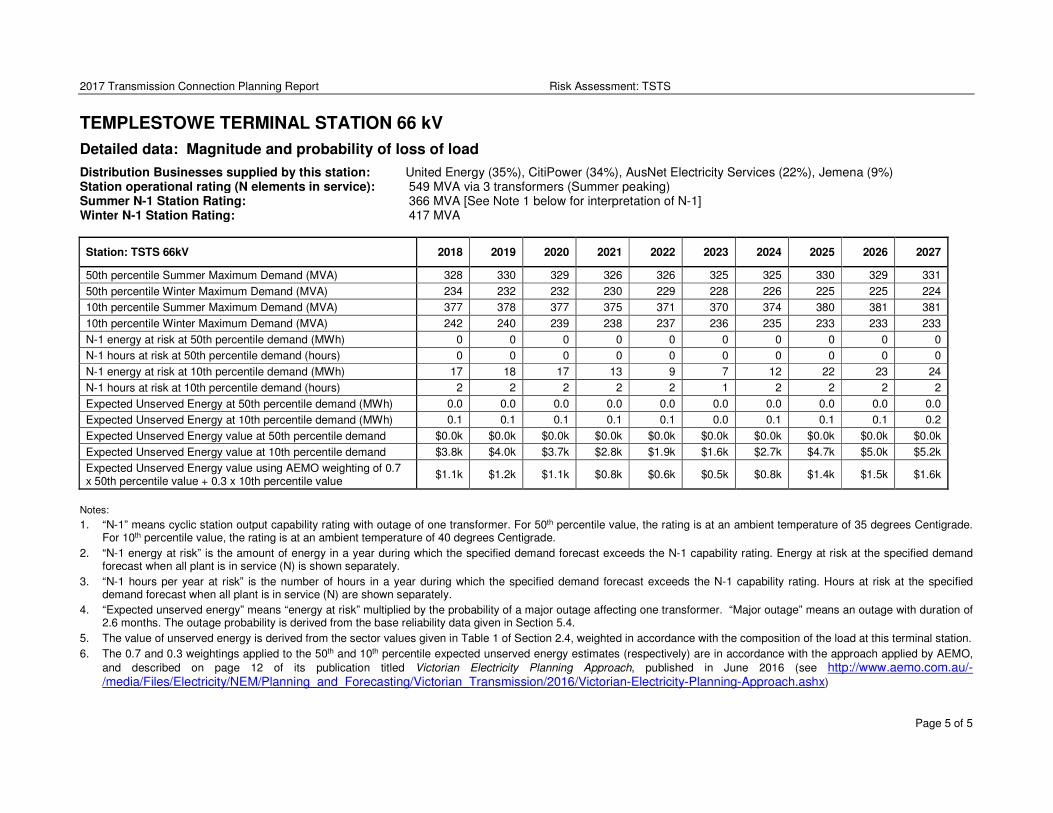
2017 Transmission Connection Planning Report Risk Assessment: TSTS
Page 5 of 5
TEMPLESTOWE TERMINAL STATION 66 kV
Detailed data: Magnitude and probability of loss of load
Distribution Businesses supplied by this station: United Energy (35%), CitiPower (34%), AusNet Electricity Services (22%), Jemena (9%) Station operational rating (N elements in service): 549 MVA via 3 transformers (Summer peaking) Summer N-1 Station Rating: 366 MVA [See Note 1 below for interpretation of N-1] Winter N-1 Station Rating: 417 MVA
Station: TSTS 66kV 2018 2019 2020 2021 2022 2023 2024 2025 2026 2027
50th percentile Summer Maximum Demand (MVA) 328 330 329 326 326 325 325 330 329 331
50th percentile Winter Maximum Demand (MVA) 234 232 232 230 229 228 226 225 225 224
10th percentile Summer Maximum Demand (MVA) 377 378 377 375 371 370 374 380 381 381
10th percentile Winter Maximum Demand (MVA) 242 240 239 238 237 236 235 233 233 233
N-1 energy at risk at 50th percentile demand (MWh) 0 0 0 0 0 0 0 0 0 0
N-1 hours at risk at 50th percentile demand (hours) 0 0 0 0 0 0 0 0 0 0
N-1 energy at risk at 10th percentile demand (MWh) 17 18 17 13 9 7 12 22 23 24
N-1 hours at risk at 10th percentile demand (hours) 2 2 2 2 2 1 2 2 2 2
Expected Unserved Energy at 50th percentile demand (MWh) 0.0 0.0 0.0 0.0 0.0 0.0 0.0 0.0 0.0 0.0
Expected Unserved Energy at 10th percentile demand (MWh) 0.1 0.1 0.1 0.1 0.1 0.0 0.1 0.1 0.1 0.2
Expected Unserved Energy value at 50th percentile demand $0.0k $0.0k $0.0k $0.0k $0.0k $0.0k $0.0k $0.0k $0.0k $0.0k
Expected Unserved Energy value at 10th percentile demand $3.8k $4.0k $3.7k $2.8k $1.9k $1.6k $2.7k $4.7k $5.0k $5.2k
Expected Unserved Energy value using AEMO weighting of 0.7 x 50th percentile value + 0.3 x 10th percentile value
$1.1k $1.2k $1.1k $0.8k $0.6k $0.5k $0.8k $1.4k $1.5k $1.6k
Notes:
1. “N-1” means cyclic station output capability rating with outage of one transformer. For 50th percentile value, the rating is at an ambient temperature of 35 degrees Centigrade. For 10th percentile value, the rating is at an ambient temperature of 40 degrees Centigrade.
2. “N-1 energy at risk” is the amount of energy in a year during which the specified demand forecast exceeds the N-1 capability rating. Energy at risk at the specified demand forecast when all plant is in service (N) is shown separately.
3. “N-1 hours per year at risk” is the number of hours in a year during which the specified demand forecast exceeds the N-1 capability rating. Hours at risk at the specified demand forecast when all plant is in service (N) are shown separately.
4. “Expected unserved energy” means “energy at risk” multiplied by the probability of a major outage affecting one transformer. “Major outage” means an outage with duration of 2.6 months. The outage probability is derived from the base reliability data given in Section 5.4.
5. The value of unserved energy is derived from the sector values given in Table 1 of Section 2.4, weighted in accordance with the composition of the load at this terminal station.
6. The 0.7 and 0.3 weightings applied to the 50th and 10th percentile expected unserved energy estimates (respectively) are in accordance with the approach applied by AEMO,
and described on page 12 of its publication titled Victorian Electricity Planning Approach, published in June 2016 (see http://www.aemo.com.au/-/media/Files/Electricity/NEM/Planning_and_Forecasting/Victorian_Transmission/2016/Victorian-Electricity-Planning-Approach.ashx)
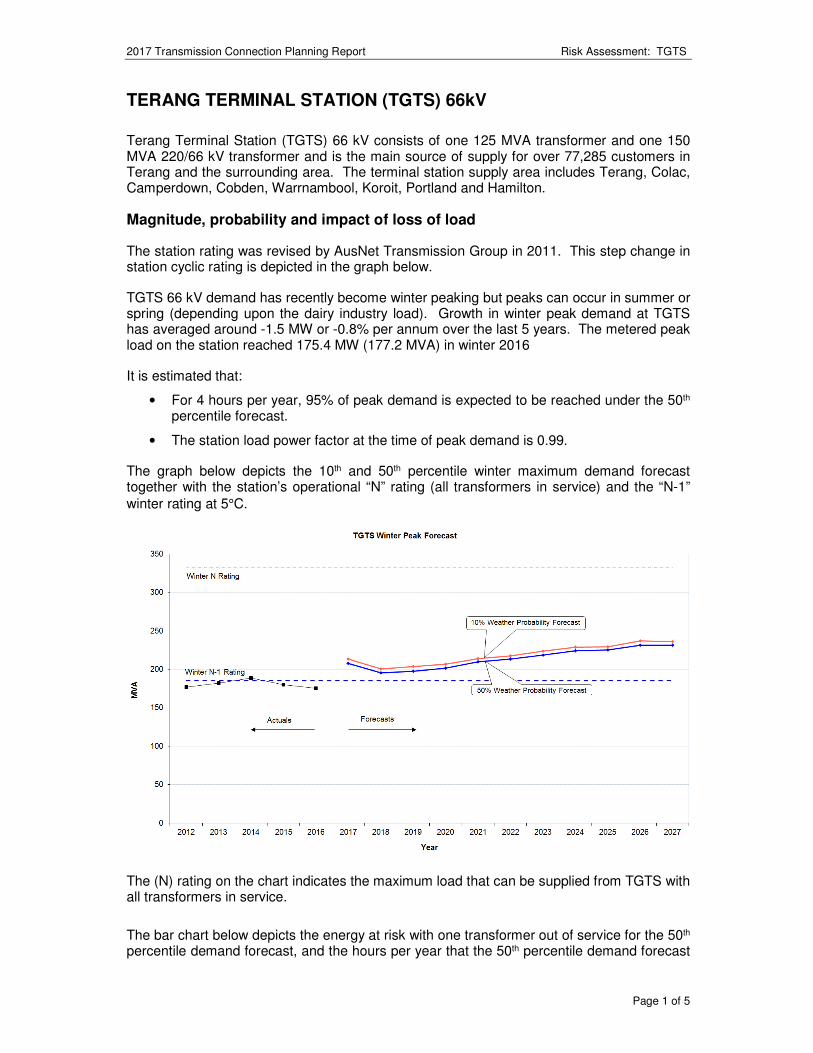
2017 Transmission Connection Planning Report Risk Assessment: TGTS
Page 1 of 5
TERANG TERMINAL STATION (TGTS) 66kV
Terang Terminal Station (TGTS) 66 kV consists of one 125 MVA transformer and one 150 MVA 220/66 kV transformer and is the main source of supply for over 77,285 customers in Terang and the surrounding area. The terminal station supply area includes Terang, Colac, Camperdown, Cobden, Warrnambool, Koroit, Portland and Hamilton.
Magnitude, probability and impact of loss of load
The station rating was revised by AusNet Transmission Group in 2011. This step change in station cyclic rating is depicted in the graph below.
TGTS 66 kV demand has recently become winter peaking but peaks can occur in summer or spring (depending upon the dairy industry load). Growth in winter peak demand at TGTS has averaged around -1.5 MW or -0.8% per annum over the last 5 years. The metered peak load on the station reached 175.4 MW (177.2 MVA) in winter 2016
It is estimated that:
• For 4 hours per year, 95% of peak demand is expected to be reached under the 50th percentile forecast.
• The station load power factor at the time of peak demand is 0.99.
The graph below depicts the 10th and 50th percentile winter maximum demand forecast together with the station’s operational “N” rating (all transformers in service) and the “N-1” winter rating at 5°C.
The (N) rating on the chart indicates the maximum load that can be supplied from TGTS with all transformers in service.
The bar chart below depicts the energy at risk with one transformer out of service for the 50th percentile demand forecast, and the hours per year that the 50th percentile demand forecast
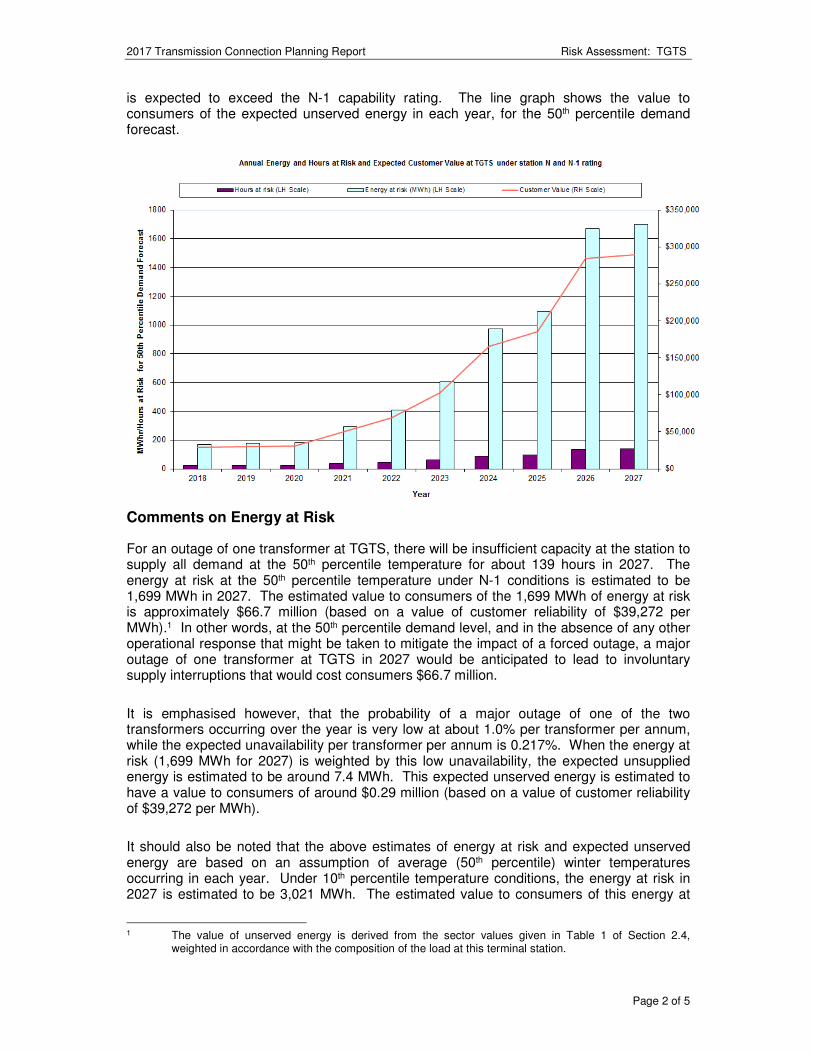
2017 Transmission Connection Planning Report Risk Assessment: TGTS
Page 2 of 5
is expected to exceed the N-1 capability rating. The line graph shows the value to consumers of the expected unserved energy in each year, for the 50th percentile demand forecast.
Comments on Energy at Risk
For an outage of one transformer at TGTS, there will be insufficient capacity at the station to supply all demand at the 50th percentile temperature for about 139 hours in 2027. The energy at risk at the 50th percentile temperature under N-1 conditions is estimated to be 1,699 MWh in 2027. The estimated value to consumers of the 1,699 MWh of energy at risk is approximately $66.7 million (based on a value of customer reliability of $39,272 per MWh).1 In other words, at the 50th percentile demand level, and in the absence of any other operational response that might be taken to mitigate the impact of a forced outage, a major outage of one transformer at TGTS in 2027 would be anticipated to lead to involuntary supply interruptions that would cost consumers $66.7 million.
It is emphasised however, that the probability of a major outage of one of the two transformers occurring over the year is very low at about 1.0% per transformer per annum, while the expected unavailability per transformer per annum is 0.217%. When the energy at risk (1,699 MWh for 2027) is weighted by this low unavailability, the expected unsupplied energy is estimated to be around 7.4 MWh. This expected unserved energy is estimated to have a value to consumers of around $0.29 million (based on a value of customer reliability of $39,272 per MWh).
It should also be noted that the above estimates of energy at risk and expected unserved energy are based on an assumption of average (50th percentile) winter temperatures occurring in each year. Under 10th percentile temperature conditions, the energy at risk in 2027 is estimated to be 3,021 MWh. The estimated value to consumers of this energy at
1 The value of unserved energy is derived from the sector values given in Table 1 of Section 2.4,
weighted in accordance with the composition of the load at this terminal station.
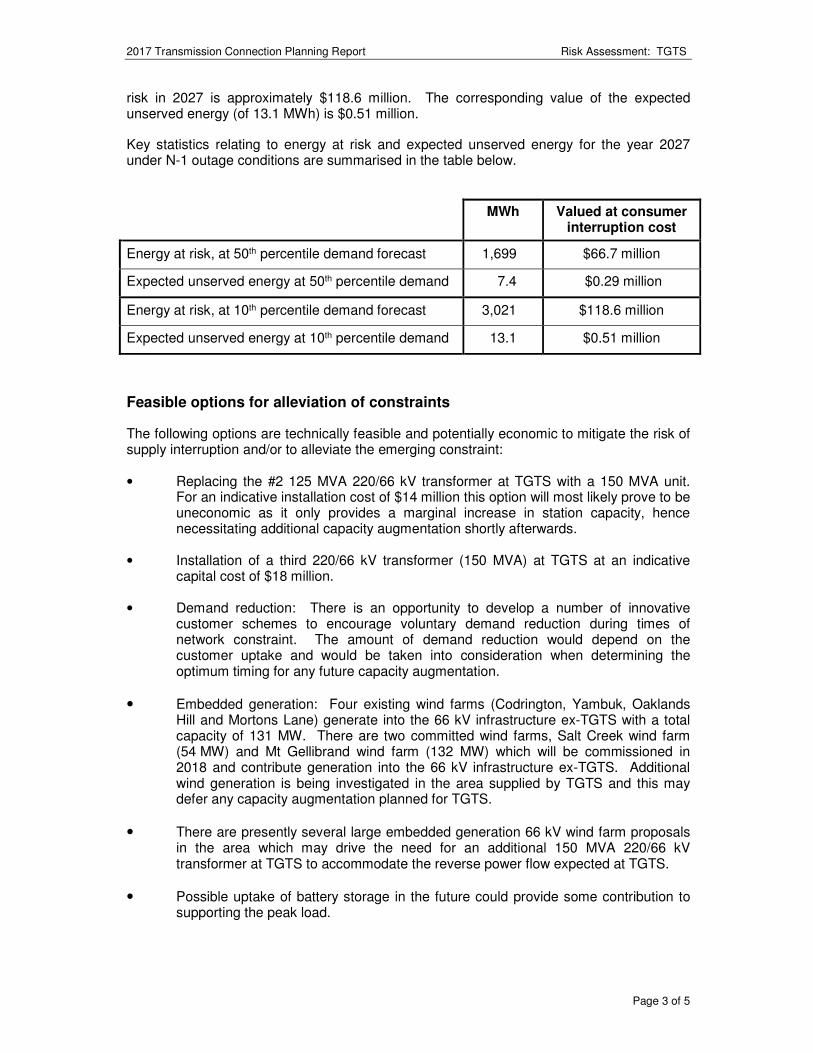
2017 Transmission Connection Planning Report Risk Assessment: TGTS
Page 3 of 5
risk in 2027 is approximately $118.6 million. The corresponding value of the expected unserved energy (of 13.1 MWh) is $0.51 million.
Key statistics relating to energy at risk and expected unserved energy for the year 2027 under N-1 outage conditions are summarised in the table below.
MWh Valued at consumer interruption cost
Energy at risk, at 50th percentile demand forecast 1,699 $66.7 million
Expected unserved energy at 50th percentile demand 7.4 $0.29 million
Energy at risk, at 10th percentile demand forecast 3,021 $118.6 million
Expected unserved energy at 10th percentile demand 13.1 $0.51 million
Feasible options for alleviation of constraints
The following options are technically feasible and potentially economic to mitigate the risk of supply interruption and/or to alleviate the emerging constraint:
• Replacing the #2 125 MVA 220/66 kV transformer at TGTS with a 150 MVA unit. For an indicative installation cost of $14 million this option will most likely prove to be uneconomic as it only provides a marginal increase in station capacity, hence necessitating additional capacity augmentation shortly afterwards.
• Installation of a third 220/66 kV transformer (150 MVA) at TGTS at an indicative capital cost of $18 million.
• Demand reduction: There is an opportunity to develop a number of innovative customer schemes to encourage voluntary demand reduction during times of network constraint. The amount of demand reduction would depend on the customer uptake and would be taken into consideration when determining the optimum timing for any future capacity augmentation.
• Embedded generation: Four existing wind farms (Codrington, Yambuk, Oaklands Hill and Mortons Lane) generate into the 66 kV infrastructure ex-TGTS with a total capacity of 131 MW. There are two committed wind farms, Salt Creek wind farm (54 MW) and Mt Gellibrand wind farm (132 MW) which will be commissioned in 2018 and contribute generation into the 66 kV infrastructure ex-TGTS. Additional wind generation is being investigated in the area supplied by TGTS and this may defer any capacity augmentation planned for TGTS.
• There are presently several large embedded generation 66 kV wind farm proposals in the area which may drive the need for an additional 150 MVA 220/66 kV transformer at TGTS to accommodate the reverse power flow expected at TGTS.
• Possible uptake of battery storage in the future could provide some contribution to supporting the peak load.
2017 Transmission Connection Planning Report Risk Assessment: TGTS
Page 4 of 5
Preferred option(s) for alleviation of constraints
In the absence of any commitment by interested parties to offer network support services by installing local generation or through demand side management initiatives that would reduce load at TGTS, it is proposed to:
1. Install a third 220/66 kV transformer (150 MVA) at TGTS at an indicative capital cost of $18 million. This equates to a total annual cost of approximately $1.8 million per annum. On the basis of the medium economic growth scenario and both 50th and 10th percentile weather probability, the transformer would not be expected to be required before 2027 to support the critical peak demand.
2. As a temporary measure, maintain contingency plans to transfer load quickly to the Geelong Terminal Station (GTS) by the use of the 66 kV tie lines between TGTS and GTS in the event of an unplanned outage of one transformer at TGTS under critical loading conditions. This load transfer is in the order of 15 MVA. Under these temporary measures, affected customers would be supplied from the 66 kV tie line infrastructure on a radial network, thereby reducing their level of reliability.
3. Subject to the availability of an AusNet Transmission Group’s spare 220/66 kV transformer for rural areas (refer Section 5.5), this spare transformer can be used to temporarily replace a failed transformer to minimise the transformer outage period.
The table on the following page provides more detailed data on the station rating, demand forecasts, energy at risk and expected unserved energy.
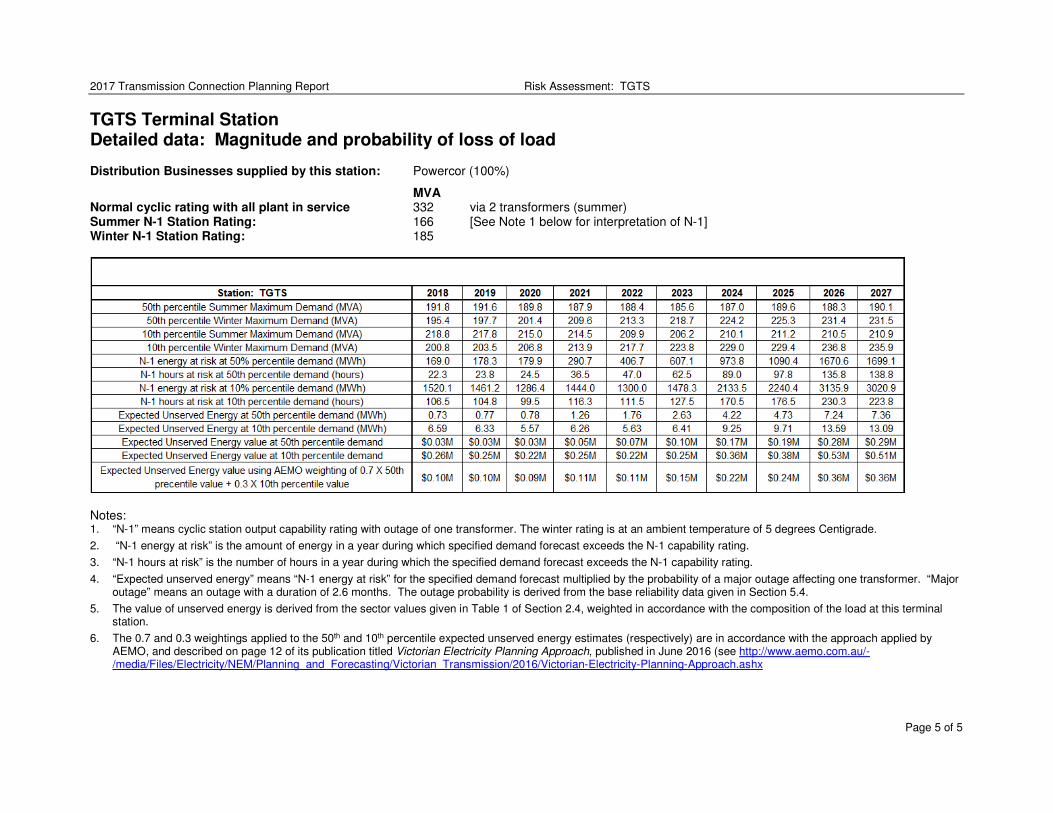
2017 Transmission Connection Planning Report Risk Assessment: TGTS
Page 5 of 5
TGTS Terminal Station
Detailed data: Magnitude and probability of loss of load Distribution Businesses supplied by this station: Powercor (100%)
MVA Normal cyclic rating with all plant in service 332 via 2 transformers (summer) Summer N-1 Station Rating: 166 [See Note 1 below for interpretation of N-1] Winter N-1 Station Rating: 185
Notes: 1. “N-1” means cyclic station output capability rating with outage of one transformer. The winter rating is at an ambient temperature of 5 degrees Centigrade.
2. “N-1 energy at risk” is the amount of energy in a year during which specified demand forecast exceeds the N-1 capability rating.
3. “N-1 hours at risk” is the number of hours in a year during which the specified demand forecast exceeds the N-1 capability rating.
4. “Expected unserved energy” means “N-1 energy at risk” for the specified demand forecast multiplied by the probability of a major outage affecting one transformer. “Major outage” means an outage with a duration of 2.6 months. The outage probability is derived from the base reliability data given in Section 5.4.
5. The value of unserved energy is derived from the sector values given in Table 1 of Section 2.4, weighted in accordance with the composition of the load at this terminal station.
6. The 0.7 and 0.3 weightings applied to the 50th and 10th percentile expected unserved energy estimates (respectively) are in accordance with the approach applied by AEMO, and described on page 12 of its publication titled Victorian Electricity Planning Approach, published in June 2016 (see http://www.aemo.com.au/-/media/Files/Electricity/NEM/Planning_and_Forecasting/Victorian_Transmission/2016/Victorian-Electricity-Planning-Approach.ashx
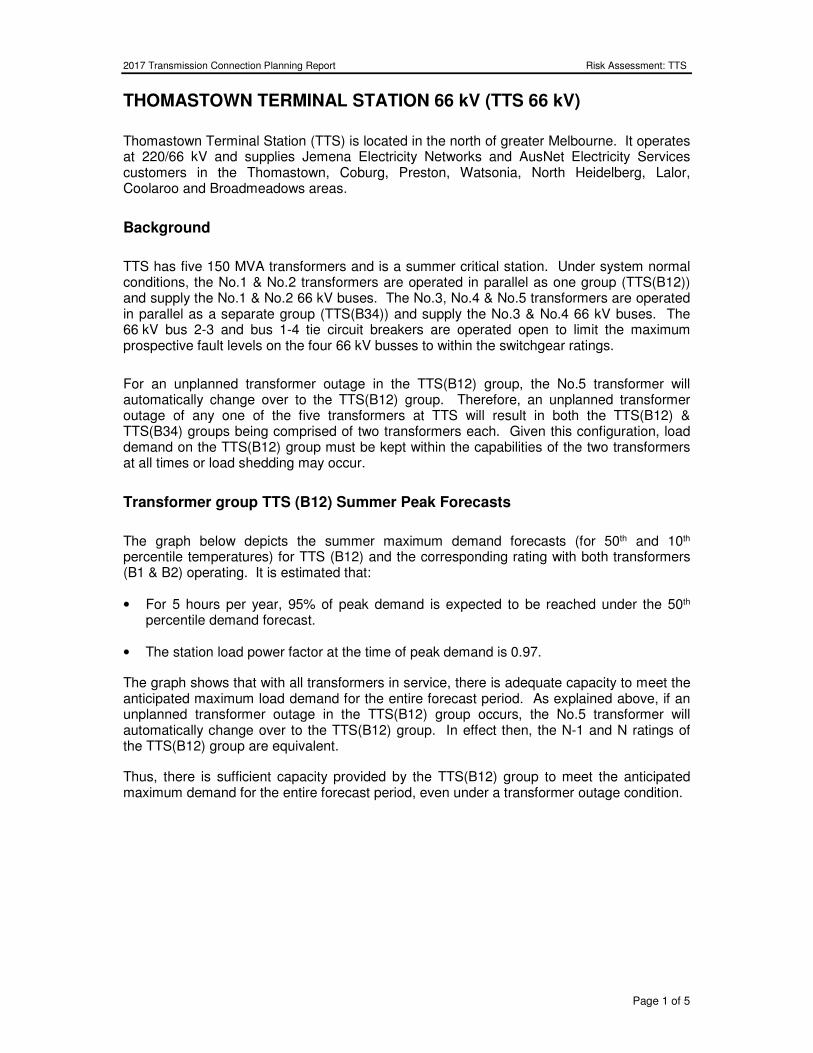
2017 Transmission Connection Planning Report Risk Assessment: TTS
Page 1 of 5
THOMASTOWN TERMINAL STATION 66 kV (TTS 66 kV)
Thomastown Terminal Station (TTS) is located in the north of greater Melbourne. It operates at 220/66 kV and supplies Jemena Electricity Networks and AusNet Electricity Services customers in the Thomastown, Coburg, Preston, Watsonia, North Heidelberg, Lalor, Coolaroo and Broadmeadows areas.
Background
TTS has five 150 MVA transformers and is a summer critical station. Under system normal conditions, the No.1 & No.2 transformers are operated in parallel as one group (TTS(B12)) and supply the No.1 & No.2 66 kV buses. The No.3, No.4 & No.5 transformers are operated in parallel as a separate group (TTS(B34)) and supply the No.3 & No.4 66 kV buses. The 66 kV bus 2-3 and bus 1-4 tie circuit breakers are operated open to limit the maximum prospective fault levels on the four 66 kV busses to within the switchgear ratings.
For an unplanned transformer outage in the TTS(B12) group, the No.5 transformer will automatically change over to the TTS(B12) group. Therefore, an unplanned transformer outage of any one of the five transformers at TTS will result in both the TTS(B12) & TTS(B34) groups being comprised of two transformers each. Given this configuration, load demand on the TTS(B12) group must be kept within the capabilities of the two transformers at all times or load shedding may occur.
Transformer group TTS (B12) Summer Peak Forecasts
The graph below depicts the summer maximum demand forecasts (for 50th and 10th percentile temperatures) for TTS (B12) and the corresponding rating with both transformers (B1 & B2) operating. It is estimated that:
• For 5 hours per year, 95% of peak demand is expected to be reached under the 50th percentile demand forecast.
• The station load power factor at the time of peak demand is 0.97.
The graph shows that with all transformers in service, there is adequate capacity to meet the anticipated maximum load demand for the entire forecast period. As explained above, if an unplanned transformer outage in the TTS(B12) group occurs, the No.5 transformer will automatically change over to the TTS(B12) group. In effect then, the N-1 and N ratings of the TTS(B12) group are equivalent.
Thus, there is sufficient capacity provided by the TTS(B12) group to meet the anticipated maximum demand for the entire forecast period, even under a transformer outage condition.
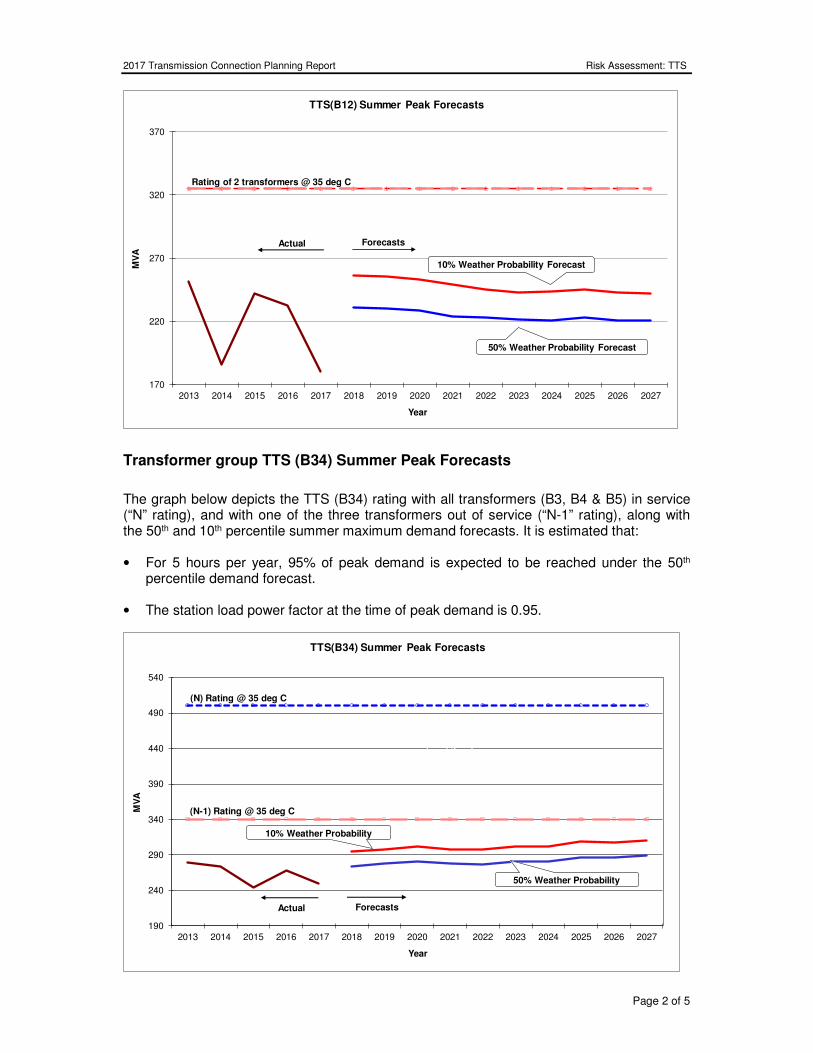
2017 Transmission Connection Planning Report Risk Assessment: TTS
Page 2 of 5
170
220
270
320
370
2013 2014 2015 2016 2017 2018 2019 2020 2021 2022 2023 2024 2025 2026 2027
MV
A
Year
TTS(B12) Summer Peak Forecasts
50% Weather Probability Forecast
10% Weather Probability Forecast
Actual Forecasts
(N) Rating @ 35 deg C with B5 normally
Rating of 2 transformers @ 35 deg C
Transformer group TTS (B34) Summer Peak Forecasts
The graph below depicts the TTS (B34) rating with all transformers (B3, B4 & B5) in service (“N” rating), and with one of the three transformers out of service (“N-1” rating), along with the 50th and 10th percentile summer maximum demand forecasts. It is estimated that:
• For 5 hours per year, 95% of peak demand is expected to be reached under the 50th percentile demand forecast.
• The station load power factor at the time of peak demand is 0.95.
190
240
290
340
390
440
490
540
2013 2014 2015 2016 2017 2018 2019 2020 2021 2022 2023 2024 2025 2026 2027
MV
A
Year
TTS(B34) Summer Peak Forecasts
50% Weather Probability
10% Weather Probability
Actual Forecasts
(N-1) Rating @ 35 deg C
(N) Rating @ 35 deg C
(N) and (N-1) Ratings @ 35 deg C from 2015 onwards, with B5 normally
connected to TTS(B12) group???

2017 Transmission Connection Planning Report Risk Assessment: TTS
Page 3 of 5
The above graph shows that there is adequate capacity to meet the anticipated maximum load demand for the entire forecast period.
Hence, the need for augmentation of transmission connection assets at TTS 66 kV is not expected to arise over the next ten years.
The tables on the following pages provide more detailed data on the station rating and demand forecasts.
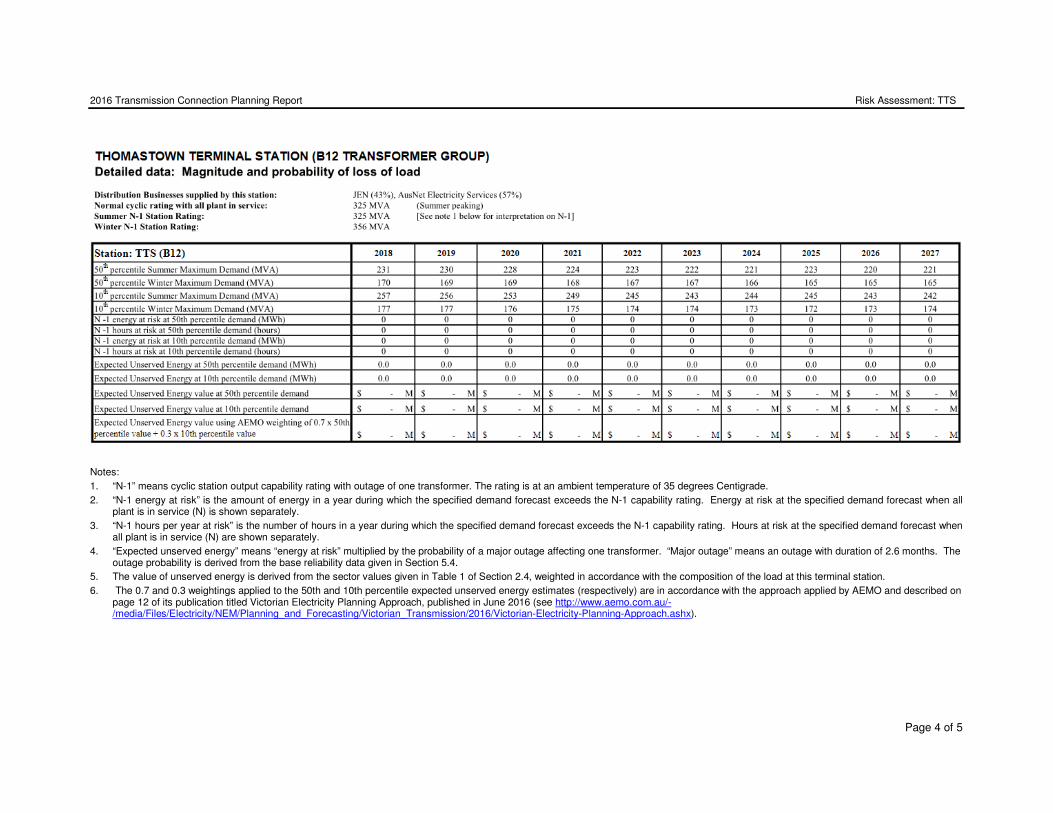
2016 Transmission Connection Planning Report Risk Assessment: TTS
Page 4 of 5
Notes:
1. “N-1” means cyclic station output capability rating with outage of one transformer. The rating is at an ambient temperature of 35 degrees Centigrade.
2. “N-1 energy at risk” is the amount of energy in a year during which the specified demand forecast exceeds the N-1 capability rating. Energy at risk at the specified demand forecast when all plant is in service (N) is shown separately.
3. “N-1 hours per year at risk” is the number of hours in a year during which the specified demand forecast exceeds the N-1 capability rating. Hours at risk at the specified demand forecast when all plant is in service (N) are shown separately.
4. “Expected unserved energy” means “energy at risk” multiplied by the probability of a major outage affecting one transformer. “Major outage” means an outage with duration of 2.6 months. The outage probability is derived from the base reliability data given in Section 5.4.
5. The value of unserved energy is derived from the sector values given in Table 1 of Section 2.4, weighted in accordance with the composition of the load at this terminal station.
6. The 0.7 and 0.3 weightings applied to the 50th and 10th percentile expected unserved energy estimates (respectively) are in accordance with the approach applied by AEMO and described on page 12 of its publication titled Victorian Electricity Planning Approach, published in June 2016 (see http://www.aemo.com.au/-/media/Files/Electricity/NEM/Planning_and_Forecasting/Victorian_Transmission/2016/Victorian-Electricity-Planning-Approach.ashx).
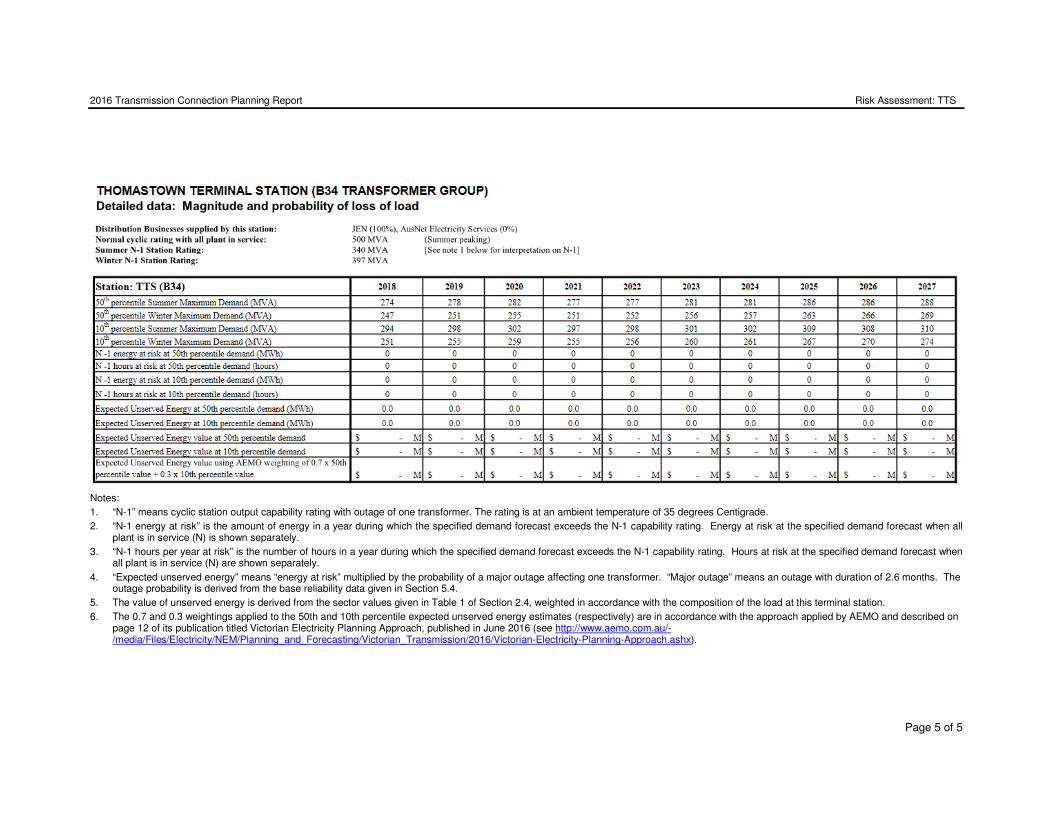
2016 Transmission Connection Planning Report Risk Assessment: TTS
Page 5 of 5
Notes:
1. “N-1” means cyclic station output capability rating with outage of one transformer. The rating is at an ambient temperature of 35 degrees Centigrade.
2. “N-1 energy at risk” is the amount of energy in a year during which the specified demand forecast exceeds the N-1 capability rating. Energy at risk at the specified demand forecast when all plant is in service (N) is shown separately.
3. “N-1 hours per year at risk” is the number of hours in a year during which the specified demand forecast exceeds the N-1 capability rating. Hours at risk at the specified demand forecast when all plant is in service (N) are shown separately.
4. “Expected unserved energy” means “energy at risk” multiplied by the probability of a major outage affecting one transformer. “Major outage” means an outage with duration of 2.6 months. The outage probability is derived from the base reliability data given in Section 5.4.
5. The value of unserved energy is derived from the sector values given in Table 1 of Section 2.4, weighted in accordance with the composition of the load at this terminal station.
6. The 0.7 and 0.3 weightings applied to the 50th and 10th percentile expected unserved energy estimates (respectively) are in accordance with the approach applied by AEMO and described on page 12 of its publication titled Victorian Electricity Planning Approach, published in June 2016 (see http://www.aemo.com.au/-/media/Files/Electricity/NEM/Planning_and_Forecasting/Victorian_Transmission/2016/Victorian-Electricity-Planning-Approach.ashx).
2017 Transmission Connection Planning Report Risk Assessment: TBTS
Page 1 of 4
TYABB TERMINAL STATION (TBTS)
TBTS consists of three 150 MVA 220/66 kV transformers, and is the main source of supply for over 115,000 customers on the Mornington Peninsula. The geographic coverage of the area spans from Frankston South in the north to Portsea in the south.
TBTS 66 kV is a summer critical station. Summer peak demand at TBTS generally occurs on days of high ambient temperature during the summer holiday period (from mid-December to the end of January). Given the peak demand at TBTS is directly related to air-conditioning use during the summer holiday period along the costal belt of the Mornington Peninsula , the peak is very sensitive to the maximum ambient temperature at this time. The station reached 269.6 MW (279 MVA) in summer 2016-17, which was 11.5 MW lower than the 2015-16 maximum demand. For TBTS the historic peak demand of 283.4 MW (298.0 MVA) was recorded on 29 January 2009. There are two embedded generation units over 1 MW connected at TBTS. 1
Due to increasing risk at TBTS, a Regulatory Test was undertaken in 2011, which identified the installation of a third 150 MVA 220/66 kV transformer as the most economic network solution. A new third transformer was installed at TBTS and commissioned in November 2013 as shown in the graph below.
Magnitude, probability and impact of loss of load
The graph below depicts the 10th and 50th percentile summer maximum demand forecast together with the station’s operational N rating (all transformers in service) and the N-1 rating at 35°C as well as 40°C ambient temperature.
The N rating on the chart below indicates the maximum load that can be supplied from TBTS with all transformers in service. Exceeding this level will initiate AusNet Transmission Group’s automatic load shedding scheme.
The graph indicates that the demand at TBTS remains below its N rating within the 10 year planning period. However, the 10th percentile summer maximum demand is forecast to exceed the station’s (N-1) rating at 40°C from summer 2026. The 50th percentile summer maximum demand is expected to remain within the (N-1) rating for the entire planning period.
The station load is forecast to have a power factor of 0.966 at times of peak demand. The demand at TBTS is expected to exceed 95% of peak demand for approximately 5 hours per annum under 50% POE conditions.
1 The maximum demand forecasts adopted in this risk analysis exclude the impact of generation schemes.
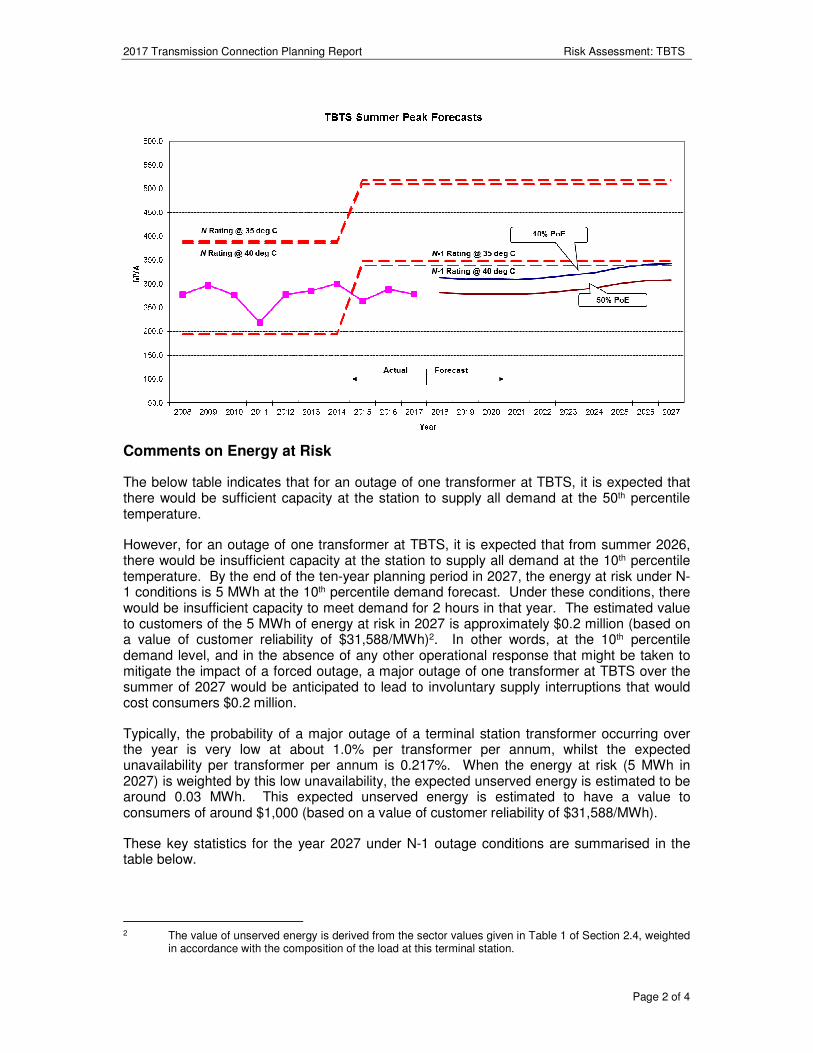
2017 Transmission Connection Planning Report Risk Assessment: TBTS
Page 2 of 4
Comments on Energy at Risk
The below table indicates that for an outage of one transformer at TBTS, it is expected that there would be sufficient capacity at the station to supply all demand at the 50th percentile temperature.
However, for an outage of one transformer at TBTS, it is expected that from summer 2026, there would be insufficient capacity at the station to supply all demand at the 10th percentile temperature. By the end of the ten-year planning period in 2027, the energy at risk under N-1 conditions is 5 MWh at the 10th percentile demand forecast. Under these conditions, there would be insufficient capacity to meet demand for 2 hours in that year. The estimated value to customers of the 5 MWh of energy at risk in 2027 is approximately $0.2 million (based on a value of customer reliability of $31,588/MWh)2. In other words, at the 10th percentile demand level, and in the absence of any other operational response that might be taken to mitigate the impact of a forced outage, a major outage of one transformer at TBTS over the summer of 2027 would be anticipated to lead to involuntary supply interruptions that would cost consumers $0.2 million.
Typically, the probability of a major outage of a terminal station transformer occurring over the year is very low at about 1.0% per transformer per annum, whilst the expected unavailability per transformer per annum is 0.217%. When the energy at risk (5 MWh in 2027) is weighted by this low unavailability, the expected unserved energy is estimated to be around 0.03 MWh. This expected unserved energy is estimated to have a value to consumers of around $1,000 (based on a value of customer reliability of $31,588/MWh).
These key statistics for the year 2027 under N-1 outage conditions are summarised in the table below.
2 The value of unserved energy is derived from the sector values given in Table 1 of Section 2.4, weighted
in accordance with the composition of the load at this terminal station.
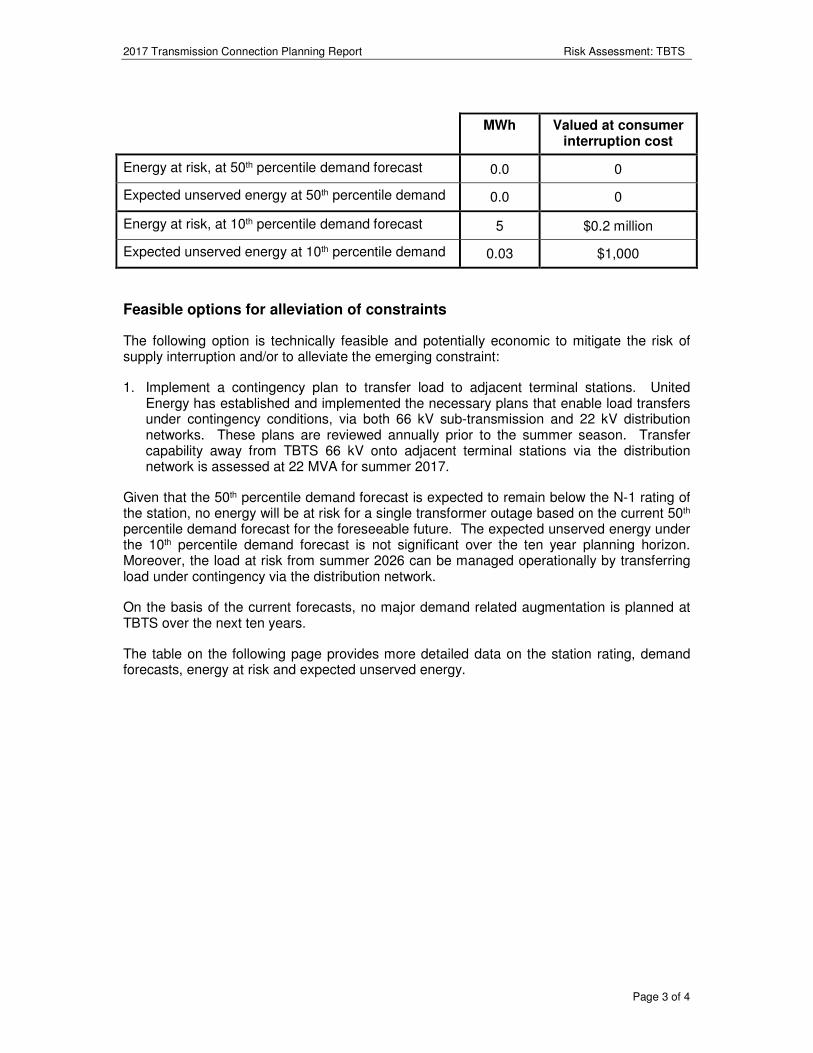
2017 Transmission Connection Planning Report Risk Assessment: TBTS
Page 3 of 4
MWh Valued at consumer interruption cost
Energy at risk, at 50th percentile demand forecast 0.0 0
Expected unserved energy at 50th percentile demand 0.0 0
Energy at risk, at 10th percentile demand forecast 5 $0.2 million
Expected unserved energy at 10th percentile demand 0.03 $1,000
Feasible options for alleviation of constraints
The following option is technically feasible and potentially economic to mitigate the risk of supply interruption and/or to alleviate the emerging constraint:
1. Implement a contingency plan to transfer load to adjacent terminal stations. United Energy has established and implemented the necessary plans that enable load transfers under contingency conditions, via both 66 kV sub-transmission and 22 kV distribution networks. These plans are reviewed annually prior to the summer season. Transfer capability away from TBTS 66 kV onto adjacent terminal stations via the distribution network is assessed at 22 MVA for summer 2017.
Given that the 50th percentile demand forecast is expected to remain below the N-1 rating of the station, no energy will be at risk for a single transformer outage based on the current 50th percentile demand forecast for the foreseeable future. The expected unserved energy under the 10th percentile demand forecast is not significant over the ten year planning horizon. Moreover, the load at risk from summer 2026 can be managed operationally by transferring load under contingency via the distribution network.
On the basis of the current forecasts, no major demand related augmentation is planned at TBTS over the next ten years.
The table on the following page provides more detailed data on the station rating, demand forecasts, energy at risk and expected unserved energy.
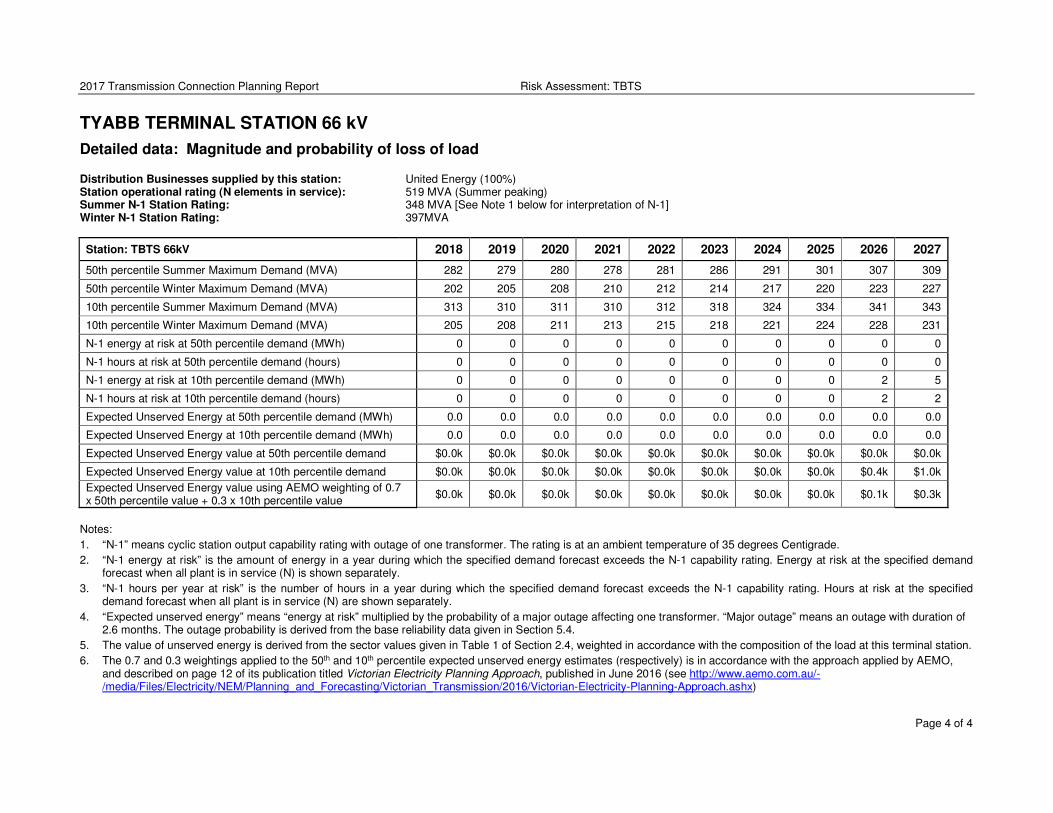
2017 Transmission Connection Planning Report Risk Assessment: TBTS
Page 4 of 4
TYABB TERMINAL STATION 66 kV
Detailed data: Magnitude and probability of loss of load
Distribution Businesses supplied by this station: United Energy (100%) Station operational rating (N elements in service): 519 MVA (Summer peaking) Summer N-1 Station Rating: 348 MVA [See Note 1 below for interpretation of N-1] Winter N-1 Station Rating: 397MVA
Station: TBTS 66kV 2018 2019 2020 2021 2022 2023 2024 2025 2026 2027
50th percentile Summer Maximum Demand (MVA) 282 279 280 278 281 286 291 301 307 309
50th percentile Winter Maximum Demand (MVA) 202 205 208 210 212 214 217 220 223 227
10th percentile Summer Maximum Demand (MVA) 313 310 311 310 312 318 324 334 341 343
10th percentile Winter Maximum Demand (MVA) 205 208 211 213 215 218 221 224 228 231
N-1 energy at risk at 50th percentile demand (MWh) 0 0 0 0 0 0 0 0 0 0
N-1 hours at risk at 50th percentile demand (hours) 0 0 0 0 0 0 0 0 0 0
N-1 energy at risk at 10th percentile demand (MWh) 0 0 0 0 0 0 0 0 2 5
N-1 hours at risk at 10th percentile demand (hours) 0 0 0 0 0 0 0 0 2 2
Expected Unserved Energy at 50th percentile demand (MWh) 0.0 0.0 0.0 0.0 0.0 0.0 0.0 0.0 0.0 0.0
Expected Unserved Energy at 10th percentile demand (MWh) 0.0 0.0 0.0 0.0 0.0 0.0 0.0 0.0 0.0 0.0
Expected Unserved Energy value at 50th percentile demand $0.0k $0.0k $0.0k $0.0k $0.0k $0.0k $0.0k $0.0k $0.0k $0.0k
Expected Unserved Energy value at 10th percentile demand $0.0k $0.0k $0.0k $0.0k $0.0k $0.0k $0.0k $0.0k $0.4k $1.0k
Expected Unserved Energy value using AEMO weighting of 0.7 x 50th percentile value + 0.3 x 10th percentile value
$0.0k $0.0k $0.0k $0.0k $0.0k $0.0k $0.0k $0.0k $0.1k $0.3k
Notes:
1. “N-1” means cyclic station output capability rating with outage of one transformer. The rating is at an ambient temperature of 35 degrees Centigrade.
2. “N-1 energy at risk” is the amount of energy in a year during which the specified demand forecast exceeds the N-1 capability rating. Energy at risk at the specified demand forecast when all plant is in service (N) is shown separately.
3. “N-1 hours per year at risk” is the number of hours in a year during which the specified demand forecast exceeds the N-1 capability rating. Hours at risk at the specified demand forecast when all plant is in service (N) are shown separately.
4. “Expected unserved energy” means “energy at risk” multiplied by the probability of a major outage affecting one transformer. “Major outage” means an outage with duration of 2.6 months. The outage probability is derived from the base reliability data given in Section 5.4.
5. The value of unserved energy is derived from the sector values given in Table 1 of Section 2.4, weighted in accordance with the composition of the load at this terminal station.
6. The 0.7 and 0.3 weightings applied to the 50th and 10th percentile expected unserved energy estimates (respectively) is in accordance with the approach applied by AEMO, and described on page 12 of its publication titled Victorian Electricity Planning Approach, published in June 2016 (see http://www.aemo.com.au/-/media/Files/Electricity/NEM/Planning_and_Forecasting/Victorian_Transmission/2016/Victorian-Electricity-Planning-Approach.ashx)
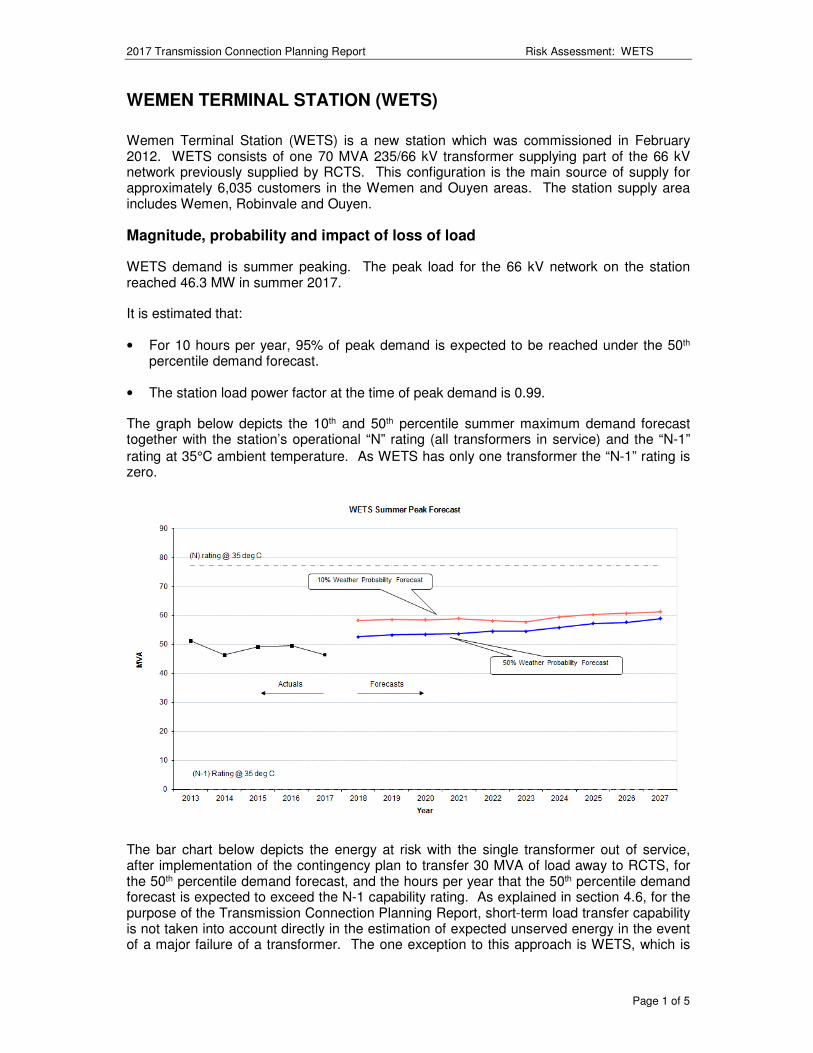
2017 Transmission Connection Planning Report Risk Assessment: WETS
Page 1 of 5
WEMEN TERMINAL STATION (WETS)
Wemen Terminal Station (WETS) is a new station which was commissioned in February 2012. WETS consists of one 70 MVA 235/66 kV transformer supplying part of the 66 kV network previously supplied by RCTS. This configuration is the main source of supply for approximately 6,035 customers in the Wemen and Ouyen areas. The station supply area includes Wemen, Robinvale and Ouyen.
Magnitude, probability and impact of loss of load
WETS demand is summer peaking. The peak load for the 66 kV network on the station reached 46.3 MW in summer 2017.
It is estimated that:
• For 10 hours per year, 95% of peak demand is expected to be reached under the 50th percentile demand forecast.
• The station load power factor at the time of peak demand is 0.99.
The graph below depicts the 10th and 50th percentile summer maximum demand forecast together with the station’s operational “N” rating (all transformers in service) and the “N-1”
rating at 35°C ambient temperature. As WETS has only one transformer the “N-1” rating is zero.
The bar chart below depicts the energy at risk with the single transformer out of service, after implementation of the contingency plan to transfer 30 MVA of load away to RCTS, for the 50th percentile demand forecast, and the hours per year that the 50th percentile demand forecast is expected to exceed the N-1 capability rating. As explained in section 4.6, for the purpose of the Transmission Connection Planning Report, short-term load transfer capability is not taken into account directly in the estimation of expected unserved energy in the event of a major failure of a transformer. The one exception to this approach is WETS, which is
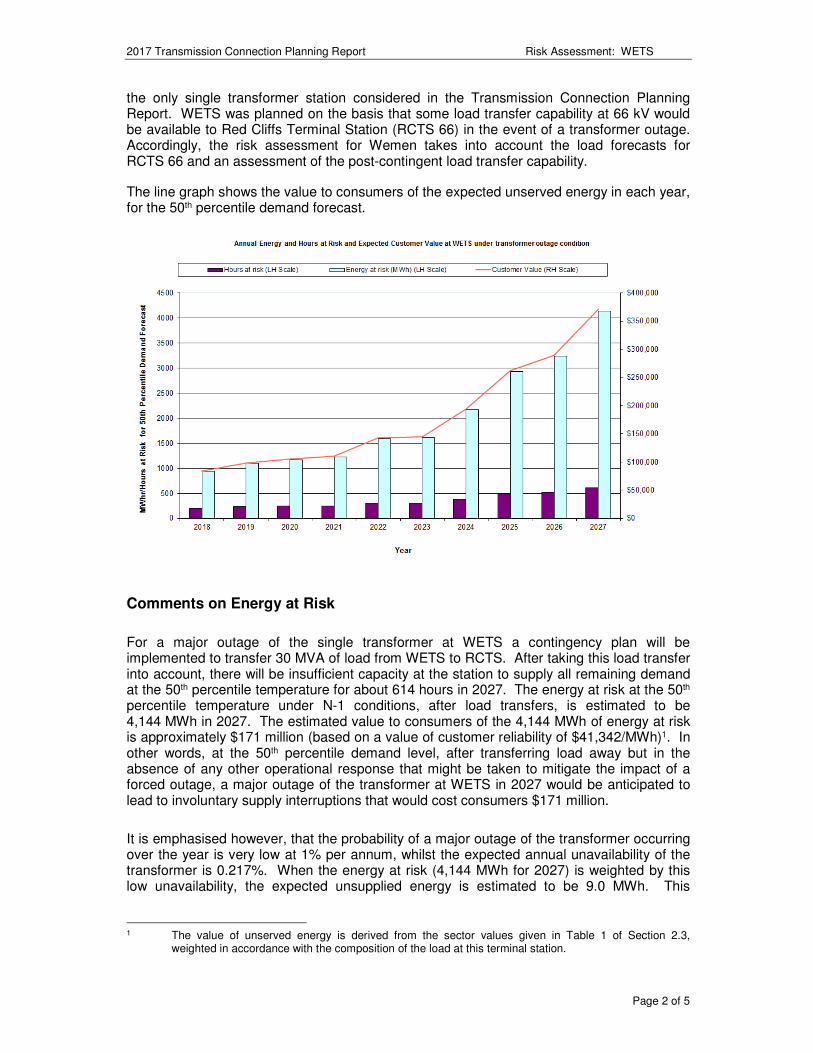
2017 Transmission Connection Planning Report Risk Assessment: WETS
Page 2 of 5
the only single transformer station considered in the Transmission Connection Planning Report. WETS was planned on the basis that some load transfer capability at 66 kV would be available to Red Cliffs Terminal Station (RCTS 66) in the event of a transformer outage. Accordingly, the risk assessment for Wemen takes into account the load forecasts for RCTS 66 and an assessment of the post-contingent load transfer capability.
The line graph shows the value to consumers of the expected unserved energy in each year, for the 50th percentile demand forecast.
Comments on Energy at Risk
For a major outage of the single transformer at WETS a contingency plan will be implemented to transfer 30 MVA of load from WETS to RCTS. After taking this load transfer into account, there will be insufficient capacity at the station to supply all remaining demand at the 50th percentile temperature for about 614 hours in 2027. The energy at risk at the 50th percentile temperature under N-1 conditions, after load transfers, is estimated to be 4,144 MWh in 2027. The estimated value to consumers of the 4,144 MWh of energy at risk is approximately $171 million (based on a value of customer reliability of $41,342/MWh)1. In other words, at the 50th percentile demand level, after transferring load away but in the absence of any other operational response that might be taken to mitigate the impact of a forced outage, a major outage of the transformer at WETS in 2027 would be anticipated to lead to involuntary supply interruptions that would cost consumers $171 million.
It is emphasised however, that the probability of a major outage of the transformer occurring over the year is very low at 1% per annum, whilst the expected annual unavailability of the transformer is 0.217%. When the energy at risk (4,144 MWh for 2027) is weighted by this low unavailability, the expected unsupplied energy is estimated to be 9.0 MWh. This
1 The value of unserved energy is derived from the sector values given in Table 1 of Section 2.3,
weighted in accordance with the composition of the load at this terminal station.
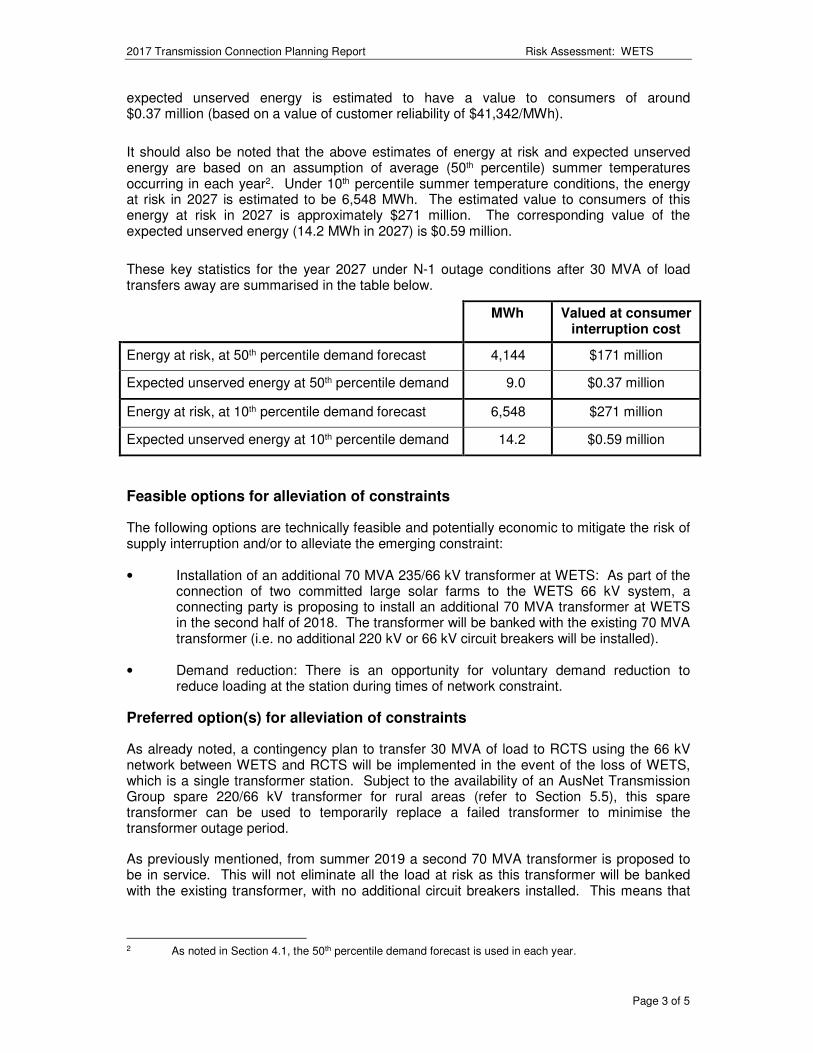
2017 Transmission Connection Planning Report Risk Assessment: WETS
Page 3 of 5
expected unserved energy is estimated to have a value to consumers of around $0.37 million (based on a value of customer reliability of $41,342/MWh).
It should also be noted that the above estimates of energy at risk and expected unserved energy are based on an assumption of average (50th percentile) summer temperatures occurring in each year2. Under 10th percentile summer temperature conditions, the energy at risk in 2027 is estimated to be 6,548 MWh. The estimated value to consumers of this energy at risk in 2027 is approximately $271 million. The corresponding value of the expected unserved energy (14.2 MWh in 2027) is $0.59 million.
These key statistics for the year 2027 under N-1 outage conditions after 30 MVA of load transfers away are summarised in the table below.
MWh Valued at consumer interruption cost
Energy at risk, at 50th percentile demand forecast 4,144 $171 million
Expected unserved energy at 50th percentile demand 9.0 $0.37 million
Energy at risk, at 10th percentile demand forecast 6,548 $271 million
Expected unserved energy at 10th percentile demand 14.2 $0.59 million
Feasible options for alleviation of constraints
The following options are technically feasible and potentially economic to mitigate the risk of supply interruption and/or to alleviate the emerging constraint:
• Installation of an additional 70 MVA 235/66 kV transformer at WETS: As part of the connection of two committed large solar farms to the WETS 66 kV system, a connecting party is proposing to install an additional 70 MVA transformer at WETS in the second half of 2018. The transformer will be banked with the existing 70 MVA transformer (i.e. no additional 220 kV or 66 kV circuit breakers will be installed).
• Demand reduction: There is an opportunity for voluntary demand reduction to reduce loading at the station during times of network constraint.
Preferred option(s) for alleviation of constraints
As already noted, a contingency plan to transfer 30 MVA of load to RCTS using the 66 kV network between WETS and RCTS will be implemented in the event of the loss of WETS, which is a single transformer station. Subject to the availability of an AusNet Transmission Group spare 220/66 kV transformer for rural areas (refer to Section 5.5), this spare transformer can be used to temporarily replace a failed transformer to minimise the transformer outage period.
As previously mentioned, from summer 2019 a second 70 MVA transformer is proposed to be in service. This will not eliminate all the load at risk as this transformer will be banked with the existing transformer, with no additional circuit breakers installed. This means that
2 As noted in Section 4.1, the 50th percentile demand forecast is used in each year.
2017 Transmission Connection Planning Report Risk Assessment: WETS
Page 4 of 5
for a transformer fault, the whole station goes off supply for the time taken to isolate the faulted transformer and to return the healthy transformer to service.
The table on the following page provides more detailed data on the station rating, demand forecasts, energy at risk and expected unserved energy. The energy at risk, hours at risk and expected unserved energy are after implementation of the contingency plan to transfer load to RCTS. It assumes that the proposed second 70 MVA transformer is not in service.
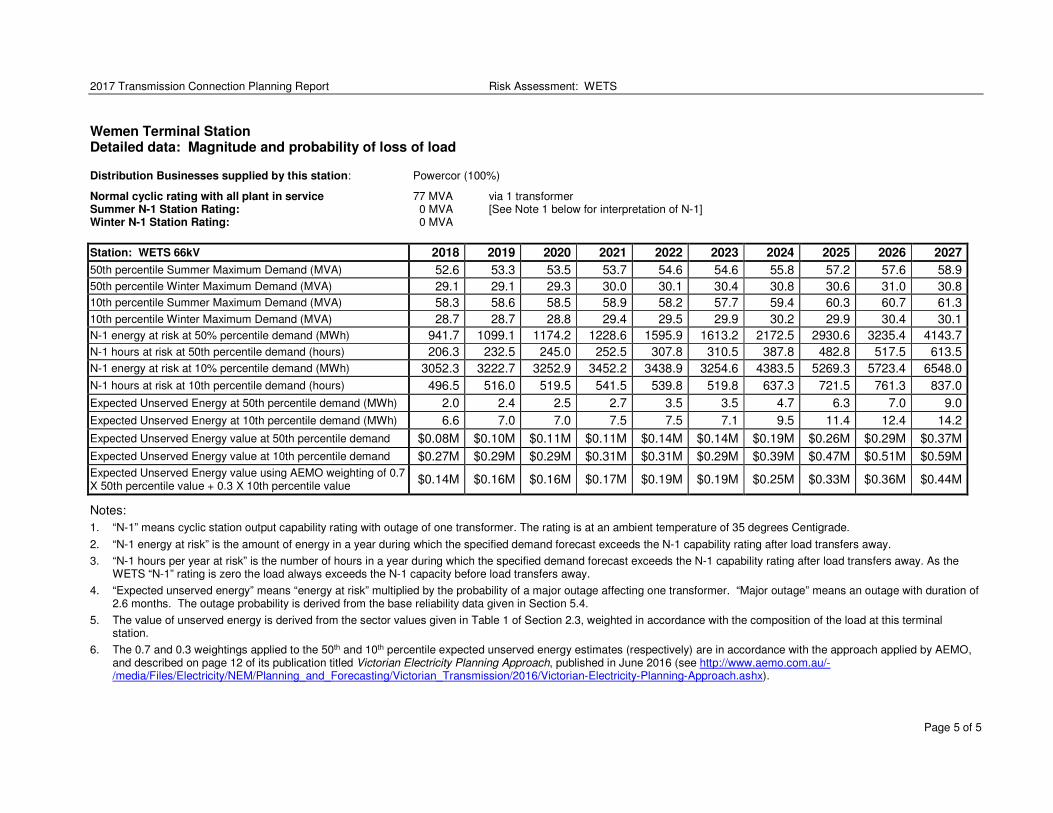
2017 Transmission Connection Planning Report Risk Assessment: WETS
Page 5 of 5
Wemen Terminal Station Detailed data: Magnitude and probability of loss of load Distribution Businesses supplied by this station: Powercor (100%)
Normal cyclic rating with all plant in service 77 MVA via 1 transformer Summer N-1 Station Rating: 0 MVA [See Note 1 below for interpretation of N-1] Winter N-1 Station Rating: 0 MVA
Station: WETS 66kV 2018 2019 2020 2021 2022 2023 2024 2025 2026 2027
50th percentile Summer Maximum Demand (MVA) 52.6 53.3 53.5 53.7 54.6 54.6 55.8 57.2 57.6 58.9
50th percentile Winter Maximum Demand (MVA) 29.1 29.1 29.3 30.0 30.1 30.4 30.8 30.6 31.0 30.8
10th percentile Summer Maximum Demand (MVA) 58.3 58.6 58.5 58.9 58.2 57.7 59.4 60.3 60.7 61.3
10th percentile Winter Maximum Demand (MVA) 28.7 28.7 28.8 29.4 29.5 29.9 30.2 29.9 30.4 30.1
N-1 energy at risk at 50% percentile demand (MWh) 941.7 1099.1 1174.2 1228.6 1595.9 1613.2 2172.5 2930.6 3235.4 4143.7
N-1 hours at risk at 50th percentile demand (hours) 206.3 232.5 245.0 252.5 307.8 310.5 387.8 482.8 517.5 613.5
N-1 energy at risk at 10% percentile demand (MWh) 3052.3 3222.7 3252.9 3452.2 3438.9 3254.6 4383.5 5269.3 5723.4 6548.0
N-1 hours at risk at 10th percentile demand (hours) 496.5 516.0 519.5 541.5 539.8 519.8 637.3 721.5 761.3 837.0
Expected Unserved Energy at 50th percentile demand (MWh) 2.0 2.4 2.5 2.7 3.5 3.5 4.7 6.3 7.0 9.0
Expected Unserved Energy at 10th percentile demand (MWh) 6.6 7.0 7.0 7.5 7.5 7.1 9.5 11.4 12.4 14.2
Expected Unserved Energy value at 50th percentile demand $0.08M $0.10M $0.11M $0.11M $0.14M $0.14M $0.19M $0.26M $0.29M $0.37M
Expected Unserved Energy value at 10th percentile demand $0.27M $0.29M $0.29M $0.31M $0.31M $0.29M $0.39M $0.47M $0.51M $0.59M
Expected Unserved Energy value using AEMO weighting of 0.7 X 50th percentile value + 0.3 X 10th percentile value
$0.14M $0.16M $0.16M $0.17M $0.19M $0.19M $0.25M $0.33M $0.36M $0.44M
Notes:
1. “N-1” means cyclic station output capability rating with outage of one transformer. The rating is at an ambient temperature of 35 degrees Centigrade.
2. “N-1 energy at risk” is the amount of energy in a year during which the specified demand forecast exceeds the N-1 capability rating after load transfers away.
3. “N-1 hours per year at risk” is the number of hours in a year during which the specified demand forecast exceeds the N-1 capability rating after load transfers away. As the WETS “N-1” rating is zero the load always exceeds the N-1 capacity before load transfers away.
4. “Expected unserved energy” means “energy at risk” multiplied by the probability of a major outage affecting one transformer. “Major outage” means an outage with duration of 2.6 months. The outage probability is derived from the base reliability data given in Section 5.4.
5. The value of unserved energy is derived from the sector values given in Table 1 of Section 2.3, weighted in accordance with the composition of the load at this terminal station.
6. The 0.7 and 0.3 weightings applied to the 50th and 10th percentile expected unserved energy estimates (respectively) are in accordance with the approach applied by AEMO, and described on page 12 of its publication titled Victorian Electricity Planning Approach, published in June 2016 (see http://www.aemo.com.au/-/media/Files/Electricity/NEM/Planning_and_Forecasting/Victorian_Transmission/2016/Victorian-Electricity-Planning-Approach.ashx).
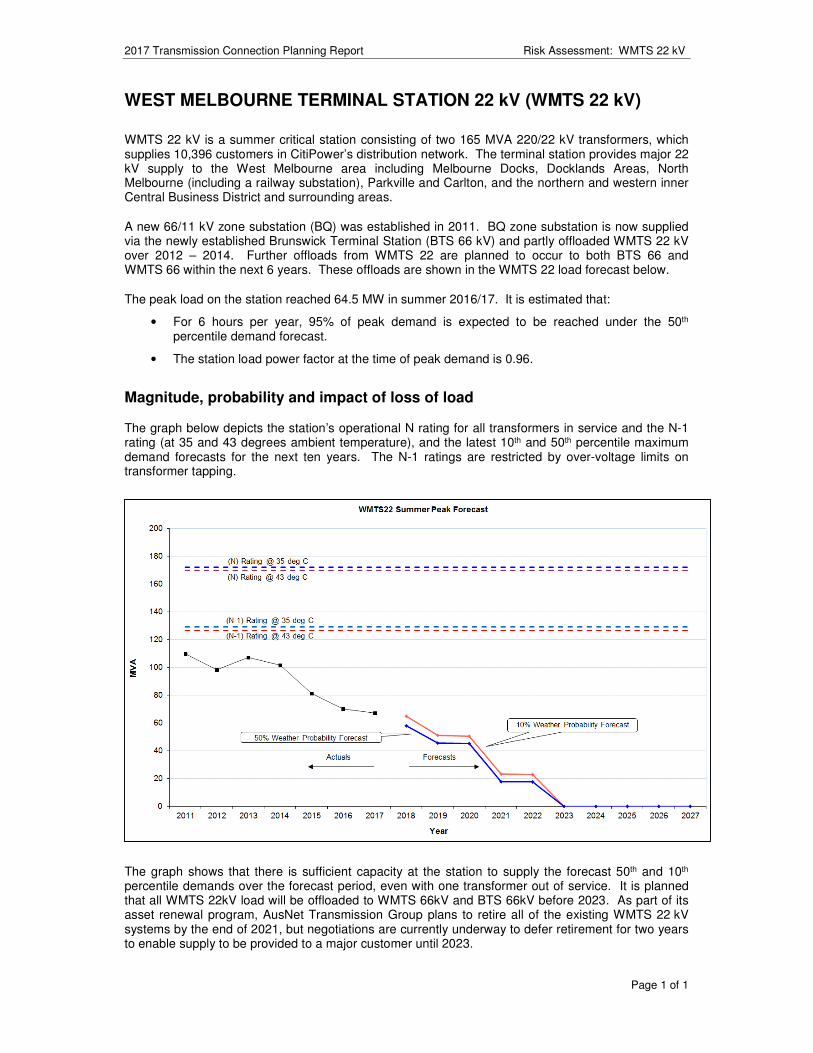
2017 Transmission Connection Planning Report Risk Assessment: WMTS 22 kV
Page 1 of 1
WEST MELBOURNE TERMINAL STATION 22 kV (WMTS 22 kV)
WMTS 22 kV is a summer critical station consisting of two 165 MVA 220/22 kV transformers, which supplies 10,396 customers in CitiPower’s distribution network. The terminal station provides major 22 kV supply to the West Melbourne area including Melbourne Docks, Docklands Areas, North Melbourne (including a railway substation), Parkville and Carlton, and the northern and western inner Central Business District and surrounding areas.
A new 66/11 kV zone substation (BQ) was established in 2011. BQ zone substation is now supplied via the newly established Brunswick Terminal Station (BTS 66 kV) and partly offloaded WMTS 22 kV over 2012 – 2014. Further offloads from WMTS 22 are planned to occur to both BTS 66 and WMTS 66 within the next 6 years. These offloads are shown in the WMTS 22 load forecast below.
The peak load on the station reached 64.5 MW in summer 2016/17. It is estimated that:
• For 6 hours per year, 95% of peak demand is expected to be reached under the 50th percentile demand forecast.
• The station load power factor at the time of peak demand is 0.96.
Magnitude, probability and impact of loss of load
The graph below depicts the station’s operational N rating for all transformers in service and the N-1 rating (at 35 and 43 degrees ambient temperature), and the latest 10th and 50th percentile maximum demand forecasts for the next ten years. The N-1 ratings are restricted by over-voltage limits on transformer tapping.
The graph shows that there is sufficient capacity at the station to supply the forecast 50th and 10th percentile demands over the forecast period, even with one transformer out of service. It is planned that all WMTS 22kV load will be offloaded to WMTS 66kV and BTS 66kV before 2023. As part of its asset renewal program, AusNet Transmission Group plans to retire all of the existing WMTS 22 kV systems by the end of 2021, but negotiations are currently underway to defer retirement for two years to enable supply to be provided to a major customer until 2023.
2017 Transmission Connection Planning Report Risk Assessment: WMTS 66 kV
Page 1 of 2
WEST MELBOURNE TERMINAL STATION 66 kV (WMTS 66 kV)
WMTS 66 kV is a summer critical station consisting of four 150 MVA 220/66 kV transformers. The terminal station is shared by CitiPower (61.0%) and Jemena Electricity Networks (39.0%). The terminal station provides major supply for 72,395 customers in the western Central Business District, including Docklands areas, as well as the inner suburbs of Northcote and Brunswick West in the north, and Kensington, Flemington, Footscray and Yarraville in the west.
WMTS 66 kV is operating with one of the four transformers on “Normal Open Auto-close” duty (i.e. on hot stand-by with a facility for automatic closing upon forced outage of any one of the three normal-running transformers). This arrangement facilitates control of the 66 kV fault level to within the terminal station fault level rating. With this transformer operating arrangement, the N rating will be approximately equal to the N-1 rating (i.e. equal to the capacity of three transformers), thus imposing a restriction that the terminal station should not be loaded beyond the N-1 rating at any time.
Following the extremely hot summer in 2009, AusNet Transmission Group expressed concern regarding the operating temperature of the WMTS 220/66 kV transformers. In order to avoid operating the WMTS transformers at temperatures that would result in accelerated aging, AusNet Transmission Group has reduced the WMTS Terminal Station summer cyclic ratings by about 5.5% to 497 MVA at 35ºC ambient temperature and about 10% to 463 MVA at 43ºC ambient temperature. As part of its asset renewal program, AusNet Transmission Group plans to replace all four existing 150 MVA 220/66 kV transformer units (B1, B2, B3 and B4) with three 225 MVA transformer units by the end of 2021.
The peak load on the station reached 240.5 MW (241.7 MVA) in summer (February) 2017, after zone substations VM, WA and BQ were transferred to Brunswick Terminal Station (BTS 66) in December 2016.
It is estimated that:
• For 7 hours per year, 95% of peak demand is expected to be reached under the 50th percentile demand forecast.
• The station load power factor at time of peak demand is 0.98.
Magnitude, probability and impact of loss of load
The graph below depicts the station’s N-1 rating (approximately equal to the N rating) at 35ºC and 43ºC, and the latest 10th and 50th percentile maximum demand forecasts during the summer periods over the next ten years. The forecast demands include the effects of load transfer works1 which were undertaken after the establishment of BTS 66 kV in late 2016. It also includes the further offloads2 from WMTS 22 to WMTS 66 between 2019 and 2021 prior to the planned decommissioning of the 22 kV supply from WMTS.
1 WA (52.7 MW), BQ (49.2 MW) and VM (42.0 MW) transfer from WMTS 66 to BTS 66 in late 2016.
2 J (6.6 MW) transfer from WMTS 22 to WMTS 66 in 2019, VR (9.2 MW) and DA (21.6 MW) transfer from WMTS 22 to WMTS 66 in 2021.
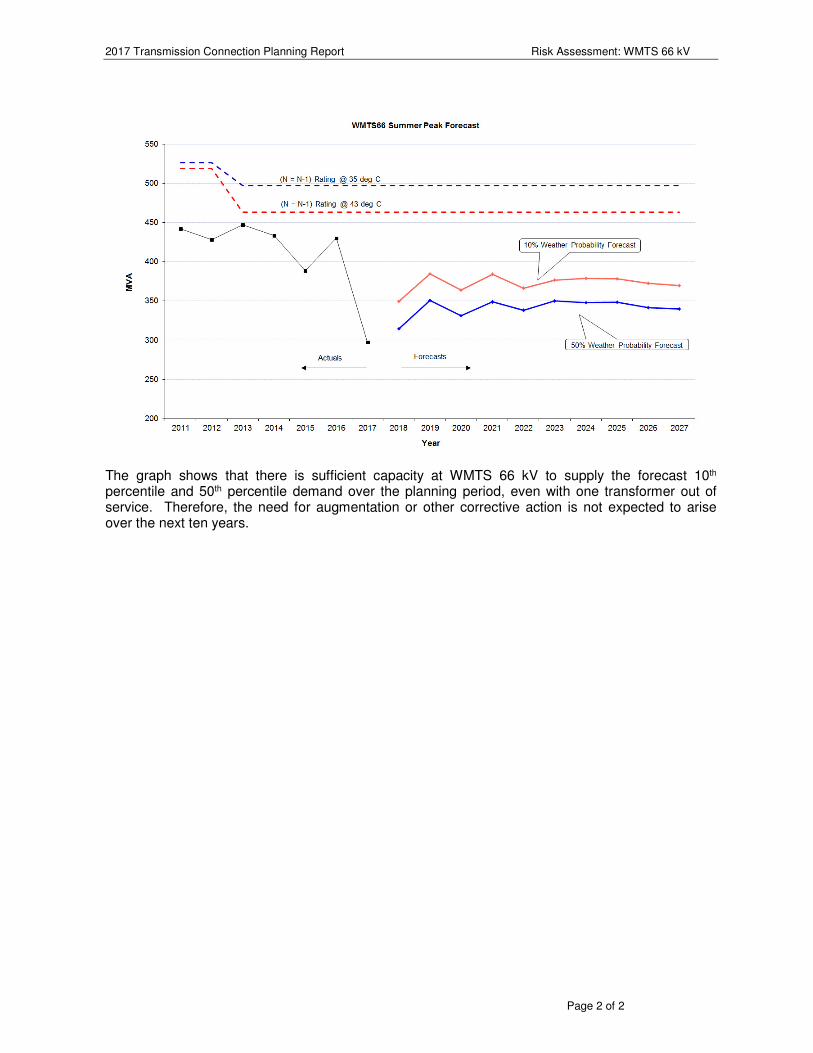
2017 Transmission Connection Planning Report Risk Assessment: WMTS 66 kV
Page 2 of 2
The graph shows that there is sufficient capacity at WMTS 66 kV to supply the forecast 10th percentile and 50th percentile demand over the planning period, even with one transformer out of service. Therefore, the need for augmentation or other corrective action is not expected to arise over the next ten years.
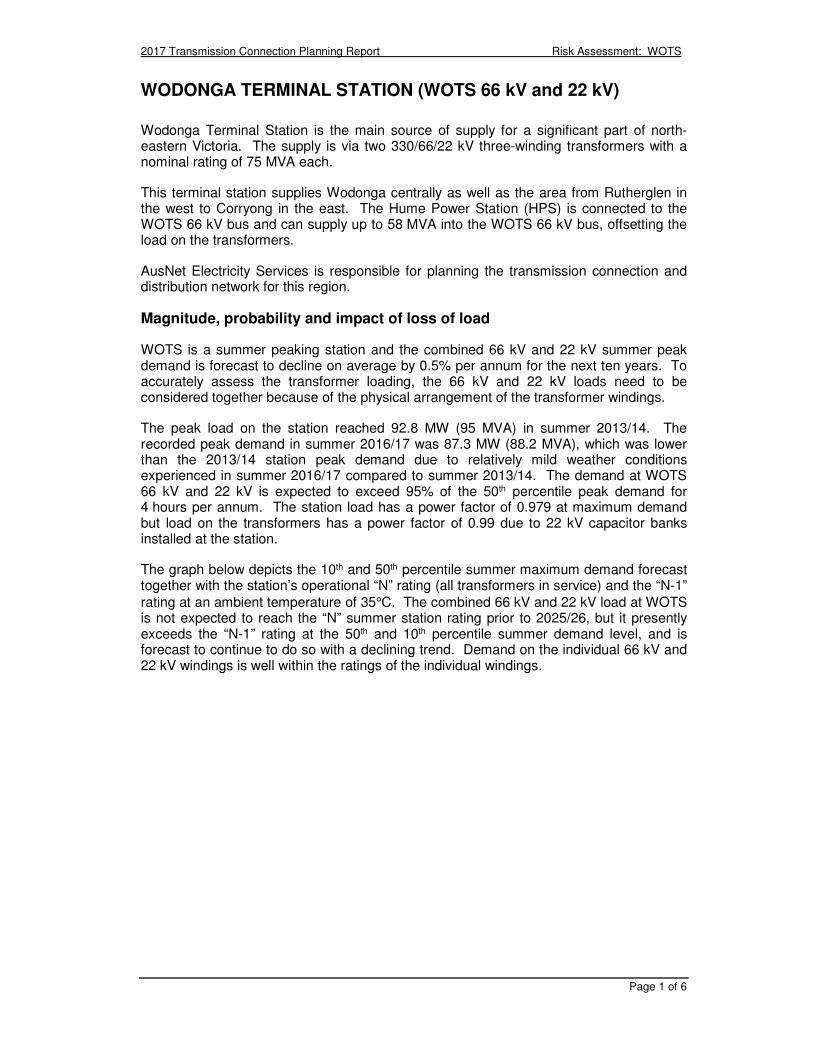
2017 Transmission Connection Planning Report Risk Assessment: WOTS
Page 1 of 6
WODONGA TERMINAL STATION (WOTS 66 kV and 22 kV)
Wodonga Terminal Station is the main source of supply for a significant part of north-eastern Victoria. The supply is via two 330/66/22 kV three-winding transformers with a nominal rating of 75 MVA each.
This terminal station supplies Wodonga centrally as well as the area from Rutherglen in the west to Corryong in the east. The Hume Power Station (HPS) is connected to the WOTS 66 kV bus and can supply up to 58 MVA into the WOTS 66 kV bus, offsetting the load on the transformers.
AusNet Electricity Services is responsible for planning the transmission connection and distribution network for this region.
Magnitude, probability and impact of loss of load
WOTS is a summer peaking station and the combined 66 kV and 22 kV summer peak demand is forecast to decline on average by 0.5% per annum for the next ten years. To accurately assess the transformer loading, the 66 kV and 22 kV loads need to be considered together because of the physical arrangement of the transformer windings.
The peak load on the station reached 92.8 MW (95 MVA) in summer 2013/14. The recorded peak demand in summer 2016/17 was 87.3 MW (88.2 MVA), which was lower than the 2013/14 station peak demand due to relatively mild weather conditions experienced in summer 2016/17 compared to summer 2013/14. The demand at WOTS 66 kV and 22 kV is expected to exceed 95% of the 50th percentile peak demand for 4 hours per annum. The station load has a power factor of 0.979 at maximum demand but load on the transformers has a power factor of 0.99 due to 22 kV capacitor banks installed at the station.
The graph below depicts the 10th and 50th percentile summer maximum demand forecast together with the station’s operational “N” rating (all transformers in service) and the “N-1” rating at an ambient temperature of 35°C. The combined 66 kV and 22 kV load at WOTS is not expected to reach the “N” summer station rating prior to 2025/26, but it presently exceeds the “N-1” rating at the 50th and 10th percentile summer demand level, and is forecast to continue to do so with a declining trend. Demand on the individual 66 kV and 22 kV windings is well within the ratings of the individual windings.
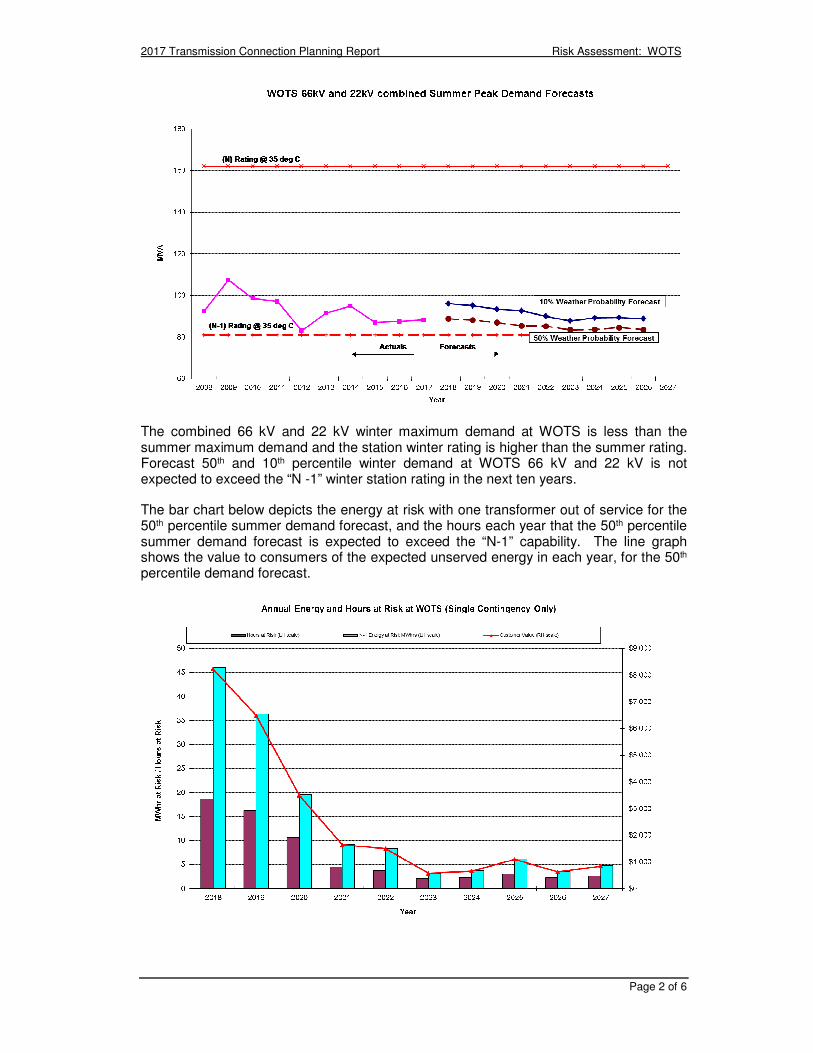
2017 Transmission Connection Planning Report Risk Assessment: WOTS
Page 2 of 6
The combined 66 kV and 22 kV winter maximum demand at WOTS is less than the summer maximum demand and the station winter rating is higher than the summer rating. Forecast 50th and 10th percentile winter demand at WOTS 66 kV and 22 kV is not expected to exceed the “N -1” winter station rating in the next ten years.
The bar chart below depicts the energy at risk with one transformer out of service for the 50th percentile summer demand forecast, and the hours each year that the 50th percentile summer demand forecast is expected to exceed the “N-1” capability. The line graph shows the value to consumers of the expected unserved energy in each year, for the 50th percentile demand forecast.
2017 Transmission Connection Planning Report Risk Assessment: WOTS
Page 3 of 6
Comments on Energy at Risk - Assuming HPS generation is not available
Assuming that Hume Power Station is unavailable, then for a major outage of any one of the two 330/66/22 kV transformers at WOTS over the entire summer period, there will be insufficient capacity at the station to supply all demand at the 50th percentile temperature. However, due to the declining demand over the forecast period, the number of hours at risk is expected to reduce from 19 hours in 2017/18 to about 3 hours in summer 2026/27. The energy at risk under “N-1” condition is estimated to reduce from 46 MWh in 2017/18 to 5 MWh in summer 2026/27. The estimated value to consumers of the energy at risk in 2016/17 is approximately $1.9 million (based on a value of customer reliability of $41,205/MWh at WOTS)1.
However the probability of a major outage of one of the two transformers occurring over the year is very low, at about 1.0% per transformer per annum, whilst the expected unavailability per transformer per annum is 0.217%. When the energy at risk (46 MWh for summer 2017/18) is weighted by this low unavailability, the expected unsupplied energy is estimated to be around 0.2 MWh. The corresponding value of expected unserved energy is approximately $8,220.
It should also be noted that the above estimates of energy at risk and expected unserved energy are based on an assumption of average (50th percentile) summer temperatures occurring in each year. Under higher (10th percentile) summer temperature conditions, the energy at risk in 2017/18 is estimated to be 559 MWh. The estimated value to consumers of the energy at risk in 2017/18 is approximately $23.0 million. The corresponding expected unserved energy at the 10th percentile demand forecast is 2.4 MWh, whch has an estimated value to consumers of approximately $0.10 million.
Given the forecast decline in demand over the 10 year planning period, by 2026/27 the energy at risk for the 10th percentile demand forecast is 77 MWh, and the expected unsupplied energy is estimated to be around 0.3 MWh. The corresponding value of expected unserved energy is approximately $13,821.
The key statistics for the year 2017/18 under “N-1” outage conditions are summarised in the table below.
MWh Valued at consumer interruption cost
Energy at risk at 50th percentile demand forecast 46 $1.9 million
Expected unserved energy at 50th percentile demand 0.2 $8,220
Energy at risk at 10th percentile demand forecast 559 $23.0 million
Expected unserved energy at 10th percentile demand 2.4 $0.10 million
If one of the 330/66/22 kV transformers at WOTS is taken off line during peak loading times and the “N-1” station rating is exceeded, then the Overload Shedding Scheme for Connection Assets (OSSCA) which is enabled by AusNet Transmission Group’s TOC2 to
1 The value of unserved energy is derived from the sector values given in Table 1 of Section 2.4,
weighted in accordance with the composition of the load at this terminal station.
2 Transmission Operation Centre.
2017 Transmission Connection Planning Report Risk Assessment: WOTS
Page 4 of 6
protect the connection assets from overloading3, will act swiftly to reduce the loads in blocks to within safe loading limits. If OSSCA operation does occur, any load reductions that are in excess of the amount required to limit load to the rated capability of the station would be restored at zone substation feeder level in accordance with AusNet Electricity Services’ operational procedures after the operation of the OSSCA scheme.
If OSSCA operates at WOTS, it would automatically shed about 60 MVA of load progressively, affecting up to approximately 13,000 customers.
Comments on Energy at Risk - Assuming HPS generation is available
The previous comments on energy at risk are based on the assumption that there is no embedded generation available to offset the 330/66/22 kV transformer loading.
However, the generation from Hume Power Station (HPS) can be fed into the WOTS 66 kV bus. The power station is capable of generating up to 58 MVA. This generation can also be connected to the TransGrid 132 kV Network in New South Wales. The generation from HPS is dependent on water releases from Hume Dam for irrigation and the water level in the dam can vary widely from year to year. There is presently no guarantee that generation from HPS will be available to offset transformer loading at WOTS. With HPS generating to its full capacity there would be no energy at risk at WOTS over the ten year planning horizon for the 50th or 10th percentile summer maximum demand forecasts.
Feasible options for alleviation of constraints
If the demand at WOTS continues to decline in accordance with the forecast, there will be no energy at risk after about 10 years. Therefore it is important to monitor the demand at WOTS and to take appropriate action to manage the risk at the lowest cost to consumers.
The following are potentially feasible options for addressing constraints at this station.
1. Load transfers
Only 1 MVA of load can be shifted away from WOTS using the existing distribution network so this option has limited ability to manage the risk at WOTS in the near future.
2. Addition of Power Factor Correction Capacitors
The station is currently running with a power factor of around 0.99 at summer peak. At this power factor the use of additional capacitor banks to reduce the MVA loading would only provide marginal benefits.
3. Demand reduction
Over sixty percent of the peak demand is from Commercial and Industrial customers and AusNet Electricity Services will be looking into demand management through either special tariff incentives, or a demand management aggregator to asses these alternatives to network augmentation.
3 OSSCA is designed to protect connection transformers against damage caused by overloads.
Damaged transformers can take months to repair or replace which can result in prolonged, long term risks to the reliability of customer supply.
2017 Transmission Connection Planning Report Risk Assessment: WOTS
Page 5 of 6
4. Embedded generation
As discussed above, subject to available water HPS can provide up to 58 MVA of network support to WOTS.
5. Fine tuning OSSCA
OSSCA scheme settings are reviewed annually so as to minimise the impact on customers of any load shedding that may take place to protect the connection assets from overloading.
It is noted that the two 330/66/22 kV transformers at WOTS are the only two of this voltage ratio in Victoria. AusNet Transmission Group does not have a spare transformer suitable for use at WOTS, so it is expected that it would take approximately 12 months to replace a failed transformer at WOTS.
Preferred network option for alleviation of constraints
In view of the current level of expected unserved energy at WOTS, and the forecast decline in expected unserved energy over the next 10 years, implementation of a network solution is unlikely to be economic over the ten year planning horizon.
The table on the following page provides more detailed data on the station rating, demand forecasts, energy at risk and expected unserved energy assuming embedded generation is not available.
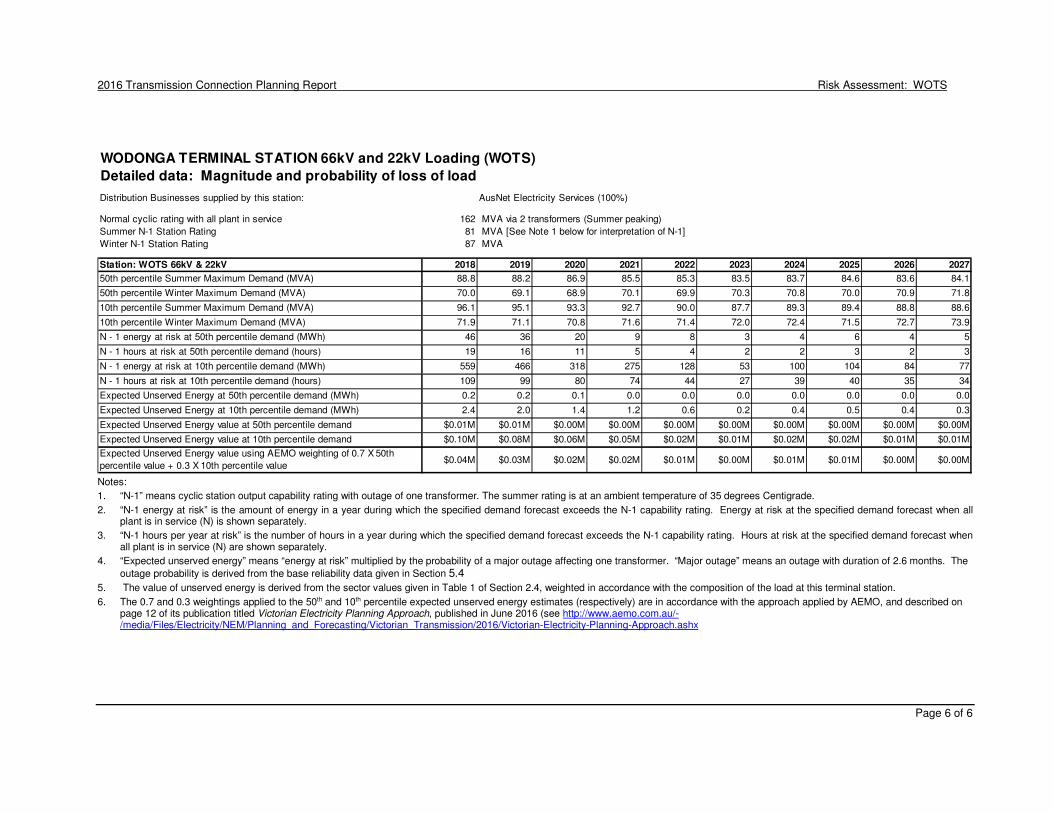
2016 Transmission Connection Planning Report Risk Assessment: WOTS
Page 6 of 6
WODONGA TERMINAL STATION 66kV and 22kV Loading (WOTS)
Detailed data: Magnitude and probability of loss of load
Distribution Businesses supplied by this station: AusNet Electricity Services (100%)
Normal cyclic rating with all plant in service 162 MVA via 2 transformers (Summer peaking)
Summer N-1 Station Rating 81 MVA [See Note 1 below for interpretation of N-1]
Winter N-1 Station Rating 87 MVA
Station: WOTS 66kV & 22kV 2018 2019 2020 2021 2022 2023 2024 2025 2026 2027
50th percentile Summer Maximum Demand (MVA) 88.8 88.2 86.9 85.5 85.3 83.5 83.7 84.6 83.6 84.1
50th percentile Winter Maximum Demand (MVA) 70.0 69.1 68.9 70.1 69.9 70.3 70.8 70.0 70.9 71.8
10th percentile Summer Maximum Demand (MVA) 96.1 95.1 93.3 92.7 90.0 87.7 89.3 89.4 88.8 88.6
10th percentile Winter Maximum Demand (MVA) 71.9 71.1 70.8 71.6 71.4 72.0 72.4 71.5 72.7 73.9
N - 1 energy at risk at 50th percentile demand (MWh) 46 36 20 9 8 3 4 6 4 5
N - 1 hours at risk at 50th percentile demand (hours) 19 16 11 5 4 2 2 3 2 3
N - 1 energy at risk at 10th percentile demand (MWh) 559 466 318 275 128 53 100 104 84 77
N - 1 hours at risk at 10th percentile demand (hours) 109 99 80 74 44 27 39 40 35 34
Expected Unserved Energy at 50th percentile demand (MWh) 0.2 0.2 0.1 0.0 0.0 0.0 0.0 0.0 0.0 0.0
Expected Unserved Energy at 10th percentile demand (MWh) 2.4 2.0 1.4 1.2 0.6 0.2 0.4 0.5 0.4 0.3
Expected Unserved Energy value at 50th percentile demand $0.01M $0.01M $0.00M $0.00M $0.00M $0.00M $0.00M $0.00M $0.00M $0.00M
Expected Unserved Energy value at 10th percentile demand $0.10M $0.08M $0.06M $0.05M $0.02M $0.01M $0.02M $0.02M $0.01M $0.01M
Expected Unserved Energy value using AEMO weighting of 0.7 X 50th
percentile value + 0.3 X 10th percentile value$0.04M $0.03M $0.02M $0.02M $0.01M $0.00M $0.01M $0.01M $0.00M $0.00M
Notes:
1. “N-1” means cyclic station output capability rating with outage of one transformer. The summer rating is at an ambient temperature of 35 degrees Centigrade.
2. “N-1 energy at risk” is the amount of energy in a year during which the specified demand forecast exceeds the N-1 capability rating. Energy at risk at the specified demand forecast when all plant is in service (N) is shown separately.
3. “N-1 hours per year at risk” is the number of hours in a year during which the specified demand forecast exceeds the N-1 capability rating. Hours at risk at the specified demand forecast when all plant is in service (N) are shown separately.
4. “Expected unserved energy” means “energy at risk” multiplied by the probability of a major outage affecting one transformer. “Major outage” means an outage with duration of 2.6 months. The
outage probability is derived from the base reliability data given in Section 5.4
5. The value of unserved energy is derived from the sector values given in Table 1 of Section 2.4, weighted in accordance with the composition of the load at this terminal station.
6. The 0.7 and 0.3 weightings applied to the 50th and 10th percentile expected unserved energy estimates (respectively) are in accordance with the approach applied by AEMO, and described on page 12 of its publication titled Victorian Electricity Planning Approach, published in June 2016 (see http://www.aemo.com.au/-/media/Files/Electricity/NEM/Planning_and_Forecasting/Victorian_Transmission/2016/Victorian-Electricity-Planning-Approach.ashx