Translation from the Hebrew. The Hebrew version is the...
63
Translation from the Hebrew. The Hebrew version is the binding version. Directors' Report on the State of the Company's Affairs for the period ended June 30, 2011 Below is the Directors' Report of Israel Chemicals Ltd. ("ICL" or "the Company") for the period ended June 30, 2011. 1. Description of the Company and its Business Environment 1.1. Description of ICL ICL is a multinational company that operates mainly in the areas of fertilizers and specialty chemicals, in three segments: Fertilizers, Industrial Products and Performance Products. ICL’s operations are based primarily on natural resources – potash, bromine, magnesium and sodium chloride from the Dead Sea, and phosphate rock from the Negev Desert, based on concessions and licenses from the State of Israel. Operations are also based on potash and salt mines in England and Spain under lease agreements and licenses from the relevant authorities in those countries. ICL is active in the production of these minerals, in their sale throughout the world, and also in the development, production and marketing of downstream products based primarily on these raw materials or complementary to these products. ICL has a prominent position in the world in the markets for potash, bromine, pure phosphoric acid, specialty phosphates, bromine and phosphorus-based flame retardants and chemicals used in wildfire retardants. Potash and phosphate are core components of fertilizers. Bromine is used in a wide range of applications, primarily as a basic ingredient of flame retardants. ICL’s products are used primarily in agriculture, electronics, food products, oil and gas drilling, water purification and desalination, and in industries such as detergents, paper, cosmetics, pharmaceuticals, automotive, aluminum and others. ICL has decades of accumulated experience in most of its businesses. ICL has direct access to most of the raw materials required for its activities, at low cost and high quality, by virtue of the exclusive concession granted to ICL by the State of Israel for extraction of minerals from the Israeli side of the Dead Sea, in return for payment of royalties to the State. The production costs of the potash and bromine that ICL extracts from the Dead Sea are relatively lower than the costs of other producers in the world that do not have access to the Dead Sea. ICL’s main production facilities are based in Israel, Germany, the USA, Holland, Spain, the UK, China, Brazil and France. ICL has other production facilities in Austria, Belgium, Turkey, Argentina, Canada, Ireland, Mexico and Australia. ICL’s operations outside of Israel are primarily in the manufacture of products that are complementary to or are based on its operations in Israel or in related fields. Approximately 95% of all ICL’s production is sold outside of Israel. The operations of ICL’s facilities are largely integrated with one another, both in terms of supply of raw materials and in the way that one facility frequently utilizes the by-products of another for the manufacture of end products (for example, bromine is produced by utilizing the bromine in the by- product streams from the evaporation ponds used to produce potash. Bromine production, utilizes chlorine, a by-product stream in the production of magnesium and others). Approximately 5% of ICL’s production is sold in Israel. For specific products, ICL and some ICL companies have been declared a monopoly in Israel. Approximately 48% of ICL’s annual sales turnover comes from production outside of Israel. ICL has no material dependency on any single customer, supplier or source of raw materials that are not included in the concessions granted to ICL. ICL applies an overall policy of sustainable development that integrates social, economic and environmental considerations in all of its business activities. The main points of the policy include
Transcript of Translation from the Hebrew. The Hebrew version is the...

Translation from the Hebrew. The Hebrew version is the binding version.
Directors' Report on the State of the Company's Affairs for the period ended June 30, 2011
Below is the Directors' Report of Israel Chemicals Ltd. ("ICL" or "the Company") for the period ended June 30, 2011.
1. Description of the Company and its Business Environment
1.1. Description of ICL
ICL is a multinational company that operates mainly in the areas of fertilizers and specialty chemicals, in three segments: Fertilizers, Industrial Products and Performance Products.
ICL’s operations are based primarily on natural resources – potash, bromine, magnesium and sodium chloride from the Dead Sea, and phosphate rock from the Negev Desert, based on concessions and licenses from the State of Israel. Operations are also based on potash and salt mines in England and Spain under lease agreements and licenses from the relevant authorities in those countries. ICL is active in the production of these minerals, in their sale throughout the world, and also in the development, production and marketing of downstream products based primarily on these raw materials or complementary to these products.
ICL has a prominent position in the world in the markets for potash, bromine, pure phosphoric acid, specialty phosphates, bromine and phosphorus-based flame retardants and chemicals used in wildfire retardants. Potash and phosphate are core components of fertilizers. Bromine is used in a wide range of applications, primarily as a basic ingredient of flame retardants. ICL’s products are used primarily in agriculture, electronics, food products, oil and gas drilling, water purification and desalination, and in industries such as detergents, paper, cosmetics, pharmaceuticals, automotive, aluminum and others. ICL has decades of accumulated experience in most of its businesses.
ICL has direct access to most of the raw materials required for its activities, at low cost and high quality, by virtue of the exclusive concession granted to ICL by the State of Israel for extraction of minerals from the Israeli side of the Dead Sea, in return for payment of royalties to the State. The production costs of the potash and bromine that ICL extracts from the Dead Sea are relatively lower than the costs of other producers in the world that do not have access to the Dead Sea.
ICL’s main production facilities are based in Israel, Germany, the USA, Holland, Spain, the UK, China, Brazil and France. ICL has other production facilities in Austria, Belgium, Turkey, Argentina, Canada, Ireland, Mexico and Australia.
ICL’s operations outside of Israel are primarily in the manufacture of products that are complementary to or are based on its operations in Israel or in related fields. Approximately 95% of all ICL’s production is sold outside of Israel.
The operations of ICL’s facilities are largely integrated with one another, both in terms of supply of raw materials and in the way that one facility frequently utilizes the by-products of another for the manufacture of end products (for example, bromine is produced by utilizing the bromine in the by-product streams from the evaporation ponds used to produce potash. Bromine production, utilizes chlorine, a by-product stream in the production of magnesium and others).
Approximately 5% of ICL’s production is sold in Israel. For specific products, ICL and some ICL companies have been declared a monopoly in Israel.
Approximately 48% of ICL’s annual sales turnover comes from production outside of Israel.
ICL has no material dependency on any single customer, supplier or source of raw materials that are not included in the concessions granted to ICL.
ICL applies an overall policy of sustainable development that integrates social, economic and environmental considerations in all of its business activities. The main points of the policy include

2
social responsibility, which covers contributing to the community, taking responsibility for the safety, hygiene and the well-being of employees, reducing environmental effects, creating a dialog and transparent communication with the authorities, as well as other subjects.
As noted, ICL operates in three segments of operation on a management-functional basis, even where administrative division and legal ownership do not fully correspond, as described below.
a. ICL Fertilizers – ICL Fertilizers produces potash from the Dead Sea, and mines and produces potash and salt from underground mines in Spain and England. ICL Fertilizers refines the potash into various grades and sells it worldwide. ICL Fertilizers also uses some of the potash for the manufacture of compound fertilizers.
ICL Fertilizers also mines and processes phosphate rock from open-pit mines in the Negev region, and at its production facilities in Israel it manufactures sulfuric acid, fertilizer-grade phosphoric acid, phosphate fertilizers, complex fertilizers based mainly on potash and phosphate, and specialty fertilizers. ICL Fertilizers also manufactures fertilizers in Holland, Germany and Belgium. In addition ICL Fertilizers manufactures phosphate-based animal feed additives in Turkey and Israel. ICL Fertilizers markets its products worldwide, and its top sales destinations are Europe, Brazil, India, China and Israel. On 28 February 2011, a transaction was completed for acquisition of the companies, assets, and activities of a specialty fertilizer business unit. The business unit manufactures and sells specialty fertilizers, growing media, plant protection products, grass seeds for commercial nurseries, public parks, sports fields and intensive agriculture. ICL intends to integrate the operations of the acquired unit in ICL Fertilizers, taking advantage of the marketing, operating and other synergies with ICL's specialty fertilizer activities. Integration of the business unit will expand the range of products offered by ICL Fertilizers in the specialty fertilizer sector. In addition, in April 2011, a company that manufactures and markets specialty fertilizers in Spain was acquired.
b. ICL Industrial Products – ICL Industrial Products manufactures elementary bromine from an end-brine that is created as a by-product of the potash production process in Sdom, as well as bromine-based compounds. ICL Industrial Products is the world's leading manufacturer of elementary bromine, producing about 35% of total global production in the reporting period. ICL Industrial Products uses about 76% of the elementary bromine it produces for manufacturing bromine compounds at its production sites in Israel, Holland and China. In addition, ICL Industrial Products produces and markets flame retardants and other phosphorus-based products in plants in the USA and Germany, produces various salt, magnesia and chlorine products at its production sites in Israel, and also manufactures chlorine-based products in Israel and the USA, and markets its products worldwide.
c. ICL Performance Products – ICL Performance Products purifies some of the fertilizer-grade phosphoric acid manufactured by ICL Fertilizers, purchases purified phosphoric acid from other sources and also manufactures thermal phosphoric acid. The purified phosphoric acid is used in the manufacture of downstream products of high added value – phosphate salts (which in turn are a raw material in the production of food additives), hygiene products, phosphorus derivatives and wildfire retardants and extinguishers. ICL Performance Products also produces specialty products based on aluminum oxide (“alumina”) and other raw materials. The main production sites of ICL Performance Products are in Europe (mainly Germany), the USA, Brazil, Israel and China. During the period approximately two thirds of the sales of ICL Performance Products were of pure phosphoric acid of various qualities, and of downstream products of the acid. In June 2011, a transaction was closed for the purchase of the facilities of a Mexican company that manufactures food supplements and specialty chemicals, as well as a sales and distribution network in Mexico and Central and South America.
In addition to these segments, other ICL activities include desalination and the production of magnesium metal.
1.2. Business environment and profitability
ICL is a multinational company. The Company's financial results are affected by global economic trends, changes in terms of trade and financing, and fluctuations in exchange rates. The demand for ICL products is affected by the demand for basic agricultural products and the global economic situation, among other factors.
Together with and as part of its business strategy, ICL is taking steps towards adapting its marketing and production policies to global market conditions. ICL is focusing on improving cash flow and diversifying financing sources, and is committed to taking action to improve efficiency and savings.

3
Most of ICL’s sales are in foreign currency, mainly US dollars and euro. A significant part of its operating expenses in Israel is denominated in shekels; therefore depreciation of the shekel against the dollar has a positive impact on ICL's profitability, while appreciation has the opposite effect. The depreciation of the average exchange rate of the euro against the dollar has a negative impact on ICL’s profitability, while appreciation has the opposite impact. Conversely, depreciation of the euro against the dollar improves the competitive ability of ICL's subsidiaries whose functional currency is the euro, compared with competitors whose functional currency is the dollar. The weakening of the dollar against the shekel in the period compared with the corresponding period last year, impacted negatively on ICL’s operating income and financing expenses, by an estimated USD 17.1 million and USD 24.4 million, respectively. ICL has a projected surplus income over expenses in euro for the next 12 months, amounting to approximately USD 350 million, and a projected surplus of expense over income in shekels for the next 12 months, amounting to approximately USD 900 million.1 ICL hedges against some of these foreign currency exposures.
Most of ICL’s loans bear variable interest rates, exposing the Company to fluctuations in these rates. The Company partially hedges against this exposure by using financial hedging instruments, including derivatives. For details of hedging amounts for reducing such exposures, see section 8 below.
There is interdependence between the amount of available arable land and the amount of food for the population, and the use of fertilizers. The increase in global consumption of grains (such as cereals, rice, soybean and corn) is affected by natural population growth and the change in food consumption habits (a shift to richer nutrition, largely based on animal protein, which increases grain consumption) resulting from the rising standard of living, mainly in developing countries. Global consumption of grains (cereals, rice, soy, corn, etc.) is also affected by environmental-quality considerations and the efforts of western countries to reduce dependence on oil imports, which strengthens the trend to shift to bio-fuels. These trends have already led to significantly lower grain stocks a few years ago, and consequently, higher prices of agricultural produce, increased planting of grain crops worldwide, and higher yield per unit of agricultural land, mainly by increased application of fertilizers.
After a decrease in grain prices in 2009 following the economic crisis, grain prices rose again in 2010, reaching levels approaching those of peak prices in 2008. The price increases are mainly due a rise in global consumption of grains that outstripped the pace of production, and an expected fall in grain stocks. This trend has continued into 2011, and prices are maintaining their high level despite volatility in grain prices in the last quarter.
The US Department of Agriculture (the USDA), in its report published on August 11, 2011, foresees stabilization in the ratio of grain stocks to annual consumption at 19% at the end of the 2011/2012 agricultural year (compared with 19.9% at the end of 2010). The decrease compared to 2010 stems mainly from a decrease in corn stocks following a sharp rise in global food and animal feed consumption and a decline in yields despite the estimations in the previous months.2
In the short term, demand for fertilizers is volatile and is affected by factors such as weather in the world’s central agricultural growing regions, fluctuations in planting of the main crops, agricultural input costs, agricultural product prices and developments in biotechnology. Some of these factors are influenced by subsidies and credit lines granted to farmers or to producers of agricultural inputs in various countries, and by environmental regulations. Changes in exchange rates, legislation and international trade policy also affect the supply, demand and level of consumption of fertilizers worldwide. Notwithstanding the volatility that can be caused in the short term as a result of these
1 The assessments of the surplus of revenues over expenses in euro in this paragraph are forward-looking information and there is no certainty that they will be realized. They could change due to fluctuations in world markets as well as local markets, especially at ICL's production sites and in the target markets for ICL products, including, inter alia, changes in the levels of supply and demand and in the prices of the products and changes in the magnitude of the operating expenses of the companies whose functional currency is the euro.
2 The estimates of future trends in this paragraph are forward-looking information and there is no certainty as to whether, if and at what pace they may be realized. They could change due to fluctuations in global agricultural markets, particularly in the target markets for ICL products, including changes in the level of supply and demand, extreme changes in the weather, prices of products, commodities and grains, input prices, transportation and energy costs, and they could also be affected by actions taken by governments, manufactures and consumers. The financial markets could also have a possible effect, including changes in exchange rates, the credit situation and interest costs.

4
factors, the Company estimates that the policy of most countries in the world is to ensure orderly and high-quality supply of food to the population, thereby encouraging agricultural production, which should preserve the long-term growth trend.3
Since the middle of 2006, fertilizer and potash prices have soared, reaching an all-time high in the middle of 2008. Most potash sales in the period were at a price of USD 750 to USD 850 (CFR), mainly in Southeast Asia and Brazil. A few sales were made at approximately USD 1,000 per ton (CFR). Following the decline in global demand for fertilizers and potash, as a result of the economic crisis, prices began to fall. The immediate sharp decline was in nitrogen and phosphorus prices. Potash prices also dropped, although the decrease was not as sharp as the decrease in prices of nitrogen and phosphorus fertilizers. Towards the end of 2009, the global economy started to recover, together with demands in the fertilizer market. According to IFA4 estimates, global sales of potash in 2010 were about 55.5 million tons, almost double the quantity in 2009 – 29.2 million tons.
In July 2011, ICL Fertilizers signed contracts in a number of customers in China for the supply of 500,000 tons of potash in the second half of 2011 at a similar price to recent transactions with other manufacturers and constituting an increase of USD 70 per ton over the contract prices for the first half of the 2011. Right after signing these contracts, ICL reached an agreement to increase the quantities supplied for the second half of 2011 by 250 thousand tons, under conditions identical to the original quantities.
High prices of agricultural produce led to lively demand for potash in the USA, and its price has risen gradually in the past two quarters. In June 2011 PotashCorp published new prices of USD 650-662 per ton.
After several months' delay in the negotiations between the Indian importers and the suppliers of potash, the Canadian trading company Canpotex announced the signing of a new contract with its customers in India. According to the announcement, the contract includes the sale of 670,000 tons between October 1, 2011 and March 31, 2012 at USD 470 per ton for half the quantity and USD 530 per ton for the second half. BPC announced signature of a new contract with its Indian customers that includes the sale of 1.2 million tons at USD 490 CFR per ton for the period from August 2011 to March 2012. After the balance sheet date, ICL Fertilizers entered into agreements with customers in India for the sale of potash in the eight-month period from August 2011 to March 2012, in which ICL Fertilizers will supply 1,390 thousand tons of potash at an average price of USD 490 per ton. An option was given to purchase another 125,000 tons on the same terms.
The upward trend in demand for phosphate fertilizers that started in the second half of 2009 continued into the second quarter of 2011. On the supply side, environmental regulations restricted production in the USA and an export levy imposed on phosphate fertilizers by the Chinese government diminished the export capacity of Chinese manufacturers. In addition, a number of exporters in North Africa, such as Tunisia and Morocco, are facing various operating problems due to political unrest, riots and strikes in those countries.
The demand for phosphate fertilizers in Brazil has increased significantly this year. According to local reports, the supply of phosphate fertilizers in the past five months has increased by 25% compared with the corresponding period in 2010.
In response to the continuing rise in fertilizer prices around the world and the rise in the prices of fertilizers imported to India (mainly DAP), the Indian government announced to importers that it was permitting them to raise the price to the consumer, but requested that they do so with restraint.
In July 2011, Moroccan phosphate manufacturer OCP and South African manufacturer Foskor signed contracts in India for the supply of phosphoric acid in the third quarter at USD 1,050 per ton P2O5, a price rise of about USD 70 per ton compared with the previous quarter.
3 The assessments of future trends in this paragraph are forward-looking information and there is no certainty that they will be realized, when and at what pace. They could change due to fluctuations in world markets as well as local markets, especially at ICL's production sites and in the target markets for ICL products, including, inter alia, changes in the levels of supply and demand and in the prices of the products, the commodities and the cereals. There could also be impact from actions taken by governments, producers and consumers. In addition there could be possible impact of the situation in the financial markets, including changes in exchange rates, credit conditions and interest rates.
4 IFA – Preliminary Annual Potash Statistics 2010 (March 2011).

5
The giant project for producing rock and downstream products in Saudi Arabia (Ma'aden) has commenced DAP production, and the first shipment is about to be sent to India. After running-in, the plant and the mine are expected to produce up to 3 million tons per year of phosphate fertilizers.
The markets of ICL Industrial Products are largely affected by activities in the electronics, construction, automotive, oil drilling, furniture, textile and water treatment markets. The increased demand for most segment products continues to be positive, together with continued price increases in most products. Higher demand and lower supply of bromine in China resulted in an increase in sale prices of elementary bromine compared to the corresponding period last year and compared to the second half of 2010. The continuing increase in demand for flame retardants is mainly due to the growing demand for electronics in the Far East and reduced production by some Chinese manufacturers.
In April 2010, a drilling rig exploded in the Gulf of Mexico, which is a major sales territory for the Company's products. As a result, the US government announced the suspension of deep sea drilling in this region. Although the suspension of drilling has been canceled, the US government is restricting drilling permits, resulting in low segment sales in this region. Nevertheless, sales and prices of clear solutions for drilling increased compared to the corresponding period last year, due to increased sales in other territories, due to higher demand and lower supply of Chinese manufacturers of clear solutions, following a price increase of elementary bromine in China.
The operations of ICL Performance Products are affected by competition in the target markets, by price volatility in the fertilizer market, which affects the segment's principal raw materials, and by volatility in energy prices. The current quarter was marked by continued price rises in the fertilizer market, which led to a rise in the prices of raw materials of phosphorus-based products. Rises in energy prices also led to an increase in production and transportation costs. Concurrently, selling prices of ICL Performance Products increased. Political instability in North Africa and the Middle East led to a decrease in demand in some countries in these regions.
Shipping expenses amounted to about 6% of the total operating costs of ICL in the reporting period. Since 2010, bulk shipping prices have been highly volatile alongside a trend to a decrease in the BDI. Average BDI in the second quarter of 2011 was 1,378 points, a decrease of about 55% compared to the corresponding quarter last year.
Energy costs account for approximately 7% of ICL's total operating costs in the reporting period. Commencing in the third quarter of 2009, energy prices started to rise. In this quarter there was another sharp jump in prices of oil compared to the corresponding quarter last year. The gradual increase in the use of natural gas moderates the effect of the increase in prices of oil and oil products on Group results.
1.3. This Directors' Report is attached to the interim financial statements for the period ended June 30, 2011, and assumes that the financial statements are available to the reader. The Directors' Report is in condensed form for the period and assumes that the Periodic Report for 2010 is also available to the reader.
The financial data, including comparative figures, are taken from the financial statements of ICL, which were prepared in accordance with International Financial Reporting Standards (IFRSs).
6
2. Results of Operations
2.1. Principal financial results
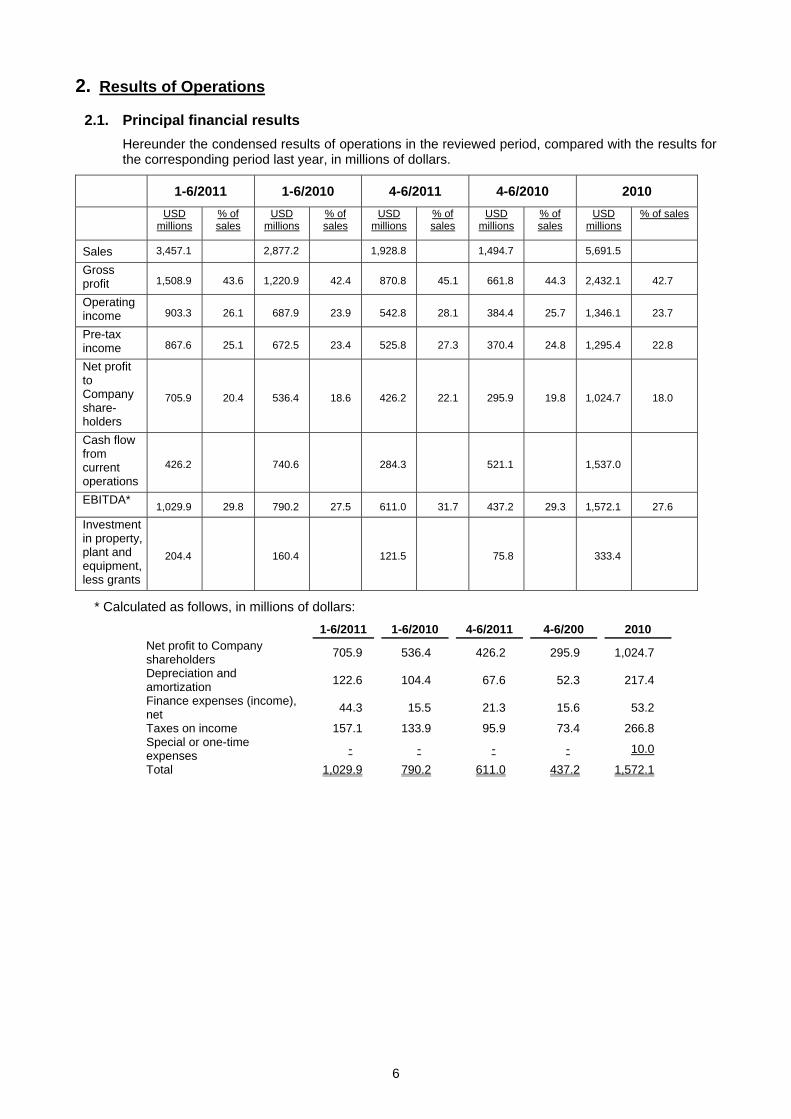
Hereunder the condensed results of operations in the reviewed period, compared with the results for the corresponding period last year, in millions of dollars.
1-6/2011 1-6/2010 4-6/2011 4-6/2010 2010
USD millions
% of sales
USD millions
% of sales
USD millions
% of sales
USD millions
% of sales
USD millions
% of sales
Sales 3,457.1 2,877.2 1,928.8 1,494.7 5,691.5
Gross profit 1,508.9 43.6 1,220.9 42.4 870.8 45.1 661.8 44.3 2,432.1 42.7
Operating income 903.3 26.1 687.9 23.9 542.8 28.1 384.4 25.7 1,346.1 23.7
Pre-tax income 867.6 25.1 672.5 23.4 525.8 27.3 370.4 24.8 1,295.4 22.8
Net profit to Company share- holders
705.9 20.4 536.4 18.6 426.2 22.1 295.9 19.8 1,024.7 18.0
Cash flow from current operations
426.2 740.6 284.3 521.1 1,537.0
EBITDA* 1,029.9 29.8 790.2 27.5 611.0 31.7 437.2 29.3 1,572.1 27.6
Investment in property, plant and equipment, less grants
204.4 160.4 121.5 75.8 333.4
* Calculated as follows, in millions of dollars:
1-6/2011 1-6/2010 4-6/2011 4-6/200 2010 Net profit to Company shareholders
705.9 536.4 426.2 295.9 1,024.7
D epreciation and amortization
122.6 104.4 67.6 52.3 217.4
Finance expenses (income), net
44.3 15.5 21.3 15.6 53.2
Taxes on income 157.1 133.9 95.9 73.4 266.8 Special or one-time expenses
- - - - 10.0
Total 1,029.9 790.2 611.0 437.2 1,572.1

7
2.2. Results of operations for January – June 2011
Sales
Sales of ICL in the reporting period amounted to approximately USD 3,457.1 million, compared with USD 2,877.2 million in the corresponding period last year, an increase of about 20.2%. This increase is due to an increase in selling prices, which led to an increase of about USD 461 million in sales, first-time consolidation of companies acquired during the reporting period, which increased sales by USD 173 million, and the positive impact of a change in exchange rates which resulted in an increase of about USD 34 million in sales. The increase was partially offset by a decrease in quantities sold, which resulted in a decrease of about USD 88 million in sales.
Below is a geographical breakdown of sales:
1-6/2011 1-6/2010 2010 CIF sales USD
millions % USD
millions % USD
millions %
Israel 160.1 4.6 174.9 6.1 313.3 5.5 North America 720.1 20.8 536.8 18.7 1,052.0 18.5 South America 318.6 9.2 298.1 10.4 620.0 10.9 Europe 1,308.8 37.9 962.3 33.4 1,886.2 33.1 Asia 862.7 25.0 849.7 29.5 1,680.4 29.5 Rest of the world 86.8 2.5 55.4 1.9 139.6 2.5 Total 3,457.1 100.0 2,877.2 100.0 5,691.5 100.0
The breakdown of sales indicates an increase in sales in Europe and North America, mainly due to the growing demand for fertilizers, bromine and bromine products in these areas. The delay in signing a potash supply agreement in India and the strike at Haifa Chemicals led to a decrease in the percentage of sales in Israel and in Asia.
Gross profit
Gross profit amounted to USD 1,508.9 million, compared with a profit of USD 1,220.9 million in the corresponding period last year, an increase of approximately USD 288 million. The gross profit margin out of sales amounted to about 43.6%, compared with about 42.4% in the corresponding period last year.
The increase in the gross profit margin compared to the corresponding period last year is mainly due to an increase in selling prices, which resulted in an increase of approximately USD 438 million, and the first-time consolidation of companies acquired in the quarter, which increased gross profit by about USD 48 million. This increase was partially offset by the effects of a decrease in quantities sold, as noted above, which resulted in a decrease of about USD 70 million and by a rise in the prices of raw materials and energy, which resulted in a decrease of about USD 102 million in gross profit, and the negative impact of a change in exchange rates which resulted in a decrease of USD 17 million in gross profit.
Sales and marketing expenses
Expenses for this item amounted to USD 427.5 million, compared with USD 388.5 in the corresponding period last year. The increase stems mainly from the first-time consolidation of the results of companies acquired, and from changes in exchange rates.
General and administrative expenses
These expenses amounted to USD 130.7 million, compared with USD 120.4 in the corresponding period last year. The increase in general and administrative expenses was mainly the result of the first-time consolidation in the reporting period of companies and operations acquired, which resulted in an increase of about USD 6.4 million in these expenses.
8
Research and development expenses
R&D expenses (net of grants from the Chief Scientist) amounted to USD 34.8 million, an increase of about USD 5.2 million compared with the corresponding period last year.
Operating income
Operating income amounted to USD 903.3 million, an increase of USD 215.4 million compared with the corresponding period last year. The increase in operating income stems mainly from the increase in gross profit net of the increased sales and marketing expenses, as noted above. Operating income as a percentage of sales turnover is about 26.1%, compared with 23.9% last year. The increase in the operating income margin stems mainly from the increase in selling prices.
Finance income/expenses
Net finance expenses amounted to about USD 44.3 million, compared with expenses of approximately USD 15.5 million in the corresponding period last year. The increase in finance expenses this year compared with the corresponding period is mainly due to the following factors:
a. Expenses in the period as result of revaluation of transactions in financial derivatives and from revaluation of net short-term financial liabilities amounting to USD 8 million, compared with revenues of USD 6 million last year.
b. An increase of f about USD 21 million in finance expenses due to the effect of exchange rate differences on the provisions for employee benefits.
c. In contrast, a decrease in net interest expenses, which were USD 10 million in the reporting period compared with USD 17 million in the corresponding period last year, resulted in a decrease in net finance expenses.
Tax expenses
Expenses amounted to USD 157.1 million, compared to USD 133.9 million last year. The pre-tax profit rate is 18.1% compared to 19.9% last year. The decrease in the tax rate in the reporting period compared to the corresponding period last year is due to the following factors:
a. The effect of the change in the dollar-shekel exchange rate for the reporting period compared to the corresponding period last year, which led to an increase in the tax rate of companies operating in Israel, due to differences in the measuring base.
b. The tax rate on ordinary income in Israel decreased from 25% to 24%. c. In the reporting period there was a decrease in unrecognized expenses compared to the
corresponding period last year, due to a decrease in the costs of options granted to employees.
Net profit
Net profit for the shareholders of the Company amounted to USD 705.9 million, compared with USD 536.4 million in the corresponding period last year.
2.3. Results of operations for April – June 2011
Sales
Sales of ICL in the quarter amounted to USD 1,928.8 million compared with USD 1,494.7 million in the corresponding period last year, an increase of about 29.0%.
That increase stems from a rise in selling prices which resulted in an increase of USD 304 million in sales from the first-time consolidation of the results of companies acquired during the quarter, which increased sales by about USD 137 million, and the positive effects of change in exchange rates, which increased sales by about USD 34 million. The increase was partially offset by a decrease in quantities sold, which resulted in a decrease in sales of about USD 42 million.
9
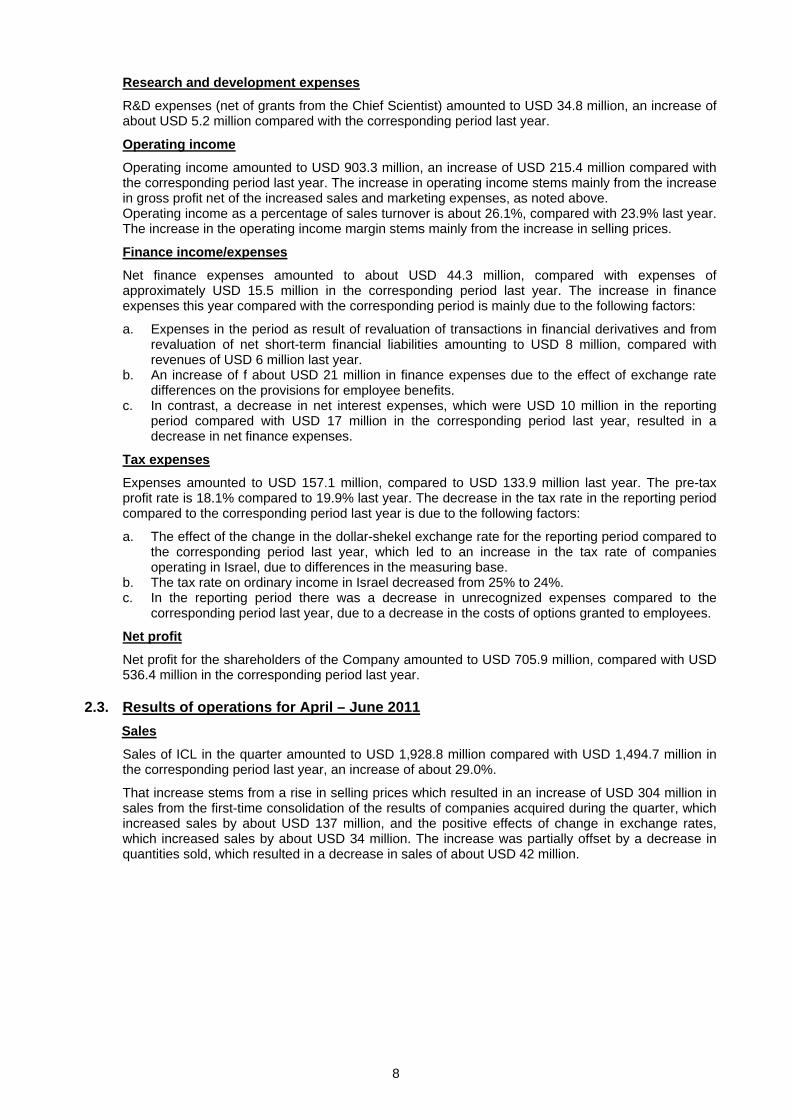
Below is a geographical breakdown of sales:
4-6/2011 4-6/2010 $ millions % $ millions %Israel 95.5 5.0 85.7 5.7 North America 415.8 21.6 283.1 18.9 South America 226.0 11.7 207.7 13.9 Europe 666.9 34.6 442.3 29.6 Asia 471.1 24.4 457.1 30.6 Rest of the world 53.5 2.8 18.8 1.3 Total 1,928.8 100.0 1,494.7 100.0
The breakdown of sales indicates an increase in sales in Europe and North America, mainly as a result of a rise in selling prices.
Gross profit
Gross profit amounted to about USD 870.8 million, compared with USD 661.8 million in the corresponding period last year, an increase of USD 209.0 million. The gross profit margin out of sales turnover is about 45.1%, compared with about 44.3% in the corresponding period last year.
The improvement in the margin compared with last year stems mainly from the rise in selling prices of most of the Company's products, which contributed to an increase of about USD 293 million in sales, from the first-time consolidation of the results of companies acquired during the quarter, which contributed approximately USD 34 million, from a decrease in quantities sold which resulted in a decrease of about USD 30 million, from a rise in the prices of raw materials, which decreased gross profit by about USD 61 million, and from an increase of about USD 23 million in maintenance expenses.
Sales and marketing expenses
Sales and marketing expenses amounted to USD 234.5, an increase of USD 31.7 million compared with the corresponding period of the previous year. The increase stems primarily from the first-time consolidation of the results of acquired companies and the effect of the changes in exchange rates.
General and administrative expenses
Expenses for this item amounted to USD 69.4 million, an increase of USD 9.2 million compared with the corresponding period last year This increase was affected primarily by the first-time consolidation of companies and operations acquired in the reporting period, which led to an increase of USD 6.4 million in expenses.
Research and development expenses
R&D expenses amounted to USD 18.2 million, an increase of USD 3.2 million compared with the corresponding period last year.
Operating income
Operating income increased by USD 158.4 million compared with last year, reaching USD 542.8 million. The increase stems from the above-mentioned increase in gross profit, which was partially offset by a rise in sales and marketing expenses
Operating income out of sales turnover is 28.1%, compared with 25.7% in the corresponding period of the previous year.
Finance income / expenses
Net finance expenses in the reporting period amounted to USD 21.3 million, compared with USD 15.6 million in the corresponding quarter last year. The increase in net finance expenses in the quarter compared with the corresponding quarter last year stems primarily from the effect of the change in the shekel/dollar exchange rate on employee benefit liabilities, which generated an expense of about USD 9 million in the quarter compared with income of about USD 13 million in the corresponding period last year (a total increase of about USD 22 million). In contrast, the increase in net finance expenses was offset by a decline in expenses from transactions in financial derivatives, a revaluation of short-term net financial liabilities amounting to USD 14 million, and a decrease of USD 3 million in net interest expenses.
10
Tax expense
The tax expenses amounted to USD 95.9 million, compared with USD 73.4 million in the corresponding period last year. The tax rate on profit is approximately 18.2%, compared with about 19.8% last year.
The source of the decline in the tax rate in the quarter compared with the corresponding period of the previous year lies in the following factors:
d. The rate of income tax on ordinary income in Israel was lowered from 25% to 24%. e. In the current quarter there was a decline in expenses not recognized for tax purposes
compared with the corresponding period of the previous year, resulting from a fall in the costs of options allotted to Company employees.
Net profit
Net profit for the shareholders of the Company amounted to USD 426.2 million, compared with USD 295.9 million in the corresponding quarter last year, an increase of USD 130.3 million.
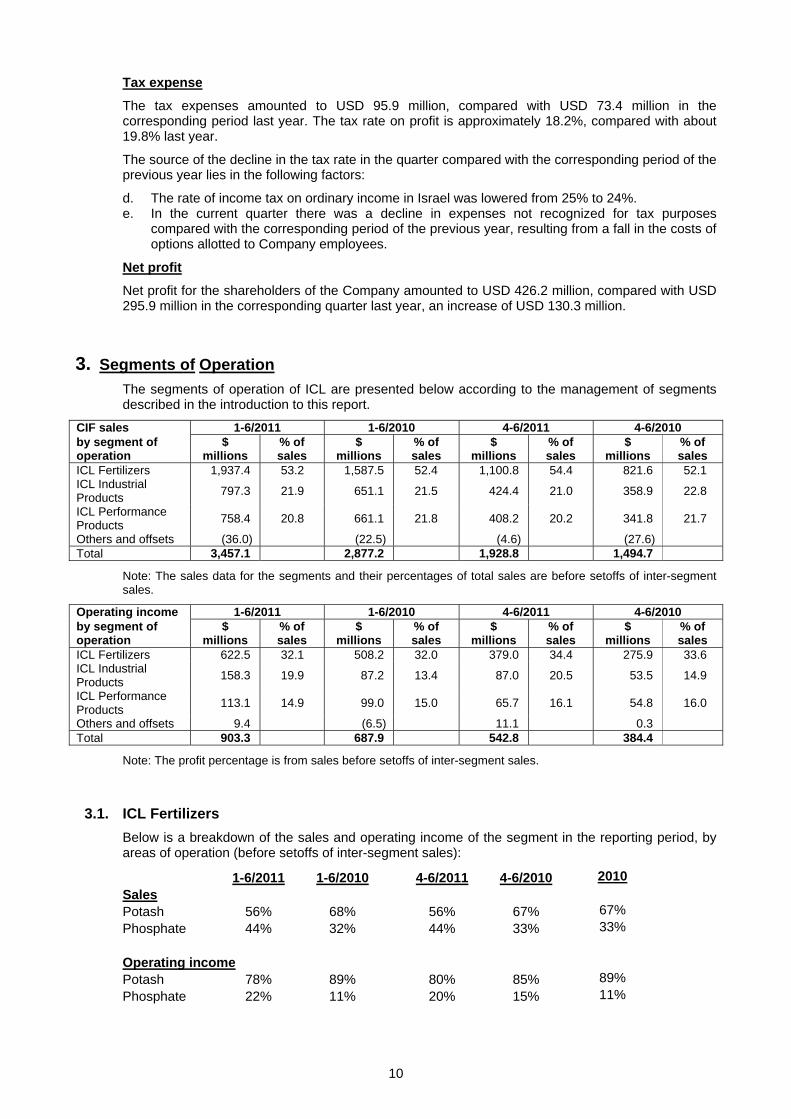
3. Segments of Operation
The segments of operation of ICL are presented below according to the management of segments described in the introduction to this report.
4-6/20104-6/20111-6/20101-6/2011 CIF sales % of sales
$ millions
% of sales
$ millions
% of sales
$ millions
% of sales
$ millions
by segment of operation
52.1 821.6 54.4 1,100.8 52.4 1,587.5 53.2 1,937.4 ICL Fertilizers
22.8 358.9 21.0 424.421.5 651.121.9 797.3 ICL Industrial Products
21.7 341.8 20.2 408.221.8 661.120.8 758.4 ICL Performance Products
(27.6) (4.6) (22.5) (36.0) Others and offsets 1,494.7 1,928.82,877.2 3,457.1 Total
Note: The sales data for the segments and their percentages of total sales are before setoffs of inter-segment sales.
4-6/20104-6/20111-6/20101-6/2011 Operating income % of sales
$ millions
% of sales
$ millions
% of sales
$ millions
% of sales
$ millions
by segment of operation
33.6 275.9 34.4 379.0 32.0 508.2 32.1 622.5 ICL Fertilizers
14.9 53.5 20.5 87.013.4 87.219.9 158.3 ICL Industrial Products
16.0 54.8 16.1 65.715.0 99.014.9 113.1 ICL Performance Products
0.3 11.1 (6.5) 9.4 Others and offsets 384.4 542.8687.9 903.3 Total
Note: The profit percentage is from sales before setoffs of inter-segment sales.
3.1. ICL Fertilizers
Below is a breakdown of the sales and operating income of the segment in the reporting period, by areas of operation (before setoffs of inter-segment sales):
1-6/2011 1-6/2010 4-6/2011 4-6/2010 2010
Sales
Potash 56% 68% 56% 67% 67%
Phosphate 44% 32% 44% 33% 33%
Operating income
Potash 78% 89% 80% 85% 89%
Phosphate 22% 11% 20% 15% 11%

11
Sales
Sales in the reporting period amounted to USD 1,937.4 million, an increase of approximately USD 349.9 million compared with the corresponding period last year, representing an increase of about 22%.
The increase in sales stems mainly from an increase in selling prices of potash, phosphate fertilizers and phosphate rock, which led to an increase of approximately USD 332 million in sales, and from consolidation for the first time of the results of the companies acquired in the reporting period, which increased sales by USD 173 million. This increase was partially offset by a decrease in potash sales which led to a decrease of approximately USD 150 million in sales.
Profitability
Operating income in the segment in the reporting period amounted to USD 622.5 million, an increase of about USD 114.2 million compared with the corresponding period last year. The margin of operating income out of sales was about 32.1%, compared with about 32.0% last year.
The increase in operating income is mainly due to an increase in sales of potash, phosphate fertilizers and phosphate rock which increased operating income by USD 248 million. This increase was partially offset by an increase in prices of sulfur and other raw materials which resulted in a decrease of about USD 32 million. There was also a decline in quantities of potash sold which reduced operating income by USD 96 million.
Potash
Revenue from potash includes the sales of potash from Israel, Spain (Iberpotash) and England (Cleveland Potash).
Potash – Revenue and profit
$ millions 1-6/2011 1-6/2010 4-6/2011 4-6/2010 2010
Revenue * 1,109.1 1,102.5 633.6 563.7 2,140.7
Operating income 487.4 452.8 305.3 235.0 857.9
* Including revenue from inter-segment sales
Revenues from potash sales in the period were similar to revenues in the corresponding period of the previous year and were affected by the increase in potash prices which increased revenues by about USD 160 million, and in contrast by a decrease in the quantities of potash sold which reduced sales by about USD 150 million. This decrease stems inter alia from the cessation in potash shipments from Israel during the strike which occurred in the first quarter, as well as from the delay in signing the India potash sales agreement.
The increase in operating income is mainly due to the effects of the increase in selling prices of about USD 134 million. This increase was partially offset by a decrease in selling prices which reduced operating income by USD 96 million.
In the first quarter of 2011, the Dead Sea Works workers’ union announced a strike which was expressed inter alia by a disruption of potash production and maintenance activities. The strike caused immediate production losses of approximately 450 thousand tons, however the production process and the building up stocks of carnallite in the evaporation ponds continued normally. The Company believes that it will succeed in recovering this inventory in its production over the coming years.
During the strike period, potash shipments from Israel were suspended to customers. The Company believes that part of the sales that were not made will be made up by the end of the year.

12
Potash – Production, sales and closing inventories
Thousands of tons 1-6/2011 1-6/2010 4-6/2011 4-6/2010 2010
Production 1,947 2,054 1,200 1,057 4,251
Sales to external customers 2,261 2,728 1,274 1,455 5,266
Sales to internal customers 136 129 78 72 292
Total sales (including internal sales) 2,397 2,857 1,352 1,527 5,558
Closing stock 1,160 2,114 1,160 2,114 1,610
The quantity of potash sold to external customers in the reporting period is about 467 thousand tons less than in the corresponding period last year.
In July 2011, ICL Fertilizers signed contracts with a number of customers in China to supply 750,000 tons in the second half of 2011, at a price representing an increase of USD 70 per ton compared with contract prices for the first half of 2011. After the balance sheet date, ICL Fertilizers entered into agreements with customers in India to sell potash for eight months (August 2011 through March 2012) under which ICL Fertilizers will supply 1,390 thousand tons of potash at an average price of USD 490 per ton. There is an option to purchase an additional 125,000 tons under the same conditions (for further details, see section 1.2).
On April 12, 2011 the British government approved a £15 million grant to Cleveland Potash Ltd. (CPL), a UK-based company of ICL Fertilizers, to encourage CPL's mining and processing of polyhalite, a mineral used as fertilizer for agriculture and which is found beneath the potash layer in CPL's mine. Geological studies performed by CPL indicate that there more than one billion tons of polyhalite ore beneath the potash layer in the Company's mine. Polyhalite is a mineral that can be used in its natural form as fertilizer for organic agriculture or as raw material in the production of specialty fertilizers. ICL is considering constructing a plant to produce specialty fertilizers and industrial products based on polyhalite in the Tees Valley area, near its potash mine in the UK. The British government announced that it views with importance the establishment of a production plant and increased mining activities in that it will result in increased employment in the area, therefore it intends to assist and support the establishment of the production facility through the above-mentioned grant.
On April 13, 2011, ICL's board of directors, as part of its streamlining plan for Iberpotash SA, the Spanish subsidiary of ICL Fertilizers, approved the merger of two plants into one site. The Suria production site, including the mine and plant, will be expanded and mining and production at the other site will be terminated. The first stage of the plan, which has been approved, includes expansion of potash production and granulation capacity as well as establishment of a production plant for vacuum salt (salt with high chemical purity) at Suria. The second stage, which has not yet been approved, includes further expansion of potash production capacity, to 1.1 million tons, of which 630,000 tons will be granulated potash and 50,000 tons will be technical potash, as well as a production capacity of 1.5 million tons of vacuum salt. The Company believes that implementation of the first stage of the plan, which will require investment of an estimated €160 million, will be completed at the beginning of 2014. The Company believes that implementation of the first stage of the plan will reduce expenses and contribute to streamlining, which will reduce potash production costs and contribute to conformity with sustainability principles related to environmental protection. Implementation of the second stage will result in higher potash production at one site compared to production at two separate sites. The closing of the second site will not have a material effect on the Company's results in the second quarter of 2011.
Fertilizers and phosphates
Revenue from these products derive from sales in Israel and abroad of phosphate rock (as a raw material and for direct fertilization), fertilizers (including phosphate, compound, liquid and fully soluble fertilizers, which include various proportions of nitrogen, phosphorus and potassium), phosphoric acid used as a raw material for fertilizer production (green acid), and other products.
Fertilizers and phosphates – Revenue and profit
$ millions 1-6/2011 1-6/2010 4-6/2011 4-6/2010 2010
Revenue * 886.1 525.4 502.4 279.6 1,056.3
Operating income 136.4 53.4 77.6 42.8 108.6
* Including revenue from inter-segment sales

13
The increase in revenues in the reporting period, compared to the corresponding period last year, is mainly due to the increase in selling prices of phosphate fertilizers and phosphate rock which increased sales by USD 172 million dollars and to inclusion of the results of companies consolidated for the first time which increased income by about USD 173 million dollars. In addition, the increase in selling prices of phosphate fertilizers and phosphate rock also contributed to an increase of about USD 12 million in sales.
The increase in operating profit in the reporting period compared with last year is mainly due to the increase in selling prices of phosphate fertilizers and phosphate rock, which contributed to a profit of USD 118 million. This increase was partially offset by an increase in production, the selling prices of sulfur and other raw materials, which resulted in a decrease of USD 32 million.
Fertilizers and phosphates – Production and sales
Thousands of tons 1-6/2011 1-6/2010 4-6/2011 4-6/2010 2010
Phosphate rock Production Sales For internal uses
1,567
398 1,190
1,547
292 1,249
774 167 554
850 104 661
3,135
636 2,584
Fertilizers Production Sales*
816 922
838 911
404 436
435 457
1,688 1,735
* To external customers
Phosphate rock is produced according to demand, both for internal uses and for sales to external customers, while maintaining appropriate stock levels.
In the second quarter of 2011 there was a decrease in the production of phosphate rock compared with last year, mainly as a result of maintenance work in the production facilities.
On February 28, 2011, a transaction was completed with the American company Scotts Miracle-Gro to acquire the companies, assets and activities of a specialty fertilizer business unit (see section 9.5).
At the beginning of April, the subsidiary in Spain acquired 100% of the interests in A. Fuentes Mendez SA, which manufactures and markets specialty fertilizers in Spain (see Section 9.9).
3.2. ICL Industrial Products
Sales
Sales of ICL Industrial Products in the reporting period reached a record USD 797.3 million, an increase of about USD 146.2 million compared with the corresponding period last year. The increase is due to an increase in selling prices, which contributed to an increase of USD 131 million in sales, mainly due to an increase in selling prices of flame retardants amounting to USD 78 million. Quantities sold increased by about USD 15 million.
Profitability
Operating income in the reporting period reached a record USD 158.3 million, compared with USD 87.2 million in the corresponding period last year.
The percentage of operating income from sales amounted to about 19.9% compared with operating income of 13.4% last year.
The increase in operating income was mainly due to the increase in selling prices, which contributed to an increase of about USD 131 million in profitability, and to the increase in quantities sold and produced, which contributed to an increase of about USD 3 million in profitability. Conversely, the increase was partially offset by an increase in raw material and energy prices of about USD 30 million, an increase in production expenses which contributed to a decrease of about USD 24 million, and the weakening of the US dollar against the shekel and the euro which accounted for about USD 9 million.

14
3.3. ICL Performance Products
Sales:
Sales in this segment amounted to USD 758.4 million, an increase of USD 97.3 million compared with the corresponding period last year.
The increase was due to an increase in selling prices of some of the segment products, which resulted in an increase of about USD 38.3 million in sales as well as an increase of about USD 59 million as a result of the increase in quantities sold.
Profitability
Operating income of the segment in the reporting period amounted to USD 113.1 million, an increase of about USD 14.2 million compared with the corresponding period last year. The increase is mainly due to the effects of the increase in selling prices, which contributed about USD 38.3 million and an increase in quantities sold, which contributed USD 8.5 million to the increase in operating income, and the weakening of the US dollar against the shekel and the euro which accounted for USD 3 million. The increase was partially offset by the increase in raw material prices, which reduced operating income by approximately USD 30 million and an increase in other expenses, mainly transportation expenses which contributed to a decline of about USD 5.6 million.
4. The Financial Position and Sources of Financing of ICL
At June 30, 2011, an increase of USD 785 million was recorded in the net interest-bearing financial liabilities of ICL compared with the balance at the end of 2010, bringing the total to approximately USD 1,443 million. ICL's sources of financing are short- and long-term loans, mostly from international banks, debentures issued to the public and to institutional investors in Israel and the USA, non-listed short-term commercial paper issued from time to time, and customer securitization, in which some of the companies in the Group sell customer receivables in return for a credit facility. The total amount of the securitization framework and credit facility amounts to USD 350 million. At June 30, 2011, ICL had used USD 256 million of the securitization facility.
On March 14, 2011, ICL entered into an agreement with 17 banks in Europe, the United States and Israel, for a revolving credit facility of USD 675 million. The credit facility is for five years, and is repayable in full at the end of the period. The basic interest rate of the credit facility for up to USD 225 million is Libor + 0.8% and additional 0.15%-0.3% for amounts exceeding USD 225 million. At the reporting date the credit facility had not been used.
5. Cash Flow
Cash flow generated by operating activities in the reporting period amounted to USD 426.2 million, compared with USD 740.6 million in the corresponding period last year. The decrease in cash flow from operating activities is mainly due to a one-time payment of USD 165 million for income tax as part of the assessment agreement for 2004-2008, and to an increase in working capital, which was partially offset by an increase in profit in the reporting period compared to last year. Cash flow from operating activities and the increase in financial commitments were the main source of net financing of investments of USD 204.4 million in property, plant and equipment, financing the consideration of about USD 424 million for acquisition of the companies and operations in the reporting period, (see section 9.4 for acquisition of assets and activities of a specialty fertilizer business unit) and distribution of a dividend of USD 534 million.
6. Investments
In the reporting period, investments in property, plant and equipment amounted to approximately USD 204 million, compared with about USD 160 million in the corresponding period last year.
7. Human Resources
The total number of employees in ICL as at June 30, 2011 was 11,636 compared with 10,924 at June 30, 2010, an increase of 712 employees. The increase in the number of employees is mainly due to the addition of additional human resources caused by the acquisition of companies as well as to the completion of investments in new facilities, which have resulted in increased production and the return to pre-crisis work formats, mainly in companies abroad.

15
8. Market Risk – Exposure and Management
Base rates as at June 30, 2011:
Currency Exchange rate NIS/USD 0.29283 EUR/USD 1.44776 GBP/USD 1.60015 JPY/USD 0.01244 BRL/USD 0.63916 CNY/USD 0.15452
Update of sensitivity to changes in the exchange rates of balances in the statement of financial position at June 30, 2011:
Increase (decrease)
in fair value Fair value
Increase (decrease) in fair value
USD/NIS (USD
millions) (USD
millions) (USD
millions) (USD
millions) (USD
millions)
Type of instrument Increase of
10% Increase of
5% Decrease of
5% Decrease of
10% Cash and cash equivalents (5.2) (2.6) 52.5 2.6 5.2 Short-term deposits and loans (2.1) (1.0) 20.8 1.0 2.1 Trade receivables (7.4) (3.7) 74.4 3.7 7.4 Receivables and debit balances (4.8) (2.4) 48.3 2.4 4.8 Long-term deposits and loans (21.9) (10.9) 218.6 10.9 21.9 Credit from banks and others 0.3 0.1 (2.8) (0.1) (0.3) Trade payables 27.4 13.7 (274.2) (13.7) (27.4) Other payables 14.8 7.4 (148.3) (7.4) (14.8) Bank loans 7.2 3.6 (72.1) (3.6) (7.2) Debentures 40.2 20.1 (402.0) (20.1) (40.2) Options (25.5) (14.5) 13.9 19.7 43.7 Forward (20.1) (11.1) 1.7 11.1 23.9 Swap (33.5) (17.5) 35.6 19.4 40.9 Embedded derivatives 8.4 4.2 2.6 (4.2) (8.4) Total (21.9) (14.4) (431.0) 21.6 51.3
Increase (decrease)
in fair value Fair value Increase (decrease)
in fair value
CPI (USD
millions) (USD
millions) (USD
millions) (USD
millions) (USD
millions)
Type of instrument Increase of
10% Increase of
5% Decrease of
5% Decrease of
10% Long-term deposits and loans 8.3 4.1 82.9 (4.1) (8.3) Credit from banks and others (0.3) (0.1) (2.7) 0.1 0.3 Other payables (0.1) 0.0 (0.8) 0.0 0.1 Long-term bank loans (7.2) (3.6) (72.1) 3.6 7.2 Fixed-interest debentures (15.1) (7.6) (151.3) 7.6 15.1 CPI/USD swap 5.3 2.7 11.8 (2.7) (5.3) Forward 6.2 3.1 1.5 (3.1) (6.2) Embedded derivative 20.0 10.0 13.5 (10.0) (20.0) Total 17.1 8.6 (117.2) (8.6) (17.1)

16
Increase (decrease)
in fair value Fair value Increase (decrease)
in fair value
EUR/USD (USD
millions) (USD
millions) (USD
millions) (USD
millions) (USD
millions)
Type of instrument Increase of
10% Increase of
5% Decrease of
5% Decrease of
10% Cash and cash equivalents (6.2) (3.1) 61.5 3.1 6.2 Short-term deposits and loans (3.8) (1.9) 37.5 1.9 3.8 Trade receivables (39.9) (19.9) 398.8 19.9 39.9 Receivables and debit balances (2.1) (1.0) 20.7 1.0 2.1 Long-term deposits and loans (0.3) (0.1) 2.6 0.1 0.3 Credit from banks and others 5.4 2.7 (53.7) (2.7) (5.4) Trade payables 23.6 11.8 (235.8) (11.8) (23.6) Other payables 9.2 4.6 (92.4) (4.6) (9.2) Long-term bank loans 25.1 12.5 (251.0) (12.5) (25.1) Options 16.8 8.3 (5.6) (9.5) (17.9) Forward 21.8 10.3 (1.3) (9.3) (17.8) Embedded derivative 6.2 3.1 9.7 (3.1) (6.2) Total 55.8 27.3 (109.0) (27.5) (52.9)
Increase (decrease)
in fair value Fair value
Increase (decrease) in fair value
GBP/USD (USD
millions) (USD
millions) (USD
millions) (USD
millions) (USD
millions)
Type of instrument Increase of
10% Increase of
5% Decrease of
5% Decrease of
10% Cash and cash equivalents (0.4) (0.2) 4.1 0.2 0.4 Short-term deposits and loans (2.7) (1.4) 27.5 1.4 2.7 Trade receivables (6.8) (3.4) 68.4 3.4 6.8 Receivables and debit balances (0.1) (0.1) 1.2 0.1 0.1 Credit from banks and others 0.6 0.3 (6.0) (0.3) (0.6) Trade payables 1.2 0.6 (12.4) (0.6) (1.2) Other payables 1.6 0.8 (16.1) (0.8) (1.6) Forward 4.2 2.2 0.4 (2.4) (5.2) Total (2.4) (1.2) 67.1 1.0 1.4
Increase (decrease)
in fair value Fair value
Increase (decrease) in fair value
GBP/EUR (USD
millions) (USD
millions) (USD
millions) (USD
millions) (USD
millions)
Type of instrument Increase of
10% Increase of
5% Decrease of
5% Decrease of
10% Forward (0.9) (0.5) (0.4) 0.5 1.1 Options (2.3) (1.2) (0.7) 0.7 1.5 Total (3.2) (1.7) (1.1) 1.3 2.5
Increase (decrease)
in fair value Fair value
Increase (decrease) in fair value
JPY/USD (USD
millions) (USD
millions) (USD
millions) (USD
millions) (USD
millions)
Type of instrument Increase of
10% Increase of
5% Decrease of
5% Decrease of
10% Cash and cash equivalents (1.7) (0.9) 17.3 0.9 1.7 Trade receivables (1.7) (0.8) 17.0 0.8 1.7 Receivables and debit balances 0.0 0.0 0.2 0.0 0.0 Long-term deposits and loans 0.0 0.0 0.2 0.0 0.0 Credit from banks and others 0.0 0.0 0.0 0.0 0.0 Trade payables 0.3 0.1 (2.9) (0.1) (0.3) Other payables 0.0 0.0 (0.4) 0.0 0.0 Long-term bank loans 0.0 0.0 (0.1) 0.0 0.0 Options 0.7 0.2 (0.1) (0.4) (1.2) Forward 0.0 0.0 0.0 0.0 0.0 Total (2.4) (1.4) 31.2 1.2 1.9

17
Increase (decrease)
in fair value Fair value
Increase (decrease) in fair value
BRL/USD (USD
millions) (USD
millions) (USD
millions) (USD
millions) (USD
millions)
Type of instrument Increase of
10% Increase of
5% Decrease of
5% Decrease of
10% Cash and cash equivalents (0.6) (0.3) 5.6 0.3 0.6 Trade receivables (0.8) (0.4) 8.0 0.4 0.8 Receivables and debit balances 0.0 0.0 0.1 0.0 0.0 Trade payables 0.6 0.3 (6.0) (0.3) (0.6) Other payables 0.1 0.0 (0.6) 0.0 (0.1) Total (0.7) (0.4) 7.1 0.4 0.7
Increase (decrease)
in fair value Fair value
Increase (decrease) in fair value
CNY/USD (USD
millions) (USD
millions) (USD
millions) (USD
millions) (USD
millions)
Type of instrument Increase of
10% Increase of
5% Decrease of
5% Decrease of
10% Cash and cash equivalents (2.0) (1.0) 20.0 1.0 2.0 Short-term deposits and loans (0.3) (0.2) 3.4 0.2 0.3 Trade receivables (1.9) (0.9) 18.7 0.9 1.9 Receivables and debit balances 0.0 0.0 0.1 0.0 0.0 Credit from banks and others 0.2 0.1 (1.5) (0.1) (0.2) Trade payables 1.2 0.6 (11.8) (0.6) (1.2) Other payables 0.3 0.2 (3.2) (0.2) (0.3) Long-term loans from banks 0.0 0.0 0.0 0.0 0.0 Total (2.5) (1.2) 25.7 1.2 2.5
Increase (decrease)
in fair value Fair value
Increase (decrease) in fair value
(USD
millions) (USD
millions) (USD
millions) (USD
millions) (USD
millions)
Type of instrument Increase of 10%
Increase of 5%
Decrease of 5%
Decrease of 10%
Hedging of marine transportation 4.0 2.0 (16.8) (2.0) (4.0) Update of sensitivity to changes in the LIBOR interest rate at June 30, 2011:
Increase (decrease)
in fair value Fair value
Increase (decrease) in fair value
(USD
millions) (USD
millions) (USD
millions) (USD
millions) (USD
millions)
Type of instrument Increase of
1% Increase of
0.5% Decrease of
0.5% Decrease of
1% Fixed-interest debentures 2.4 1.2 (94.0) (1.3) (2.5) Collar transactions 5.0 2.5 (5.1) (2.4) (4.7) Swap transactions 5.7 2.9 (9.2) (2.7) (4.9) Other options 0.8 0.5 (1.2) (0.7) (1.5) NIS/USD swap 5.5 2.8 23.7 (2.3) (4.0) Total 19.4 9.9 (85.8) (9.4) (17.6)

18
Update of sensitivity to changes in the index interest rate at June 30, 2011:
Sensitivity to changes in the index interest rate
Increase (decrease) in fair value
Fair value Increase (decrease)
in fair value
(USD millions)
(USD millions)
(USD millions)
(USD millions)
(USD millions)
Type of instrument Increase of
1% Increase of
0.5% Decrease of
0.5% Decrease of
1% Fixed-interest debentures 4.0 2.0 (151.3) (2.0) (4.1) Long-term bank loans 4.1 2.1 (72.1) (2.2) (4.5) CPI/USD swap (1.3) (0.7) 11.8 0.7 1.3 Total 6.8 3.4 (211.6) (3.5) (7.3)
Update of sensitivity to changes in the shekel interest rate at June 30, 2011:
Sensitivity to changes in the shekel interest rate
Increase (decrease) in fair value
Fair value Increase (decrease)
in fair value
(USD millions)
(USD millions)
(USD millions)
(USD millions)
(USD millions)
Type of instrument Increase of
1% Increase of
0.5% Decrease of
0.5% Decrease of
1% Fixed-interest debentures 4.6 2.3 (220.5) (2.4) (4.7) NIS/USD swap (8.4) (4.3) 23.4 4.3 8.7 Total (3.8) (2.0) (197.1) 1.9 4.0

19
Update of positions in derivatives at June 30, 2011
Hedging transactions against the effect of changes in exchange rates on cash flow USD thousands
Nominal value Fair value Up to one year Up to one year Long Short Long ShortTransactions in dollars against other currencies
(direction of transaction in derivatives is dollar purchase)
EUR/USD in USD thousands Forward 196,017 (1,257) Call options 172,681 (8,998) Put options 172,788 3,429 JPY/USD in USD thousands Forward Call options 21,000 71 Put options 19,000 (153) NIS/USD in USD thousands Forward 232,000 1,659 Call options 325,852 (2,614) Put options 421,929 16,496 GBP in thousands Forward 46,380 416 GBP/EUR in USD thousands Forward 7,000 (415) Call options 20,449 (794) Put options 20,449 85 Update of sensitivity to changes in the ocean freight rate on balances in the statement of financial position at June 30, 2011 Hedging transactions for increase of marine transportation and energy prices – up to one year
27,869 (8,989)
More than one year 28,994 (7,849) Swap contracts and futures contracts for the Company's liabilities
Israeli fixed to variable interest swap contract 76,340 (329) Fixed interest dollar liability to variable interest dollar liability swap contract from CPI-linked fixed interest liability – not recognized
91,782 8,885
Fixed interest shekel to dollar liability fixed-interest swap contract from fixed-interest shekel liability
178,553 14,879
Cash flow swap contract from fixed-interest shekel liability to fixed-interest dollar liability – recognized for accounting
38,892 11,839
Futures contract for CPI purchase – more than one year
53,291 1,471
Principal terms of the material derivative instruments used for economic hedging of foreign currency risk:
Nominal value in USD thousands
Carrying amount/fair value
Average transaction rate
Forward transactions USD/NIS 213,000 1,271 3.44 EUR/USD 196,017 (1,257) 1.44
The expiration date of all the derivatives used for economic hedging of foreign currency risk is up to one year.

20
Interest-hedging transactions – for hedging against changes in variable interest rate (LIBOR) on dollar loans (in USD thousands) Nominal value Fair value Up to one year Over one year Up to one year Over one year Long Short Long Short Long Short Long ShortSwap 20,000 331,262 48,000 811 )16,241( 6,223 Caps 200,000 2,035 Floors 200,000 (7,091) Other options 30,000 (1,222)
In swap transactions, the Company replaces the variable interest rate paid on loans received for fixed interest with rates between 2.5% and 4.3%. In cap and floor transactions, the Company fixes the float of variable interest loans in the range of 1% to 5.25%.
In 2009, the Company issued listed debentures amounting to NIS 1.6 million. Some of these series are denominated in shekels, some are linked to the CPI and bear fixed interest, and some are linked to the USD (see section 5.3.5 in Chapter A of the Periodic Report – Description of the Corporation's Business).
For the CPI-linked shekel liabilities, the Company has swap and hedging transactions from shekel to dollar. In addition, the Company has derivatives to hedge most of the exposure to changes in the CPI.
In addition, during the third quarter of 2009 the Company invested in derivatives for hedging the exposure to changes to changes in the cash flows of the expanded series 2 debentures, in respect of changes in the exchange rates of the shekel against the dollar. This hedging transaction was accounted for in the financial statements as accounting hedging. As a result of the accounting hedging, the Company recognized some of the changes in the fair value of the derivatives (loss of USD 9.1 million) in capital reserve.
None of the other hedging transactions made by the Company are accounted for as an accounting hedge in the financial statements.

21
9. Update on the description of the Company's business and material events during and after the balance sheet period
9.1 On March 27, 2011, the board of directors of ICL resolved to distribute a cash dividend of USD 170 million (net dividend less the subsidiary's share is USD 169.7 million), which will be distributed on May 12, 2011.
9.2 On May 15, 2011, the board of directors of ICL resolved to distribute a cash dividend of USD 195 million (net dividend less the subsidiary's share is USD 194.7 million), which was distributed on June 28, 2011.
9.3 After the balance sheet date, on August 16, 2011, the board of directors of ICL resolved to distribute a cash dividend of USD 298 million (net dividend less the subsidiary's share is USD 297.5 million), which will be distributed on September 26th, 2011.
9.4 On September 30, 2010 the collective work agreement for Dead Sea Works (“DSW”), a company in the Fertilizer Segment expired. On November 18, 2010, the General Union declared a labor dispute at Dead Sea Works relating to disagreements during the negotiation process for signing the new collective agreement. On January 4, 2011, the Workers' Council of DSW declared a strike, reflected in work sanctions that restricted production and maintenance activities, which affected the operations of DSW and other plants on the DSW site. These sanctions disrupted production processes to the extent of suspension of plant production and potash shipments to the Company’s customers. On February 16, 2011, the management of DSW and the Workers’ Council reached a memorandum of understanding regarding the labor agreement for the coming years and the sanctions ended. On the same date a principle agreement was signed for a new collective agreement for five years, ending in September 2015. On 14 April, 2011, the collective agreement was signed.
9.5 On February 28, 2011, a transaction was completed for acquisition from the American company Scotts Miracle-Gro of the companies, assets and activities of a specialty fertilizer business unit called The Global Professional Business. For further information, see Note 5(5) to the financial statements.
9.6 On December 12, 2010, a subsidiary in the fertilizers segment (DSW) entered into a conditional agreement with East Mediterranean Gas S.A.E for the supply of 0.2 BCM of natural gas to a power station that DSW is considering establishing at Sdom. Pursuant to the agreement, DSW has an option to purchase a further quantity of natural gas of up to 0.53 BCM. The option is exercisable until March 31, 2011. The total monetary value of the agreement for the entire contractual period until 2030, consistent with the component for the current cost of generating electricity, is USD 370-460 million assuming that the option is not exercised. In March 2011, the option period was extended to December 31, 2011.
9.7 On March 14, 2011 the State of Israel filed a statement of claim against a subsidiary (DSW), in the arbitration according to the Dead Sea Concession Law, 5721-1961. In the statement of claim, the state is claiming USD 265 million for a shortfall in royalties from 2000 to 2009, bearing interest and linkage differences; USD 26 million for the increased rate of royalties, as from 2010, proportionately to the annual quantity of potash sales exceeding 3 million tons; and a change in the formula for calculating royalties for metallic magnesium sales. On July 31, 2011, DSW filed its statement of defense. At the reporting date, each of the parties had appointed an arbitrator on its behalf and the third arbitrator had not yet been appointed. For further information, see Note 5(8) to the financial statements.
9.8 On March 14, 2011, the Company entered into an agreement with a group of 17 banks, most of them international, for a credit facility of USD 675 million for five years from the date the credit facility was granted. A credit facility for USD 225 million will be provided at a base interest rate of Libor + 0.8%, and for use of credit in amounts exceeding USD 225 million, additional interest of 0.15%-0.3% will be charged.
9.9 In April 2011, a subsidiary in Spain acquired 100% of the interests in A. Fuentes Mendez, SA ("the acquired company"), which manufactures and markets specialty fertilizers in Spain. The financial statements of the acquired company have been included in the Company's consolidated financial statements as from the second quarter of 2011.
9.10 On April 14, 2011, the Supreme Court handed down an order nisi to the state, ordering it to adopt one of the permanent solutions for protection of the Dead Sea within three months from the order. A hearing of the application is expected in September – October 2011. In June 2011 a notice was published by the Prime Minister’s Office to the effect that the solution preferred

22
by the Prime Minister is full harvest of the salt from the bed of the pond and its removal to the Northern section of the Dead Sea. Following the notice, on July 3, 2011, the Company announced that talks were ongoing between its representatives and officials from the Ministry of Finance regarding all the matters involved in application of the harvesting solution, including the allocation of financing. There is under preparation a national outline plan for the Dead Sea area (including the concession area) known as TAMA 13. The policy statement of the outline plan was recently approved by the National Council. The document presents a vision according to which the region in which the company operates will continue to serve for industry, tourism and settlement, while preserving environmental aspects. The next step will be to prepare the regional outline plan on the basis of the policy statement. For further information see the Company's immediate report dated July 3, 2011 (ref. 2011-01-199626) and Section 4.1.17(a), Description of the Corporation's Affairs for 2010.
9.11 On April 4, 2011, the Attorney General submitted his position regarding the settlement of the class action suit filed against a subsidiary in the ICL Industrial Products segment, which stated that he opposes the settlement agreement. The Company filed its response to the position of the Attorney General. The court decided that notwithstanding the Company's response, the Attorney General would continue to oppose the settlement agreement and that there would be a hearing of the motion for certification of the claim as a class action on October 25, 2011. For further details see Note 24(C) (d) to the Company’s financial statements of 2010.
9.12 During the quarter ICL Fertilizers completed the dynamic compression of the dike surrounding its evaporation pond at the Dead Sea – as part of the comprehensive engineering plan to reinforce the stability of the dike and also commenced building the new partition to reduce seepage from the dike to the minimum possible. The construction of the partition is estimated at a cost of approximately USD 470 million and includes the raising of the dike by approximately one meter. The project is expected to be completed during 2014. For additional details see The Description of the entity’s operations for 2010 section 4.1.17 (C).
9.13 Subsequent to the date of the financial statements, a subsidiary, Dead Sea Bromine Ltd received draft “Additional conditions for the Business of Bromine”. According to the draft, commencing from 2012 until 2016, transportation of bromine via Haifa port will be restricted gradually by 50% in 2012 to 30%, of the total exports in 2016. In 2010 Dead Sea Bromine transported approximately 60% of Bromine exports via Haifa Port. Dead Sea Bromine has commenced evaluations of transporting bromine in accordance with the draft. For additional details see The Description of the entity’s operations for 2010 section 4.2.14(D).
9.14 Further to section 4.2.14 (C1) in The Description of the entity’s operations for 2010, under the initiation of the Ramat Hovav Council and in agreement with the Environmental Ministry the outline of the evaporation ponds has been changed in such that part will be established on the basis of the existing ponds. Industrial Products will commence construction of the evaporation ponds in accordance with the outline and timeframe which will be agreed by all the relevant parties.
9.15 Subsequent to the financial statements in July 2011, Bromine Compounds in Ramat Hovav received draft conditions for business permit relating to air quality. The plant is in negotiations with the authorities to consolidate the final conditions of the draft regulations. For further details see The Description of the entity’s operations for 2010 section 4.2.14(C 4).
9.16 On August 11, 2011 the finance committee discussed the financial statements at June 30, 2011 and submitted its recommendations to ICL's board of directors which was distributed to all the members of the board of directors on the same day. The committee meeting was divided into two parts. In the first part, the Company's management reviewed the data in the financial statements and their accounting treatment. The second part, which was attended only by the board members serving as committee members, consisted of a discussion in which they formulated their recommendations for the board. The committee members who attended the meeting were Prof. Yair Orgler, Victor Medina, Dr. Miriam Haram, Avisar Paz, accountant and Eran Sarig, solicitor. Also present at the first part of the meeting were the board members Nir Gilad, Chairman of the board of directors, Haim Erez, Avraham (Beige) Shochat, Moshe Vidman and Yossi Rozen. The Company's auditor Zion Amsalem was present at the whole meeting, as were the following officersAkiva Mozes, Asher Grinbaum, Avi Doitchman, Asher Rapoport, Eli Amit, Herzel Barniv, Nathan Dreyfus, Lisa Haimovitz, Amir Benita, Osi Sessler (For details of the positions held by the officers, see the chapter Additional details of the corporation in the Periodic Report for 2010).

23
On August 16, 2011 the board of directors approved the financial statements. For measures taken by the committee in respect of formulation of its recommendation, see sections 2.4 and 2.5 of Chapter D of the Periodic Report for 2010 (Ethical code, corporate governance, internal auditing controls).
The Board of Directors of ICL wishes to thank ICL's management, as well as the employees and managers of ICL companies, for their dedicated and skilled contribution to the development of ICL and the achievement of its business results.
Date: August 16, 2011
--- ---
Nir Gilad Chairman of the Board of Directors
Akiva Mozes CEO

TRANSLATION FROM HEBREW. THE BINDING VERSION IS THE ORIGINAL HEBREW VERSION
Israel Chemicals Ltd.
Condensed Consolidated Interim
Financial Statements
As at June 30, 2011
(Unaudited)
In thousands of U.S. Dollars

Israel Chemicals Ltd. Condensed Consolidated Interim Financial Statements as at June 30, 2011 (Unaudited) Contents Page Auditors' Review Report 2 Condensed Consolidated Interim Statements of Financial Position 3 Condensed Consolidated Interim Statements of Income 5 Condensed Consolidated Interim Statements of Other Comprehensive Income 6 Condensed Consolidated Interim Statements of Changes in Equity 7 Condensed Consolidated Interim Statements of Cash Flows 10 Notes to the Condensed Consolidated Interim Financial Statements 12

Somekh Chaikin Telephone 972 3 684 8000
KPMG Millennium Tower Fax 972 3 684 8444 17 Ha'arba'a Street, PO Box 609 Internet www.kpmg.co.il Tel Aviv 61006 Israel
Somekh Chaikin, a partnership registered under the Israeli Partnership Ordinance, is the Israeli member firm of KPMG International, a Swiss cooperative.
Review Report of the Independent Auditors to the Shareholders of Israel Chemicals Ltd. Introduction We have reviewed the accompanying financial information of Israel Chemicals Ltd. and its subsidiaries, including the condensed consolidated interim statement of financial position as at June 30, 2011 and the related condensed consolidated interim statements of income, other comprehensive income, changes in equity and cash flows for the six-month and three-month periods then ended. The Board of Directors and Management are responsible for preparation and presentation of this interim financial information in accordance with IAS 34 “Interim Financial Reporting”, and are also responsible for preparation of the financial information for this interim period in accordance with Section D of the Securities Regulations (Periodic and Immediate Reports), 1970. Our responsibility is to express a conclusion on this interim financial information based on our review. Scope of Review We conducted our review in accordance with Review Standard 1, "Review of Financial Information for Interim Periods Performed by the Independent Auditor of the Entity" of the Institute of Certified Public Accountants in Israel. A review of financial information for interim periods consists of making inquiries, primarily of persons responsible for financial and accounting matters, and applying analytical and other review procedures. A review is substantially less in scope than an audit conducted in accordance with generally accepted auditing standards in Israel and consequently does not enable us to obtain assurance that we would become aware of all significant matters that might be identified in an audit. Accordingly, we do not express an audit opinion. Conclusion Based on our review, nothing has come to our attention that causes us to believe that the abovementioned financial information is not prepared, in all material respects, in accordance with International Accounting Standard IAS 34. In addition to that mentioned in the previous paragraph, based on our review, nothing has come to our attention that causes us to believe that the abovementioned financial information does not comply, in all material respects, with the disclosure requirements of Section D of the Securities Regulations (Periodic and Immediate Reports), 1970. Somekh Chaikin Certified Public Accountants (Isr.) August 16, 2011

3
Condensed Consolidated Interim Statements of Financial Position as at June 30 June 30 December 31 2011 2010 2010 (Unaudited) (Unaudited) (Audited) US$ thousands US$ thousands US$ thousands
Current assets
Cash and cash equivalents 271,275 281,324 400,914 Short-term investments, deposits and loans 189,556 154,629 493,201 Trade receivables 1,411,827 987,406 949,692 Other receivables and debit balances, including derivative instruments 234,133 146,955 145,007 Income taxes refundable 14,367 25,783 27,171 Inventories 1,233,406 1,058,279 1,114,134
Total current assets 3,354,564 2,654,376 3,130,119
Non-current assets
Investments in associated companies 31,898 25,353 28,124 Long-term deposits and receivables 235,677 192,443 205,580 Excess of assets over liabilities in respect of defined benefit plan 84,001 61,754 83,325 Long-term derivative instruments 45,176 17,896 36,308 Non-current inventories 53,174 62,473 50,010 Deferred taxes, net 111,271 107,408 120,305 Property, plant and equipment 2,400,325 2,088,827 2,190,594 Intangible assets 833,177 526,376 543,779
Total non-current assets 3,794,699 3,082,530 3,258,025
Total assets 7,149,263 5,736,906 6,388,144
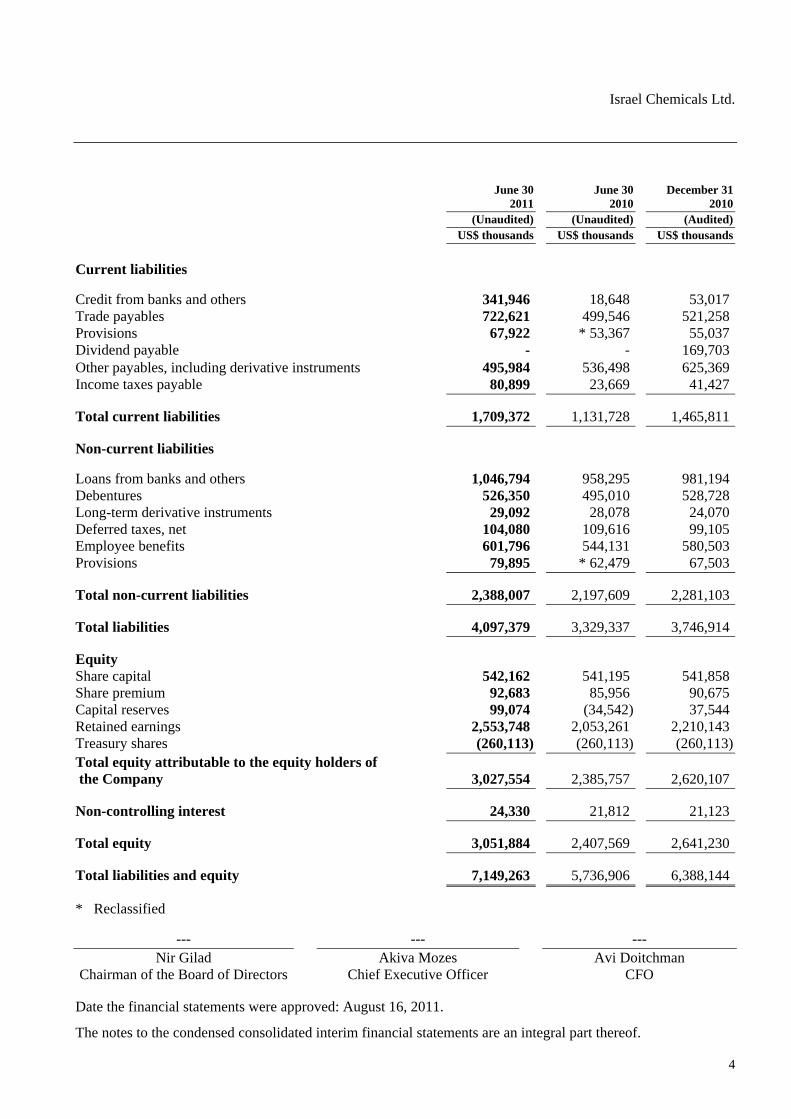
4
Israel Chemicals Ltd.
June 30 June 30 December 31 2011 2010 2010 (Unaudited) (Unaudited) (Audited) US$ thousands US$ thousands US$ thousands
Current liabilities
Credit from banks and others 341,946 18,648 53,017 Trade payables 722,621 499,546 521,258 Provisions 67,922 * 53,367 55,037 Dividend payable - - 169,703 Other payables, including derivative instruments 495,984 536,498 625,369 Income taxes payable 80,899 23,669 41,427
Total current liabilities 1,709,372 1,131,728 1,465,811
Non-current liabilities
Loans from banks and others 1,046,794 958,295 981,194 Debentures 526,350 495,010 528,728 Long-term derivative instruments 29,092 28,078 24,070 Deferred taxes, net 104,080 109,616 99,105 Employee benefits 601,796 544,131 580,503 Provisions 79,895 * 62,479 67,503
Total non-current liabilities 2,388,007 2,197,609 2,281,103
Total liabilities 4,097,379 3,329,337 3,746,914
Equity Share capital 542,162 541,195 541,858 Share premium 92,683 85,956 90,675 Capital reserves 99,074 (34,542) 37,544 Retained earnings 2,553,748 2,053,261 2,210,143 Treasury shares (260,113) (260,113) (260,113)Total equity attributable to the equity holders of the Company 3,027,554 2,385,757 2,620,107
Non-controlling interest 24,330 21,812 21,123
Total equity 3,051,884 2,407,569 2,641,230
Total liabilities and equity 7,149,263 5,736,906 6,388,144
* Reclassified
--- --- --- Nir Gilad Akiva Mozes Avi Doitchman
Chairman of the Board of Directors Chief Executive Officer CFO Date the financial statements were approved: August 16, 2011.
The notes to the condensed consolidated interim financial statements are an integral part thereof.

5
Israel Chemicals Ltd. Condensed Consolidated Interim Statements of Income For the For the six month period ended For the three month period ended year ended June 30 June 30 June 30 June 30 December 31 2011 2010 2011 2010 2010 (Unaudited) (Unaudited) (Unaudited) (Unaudited) (Audited) US$ thousands US$ thousands US$ thousands US$ thousands US$ thousands Sales 3,457,138 2,877,179 1,928,842 1,494,698 5,691,537Cost of sales 1,948,262 1,656,231 1,058,067 832,892 3,259,461
Gross profit 1,508,876 1,220,948 870,775 661,806 2,432,076
Selling, transportation and marketing expenses 427,487 388,535 234,493 202,781 779,809General and administrative expenses 130,696 120,436 69,398 60,154 245,614Research and development expenses, net 34,760 29,623 18,191 14,966 64,064Other expenses 13,450 4,626 5,857 2,206 7,741Other income )850( (10,178) - (2,740) )11,279(
Operating income 903,333 687,906 542,836 384,439 1,346,127Financing expenses 56,130 31,443 27,969 15,791 85,604 Financing income )11,845( (15,910) )6,696( (152) (32,422)
Financing expenses, net 44,285 15,533 21,273 15,639 53,182Share in income (losses) of associated companies, net
of tax 8,565 173 4,258 1,598 2,478
Income before taxes on income 867,613 672,546 525,821 370,398 1,295,423Taxes on income 157,076 133,937 95,920 73,381 266,806
Income for the period 710,537 538,609 429,901 297,017 1,028,617
Attributable to: Equity holders of the Company 705,904 536,446 426,169 295,914 1,024,740Non-controlling interests 4,633 2,163 3,732 1,103 3,877 Income for the period 710,537 538,609 429,901 297,017 1,028,617
Earnings per share attributable to the holders of the Company: $ $ $ $ $
Basic earnings per share 0.557 0.424 0.336 0.234 0.810 Diluted earnings per share 0.554 0.423 0.334 0.233 0.806
The notes to the condensed consolidated interim financial statements are an integral part thereof.

6
Israel Chemicals Ltd. Condensed Consolidated Interim Statements of Other Comprehensive Income For the For the six month period ended For the three month period ended year ended June 30 June 30 June 30 June 30 December 31 2011 2010 2011 2010 2010 (Unaudited) (Unaudited) (Unaudited) (Unaudited) (Audited) US$ thousands US$ thousands US$ thousands US$ thousands US$ thousands
Income for the period 710,537 538,609 429,901 297,017 1,028,617 Components of other comprehensive income Foreign currency translation differences with respect to foreign operations 63,491 (74,411) 22,368 (39,255) (17,709) Net change in fair value of financial assets available for sale )3,756( (6,713) )4,191( (5,328) (3,324) Actuarial gains (losses) from defined benefit plan 3,008 (47,938) )15,001( (29,045) (23,463) Change in fair value of derivatives used to hedge cash flows )6,782( (1,133) )3,906( 108 (1,097) Income tax on components of other comprehensive income 2,013 12,181 5,188 7,242 2,676 Other comprehensive income (loss) for the period, net of tax 57,974 (118,014) 4,458 (66,278) (42,917) Total comprehensive income for the period 768,511 420,595 434,359 230,739 985,700 Attributable to: Equity holders of the Company 764,135 418,056 430,364 229,706 981,660 Non-controlling interest 4,376 2,539 3,995 1,033 4,040 Total comprehensive income for the period 768,511 420,595 434,359 230,739 985,700
The notes to the condensed consolidated interim financial statements are an integral part thereof.

7
Israel Chemicals Ltd. Condensed Consolidated Interim Statements of Changes in Equity Non-controlling Total Attributable to equity holders of the Company interest equity Translation Reserve reserve from from Share foreign available Capital Treasury Retained Share capital premium operations for sale assets reserves shares earnings Total (Unaudited) (Unaudited) (Unaudited) (Unaudited) (Unaudited) (Unaudited) (Unaudited) (Unaudited) (Unaudited) (Unaudited) US$ thousands US$ thousands US$ thousands US$ thousands US$ thousands US$ thousands US$ thousands US$ thousands US$ thousands US$ thousands
For the six-month period ended June 30, 2011 Balance as at January 1, 2011 (Audited) 541,858 90,675 (9,049) 2,427 44,166 (260,113) 2,210,143 2,620,107 21,123 2,641,230 Exercise of options allotted to employees 304 2,008 - - (2,312) - - - - - Share-based payments - - - - 7,845 - - 7,845 - 7,845 Dividends to shareholders - - - - - - (364,363) (364,363) (1,169) (365,532) Tax benefit in respect of allotment of shares to employees - - - - (170) - - (170) - (170) Comprehensive income for the period - - 63,748 (2,427) (5,154) - 707,968 764,135 4,376 768,511
Balance as at June 30, 2011 (Unaudited) 542,162 92,683 54,699 - 44,375 (260,113) 2,553,748 3,027,554 24,330 3,051,884 Non-controlling Total Attributable to equity holders of the Company interest equity Translation Reserve reserve from from Share foreign available Capital Treasury Retained Share capital premium operations for sale assets reserves shares earnings Total (Unaudited) (Unaudited) (Unaudited) (Unaudited) (Unaudited) (Unaudited) (Unaudited) (Unaudited) (Unaudited) (Unaudited) US$ thousands US$ thousands US$ thousands US$ thousands US$ thousands US$ thousands US$ thousands US$ thousands US$ thousands US$ thousands
For the six-month period ended June 30, 2010 Balance as at January 1, 2010 (Audited) 541,028 84,059 8,823 5,420 19,660 (260,113) 2,374,883 2,773,760 21,089 2,794,849 Exercise of options allotted to employees 167 1,897 - - (1,730) - - 334 - 334 Share-based payments - - - - 15,969 - - 15,969 - 15,969 Dividends to shareholders - - - - - - (821,560) (821,560) (2,230) (823,790) Tax benefit in respect of allotment of shares to employees - - - - (802) - - (802) - (802) Options of proportionately consolidated company issued to its employees - - - - - - - - 414 414 Comprehensive income for the period - - (74,787) (6,245) (850) - 499,938 418,056 2,539 420,595
Balance as at June 30, 2010 (Unaudited) 541,195 85,956 (65,964) (825) 32,247 (260,113) 2,053,261 2,385,757 21,812 2,407,569 The notes to the condensed consolidated interim financial statements are an integral part thereof.

8
Israel Chemicals Ltd. Condensed Consolidated Interim Statements of Changes in Equity (cont'd)
Non-controlling Total Attributable to equity holders of the Company interest equity Translation Reserve reserve from from Share foreign available Capital Treasury Retained Share capital premium operations for sale assets reserves shares earnings Total (Unaudited) (Unaudited) (Unaudited) (Unaudited) (Unaudited) (Unaudited) (Unaudited) (Unaudited) (Unaudited) (Unaudited) US$ thousands US$ thousands US$ thousands US$ thousands US$ thousands US$ thousands US$ thousands US$ thousands US$ thousands US$ thousands
For the three-month period ended June 30, 2011 Balance as at April 1, 2011 542,055 92,001 32,594 2,850 44,465 (260,113) 2,334,331 2,788,183 21,083 2,809,266 Exercise of options allotted to employees 107 682 - - (789) - - - - - Share-based payments - - - - 3,773 - - 3,773 - 3,773 Dividends to shareholders - - - - - - (194,660) (194,660) (748) (195,408) Tax benefit in respect of allotment of shares to employees - - - - (106) - - (106) - (106) Comprehensive income for the period - - 22,105 (2,850) (2,968) - 414,077 430,364 3,995 434,359
Balance as at June 30, 2011 542,162 92,683 54,699 - 44,375 (260,113) 2,553,748 3,027,554 24,330 3,051,884 Non-controlling Total Attributable to equity holders of the Company interest equity Translation Reserve reserve from from Share foreign available Capital Treasury Retained Share capital premium operations for sale assets reserves shares earnings Total (Unaudited) (Unaudited) (Unaudited) (Unaudited) (Unaudited) (Unaudited) (Unaudited) (Unaudited) (Unaudited) (Unaudited) US$ thousands US$ thousands US$ thousands US$ thousands US$ thousands US$ thousands US$ thousands US$ thousands US$ thousands US$ thousands
For the three-month period ended June 30, 2010 Balance as at April 1, 2010 541,175 85,402 (26,779) 3,780 24,508 (260,113) 2,446,677 2,814,650 22,801 2,837,451 Exercise of options allotted to employees 20 554 - - (240) - - 334 - 334 Share-based payments - - - - 8,185 - - 8,185 - 8,185 Dividends to shareholders - - - - - - (666,831) (666,831) (2,230) (669,061) Tax benefit in respect of allotment of shares to employees - - - - (287) - - (287) - (287) Options of proportionately consolidated company issued to its employees - - - - - - - - 208 208 Comprehensive income for the period - - (39,185) (4,605) 81 - 273,415 229,706 1,033 230,739
Balance as at June 30, 2010 541,195 85,956 (65,964) (825) 32,247 (260,113) 2,053,261 2,385,757 21,812 2,407,569 The notes to the condensed consolidated interim financial statements are an integral part thereof.

9
Israel Chemicals Ltd. Condensed Consolidated Interim Statements of Changes in Equity (cont'd) Non-controlling Total Attributable to equity holders of the Company interest equity Translation Reserve reserve from from available Share Share foreign for sale Capital Treasury Retained capital premium operations assets reserves shares earnings Total (Audited) (Audited) (Audited) (Audited) (Audited) (Audited) (Audited) (Audited) (Audited) (Audited) US$ thousands US$ thousands US$ thousands US$ thousands US$ thousands US$ thousands US$ thousands US$ thousands US$ thousands US$ thousands
For the year ended December 31, 2010 Balance as at January 1, 2010 541,028 84,059 8,823 5,420 19,660 )260,113( 2,374,883 2,773,760 21,089 2,794,849 Exercise of options allotted to employees 830 6,616 - - )7,112( - - 334 - 334 Share-based payments - - - - 32,518 - - 32,518 - 32,518 Dividends to equity holders - - - - - - )1,167,954( )1,167,954( )3,788( )1,171,742( Tax benefit in respect of allotment of shares to employees - - - - )211( - - )211( - )211( Change in respect of options of proportionately consolidated company - - - - - - - - )218( )218( Comprehensive income for the year - - )17,872( )2,993( )689( - 1,003,214 981,660 4,040 985,700 Balance as at December 31, 2010 541,858 90,675 )9,049( 2,427 44,166 )260,113( 2,210,143 2,620,107 21,123 2,641,230
The notes to the condensed consolidated interim financial statements are an integral part thereof.

10
Israel Chemicals Ltd. Condensed Consolidated Interim Statements of Cash Flows For the six month period ended For the three month period ended For the year ended June 30 June 30 June 30 June 30 December 31 2011 2010 2011 2010 2010 (Unaudited) (Unaudited) (Unaudited) (Unaudited) (Audited) US$ thousands US$ thousands US$ thousands US$ thousands US$ thousands
Cash flows from operating activities Income for the period 710,537 538,609 429,901 297,017 1,028,617
Adjustments: Depreciation and amortization 122,566 104,422 67,621 52,310 217,395 Interest expenses, net 10,462 23,494 4,809 14,762 36,313 Share in income of associated companies, net of tax (8,565) (173) (4,258) (1,598) (2,478)Gain (loss) on sale of property, plant and equipment (33) (2,566) 307 (746) (2,712)Gain on securities classified as held for trading and available-for-sale (4,535) - (4,535) - (3,244)Share-based payment transactions 7,845 16,383 3,773 8,393 33,159 Revaluation of assets and liabilities denominated in foreign currency (542) (21,906) (10,068) (16,559) 13,394 Gain on sale of an activity - (5,587) - - (5,587)Income tax expenses 157,076 133,937 95,920 73,381 266,806 994,811 786,613 583,470 426,960 1,581,663 Change in inventories (23,528) 129,840 (37,541) 57,858 109,192 Change in trade and other receivables (390,437) (96,947) (218,225) 69,536 (30,468)Change in trade and other payables 82,803 103,905 2,268 49,776 139,647 Change in provisions and employee benefits 20,375 (16,904) 13,299 (17,366) 15,705 684,024 906,507 343,271 586,764 1,815,739 Income taxes paid (247,714) (149,358) (50,232) (55,597) (240,449)Interest received 11,293 9,812 5,087 6,203 9,527 Interest paid (21,370) (26,333) (13,874) (16,297) (47,832)Net cash provided by operating activities 426,233 740,628 284,252 521,073 1,536,985
Cash flows from investing activities Investment in long-term deposits )1,111( (1,089) )1,111( (918) (11,009)Proceeds from sale of property, plant and equipment 2,054 4,797 758 1,871 5,618 Short-term deposits and loans, net 295,522 (4,750) 10,290 38,284 (329,089)Business combinations less cash acquired )424,100( - )161,512( - - Dividend received from associated companies 4,054 2,229 1,160 2,211 3,661 Acquisition of fixed assets )204,408( (160,419) )121,527( (75,762) (333,752)Investment grants received - - - - 303 Acquisition of intangible assets )8,501( (4,922) )4,523( (1,738) (14,944)Sale of securities classified as available-for-sale 14,421 - 14,421 - 9,356 Proceeds from sale of an activity - 9,426 - - 9,426 Proceeds from realization of long- term deposits 1,973 3,032 1,832 2,023 1,952 Net cash used in investment activities )320,096( (151,696) )260,212( (34,029) (658,478)
The notes to the condensed consolidated interim financial statements are an integral part thereof.

11
Israel Chemicals Ltd. Condensed Consolidated Interim Statements of Cash Flows (cont'd) For the six month period ended For the three month period ended For the year ended June 30 June 30 June 30 June 30 December 31 2011 2010 2011 2010 2010 (Unaudited) (Unaudited) (Unaudited) (Unaudited) (Audited) US$ thousands US$ thousands US$ thousands US$ thousands US$ thousands
Cash flows from financing activities Proceeds from exercise of options allotted to employees - 334 - 334 334 Dividend paid to the Company’s equity holders )534,066( (771,131) )364,363( (771,131) (998,251)Dividend paid to non-controlling interest )1,169( (2,230) )748( (2,230) (3,788)Receipt of long-term loans 173,522 555,451 35,810 434,660 676,043 Repayment of long-term loans )124,781( (314,343) )2,778( (257,476) (376,451)Short-term credit from banks and others, net 248,999 (26,057) 140,163 (18,238) (28,446)
Net cash used in financing activities )237,495( (557,976) )191,916( (614,081) (730,559)
Net increase (decrease) in cash and cash equivalents )131,358( 30,956 )167,876( (127,037) 147,948 Cash and cash equivalents at beginning of the period 400,914 257,970 437,274 406,157 257,970 Effect of changes in the exchange rate on cash and cash equivalents 1,719 (7,602) 1,877 2,204 (5,004)
Cash and cash equivalents at end of the period 271,275 281,324 271,275 281,324 400,914
The notes to the condensed consolidated interim financial statements are an integral part thereof.

12
Israel Chemicals Ltd. Notes to the Condensed Consolidated Interim Financial Statements as at June 30, 2011 (Unaudited) Note 1 - The Reporting Entity
Israel Chemicals Ltd. (hereinafter - “the Company” or “ICL”), is an Israeli-resident company that was incorporated in Israel and whose shares are traded on the Tel-Aviv Stock Exchange. The Company’s registered office is 23 Aranha St., Tel-Aviv, Israel, and its subsidiaries and associated companies (hereinafter – “the Group”) constitute a multi-national group operating primarily in the fertilizers and specialty chemicals sectors, in three main operating segments: fertilizers (including potash and phosphate products), industrial products and performance products. In addition, the Group has activities in a number of other segments. The Company is a subsidiary of Israel Corporation Ltd. The Group’s activities are based principally on natural resources – potash, bromine, magnesium and salt produced from the Dead Sea and phosphate rock mined from the State’s southern region, all in accordance with concessions and licenses from the State of Israel. The activities are also based on potash and salt mines in the United Kingdom and Spain, as well as on lease agreements and licenses from the appropriate authorities in these countries. The Company is engaged in the extraction of these minerals and the sale thereof throughout the world, as well as in the development, manufacture and marketing of downstream derivative products based primarily on these raw materials. The Company and some of the Group companies were declared a monopoly with respect to some of the products they manufacture and/or sell in Israel. The Group’s main production facilities are located in Israel, Germany, the United States, the Netherlands, Spain, the United Kingdom, China, Brazil and France. In addition, the Group has additional production facilities in Austria, Belgium, Turkey, Argentina and Australia. The Group’s activities outside of Israel are mainly in the manufacture of products using or based on the Group’s activities in Israel or in related areas. About 95% of the Group’s output is sold to customers outside of Israel.
Note 2 - Basis of Preparation of the Financial Statements
A. Declaration of compliance with International Financial Reporting Standards (IFRS) The condensed consolidated interim financial statements were prepared in accordance with IAS 34, “Interim Financial Reporting” and do not include all of the information required in complete, annual financial statements. These statements should be read together with the financial statements as at and for the year ended December 31, 2010 (hereinafter: “the annual financial statements”). In addition, these financial statements were prepared in accordance with the provisions of Section D of the Securities Regulations (Periodic and Immediate Reports), 1970. The condensed consolidated interim financial statements were approved for publication by the Group’s Board of Directors on August 16, 2011.
B. Functional currency and presentation currency The United States dollar is the currency representing the main economic environment in which the Company operates and, accordingly, the dollar constitutes the functional and presentation currency in these financial statements. Currencies other than the dollar constitute foreign currency.

Israel Chemicals Ltd. Notes to the Condensed Consolidated Interim Financial Statements as at June 30, 2011 (Unaudited)
13
Note 2 - Basis of Preparation of the Financial Statements (cont’d)
C. Use of estimates and judgment In preparation of the condensed financial statements in accordance with IFRS, Company management is required to use judgment when making estimates and assumptions that affect implementation of the policies and the amounts of assets, liabilities, income and expenses. It is clarified that the actual results are likely to be different from these estimates.
Management’s judgment, at the time of implementing the Group’s accounting policies and the main assumptions used in the estimates involving uncertainty, are consistent with those used in the annual financial statements.
Note 3 - Significant Accounting Policies
A. The Company's accounting policies in these condensed consolidated interim financial statements are the policies that were applied in the annual financial statements as at December 31, 2010.
B. New Standards not yet adopted:
(1) IFRS 10 Consolidated Financial Statements (hereinafter – “IFRS 10”). IFRS 10 replaces the requirements of IAS 27 Consolidated and Separate Financial Statements and the requirements of SIC-12 Consolidation – Special Purpose Entities with respect to the consolidation of financial statements, so that the requirements of IAS 27 will continue to be valid only for separate financial statements.
IFRS 10 introduces a new single control model for determining whether an investor controls an investee and should therefore consolidate it. This model is implemented with respect to all investees. According to the model, an investor controls an investee when it is exposed, or has rights, to variable returns from its involvement with that investee, has the ability to affect those returns through its power over that investee and there is a link between power and return.
Presented hereunder are certain key changes from the current consolidation guidance:
IFRS 10 introduces a model that requires applying judgment and analyzing all the relevant facts and circumstances for determining who has control and is required to consolidate the investee.
IFRS 10 introduces a single control model that is to be applied to all investees, both those presently in the scope of IAS 27 and those presently in the scope of SIC-12.
De facto power should be considered when assessing control. This means that the existence of de facto control could require consolidation.
When assessing control, all “substantive” potential voting rights will be taken into account. The structure, reasons for existence and conditions of potential voting rights should be considered.
IFRS 10 provides guidance on the determination of whether a decision maker is acting as an agent or as a principal when assessing whether an investor controls an investee.
IFRS 10 provides guidance on when an investor would assess power over portion of the investee (silos), that is over specified assets of the investee.

Israel Chemicals Ltd. Notes to the Condensed Consolidated Interim Financial Statements as at June 30, 2011 (Unaudited)
14
Note 3 - Significant Accounting Policies (cont’d)
B. New Standards not yet adopted: (cont’d) (1) (cont’d)
IFRS 10 provides a definition of protective rights, while there is no such definition in
existing IFRS.
The exposure to risk and rewards of an investee does not, on its own determine that the investor has control over an investee, rather it is one of the factors of control analysis.
IFRS 10 is applicable retrospectively (with a certain relief) for annual periods beginning on or after January 1, 2013. Early adoption is permitted providing that disclosure is provided and that the entire consolidation suite is early adopted, meaning also the two additional standards that were issued – IFRS 11 Joint Arrangements and IFRS 12 Disclosure of Involvement with Other Entities.
The Group has started assessing the effects of adopting the amendment on its financial statements.
(2) IFRS 11 Joint Arrangements (hereinafter – “IFRS 11”). IFRS 11 replaces the requirements
of IAS 31 Interests in Joint Ventures (hereinafter – IAS 31) and amends part of the requirements in IAS 28 Investments in Associates. The standard defines a joint arrangement as an arrangement over which two or more parties have joint control (as defined in IFRS 10). Joint control is the contractually agreed sharing of control of an arrangement, which exists only when decisions about the relevant activities require the unanimous consent of the parties sharing control. According to the standard, Joint ventures shall only be accounted for using the equity method (the option to apply the proportionate consolidation method has been removed). IFRS 11 is applicable retrospectively for annual periods beginning on or after January 1, 2013, but there are specific requirements for retrospective implementation in certain cases. Early adoption is permitted providing that disclosure is provided and that the entire consolidation suite is adopted at the same time, meaning also the two additional standards published – IFRS 10 consolidated financial statements and IFRS 12 disclosure of involvement with other entities.

Israel Chemicals Ltd. Notes to the Condensed Consolidated Interim Financial Statements as at June 30, 2011 (Unaudited)
15
Note 3 - Significant Accounting Policies (cont’d)
C. Indices and Exchange Rates Data regarding the representative exchange rates and the CPI are as follows:
Consumer Dollar–NIS Dollar–Euro Price exchange exchange Index rate rate
Rates of change for the six months ended: June 30, 2011 2.2% (3.8%) (7.8%)June 30, 2010 0.7% 2.6% 17.4%
Rates of change for the three months ended: June 30, 2011 1.5% (1.9%) (1.8%)June 30, 2010 1.6% 4.4% 9.5%
For the year ended December 31, 2010 2.6% )6.0%( 8.0% Note 4 - Business Segments
A. General
The Group operates in the segments that are described below:
ICL Fertilizers - ICL Fertilizers mines and processes potash, mines and processes phosphate rock, and produces agricultural phosphoric acid, phosphate fertilizers, compound fertilizers, based mainly on potash and phosphate, and specialty fertilizers. ICL Fertilizers markets these products worldwide, mainly to Europe, Brazil, India, China and Israel. This segment is comprised of two sub-segments: potash and phosphate. ICL Fertilizers extracts potash from the Dead Sea and mines potash from subterranean mines in the UK and in Spain. ICL Fertilizers mines phosphate rock from open-air mines in the Negev, and also produces sulphuric and phosphoric acid in Israel and fertilizers in Israel, the Netherlands and Germany. In addition, the activities of Mifalei Tovala Ltd., which is engaged in the transportation of cargo, mainly of ICL companies in Israel, are included in the ICL Fertilizers segment. ICL Industrial Products - ICL Industrial Products produces bromine out of a solution that is created as a by-product of the potash production process in Sdom, as well as bromine-based compounds. ICL Industrial Products uses most of the bromine it produces for self-production of bromine compounds on production sites in Israel, the Netherlands and China. In addition, ICL Industrial Products extracts salt, magnesia and chlorine from the Dead Sea brine, and produces chlorine-based products in Israel and the United States. Furthermore, ICL Industrial Products produces and markets flame retardants and other products made from phosphorus.
ICL Performance Products - ICL Performance Products processes some of the agricultural phosphoric acid produced by ICL Fertilizers, using it to produce downstream products with high added value. These products include phosphoric acid (food grade and technical grade), phosphate salts, food additives, and hygiene products for the food industry. ICL Performance Products also produces specialty products, based on aluminum compounds, and other raw materials. Production is mostly carried out on production sites in Europe, (particularly in Germany) and the United States, as well as in Israel, China, and other countries.
In addition to the segments detailed above, ICL has other activities, including, water desalinization (through a proportionately consolidated company) and production and marketing pure magnesium and magnesium alloys.

Israel Chemicals Ltd. Notes to the Condensed Consolidated Interim Financial Statements as at June 30, 2011 (Unaudited)
16
Note 4 - Business Segments (cont’d)
B. Information on business segments Fertilizers Industrial Performance Other Potash Phosphate Eliminations Total Products Products activities Eliminations Consolidated (Unaudited) (Unaudited) (Unaudited) (Unaudited) (Unaudited) (Unaudited) (Unaudited) (Unaudited) (Unaudited) US$ thousands US$ thousands US$ thousands US$ thousands US$ thousands US$ thousands US$ thousands US$ thousands US$ thousands
Six-month period ended June 30, 2011 Sales to external parties 1,001,395 810,510 - 1,811,905 790,512 722,724 131,997 - 3,457,138 Inter-segment sales 107,690 75,587 )57,768( 125,509 6,821 35,652 14,513 )182,495( - Total sales 1,109,085 886,097 )57,768( 1,937,414 797,333 758,376 146,510 )182,495( 3,457,138 Income from ordinary activities 487,388 136,447 )1,365( 622,470 158,347 113,149 15,743 909,709 Unallocated expenses and intercompany eliminations )6,376( Operating income 903,333 Financing expenses )56,130( Financing income 11,845 Share in income of associated companies, net of tax 8,565 Income before taxes on income 867,613 Capital expenditures 92,326 324,377 - 416,703 47,326 89,706 4,874 - 558,609 Unallocated capital expenditures 210 Total capital expenditures 558,819 Depreciation and amortization 48,433 22,794 - 71,227 28,922 18,897 3,219 - 122,265 Unallocated depreciation and amortization 301 Total depreciation and amortization 122, 566

Israel Chemicals Ltd. Notes to the Condensed Consolidated Interim Financial Statements as at June 30, 2011 (Unaudited)
17
Note 4 - Business Segments (cont’d)
B. Information on business segments (cont’d) Fertilizers Industrial Performance Other Potash Phosphate Eliminations Total Products Products activities Eliminations Consolidated (Unaudited) (Unaudited) (Unaudited) (Unaudited) (Unaudited) (Unaudited) (Unaudited) (Unaudited) (Unaudited) US$ thousands US$ thousands US$ thousands US$ thousands US$ thousands US$ thousands US$ thousands US$ thousands US$ thousands
Six-month period ended June 30, 2010 Sales to external parties 1,015,314 468,734 - 1,484,048 644,954 631,213 116,964 - 2,877,179 Inter-segment sales 87,173 56,626 (40,313) 103,486 6,149 29,852 14,334 (153,821) - Total sales 1,102,487 525,360 (40,313) 1,587,534 651,103 661,065 131,298 (153,821) 2,877,179
Income from ordinary activities 452,767 53,377 2,090 508,234 87,172 98,988 6,591 700,985 Unallocated expenses and intercompany eliminations (13,079) Operating income 687,906 Financing expenses (31,443) Financing income 15,910 Share in income of associated companies, net of tax 173 Income before taxes on income 672,546
Capital expenditures 77,590 29,028 - 106,618 32,293 13,436 9,609 - 161,956 Unallocated capital expenditures 326 Total capital expenditures 162,282 Depreciation and amortization 37,672 19,112 - 56,784 23,614 21,010 2,777 - 104,185 Unallocated depreciation and amortization 237 Total depreciation and amortization 104,422

Israel Chemicals Ltd. Notes to the Condensed Consolidated Interim Financial Statements as at June 30, 2011 (Unaudited)
18
Note 4 - Business Segments (cont’d)
B. Information on business segments (cont’d) Fertilizers Industrial Performance Other Potash Phosphate Eliminations Total Products Products activities Eliminations Consolidated (Unaudited) (Unaudited) (Unaudited) (Unaudited) (Unaudited) (Unaudited) (Unaudited) (Unaudited) (Unaudited) US$ thousands US$ thousands US$ thousands US$ thousands US$ thousands US$ thousands US$ thousands US$ thousands US$ thousands
Three-month period ended June 30, 2011 Sales to external parties 571,963 464,310 - 1,036,273 422,138 390,018 80,413 - 1,928,842 Inter-segment sales 61,671 38,081 (35,262) 64,490 2,282 18,226 9,399 (94,397) - Total sales 633,634 502,391 (35,262) 1,100,763 424,420 408,244 89,812 (94,397) 1,928,842 Income from ordinary activities 305,297 77,621 (3,951) 378,967 87,001 65,721 11,399 543,088
Unallocated expenses and intercompany eliminations (252) Operating income 542,836 Financing expenses (27,969) Financing income 6,696 Share in income of associated companies, net of tax 4,258 Income before taxes on income 525,821 Capital expenditures 53,854 141,762 - 195,616 28,299 77,172 2,274 - 303,361 Unallocated capital expenditures 17 Total capital expenditures 303,378 Depreciation and amortization 27,833 12,988 - 40,821 14,863 10,202 1,577 - 67,463 Unallocated depreciation and amortization 158 Total depreciation and amortization 67,621
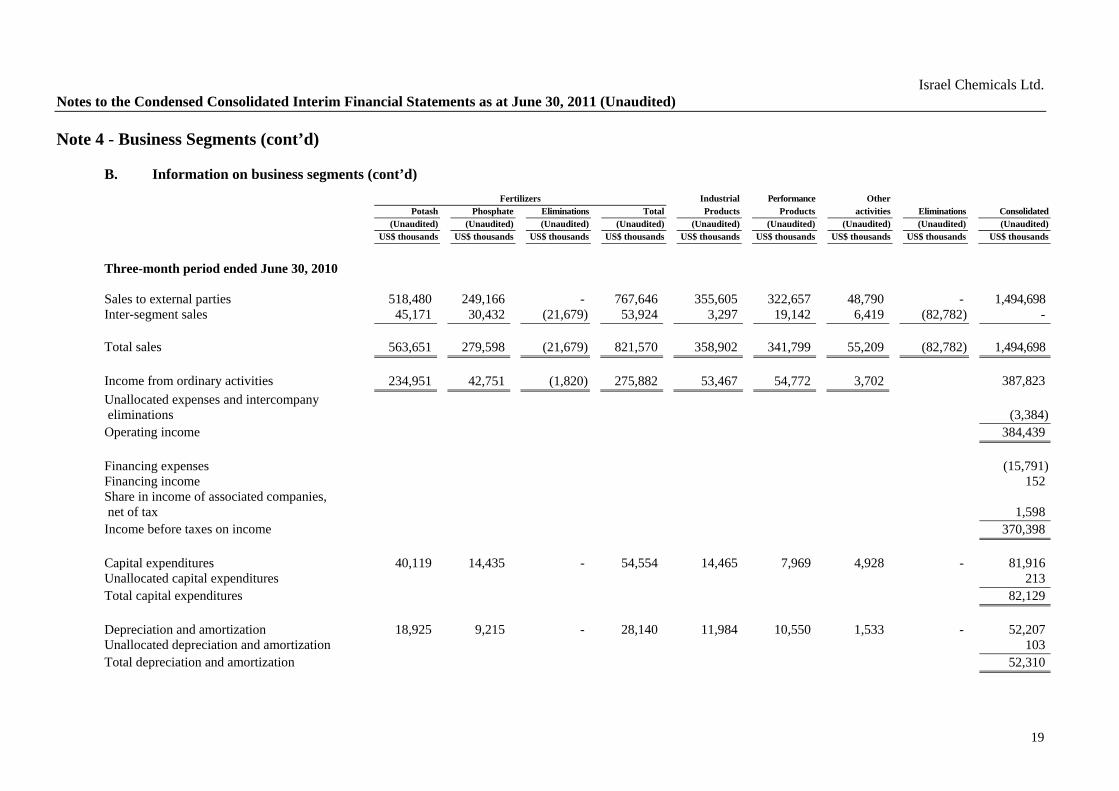
Israel Chemicals Ltd. Notes to the Condensed Consolidated Interim Financial Statements as at June 30, 2011 (Unaudited)
19
Note 4 - Business Segments (cont’d)
B. Information on business segments (cont’d) Fertilizers Industrial Performance Other Potash Phosphate Eliminations Total Products Products activities Eliminations Consolidated (Unaudited) (Unaudited) (Unaudited) (Unaudited) (Unaudited) (Unaudited) (Unaudited) (Unaudited) (Unaudited) US$ thousands US$ thousands US$ thousands US$ thousands US$ thousands US$ thousands US$ thousands US$ thousands US$ thousands
Three-month period ended June 30, 2010 Sales to external parties 518,480 249,166 - 767,646 355,605 322,657 48,790 - 1,494,698 Inter-segment sales 45,171 30,432 (21,679) 53,924 3,297 19,142 6,419 (82,782) - Total sales 563,651 279,598 (21,679) 821,570 358,902 341,799 55,209 (82,782) 1,494,698
Income from ordinary activities 234,951 42,751 (1,820) 275,882 53,467 54,772 3,702 387,823
Unallocated expenses and intercompany eliminations (3,384) Operating income 384,439 Financing expenses (15,791) Financing income 152 Share in income of associated companies, net of tax 1,598 Income before taxes on income 370,398
Capital expenditures 40,119 14,435 - 54,554 14,465 7,969 4,928 - 81,916 Unallocated capital expenditures 213 Total capital expenditures 82,129 Depreciation and amortization 18,925 9,215 - 28,140 11,984 10,550 1,533 - 52,207 Unallocated depreciation and amortization 103 Total depreciation and amortization 52,310

Israel Chemicals Ltd. Notes to the Condensed Consolidated Interim Financial Statements as at June 30, 2011 (Unaudited)
20
Note 4 - Business Segments (cont’d)
B. Information on business segments (cont’d) Fertilizers Industrial Performance Other Potash Phosphate Eliminations Total Products Products activities Eliminations Consolidated (Audited) (Audited) (Audited) (Audited) (Audited) (Audited) (Audited) (Audited) (Audited) US$ thousands US$ thousands US$ thousands US$ thousands US$ thousands US$ thousands US$ thousands US$ thousands US$ thousands
2010: Sales to external customers 1,956,879 931,829 - 2,888,708 1,298,513 1,284,127 220,189 - 5,691,537 Inter-segment sales 183,810 124,511 )89,774( 218,547 14,679 55,901 25,813 )314,940( - Total sales 2,140,689 1,056,340 )89,774( 3,107,255 1,313,192 1,340,028 246,002 )314,940( 5,691,537 Income from ordinary activities 857,914 108,583 )1,366( 965,131 206,599 185,067 15,192 1,371,989 Unallocated expenses and intercompany eliminations )25,862( Operating income 1,346,127 Financing expenses (85,604) Financing income 32,422 Share in income of associated companies, net of tax 2,478 Income for the year before tax 1,295,423 Capital expenditures 148,342 59,489 - 207,831 80,173 41,386 15,697 - 345,087
Unallocated capital expenditures 7,475 Total capital expenditures 352,562
Depreciation and amortization* 80,285 39,850 - 120,135 51,001 40,148 5,603 - 216,887 Unallocated depreciation and amortization 508 Total depreciation and amortization 217,395 * Depreciation and amortization includes impairment of property, plant and equipment. (See Note 16(B) to the Company’s annual financial statements as of December 31, 2010).

Israel Chemicals Ltd. Notes to the Condensed Consolidated Interim Financial Statements as at June 30, 2011 (Unaudited)
21
Note 5 - Additional Information (1) On March 27, 2011, the Company’s Board of Directors decided to distribute a dividend in the
amount of $170 million (the net dividend, less the share of a subsidiary, amounts to $169.7 million), about $0.13 per share. The dividend was distributed on May 12, 2011.
(2) On May 15, 2011, the Company’s Board of Directors decided to distribute a dividend in the
amount of $195 million (the net dividend, less the share of a subsidiary amount to $194.7 million), about $0.15 per share. The dividend was distributed on June 28, 2011.
(3) Subsequent to the date of the report, on August 16, 2011, the Company’s Board of Directors
decided to distribute a dividend in the amount of $298 million (the net dividend, less the share of a subsidiary amount to $297.5 million), about $0.23 per share. The dividend will be distributed on September 26, 2011.
(4) During the period of the report 1,521,114 options were exercised for 1,033,638 of the
Company’s ordinary shares. Subsequent to the date of the report 567,925 options were exercised for 381,564 of the Company’s ordinary shares. After exercise of the options, the Company’s issued and paid-up share capital is 1,292,587,975 ordinary shares for NIS 1 par value.
(5) On February 28, 2011, ICL completed the transaction for acquisition of the companies, assets
and activities of the business unit in the specialty fertilizers area (hereinafter – “the Business Unit”) owned by the U.S. company, Scotts Miracle-Gro Company (hereinafter – “the Seller”).
The consideration for the acquisition reflects a value of about $271 million for the Business Unit. The acquisition consideration was allocated as follows: about $120 million to working capital, about $22 million to property, plant and equipment, about $102 million to identifiable intangible assets and about $10 million to long-term liabilities. The balance, in the amount of about $37 million, was allocated to goodwill.
The acquisition cost, in the amount of about $8 million, was recorded to other expenses.
The total sales of the Business Unit, for the year ended September 30, 2010, are about $242 million (the total sales are not taken from the Seller’s audited financial statements and were prepared in order to reflect the total sales of the Business Unit as an independent unit).
The Business Unit is engaged in manufacture and sale of specialty fertilizers, growing beds, plant protection products, grass seeds for commercial nurseries, sod for public use, sport surfaces and advanced agriculture. The Business Unit has about 340 employees and it operates three manufacturing facilities located in the Netherlands, the United Kingdom and the United States, and peat mines for growing beds in the United Kingdom. The main markets in which the Business Unit operates are Europe, North America, Asia/Pacific and Africa.
ICL intends to integrate the activities of the unit acquired into the ICL Fertilizers segment, while taking advantage of the marketing, operational and other synergies with ICL’s specialty fertilizer activities. Integration of the Business Unit will expand the products’ basket of ICL Fertilizers in the area of specialty fertilizers.
Commencing from the acquisition date, the financial statements of the Business Unit are consolidated in the Company’s consolidated financial statements.
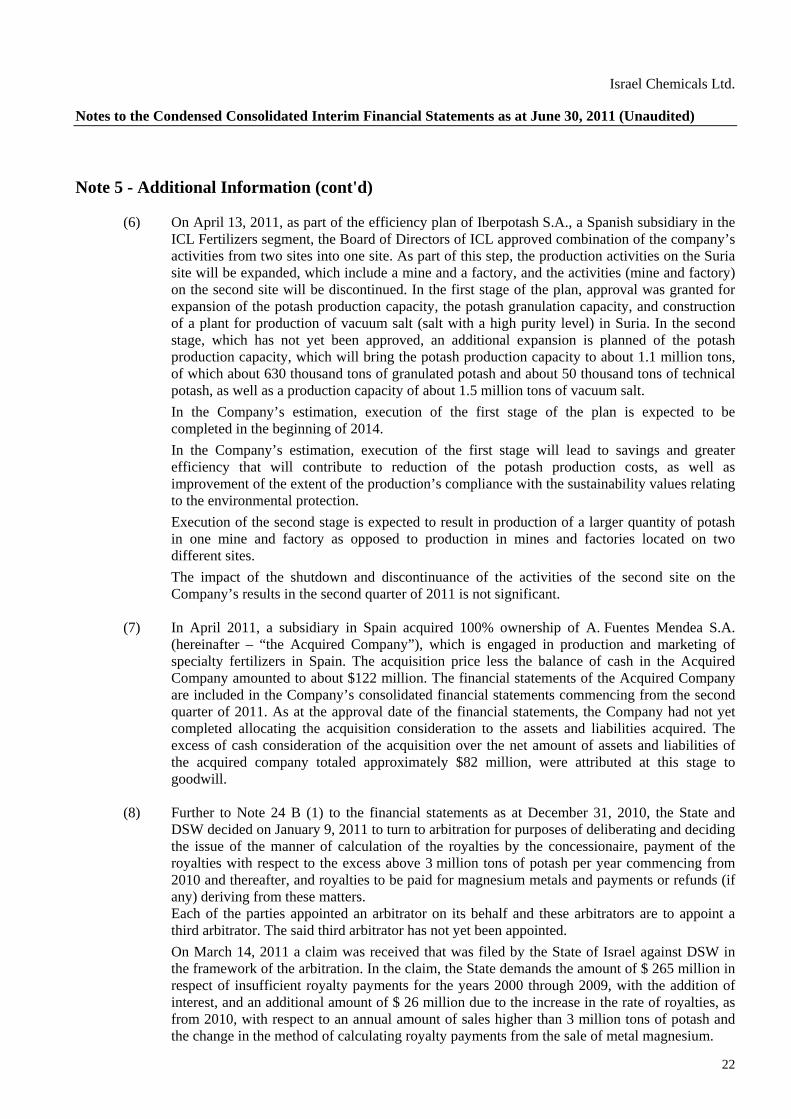
Israel Chemicals Ltd. Notes to the Condensed Consolidated Interim Financial Statements as at June 30, 2011 (Unaudited)
22
Note 5 - Additional Information (cont'd) (6) On April 13, 2011, as part of the efficiency plan of Iberpotash S.A., a Spanish subsidiary in the
ICL Fertilizers segment, the Board of Directors of ICL approved combination of the company’s activities from two sites into one site. As part of this step, the production activities on the Suria site will be expanded, which include a mine and a factory, and the activities (mine and factory) on the second site will be discontinued. In the first stage of the plan, approval was granted for expansion of the potash production capacity, the potash granulation capacity, and construction of a plant for production of vacuum salt (salt with a high purity level) in Suria. In the second stage, which has not yet been approved, an additional expansion is planned of the potash production capacity, which will bring the potash production capacity to about 1.1 million tons, of which about 630 thousand tons of granulated potash and about 50 thousand tons of technical potash, as well as a production capacity of about 1.5 million tons of vacuum salt.
In the Company’s estimation, execution of the first stage of the plan is expected to be completed in the beginning of 2014.
In the Company’s estimation, execution of the first stage will lead to savings and greater efficiency that will contribute to reduction of the potash production costs, as well as improvement of the extent of the production’s compliance with the sustainability values relating to the environmental protection.
Execution of the second stage is expected to result in production of a larger quantity of potash in one mine and factory as opposed to production in mines and factories located on two different sites.
The impact of the shutdown and discontinuance of the activities of the second site on the Company’s results in the second quarter of 2011 is not significant.
(7) In April 2011, a subsidiary in Spain acquired 100% ownership of A. Fuentes Mendea S.A.
(hereinafter – “the Acquired Company”), which is engaged in production and marketing of specialty fertilizers in Spain. The acquisition price less the balance of cash in the Acquired Company amounted to about $122 million. The financial statements of the Acquired Company are included in the Company’s consolidated financial statements commencing from the second quarter of 2011. As at the approval date of the financial statements, the Company had not yet completed allocating the acquisition consideration to the assets and liabilities acquired. The excess of cash consideration of the acquisition over the net amount of assets and liabilities of the acquired company totaled approximately $82 million, were attributed at this stage to goodwill.
(8) Further to Note 24 B (1) to the financial statements as at December 31, 2010, the State and
DSW decided on January 9, 2011 to turn to arbitration for purposes of deliberating and deciding the issue of the manner of calculation of the royalties by the concessionaire, payment of the royalties with respect to the excess above 3 million tons of potash per year commencing from 2010 and thereafter, and royalties to be paid for magnesium metals and payments or refunds (if any) deriving from these matters. Each of the parties appointed an arbitrator on its behalf and these arbitrators are to appoint a third arbitrator. The said third arbitrator has not yet been appointed.
On March 14, 2011 a claim was received that was filed by the State of Israel against DSW in the framework of the arbitration. In the claim, the State demands the amount of $ 265 million in respect of insufficient royalty payments for the years 2000 through 2009, with the addition of interest, and an additional amount of $ 26 million due to the increase in the rate of royalties, as from 2010, with respect to an annual amount of sales higher than 3 million tons of potash and the change in the method of calculating royalty payments from the sale of metal magnesium.

Israel Chemicals Ltd. Notes to the Condensed Consolidated Interim Financial Statements as at June 30, 2011 (Unaudited)
23
Note 5 - Additional Information (cont'd) (8) (cont'd)
On July 31, 2011 the Company submitted its defense to the arbitrators appointed. Study of the State’s allegations in respect of prior years indicates that they do not include any new material arguments that were not known to DSW and which in respect thereto DSW believes, on the basis of a legal opinion it received, that the royalties it had paid and their manner of calculation are consistent with the provisions of the concession. The same method of calculation was applied consistently since the time DSW was a government company, and was known to the State and accepted by it. Accordingly, and on the basis of the legal opinion DSW received, no provision has been recorded in the financial statements with respect to royalties that the Accountant General contends were not paid. As regards the increase in the rate of royalties as from 2010 in respect of sales of more than 3 million tons of potash a year, due to the fact that this is a new matter for which the parties have not yet been provided instructions as to which parameters should be considered in order to decide on a royalty rate higher than the present rate (5%), and due to the fact that the arbitration proceeding has not yet commenced, the Company is unable to determine a certain outcome in the possible range of outcomes between the present rate of royalty and the maximum rate of royalty that is likelier than other outcomes. Therefore the Company recorded a provision in the amount of half of the difference. See Note 24 to the annual financial Statements as at December 31, 2010 regarding the rest of the contingent liabilities of the Company and its subsidiaries.
(9) On March 14, 2011, ICL signed an agreement with a group of 17 banks from Europe, the
United States and Israel whereby these banks made available to ICL credit in the amount of $675 million. The credit line is for a period of 5 years and will be repaid in one lump-sum at the end of the period. In case of using up to $225 million of the available credit, the basic interest is Libor + 0.8%. In case of higher use of the credit, an additional interest of 0.15%-0.3% will be charged.
(10) On April 14, 2011, the Supreme Court handed down an order nisi to the state, ordering it to
adopt one of the permanent solutions for protection of the Dead Sea within three months from the order. A hearing of the application is expected in September – October 2011. In June 2011 a notice was published by the Prime Minister’s Office to the effect that the solution preferred by the Prime Minister is full harvest of the salt from the bed of the pond and its removal to the Northern section of the Dead Sea. Following the notice, on July 3, 2011, the Company announced that talks were ongoing between its representatives and officials from the Ministry of Finance regarding all the matters involved in application of the harvesting solution, including the allocation of financing. A national outline plan for the Dead Sea area (including the concession area) known as TAMA 13 is under preparation. The policy statement of the outline plan has been recently approved by the National Council. The document presents a vision according to which the company’s region of operation will continue to serve industry, tourism and the community, while preserving environmental aspects. The next step will be to prepare the regional outline plan on the basis of the policy statement.

.

Translation from Hebrew. The binding version is the original Hebrew version.
Israel Chemicals Ltd.
Separate Interim Financial Information presented in accordance with Regulation 38D
of the Securities Regulations (Periodic and Immediate Reports), 1970
Condensed Financial Data Related to the Company from the Condensed Consolidated Interim Financial Statements as at June 30, 2011
(Unaudited)

Israel Chemicals Ltd. Separate Interim Financial Information presented in accordance with Regulation 38D of the Securities Regulations (Periodic and Immediate Reports), 1970 Condensed Financial Data Related to the Company from the Condensed Consolidated Financial Statements as at June 30, 2011 Contents
Page
Auditors' Report 2 Condensed Details of Interim Financial Position 3 Condensed Details of Interim Profit and Loss 5 Condensed Details of Interim Comprehensive Income 6 Condensed Details of Interim Cash Flows 7 Additional information 8

Somekh Chaikin Telephone 972 3 684 8000 KPMG Millennium Tower Fax 972 3 684 8444 17 Ha'arba'a Street, PO Box 609 Internet www.kpmg.co.il Tel Aviv 61006 Israel
Somekh Chaikin, a partnership registered under the Israeli Partnership Ordinance, is the Israeli member firm of KPMG International, a Swiss cooperative.
To: The shareholders of Israel Chemicals Ltd. Subject: Special auditors’ report on separate financial data according to Regulation 38D of the Securities Regulations (Periodic and Immediate Reports) – 1970 Introduction We have reviewed the separate interim financial information presented in accordance with Regulation 38D of the Securities Regulations (Periodic and Immediate Reports) – 1970 of Israel Chemicals Ltd. (hereinafter - the Company), as at June 30, 2011 and for the six-month and three-month periods then ended. The separate interim financial information is the responsibility of the Company’s Board of Directors and of its Management. Our responsibility is to express a conclusion on the separate interim financial information based on our review. Scope of Review We conducted our review in accordance with the Standard on Review Engagements 1, "Review of Interim Financial Information Performed by the Independent Auditor of the Entity" of the Institute of Certified Public Accountants in Israel. A review of separate interim financial information consists of making inquiries, primarily of persons responsible for financial and accounting matters, and applying analytical and other review procedures. A review is substantially less in scope than an audit conducted in accordance with generally accepted auditing standards in Israel and consequently does not enable us to obtain assurance that we would become aware of all significant matters that might be identified in an audit. Accordingly, we do not express an audit opinion. Conclusion Based on our review, nothing has come to our attention that causes us to believe that the accompanying separate interim financial information is not prepared, in all material respects, in accordance with Regulation 38D of the Securities Regulations (Periodic and Immediate Reports) – 1970. Somekh Chaikin Certified Public Accountants (Isr.) August 16, 2011

Financial Data Related to the Company from the Condensed Consolidated Interim Financial Statements Condensed Details of Interim Financial Position as at June 30 June 30 December 31 2011 2010 2010 (Unaudited) (Unaudited) (Audited) US$ thousands US$ thousands US$ thousands
Current assets Cash and cash equivalents 73,974 77,676 115,682 Short-term investments, deposits and loans 466 16,029 157,500 Investee companies - current account 313,183 418,227 649,365 Other receivables, including derivative instruments 3,266 2,977 4,455 Income taxes refundable 5,747 - -
Total current assets 396,636 514,909 927,002
Non-current assets
Investments in investee companies 3,168,599 2,782,800 3,056,038 Long-term deposits and receivables 8,070 8,022 8,158 Loans to subsidiaries 570,000 440,000 440,000 Long-term derivative instruments 45,176 17,896 36,308 Deferred taxes, net 8,407 9,559 9,192 Property, plant and equipment 1,241 860 1,302
Total non-current assets 3,801,493 3,259,137 3,550,998
Total assets 4,198,129 3,774,046 4,478,000

4
Israel Chemicals Limited June 30 June 30 December 31 2011 2010 2010 (Unaudited) (Unaudited) (Audited) US$ thousands US$ thousands US$ thousands
Current liabilities Credit from banks and others 51,535 252,072 282,027 Credit from investee companies 189,926 66,049 265,236 Dividend payable - - 169,703 Other payables, including derivative instruments 24,778 77,584 67,819 Income taxes payable - 8,993 833 Total current liabilities 266,239 404,698 785,618 Non-current liabilities Loans from banks and others - 150,000 120,000 Loans from investee companies 404,142 383,522 473,522 Debentures 459,350 408,010 441,728 Long-term derivative instruments 23,947 28,078 21,274 Employee benefits 16,897 13,981 15,751 Total non-current liabilities 904,336 983,591 1,072,275 Total liabilities 1,170,575 1,388,289 1,857,893 Equity Share capital 542,162 541,195 541,858 Share premium 92,683 85,956 90,675 Capital reserves 99,074 (34,542) 37,544 Retained earnings 2,553,748 2,053,261 2,210,143 Treasury shares (260,113) (260,113) (260,113) Total equity attributable to the holders of the Company’s rights 3,027,554 2,385,757 2,620,107 Total liabilities and equity 4,198,129 3,774,046 4,478,000
Nir Gilad Akiva Mozes Avi Doitchman
Chairman of the Board of Chief Executive CFO Directors Officer
Approval date of the financial statements: August 16, 2011. The notes to the interim separate financial data are an integral part thereof.
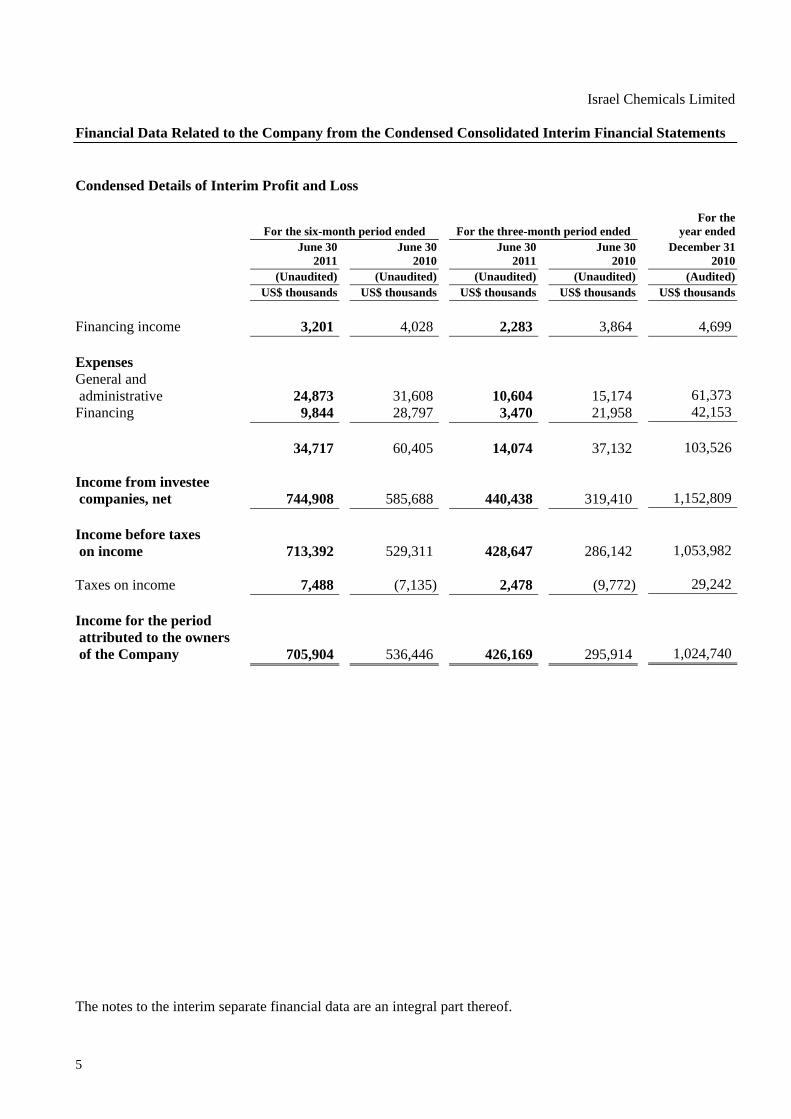
5
Israel Chemicals Limited Financial Data Related to the Company from the Condensed Consolidated Interim Financial Statements Condensed Details of Interim Profit and Loss For the For the six-month period ended For the three-month period ended year ended June 30 June 30 June 30 June 30 December 31 2011 2010 2011 2010 2010 (Unaudited) (Unaudited) (Unaudited) (Unaudited) (Audited) US$ thousands US$ thousands US$ thousands US$ thousands US$ thousands
Financing income 3,201 4,028 2,283 3,864 4,699 Expenses General and administrative 24,873 31,608 10,604 15,174 61,373Financing 9,844 28,797 3,470 21,958 42,153 34,717 60,405 14,074 37,132 103,526 Income from investee companies, net 744,908 585,688 440,438 319,410 1,152,809 Income before taxes on income 713,392 529,311 428,647 286,142 1,053,982 Taxes on income 7,488 (7,135) 2,478 (9,772) 29,242 Income for the period attributed to the owners of the Company 705,904 536,446 426,169 295,914 1,024,740 The notes to the interim separate financial data are an integral part thereof.
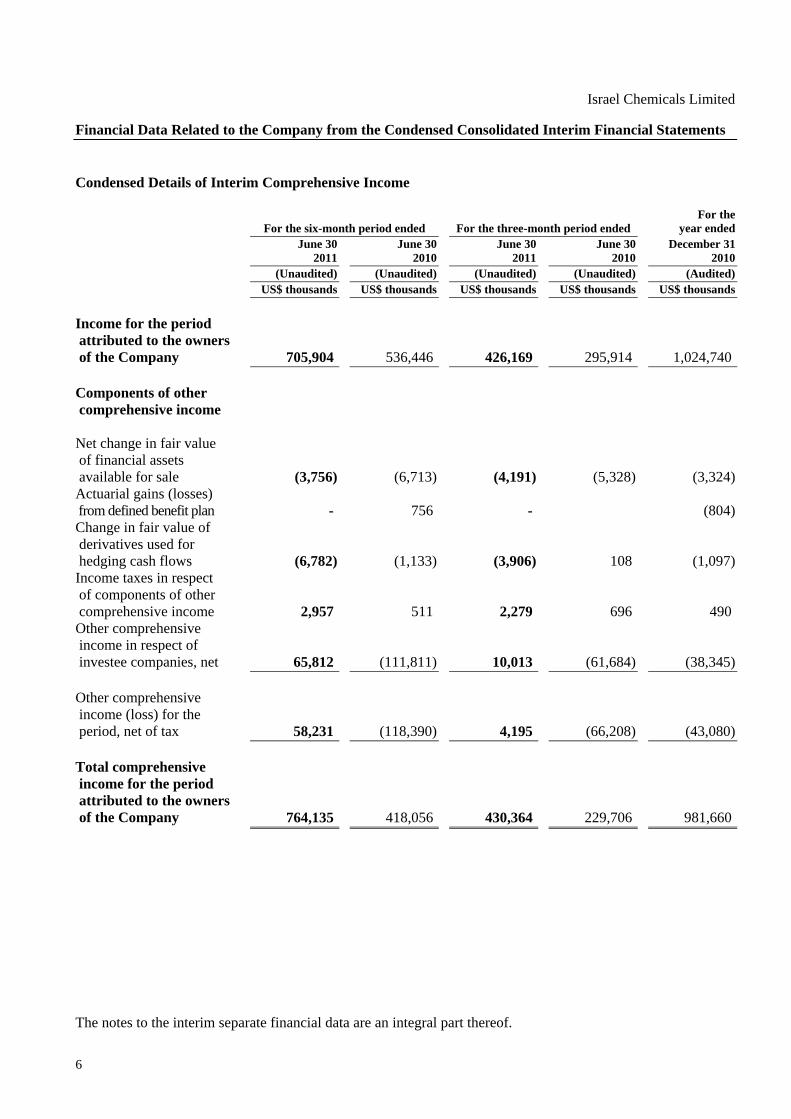
6
Israel Chemicals Limited
Financial Data Related to the Company from the Condensed Consolidated Interim Financial Statements Condensed Details of Interim Comprehensive Income For the For the six-month period ended For the three-month period ended year ended June 30 June 30 June 30 June 30 December 31 2011 2010 2011 2010 2010 (Unaudited) (Unaudited) (Unaudited) (Unaudited) (Audited) US$ thousands US$ thousands US$ thousands US$ thousands US$ thousands
Income for the period attributed to the owners of the Company 705,904 536,446 426,169 295,914 1,024,740 Components of other comprehensive income Net change in fair value of financial assets available for sale (3,756) (6,713) (4,191) (5,328) (3,324)Actuarial gains (losses) from defined benefit plan - 756 - (804)Change in fair value of derivatives used for hedging cash flows (6,782) (1,133) (3,906) 108 (1,097)Income taxes in respect of components of other comprehensive income 2,957 511 2,279 696 490 Other comprehensive income in respect of investee companies, net 65,812 (111,811) 10,013 (61,684) (38,345) Other comprehensive income (loss) for the period, net of tax 58,231 (118,390) 4,195 (66,208) (43,080) Total comprehensive income for the period attributed to the owners of the Company 764,135 418,056 430,364 229,706 981,660 The notes to the interim separate financial data are an integral part thereof.

7
Israel Chemicals Limited
Financial Data Related to the Company from the Condensed Consolidated Interim Financial Statements Condensed Details of Interim Cash Flows
For the For the six-month period ended For the three-month period ended year ended June 30 June 30 June 30 June 30 December 31 2011 2010 2011 2010 2010 (Unaudited) (Unaudited) (Unaudited) (Unaudited) (Audited) US$ thousands US$ thousands US$ thousands US$ thousands US$ thousands
Cash flows from operating activities Income for the period 705,904 536,446 426,169 295,914 1,024,740 Adjustments for: Depreciation and amortization 139 213 67 105 399 Interest expenses, net 10,121 9,700 4,859 3,751 19,646 Gain on realization of securities classified as available-for-sale (4,535) - (4,535) - (3,244)Income from investee companies, net (744,908) (585,688) (440,438) (319,410) (1,152,809)Share based payment transactions 7,845 15,969 3,773 8,185 32,518 Revaluation of assets and liabilities denominated in foreign currency 4,712 3,033 1,246 3,715 11,382 Income tax expense 7,488 (7,135) 2,478 (9,772) 29,242 (13,234) (27,462) (6,381) (17,512) (38,126) Change in other receivables 1,049 (428) 2,676 (1,602) (1,782)Change in trade and other payables 9,723 (69) 7,815 (3,538) (7,364)Change in employee benefits 1,146 188 (37) (324) 2,006 (1,316) (27,771) 4,073 (22,976) (45,266)Income tax paid (220,125) (71,459) (48,869) (21,475) (123,152)Interest received 74 334 26 287 1,584 Interest paid (10,085) (8,947) (9,184) (7,938) (20,115) Net cash used in operating activities related to the Company (231,452) (107,843) (53,954) (52,102) (186,949)Net cash provided by operating activities related to investee companies 855,053 1,140,778 248,324 630,668 1,361,372 Net cash provided by operating activities 623,601 1,032,935 194,370 578,566 1,174,423 The notes to the interim separate financial data are an integral part thereof.
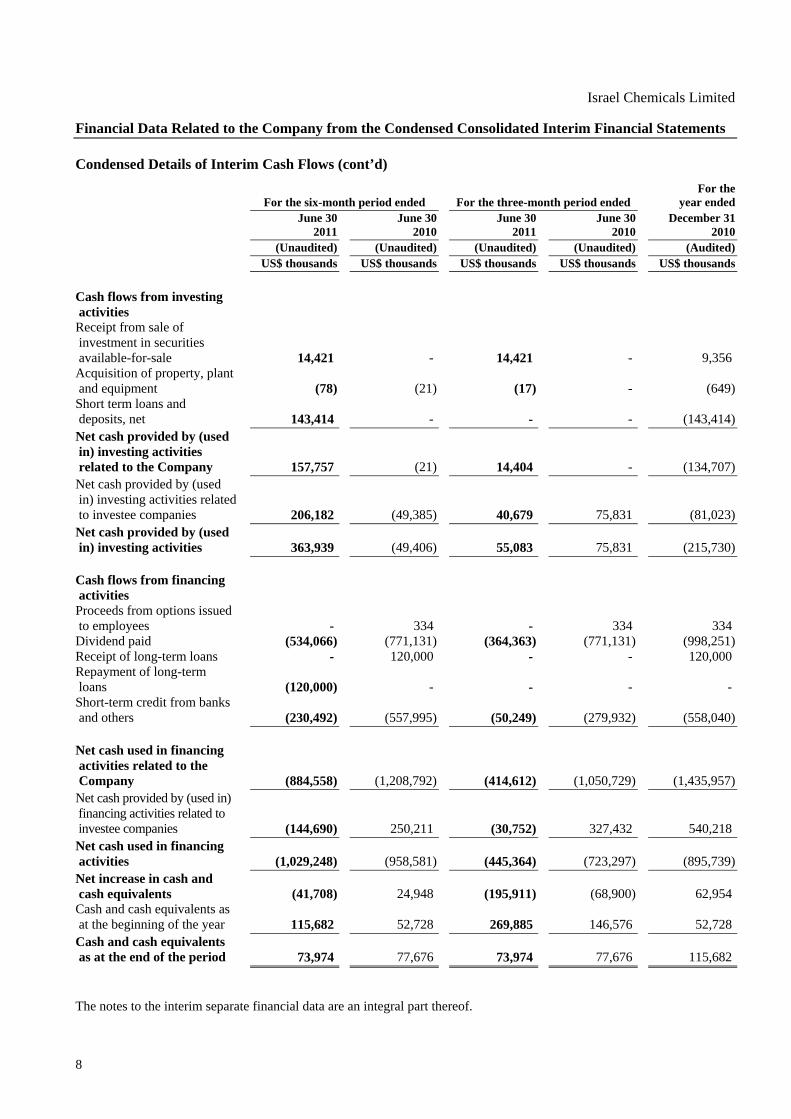
8
Israel Chemicals Limited
Financial Data Related to the Company from the Condensed Consolidated Interim Financial Statements Condensed Details of Interim Cash Flows (cont’d)
For the For the six-month period ended For the three-month period ended year ended June 30 June 30 June 30 June 30 December 31 2011 2010 2011 2010 2010 (Unaudited) (Unaudited) (Unaudited) (Unaudited) (Audited) US$ thousands US$ thousands US$ thousands US$ thousands US$ thousands
Cash flows from investing activities Receipt from sale of investment in securities available-for-sale 14,421 - 14,421 - 9,356 Acquisition of property, plant and equipment (78) (21) (17) - (649)Short term loans and deposits, net 143,414 - - - (143,414) Net cash provided by (used in) investing activities related to the Company 157,757 (21) 14,404 - (134,707)Net cash provided by (used in) investing activities related to investee companies 206,182 (49,385) 40,679 75,831 (81,023)Net cash provided by (used in) investing activities 363,939 (49,406) 55,083 75,831 (215,730) Cash flows from financing activities Proceeds from options issued to employees - 334 - 334 334 Dividend paid (534,066) (771,131) (364,363) (771,131) (998,251)Receipt of long-term loans - 120,000 - - 120,000 Repayment of long-term loans (120,000) - - - - Short-term credit from banks and others (230,492) (557,995) (50,249) (279,932) (558,040) Net cash used in financing activities related to the Company (884,558) (1,208,792) (414,612) (1,050,729) (1,435,957) Net cash provided by (used in) financing activities related to investee companies (144,690) 250,211 (30,752) 327,432 540,218 Net cash used in financing activities (1,029,248) (958,581) (445,364) (723,297) (895,739)Net increase in cash and cash equivalents (41,708) 24,948 (195,911) (68,900) 62,954 Cash and cash equivalents as at the beginning of the year 115,682 52,728 269,885 146,576 52,728 Cash and cash equivalents as at the end of the period 73,974 77,676 73,974 77,676 115,682
The notes to the interim separate financial data are an integral part thereof.

Israel Chemicals Limited Financial Data Related to the Company from the Condensed Consolidated Interim Financial Statements
9
Additional Information Note 1 - General
The separate interim financial information is presented in accordance with Regulation 38D of the Securities Regulations (Periodic and Immediate Reports) - 1970, and does not include all the information required by Regulation 9C and the 10th Addendum to the Securities Regulations (Periodic and Immediate Reports) - 1970 regarding the separate financial information of a corporation. It should be read in conjunction with the separate financial information as at and for the year ended December 31, 2010 and in conjunction with the condensed consolidated interim financial statements as at June 30, 2011. In this interim financial information: (A) The Company - Israel Chemicals Ltd.
(B) Subsidiaries - Companies, including partnerships, whose financial statements are fully consolidated, directly or indirectly, with the financial statements of the Company.
(C) Investee companies - Subsidiaries and companies, including partnerships or joint ventures, the Company's investment in which is included in the financial statements, directly or indirectly, on the equity basis.
Note 2 - Significant Accounting Principles Applied in the Condensed Consolidated Interim
Financial Information
The accounting principles in this condensed interim financial information are in accordance with the accounting principles detailed in the separate financial information as at December 31, 2010.
Note 3 - Material Relationships, Commitments and Transactions with Investee Companies
On January 1, 2011, a dividend in the amount of $4.5 million was received from the subsidiary Tovala. On January 12, 2011, dividends in the amount of $150 million and $45 million were received from the subsidiaries Dead Sea Works and Rotem Amfert Negev, respectively. On February 25, 2011, a dividend in the amount of $2 million was received from the subsidiary Hy Yield Bromine Inc. On March 10, 2011 the subsidiary Tovala declared a dividend of $9.5 million. The dividend was received on May 12, 2011. On March 14, 2011, a proportionately consolidated company, IDE, declared distribution of a dividend in the amount of $10 million. The Company's proportionate part of the dividend in the amount of $5 million was received on April 3, 2011.

Israel Chemicals Limited Financial Data Related to the Company from the Condensed Consolidated Interim Financial Statements
10
Note 3 - Material Relationships, Commitments and Transactions with Investee Companies (cont’d)
On March 31, 2011, dividends in the amount of $400 million, $38 million and $25 million were received from the subsidiaries Dead Sea Works, Dead Sea Bromine and Rotem Amfert Negev, respectively. On May 12, 2011, a dividend in the amount of $40 million was received from the subsidiary Rotem Amfert Negev. On May 15, 2011, a dividend in the amount of $25 million was received from the subsidiary Dead Sea Bromine. On June 28, 2011, a dividend in the amount of $140 million was received from the subsidiary Dead Sea Works. After the date of this report, on August 14, 2011 dividends in the amount of $150 million and $60 million were declared by the subsidiaries Dead Sea Works and Rotem Amfert Negev, respectively. After the date of this report, on August 15, 2011 a dividend in the amount of $31 million was declared by the subsidiary Dead Sea Bromine.

2121212

Quarterly Report regarding Effectiveness of the Internal Control over the Financial Reporting and the Disclosure in accordance with Regulation 38C(a): The management, under the supervision of the Board of Directors of Israel Chemicals Ltd. (hereinafter – “the Corporation”), is responsible for determining and maintaining proper internal control over the Corporation’s financial reporting and disclosure. Regarding this matter, the members of management are:
1. Akiva Mozes, CEO 2. Asher Grinbaum, Deputy CEO and COO 3. Yossi Shahar, Deputy CEO and Business Development 4. Nissim Adar, CEO of ICL industrial Products 5. Dani Chen, CEO of ICL Fertilizers 6. Lisa Haimovitz, General Counsel and Company Secretary 7. Herzel Bar-Niv, VP of International taxation 8. Avi Doitchman, CFO 9. Nathan Dreyfuss, VP of Finance 10. Amir Benita, ICL Controller 11. Osnat Sessler, VP of Investor Relations and Communications 12. Eli Amit, VP of Economics 13. Asher Rapaport, VP of Human Resources
Internal control over the financial reporting and disclosure includes the Corporation’s existing controls and procedures, which were planned by the CEO and the most senior officer in the finance area or under their supervision, or by a party actually executing the said functions, under the supervision of the Corporation’s Board of Directors, which were intended to provide a reasonable level of confidence regarding the reliability of the financial reporting and preparation of the financial statements in accordance with law, and to ensure that information the Corporation is required to disclose in the statements it publishes under law was gathered, processed, summarized and reported on the date and in the format prescribed by law. The internal control includes, among other things, controls and procedures that were planned to ensure that information the Corporation is required to disclose, as stated, was accumulated and transferred to Corporation management, including to the CEO and to the most senior officer in the finance area or to a party actually executing the said functions, in order to enable making decisions at the appropriate time, with respect to the disclosure requirement. Due to its inherent limitations, the internal control over the financial reporting and disclosure is not intended to provide complete assurance that a misrepresentation or omission of information in the statements will be avoided or discovered. In the quarterly report regarding the effectiveness of internal control over financial reporting and disclosure which was attached to the quarterly report for the period ending March 31, 2011 (hereinafter: the last quarterly report regarding internal controls), concluded that the internal controls are effective. Up to the date of the report, no event or matter came to the attention of the Board of Directors and management that would require a change in the evaluation of the internal controls, as was presented in the last annual report regarding internal controls. As of the report date, based on the evaluation of the internal controls in the last quarterly report regarding internal controls, and based on the information that came to the attention of management and the Board of Directors as above, the internal controls are effective. Date: August 16, 2011 _______________ _______________ _______________ Akiva Mozes Nir Gilad Avi Doitchman Chief Executive Chairman of the CFO Officer Board of Directors

Declaration of the most senior officer in the finance area in accordance with Regulation 38C(d)(2):
I, Avi Doitchman, declare that: 1. I have examined the financial statements and other financial information included in the statements of Israel
Chemicals Ltd. (hereinafter – “the Corporation”) as at June 30, 2011 (hereinafter – “the Statements”); 2. As far as I am aware, the financial statements and the other financial information included in the Statements do
not include a misrepresentation of a material fact and they do not lack a material fact that is required so that the representations included therein, in light of the circumstances in which such representations were included, will not be misleading with reference to the period covered by the Statements;
3. As far as I am aware, the financial statements and other financial information included in the Statements
properly reflect, in all material respects, the Corporation’s financial position, results of operations and cash flows as at the dates and for the periods to which the Statements relate;
4. I have disclosed to the Corporation’s auditors, Board of Directors and Audit and Financial Statements
Committees, based on my most up-to-date estimation with respect to the internal control over the Corporation’s financial reporting and disclosure:
A) All the significant deficiencies and material weaknesses in determination or operation of the internal
control over the financial reporting and disclosure to the extent it relates to the financial statements and the other financial information included in the Statements, which could reasonably have an adverse impact on the Corporation’s ability to gather, process, summarize or report financial information in such a manner that could cause doubt with respect to the reliability of the financial report and preparation of the financial statements in accordance with the provisions of law; and –
B) Every fraud, whether or not significant, wherein the CEO is involved or a party under his direct
supervision or other employees are involved that have a significant function in the internal control over the financial reporting and disclosure;
5. I, alone or together with others in the Corporation:
A) Have determined controls and procedures, or have verified the determination and existence of controls and procedures under my supervision, which are designed to ensure that significant information relating to the Corporation including subsidiaries as defined in the Securities Law (preparation of annual financial statements), 1993, to the extent it is relevant to the financial statements and to other financial information included in the Statements is brought to my attention by others in the Corporation and subsidiaries particularly during the period of preparation of the Statements; and –
B) Have determined controls and procedures, or have verified the determination and existence of controls
and procedures under my supervision, which are designed to reasonably ensure the reliability of the financial report and preparation of the financial statements in accordance with the provisions of law, including in accordance with generally accepted accounting principles (GAAP);
C) No event or matter that happened during the period since the last reporting period and this reporting
period has come to my attention, which would require a change in the conclusion by the Board of Directors and management in relation to the effectiveness of the internal controls over financial reporting and disclosure of the Corporation.
Nothing in that stated above detracts from my responsibility or the responsibility of any other person under any law. Date: August 16, 2011 _________________ Avi Doitchman, CFO

Declaration of the CEO in accordance with Regulation 38C(d)(1):
I, Akiva Mozes, declare that: 1. I have examined the Periodic Report of Israel Chemicals Ltd. (hereinafter – “the Corporation”) as at June 30,
2011 (hereinafter – “the Statements”); 2. As far as I am aware, the Statements do not include a misrepresentation of a material fact and they do not lack a
material fact that is required so that the representations included therein, in light of the circumstances in which such representations were included, will not be misleading with reference to the period covered by the Statements;
3. As far as I am aware, the financial statements and other financial information included in the Statements
properly reflect, in all material respects, the Corporation’s financial position, results of operations and cash flows as at the dates and for the periods to which the Statements relate;
4. I have disclosed to the Corporation’s auditors, Board of Directors and Audit and Financial Statements
Committees, based on my most up-to-date estimation with respect to the internal control over the Corporation’s financial reporting and disclosure:
A) All the significant deficiencies and weaknesses in determination or operation of the internal control over
the financial reporting and disclosure that might reasonably have an unfavorable impact on the Corporation’s ability to gather, process, summarize or report financial information in such a manner that could cause doubt with respect to the reliability of the financial report and preparation of the financial statements in accordance with the provisions of law;
and – B) Every fraud, whether or not significant, wherein the CEO is involved or a party under his direct
supervision or other employees are involved that have a significant function in the internal control over the financial reporting and disclosure;
5. I, alone or together with others in the Corporation:
A) Have determined controls and procedures, or have verified the determination and existence of controls and procedures under my supervision, which are designed to ensure that significant information relating to the Corporation including subsidiaries as defined in the Securities Law (preparation of annual financial statements), 1993, is brought to my attention by others in the Corporation and subsidiaries, particularly during the period of preparation of the Statements; and –
B) Have determined controls and procedures, or have verified the determination and existence of controls
and procedures under my supervision, which are designed to reasonably ensure the reliability of the financial report and preparation of the financial statements in accordance with the provisions of law, including in accordance with generally accepted accounting principles (GAAP);
C) No event or matter that happened during the period since the last reporting period and this reporting
period has come to my attention, which would require a change in the conclusion by the Board of Directors and management in relation to the effectiveness of the internal controls over financial reporting and disclosure of the Corporation.
Nothing in that stated above detracts from my responsibility or the responsibility of any other person under any law. Date: August 16, 2011 ____________________ Akiva Mozes, CEO