
Transition to Work Interim Evaluation Report · Transition to Work Interim Evaluation Report 9 List...
130
Transition to Work Interim Evaluation Report
Transcript of Transition to Work Interim Evaluation Report · Transition to Work Interim Evaluation Report 9 List...

Transition to Work Interim Evaluation Report

2
ISBN
978-1-76051-872-1 [PRINT]
978-1-76051-870-7 [PDF]
978-1-76051-871-4 [DOCX]
With the exception of the Commonwealth Coat of Arms, the Department’s logo, any material
protected by a trade mark and where otherwise noted all material presented in this document is
provided under a Creative Commons Attribution 3.0 Australia
(http://creativecommons.org/licenses/by/3.0/au/) licence.
The details of the relevant licence conditions are available on the Creative Commons website
(accessible using the links provided) as is the full legal code for the CC BY 3.0 AU licence
(http://creativecommons.org/licenses/by/3.0/au/legalcode).
The document must be attributed as the Transition to Work Interim Evaluation Report.

3
Acknowledgements
This report was prepared by Christina Jankovic, Wendy Elliott, Bethany Jones, Patricia Barber,
Matthew Toohey, Sepi Helali, Robyn Henderson, Alison Reinhard, Peter Schmidli, Deo Mwesigye,
and Yingru Wu. Stephen Howe provided assistance with data construction of analysis datasets.
The department would also like to acknowledge the contribution to this report from commissioned
research undertaken by the Social Research Centre.
4
Contents Acknowledgements ............................................................................................................................. 3
List of tables ............................................................................................................................................ 9
List of figures ......................................................................................................................................... 10
List of short forms ................................................................................................................................. 12
Glossary ................................................................................................................................................. 13
Executive summary ............................................................................................................................... 17
Background ....................................................................................................................................... 17
Evaluation of the Transition to Work service ................................................................................... 18
Methods and analysis ....................................................................................................................... 19
Main findings .................................................................................................................................... 19
Early implementation and operation of the TtW service 19
Engagement and retention of participants in TtW 19
Early education, employment and labour market attachment outcomes 21
Conclusion ......................................................................................................................................... 21
1 Introduction ............................................................................................................................. 23
1.1 The study to work transition — government responses internationally ............................. 23
1.1.1 Types of youth employment programs around the world 24
1.1.2 Characteristics of successful youth employment programs 26
1.2 Transition to Work service ................................................................................................... 26
1.2.1 TtW was implemented progressively from February 2016 to May 2016 27
1.2.2 TtW targets three main groups of young people 27
1.2.3 The TtW service process 28
1.2.4 The TtW funding model 30
1.2.5 The TtW funding model includes up-front payments and 12-week Outcome
Performance Target payments 31
1.2.6 The TtW service focuses on both employment and education outcomes 31
1.2.7 Service guarantee, Service Delivery Plans and key performance indicators 32
1.2.8 Interactions of TtW with other employment programs 33
2 Evaluation of the Transition to Work service .......................................................................... 34
2.1 Evaluation outline ................................................................................................................ 34
2.1.1 Stage one 34
2.1.2 Stage two 34

5
2.2 Key evaluation questions ..................................................................................................... 34
Question 1.1: To what extent do the service implementation and operational processes enable
effective and efficient service delivery? 34
Question 1.2: How efficiently and effectively does the service engage and retain participants? 35
Question 1.3: Do early employment and education outcomes indicate participants are
benefiting from TtW? 35
2.3 Methodology ........................................................................................................................ 35
2.3.1 Data sources 35
2.3.2 Study populations 36
2.3.3 Profile of the TtW inflow population 37
3 The extent to which service implementation and operational processes enabled effective
and efficient service delivery ................................................................................................... 39
Key findings ....................................................................................................................................... 39
3.1 Indicators used to address the evaluation question............................................................ 39
3.2 Early provider experiences of implementation ................................................................... 40
3.2.1 Most providers found the short implementation timeframe challenging 40
3.2.2 Providers found the start-up referrals challenging, as referrals lacked sufficient
contact information or contact details were incorrect 41
3.2.3 Providers’ experiences of the implementation process were influenced by the phase
in which they started 44
3.2.4 Providers were generally positive about the level of support and information from
the department 45
3.2.5 The contribution of stakeholder interactions and engagement to successful service
implementation 49
3.3 Provider views as the TtW service matured ........................................................................ 50
3.3.1 The lack of awareness among stakeholders and a system glitch compounded the
initial challenge of referrals from DHS 51
3.3.2 Providers had limited success in recruiting Group Two participants 52
3.3.3 The number of Group Three referrals was below expectations 53
3.3.4 Providers reported that the TtW funding structure was sustainable and allowed them
to support participants appropriately 54
3.3.5 Providers were satisfied with the operational information about TtW and, to a lesser
extent, the ESS Web system 55
3.4 Providers’ strategies to address any implementation and early operational issues ........... 56
3.4.1 Providers regularly visited Centrelink offices to encourage Group One referrals by
increasing understanding of TtW 56

6
3.4.2 Providers worked with local schools and community groups to recruit Group Two
participants 57
3.4.3 Providers suggested that the department could provide incentives to increase Group
Three referrals 58
3.5 The appropriateness of the TtW model in helping young people to become job ready..... 59
3.5.1 The TtW service model is flexible and appropriate for engaging young people 61
3.5.2 Providers and participants preferred TtW to jobactive 63
3.6 Suggestions from stakeholders ............................................................................................ 64
3.6.1 Support and guidance from the department 64
3.6.2 Suggestions for expanding the service 65
4 The effectiveness and efficiency of the Transition to Work service in engaging and retaining
participants .............................................................................................................................. 66
Key findings ....................................................................................................................................... 66
4.1 The number of participants engaged in TtW compared with the allocation of Annual
Funded Places — caseloads and commencements ............................................................. 67
4.1.1 Contracts were approved on a rolling basis 67
4.1.2 Utilisation of Annual Funded Places 68
4.2 Speed of commencement in services .................................................................................. 71
4.2.1 The commencement process 71
4.2.2 Lags between referral and commencement were initially very large but decreased
rapidly 71
4.2.3 Time to commence is faster in TtW than in the jobactive comparison group 73
4.3 Appointments and activities ................................................................................................ 75
4.3.1 TtW providers engaged more frequently with participants over the six months
following the initial appointment 75
4.3.2 Consistent with the service design, TtW participants engage in more activities than
participants in the matched jobactive comparison group 77
4.3.3 TtW offers a wider range of options to meet activity requirements 79
4.3.4 Three most important strategies TtW providers used to achieve job placements 81
4.4 Whether referred participants left before completing 12 months of services ................... 82
4.4.1 Non-commencements 82
4.4.2 Exits from services 84
4.4.3 Reasons for not completing 12 months in TtW 85
5 Early impacts and outcomes achieved for Transition to Work participants ............................ 90
Key findings ....................................................................................................................................... 90
7
5.1 Early perceptions of the impacts of the TtW service ........................................................... 91
5.2 Outcome Performance Targets in TtW ................................................................................ 92
5.2.1 Outcome Performance Targets progressively increased over the first year to reflect
the time needed for providers to build their caseloads and achieve outcomes 92
5.2.2 Performance against targets improved over time in operation 92
5.2.3 Around half of the providers were achieving their quarterly outcome targets after a
year of operation 93
5.2.4 TtW-only providers performed similarly to providers delivering both TtW and
jobactive 94
5.3 Education and employment participation qualifying for an outcome ................................ 94
5.3.1 Core outcomes in TtW 94
5.3.2 There were almost four times as many employment outcomes as education
outcomes 96
5.3.3 A third of education and training activity placements counted towards education
outcomes 96
5.3.4 There were relatively few hybrid outcomes 98
5.4 Labour market and education outcome measures .............................................................. 99
5.4.1 Similar proportions of TtW and jobactive participants reported earnings 100
5.4.2 TtW participants had higher labour market attachment and positive outcome
attainment 101
6 Conclusions ............................................................................................................................ 105
6.1 Appropriateness, implementation, engagement and outcomes ...................................... 105
6.1.1 Appropriateness and implementation 105
6.1.2 Engagement-related measures 105
6.1.3 Exits from services 107
6.1.4 Outcomes 107
6.1.5 Stakeholder suggestions for improving the TtW service 108
Appendix A — Employment regions ................................................................................................... 109
Appendix B — TtW outcomes matrix.................................................................................................. 110
Appendix C — TtW study group construction, statistical analysis ..................................................... 111
The primary study population ........................................................................................................ 111
Administrative data: matched samples (TtW and jobactive) ......................................................... 111
Estimating the effects of TtW ......................................................................................................... 112
Appendix D — TtW outcome types .................................................................................................... 116

8
Appendix E — Education activity types in TtW ................................................................................... 118
Appendix F — Labour market attachment and positive outcome measures ..................................... 119
Constructing the labour market attachment measure ................................................................... 119
Logistic regression modelling .......................................................................................................... 119
Appendix G — Qualitative study discussion and locations ................................................................. 123
Questions guiding discussion on operational aspects of TtW post implementation ..................... 123
Appendix H — Income support and reported earnings status ........................................................... 124
TtW participants had a slightly lower rate of exiting income support, and this may be attributed to
their higher level of engagement in education and training activities .............................. 124
Low earnings among young people meant that few went off income support or reduced their
income support payments significantly ............................................................................. 125
After six months in services there was little difference in earnings and income support reliance
between TtW and jobactive ............................................................................................... 127
End notes ............................................................................................................................................ 129
Transition to Work Interim Evaluation Report
9
List of tables
Table 2.1 TtW and jobactive participants on income support at referral and 30 days after
referral 38
Table 3.1 Phases of TtW rollout 40
Table 3.2 Referral paths of the three target groups 51
Table 4.1 Caseload at 31 July 2016 and 31 January 2017 70
Table 4.2 Initial appointment attendance rates for participants who commenced within
30 days of referral, comparing TtW and the jobactive comparison group 76
Table 4.3 Appointments attended in the first 180 days from commencement, comparing
TtW and jobactive 77
Table 5.1 Breakdown of outcomes achieved, by outcome type 96
Table 5.2 Participation in education and training in the first 180 days after commencement 97
Table 5.3 Outcome measures achieved, by month of participation, comparing TtW
and jobactive 100
Table 5.4 Odds ratios for labour market attachment and positive outcome, comparing
TtW and the jobactive comparison group 104
Table C. 1 Demographic characteristics of TtW inflow population and matched samples for
TtW and jobactive 112
Table C. 2 Key demographic comparisons — statistical differences 114
Table D. 1 Outcomes achieved, by outcome type and quarter, to 31 March 2017 117
Table F. 1 Logistic regression — labour market attachment 121
Table F. 2 Logistic regression — positive outcome 122
Table G. 1 Qualitative discussions with TtW participants and stakeholders 123

Transition to Work Interim Evaluation Report
10
List of figures Figure 1.1 Pathway to employment showing five points at which policy interventions can
either keep young people from disengaging or bring them back on track 25
Figure 1.2 Transition to Work pathway for Group One 29
Figure 2.1 Age at referral to TtW 37
Figure 3.1 Provider views on start-up caseload referrals 42
Figure 3.2 Provider views on suitability of referrals at contract start date and November
2016 (current at time of survey) 43
Figure 3.3 Provider satisfaction with departmental support in their first three months, by
provider start phase 44
Figure 3.4 Provider views on whether departmental staff communicated clearly, by provider
start phase 45
Figure 3.5 Provider views on departmental support during the implementation phase 46
Figure 3.6 Provider views on departmental responses to queries 47
Figure 3.7 Provider views on the department’s notice about changes and responsiveness
to queries 48
Figure 3.8 Provider views on courtesy and respectfulness of departmental staff 48
Figure 3.9 Provider views on communication skills of departmental staff 49
Figure 3.10 Provider views on difficulty of engaging Group Two participants 52
Figure 3.11 Referrals and commencements in the first 30 days of provider contracts, by
participant group 53
Figure 3.12 Provider satisfaction with the Learning Centre, program guidelines and TtW Deed 56
Figure 3.13 Provider views on TtW’s suitability for the target groups 60
Figure 3.14 Provider views on TtW’s flexibility in meeting participant needs 61
Figure 3.15 Provider views on TtW’s flexibility in meeting participant and employer
circumstances 62
Figure 3.16 Service approaches reported by TtW providers 63
Figure 4.1 Timeline of contracts approved during the implementation phase 68
Figure 4.2 Use of Annual Funded Places per provider contract, by days from contract start 69
Figure 4.3 Utilisation rates of Group Three Annual Funded Places, 31 July 2016 and
31 January 2017 70
Figure 4.4 Median days from referral to commencement, by month from TtW provider
contract start 72
Figure 4.5 Days from referral to commencement of Group Two participants 73
Figure 4.6 Cumulative percentage of commencements within 30 days, by days from referral 74
Transition to Work Interim Evaluation Report
11
Figure 4.7 Number of activities per participant in the first 180 days* from commencement 78
Figure 4.8 Timing of first recorded participant activity 79
Figure 4.9 Participation in different types* of activities, comparing TtW and the jobactive
comparison group 81
Figure 4.10 TtW provider views on the most important job placement strategies 82
Figure 4.11 Percentage of referred participants who did not commence, by month from
referral, comparing TtW and jobactive 83
Figure 4.12 Percentage of commenced participants who exited, by month from
commencement, comparing TtW and jobactive 84
Figure 4.13 Reasons for non-commencement in the first three months from referral,
comparing TtW and the jobactive comparison group 85
Figure 4.14 Reasons for exit during the first six months, comparing TtW and the jobactive
comparison group who commenced in services 86
Figure 4.15 Percentage of exits and breakdown of main reasons, by month from
commencement — TtW 88
Figure 4.16 Percentage of exits and breakdown of main reasons, by month from
commencement — jobactive 89
Figure 5.1 Outcome performance, by contract start month and target quarter 93
Figure 5.2 Core outcome categories 95
Figure 5.3 Percentages of education and training placements that qualified for an education
outcome, by activity type 98
Figure 5.4 Change in percentage of commenced participants who reported employment
income to DHS, by month from referral*, comparing TtW and jobactive 101
Figure 5.5 Change in labour market attachment rates, by month from referral, comparing
TtW and jobactive commenced participants 102
Figure 5.6 Change in positive outcome rates, by month from referral, comparing TtW
and jobactive 103
Figure A. 1 Employment regions 109
Figure C. 1 Implementation, data capture and analysis timeline 115
Figure E. 1 Education activity types 118
Figure H. 1 Changes in income support, by months in employment services for commenced
placements* 124
Figure H. 2 Average earnings for participants commenced within 30 days of referral who
reported employment income to DHS, by month 126
Figure H. 3 Median base rate paid per month for participants commenced within 30 days
of referral 127

Transition to Work Interim Evaluation Report
12
List of short forms
Short form In full
ABS Australian Bureau of Statistics
ALMPs Active Labour Market Policies or Programs
department Department of Employment, Skills, Small and Family Business
DHS Services Australia (previously Department of Human Services)
ESAt Employment Services Assessment
ESS Employment Services System
Eurofound European Foundation for the Improvement of Living and Working Conditions
JSCI Job Seeker Classification Instrument
KPI key performance indicator
OECD Organisation for Economic Co-operation and Development
RED Research and Evaluation Database
SDP Service Delivery Plan
TtW Transition to Work
TtW Deed Transition to Work Deed 2016–2020

Transition to Work Interim Evaluation Report
13
Glossary
Term Description
Annual Funded Places
TtW providers are contracted for an agreed number of funded places per annum per employment region, with each funded place expected to allow participation for two young people on average per annum.
commence(ment)
In this report, to commence(ment) is to start actively engaging with employment services. A participant commences with TtW when they attend their first appointment with the TtW provider. Then there is a 28-day ‘Initial Phase’ when the provider must explain their services and make sure the participant understands the participation requirement and consequences of not participating appropriately.
A participant commences with jobactive when they attend their first appointment with the jobactive provider. The provider assesses the job seeker’s circumstances, explains to the job seeker their obligations under social security law and, together with the job seeker, develops and agrees on a Job Plan.
commencement rate
The commencement rate is the percentage of people referred to TtW who attended an initial appointment with a TtW provider.
contract
In this report, a contract is an agreement between a provider and the Australian Government to deliver TtW services in a particular Employment Region. Some providers have more than one contract because they deliver TtW in more than one region.
Employment Fund
The Employment Fund General Account (Employment Fund) is a flexible pool of funds available to jobactive providers. Each jobactive provider receives credits which they can use to claim reimbursement for goods and services that genuinely support and assist job seekers to gain the tools, skills and experience they need to get and keep a job. TtW does not provide Employment Fund access, as providers are expected to use up-front payments to support young people to get and keep a job.
ESS Web
This is the Employment Services System secure web interface where providers enter servicing information about participant transactions that stimulate payments consistent with the contractual arrangement with the department.
exit
In this report, an exit is when a participant is exited from the caseload of a TtW or jobactive provider.
Most exits are automatic (effective exit) for reasons such as stopping or changing income support payments, changing to another employment service, death or imprisonment. Providers can initiate a manual exit (provider exit). They must record reasons for exits.
Transition to Work Interim Evaluation Report
14
Term Description
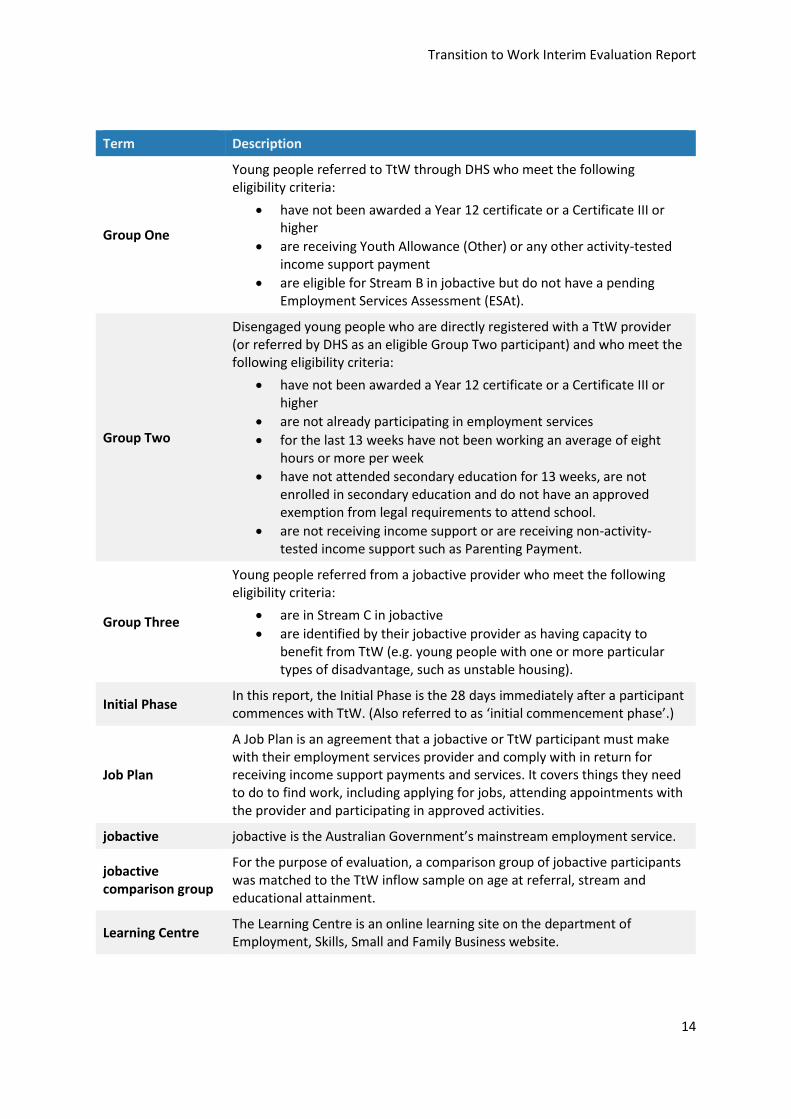
Group One
Young people referred to TtW through DHS who meet the following eligibility criteria:
have not been awarded a Year 12 certificate or a Certificate III or higher
are receiving Youth Allowance (Other) or any other activity-tested income support payment
are eligible for Stream B in jobactive but do not have a pending Employment Services Assessment (ESAt).
Group Two
Disengaged young people who are directly registered with a TtW provider (or referred by DHS as an eligible Group Two participant) and who meet the following eligibility criteria:
have not been awarded a Year 12 certificate or a Certificate III or higher
are not already participating in employment services
for the last 13 weeks have not been working an average of eight hours or more per week
have not attended secondary education for 13 weeks, are not enrolled in secondary education and do not have an approved exemption from legal requirements to attend school.
are not receiving income support or are receiving non-activity-tested income support such as Parenting Payment.
Group Three
Young people referred from a jobactive provider who meet the following eligibility criteria:
are in Stream C in jobactive
are identified by their jobactive provider as having capacity to benefit from TtW (e.g. young people with one or more particular types of disadvantage, such as unstable housing).
Initial Phase In this report, the Initial Phase is the 28 days immediately after a participant commences with TtW. (Also referred to as ‘initial commencement phase’.)
Job Plan
A Job Plan is an agreement that a jobactive or TtW participant must make with their employment services provider and comply with in return for receiving income support payments and services. It covers things they need to do to find work, including applying for jobs, attending appointments with the provider and participating in approved activities.
jobactive jobactive is the Australian Government’s mainstream employment service.
jobactive comparison group
For the purpose of evaluation, a comparison group of jobactive participants was matched to the TtW inflow sample on age at referral, stream and educational attainment.
Learning Centre The Learning Centre is an online learning site on the department of Employment, Skills, Small and Family Business website.
Transition to Work Interim Evaluation Report
15
Term Description
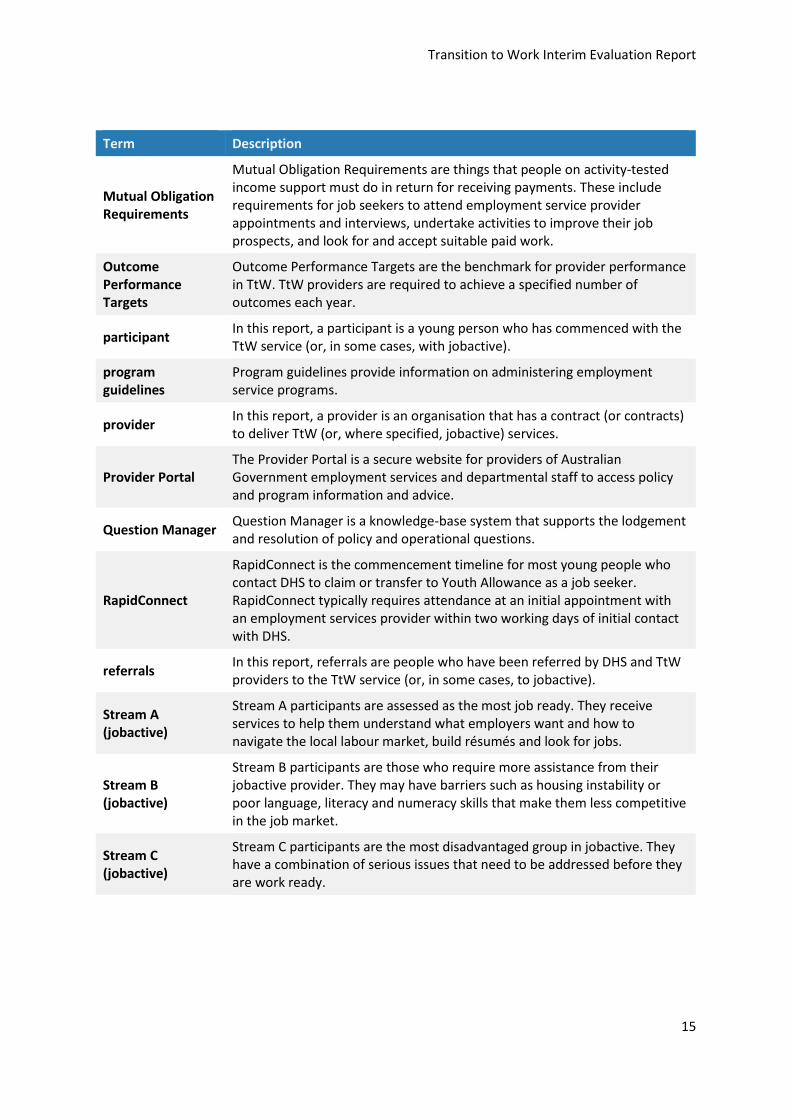
Mutual Obligation Requirements
Mutual Obligation Requirements are things that people on activity-tested income support must do in return for receiving payments. These include requirements for job seekers to attend employment service provider appointments and interviews, undertake activities to improve their job prospects, and look for and accept suitable paid work.
Outcome Performance Targets
Outcome Performance Targets are the benchmark for provider performance in TtW. TtW providers are required to achieve a specified number of outcomes each year.
participant In this report, a participant is a young person who has commenced with the TtW service (or, in some cases, with jobactive).
program guidelines
Program guidelines provide information on administering employment service programs.
provider In this report, a provider is an organisation that has a contract (or contracts) to deliver TtW (or, where specified, jobactive) services.
Provider Portal The Provider Portal is a secure website for providers of Australian Government employment services and departmental staff to access policy and program information and advice.
Question Manager Question Manager is a knowledge-base system that supports the lodgement and resolution of policy and operational questions.
RapidConnect
RapidConnect is the commencement timeline for most young people who contact DHS to claim or transfer to Youth Allowance as a job seeker. RapidConnect typically requires attendance at an initial appointment with an employment services provider within two working days of initial contact with DHS.
referrals In this report, referrals are people who have been referred by DHS and TtW providers to the TtW service (or, in some cases, to jobactive).
Stream A (jobactive)
Stream A participants are assessed as the most job ready. They receive services to help them understand what employers want and how to navigate the local labour market, build résumés and look for jobs.
Stream B (jobactive)
Stream B participants are those who require more assistance from their jobactive provider. They may have barriers such as housing instability or poor language, literacy and numeracy skills that make them less competitive in the job market.
Stream C (jobactive)
Stream C participants are the most disadvantaged group in jobactive. They have a combination of serious issues that need to be addressed before they are work ready.

Transition to Work Interim Evaluation Report
16
Term Description
study period
Participants in the matched TtW and jobactive inflows who had started in the services by 31 August 2016 were followed for 180 days from their commencement date. Unless otherwise indicated, this was the study period for this evaluation. The inflow population includes young people referred to the service in the period between 1 February 2016 and 31 July 2016. Caseload refers to the number of participants in services and information about this group captured at a point in time.
TtW Deed This is the legal agreement under which a provider is contracted to deliver TtW services.
utilisation rate In this report, the utilisation rate is the percentage of a TtW provider’s Annual Funded Places that are being used by a TtW participant.
Transition to Work Interim Evaluation Report
17
Executive summary
Background
In the 2015-16 Commonwealth Budget, the Australian Government announced a $322 million Youth
Employment Strategy under the Jobs and Small Business Package. The Transition to Work (TtW)
service forms an integral component of the Youth Employment Strategy and was rolled out between
February 2016 and May 2016. The TtW service helps young people aged 15 to 21 to get into work or
education.
TtW aims to increase the work-readiness of early school leavers who are finding it difficult to move
from education into work by providing intensive pre-employment support to increase the
work-readiness of young people and help them into work (including apprenticeships and
traineeships) or education. The service also has a strong focus on helping young people to
understand and to develop the skills, attitudes and behaviours employers expect.
The Department of Employment, Skills, Small and Family Business (the department) has overall
responsibility for TtW, through providers contracted by the department to deliver the service. TtW
operates separately from the Government’s mainstream employment service, jobactive, and other
targeted employment services such as Disability Employment Services and the Community
Development Programme. The department also administers other services, such as Empowering
YOUth Initiatives and ParentsNext, which help participants to prepare for employment.
The major difference between TtW and jobactive is that TtW is a 12-month service that specifically
targets early school leavers, aged between 15 and 21, who require intensive support to address the
barriers they face to entering and maintaining employment. The department requires TtW providers
to have experience in working with disengaged youth.
The TtW payment model supports intensive servicing and provides strong incentives for providers to
achieve set performance targets. TtW providers receive a significant up-front payment of $5300 per
funded place each year to enable them to support participants in achieving employment, engaging in
education and increasing work-readiness. TtW providers receive bonus payments for achieving
outcomes above their performance targets.
TtW providers working with participants have the autonomy to determine the appropriate mix of
individual, group and self-directed activities for each participant who must meet a participation
requirement of 25 hours each week. These activities range from paid employment to education and
training courses and other interventions to address non-vocational barriers.

Transition to Work Interim Evaluation Report
18
TtW targets three groups of young people who are considered most at risk of long-term
unemployment. While the eligibility requirements vary between the three groups, the overarching
eligibility requirements to participate in TtW are for a young person to:
be aged 15-21 years
be an Australian citizen or the holder of a
permanent visa or
New Zealand Special Category Visa or
nominated visa (including Temporary Visa or Safe Haven Visa)
live in one of the employment regions in which TtW providers are contracted to deliver services.
In addition to the core TtW eligibility requirements, a young person must be:
an early school leaver when applying for Youth Allowance (Other) — Group One or
not engaged in employment or education for three months (or six months for those with
Year 12) and not eligible for an income support payment — Group Two or
participating in Stream C of jobactive and suitable for TtW — Group Three.
In addition to the original allocation of $322 million, the Government announced a Youth
Employment Package in the 2016–17 Budget that includes Youth Jobs PaTH (Prepare–Trial–Hire) and
measures to encourage young people to start a business and create their own job. From 1 July 2018
TtW became a demand driven program with uncapped funding (announced in the 2018–19 Budget)
following the expansion of the eligibility criteria from 1 January 2018 to all Indigenous youth aged
21 years or under, including those who have completed high school.
The Youth Employment Package and other changes to TtW are outside the scope of this analysis and
will be separately evaluated.
Evaluation of the Transition to Work service
The evaluation of TtW has two stages: a formative stage and a summative stage. The formative stage
focuses on the phased rollout and early referrals up to 31 July 2016 (the inflow period). The
summative stage will be an in-depth assessment of the overall performance of referrals to TtW
covering the phased rollout from February to May 2016 up to the end of March 2017.
This interim evaluation report outlines evaluation activities undertaken during the formative stage,
with findings primarily focused on:
the early implementation and operation of the TtW service
engagement and retention of participants in TtW
early education, employment and labour market attachment outcomes.

Transition to Work Interim Evaluation Report
19
Methods and analysis
The TtW evaluation team adopted a mixed methods approach. It involved collecting and analysing
quantitative and qualitative data. Data sources were:
income support administrative data from the Department of Human Services (DHS) captured in
the Department of Employment, Skills, Small and Family Business’s Research and Evaluation
Dataset (RED)
employment services administrative data from the department
provider survey data from a census of all TtW providers collected by the department during
October and November 2016
qualitative data reported by the Social Research Centre from commissioned research with
stakeholders.
Statistical methods used to analyse quantitative data include descriptive statistics and logistic
regression modelling. The study populations were matched inflow populations of young people
referred to TtW and jobactive between 1 February 2016 and 31 July 2016. The TtW inflow sample of
20,684 participants was compared with a matched group of jobactive job seekers.
Main findings
Early implementation and operation of the TtW service
The qualitative research found that, with the rapid rollout of TtW, a number of providers reported
that it was challenging to find sites and train staff by their contract start date. Providers also
reported problems with initial referrals, particularly with participant contact details and the
suitability for TtW of early transfers from jobactive. Providers, DHS staff and employers all reported
that low initial awareness of TtW had contributed to early issues with the service.
A survey of providers by the department during October to November 2016 found that, while start-
up issues were challenging, most had been largely resolved. Providers also reported that the service
and support provided by the department during the rollout and early stages of TtW were of a high
quality.
Most providers and participants reported that they were satisfied with the flexibility of the TtW
service that enabled a strong focus on participant engagement in activities and more time with
individual participants to increase their work-readiness and chances of finding a job. Providers also
regarded the TtW funding structure as sustainable, and the key performance indicators (KPIs) and
Outcome Performance Targets as achievable.
Engagement and retention of participants in TtW
Utilisation of TtW places (that is Occupancy of Annual Funded Places) increased over time, with the
TtW caseload (pending, commenced and suspended participants) at 78 per cent of Annual Funded
Places at the end of July 2016 and rising to 117 per cent six months later. The median time to
commence a participant fell during the study period, from 16 days in the provider’s first month in

Transition to Work Interim Evaluation Report
20
TtW to four days by the provider’s sixth month. Analysis of referrals to both TtW and jobactive in the
matched inflow population showed TtW providers achieved a higher commencement rate during the
first 30 days after the participant’s referral to them (93 per cent, excluding Group Three transfers
from jobactive) than jobactive providers (83 per cent).
The attendance rate at the first initial appointment was higher for TtW participants (77 per cent)
than for young people in the jobactive comparison group (69 per cent), while the attendance at
contact appointments was slightly lower (60 per cent for TtW, compared with 63 per cent for the
jobactive comparison group). It is worth noting that there is a different compliance arrangement
relating to individual appointments and attendance at activities in TtW. TtW does not have sanctions
of suspending/cancelling income support payments in relation to non-attendance at appointments
or activities (as in jobactive). Instead, TtW providers assess the participant’s overall participation and
exit them if they do not meet participation requirements.
During the early months, providers reported that they had difficulties in attracting disengaged young
people (Group Two) but, once they were engaged, these participants had a high level of
commitment to, and retention in, the TtW service. Providers and peak bodies both noted that
recruitment of this group improved over time, attributing this to innovative strategies and word of
mouth. Referrals of suitable young people from jobactive Stream C were well below the targeted
10 per cent of Annual Funded Places during the first 12 months of operation.
TtW participants were required to undertake 25 hours per week of pre-employment activities, which
included placements in a wider range of education and training activities than young people in
jobactive. TtW participants typically undertook more pre-employment activities reflecting the
employment preparation focus of the program. By contrast, the jobactive focus on employment
outcomes meant jobactive participants, who were early school leavers, were more likely to receive a
range of work-related services and support from their providers. This included job search, part-time
or casual employment, participation in other government programs, and certain education and
training activities depending on their needs and job seeker classification. As a consequence, the
proportion of young people participating in activities was higher in TtW (46 per cent, compared to
19 per cent for the jobactive comparison group) over their first six months in the service. For
participants who were undertaking activities, TtW participants were also placed in activities more
quickly (55 per cent in the first 30 days after referral, compared with 46 per cent for the jobactive
comparison group).
The commencement processes between TtW and jobactive are similar, but the non-commencement
patterns for referrals are different. TtW providers generally recorded young people as a non-
commencement from the second month after referral following numerous attempts to engage
them. The main recorded reason for non-commencement was ‘young person was not contactable’.
Non-commencements from the comparison group in jobactive during the first month were more
likely due to many reasons such as failing to attend an initial appointment with their providers,
having their income support claims cancelled or withdrawn, or after finding a job. Therefore,
recorded reasons in jobactive tend to be ‘referral to other service’ or ‘no longer fully eligible’.

Transition to Work Interim Evaluation Report
21
Early education, employment and labour market attachment outcomes
Approved outcomes in TtW include education, employment or a combination of education and
employment outcomes, depending on the participant’s income status and Mutual Obligation
Requirements. At the end of March 2017, employment outcomes achieved through TtW comprised
79 per cent of all TtW outcomes, and the March 2017 quarterly Outcome Performance Targets were
met for 50 per cent of all provider contracts.
The high contribution of employment outcomes probably reflects the provider focus, where
possible, to get young people in a job to achieve an employment outcome. Qualitative research
found placing young people in education in order to obtain an education outcome was considered to
be the secondary focus for providers after all avenues of employment were already exhausted. A
Certificate III was the main type of study undertaken by TtW participants qualifying for an education
outcome.
Young people were less likely to report earnings early in their TtW participation period compared to
the matched sample of jobactive participants. However, similar proportions of participants reported
earnings by the sixth month of service, with the rate of increase slightly faster for TtW.
The labour market attachment rate, which measures engagement in some paid employment, was
higher over the study period for TtW participants (33 per cent) than for the jobactive comparison
group participants (28 per cent). Employment indicators used for this measure included earnings
reported to DHS, reduction in income support payment, participation in casual or part-time
employment, and confirmed job placements.
The positive outcome measure for this report which includes study in education courses qualifying
for an TtW outcome paymenti, as well as the employment indicators, was higher for TtW
participants (42 per cent) than for the jobactive comparison group participants (33 per cent). This
result is consistent with a higher proportion of TtW participants placed in these education courses
compared with the matched cohort of young people in jobactive.
Conclusion
Overall, TtW is an appropriate and well-received service for young people. It delivers high-quality
services to the identified target groups in a flexible and effective manner. Despite some initial issues
with the implementation of TtW, the service’s operational processes appear sound. The strong
evidence-based design underpinning TtW, together with funding arrangements that support
intensive servicing presumably contributed to the positive outcomes achieved over the six month
follow up period from commencement in services.
i Other measures of positive outcomes compiled by the department have broader criteria for education course inclusion and are not strictly comparable.

Transition to Work Interim Evaluation Report
22
Providers and participants suggested a number of changes to expand the eligibility for and
participation in the TtW service. These included:
extending the service delivery time beyond 12 months
extending the upper age limit from 21 to 25 years
increasing compliance requirements for participants during the early weeks of engagement
reducing the waiting times for disengaged youth (Group Two)
increasing incentives to encourage more Stream C referrals from jobactive (Group Three).
Providers also recommended that the department could improve the delivery of TtW by:
offering providers more training on the use of the department’s IT system
providing more regular feedback to providers on their performance
encouraging greater interaction between the department, providers and DHS.
The next stage of the evaluation will provide an assessment of the overall performance of the TtW
service, addressing questions of service quality, effectiveness, efficiency and good practice. With
more data available for analysis covering the full 12 months of services offered to eligible young
people, the final (stage two) report will offer more robust assessments of outcomes, including
improvement of participant work-readiness, cost and time effectiveness, and service quality. The
final report will also assess the impact of specific service elements on employment and education
outcomes.

Transition to Work Interim Evaluation Report
23
1 Introduction
In most developed countries the transition period from education to employment starts when young
people become eligible for employment (generally at 15 years) and ends when they have finished
education (usually around 24 years).1 During this transition, young people experience rapid
biological, psychological and physical changes, as well as changes in social and economic
circumstances as they begin to take on the responsibilities of adulthood.2
Young people who do not make this transition successfully are more likely to face longer periods of
unemployment or underemployment. They are also more likely to end up with low-paying and low-
skilled jobs, with limited prospects for progression to more highly skilled work.3
Creating secure pathways from education to work requires strong partnerships between young
people and their parents, schools, universities, training providers, employers and communities.
These partnerships can help young people find their first job, or at least work experience that future
employers will recognise and value.
Before the onset of the global financial crisis in 2008, Australian young people faced a low risk of
unemployment, thanks to a buoyant labour market with strong job creation from 2000. The
Organisation for Economic Co-operation and Development (OECD)4 found that more than
69.8 per cent of young people in Australia had a job in 2008, the highest level since 1978.
The high youth employment rate and relatively small pool of long-term unemployed reflected the
high proportion of young people in Australia combining part-time work with study. This provided a
protective barrier for Australian youth from the high unemployment rates disproportionately felt by
young people across Europe and other OECD countries as labour market conditions worsened in the
lead-up to the global financial crisis.
While Australia also faced a period of rising youth unemployment following the onset of the global
financial crisis, with many young people finding it difficult to break into employment, the impact was
smaller than in other countries. In September 2008, Australia’s youth unemployment rate was less
than 9 per cent. In the September quarter of 2010 it was 11 per cent, compared with 21.1 per cent
for Europe and 18.5 per cent for the OECD. It rose to a high of 15.5 per cent in January 2015, still
well below the youth unemployment rates experienced in Europe and the OECD. In June 2017 the
youth unemployment rate in Australia remained high (12.4 per cent) compared with the 2008 and
2010 rates in Australia.5
1.1 The study to work transition — government responses internationally
Comparison of government policies around the world reveals that interventions to help young
people transition from school to employment generally fall into two categories. The first involves
‘demand side’ responses to increase the number of available jobs through stimulating economic
growth and ensuring that regulation fosters youth participation in the labour market. The second is
‘supply side’ responses to ensure that young people have the skills and capabilities to fill these jobs.

Transition to Work Interim Evaluation Report
24
Local labour market conditions and job vacancies are critical factors contributing to the youth
employment rate. Consequently, policies that aim to stimulate job growth are one response to the
issue of youth unemployment.6 While it is important to note that labour market conditions may
inform policy responses, analysis of how governments can best stimulate economic growth and
whether this will lead to job creation is outside the scope of this report. The following sections
review a small range of ‘supply side’ interventions in Australia and other countries.
1.1.1 Types of youth employment programs around the world
Ensuring that young people are work ready
Enabling young people to graduate from the education system with job-relevant skills7 is a persistent
challenge worldwide. In a study involving nine countries (Brazil, Germany, India, Mexico, Morocco,
Saudi Arabia, Turkey, the UK and the USA), Mourshed and colleagues (2013) found that 43 per cent
of employers surveyed could not find enough skilled entry-level workers.8 The study concluded that
the journey from education to employment is complicated, with many different routes, resulting in
too many young people getting lost along the way.
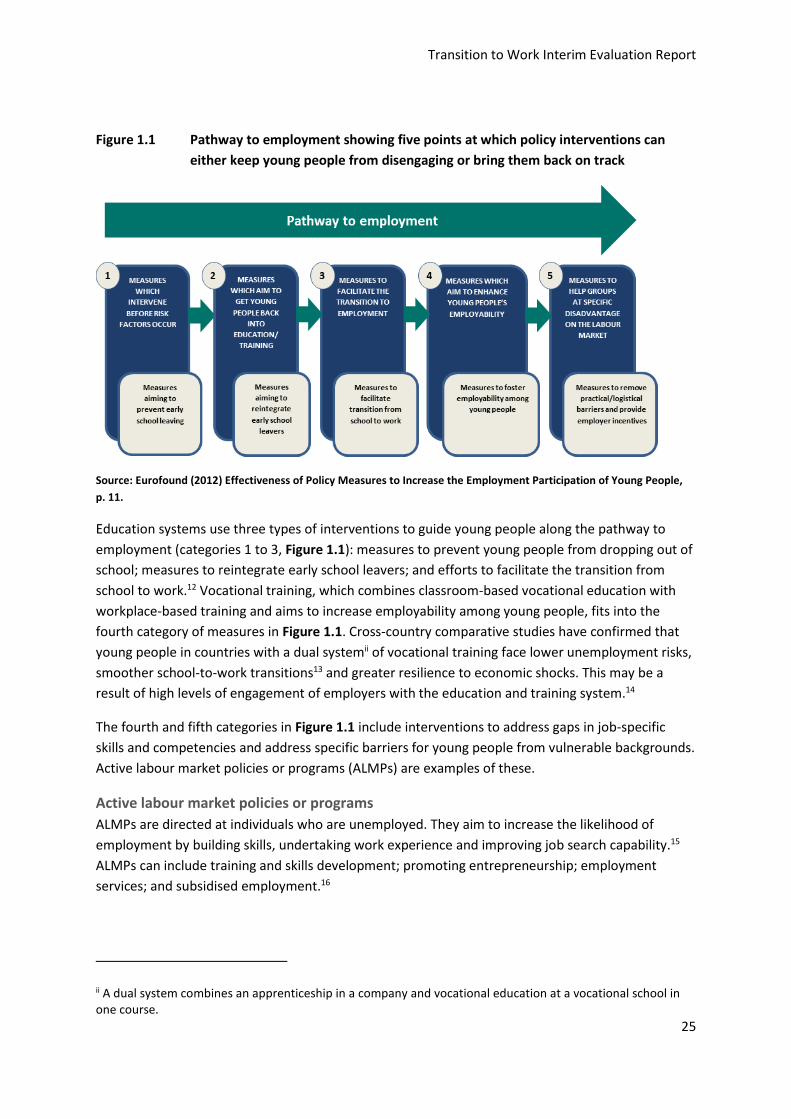
A review by Eurofound (2012) of 25 policies tackling youth unemployment across nine European
countries (including the UK) identified five categories of policy interventions a young person may
engage with on the road to employment (Figure 1.1). The review found that preventing participants
from ‘dropping out’ of education and training was generally more cost-effective than re-engaging
them.9 10 Measures that successfully help young people who had completed their education to
transition to employment were generally found not to work for young people who have dropped out
of education and are experiencing complex problems.11
Transition to Work Interim Evaluation Report
25
Figure 1.1 Pathway to employment showing five points at which policy interventions can
either keep young people from disengaging or bring them back on track
Source: Eurofound (2012) Effectiveness of Policy Measures to Increase the Employment Participation of Young People,
p. 11.
Education systems use three types of interventions to guide young people along the pathway to
employment (categories 1 to 3, Figure 1.1): measures to prevent young people from dropping out of
school; measures to reintegrate early school leavers; and efforts to facilitate the transition from
school to work.12 Vocational training, which combines classroom-based vocational education with
workplace-based training and aims to increase employability among young people, fits into the
fourth category of measures in Figure 1.1. Cross-country comparative studies have confirmed that
young people in countries with a dual systemii of vocational training face lower unemployment risks,
smoother school-to-work transitions13 and greater resilience to economic shocks. This may be a
result of high levels of engagement of employers with the education and training system.14
The fourth and fifth categories in Figure 1.1 include interventions to address gaps in job-specific
skills and competencies and address specific barriers for young people from vulnerable backgrounds.
Active labour market policies or programs (ALMPs) are examples of these.
Active labour market policies or programs
ALMPs are directed at individuals who are unemployed. They aim to increase the likelihood of
employment by building skills, undertaking work experience and improving job search capability.15
ALMPs can include training and skills development; promoting entrepreneurship; employment
services; and subsidised employment.16
ii A dual system combines an apprenticeship in a company and vocational education at a vocational school in one course.
Transition to Work Interim Evaluation Report
26
ALMPs operate on the assumption that jobs are available and that, with the appropriate support,
people who are unemployed can take them up. Consequently, the state of the labour market and
economy can influence which types of ALMPs are likely to be the most appropriate.17 In periods of
economic downturn when there are fewer jobs, ALMPs are still useful in helping job seekers to be
‘job ready’ so that when job opportunities arise they can fill those vacancies.18
An important consideration in the design of appropriate ALMPs is that young people are not a
homogeneous group.19 Adaptable programs that focus on specific target groups or have innovative
ways of assisting particular individuals have been successful for young people at various levels of
labour market readiness.20 21
1.1.2 Characteristics of successful youth employment programs
There is evidence that particular program characteristics are likely to produce specific successful
outcomes. Evaluations of other employment programs have highlighted the importance of
integrating youth employment initiatives with education policies that include both measures to
prevent early school leaving and measures to re-integrate those who do leave school early back into
education or training.22 23 Others have identified appropriate targeting of subgroups as
important.24 25
Many studies point to the need for holistic services for young people to address complex barriers to
employment.26 27 28 29 Intensive interventions may also be more effective than diffuse programs.30 31
Building a young person’s perceptions of their capabilities through mentoring has been found to be
an effective strategy, just as broadening their horizons and perceptions of possible career
pathways32 can increase their ambition and motivation to pursue study or training.33 34 35 Exposure to
a work environment during apprenticeships and work experience can also build valuable skills for
future employment.36 37
1.2 Transition to Work service
The TtW service incorporates a number of the features of the successful youth employment
programs described in Section 1.1.2. It is a targeted 12-month intensive initiative that can include
pre-employment activities hosted by the provider, education and training courses, activities to
address non-vocational barriers and appointments. The service providers operate in one or more
employment regions and are either for profit or not-for-profit organisations with links to educational
organisations and local employment markets. The funding model allows providers to work with
individual participants in ways that are most helpful to them, creating a service that is tailored to
each participant’s needs. Unlike jobactive, TtW participants are not subject to a suspension of their
income support payment for failure to attend contact appointments with their provider or activities.
TtW operates separately of jobactive and targeted employment services such as Disability
Employment Services and the Community Development Programme.

Transition to Work Interim Evaluation Report
27
1.2.1 TtW was implemented progressively from February 2016 to May 2016
The TtW service was rolled out in four phases in 51 employment regions from February 2016 to
May 2016. TtW provider contracts are in place until 26 June 2020, with an option to extend for a
further two years to 24 June 2022. A map of employment regions is at Appendix A.
1.2.2 TtW targets three main groups of young people
The TtW service targets three groups of young people aged 15 to 21 years considered most at risk of
disengagement or disadvantage in moving to work. The eligibility requirements for each of the three
groups vary. The overarching eligibility requirements are for a young person to:
be aged 15-21 years on commencement in the service
be an Australian citizen or the holder of a
permanent visa or
New Zealand Special Category Visa (protected or non-protected) or
nominated visa (including Temporary Protection Visa or Safe Haven Visa)
live in an employment region where the TtW service is delivered.
In addition to the core TtW eligibility requirements, young people are referred to TtW through the
different pathways identified in Box 1.1, reflecting the different eligibility circumstances of each of
the three target groups.
Box 1.1 Transition to Work target groups before 1 January 2018:iii eligibility, referral process and
caseload profile
Group One — referrals from the Department of Human Services
These are young people who:
• have not been awarded a Year 12 certificate or a Certificate III or higher
• are receiving Youth Allowance (Other) or any other activity-tested income support payment
• are eligible for Stream B in jobactive but do not have a pending employment services
assessment (ESAt).
Referral process
• DHS (Centrelink) refers eligible young people to their local TtW service when they first claim
income support. They are expected to start with TtW within two business days from referral.
• Participants in this group may opt out and elect to participate in jobactive instead.
• TtW providers are expected to attempt to engage young people in this group within four weeks
from referral, before exiting them for referring them back to jobactive if they are uncontactable
or unsuitable for TtW.
iii Effective 1 January 2018, eligibility requirements were expanded to include Aboriginal or Torres Strait Islander young people irrespective of whether they have completed Year 12 or a Certificate III or higher.

Transition to Work Interim Evaluation Report
28
Caseload
• Participants in this group have priority access to TtW and were projected to make up
approximately 70 per cent of Annual Funded Places.
Group Two — disengaged young people
These are young people who:
• have not been awarded a Year 12 certificate or a Certificate III or higher
• are not already participating in employment services
• for the last 13 weeks have not been working an average of eight hours or more per week
• have not attended secondary education for 13 weeks, are not enrolled in secondary education
and do not have an approved exemption from legal requirements to attend school
• are not receiving income support or are receiving non-activity-tested income support such as
Parenting Payment.
Referral process
• Eligible young people can directly register with a provider.
• Providers are expected to undertake activities to attract disengaged young people to the service
and encourage them to participate in it fully.
Caseload
• Participants in this group were projected to make up around 20 per cent of Annual Funded
Places.
Group Three — referrals from a jobactive provider
These are young people who:
• are in Stream C in jobactive
• are identified by their jobactive provider as having capacity to benefit from TtW (e.g. young
people with one or more particular types of disadvantage, such as unstable housing).
Referral process
• jobactive providers can directly refer young people in this category to TtW providers.
Caseload
Participation in this group is subject to a cap on places, which is set at 10 per cent of the total Annual
Funded Places allocated (except during the initial commencement stage).
Providers determine the appropriate mix of individual, group and self-directed activities for a
participant to meet a 25 hours per week participation requirement. This can include employment,
activities hosted by the provider, education and training courses, activities to address non-vocational
barriers, and appointments.
1.2.3 The TtW service process
For a young person needing support to make the transition from education to work, the
employment services process can seem complex. TtW providers are expected to provide more
intensive support than is available through existing employment services to help young people

Transition to Work Interim Evaluation Report
29
develop the attitudes and behaviours sought by employers. The TtW service pathway for Group One
is outlined in Figure 1.2.
Figure 1.2 Transition to Work pathway for Group One
Simple flow chart describing the stages of the TtW service for Group One participants (DHS referrals) This figure describes six stages of participation, in chronological order from 1 to 6. 1. Registers for Youth Allowance (Other) with DHS — meets eligibility criteria for TtW and is assessed in Job Seeker Classification Instrument as Stream B (no ESAt pending) 2. Referred by DHS to employment services provider (referral) — referred to TtW if eligible but may choose referral to jobactive 3. Placed with TtW provider (placement) — TtW employment services provider has a contract with the Department and at the initial appointment assesses the young person, explains Mutual Obligation Requirements and develops a Job Plan 4. Intensive pre-employment support to help with work-readiness or education — those who choose jobactive instead must meet early school leaver participation requirements (compulsory job search of study for Year 12 equivalency) 5. Can change service provider site but stay with the same provider (new placement) or change provider (new referral) — young person may move to more assessable site or change address 6. Can stay in TtW for 12 months; exit TtW before 12 months; be referred back to jobactive after 12 months unless tracking to a TtW outcome — reasons for exit include finding a job, moving to a non-activity-tested income support payment, entering full-time study or choosing to exit
The commencement processes for TtW and jobactive are similar.
For TtW, a participant has commenced once they have attended their initial appointment. In the first
four weeks of a participant starting with TtW, the provider describes their services; explains that
participating in TtW fully meets any applicable Mutual Obligation Requirements (i.e. for Group One
and Group Three participants) and explains the consequences of not participating appropriately.
Providers work with TtW participantsiv to develop an individual Job Plan detailing the activities they
will participate in for 25 hours per week for up to 12 months.
Similarly, a job seeker also commences in jobactive after attending an initial appointment. The
provider explains the services, identifies the job seeker’s strengths and any issues they have in
finding employment, assesses the job seeker’s circumstances and explains their Mutual Obligation
Requirements.
For early school leavers Mutual Obligation Requirements include:
entering into a job plan which sets out the activities and appointments the job seeker will be
undertaking
attending all DHS and provider appointments
iv Including Group Two participants who are not receiving an income support payment.

Transition to Work Interim Evaluation Report
30
acting on referrals to jobs from their provider and attending job interviews offered by employers
undertaking job search (generally 20 job searches per month)
meeting their annual activity requirement by participating in activities including full-time or part-
time education and training for up to 25 hours per week
participating in any activity at any time that is relevant to their personal circumstances and will
help the job seeker to improve their employment prospects.
If the job seeker does not comply with these requirements their income support payment may be
suspended, reduced and/or cancelled.
In the early implementation of the TtW service the department through its IT systems referred a
number of participants from jobactive to a TtW provider. This was the initial start-up caseload used
to enable providers to start their service rapidly.
1.2.4 The TtW funding model
The funding model for TtW providers includes an up-front payment, a quarterly Outcome
Performance Target and additional outcome payments to drive high performance. The three main
elements are:
an up-front payment of $5300 per annum for each funded place, paid in quarterly instalments of
$1325
a bonus outcome payment of $3500 for every outcome above a quarterly Outcome Performance
Target, paid as outcomes are achieved
a sustainability outcome payment of $3500 for every 26-week employment and hybrid outcome,
paid as outcomes are achieved, regardless of whether the quarterly Outcome Performance
Target was met.
The relatively generous up-front payment is designed to allow providers to fund services or activities
that will help a participant gain employment, participate in education and increase work-readiness.
Wage subsidies (up to $10,000v) are also available to employers who have hired a TtW participant in
a sustainable ongoing position with an average of 20 hours per week over at least six months, to
help cover the costs of hiring and training a young person who is eligible for a wage subsidy. These
provide a financial incentive to employers to hire eligible recipients in ongoing jobs by contributing
to the initial costs of hiring a new employee. TtW providers can seek reimbursement from the
department for the following wage subsidies:
Youth Bonus Wage Subsidy
Parents Wage Subsidy
v The Youth Bonus wage subsidy for a TtW participant is up to $10,000 (previously up to $6,500) from 1 January 2017 onwards. From 1 January 2018 eligible Indigenous participants can access up to $10,000 through any of the wage subsidies.

Transition to Work Interim Evaluation Report
31
Long Term Unemployed Wage Subsidy
Indigenous Wage Subsidy.
The TtW funding model differs from other employment services funding models, such as jobactive.
jobactive provides a six-monthly administration fee and outcome payments as the primary source of
funding. jobactive providers also have access to an Employment Fund allocation, not available to
TtW, for goods and services that genuinely support and assist young people to gain the tools, skills
and experience they need to get and keep a job. TtW providers are expected to purchase these
items out of the much higher up-front payments provided in TtW as well as bonus outcome and
sustainability payments achieved.
1.2.5 The TtW funding model includes up-front payments and 12-week Outcome
Performance Target payments
As a condition of the up-front payment for each funded place (Section 1.2.4), providers must achieve
an agreed number of outcomes. The Outcome Performance Target has been set at 25 per cent
above the average employment and education outcome rates achieved for jobactive in each
employment region. For example, in an employment region where jobactive providers are achieving
100 outcomes on average, a TtW provider with a caseload that is similar in number and
characteristics is expected to achieve 125 outcomes.
To take into account variations in labour market conditions, the annual Outcome Performance
Targets were calculated separately for each of the 51 employment regionsvithe TtW service operates
in. In the first year of the service, these targets were set using three-year average outcome rates
from Job Services Australia and, where available, comparable jobactive data. The first-year
performance targets are lower than those for subsequent years because the allocated annual
Outcome Performance Targets were discounted quarterly over the first year of operation. This was
to make allowance for the expectation that providers would have commenced 75, 85, 90 and 100
per cent of their funded places by the end of each quarter as their caseload increased.
1.2.6 The TtW service focuses on both employment and education outcomes
Providers can claim outcomes for young people who participate in work, education or a combination
of the two, depending on the participant’s income support status and Mutual Obligation
Requirements as presented in the table in Appendix B.
Employment outcomes
A 12-week employment outcome is achieved for participation in 12 cumulative weeks of:
employment confirmed and tracked during a participant’s period of service (this can comprise
multiple job placements and employers) or
unsubsidised (not on income support) self-employment or
an apprenticeship or traineeship (if not claimed as a hybrid outcome).
vi The Norfolk Island employment region has no TtW services operating.

Transition to Work Interim Evaluation Report
32
A 26-week Employment Outcome is achieved by meeting the requirements for a 12-week
employment or 12-week hybrid outcome, then continued employment for 14 consecutive weeks
after the 12-week outcome.
Education outcomes
An education outcome is achieved for attainment of, or 26 consecutive weeks of full-time
participation in:
a Certificate III or higher course (this includes a diploma, advanced diploma, associate degree or
bachelor degree; it does not include university bridging or preparation courses) or
secondary education leading to Year 12 (attainment may only be claimed for completing
Year 12) or
26 consecutive weeks of full-time participation in the Skills for Education and Employment (SEE)
program or Adult Migrant Education Program (AMEP). SEE and AMEP can only track towards a
participation outcome, not an attainment outcome.
Hybrid outcomes
A 12-week hybrid outcome is achieved for 12 consecutive weeks of participation in any combination
of education and employment for no fewer than 25 hours (on average) per week, as long as
placements run concurrently.
A 26-week hybrid outcome is achieved where a participant meets the 12-week hybrid or 12-week
employment outcome requirements, then the hybrid outcome requirements for 14 consecutive
weeks after the 12-week outcome.
1.2.7 Service guarantee, Service Delivery Plans and key performance indicators
The Service Guarantee for Transition to Work sets out the standard of service delivery participants
and employers can expect from a provider. This is complemented by Service Delivery Plans (SDPs)
outlining the agreed suite of services to be delivered by the TtW provider, including highly flexible
strategies that are tailored to the needs of individual participants, employers and other
stakeholders. The SDPs will be reviewed in the second phase of the TtW evaluation.
Outcome Performance Targets are set out in providers’ contracts. Some providers have a single
contract, while others have multiple contracts, and these targets are contract-specific. Providers
receive ‘bonus’ outcomes for every 12-week employment, 12-week hybrid or education outcome
they claim above their quarterly allocated target. The department uses the three key performance
indicators (KPIs) set out in the TtW Deed to assess the effectiveness, efficiency and quality of a
provider’s service delivery. The KPIs are:
KPI 1 (Effectiveness) — the extent to which the provider meets the objectives of TtW.
Measurement is based on:
the number of outcomes (excluding sustainability outcomes) achieved for participants,
relative to the Outcome Performance Target
Transition to Work Interim Evaluation Report
33
from 1 July 2017, the degree of improvement in each participant’s work-readiness from
their start date to their exit date
achieving outcomes that result in participants moving fully off income support payments.
KPI 2 (Efficiency) — Measurement is based on the amount of time between referral and
commencement of participants.
KPI 3 (Quality) — Measurement is based on the department’s assessment of quality and
assurance, including delivery against the Service Guarantee for Transition to Work and the SDPs.
The department reviews service delivery on a continuous basis and undertakes service assurance
activities, including through regular provider meetings. It conducts formal performance reviews
annually from the start of each TtW deed. It also gathers information on each provider’s
performance from a variety of sources, including post-program monitoring surveys.
Indigenous young people and other highly vulnerable groups are a priority for the TtW service. This
is reflected in the change to the TtW eligibility criteria to include all Indigenous youth from January
2018. Providers must have experience working with disengaged and disadvantaged young people, as
well as having strong links with employers, community services and schools in their local community.
Although there are no specific targets for Indigenous and other highly vulnerable participants in
TtW, the department monitors outcomes for these groups. An estimated one-fifth of TtW
participants are Indigenous Australians, although this varies by employment region.
1.2.8 Interactions of TtW with other employment programs
Since TtW began, the Government has introduced the Youth Jobs PaTH program in April 2017. Youth
Jobs PaTH covers three elements: Prepare, Trial and Hirevii to encourage employers to hire young
people by enhancing their employability through targeted training and real work experience
supported by incentives for employers to employ them and support them as they transition to
employment. TtW participants are eligible for the Trial and Hire elements of Youth Jobs PaTH. TtW
participants who are 18 years or older can also undertake work experience job placements under
the National Work Experience Programme (NWEP).viii
vii The Trial element offers a Youth Jobs PaTH internship placement of four to 12 weeks, designed to help young people gain the skills and work experience they need to get and keep a job. The Hire element offers employers incentives such as a Youth Bonus Wage Subsidy of up to $10,000 when they take on a young person. Youth Jobs PaTH will be separately evaluated. viii Through NWEP, employers can trial a TtW participant for up to 25 hours a week over a maximum four-week
period. They may be eligible for a wage subsidy if they offer ongoing employment to the participant after the
placement.
Transition to Work Interim Evaluation Report
34
2 Evaluation of the Transition to Work service
Program evaluation contributes to the Australian Government’s transparency and accountability
agenda, informing policy development and driving continuous improvement and innovation. In the
enhanced Commonwealth performance framework implemented in 2015 through the Public
Governance, Performance and Accountability Act 2013, evidence from evaluations can also be used
to support performance reporting in annual performance statements. To that end, the TtW
evaluation focuses on supporting continuous improvement of the service and assessing how
effectively and efficiently the service is meeting its objectives.
2.1 Evaluation outline
The Transition to Work Evaluation Strategy outlines a two-stage approach to the TtW evaluation.
2.1.1 Stage one
This interim evaluation focuses on the formative evaluation phase of TtW, underpinned by initial
participant and provider views on the service’s design, commencement, implementation and
operational processes, and on the initial stage of participant engagement. It also includes a
preliminary assessment of progress towards defined outcomes, using administrative data.
It covers the inflow period for referrals to TtW from the start of the service in February 2016 until
31 July 2016. It follows participants who commenced by 31 August 2016 for up to six months and
includes quarterly outcome performances reported up to the end of March 2017.
2.1.2 Stage two
Stage two will be conducted once the TtW service has been operating for two years and more
administrative data is available. It will focus on assessing the effectiveness, efficiency and quality of
the service and identifying good practice. This will provide the basis for a final evaluation report.
2.2 Key evaluation questions
Consistent with the TtW Evaluation Strategy, this interim report addresses the following evaluation
questions.
Question 1.1: To what extent do the service implementation and operational processes enable
effective and efficient service delivery?
Areas for investigation include:
implementation planning
phased rollout
operational processes
appropriateness of the service
interactions of key parties.

Transition to Work Interim Evaluation Report
35
Chapter 3 addresses this question.
Question 1.2: How efficiently and effectively does the service engage and retain participants?
Key indicators and areas for investigation are:
number of participant commencements relative to number of Annual Funded Places
characteristics of participants
time between referral and commencement
appointment and activity attendance rates (if available)
drop-out rates (and reasons).
Chapter 4 addresses this question.
Question 1.3: Do early employment and education outcomes indicate participants are benefiting
from TtW?
Key indicators are:
proportion of participants placed in employment or education
number of 12-week outcomes against the set Outcome Performance Targets
proportion of participants leaving income support or reducing their reliance on income support
compared with the proportions of similar cohorts in other employment services.
Chapter 5 addresses this question.
2.3 Methodology
The evaluation adopted a mixed methods approach involving the collection and analysis of
quantitative and qualitative data.
2.3.1 Data sources
The following primary data sources informed the evaluation. This report also draws on Australian
Bureau of Statistics (ABS) and other relevant data.
Quantitative administrative data
Administrative data came from two sources:
the Employment Services System (ESS) databases, which capture participant, provider, employer
and other program-related information
income support information from DHS administrative data captured in the department’s RED.
Descriptive statistics, including category counts and percentages, are reported at a whole-service
level and disaggregated for different groups of interest where feasible. The confidence level for
statistical significance for this report was set at 95 per cent.

Transition to Work Interim Evaluation Report
36
Logistic regression modelling was used where necessary to control for observable participant
characteristics for a more robust estimate of the effects of TtW (details are in Appendix F).
Quantitative survey data
A survey was conducted as a census of all TtW service providers in October and November 2016. The
purpose was to collect providers’ feedback on their experiences of, and perspectives on, the
implementation and the initial operational phase of TtW. All active provider sites delivering TtW
services were invited to participate.
Providers completed surveys for 242 sites from a total survey population of 264 sites. This
represented a response rate of 91.7 per cent. Around 86 per cent of providers delivering TtW
services at the time of the survey responded.
Qualitative data
The department commissioned qualitative research which was conducted in six (of 51) employment
regions between October and December 2016. Within each region, two areas were selected for the
qualitative discussions. The areas were chosen to provide a broad geographical coverage, diverse
population characteristics and a mix of urban and regional locations (details are in Appendix F).
The qualitative research consisted of:
in-depth interviews with
TtW providers
DHS staff
employers who had recently hired TtW participants
peak bodies (Jobs Australia and the National Employment Services Association (NESA))
focus group discussions with TtW participants.
2.3.2 Study populations
The main study population was the inflow population of young people referred to TtW (including the
initial caseload transferred from jobactive) between 1 February 2016 and 31 July 2016. A
comparison sample using case-control matching was constructed from a similar jobactive
population.
The matched inflow populations were constructed from young people referred to TtWix and
jobactive between 1 February 2016 and 31 July 2016. Participants in the matched inflows who had
commenced in the services by 31 August 2016 were followed for 180 days from their
commencement date. Unless otherwise indicated, this was the study period. In addition, two
ix A small number of participants in the TtW inflow population did not have a corresponding match in the jobactive inflow population for age stream and educational qualification and were excluded from the matched sample. These people were retained in the analysis of TtW participants only.

Transition to Work Interim Evaluation Report
37
snapshots taken at 31 July 2016 and 31 January 2017 were used to analyse the TtW caseload at
these points in time. Further information about the sample methodology is in Appendix C.
2.3.3 Profile of the TtW inflow population
In the inflow population, the majority of TtW participants were male (58.2 per cent). Nearly two-
thirds were between 17 and 19 years of age (Figure 2.1). Fifteen people aged 22 who were referred
into the service in error were permitted to remain. Almost 20 per cent of people referred to TtW
were Indigenous. Just over 10 per cent of all referrals were ex-offenders.
Figure 2.1 Age at referral to TtW
Source: Department of Employment, Skills, Small and Family Business administrative data — TtW inflow population.
The TtW inflow sample of 20,684 participants was compared with a matched group in jobactive. The
participants were matched on age at referral, Stream B and educational attainment. They were
compared on age, education, gender, Indigenous status, level of English proficiency, transport
access, offender status and remoteness.
The demographics for participants in the matched sample were similar to the full TtW inflow
population. Details of the TtW inflow population (i.e. everyone referred to the service) and the
matched samples of TtW and jobactive referrals are in Appendix C.
Slightly more jobactive participants than TtW participants were on income support at referral
(Table 2.1).
0.5%
8.1%
17.5%
24.4%
19.7%
16.0%
13.7%
0.1%0%
5%
10%
15%
20%
25%
30%
15 16 17 18 19 20 21 22
Age at referral (years)
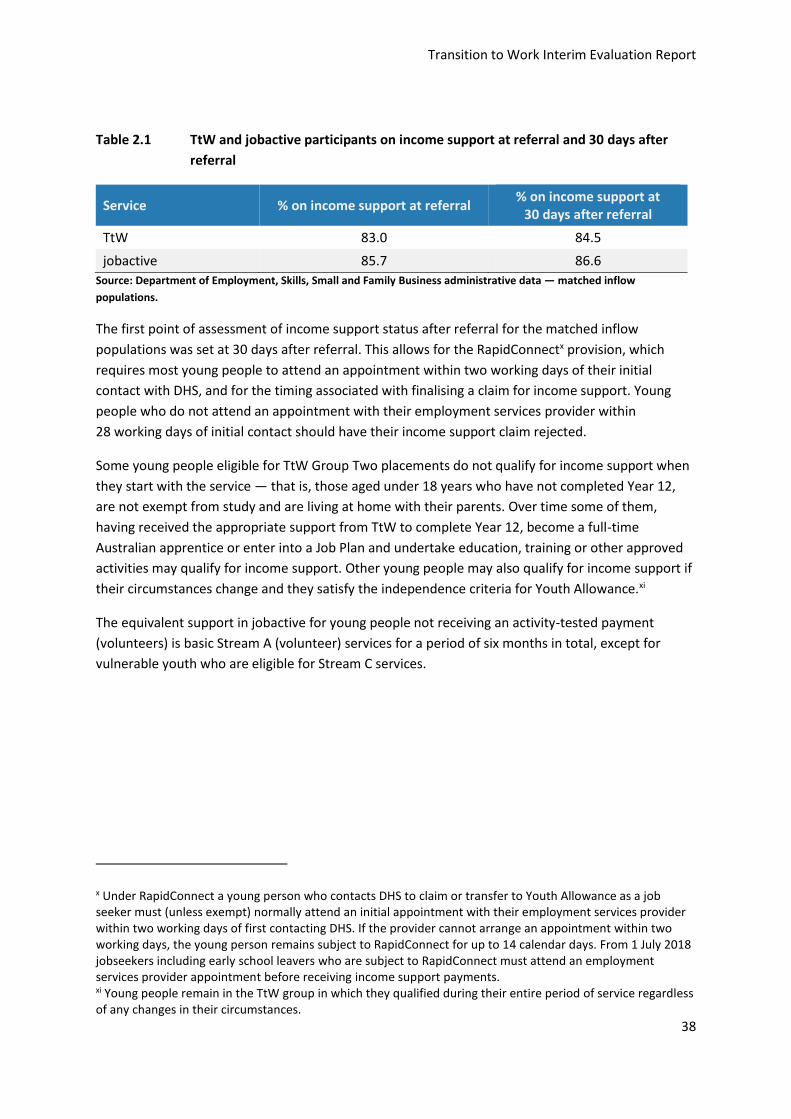
Transition to Work Interim Evaluation Report
38
Table 2.1 TtW and jobactive participants on income support at referral and 30 days after
referral
Service % on income support at referral % on income support at
30 days after referral
TtW 83.0 84.5
jobactive 85.7 86.6
Source: Department of Employment, Skills, Small and Family Business administrative data — matched inflow
populations.
The first point of assessment of income support status after referral for the matched inflow
populations was set at 30 days after referral. This allows for the RapidConnectx provision, which
requires most young people to attend an appointment within two working days of their initial
contact with DHS, and for the timing associated with finalising a claim for income support. Young
people who do not attend an appointment with their employment services provider within
28 working days of initial contact should have their income support claim rejected.
Some young people eligible for TtW Group Two placements do not qualify for income support when
they start with the service — that is, those aged under 18 years who have not completed Year 12,
are not exempt from study and are living at home with their parents. Over time some of them,
having received the appropriate support from TtW to complete Year 12, become a full-time
Australian apprentice or enter into a Job Plan and undertake education, training or other approved
activities may qualify for income support. Other young people may also qualify for income support if
their circumstances change and they satisfy the independence criteria for Youth Allowance.xi
The equivalent support in jobactive for young people not receiving an activity-tested payment
(volunteers) is basic Stream A (volunteer) services for a period of six months in total, except for
vulnerable youth who are eligible for Stream C services.
x Under RapidConnect a young person who contacts DHS to claim or transfer to Youth Allowance as a job seeker must (unless exempt) normally attend an initial appointment with their employment services provider within two working days of first contacting DHS. If the provider cannot arrange an appointment within two working days, the young person remains subject to RapidConnect for up to 14 calendar days. From 1 July 2018 jobseekers including early school leavers who are subject to RapidConnect must attend an employment services provider appointment before receiving income support payments. xi Young people remain in the TtW group in which they qualified during their entire period of service regardless of any changes in their circumstances.

Transition to Work Interim Evaluation Report
39
3 The extent to which service implementation and operational processes enabled effective and efficient service delivery
Key findings
Providers and peak bodies identified a number of issues with the rapid implementation and
rollout of the service. These included securing sites, training staff, the suitability of and
incomplete or inaccurate contact details of people referred from jobactive (the start-up
caseload) and the general lack of awareness and knowledge of TtW (particularly among
transitioned participants and DHS staff).
These issues settled as delivery matured. Providers were generally satisfied with the level of
departmental support they received during the implementation period.
Employers of TtW participants reported low awareness of the TtW service.
All stakeholders expressed positive views on aspects of the design of TtW, including the funding
model, individualised servicing, increased work-readiness, KPIs and Outcome Performance
Targets.
Providers found disengaged youth (Group Two) difficult to attract, and expressed frustration at
the lack of participants referred from jobactive (Group Three).
3.1 Indicators used to address the evaluation question
This chapter addresses TtW Evaluation Strategy Question 1.1:
To what extent do the service implementation and operational processes enable
effective and efficient service delivery?
Indicators relevant to this question were:
the ease and timeliness of TtW’s implementation processes and any subsequent impact on the
quality of providers’ services at start-up, including the effectiveness of a phased rollout
providers’ views on the operational aspects of TtW after implementation, including the funding
model, program issues and design
providers’ strategies to address implementation and early operational issues
the contribution of stakeholder interactions and engagement to successful service
implementation
the appropriateness of the TtW model in helping young people to become job ready.
The main data source used in this chapter was a census of TtW providers at site level and qualitative
research (undertaken from October to December 2016), augmented by administrative data. The
findings reported in this chapter are based on responses by providers at site level. It is important to

Transition to Work Interim Evaluation Report
40
note when interpreting these findings that contracted TtW providers can provide services in one or
more Employment Regions and at one or more sites in each region.
3.2 Early provider experiences of implementation
This section focuses on the experiences and views of TtW providers and stakeholders from the close
of the Request for Proposal (on 1 December 2015) to when providers were notified of their success
(from January 2016) and then to full commencement of the service started (by May 2016).
TtW was implemented over four phases, outlined in Table 3. 1.
Table 3.1 Phases of TtW rollout
Rollout phase Commencement date Number of contracts Number of employment regions*
Phase One 11 7 Phase One — Part 1 15 February 2016 (7) — 5 Phase One — Part 2 29 February 2016 (4) — 4
Phase Two 14 March 2016 28 21 Phase Three 4 April 2016 42 27 Phase Four 2 May 2016 1 1 All phases — 82 51
* Contracts could be rolled out in an employment region over multiple phases, so the number across phases will not equal the number of regions.
3.2.1 Most providers found the short implementation timeframe challenging
Despite being satisfied with departmental support during the implementation phase (Section 3.2.4),
most providers, particularly those new to employment services, indicated that the relatively short
commencement deadline was challenging.
So, while managing the entire region, the turnarounds were very, very quick, so
from when we got the contract we had four weeks to open the services in all
sites, which was a very short window, and it would be great to have a longer
window in the future.
(Provider Focus Group 2)
The short timeframe made it difficult for some providers to secure premises and staff and to train
staff sufficiently on the TtW guidelines and systems before the service started.
We only had 18 days to set it up from nothing … So I spent 18 days finding
premises to start when we did, plus furnishing, recruiting, training, developing
the resources that we needed. That was really a fraught time, 18 days, fraught
time.
(Provider Interview 3)

Transition to Work Interim Evaluation Report
41
You’ve got staff who are really keen and want to work with young people and are
frustrated because they’ve got the knowledge on how to engage with them but
they got no time to learn the program.
(Provider Interview 7)
Providers who were new to employment services and unfamiliar with working with the department
found these time constraints particularly frustrating as they attempted to develop a good
understanding of the TtW guidelines and the ESS. These providers indicated a need for more
structured training from the department.
… the department put up three one-minute tutorials on using ESS, and some pre-
recorded webinar, which didn’t get to the meat of things. Granted, it did provide
some in-person training at various points, but for people who have never used
the system before, it’s a complex system, and I think some forethought about
how you’re wanting to put that out; it’s very important that there’s a very
structured and regimented way to get people across using that system.
(Provider Focus Group 2)
Providers with some familiarity with employment services found implementation easier, especially
as they knew what to expect.
Yeah, it was pretty smooth. I mean when you’re learning a new contract there’s
always a few little hiccups but I think that’s normal, that’s a normal part of the
process.
(Provider Interview 4)
3.2.2 Providers found the start-up referrals challenging, as referrals lacked sufficient
contact information or contact details were incorrect
Although providers said they found the tight implementation timeframe challenging, they identified
the biggest challenge as the start-up caseload referrals from jobactive.xii The reasons they gave why
early referrals were inappropriate included young people being uncontactable, living outside the
service area, having a serious mental illness or not being interested in the TtW service. Around 39
per cent of providers agreed that contact details were accurate compared with 41 per cent who
disagreed. Just under half (49 per cent) agreed that the start-up caseload transfer from jobactive
went smoothly (Figure 3.1).
xii Start-up caseloads were referred by DHS from jobactive to TtW under Group One.
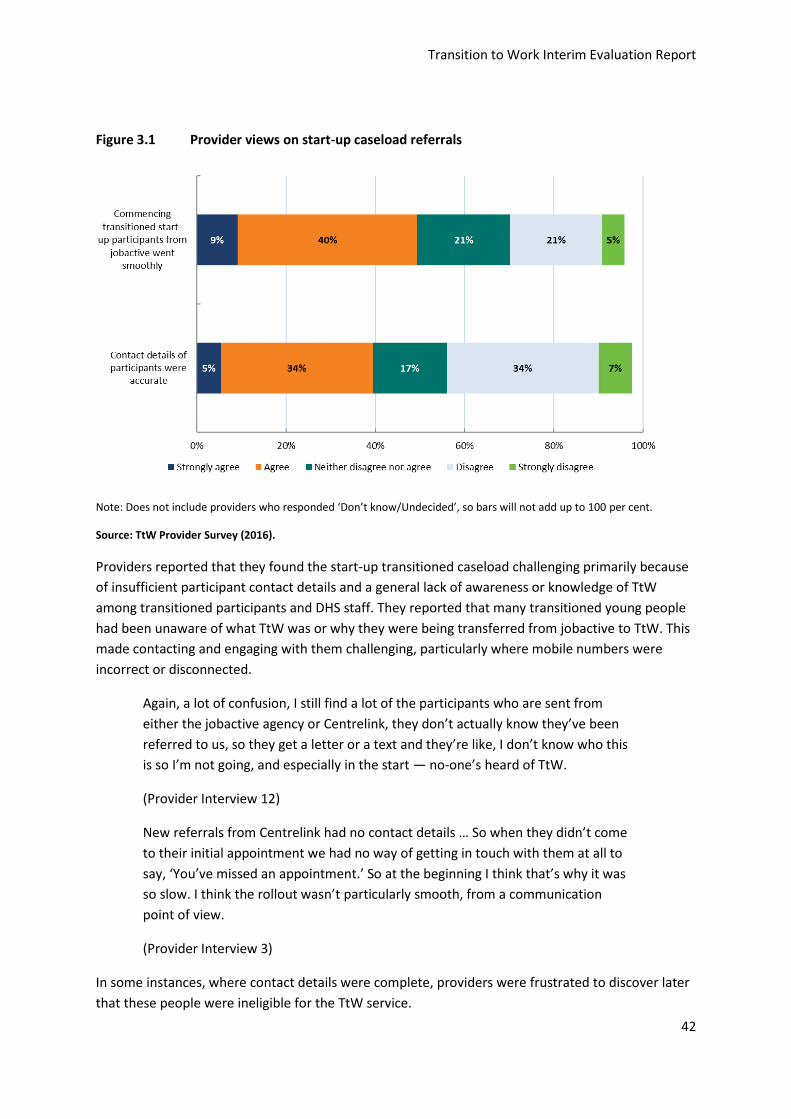
Transition to Work Interim Evaluation Report
42
Figure 3.1 Provider views on start-up caseload referrals
Note: Does not include providers who responded ‘Don’t know/Undecided’, so bars will not add up to 100 per cent.
Source: TtW Provider Survey (2016).
Providers reported that they found the start-up transitioned caseload challenging primarily because
of insufficient participant contact details and a general lack of awareness or knowledge of TtW
among transitioned participants and DHS staff. They reported that many transitioned young people
had been unaware of what TtW was or why they were being transferred from jobactive to TtW. This
made contacting and engaging with them challenging, particularly where mobile numbers were
incorrect or disconnected.
Again, a lot of confusion, I still find a lot of the participants who are sent from
either the jobactive agency or Centrelink, they don’t actually know they’ve been
referred to us, so they get a letter or a text and they’re like, I don’t know who this
is so I’m not going, and especially in the start — no-one’s heard of TtW.
(Provider Interview 12)
New referrals from Centrelink had no contact details … So when they didn’t come
to their initial appointment we had no way of getting in touch with them at all to
say, ‘You’ve missed an appointment.’ So at the beginning I think that’s why it was
so slow. I think the rollout wasn’t particularly smooth, from a communication
point of view.
(Provider Interview 3)
In some instances, where contact details were complete, providers were frustrated to discover later
that these people were ineligible for the TtW service.
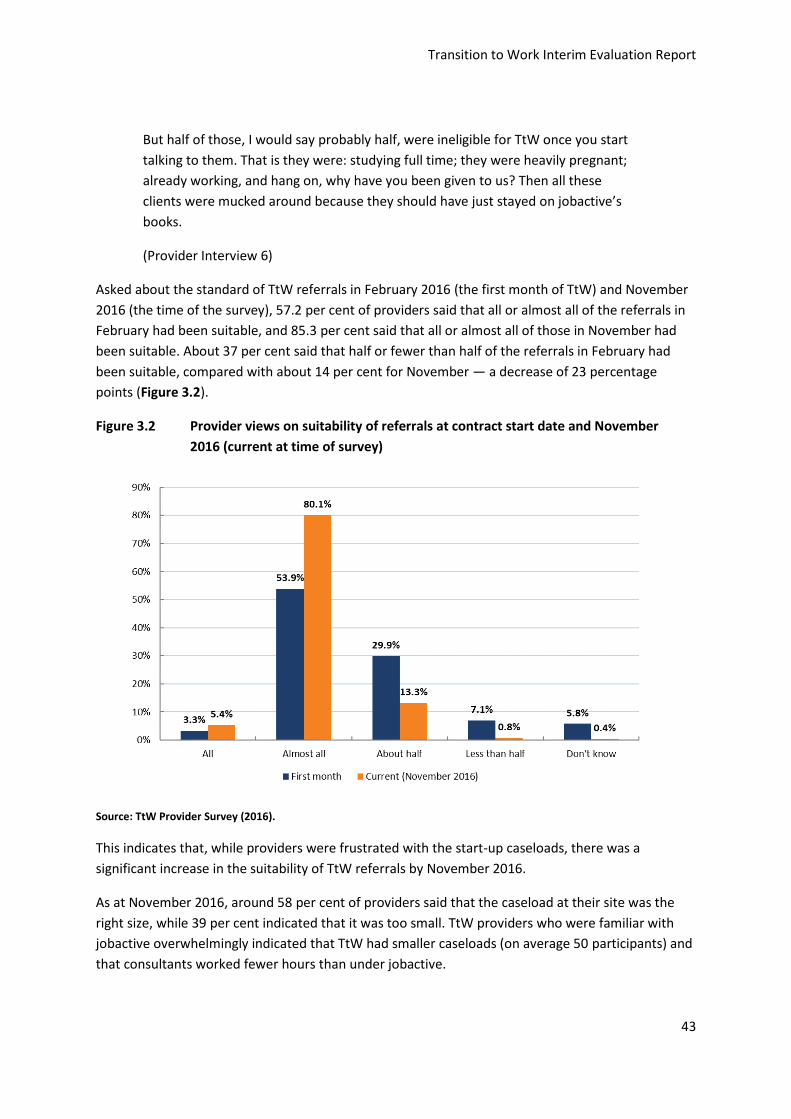
Transition to Work Interim Evaluation Report
43
But half of those, I would say probably half, were ineligible for TtW once you start
talking to them. That is they were: studying full time; they were heavily pregnant;
already working, and hang on, why have you been given to us? Then all these
clients were mucked around because they should have just stayed on jobactive’s
books.
(Provider Interview 6)
Asked about the standard of TtW referrals in February 2016 (the first month of TtW) and November
2016 (the time of the survey), 57.2 per cent of providers said that all or almost all of the referrals in
February had been suitable, and 85.3 per cent said that all or almost all of those in November had
been suitable. About 37 per cent said that half or fewer than half of the referrals in February had
been suitable, compared with about 14 per cent for November — a decrease of 23 percentage
points (Figure 3.2).
Figure 3.2 Provider views on suitability of referrals at contract start date and November
2016 (current at time of survey)
Source: TtW Provider Survey (2016).
This indicates that, while providers were frustrated with the start-up caseloads, there was a
significant increase in the suitability of TtW referrals by November 2016.
As at November 2016, around 58 per cent of providers said that the caseload at their site was the
right size, while 39 per cent indicated that it was too small. TtW providers who were familiar with
jobactive overwhelmingly indicated that TtW had smaller caseloads (on average 50 participants) and
that consultants worked fewer hours than under jobactive.
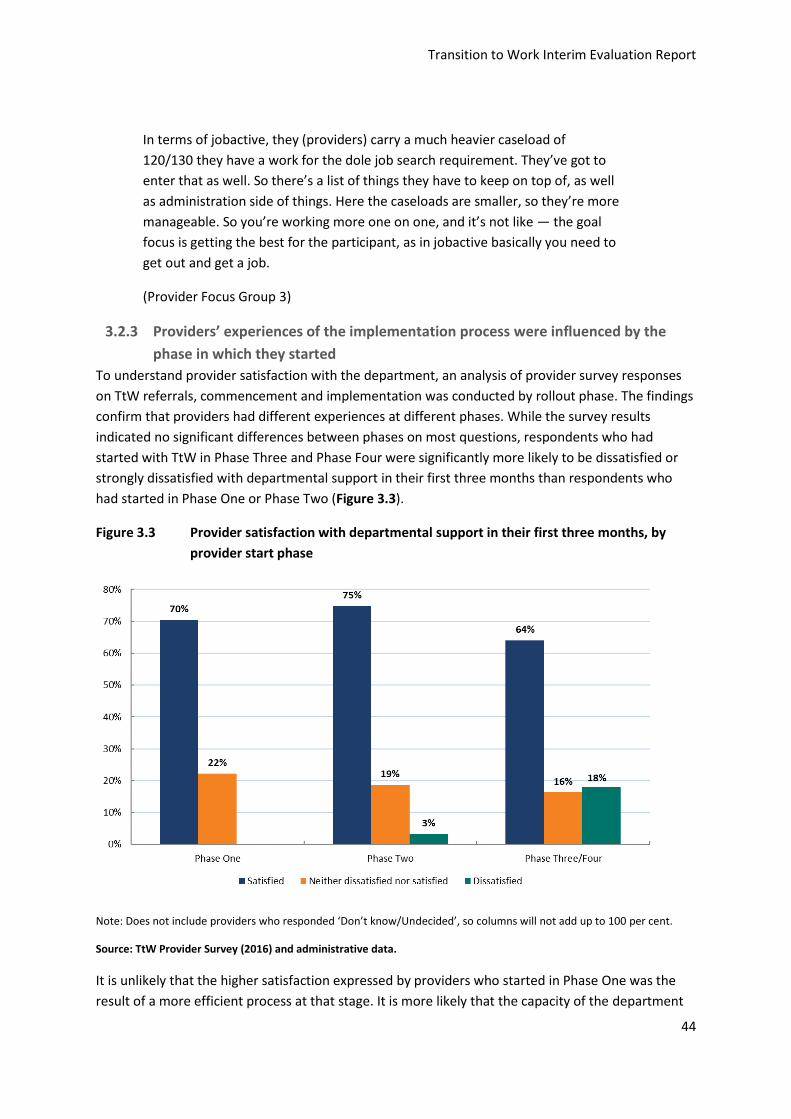
Transition to Work Interim Evaluation Report
44
In terms of jobactive, they (providers) carry a much heavier caseload of
120/130 they have a work for the dole job search requirement. They’ve got to
enter that as well. So there’s a list of things they have to keep on top of, as well
as administration side of things. Here the caseloads are smaller, so they’re more
manageable. So you’re working more one on one, and it’s not like — the goal
focus is getting the best for the participant, as in jobactive basically you need to
get out and get a job.
(Provider Focus Group 3)
3.2.3 Providers’ experiences of the implementation process were influenced by the
phase in which they started
To understand provider satisfaction with the department, an analysis of provider survey responses
on TtW referrals, commencement and implementation was conducted by rollout phase. The findings
confirm that providers had different experiences at different phases. While the survey results
indicated no significant differences between phases on most questions, respondents who had
started with TtW in Phase Three and Phase Four were significantly more likely to be dissatisfied or
strongly dissatisfied with departmental support in their first three months than respondents who
had started in Phase One or Phase Two (Figure 3.3).
Figure 3.3 Provider satisfaction with departmental support in their first three months, by
provider start phase
Note: Does not include providers who responded ‘Don’t know/Undecided’, so columns will not add up to 100 per cent.
Source: TtW Provider Survey (2016) and administrative data.
It is unlikely that the higher satisfaction expressed by providers who started in Phase One was the
result of a more efficient process at that stage. It is more likely that the capacity of the department

Transition to Work Interim Evaluation Report
45
to support providers was stretched by the larger numbers starting in Phase Three / Phase Four and,
to a lesser extent, Phase Two. At the same time, the department was also rolling out other initiatives
under the Youth Employment Package.
Conversely, providers at sites that started in Phase One were more likely to disagree with the
statement that departmental staff communicated clearly than those in the subsequent phases
(Figure 3.4), indicating some confusion in the early stages of the implementation.
Moreover, the short time between Phase Two and Phase Three could have exacerbated the pressure
on Phase Three / Phase Four. It is likely that staged rollouts with a more even distribution of sites
and more time between phases in future would help the department provide high-quality support to
all providers. However, generally most providers (82 per cent) reported that their experiences in
their first three months were largely the same as or better than their expectations.
Figure 3.4 Provider views on whether departmental staff communicated clearly, by provider
start phase
Note: Does not include providers who responded ‘Don’t know/Undecided’, so columns will not add up to 100 per cent.
Source: TtW Provider Survey (2016) and administrative data.
3.2.4 Providers were generally positive about the level of support and information from
the department
Providers generally had a positive view of the level of support they had received from the
department. Nearly 70 per cent of providers responded that they were satisfied or very satisfied
with the level of support from the department in the first three months. About 10 per cent reported
that they were dissatisfied or very dissatisfied. A majority agreed or strongly agreed that the
department was easy to contact, kept them informed, managed the implementation well and gave
them adequate support (Figure 3.5).
56%
84%81%
15%
1%
11%
26%
6%2%
0%
10%
20%
30%
40%
50%
60%
70%
80%
90%
100%
Phase One Phase Two Phase Three/Four
Agree Neither disagree nor agree Disagree

Transition to Work Interim Evaluation Report
46
Figure 3.5 Provider views on departmental support during the implementation phase
Note: Does not include providers who responded ‘Don’t know/Undecided’, so bars may not add up to 100 per cent.
Source: TtW Provider Survey (2016).
Providers indicated that information and support from the department were readily available, easy
to access and, more often than not, of a high standard.
I think the support from the department has probably been exceptional in lots of
ways and that has been really good — I’ve attended all of the Transition to Work
conferences, [Name]’s been to one of the youth forums. There’s really strong
support from the department around Transition to Work, they’re really happy
with how it’s going, etc.
(Provider Interview 13)
Most providers noted that the Provider Portal was a helpful resource for addressing their questions
and concerns. Many said that this was usually the first point of call for provider staff.
I have [the portal] open every day … It’s just a routine that I have, because I flick
to the guidelines in the Deed a lot, and I just always have got it there just in case
there is an update, and it’s just something I have open, it’s like a lifeline.
(Provider Focus Group 5)
Most providers had infrequent contact with their contract or account manager, but those who had
needed assistance spoke highly of the support they received.
15%
16%
18%
21%
56%
50%
57%
55%
16%
15%
13%
12%
9%
13%
9%
7%
1%
2%
0% 20% 40% 60% 80% 100%
The Department
provided adequate
support
The implementation
was well managed
by the Department
The Department
kept our site
informed
The Department
was easy to contact
when we had
questions
Strongly agree Agree Neither disagree nor agree Disagree Strongly disagree

Transition to Work Interim Evaluation Report
47
I’ve had a good involvement with our contract manager through the jobactive
process as well and she’s remained with us as part of TtW so that’s been a bonus;
so I already had an existing relationship with the contract manager. We’re in
contact very frequently. I try and inform her if I identify any issues or any queries
that I have and as I said we get responses and results through the contract
manager which is great.
(Provider Interview 5)
Providers generally agreed that departmental staff were knowledgeable in answering queries and
that the right person was available to resolve their issues (Figure 3.6).
Figure 3.6 Provider views on departmental responses to queries
Note: Does not include providers who responded ‘Don’t know/Undecided’, so bars may not add up to 100 per cent.
Source: TtW Provider Survey (2016).
Most providers agreed that departmental staff responded promptly to queries and provided
reasonable notice about changes (Figure 3.7).
18%
20%
53%
53%
13%
11%
7%
8%
3%
2%
0% 20% 40% 60% 80% 100%
The right person
available to resolve
issues
Knowledgeable
about Transition to
Work
Strongly agree Agree Neither disagree nor agree Disagree Strongly disagree
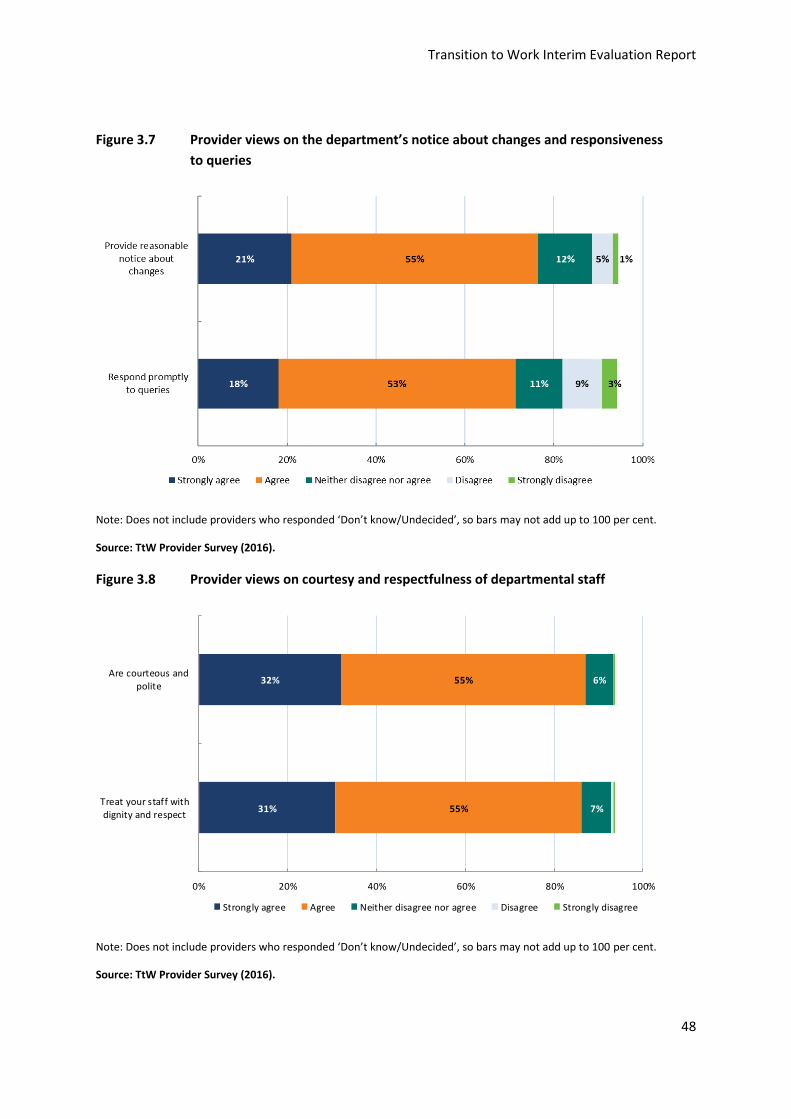
Transition to Work Interim Evaluation Report
48
Figure 3.7 Provider views on the department’s notice about changes and responsiveness
to queries
Note: Does not include providers who responded ‘Don’t know/Undecided’, so bars may not add up to 100 per cent.
Source: TtW Provider Survey (2016).
Figure 3.8 Provider views on courtesy and respectfulness of departmental staff
Note: Does not include providers who responded ‘Don’t know/Undecided’, so bars may not add up to 100 per cent.
Source: TtW Provider Survey (2016).
31%
32%
55%
55%
7%
6%
0% 20% 40% 60% 80% 100%
Treat your staff with
dignity and respect
Are courteous and
polite
Strongly agree Agree Neither disagree nor agree Disagree Strongly disagree

Transition to Work Interim Evaluation Report
49
Most providers said that departmental staff were courteous and respectful (Figure 3.8) and that
they demonstrated good communication skills (Figure 3.9).
Figure 3.9 Provider views on communication skills of departmental staff
Note: Does not include providers who responded ‘Don’t know/Undecided’, so bars may not add up to 100 per cent.
Source: TtW Provider Survey (2016).
3.2.5 The contribution of stakeholder interactions and engagement to successful
service implementation
This section discusses the relationship between departmental staff, DHS, TtW providers and
employers during the initial service implementation phase. TtW providers reported they worked
closely with stakeholders in their communities, including DHS staff, jobactive providers, employers,
and education and community organisations to facilitate placements and recruit Group Two
referrals.
All stakeholders agreed that TtW was a positive experience
Overall, all parties surveyed agreed that working with TtW was a positive experience. Almost all
providers (99 per cent) indicated that they thought TtW was a good service, with potential for
further improvement. Overall, stakeholders said it was an appropriate service model for the target
population, with enough flexibility to enable productive interactions between stakeholders,
especially between providers and participants.
TtW’s flexibility and high level of personal support were regarded highly. Participants reported
feeling more confident in their job-seeking and interviewing skills.
18%
20%
20%
20%
53%
60%
58%
55%
14%
8%
11%
14%
7%
5%
5%
2%
1%
1%
0% 20% 40% 60% 80% 100%
Provide a clear
response to queries
Communicate with
you clearly
Communicate
changes effectively
Listen to your staff's
point of view
Strongly agree Agree Neither disagree nor agree Disagree Strongly disagree

Transition to Work Interim Evaluation Report
50
I just feel like it’s really hands on and they really help with giving you the skills
that you need and giving you different options for things that you might not even
know exist.
(Participant Focus Group 12)
They [providers] genuinely care about what they’re doing. They get to know
people on a personal level so, it’s not like black and white there’s a lot of
different things and things that go into it and everything. So yeah, it’s just really
great thing, I love it ….
(Participant Focus Group 12)
Stakeholders agreed that early implementation issues had been resolved
Many stakeholders highlighted some early implementation issues. However, they agreed that most
of these issues had been resolved as the TtW service matured. Most stakeholders noted their
proactive strategies put in place to quickly address many of these issues.
Participants noted that DHS provided them with little information when referring them to a TtW
service.
No explanation. Just said, ‘You have to go to this, this is the location and that’s
your meeting time.’
(Respondent 2, Participant Focus Group 4)
Most DHS staff interviewed acknowledged that their knowledge of the TtW service during the
implementation rollout was limited to information that could be found in the go-to directory of
services for DHS staff.
I started researching it through our options that we've got to obviously look at
things. So we looked at the operational blueprint and it's like, okay, so what's the
criteria, eligibility, how does referral process work a bit better.
(DHS Interview 4)
3.3 Provider views as the TtW service matured
The provider survey asked about post-implementation operational aspects of TtW, to enable the
evaluation to identify areas for improvement that could make the service more effective. The
questions that guided the discussion in this section are in Appendix G.
As described in Chapter 1, TtW targets three groups of young people aged 15 to 21 years. Each of
these groups had a different pathway into the service (Table 3.2).

Transition to Work Interim Evaluation Report
51
Table 3.2 Referral paths of the three target groups
Group Description
Group One
DHS referrals
DHS refers these participants to TtW when they first claim income support — including the initial caseload referred from jobactive
Group Two Disengaged youth
TtW providers recruit these participants directly
Group Three jobactive referrals
jobactive providers refer these participants to TtW
3.3.1 The lack of awareness among stakeholders and a system glitch compounded the
initial challenge of referrals from DHS
The lack of up-to-date and complete contact details for start-up participants is discussed in detail in
Section 3.2.2. However, TtW providers continued to encounter difficulties in relation to ongoing
Group One referrals beyond implementation.
It definitely wasn’t the high number that we thought would come through, and
given that the demographics of this area, a lot of young people are in this area,
we really thought that the DHS referrals would be high from day one and be that
way the whole time, because any young person that’s eligible for TtW.
(Provider Interview 7)
Almost 50 per cent of providers agreed that Group One referrals from DHS were smooth. Responses
to this question are likely to have been influenced by issues with the start-up transfer in the early
implementation phase.
Providers generally thought that awareness of TtW was low among DHS staff. DHS staff reported
that, while they were aware of the TtW service, they generally had little detailed knowledge of the
eligibility criteria and relied on the DHS IT system to flag a potentially eligible young person. They
were also unsure of the exact nature of the service. As indicated earlier, this prompted some DHS
staff to actively search for more information about TtW.
There were also reports from DHS staff that during the early stages of implementation that it could
be difficult to find appointment slots on the system for TtW providers in the required timeframe.
DHS staff often referred young people to the first available slot with a jobactive provider to avoid
risking delays to the young person receiving a benefit payment.
We just have to make an appointment with someone, especially at the new claim
stage because they have to go to one of these appointments for their payments
to kick in. So, it might be that we’d make an appointment with one of them and

Transition to Work Interim Evaluation Report
52
then maybe get the client to come back in at some stage to see if we can then
transfer them.
(DHS Interview 2)
I’ve gone in to run a referral to Transition to Work and it comes up “no
appointments available” and it is a known error that has been escalated
apparently … In this one it reads that she’s linked with a jobactive provider
however she needs to have an initial appointment of some kind in the system. So,
we’ve had to code an exemption on her record which will allow another 28 days.
So, if she doesn’t connect within that 28 days then her payment would suspend.
(DHS Interview 9)
3.3.2 Providers had limited success in recruiting Group Two participants
Around 61 per cent of providers agreed that Group Two participants were difficult to attract.
Providers also reported that there was too much red tape and that the eligibility criteria were too
restrictive (Figure 3.10).
Figure 3.10 Provider views on difficulty of engaging Group Two participants
Note: Does not include providers who responded ‘Don’t know/Undecided’, so bars may not add up to 100 per cent.
Source: TtW Provider Survey (2016).
Around 71 per cent of providers strongly agreed or agreed that there was too much red tape
involved in recruiting disengaged young people, such as gathering documentary evidence to confirm
that the young person has not attended school for 13 weeks.
23%
32%
32%
38%
37%
39%
17%
16%
16%
19%
15%
11%
3%
1%
0% 20% 40% 60% 80% 100%
It is difficult to
attract Group Two
participants to
Transition to Work
The eligibility
criteria for Group
Two participants are
too restrictive
There is too much
red tape involved in
engaging Group Two
participants
Strongly agree Agree Neither disagree nor agree Disagree Strongly disagree

Transition to Work Interim Evaluation Report
53
Providers reported that Group Two participants approached them directly to inquire about TtW. In
line with this, focus group responses from participants indicated that they had heard about TtW
from friends who had found employment though TtW. DHS staff also confirmed this.
A lot of them I think came from word of mouth. So, a couple of the kids getting in
— so, they were referred initially and then word’s got out on the street that,
‘Hey, this is available. You can get placed in work,’ that sort of thing.
(DHS Interview 7)
3.3.3 The number of Group Three referrals was below expectations
TtW providers were frustrated by the lack of Group Three referrals from jobactive providers.
Yes and it was very frustrating — there were certain jobactive providers that
didn’t want to play and didn’t want to support that transition and were saying to
the participants they didn’t have to go … but they weren’t supportive and this is
about a young person’s development which is the whole purpose of a TtW, in my
belief.
(Provider Interview 15)
Administrative data from ESS provided further evidence of low Stream C referral numbers from
jobactive. In the first six months of operation of the TtW contracts, fewer than four per cent of
referred participants who had commenced within 30 days of referral were from jobactive
(Group Three participants). This compared with around 90 per cent for Group One and more than six
per cent for Group Two (Figure 3.11).
Figure 3.11 Referrals and commencements in the first 30 days of provider contracts, by
participant group
Source: Department of Employment, Skills, Small and Family Business administrative data.
92%
97%
89%
4%
7%
90%
0% 20% 40% 60% 80% 100%
Group three
Group two
Group one
Referrals commenced in first six months of operationAll referrals Group commencement rate

Transition to Work Interim Evaluation Report
54
The median proportion of Group Three referrals was around 3 per cent of Annual Funded Places,
well below the cap of 10 per cent of Annual Funded Places allowed. The commencement rate of
Group Three referrals to TtW was around 92 per cent.
TtW providers thought that jobactive providers were unwilling to refer Stream C young people for
various reasons. Some providers speculated that Stream C participants attract much higher
payments to jobactive providers than participants in other streams.
I think it’s a combination of a lack of awareness but I also think (from the
experience in the industry) people are not wanting to give up their participants. A
Stream C participant is quite a high dollar value for them. A young person placed
into work is more attractive for them to keep than it is to transition to us.
(Provider Interview 16)
Some TtW providers found that participants referred from Stream C in jobactive were already
disengaged and non-compliant. Many of these participants had no interest in being supported by
TtW — or by any other service, for that matter. Many did not attend initial appointments and were
then exited and returned to jobactive. Around 68 per cent of TtW providers agreed or strongly
agreed that some of the participants referred to TtW from jobactive were unsuitable for the
intensive activity requirements of TtW.
3.3.4 Providers reported that the TtW funding structure was sustainable and allowed
them to support participants appropriately
Providers indicated that they were generally satisfied with the funding structure and felt that the
KPIs and Outcome Performance Targets were achievable. They said that the funding structure was
sustainable and helped them to support participants properly. They agreed that the up-front
payments had helped them set up their offices, pay staff and provide services to participants. A few
providers who had achieved sustainability outcomes said that this was a good incentive as the extra
income could be used to support other participants.
What I really like is that if you meet your KPI and you get over your KPI, you get a
bonus payment that you wouldn’t otherwise get. We got quite a few because we
knew our KPI was exceeded. That’s cool because all that is a bit of funding that
will now go back for us to do something else with.
(Provider Interview 3)
The funding portion, the way that they’ve rolled out the funding isn’t bad,
because they’ve actually paid us in advance for a portion of it, and then we get
quarterly payments. So the actual funding and the flow of cash for the program
are not terribly bad. That’s actually quite fine.
(Provider Interview 6)

Transition to Work Interim Evaluation Report
55
Many providers reported setting aside a proportion of their up-front payments to help TtW
participants prepare for work, such as to buy interview or job-specific clothing or to pay for driving
lessons.
It’s allowed me to have that cash flow and stuff so that we can — you know, if
they say this person wants to do their RSA [Responsible Service of Alcohol], RCG
[Responsible Conduct of Gambling] you know, the money is there to do it and
stuff like that, although I always make sure we can get a group together and do it
in a group rather than paying individually this week and that week.
(Provider Interview 6)
The average TtW site caseload was around 50 participants; however, administrative data showed
that the variation across sites was large. Where caseloads were higher, participants and providers
made less positive comments about the quality of the service.
It’s supposed to be intensive support but with a caseload of seventy how are you
supposed to provide intensive support if you’re seeing them for half an hour a
fortnight because that’s all you can actually do.
(Provider Focus Group 1)
Participants at sites with higher than average caseloads also felt that their consultant had not
dedicated enough time to helping them find a job.
Respondent: I wouldn’t say she was negative, Iike I loved her from the day I
walked in, she’s really cool, but I just don’t feel that she’s going out of her way for
me. The last time I went in there they found one job, one job, and put me
towards it, but why not put me towards a couple, because you’re not going to get
one overnight.
Respondent: I just think there needs to be more people helping you.
(Participant Focus Group 10)
TtW providers estimated that the proportion of time they spent on administration was around
43 per cent — about 20 percentage points lower than reported in the jobactive Provider Survey. The
stronger job seeker compliance arrangements and managing the operating requirement of their
Employment Fund allocation to purchase goods and services for participants in jobactive are likely to
be contributing factors in the reported difference in administrative burden.
3.3.5 Providers were satisfied with the operational information about TtW and, to a
lesser extent, the ESS Web system
The TtW provider survey examined providers’ satisfaction with the operational information they had
about TtW and with the department’s information systems. Responses in relation to online
information about TtW (including the Provider Portal and Question Manager) were overwhelmingly

Transition to Work Interim Evaluation Report
56
positive. More than 75 per cent of respondents agreed or strongly agreed that the content was up to
date, relevant, consistent, accurate, provided in a timely manner and a useful format, and easy to
understand. Respondents were also very positive about the Learning Centre, the program guidelines
and the TtW Deed (Figure 3.12).
Figure 3.12 Provider satisfaction with the Learning Centre, program guidelines and TtW Deed
Note: Does not include providers who responded ‘Don’t know/Undecided’, so bars may not add up to 100 per cent.
Source: TtW Provider Survey (2016).
Around 60 per cent of providers strongly agreed or agreed that ESS Web provided flexibility with
administering TtW.
3.4 Providers’ strategies to address any implementation and early operational issues
This section considers the extent to which the implementation and operational processes of TtW
influenced the quality of service delivered by providers. As discussed in Section 3.2, the lack of
up-to-date and complete contact details in the start-up caseload from DHS frustrated providers and
compromised their ability to deliver the service efficiently. However, TtW providers devised
innovative strategies to address this issue and other barriers.
3.4.1 Providers regularly visited Centrelink offices to encourage Group One referrals by
increasing understanding of TtW
During the rollout and early months of the TtW service, DHS staff had little detailed knowledge of
the eligibility criteria for TtW and limited understanding of the exact nature of the service. To
overcome this barrier, many providers needed to visit Centrelink offices regularly to talk about TtW.
11%
11%
15%
74%
74%
59%
10%
6%
16%
2%
5%
7%
2%
3%
3%
0% 20% 40% 60% 80% 100%
The TtW Deed is comprehensive
and meets our requirements
Program guidelines are
comprehensive and meet our
requirements
The Learning Centre content is
relevant and helpful
Strongly agree Agree Neither disagree nor agree Disagree Strongly disagree

Transition to Work Interim Evaluation Report
57
I’ve personally visited the [Centrelink location] office at least eight times now
over the period of the contract to go to their staff meetings. If I didn’t do this,
they wouldn’t know anything about us.
(Provider Interview 6)
Some DHS staff reported that it was difficult to find available TtW provider appointment slots in the
IT system within the timeframe stipulated in RapidConnect (the young person must attend an
interview with an employment services provider within two working days of their initial contact with
DHS).
Following the feedback from DHS about the lack of available appointment slots, some providers
reported reassessing their schedules regularly to ensure that appointment times were available for
referrals.
I always monitor the calendar to make sure that there are available time slots and
if there aren’t then we just add some more in.
(Provider Focus Group 14)
3.4.2 Providers worked with local schools and community groups to recruit Group Two
participants
Most providers reported that recruitment rates for Group Two participants were much lower than
the projected 20 per cent. They noted that commencement of Group Two participants was slow
because of:
the need to check and confirm that a young person was suitable for TtW first
the required waiting period for disengagement from school, which meant that by the end of the
waiting period the young person could have been completely disengaged from services as well
the lack of contact details for this group, as in most cases their current details would not be
registered with DHS.
Providers reported that they adopted a broad range of strategies for recruiting this group of
participants. These included going out to local schools to identify students at risk of dropping out
of school; collaborating with youth-oriented community organisations and programs such as
juvenile justice and cultural groups; and reaching out to parents via leaflets, flyers etc. Some
providers noted that they sent team members into the community to target specific hotspots,
including shopping centres, skate parks and sports grounds.
It’s more of a scatter gun approach. All of our YA youth advisors are mobile so
what we’ve been focussing on is concentrating on areas where we know young
people hang out. These are the shopping centres, the sporting fields, the
skateboard parks.
(Provider Interview 5)

Transition to Work Interim Evaluation Report
58
We’ve been operating down there from time to time, we might just go down and
work off the skateboard park and just be sitting on one of the benches on the
skateboard park with our laptop and just looking and talking and people will start
coming up.
(Provider Interview 5)
Peak body organisations acknowledged that providers taking innovative and flexible approaches to
recruiting Group Two participants was a key element of TtW’s success in reaching disengaged young
people who are not working or studying.
Providers questioned the requirement that a young person with Year 12 must not have engaged
with employment or education for six months or more to be eligible for Group Two participation.
They said that this requirement made it harder for them to engage the young person, and some
realised that this reduced the value of their strategy of approaching schools directly.
Within the Group Twos (those are the ones with the direct register) they’re hard
to find. Because of the requirement that they’ve been out of school for x amount
of time and stuff like that, and they’re not on a payment, it means that they’re
not engaged for the service to refer to us… and it’s harder for me to go to talk to
them, sort of thing. We’re having some interactions with the schools, but we
have to be a bit careful because we can’t sign them up straight out of school.
(Provider Interview 10)
3.4.3 Providers suggested that the department could provide incentives to increase
Group Three referrals
Many TtW providers suggested that the department could help by introducing a dual outcome
funding structure so that jobactive providers would not lose the financial incentives for Stream C
young people when they refer them to TtW.xiii
Those Stream Cs, for a jobactive provider are a very high profile client because
they have huge weightings towards the STAR ratings. If I put my jobactive hat on I
would not be referring any quality Stream Cs to TtW because if they refer them
and TtW gets them into work or further education then TtW gets the results of
that against the Star Ratings, jobactive provider doesn’t. So that’s why I’m saying
there’s a bit of a conflict of interest and I said to the department same thing
yesterday. I said ‘Easy fix would be just to have a dual outcome so both programs
get the outcome.’
(Provider Interview 5)
xiii Commencing in the June 2017 Star Ratings release the department included TtW outcomes towards the Star Ratings of jobactive providers when the referred Stream C participants achieved an outcome in TtW.

Transition to Work Interim Evaluation Report
59
3.5 The appropriateness of the TtW model in helping young people to become job ready
This section examines the alignment of TtW’s aims and objectives with the target group’s needs and
priorities. TtW providers are required to work closely with participants to identify the individual,
group and self-directed activities that are necessary for them to acquire appropriate skills and meet
the 25 hours per week activity requirement. Activities TtW providers typically undertook with their
participants were:
developing a Job Plan
improving the participant’s foundation skillsxiv
helping them develop non-vocational skills
providing career advice
helping them access education and training courses.
According to providers interviewed in the qualitative research, many of the young people in TtW
have multiple individual barriers to employment. These include inability to: read, write or
communicate clearly; focus on work tasks; work in a team; and cope with change. Many young
people also lack work experience, have never worked or have intergenerational unemployment
issues, and often have poor attitudes and low motivation to finding a job.
The Survey of Employers’ Recruitment Experiences, conducted biannually by the department, shows
that employers believe that the employment prospects of young people improve in line with
improvements in their:
attitude to work
responsibility and reliability
presentation
realistic work expectations
work experience
education and training
job search and application skills.
xiv Foundation skills are skills needed to participate in the workplace, in the community and in adult education and training, such as literacy and numeracy, interpersonal skills, motivation and reliability, and willingness to work. The Australian Government funds a number of foundation skills programs, including AMEP and SEE. The Australian Core Skills Framework describes five core skills: learning, reading, writing, oral communication and numeracy.

Transition to Work Interim Evaluation Report
60
Flexibility is necessary if activities are to support the development of all the characteristics listed
above. With this in mind, TtW was developed separately from the mainstream jobactive as a service
to address some of these issues.
Providers agreed that the TtW model was appropriate, improved participants’ work-readiness and
improved their chances of finding and keeping a job. Appropriateness relates to whether a
program’s objectives are relevant to meeting the needs of its target groups. In the TtW Provider
Survey, 97 per cent of respondents agreed or strongly agreed that the TtW model was appropriate
to the target groups, particularly in improving their work-readiness and helping them find and keep a
job (Figure 3.13).
Figure 3.13 Provider views on TtW’s suitability for the target groups
Note: Does not include providers who responded ‘Don’t know/Undecided’, so bars may not add up to 100 per cent.
Source: TtW Provider Survey (2016).
This was supported by qualitative research findings that providers were generally positive about the
design of TtW. Providers reported that the service model allowed them to provide individualised
service to clients, which was important in helping disadvantaged young people.
Having a long history of working in job services, to have something where we can
offer a bit of flexibility and actually sit down and work with a young person is
great.
(Provider Interview 1)
DHS staff also expressed support for a dedicated service for this cohort.
44%
45%
51%
52%
52%
47%
2%
2%
1%
2%
1%
0%
0% 20% 40% 60% 80% 100%
helps participants at high
risk of long-term
unemployment to
improve their chances of
finding and keeping a job
is appropriate for the
target participant group
improves participants’ work-readiness
Extent to which TtW:
Strongly agree Agree Neither disagree nor agree Disagree Strongly disagree

Transition to Work Interim Evaluation Report
61
3.5.1 The TtW service model is flexible and appropriate for engaging young people
Most providers (around 65 per cent) who responded to the TtW Provider Survey indicated that four
weeks to engage and 12 months to increase work-readiness were sufficient time limits. Some
providers advocated for flexibility to extend the service delivery time beyond 12 months.
It is worth noting that the difficulties associated with the early referrals in the implementation phase
may have influenced these figures and that overall satisfaction may increase as TtW becomes more
established.
Around 90 per cent of providers indicated that the service had the flexibility to help participants
transition into work, education or training (Figure 3.14).
I think that’s the best thing with Transition to Work — the flexibility in being able
to work with a young person.
(Provider Interview 9)
Figure 3.14 Provider views on TtW’s flexibility in meeting participant needs
Note: Does not include providers who responded ‘Don’t know/Undecided’, so bars may not add up to 100 per cent.
Source: TtW Provider Survey (2016).
Providers explained that TtW gave them the flexibility to spend more time with each participant,
such as accompanying a participant on cold canvassing visits to local employers (Figure 3.15).
Participants reported feeling more confident of their ability to present themselves to potential
employers as a result of improving their résumés, increasing their interpersonal skills to market
themselves, and dressing appropriately for face-to-face interactions with employers.
32%
33%
35%
37%
58%
58%
55%
56%
3%
5%
6%
3%
5%
4%
4%
0% 25% 50% 75% 100%
address non-vocational barriers
transition to training
transition to education
transition to employment
TtW has sufficient flexibility to meet participants’ need to:
Strongly agree Agree Neither disagree nor agree Disagree Strongly disagree

Transition to Work Interim Evaluation Report
62
I definitely feel more confident in going out there and looking for a job and
everything. As I said I didn’t have a résumé prior to joining them and now that I
do, so yes.
(Participant Focus Group 12)
Figure 3.15 Provider views on TtW’s flexibility in meeting participant and employer
circumstances
Note: Does not include providers who responded ‘Don’t know/Undecided’, so bars will not add up to 100 per cent.
Source: TtW Provider Survey (2016).
While providers used a combination of service approaches the survey data indicates (Figure 3.16)
that 90 per cent of providers assigned a designated consultant to each participant to ensure that
they received tailored and individualised service. Specialist consultants were also available to
participants with specific barriers at 86 per cent of provider sites who responded. In addition, 61 per
cent of the responding providers reported using teleconferencing or telephone servicing with almost
half using self service at least some of the time.
38%
53%
46%
41%
12%
5%
3%
0% 20% 40% 60% 80% 100%
meet the
circumstances of
employers
meet the
circumstances of
participants
TtW allows for more flexible strategies that are appropriately tailored to:
Strongly agree Agree Neither disagree nor agree Disagree Strongly disagree
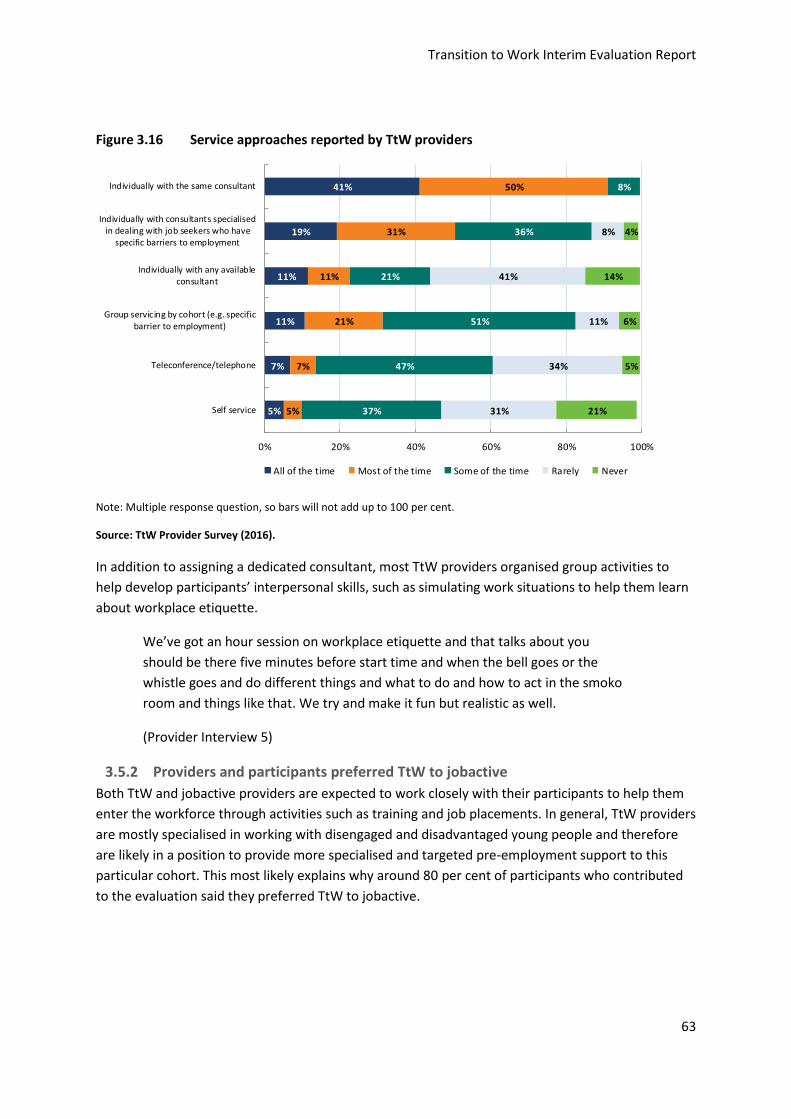
Transition to Work Interim Evaluation Report
63
Figure 3.16 Service approaches reported by TtW providers
Note: Multiple response question, so bars will not add up to 100 per cent.
Source: TtW Provider Survey (2016).
In addition to assigning a dedicated consultant, most TtW providers organised group activities to
help develop participants’ interpersonal skills, such as simulating work situations to help them learn
about workplace etiquette.
We’ve got an hour session on workplace etiquette and that talks about you
should be there five minutes before start time and when the bell goes or the
whistle goes and do different things and what to do and how to act in the smoko
room and things like that. We try and make it fun but realistic as well.
(Provider Interview 5)
3.5.2 Providers and participants preferred TtW to jobactive
Both TtW and jobactive providers are expected to work closely with their participants to help them
enter the workforce through activities such as training and job placements. In general, TtW providers
are mostly specialised in working with disengaged and disadvantaged young people and therefore
are likely in a position to provide more specialised and targeted pre-employment support to this
particular cohort. This most likely explains why around 80 per cent of participants who contributed
to the evaluation said they preferred TtW to jobactive.
5%
7%
11%
11%
19%
41%
5%
7%
21%
11%
31%
50%
37%
47%
51%
21%
36%
8%
31%
34%
11%
41%
8%
21%
5%
6%
14%
4%
0% 20% 40% 60% 80% 100%
Self service
Teleconference/telephone
Group servicing by cohort (e.g. specificbarrier to employment)
Individually with any availableconsultant
Individually with consultants specialisedin dealing with job seekers who have
specific barriers to employment
Individually with the same consultant
All of the time Most of the time Some of the time Rarely Never
Transition to Work Interim Evaluation Report
64
I like that they generally go out of the way to try and find you jobs that you are
going to enjoy instead of just trying to force you to a job that you’re going to hate
and leave anyway. It’s a big difference between getting someone to look for work
they’re not going to like and then being in a job they hate and leaving it, and
having done it all for nothing. A lot of new young persons find a job that they’re
going to want to stay in that is going to help them with their future, and it will be
a job they think that they’re going to keep. Like, it’s a big difference and I really
like that they go out of the way to make sure that they’re looking for something
that you’re comfortable doing, and something that you’re actually going to enjoy.
(Respondent 1, Participant Focus Group 12)
Providers welcomed a different way of operating under TtW than under jobactive — specifically
TtW’s smaller caseloads supported by the funding arrangements, which allowed them to spend
more time with each individual participant.
So with the ability to be able to spend that extra time with them and get to know
them and get to know what it is that they actually do want to do, it makes our job
a lot easier because we’ve got the time to just sit back and ask the questions that
maybe jobactive providers don’t have the time to ask.
(Provider Interview 11)
3.6 Suggestions from stakeholders
Overall the TtW service was positively received by all stakeholders: participants, providers, DHS staff,
peak body representatives, and employers. Stakeholders agreed that the service gives providers the
opportunity to deliver a flexible, holistic service to support a cohort of young people on their path to
employment or further education. While stakeholders were generally satisfied with the TtW service
there were a number of suggestions offered for improving the service.
3.6.1 Support and guidance from the department
Some providers acknowledged that they would have benefited from additional training on using the
department‘s IT system and other resources available to providers. Many providers who had not
previously delivered jobactive services reported that training on the Provider Portal was limited.
These providers said there was insufficient training on using the department’s IT system and learning
resources at the beginning of the contract, other than short webinars and face-to-face training that
assumed some basic knowledge. A majority of providers indicated that, while the program
guidelines were helpful, they would prefer more practical examples of likely situations that could
arise and how to deal with them.
Some providers said that communication between the department and DHS could be improved by
focusing not only on system needs but also on the support needs of TtW participants. Providers also
indicated that they wanted more information from the department about their performance to
enable them to assess how they were performing against other organisations in their regions and
identify where they needed to improve their service.

Transition to Work Interim Evaluation Report
65
Some TtW providers speculated that jobactive providers had a perceived conflict of interest that
may have made them reluctant to refer any suitable young people in Stream C to TtW because they
would lose potential outcome payments. The Department has implemented changes that allow
jobactive providers to count TtW outcomes achieved by their Stream C referrals towards their Star
Ratings from June 2017 onwards.
3.6.2 Suggestions for expanding the service
While most providers supported the different compliance in relation to individual appointments or
activities in TtW, some stakeholders suggested that compliance could be stronger in specific areas of
the service. Providers noted that they often had no option but to exit a non-complying participant
from the service, despite believing that this was not always in the participant’s best interest.
Some providers and participants suggested expanding TtW by raising the age limit for eligibility to
24 or 25 years, to align with the Youth Allowance (Student) payment. Providers also suggested that
some TtW participants with significant labour market barriers would benefit from an extension
beyond 12 months, on a case-by-case basis, to gain the self-confidence, skills and qualifications
needed to reach their educational and employment goals.
A number of stakeholders suggested reducing the waiting period for Group Two participants
significantly or removing it altogether, to allow for direct registration of young people straight from
school. Some providers said that the strict eligibility criteria had contributed to the difficulty in
building the caseload of Group Two participants. Many providers found it difficult to register young
people into Group Two because they were already disengaged after leaving school for three to six
months and have developed behavioural, cognitive and emotional disengagement.
Transition to Work Interim Evaluation Report
66
4 The effectiveness and efficiency of the Transition to Work service in engaging and retaining participants
Key findings
Utilisation of TtW Annual Funded Places (that is occupancy) was influenced by each provider’s
time in operation. The average occupancy rate of caseloads grew from 78 per cent at
31 July 2016 to 117 per cent six months later.
TtW providers had more success in engaging referred young people in services during the first
30 days (93 per cent) than their jobactive counterparts had (83 per cent). TtW providers also
reduced the median time between referral and commencement from 16 days during their first
month of operation to four days by their sixth month.
Over the study period, consistent with the intensive servicing of the TtW program, the median
number of attended contact appointments by TtW participants (7) was more than twice the
median number attended by the jobactive comparison group (3). Despite different compliance
arrangements in jobactive and TtW applying to individual appointments or activitiesxv the
attendance rate at the first initial appointment was higher for TtW participants (77 per cent)
than for young people in the jobactive comparison group (69 per cent). The attendance at
contact appointments was slightly lower (60 per cent for TtW, compared with 63 per cent for the
jobactive comparison group).
Consistent with the intensive activity nature of TtW, the proportion of commencements in
activities was higher for TtW, almost 46 per cent, compared with 19 per cent for the jobactive
comparison group during the six month study period.
Overall, the exit rate over the first six months for commenced participants was higher for the
jobactive comparison group (52 per cent) than for TtW (45 per cent). This was driven by the
higher exit rate of the jobactive comparison group in the first month in service. The jobactive
comparison group not receiving income support payments were more likely to be exited (auto
exit) as ‘no longer fully eligible’, while TtW participants were more likely to be exited from
services as a result of not being contactable by their provider (provider exit). This reflects the
different compliance and design of the two programs as well as providers’ capability to engage
young people.
The aim of this chapter is to explain how efficiently and effectively the TtW service engages with
and retains participants. The analysis focuses on:
the number of participants engaged in TtW compared with the allocation of Annual Funded
Places
xv TtW does not have sanctions of suspending/cancelling income support payments in relation to non-attendance at appointments or activities (as in jobactive). Instead, TtW providers assess the participant’s overall participation and exit them if they do not meet participation requirements.
Transition to Work Interim Evaluation Report
67
whether participants commenced in services, and exits before or after commencement
how quickly participants commenced in the service
which activities participants undertook.
The main data source used in this chapter was the department’s administrative data, augmented by
income support data from the department’s RED. The administrative data analysed related to the
TtW inflow population, comprising all participants referred to the service between
1 February 2016 and 31 July 2016. Comparisons between TtW and jobactive participants used the
matched samples described in Section 2.3.3.
Two snapshots of the caseload population, one at 31 July 2016 and another at 31 January 2017,
were used to assess:
utilisation of TtW Annual Funded Places
distribution of participants in various groups.
The findings from a provider survey and qualitative research (undertaken in October to
December 2016) are included to support the analysis of administrative data where relevant.
4.1 The number of participants engaged in TtW compared with the allocation of Annual Funded Places — caseloads and commencements
4.1.1 Contracts were approved on a rolling basis
Contracts were approved between February 2016 and the end of April 2016 an allocated a start date
in one of the four implementation phases (Figure 4.1).
Once provider sites and start-up dates were confirmed, the department identified young people in
jobactive in each employment region who were eligible for TtW and started referring them to TtW
providers (start-up caseload). There were 82 contracts approved (across 271 sites and
43 organisations) between February and the end of April 2016 that were operational during the first
year of TtW.

Transition to Work Interim Evaluation Report
68
Figure 4.1 Timeline of contracts approved during the implementation phase
Source: Department of Employment, Skills, Small and Family Business administrative data.
4.1.2 Utilisation of Annual Funded Places
The evaluation examined TtW caseloads at two dates, 31 July 2016 and 31 January 2017, to measure
the utilisation of Annual Funded Places. As participants are not allocated to a single funded place,
providers are expected to continue accepting new referrals and recruiting. At any time providers
may have more participants than their allocated Annual Funded Places. When the approval date of
each contract was accounted for, there was a trend for providers whose contracts had been
operating for longer to have a higher percentage of their Annual Funded Places filled as shown in
Figure 4.2 (i.e. they had more time to build their caseload). In fact, the average occupancy rate of
caseloads grew from 78 per cent at 31 July 2016 to 117 per cent six months later.
As is also evident from Figure 4.2, there was still a high degree of variability in the percentage of
Annual Funded Places filled that was not explained by the time in operation. This indicated that
other significant factors specific to contracts were likely to have influenced use of allocated places,
such as the number and timing of young people registering for income support. Other factors such
as the providers’ skill in recruiting disengaged young people (Group Two) and the flow of suitable
Stream C participants from jobactive had a smaller impact.
Additional site-specific factors might have also contributed to the variability, including:
whether they were previously operating as an employment servicesxvi site
the relationships between the provider, DHS and other referring partners
xvi Employment services sites are offices that deliver Australian Government employment services programs.
7
4
28
42
1
0
5
10
15
20
25
30
35
40
45
Nu
mb
er
of
con
trac
ts a
pp
rove
d
Contract approval date and start date
Number of contracts started
Approval date of contracts
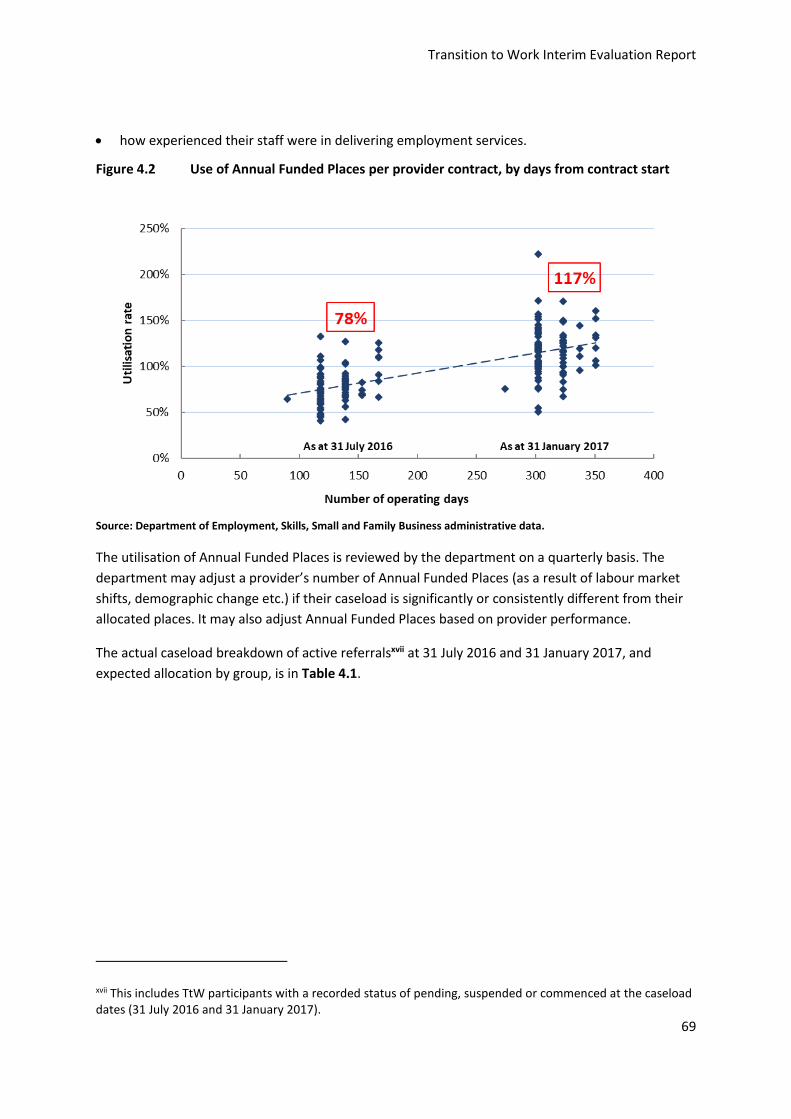
Transition to Work Interim Evaluation Report
69
how experienced their staff were in delivering employment services.
Figure 4.2 Use of Annual Funded Places per provider contract, by days from contract start
Source: Department of Employment, Skills, Small and Family Business administrative data.
The utilisation of Annual Funded Places is reviewed by the department on a quarterly basis. The
department may adjust a provider’s number of Annual Funded Places (as a result of labour market
shifts, demographic change etc.) if their caseload is significantly or consistently different from their
allocated places. It may also adjust Annual Funded Places based on provider performance.
The actual caseload breakdown of active referralsxvii at 31 July 2016 and 31 January 2017, and
expected allocation by group, is in Table 4.1.
xvii This includes TtW participants with a recorded status of pending, suspended or commenced at the caseload dates (31 July 2016 and 31 January 2017).

Transition to Work Interim Evaluation Report
70
Table 4.1 Caseload at 31 July 2016 and 31 January 2017
TtW group Percentage of
caseload at 31 July 2016
Percentage of caseload at
31 January 2017
Projected allocation (%)
Group One (DHS referrals) 91.1 90.6 70.0
Group Two (disengaged young people) 4.9 7.6 20.0
Group Three (jobactive referrals) 4.0 1.9 10.0
Source: Department of Employment, Skills, Small and Family Business administrative data — caseload data.
The proportion of Group Three participants was capped at 10 per cent of the number of Annual
Funded Places. While all providers had filled over 50 per cent of their total Annual Funded Places by
31 January 2017, the majority of the Group Three places had not been filled.
Figure 4.3 Utilisation rates of Group Three Annual Funded Places, 31 July 2016 and
31 January 2017
Source: Department of Employment, Skills, Small and Family Business administrative data.
Figure 4.3 shows a decline in the proportion of Group Three referrals between 31 July 2016 and
31 January 2017. This indicates that there were ongoing issues with achieving the estimated number
of Stream C referrals from jobactive. This downward trend could also be because many providers
had already filled or exceeded their Annual Funded Places with Group One and Group Two
participants and therefore did not consider Group Three referrals to be a priority.
Another reason for the shortfall could have been because the eligible Stream C pool contains a high
proportion of young people with complex needs, who are difficult to place in the labour force and
are therefore considered unsuitable for referral to TtW. The final evaluation report will further
investigate the lower than expected proportion of Group Three referrals.
43%
33%
15%
5% 5%
54%
27%
11%
5% 4%
0%
10%
20%
30%
40%
50%
60%
Below 25% 25% to 49% 50% to 74% 75% to 99% 100% or more
Percentage of Group Three capped places
As at 31 July 2016
As at 31 January 2017

Transition to Work Interim Evaluation Report
71
4.2 Speed of commencement in services
This section examines how quickly young people commenced in TtW, compared with the matched
jobactive inflow population. DHS refers most people who register for income support payments with
Mutual Obligation Requirements to an employment services provider. Young people who register
with DHS and are eligible for TtW are referred for a maximum of 12 monthsxviii of services in TtW
instead of jobactive. Some may still choose to go to jobactive if, for example, the location of
jobactive services is more convenient.
4.2.1 The commencement process
For each TtW group there is a different target for the length of time that can elapse between a
participant’s referral to and initial appointment (commencement) with a provider:
Group One (referred by DHS through RapidConnect, unless granted an exemption) and
Group Three (referred from jobactive) participants must generally commence within two
business days
Group Two (direct entry) participants must generally commence within four weeks of their
referral to services by a TtW provider (or DHS if their income support claim is unsuccessful).
Most of the jobactive comparison population were referred by DHS though RapidConnect and were
expected to commence within two business days.
The following analysis is restricted to young people in the study groups who had commenced
services in the first 30 days after referral.
4.2.2 Lags between referral and commencement were initially very large but decreased
rapidly
The analysis was aligned to when the provider contract started rather than when the TtW service
started.xix By allowing the evaluation to examine the time elapsed between referral and
commencement over each contract’s first six months of operation, this avoided conflating
commencement lags under established contracts with those under contracts that were just starting.
xviii Participants tracking towards an outcome after 12 months of services remains in TtW until they achieve or are no longer eligible for the outcome they are tracking towards. Young people receiving an activity tested income support payment are referred back to jobactive while other participants are exited from the TtW service. xix For a provider that started in Phase One (February 2016), April was the third month of operation; for a provider that started in Phase Three (April 2016), July was the third month of operation.

Transition to Work Interim Evaluation Report
72
Figure 4.4 Median days from referral to commencement, by month from TtW provider
contract start
Source: Department of Employment, Skills, Small and Family Business administrative data.
Figure 4.4 shows the median time to commencement for TtW participants referred during the inflow
period who commenced during the first 30 days.
As expected, early referrals from jobactive from the contract approval date and often before the
actual contract start date, to allow for a start-up caseload, contributed to the large lags from referral
to commencement during the first months of operation across all contracts. DHS staff interviewed
for the qualitative research reported difficulties in finding appointment slots with TtW providers in
the required timeframe during the early days of operation.
Responses from the TtW provider survey highlighted initial communication issues with DHS, as well
as incorrect contact details and inappropriate referrals for many in the starting caseload. Around
40 per cent of surveyed providers reported that fewer than half of the people in their referred
caseload in the first month of operation were eligible for TtW. Only 14 per cent reported similar
issues with their most recent referrals at the time of the survey, in October and November 2016. The
reasons given were discussed in Section 3.2.2.
The median time between referral and commencement reduced significantly over the study period
and was down to four days by the provider’s sixth month of operation.
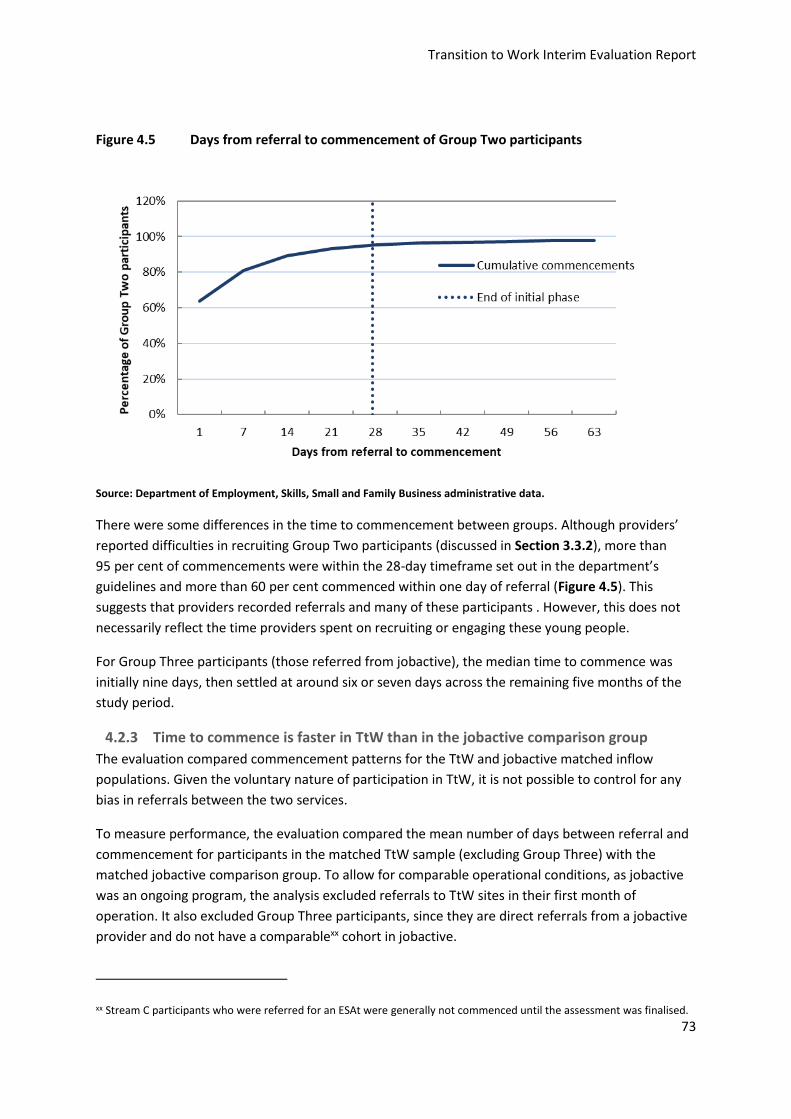
Transition to Work Interim Evaluation Report
73
Figure 4.5 Days from referral to commencement of Group Two participants
Source: Department of Employment, Skills, Small and Family Business administrative data.
There were some differences in the time to commencement between groups. Although providers’
reported difficulties in recruiting Group Two participants (discussed in Section 3.3.2), more than
95 per cent of commencements were within the 28-day timeframe set out in the department’s
guidelines and more than 60 per cent commenced within one day of referral (Figure 4.5). This
suggests that providers recorded referrals and many of these participants . However, this does not
necessarily reflect the time providers spent on recruiting or engaging these young people.
For Group Three participants (those referred from jobactive), the median time to commence was
initially nine days, then settled at around six or seven days across the remaining five months of the
study period.
4.2.3 Time to commence is faster in TtW than in the jobactive comparison group
The evaluation compared commencement patterns for the TtW and jobactive matched inflow
populations. Given the voluntary nature of participation in TtW, it is not possible to control for any
bias in referrals between the two services.
To measure performance, the evaluation compared the mean number of days between referral and
commencement for participants in the matched TtW sample (excluding Group Three) with the
matched jobactive comparison group. To allow for comparable operational conditions, as jobactive
was an ongoing program, the analysis excluded referrals to TtW sites in their first month of
operation. It also excluded Group Three participants, since they are direct referrals from a jobactive
provider and do not have a comparablexx cohort in jobactive.
xx Stream C participants who were referred for an ESAt were generally not commenced until the assessment was finalised.

Transition to Work Interim Evaluation Report
74
The majority of the referred participants who started before 31 August 2016 appeared to have
commenced within 30 days (Figure 4.6). A similar proportion (35 per cent for TtW compared with
31 per cent for the jobactive comparison) commenced over the first two days (i.e. met the
RapidConnect provisions). However, the proportion of referrals commenced within thirty days was
consistently higher in TtW.
Figure 4.6 Cumulative percentage of commencements within 30 days, by days from referral
Note: TtW contracts were quarantined for the first month of operation, to allow a valid comparison with the jobactive comparison.
Source: Department of Employment, Skills, Small and Family Business administrative data.
While certain unforeseen circumstances may have caused commencement delays for some
participants, the analysis shows that TtW providers had more success in commencing young people
in services during the first 30 days (93 per cent) than jobactive providers (83 per cent). Controlling
for participants with an ESAt referral in the jobactive sample did not account for the difference.
There are many reasons why young people referred to both programs do not commence in services,
such as finding a job, their income support claim rejected or withdrawn or other changes in their
personal circumstances. Young people referred to jobactive who are not yet receiving income
support payments are placed as Stream A (Volunteer) and do not have a mutual obligation
requirement so must elect to participate as a volunteer. This may influence the timing of their
commencement in services. As all referrals to TtW have the same participation requirement based
on their particular circumstances and receive the same service, their income support status is less
relevant.
Transition to Work Interim Evaluation Report
75
This early evidence points to TtW meeting its objective of targeting and engaging a cohort of young
people in services to improve their work-readiness and help them find work. A more comprehensive
analysis will be carried out for the final evaluation of TtW when additional data becomes available.
4.3 Appointments and activities
All participants in TtW and the jobactive comparison group attended at least one initial appointment
before commencement. After this, they kept in contact with their provider through group
appointments, telephone, email or SMS, plus individual appointments. Individual appointments with
the provider (including the outcomes of these appointments) were captured in the ESS
administrative datasets.
As TtW is a more intensive and tailored service, TtW participants had more appointments and
contact with their providers than participants in the jobactive comparison group. TtW providers are
required to maintain regular contact with each participant to monitor their progress against agreed
participation requirements and activities agreed in their Job Plans. Providers will work with the
participants to develop strategies to overcome issues that affect participation, such as changing the
mix of activities, renegotiating activity requirements, advising the participant to contact DHS to test
their eligibility for an exemption, applying a suspension period, or directing the participant to other
relevant services for specialised assistance. If these attempts fail without any valid reasons from the
participant, they will then be exited from TtW.
Participants in the jobactive comparison group may have their income support payments suspended
by DHS if they fail to meet their mutual obligation requirements, such as missing appointments
without a valid reason, mutual obligation breaches, failure to submit job search or attend reasonable
activities as set out in their Job Plan. Their payments will only be re-instated once they attend a re-
engagement appointment with their jobactive provider.
4.3.1 TtW providers engaged more frequently with participants over the six months
following the initial appointment
Table 4.2 shows that a higher proportion of participants in TtW than in the jobactive comparison
group attended their first initial scheduled appointment after which they were commenced in
services. For jobactive referrals with a mutual obligation requirement non-attendance at their initial
appointment without a valid reason may result in compliance action such as suspension of their
income support. This means that 17 per cent were subject to compliance action before they
commenced and were required to attend a re-engagement appointment to have an income support
payment suspension lifted. For this group their first appointment is recorded as a re-engagement
appointment in the IT system.

Transition to Work Interim Evaluation Report
76
Table 4.2 Initial appointment attendance rates for participants who commenced within
30 days of referral, comparing TtW and the jobactive comparison group
Appointment(s) attended before commencement TtW
(%)
jobactive
comparison
(%)
Initial appointments — —
First initial appointment attended 76.8 69.3
Rescheduled initial appointments attended 23.2 13.7
Proportion of participants who attended at least one 100.0 83.0
Re-engagement appointments (jobactive comparison group only) — —
First re-engagement appointment attended n.a. 15.6
Rescheduled re-engagement appointments attended n.a. 1.4
Proportion of participants 100.0 100.0
n.a. = not applicable, as participation in TtW is not subject to compliance mechanisms to suspend, cancel or apply a penalty to income support payments. Seventeen per cent of jobactive first attended appointments were re-engagement appointments.
Source: Department of Employment, Skills, Small and Family Business administrative data — matched inflow
populations.
The following analysis focuses on the number of subsequently booked and attended contact
appointments for TtW and jobactive referrals over the 180-day period following participants’
commencement (or a shorter period if the participant exited services during the tracking period).
Despite different compliance arrangements in relation to individual appointments or activitiesxxi in
TtW, the median attendance rate for ongoing contact appointments for both services was over
60 per cent (Table 4.3). The median number of attended contact appointments for TtW was more
than twice that for jobactive.xxii
xxi TtW providers must monitor participation to ensure participants meet their mutual obligation requirements. If a participant fails to meet these requirements, the provider must exit and refer them to jobactive. xxii The analysis of contact appointments excludes re-engagement appointments relating to compliance actions in jobactive, as there are no comparable actions in TtW. jobactive participants attended, on average, two additional re-engagement appointments. Non-attendance without a valid reason in TtW may result in a referral back to jobactive.

Transition to Work Interim Evaluation Report
77
Table 4.3 Appointments attended in the first 180 days from commencement, comparing TtW
and jobactive
Appointment type Median number attended Median attendance rate
TtW contact appointments attended 7 60%
jobactive contact appointments attended 3 63%
Note: jobactive re-engagement appointments are not included (see footnote below).
Source: Department of Employment, Skills, Small and Family Business administrative data — matched inflow
populations.
The evaluation showed that at least 50 per cent of participants attended face-to-face meetings with
their TtW providers on a monthly basis (on average), compared with every two months for
participants in the jobactive comparison group.
TtW providers indicated during the qualitative research that individual face-to-face discussions with
young people were the most effective way to build rapport and gain their confidence.
So you’d have to look at everything that that person is interested in, and we
spend a lot of time looking at what are their interests, and we have different
ways of finding out what their interests are, what their experiences are, and have
they been exposed to different workplaces? Or are they only familiar with what
they know because of their family or a friend works in that area? And why don’t
we go and show you different workplaces so you can see this is what it’s like.
(Provider Interview 7)
I like [my TtW provider]. Their goal is to actually help you. Because a lot of
[jobactive] job providers that I’ve been with, they’re just there to get you a job
and then they’re out. You’re just another number, whereas with [my TtW
provider] they care.
(Participant Focus Group 2)
4.3.2 Consistent with the service design, TtW participants engage in more activities
than participants in the matched jobactive comparison group
While both TtW and jobactive are designed to move job seekers into work, TtW providers have a
greater flexibility on how this is achieved. The objective of TtW is to enable providers more flexibility
to work with young people who were primarily early school leavers to improve their work-readiness,
through an intensive 12-month pre-employment support service. Providers are expected to place
participants in 25 hours per week of activities, including attending appointments, education and
training, employment, work experience placements and engagement with relevant local community
services, to maximise their chances of getting a job.
By comparison, early school leavers in the jobactive matched inflow sample, unless engaged in study
to gain a Year 12 certificate or equivalent qualification, were expected to participate in other

Transition to Work Interim Evaluation Report
78
approved activities for 25 hours per weekxxiii , including job search (generally 20 job applications per
month).
The analysis of activity placements focused on matched inflow samples for TtW and jobactive who
had commenced by the end of August 2016. Each participant was followed for 180 days from
commencement (or until an exit is recorded).
The proportion of placements in a confirmed activity was higher for TtW participants —
45.8 per cent, compared with 18.9 per cent per participant for the jobactive comparison group
during the study period (Figure 4.7).
Figure 4.7 Number of activities per participant in the first 180 days* from commencement
* If the participant exited before 180 days, the activities recorded only apply to their days in employment services.
Source: Department of Employment, Skills, Small and Family Business administrative data — matched inflow
populations.
TtW participants also engaged in a greater number of activities over the study period. This was not
unexpected given the intensive servicing in TtW and the greater focus by providers on getting TtW
participants to undertake activities to improve their work readiness.
Figure 4.8 shows the distribution of time taken for participants undertaking an activity to record a
confirmed placement in their first activity during the first 180 days from commencement. Of the
young people with a confirmed activity placement, participants in TtW engaged in their first activity
xxiii Principal carer parents and those with a partial capacity to work of 15 to 29 hours per week are expected to participate in approved activities for 15 hours per week.

Transition to Work Interim Evaluation Report
79
sooner than the jobactive matched cohort (75 per cent within the first 60 days, compared with
62 per cent).
Figure 4.8 Timing of first recorded participant activity
Source: Department of Employment, Skills, Small and Family Business administrative data — matched inflow
populations.
Both models allow for funding of participation in activities for early school leavers. While upfront
administrative funding for jobactive is low, jobactive providers can access the Employment Fund to
purchase goods and services to help participants overcome barriers to employment. This separate
funding source is not available to TtW providers, as the higher up-front payment is expected to cover
participation in approved activities. TtW providers can also use sustainability and bonus outcome
payments achieved to help fund activities for participants.
4.3.3 TtW offers a wider range of options to meet activity requirements
While the aim of TtW is to increase employability, employment outcomes are not the only focus,
TtW providers have more flexibility in the range of activities participants can participate in. In
addition to paid employment, activities included a wider range of education and training activities,
non-vocational assistance (for issues such as substance use and homelessness), and work-like
activities such as volunteering and work experience. The following analysis looks at the types of
activities participants undertook in the TtW and jobactive matched inflow samples.
More TtW participants were placed in all types of activities, with the exception of Work for the Dole,
which is not available in TtW. Work for the Dole activities are part of the Work for the Dole phase in
jobactive and may be undertaken usually after 12 months in services (previously six months).
Figure 4.9 shows that the distribution of placements across the types of activities differs between
TtW and jobactive. Early school leavers in TtW were more likely, than those in the jobactive
comparison group, to be placed in non-accredited education and training (i.e. preparatory education
45.7%
54.6%
16.7%
20.8%11.9%
11.3%
25.8%13.3%
0%
20%
40%
60%
80%
100%
jobactive TtW
Pe
rce
nta
ge o
f ac
tivi
ty p
lace
me
nts
180 days
90 days
60 days
30 days

Transition to Work Interim Evaluation Report
80
to address barriers before seeking work or further education) during the study period. Almost 44 per
cent of activities undertaken by TtW participants were for non-accredited training and other
preparatory education, compared to the jobactive comparison group (24 per cent)xxiv.
While participation in these activities does not qualify for an education outcome, this suggests that
TtW providers focus on addressing barriers in the first six months of the 12 month service period to
improve the work-readiness of participants. TtW providers can use their up-front payments as well
as any bonus and sustainability outcome payments achieved to assist participants with the cost of
undertaking these activities to meet their education and employment goals.
Young people in the jobactive comparison group, while having a lower rate of participation in
activities, were more likely to undertake accredited vocational education and training. This aligns
with education outcome payments in jobactive for young people completing further study being
restricted to attaining a Year 12 or equivalent qualification. jobactive providers can also claim the
cost of work-related accredited education and training activities for participants from the
Employment Fund where there is a likelihood of securing a job. Young people in jobactive with
recorded activities were also more likely to be participating in other government programs and part-
time or casual employment.
xxiv With the introduction of the PaTH Employability Skills Training (EST) from April 2017 this difference is expected to reduce.
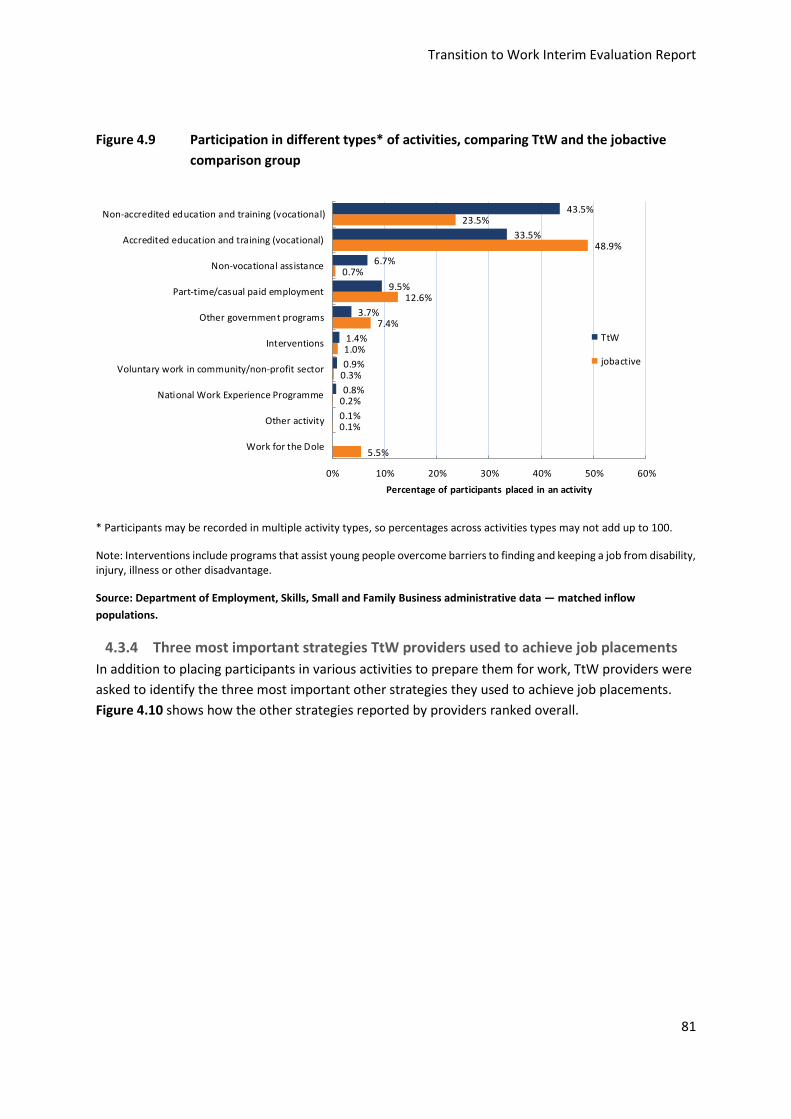
Transition to Work Interim Evaluation Report
81
Figure 4.9 Participation in different types* of activities, comparing TtW and the jobactive
comparison group
* Participants may be recorded in multiple activity types, so percentages across activities types may not add up to 100.
Note: Interventions include programs that assist young people overcome barriers to finding and keeping a job from disability, injury, illness or other disadvantage.
Source: Department of Employment, Skills, Small and Family Business administrative data — matched inflow
populations.
4.3.4 Three most important strategies TtW providers used to achieve job placements
In addition to placing participants in various activities to prepare them for work, TtW providers were
asked to identify the three most important other strategies they used to achieve job placements.
Figure 4.10 shows how the other strategies reported by providers ranked overall.
5.5%
0.1%
0.2%
0.3%
1.0%
7.4%
12.6%
0.7%
48.9%
23.5%
0.1%
0.8%
0.9%
1.4%
3.7%
9.5%
6.7%
33.5%
43.5%
0% 10% 20% 30% 40% 50% 60%
Work for the Dole
Other activity
National Work Experience Programme
Voluntary work in community/non-profit sector
Interventions
Other government programs
Part-time/casual paid employment
Non-vocational assistance
Accredited education and training (vocational)
Non-accredited education and training (vocational)
Percentage of participants placed in an activity
TtW
jobactive

Transition to Work Interim Evaluation Report
82
Figure 4.10 TtW provider views on the most important job placement strategies
Source: TtW Provider Survey (2016).
Preparing participants for work was used by 74 per cent of providers as a strategy to get job
placements. The next two most commonly reported strategies were preparing participants for
interviews and providing post-placement support. Understanding employer needs, maintaining
relationships with employers and promoting the skills of participants were also identified as
important strategies for placing young people in jobs.
4.4 Whether referred participants left before completing 12 months of services
Young people referred to TtW who left before completing 12 months of services can be categorised
into two groups:
exits before commencement (non-commencements)
exits after commencement (exits from services).
4.4.1 Non-commencements
To measure the rate of non-commencement, the evaluation examined the proportion of referred
participants who did not commence within the first three months after referral (Figure 4.11).
37.4%
38.7%
39.5%
40.3%
45.0%
74.0%
0.0% 20.0% 40.0% 60.0% 80.0% 100.0%
Promoting the skills of participants
Maintaining relationships with employers
Understanding employer needs
Providing post-placement support
Preparing participants for interviews
Preparing participants for work
Percentage of providers

Transition to Work Interim Evaluation Report
83
There are many reasons why potential participants do not commence, including having their claim
for income support rejected; withdrawing their claim; electing to return to full-time study; being
referred to another service;xxv or finding a job.
Figure 4.11 Percentage of referred participants who did not commence, by month from
referral, comparing TtW and jobactive
Source: Department of Employment, Skills, Small and Family Business administrative data — matched inflow
populations.
While the differences between the non-commencement rates in the first two months after referral
for TtW and jobactive were significant, there was no meaningful difference between the overall
non-commencement rates in TtW (27.5 per cent) and jobactive (27.6 per cent) at three months from
referral to services.
Non-commencements for jobactive were predominantly recorded in the first month following
referral, while TtW non-commencements were recorded mostly during the first two months. The
greater lag in time for TtW non-commencements to be recorded reflected the greater flexibility TtW
providers had to engage participants due to the different compliance arrangementsxxvi applying to
individual appointments or activities in TtW.
For most young people registering for unemployment benefits with DHS, failure to engage with their
jobactive provider (attend an initial appointment without a valid reason recorded) during the first
month would normally result in an automatic cancellation of their income support claim and exit
xxv Young people who are referred to TtW may elect to go to another service such as jobactive or Disability Employment Services instead of commencing in TtW. This was not accounted for in this analysis. xxvi Recent changes to compliance means an income support payment is not paid until an initial appointment is attended.
14%
11%
3% 3%
19%
6%
3%
6%
0.0%
4.0%
8.0%
12.0%
16.0%
20.0%
1st month 2nd month 3rd month Not commenced or
exited 3 months after
referral
Pe
rce
nta
ge o
f re
ferr
als
no
t co
mm
en
ced
TtW
jobactive

Transition to Work Interim Evaluation Report
84
from employment services, unless they elect to continue in the service as a volunteer. Servicing in
TtW remained the same regardless of the young person’s income support status.
4.4.2 Exits from services
Exits for non-employment reasons from TtW after commencement, particularly in the early months,
partly reflected the provider’s ability to successfully engage young people in the service
(Figure 4.12).
Figure 4.12 Percentage of commenced participants who exited, by month from
commencement, comparing TtW and jobactive
Source: Department of Employment, Skills, Small and Family Business administrative data — matched inflow
populations.
During the first month after commencement, young people in jobactive had an exit rate more than
double that of the matched TtW group, but the exit rates for the two groups were similar over the
next five months. Young people exited services during the early months for many reasons, including
finding a job; starting full-time study; having their income support claim rejected; withdrawing their
claim; and other changes in circumstances. Overall the exit rate over the first six months was higher
for the jobactive comparison group (52 per cent) than for TtW (45 per cent), driven by the higher
exit rate during the first month in services.
The greater focus in TtW on individualised pathways for young people that combine education and
training with paid work is likely to result in some attachment effect for TtW participants in the
shorter term. The longer term outcomes for TtW participants will be examined in the final evaluation
report.
7%
10%
9%
7%6%
5%
16%
10%
8%
7%
5% 5%
0%
4%
8%
12%
16%
20%
1st month 2nd month 3rd month 4th month 5th month 6th month
Pe
rce
nta
ge o
f co
mm
en
ced
par
tici
pan
ts e
xite
d
TtW
jobactive

Transition to Work Interim Evaluation Report
85
4.4.3 Reasons for not completing 12 months in TtW
This section examines the reasons why young people did not commence the services, or exited after
commencing.
For young people who did commence, TtW referrals were much more likely than the matched group
in jobactive to not commence services as a result of not being contactable (Figure 4.13). Young
people, receiving an activity-tested income support payment, who failed to attend an initial
appointment without a valid reason and did not commence were referred to jobactive by their TtW
provider.
Figure 4.13 Reasons for non-commencement in the first three months from referral,
comparing TtW and the jobactive comparison group
Source: Department of Employment, Skills, Small and Family Business administrative data — matched inflow
populations.
Jobactive referrals, on the other hand, had high rates of non-commencements recorded as ‘no
longer fully eligible participant for the program’ or ‘changed service’ in the first three months after
referral. Many of these were likely to be cases where a young person’s application for income
support was declined or withdrawn after they were referred to an employment service provider.
Unless they elected and were eligible to participate as a volunteer, these young people would not
have stayed in jobactive. Others may have found a job or taken up full-time study. This possibly
reflects a ‘referral effect’ whereby a greater proportion of jobactive job seekers found employment,
commenced study or elected not to participate in the program.
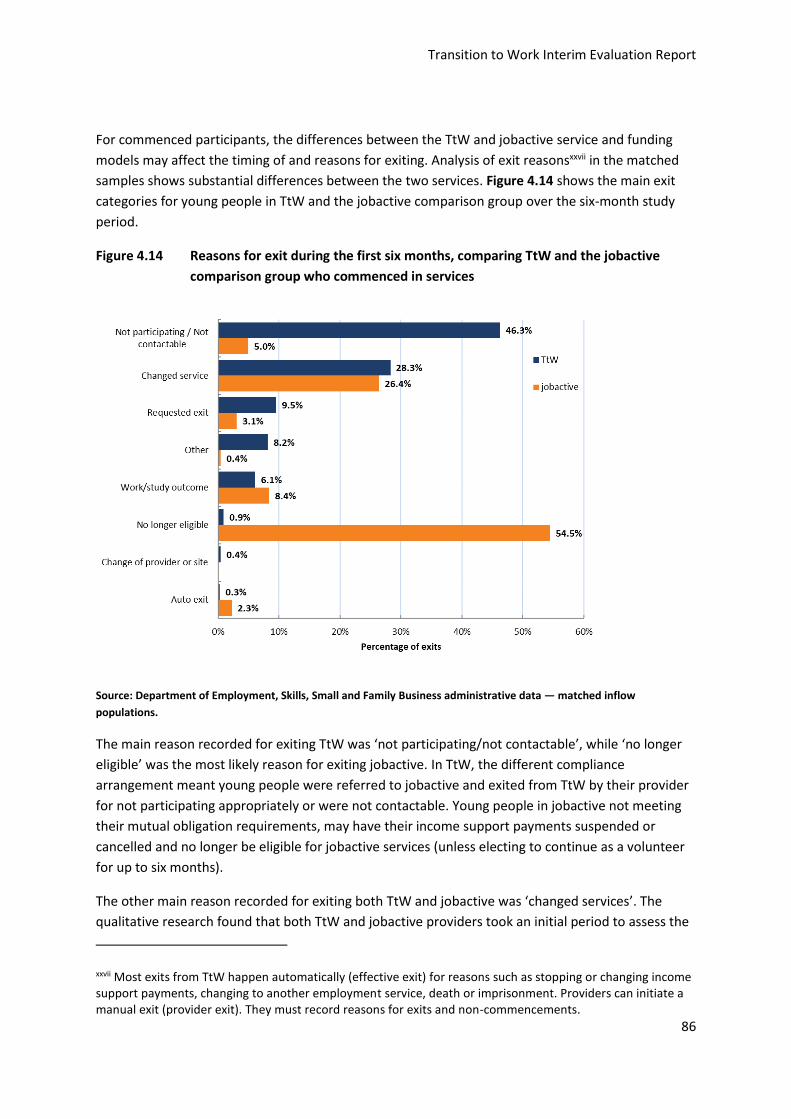
Transition to Work Interim Evaluation Report
86
For commenced participants, the differences between the TtW and jobactive service and funding
models may affect the timing of and reasons for exiting. Analysis of exit reasonsxxvii in the matched
samples shows substantial differences between the two services. Figure 4.14 shows the main exit
categories for young people in TtW and the jobactive comparison group over the six-month study
period.
Figure 4.14 Reasons for exit during the first six months, comparing TtW and the jobactive
comparison group who commenced in services
Source: Department of Employment, Skills, Small and Family Business administrative data — matched inflow
populations.
The main reason recorded for exiting TtW was ‘not participating/not contactable’, while ‘no longer
eligible’ was the most likely reason for exiting jobactive. In TtW, the different compliance
arrangement meant young people were referred to jobactive and exited from TtW by their provider
for not participating appropriately or were not contactable. Young people in jobactive not meeting
their mutual obligation requirements, may have their income support payments suspended or
cancelled and no longer be eligible for jobactive services (unless electing to continue as a volunteer
for up to six months).
The other main reason recorded for exiting both TtW and jobactive was ‘changed services’. The
qualitative research found that both TtW and jobactive providers took an initial period to assess the
xxvii Most exits from TtW happen automatically (effective exit) for reasons such as stopping or changing income support payments, changing to another employment service, death or imprisonment. Providers can initiate a manual exit (provider exit). They must record reasons for exits and non-commencements.

Transition to Work Interim Evaluation Report
87
needs and preferences of some job seekers before directing them back to DHS for assessment and
referral for a more appropriate or preferred employment service including the Disability
Employment Service (DES) during the early months. Many referrals to another service were between
TtW and jobactive driven by factors such as participants locating to different region or a change in
the participant’s circumstances. Referrals to DES were around one per cent of the exit reasons
recorded.
TtW participants were more likely than those in the jobactive comparison group to ‘request to exit’,
as TtW is not compulsory while jobactive is.xxviii TtW participants with Mutual Obligation
Requirements would be exited and referred to jobactive by their provider if they asked to exit, while
a ‘request to exit’ from jobactive would usually result in the suspension or cancellation of income
support paymentsxxix.
The intensive servicing and different compliance in relation to individual appointments or activities
in TtW made it difficult for providers to initially engage some young people. Providers interviewed in
the qualitative research reported that many participants initially displayed a relatively high level of
disengagement and little knowledge of the TtW service. Young people in the focus groups reported
that they had initially mistrusted TtW providers but now felt that the providers were helping them in
any way they could to achieve their goals.
TtW providers generally indicated that they had made a number of attempts to engage and to keep
a participant in services before exiting them for not engaging appropriately.
Yeah, we’ve exited a few. So, we’ve exited a few in [Place] and [Place], just for
just non-attendance at all, haven’t heard from them, just totally off the radar,
that sort of thing. That’s really the only time. If they’re not turning up to
workshops or the job search hubs or appointments with me and we can’t get hold
of them, things like that. Well, we’ve tried. And we are patient, we do try. And we
do text, ring, send letters but there’s only so much you can do as well. And then
we send out an exit letter.
(Provider Interview 17)
Further analysis of the main reasons for exiting, by month from commencement, showed very
different patterns for the two services (Figure 4.15 and Figure 4.16).
xxviii Only job seekers who volunteer to participate in jobactive have the option to request to exit. xxix Only suitable jobactive Stream C participants are eligible to be referred to TtW.
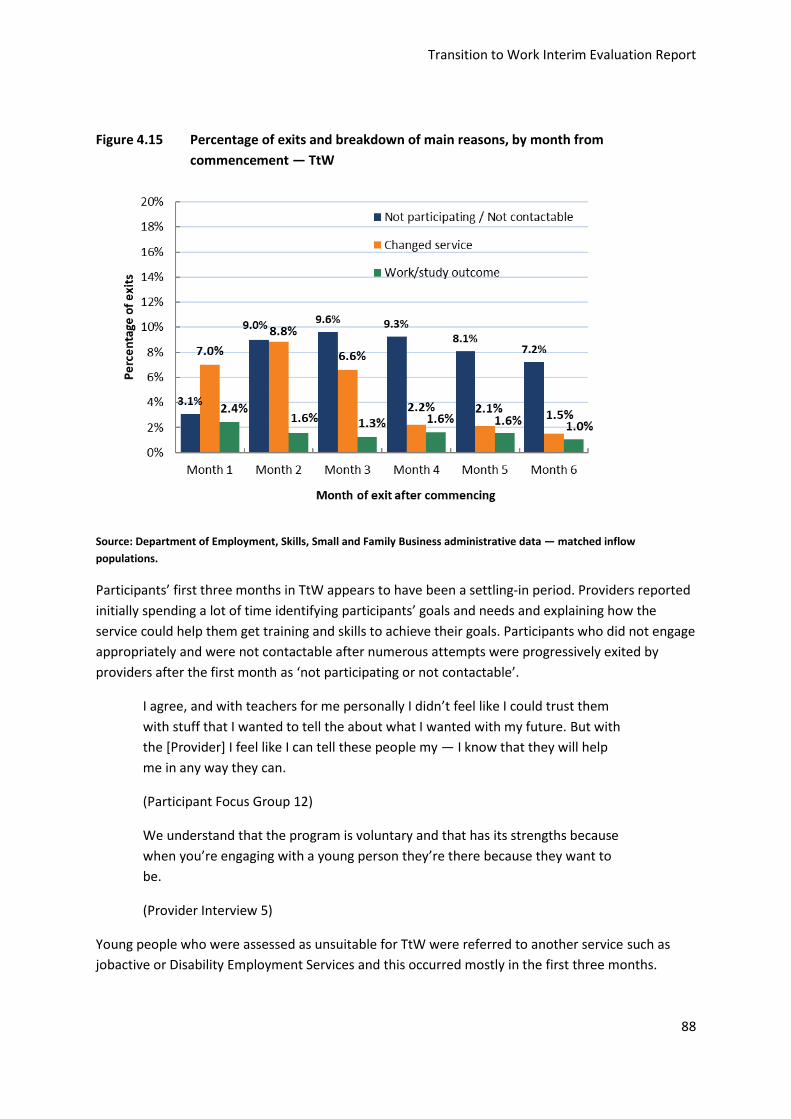
Transition to Work Interim Evaluation Report
88
Figure 4.15 Percentage of exits and breakdown of main reasons, by month from
commencement — TtW
Source: Department of Employment, Skills, Small and Family Business administrative data — matched inflow
populations.
Participants’ first three months in TtW appears to have been a settling-in period. Providers reported
initially spending a lot of time identifying participants’ goals and needs and explaining how the
service could help them get training and skills to achieve their goals. Participants who did not engage
appropriately and were not contactable after numerous attempts were progressively exited by
providers after the first month as ‘not participating or not contactable’.
I agree, and with teachers for me personally I didn’t feel like I could trust them
with stuff that I wanted to tell the about what I wanted with my future. But with
the [Provider] I feel like I can tell these people my — I know that they will help
me in any way they can.
(Participant Focus Group 12)
We understand that the program is voluntary and that has its strengths because
when you’re engaging with a young person they’re there because they want to
be.
(Provider Interview 5)
Young people who were assessed as unsuitable for TtW were referred to another service such as
jobactive or Disability Employment Services and this occurred mostly in the first three months.

Transition to Work Interim Evaluation Report
89
Figure 4.16 Percentage of exits and breakdown of main reasons, by month from
commencement — jobactive
Source: Department of Employment, Skills, Small and Family Business administrative data — matched inflow
populations.
Most jobactive exits occurred in the first month, when around 20 per cent left the program as they
were ‘no longer eligible’. The category tended to be a catch-all for young people failing to engage for
many reasons, including an income support claim being rejected or withdrawn; a change in
circumstances; a return to full-time study; or finding a job. Figure 4.16 shows that jobactive
providers were also more likely to refer young people to another employment service during the
first two months after commencement.
The final evaluation report will examine the characteristics of participants who exited over the full
12 months of the TtW service.
19.3%
8.4% 8.1%6.9% 6.6%
5.1%
8.7%8.1%
4.5%
2.5%1.6%
1.1%2.4%
1.8% 1.6% 1.3%0.7% 0.6%
0%
2%
4%
6%
8%
10%
12%
14%
16%
18%
20%
Month 1 Month 2 Month 3 Month 4 Month 5 Month 6
Pe
rce
nta
ge o
f e
xits
Month of exit after commencing
No longer eligible
Changed service
Work/study outcome
Transition to Work Interim Evaluation Report
90
5 Early impacts and outcomes achieved for Transition to Work participants
Key findings
At the end of March 2017 a total of 4716 outcomes had been achieved across the commenced
TtW population, of which 3729 were employment outcomes.
The higher rate of employment outcomes (79 per cent) than education and hybrid outcomes is
likely to reflect the provider focus, as well as to have been driven by the length of the evaluation
study period (six months from a participant’s referral to the service) and the 12-week minimum
timeframe to achieve an employment outcome. Education outcomes, on the other hand, have a
26-week (or completion of studies) timeframe.
Almost 39 per cent of TtW participants undertook education and training activities, which
accounted for 81 per cent of all activities during the study period. A Certificate III qualification,
which can qualify for an education outcome, was the main type of education and training
activity.
TtW provider performance against quarterly allocated Outcome Performance Targets improved
with time in operation. More than 50 per cent of all contracts were meeting their quarterly
targets by the end of March 2017.
The proportion of participants who reported earnings was similar in TtW to that in the matched
jobactive sample after six months in the service, but it increased over the study period at a
slightly faster rate in TtW.
TtW participants had a higher labour market attachment rate (33 per cent) than participants in
the jobactive comparison group (28 per cent). This measure seeks to capture the numbers of
participants who have achieved an employment outcome and left income support, as well as
those reporting earnings to DHS.
The combined positive outcome measure, which included participants studying in education
courses qualifying for an TtW outcome payment as well as the employment indicators, was
higher for TtW participants (42 per cent) than for participants in the jobactive comparison group
(33 per cent).
This chapter focuses on the early impacts of the TtW service. Levels of engagement and rates of
progression towards an education qualification or an exit from income support into paid work are
often hard to measure. The evaluation used a range of measures to provide an early indication.
Section 5.1 covers early perceptions of providers and participants recorded in qualitative fieldwork
undertaken during October to December 2016. Section 5.2 discusses Outcome Performance Targets
and early progress towards those targets. Section 5.3 looks at six core outcomes achieved during the
first year of the TtW service. Section 5.4 deals with a number of additional measures constructed
from administrative data for comparison with jobactive. These were designed to capture labour
market attachment (which measures engagement in some paid employment) and education
Transition to Work Interim Evaluation Report
91
participation, recognising the variety of pathways in TtW to paid employment. Most of the analyses
of outcomes are descriptive as the outcome payment structure in jobactive and TtW is different and
not directly comparable. The evaluation used the TtW population and matched jobactive inflow
populations described in Section 2.3.2 for comparisons where possible between the programs.
Where logistic regression analysis was undertaken, the results are summarised in Appendix F.
5.1 Early perceptions of the impacts of the TtW service
While obtaining an education qualification or moving from income support into paid work
represents the ultimate TtW outcome, the pathway for disadvantaged youth towards achieving their
goals starts with their willingness to engage with the service. Analysing providers’ perceptions of
progress towards outcome targets and young people’s perceptions of progress towards their goals
provides information on the early impacts of the TtW service.
Young people spoke of ‘goal setting’ as a welcome component of TtW and as something they had
not previously had the opportunity to consider or discuss. They also welcomed the tailored support
the service offered.
Just the help that there’s actually someone there to step you through it because I
know a lot of us go through it and we don’t know where to start and where to go
and what steps to take so I think that’s a big help.
(Participant Focus Group 7)
[Name]’s given me a little bit more confidence in myself. She’s sat there and
spoke to me about a few things because I was going downhill, kind of thing, and
she sort of brought me back up and made me feel confident again. So that’s a
good thing.
(Participant Focus Group 8)
Providers’ comments focused more on the differing needs of participants and on progress towards
sustainable outcomes.
They can actually start to see that I’m getting somewhere, little goals and
consistent work every week on activities, I’m actually moving forward, I’m getting
closer to getting into study or to getting a job and they’re meeting people and
feeling better and themselves
(Provider Focus Group 14)
With a boy the other week, he said, ‘I’ve not done anything. I did a week’s work
experience and I did this and I did that.’ And then by the time we’d made up a
two-page resume, and he went, ‘Oh, well I actually have done quite a bit.’
(Provider Interview 10)
Transition to Work Interim Evaluation Report
92
Providers and participants both said that TtW provided the opportunity for early identification of
personal and financial problems. They noted that timely assistance was crucial to avoid participants
falling into a downward cycle that disrupted their participation in education and employment.
5.2 Outcome Performance Targets in TtW
Outcome Performance Targets are the benchmark for provider performance in TtW. The TtW service
agreement requires providers to achieve a specified number of outcomes (excluding Youth Jobs
PaTH internship outcomes and sustainability outcomes). This number is the provider’s annual
Outcome Performance Target. The provider receives a bonus outcome payment of $3500 for every
outcome achieved above the target. The annual target is distributed across the four quarters of the
financial year. Providers’ performance is assessed each quarter against the quarterly allocation.
5.2.1 Outcome Performance Targets progressively increased over the first year to
reflect the time needed for providers to build their caseloads and achieve
outcomes
The allocated annual Outcome Performance Targets were discounted quarterly over the first year of
operation in line with the expectation that providers would have commenced 75, 85, 90 and 100 per
cent of their Annual Funded Places by the end of each of the first four quarters of the
2016-17 financial year as their caseload increased.
No contracts had targets for the March quarter 2016, as the first phase of TtW contracts did not
start until midway through this period. The June quarter 2016 targets for the first phase (February
2016) contracts were very small, while contracts that began between March 2016 and May 2016 did
not have targets.
For the four quarters of financial year 2016–17 (Year One), the quarterly discounted targets were
adjusted further for contracts with later start dates. These quarterly adjustments allowed for an
implementation phase and the minimum time required (12 weeks) to achieve an outcome. Every
contract in the first year of operation had a higher target set for each subsequent quarter, and the
annual target determined by the department applied in full from Year Two.
The Department reviews the targets for each provider regularly in line with labour market changes
and local issues that affect the demand for TtW services. In exceptional cases, such as major
structural adjustments in the local labour market, it will consider adjusting the target in as close to
real time as possible. Where there is a lower than expected demand for services, the department
may reduce the number of Annual Funded Places in an employment region, and hence the targets
for the affected providers.
5.2.2 Performance against targets improved over time in operation
While it was possible to investigate the proportion of targets achieved for each contract, the level of
reporting detail was limited. As a result, the outcomes achievedxxx for each quarter up to
xxx Includes only the four outcome types counted towards Outcome Performance Target shown in Figure 5.2.
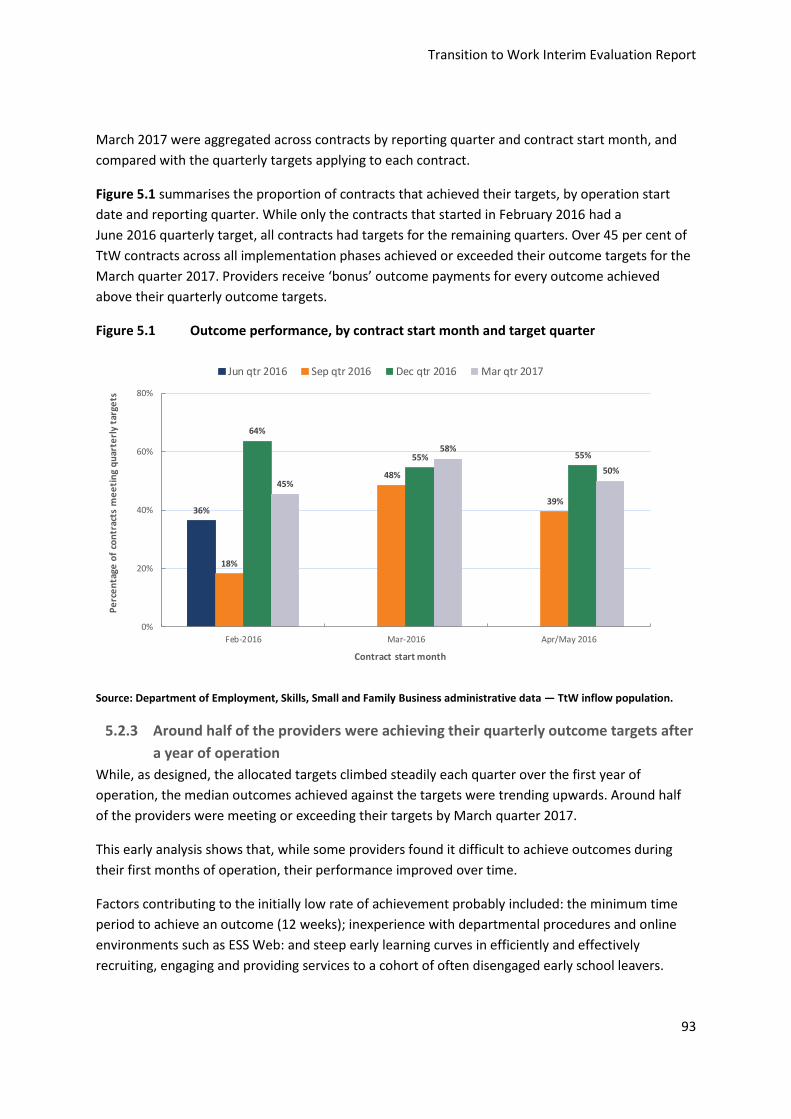
Transition to Work Interim Evaluation Report
93
March 2017 were aggregated across contracts by reporting quarter and contract start month, and
compared with the quarterly targets applying to each contract.
Figure 5.1 summarises the proportion of contracts that achieved their targets, by operation start
date and reporting quarter. While only the contracts that started in February 2016 had a
June 2016 quarterly target, all contracts had targets for the remaining quarters. Over 45 per cent of
TtW contracts across all implementation phases achieved or exceeded their outcome targets for the
March quarter 2017. Providers receive ‘bonus’ outcome payments for every outcome achieved
above their quarterly outcome targets.
Figure 5.1 Outcome performance, by contract start month and target quarter
Source: Department of Employment, Skills, Small and Family Business administrative data — TtW inflow population.
5.2.3 Around half of the providers were achieving their quarterly outcome targets after
a year of operation
While, as designed, the allocated targets climbed steadily each quarter over the first year of
operation, the median outcomes achieved against the targets were trending upwards. Around half
of the providers were meeting or exceeding their targets by March quarter 2017.
This early analysis shows that, while some providers found it difficult to achieve outcomes during
their first months of operation, their performance improved over time.
Factors contributing to the initially low rate of achievement probably included: the minimum time
period to achieve an outcome (12 weeks); inexperience with departmental procedures and online
environments such as ESS Web: and steep early learning curves in efficiently and effectively
recruiting, engaging and providing services to a cohort of often disengaged early school leavers.
36%
18%
48%
39%
64%
55% 55%
45%
58%
50%
0%
20%
40%
60%
80%
Feb-2016 Mar-2016 Apr/May 2016
Pe
rce
nta
ge o
f co
ntr
acts
me
eti
ng
qu
arte
rly
targ
ets
Contract start month
Jun qtr 2016 Sep qtr 2016 Dec qtr 2016 Mar qtr 2017
Transition to Work Interim Evaluation Report
94
5.2.4 TtW-only providers performed similarly to providers delivering both TtW and
jobactive
TtW providers who also delivered services under jobactive may have had a slight advantage in the
early stages of TtW, as they were familiar with departmental procedures, contracts and online
environments and would already have established internal infrastructure for managing
departmental requirements.
While there was some variability between the outcome performances of these two groups of
providers during the early months of operation, any advantage that TtW providers who also
delivered jobactive may have had was not being reflected in outcomes by the end of March 2017.
Outcome performance over the first year of TtW was more closely related to how long the provider
had been operating under TtW.
5.3 Education and employment participation qualifying for an outcome
This section outlines the TtW education and employment outcomes and details the level of
participation of TtW participants in education and employment activities that qualified for an
outcome during the study period. Many of the results were not directly compared with the matched
jobactive sample, as outcomes in TtW are complex and do not align with jobactive outcome
categories in most cases. Equivalent new entrants into jobactive commencing as early school leavers
with Mutual Obligation Requirements must undertake up to 20 job searches per month if they are
not undertaking approved paid work and/or study for 25 hours per week.
Outcomes between the two services are therefore limited to employment outcomes for early school
leavers in TtW only and education participation or attainment outcomes in both services.
Education outcome payments are paid to jobactive providers where job seekers participate for six
months in a qualifying education course or for attainment of Year 12 or Certificate III or above.
Courses must be at least 12 weeks and completed within six months. Courses less than 12 weeks
which lead to employment within eight weeks of course completion and lead to a four week
employment outcome are also eligible for an education outcome payment in jobactive but not TtW.
Hybrid outcomes (combining paid work and study for 25 hours per week) are payable in TtW but are
not available in jobactive.
Education outcomes achieved for selected courses of study for the TtW and jobactive matched
populations are discussed briefly in Section 5.3.4.
5.3.1 Core outcomes in TtW
Figure 5.2 shows the six core types of TtW outcomes across employment, education and a
combination of the two (hybrid), and their tracking paths to an outcome.
It is important to note that qualifying outcomes achieved in TtW are not all paid outcomes. TtW
providers receive an up-front payment per quarter and, with this, are expected to achieve a certain
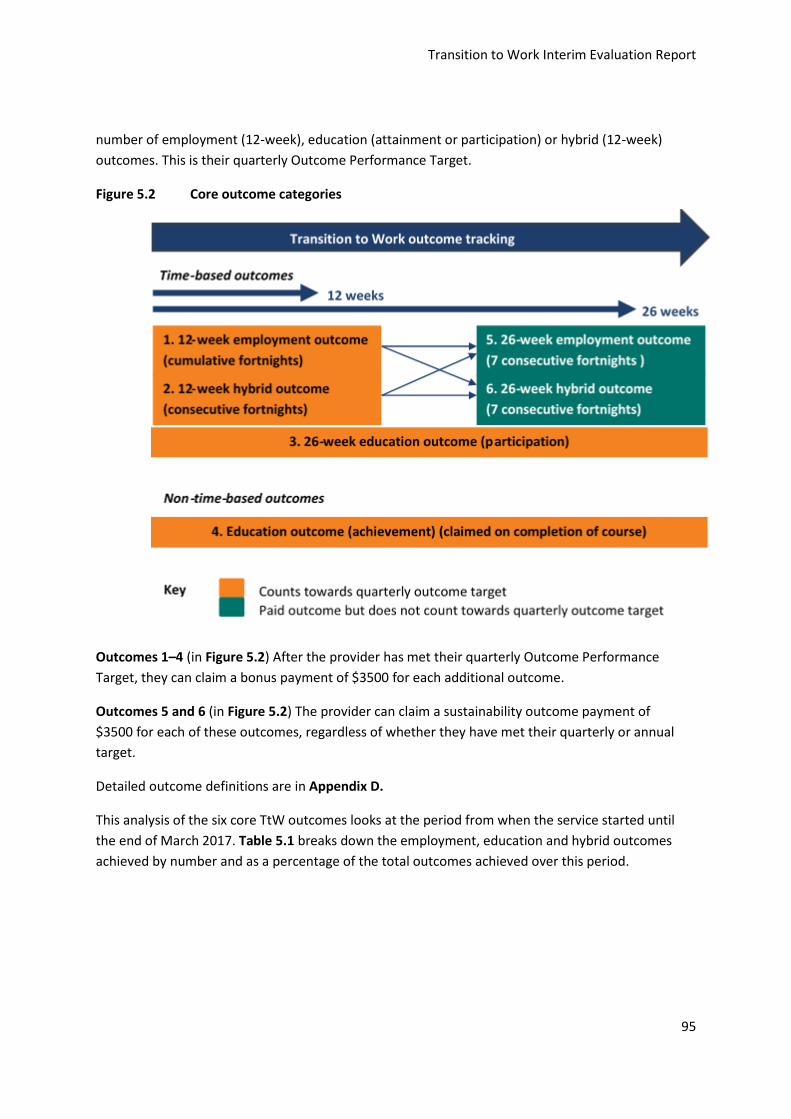
Transition to Work Interim Evaluation Report
95
number of employment (12-week), education (attainment or participation) or hybrid (12-week)
outcomes. This is their quarterly Outcome Performance Target.
Figure 5.2 Core outcome categories
Depiction of the six core outcome categories, how they track to completion over time and whether they count towards quarterly targets.
This figure shows six core outcome categories:
1. 12-week employment outcome (cumulative fortnights)
2. 12-week hybrid outcome (consecutive fortnights)
3. 26-week education outcome (participation)
4. Education outcome (achievement — claimed on completion of course)
5. 26-week sustainability outcome (employment) (7 consecutive fortnights)
6. 26-week sustainability outcome (hybrid) (7 consecutive fortnights)
Categories 1, 2, 3, 5 and 6 are time-based outcomes.
Category 4 is a non-time-based outcome.
Categories 1, 2, 3 and 4 count towards the quarterly outcome target.
Categories 5 and 6 are paid outcomes but do not count towards the quarterly outcome target.
Outcomes 1–4 (in Figure 5.2) After the provider has met their quarterly Outcome Performance
Target, they can claim a bonus payment of $3500 for each additional outcome.
Outcomes 5 and 6 (in Figure 5.2) The provider can claim a sustainability outcome payment of
$3500 for each of these outcomes, regardless of whether they have met their quarterly or annual
target.
Detailed outcome definitions are in Appendix D.
This analysis of the six core TtW outcomes looks at the period from when the service started until
the end of March 2017. Table 5.1 breaks down the employment, education and hybrid outcomes
achieved by number and as a percentage of the total outcomes achieved over this period.

Transition to Work Interim Evaluation Report
96
Table 5.1 Breakdown of outcomes achieved, by outcome type
TtW outcome type Number of outcomes
Proportion of total outcomes (%)
Employment outcome 3,729 79.1
12-week 2,774 58.8
26-week sustainability 955 20.3
Hybrid outcome 31 0.7
12-week 29 0.6
26-week sustainability 2 0.0
Education outcome (participation or attainment)
956 20.3
Total outcomes 4,716 100.0
Source: Department of Employment, Skills, Small and Family Business administrative data — TtW inflow population.
5.3.2 There were almost four times as many employment outcomes as education
outcomes
By the end of March 2017, a total of 4716 outcomes had been achieved across the TtW population,
of which 3729 were employment outcomes (12 and 26 week). A full breakdown of employment,
education and hybrid outcomes by quarter is in Appendix D.
The higher rate of employment outcomes (79 per cent) than education and hybrid outcomes is likely
to reflect the provider focus, as well as to have been driven by the length of the evaluation study
period (six months from a participant’s referral to the service) and the 12-week minimum timeframe
to achieve an employment outcome. Education outcomes, on the other hand, have a 26-week (or
completion of studies) timeframe. Qualitative research found placing young people in education in
order to obtain an education outcome was considered to be the secondary focus for providers after
all avenues of employment were already exhausted. xxxi
5.3.3 A third of education and training activity placements counted towards education
outcomes
Education and training activities available to TW participants are categorised into three types:
accredited education and training
non-accredited education and training
other government programs.
A full list of activities, including education and training activities that qualify for an education
outcome, is in Appendix E.
xxxi The majority of TtW participants undertook Certificate III training which is a one-year course.
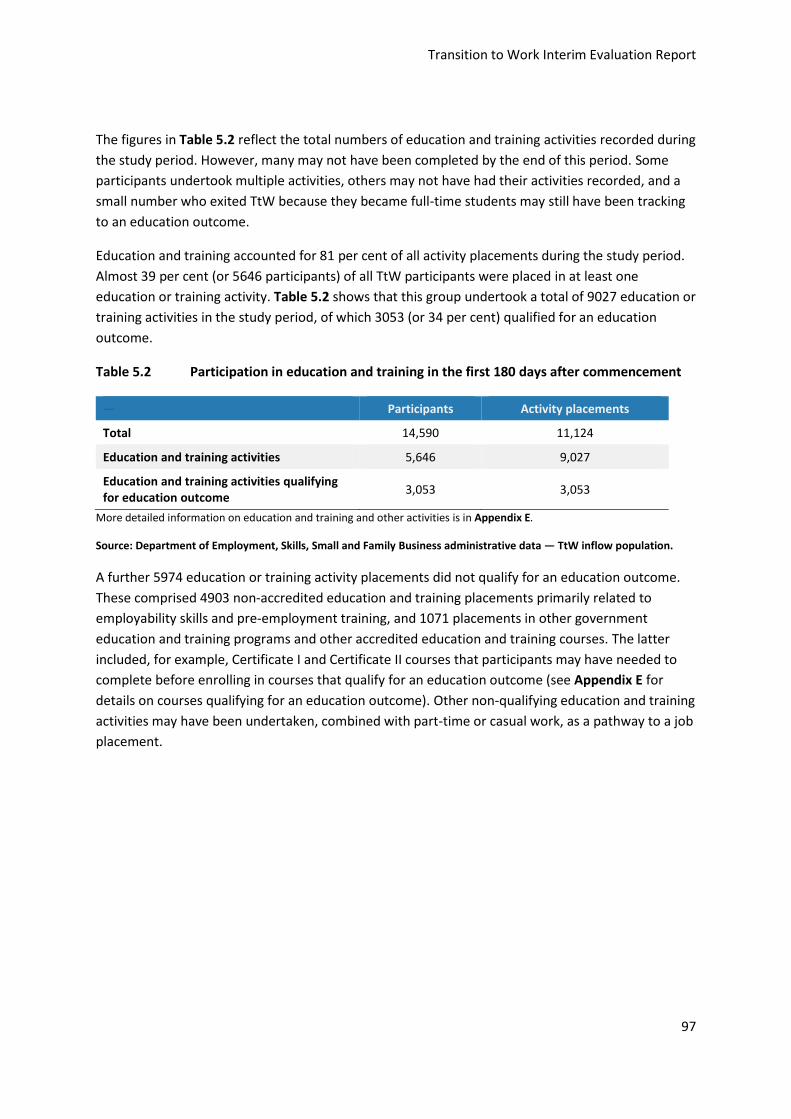
Transition to Work Interim Evaluation Report
97
The figures in Table 5.2 reflect the total numbers of education and training activities recorded during
the study period. However, many may not have been completed by the end of this period. Some
participants undertook multiple activities, others may not have had their activities recorded, and a
small number who exited TtW because they became full-time students may still have been tracking
to an education outcome.
Education and training accounted for 81 per cent of all activity placements during the study period.
Almost 39 per cent (or 5646 participants) of all TtW participants were placed in at least one
education or training activity. Table 5.2 shows that this group undertook a total of 9027 education or
training activities in the study period, of which 3053 (or 34 per cent) qualified for an education
outcome.
Table 5.2 Participation in education and training in the first 180 days after commencement
— Participants Activity placements
Total 14,590 11,124
Education and training activities 5,646 9,027
Education and training activities qualifying for education outcome
3,053 3,053
More detailed information on education and training and other activities is in Appendix E.
Source: Department of Employment, Skills, Small and Family Business administrative data — TtW inflow population.
A further 5974 education or training activity placements did not qualify for an education outcome.
These comprised 4903 non-accredited education and training placements primarily related to
employability skills and pre-employment training, and 1071 placements in other government
education and training programs and other accredited education and training courses. The latter
included, for example, Certificate I and Certificate II courses that participants may have needed to
complete before enrolling in courses that qualify for an education outcome (see Appendix E for
details on courses qualifying for an education outcome). Other non-qualifying education and training
activities may have been undertaken, combined with part-time or casual work, as a pathway to a job
placement.

Transition to Work Interim Evaluation Report
98
Figure 5.3 Percentages of education and training placements that qualified for an education
outcome, by activity type
Source: Department of Employment, Skills, Small and Family Business administrative data — TtW inflow population.
Figure 5.3 shows the breakdown of subtypes of accredited education and training and other
government program activity placements during the study period that qualified for an education
outcome. Almost half of these placements were Certificate III qualifications.
An analysis of the education outcomes (participation and attainment) for the matched TtW and
jobactive populations during the study period was undertaken. The findings show that participants in
the jobactive comparison group achieved around five per cent of the number of educational
outcomes (participation and attainment) achieved by TtW over the period. This indicates that TtW
providers focused on engaging young people, who needed or wanted further education and training,
in courses as soon as possible after they commenced and supporting them to achieve an outcome.
Based on the types of activities undertaken, the distribution of outcomes between education and
employment was expected to change when the TtW service had been operating for longer, giving
providers more time to achieve the longer term educational outcomes. Approximately 54 per cent of
participants with at least one confirmed placement in an education or training activity in the study
period participated in one that qualified for an education outcome.
5.3.4 There were relatively few hybrid outcomes
The low rates of hybrid outcomes (see Table 5.1) over the first year of the TtW service may reflect
the difficulty associated with combining work and study for an average of 25 hours per week for the
12 weeks and 26 weeks consecutively to claim this type of outcome. Many young people who
combined work and study often had breaks in their work (possibly because of exams or assignments
or irregular patterns associated with casual work).
0.2%
0.3%
0.5%
4.2%
5.0%
5.2%
8.9%
49.7%
0% 10% 20% 30% 40% 50% 60%
Bachelor degree
Certificate III — LLN
Adult Migrant English Program
Certificate IV
Diploma
Secondary school
Skills for Education and Employment
Certificate III
Percentage of placements that qualified for an education outcome
Transition to Work Interim Evaluation Report
99
An employment outcome, on the other hand, could comprise multiple periods of at least four weeks
when the participant’s basic rate of income support was reduced by at least 60 per cent.xxxii The
12 or 26 weeks of work did not have to be consecutive, as long as the last seven fortnights of a 26
week outcome are consecutive.
While apprenticeships and traineeships were eligible for an employment outcome, providers initially
highlighted the difficulties young people in these positions had in earning enough to achieve the
60 per cent reduction in income support required for an employment outcome. From 1 July 2017,
providers who placed young people in apprenticeships and traineeships combining 25 hours of
education and employment each week over 12 consecutive weeks were eligible for a hybrid
outcome. This change is expected to lead to an increase in this category. In the qualitative research,
some participants in the focus groups expressed resistance to further education and a preference to
focus instead on getting a job and earning money. This factor may limit the number of hybrid
outcomes.
5.4 Labour market and education outcome measures
While TtW is a targeted service that includes education and training, personal development,
improvement of soft skills, and work or work-like activities designed to increase employability,
employment outcomes and earnings are the ultimate indicators of participants’ successful transition
to work. If participants do not find work, do not move off income support, or are not tracking
towards an employment, hybrid or education outcome at the end of 12 months in TtW, they will be
referred to jobactive if eligible.
The evaluation used a range of indicators based on administrative data to identify whether TtW
participants were engaged in paid employment and to provide a comparison with jobactive. Two
composite measures, comprising multiple indicators, were constructed to capture the various
approaches used in TtW to transition participants towards employment.
The three main measures discussed are:
a simple primary measure of the proportion of participants reporting earnings to DHS
a composite measure of labour market attachment
a composite measure, the positive outcome measure, incorporating an education outcome
indicator with labour market attachment.
Labour market attachment is a widely used term with few formal definitions. For this report, labour
market attachment means ‘working or providing services in the labour market for remuneration, on
a full-time, part-time, seasonal or temporary basis, either as an employee or in self-employment’.38
xxxii Participants with pre-existing employment must achieve 100 per cent income support reduction (i.e. income support cancelled) to qualify for an employment outcome.

Transition to Work Interim Evaluation Report
100
Comparisons with jobactive are made using the matched inflow sample described in Section 2.3.3.
The summarised results are in Table 5.3. Further details regarding other indicators and analyses are
in Appendix F and Appendix H.
Table 5.3 Outcome measures achieved, by month of participation, comparing TtW
and jobactive
Month from participant’s commence-
ment
Reported earnings to DHS
TTW (%)
Reported earnings to
DHS
Jobactive (%)
Labour market
attachment
TTW (%)
Labour market
attachment
jobactive (%)
Positive outcome measure
TTW (%)
Positive outcome measure
jobactive (%)
Month 1 13.73 14.58 18.76 18.36 23.21 21.18
Month 2 16.95 17.47 22.36 20.67 30.58 24.88
Month 3 19.16 19.40 25.61 22.89 35.58 27.46
Month 4 20.90 21.11 28.47 24.85 39.27 29.65
Month 5 22.05 22.24 30.95 26.75 41.60 31.59
Month 6 22.93 23.18 32.81 28.17 42.45 32.87
Source: Department of Employment, Skills, Small and Family Business administrative data (matched inflow populations
in the first six months); DHS administrative data (RED).
5.4.1 Similar proportions of TtW and jobactive participants reported earnings
The evaluation tracked the proportion of participants reporting earnings to DHS over the six months
after their referral to TtW or jobactive (Table 5.3). The cumulative proportions of participants
reporting earnings were similar for the TtW and jobactive matched samples over most of the six-
month study period. While a higher proportion of the jobactive matched sample initially reported
earnings, the TtW group had a slightly higher rate increase over six months (Figure 5.4).
The results of additional analyses regarding the amounts of participant earnings and income support
status are in Appendix H. These results indicate that TtW participants exited income support at a
slightly lower rate than the jobactive matched sample over the study period. This may be
attributable to the higher level of engagement of TtW participants in education and training
activities, which may have restricted their earnings for at least their first few months in TtW (often
described as an ‘attachment effect’).
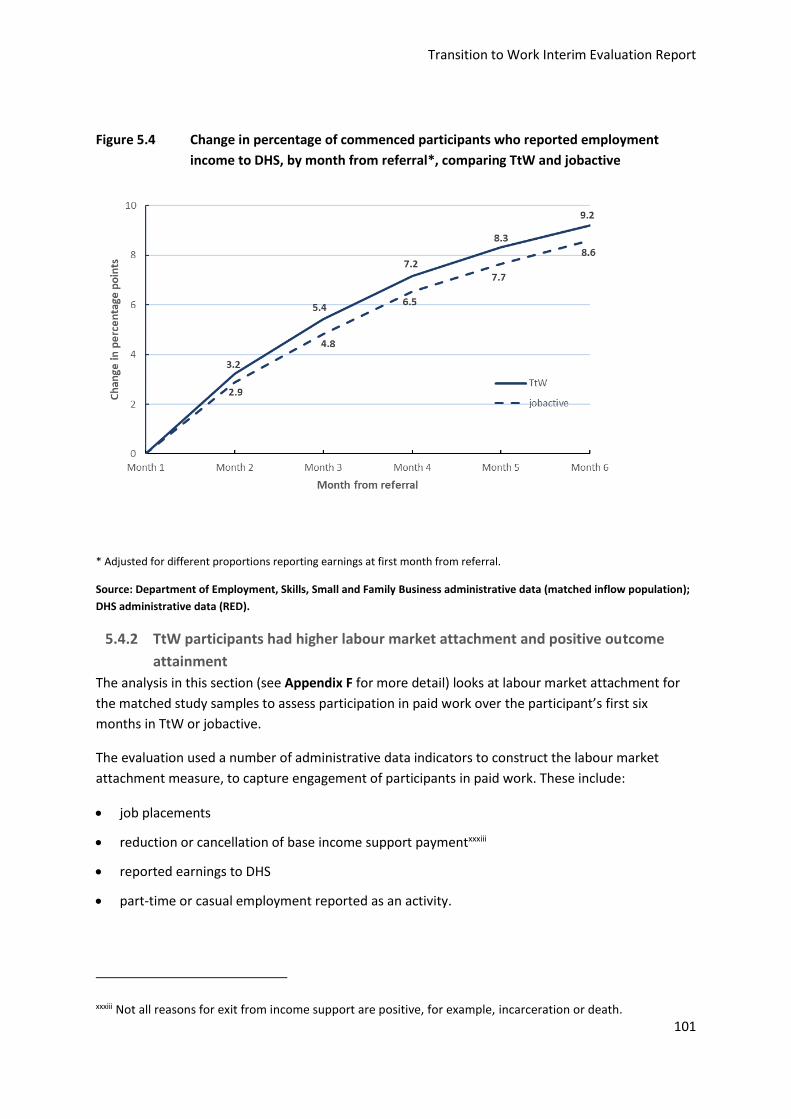
Transition to Work Interim Evaluation Report
101
Figure 5.4 Change in percentage of commenced participants who reported employment
income to DHS, by month from referral*, comparing TtW and jobactive
* Adjusted for different proportions reporting earnings at first month from referral.
Source: Department of Employment, Skills, Small and Family Business administrative data (matched inflow population);
DHS administrative data (RED).
5.4.2 TtW participants had higher labour market attachment and positive outcome
attainment
The analysis in this section (see Appendix F for more detail) looks at labour market attachment for
the matched study samples to assess participation in paid work over the participant’s first six
months in TtW or jobactive.
The evaluation used a number of administrative data indicators to construct the labour market
attachment measure, to capture engagement of participants in paid work. These include:
job placements
reduction or cancellation of base income support paymentxxxiii
reported earnings to DHS
part-time or casual employment reported as an activity.
xxxiii Not all reasons for exit from income support are positive, for example, incarceration or death.
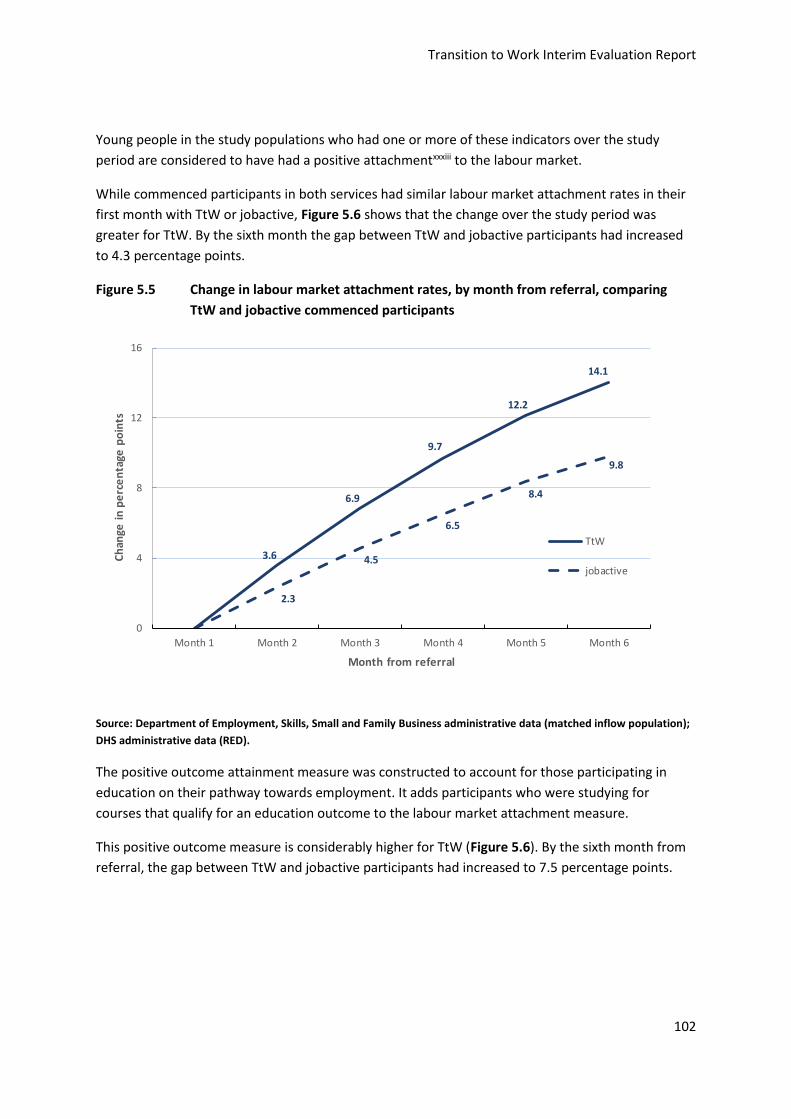
Transition to Work Interim Evaluation Report
102
Young people in the study populations who had one or more of these indicators over the study
period are considered to have had a positive attachmentxxxiii to the labour market.
While commenced participants in both services had similar labour market attachment rates in their
first month with TtW or jobactive, Figure 5.6 shows that the change over the study period was
greater for TtW. By the sixth month the gap between TtW and jobactive participants had increased
to 4.3 percentage points.
Figure 5.5 Change in labour market attachment rates, by month from referral, comparing
TtW and jobactive commenced participants
Source: Department of Employment, Skills, Small and Family Business administrative data (matched inflow population);
DHS administrative data (RED).
The positive outcome attainment measure was constructed to account for those participating in
education on their pathway towards employment. It adds participants who were studying for
courses that qualify for an education outcome to the labour market attachment measure.
This positive outcome measure is considerably higher for TtW (Figure 5.6). By the sixth month from
referral, the gap between TtW and jobactive participants had increased to 7.5 percentage points.
3.6
6.9
9.7
12.2
14.1
2.3
4.5
6.5
8.4
9.8
0
4
8
12
16
Month 1 Month 2 Month 3 Month 4 Month 5 Month 6
Ch
ange
in
pe
rce
nta
ge p
oin
ts
Month from referral
TtW
jobactive

Transition to Work Interim Evaluation Report
103
Figure 5.6 Change in positive outcome rates, by month from referral, comparing TtW
and jobactive
Source: Department of Employment, Skills, Small and Family Business administrative data (matched inflow populations);
DHS administrative data (RED).
Logistic regression analysis was performed to further control for observable differences between the
TtW and jobactive matched samples and corroborate the findings on labour market attachment and
positive outcome rates. This analysis confirmed that TtW participants were more likely to become
attached to the labour market and to achieve a positive outcome than the matched jobactive
comparison group. The odds ratiosxxxiv for these comparisons were 1.14 and 1.49 respectively
(Table 5.4), suggesting that TtW participants had 14 per cent and 49 per cent greater chances of
becoming attached to the labour market and achieving a positive outcome respectively than the
matched jobactive comparison group.
The regression analysis also found that, participants with more schooling were the most likely to
have labour market attachment (see Appendix F). Participants who had good English and their own
means of transport were also more likely to engage with the labour market. On the other hand,
participants with a disability, ex-offenders and Indigenous participants were less likely to engage
with the labour market.
xxxiv The odds ratio of labour market attachment is the relative measure in chance of achieving a labour market attachment of participating in TtW compared with participating in jobactive. An odds ratio greater than 1 indicates that TtW participants are more likely to achieve a labour market attachment than jobactive participants; the reverse is true for odds ratios less than 1.
7.4
12.4
16.1
18.4
19.2
3.7
6.3
8.5
10.411.7
0
4
8
12
16
20
24
Month 1 Month 2 Month 3 Month 4 Month 5 Month 6
Ch
ange
in
pe
rce
nta
ge p
oin
ts
Month from referral
TtW
jobactive

Transition to Work Interim Evaluation Report
104
Table 5.4 Odds ratios for labour market attachment and positive outcome, comparing
TtW and the jobactive comparison group
— Labour market attachment Positive outcome
Odds ratio (TtW:jobactive) 1.14 1.49
Source: Department of Employment, Skills, Small and Family Business administrative data — matched inflow
populations, DHS administrative data (RED).
The current findings are based on TtW’s first six months of operations only and will not reflect the
full impact of the service. The final evaluation will analyse the outcomes based on the full 12 months
of participation. This will shed more light on the impact of TtW.
Transition to Work Interim Evaluation Report
105
6 Conclusions
This report focuses on the implementation of the TtW service, its operational processes and the
initial stage of service participation. It provides an early assessment of the appropriateness and
effectiveness of TtW over its early months of operation. The effectiveness assessment compares
early labour market outcomes and education participation for TtW participants with a comparison
group from jobactive.
6.1 Appropriateness, implementation, engagement and outcomes
6.1.1 Appropriateness and implementation
The early findings indicate that the TtW service is an appropriate service for helping early school
leavers aged 15 to 21 years who are not currently in employment or education to transition into
work or education. Both TtW providers and participants were satisfied with TtW for this cohort of
young people because it allows for specific targeting of services for early school leavers who require
more intensive support. The flexibility of the service enables providers to develop individually
tailored strategies that reflect the particular needs of each participant.
The rapid implementation of TtW created a number of challenges in the first few months of
operation of the service. In the provider survey, fewer than 40 per cent of provider site respondents
agreed that contact details for the early referrals from jobactive (the start-up caseload) were
accurate, and fewer than 50 per cent agreed that the start-up caseload transfer went smoothly.
Providers also indicated that a high proportion of referrals during the early months of operation
were unsuitable but that this had improved over time. Providers attributed many of the early
implementation issues to a lack of awareness and understanding of the TtW service among
participants, DHS staff and employers.
In general, providers said they were happy with the service they received from the department once
the early implementation issues were resolved. They suggested that the department could do more
to encourage jobactive providers to increase the number of referrals of suitable jobactive Stream C
participants to TtW.
6.1.2 Engagement-related measures
Occupancy of funded places
The utilisation (average occupancy rate) of the TtW service’s Annual Funded Places in its first six
months of operation was 78 per cent. This had increased to 117 per cent by 31 January 2017, nearly
12 months after TtW began. When the different contract start dates are accounted for, there was a
trend for the utilisation rate to increase over time as providers built their caseloads. At November
2016 more than half (around 58 per cent) of providers considered the caseload at their site to be the
right size.

Transition to Work Interim Evaluation Report
106
The utilisation of allocated Group Three places was short of expectations and fell between TtW’s
sixth and 12th months of operation. This could be due to providers already having fulfilled their
Annual Funded Places allocations from the high number of Group One participants.
Engagement and non-commencement
During the first month of operation, the median time between referral and commencement was
high (16 days) for TtW referrals, which was expected given the high volume of young people
transitioning across to TtW at the start of the service (approximately 40% of Annual Funded
Places).This had reduced to four days by the end of the study period.
Despite the different compliance in relation to individual appointments or activities in TtW, and after
allowing for a settling-in period during the first month of operation of TtW contracts, a higher
proportion of young people in TtW were engaged during the first 30 days after referral than young
people in the jobactive comparison group. More than 93 per cent of those referred to TtWxxxv had
commenced within 30 days of referral, compared with 83 per cent in the jobactive comparison
group. This indicates that the service is achieving its objective of targeting and engaging a cohort of
young people.
While jobactive had a higher non-commencement rate (the proportion of people who were referred
but did not commence) in the first month after referral, there was no meaningful difference
between the overall non-commencement rates in TtW and the jobactive comparison group at three
months from referral. This suggests that the intensive, activity-based nature of the TtW service
may have been less attractive to some young people who were more interested after the
‘initial phase’ in getting a job quickly and elected to go to or were referred to jobactive.
TtW participants who did not commence were more likely than similar participants in the jobactive
comparison group to be recorded by providers after the first month as non-commencements
because they were uncontactable or not participating. The qualitative research found a high level of
disengagement among referrals due to a lack of knowledge about TtW, negative attitudes from
experiences with jobactive, or other difficulties such as personal problems or housing issues. After
numerous unsuccessful attempts to engage these young people in service, TtW providers referred
them to jobactive.
Activity engagement and types of activities
TtW providers reported that, while some young people were initially hard to engage, once engaged
participants were committed to the flexible, individualised, one-to-one support TtW offers.
Reflecting the intensive servicing and generous funding arrangement, the proportion of participants
undertaking an activity during their first six months in the service was higher for TtW participants:
45.8 per cent, compared to 18.9 per cent for participants in the jobactive comparison group. TtW
participants were also placed in an activity faster than the jobactive comparison group. Around
39 per cent of TtW participants undertook at least one education and training activity.
xxxv For comparability, all Group Three participants and the first month’s referrals for each TtW provider were excluded.

Transition to Work Interim Evaluation Report
107
A Certificate III qualification, which qualifies for an education outcome, was the principal type of
educational activity undertaken by TtW participants, both in activities that qualified for an education
outcome and across all educational activities.
This reflects the design of TtW as an activity-intensive service that requires participants to undertake
25 hours per week of pre-employment activities. TtW providers can use the higher up-front
payments as well as outcome payments for a wider range of education and training activities than
those available to young people in jobactive. Many TtW participants also undertook work-like
activities such as volunteering and work experience.
By comparison, the design of jobactive focuses on achieving employment outcomes. The low
administration fees and less flexible funding structure in jobactive suggests participants may be
more likely undertake job search and concentrate on getting a job, rather than participating in pre-
employment activities such as training and education. Young people in jobactive were more likely to
undertake work-related accredited education and training activities where there is a likelihood of
securing job or participate in other government programs and part-time or casual employment.
6.1.3 Exits from services
During their first month after commencement, the jobactive comparison group had an exit rate
more than double that of TtW participants, but the two groups had similar exit rates over the next
five months. TtW participants were also more likely to request to exit, as might be expected given
the voluntary nature of the service, and also due to the fact that only job seekers who have
volunteered to be in jobactive have the option to request an exit. Young people with Mutual
Obligation Requirements were referred to jobactive when they exited from TtW.
A frequently recorded reason for participants in both TtW and jobactive exiting services was
‘changed services’. This may indicate that TtW and jobactive providers took an initial period to
assess the needs of some job seekers before referring them to other employment services during
the early months. However, there are also other driving factors such as a change initiated by DHS, a
participant locating to a different region, or a change in the participant’s circumstances.
6.1.4 Outcomes
Approved outcomes
For more than 50 per cent of all provider contracts, the allocated quarterly Outcome Performance
Targets were achieved or exceeded in the March quarter 2017–18. A total of 4716 outcomes were
achieved across the TtW population by the end of March 2017, of which 3729 were employment
outcomes (12 and 26 week), indicating a strong focus on labour market outcomes.
Labour market attachment
Attachment to the labour market over the study period (six months from referral) was higher for
TtW participants than for jobactive participants (by 4.3 percentage points). This indicates that
greater participation in education and training activities was not at the cost of labour market
attachment.

Transition to Work Interim Evaluation Report
108
Positive outcome measure
The positive outcome measure, which includes study in education courses that qualifies for an
outcome payment as well as the employment indicators, was considerably higher for TtW
participants. At the six-month point, this had increased to a difference of 7.5 percentage points
between the TtW and jobactive study populations, consistent with the broader TtW focus.
6.1.5 Stakeholder suggestions for improving the TtW service
Overall the TtW service was positively received by all stakeholders: participants, providers, DHS staff,
peak body representatives, and employers. Stakeholders agreed that the service gives providers the
opportunity to deliver a flexible, holistic service to support a cohort of young people on their path to
employment or further education.
Support and guidance from the department
Some providers who had not previously delivered jobactive services acknowledged that they would
have benefited from additional training on use of the department’s IT system and more practical
examples of likely situations that could arise and how to deal with them in program guidelines.
A number of providers said that communication between the department and DHS could be
improved by focusing not only on system needs but also on the support needs of TtW participants.
Providers also indicated that they wanted more information from the department about their
performance.
Suggestions for expanding the service
Some providers supported access to stronger compliance options to better engage participants that
are exited for not participating appropriately.
Some providers and participants suggested expanding TtW by raising the age limit for eligibility to
24 or 25 years, to align with the Youth Allowance (Student) payment and an extension beyond
12 months for some participants, on a case-by-case basis, to gain the self-confidence, skills and
qualifications needed to reach their educational and employment goals.
A number of stakeholders suggested there may be benefits in reducing the waiting period for
Group Two participants significantly or removing it altogether, to allow for direct registration of
young people straight from school.

109
Appendix A — Employment regions Figure A. 1 Employment regions
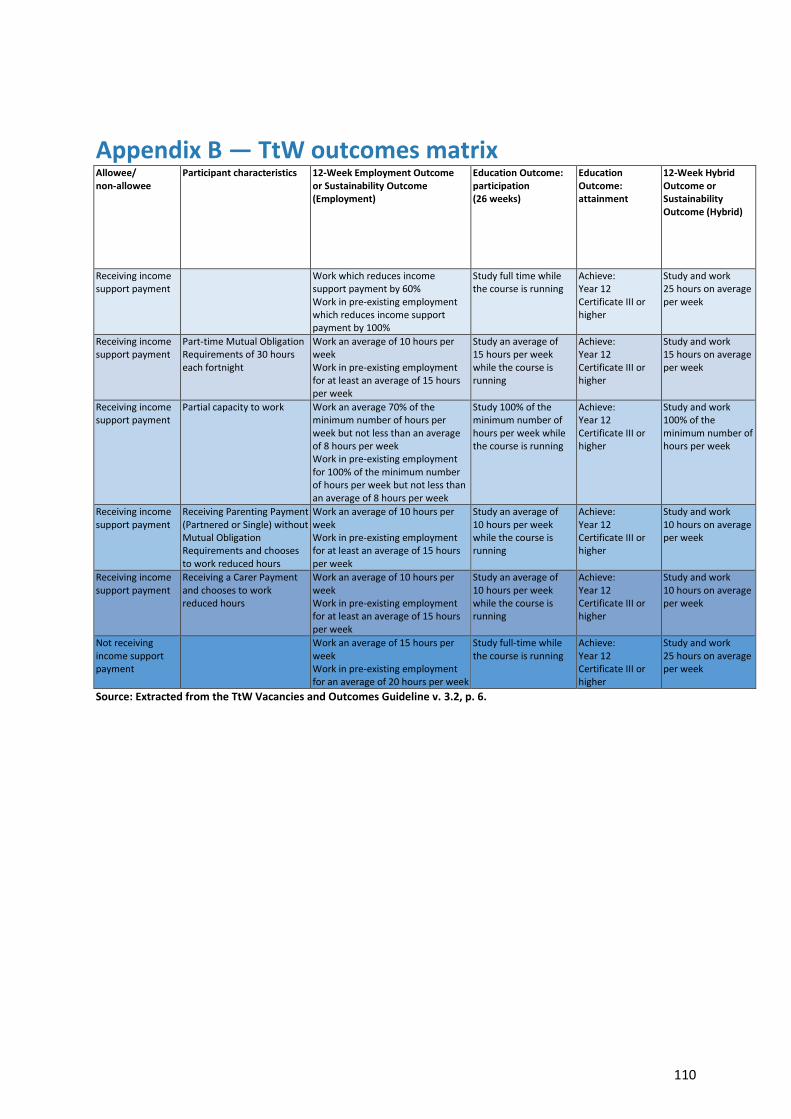
110
Appendix B — TtW outcomes matrix Allowee/ non-allowee
Participant characteristics 12-Week Employment Outcome or Sustainability Outcome (Employment)
Education Outcome: participation (26 weeks)
Education Outcome: attainment
12-Week Hybrid Outcome or Sustainability Outcome (Hybrid)
Receiving income support payment
Work which reduces income support payment by 60% Work in pre-existing employment which reduces income support payment by 100%
Study full time while the course is running
Achieve: Year 12 Certificate III or higher
Study and work 25 hours on average per week
Receiving income support payment
Part-time Mutual Obligation Requirements of 30 hours each fortnight
Work an average of 10 hours per week Work in pre-existing employment for at least an average of 15 hours per week
Study an average of 15 hours per week while the course is running
Achieve: Year 12 Certificate III or higher
Study and work 15 hours on average per week
Receiving income support payment
Partial capacity to work Work an average 70% of the minimum number of hours per week but not less than an average of 8 hours per week Work in pre-existing employment for 100% of the minimum number of hours per week but not less than an average of 8 hours per week
Study 100% of the minimum number of hours per week while the course is running
Achieve: Year 12 Certificate III or higher
Study and work 100% of the minimum number of hours per week
Receiving income support payment
Receiving Parenting Payment (Partnered or Single) without Mutual Obligation Requirements and chooses to work reduced hours
Work an average of 10 hours per week Work in pre-existing employment for at least an average of 15 hours per week
Study an average of 10 hours per week while the course is running
Achieve: Year 12 Certificate III or higher
Study and work 10 hours on average per week
Receiving income support payment
Receiving a Carer Payment and chooses to work reduced hours
Work an average of 10 hours per week Work in pre-existing employment for at least an average of 15 hours per week
Study an average of 10 hours per week while the course is running
Achieve: Year 12 Certificate III or higher
Study and work 10 hours on average per week
Not receiving income support payment
Work an average of 15 hours per week Work in pre-existing employment for an average of 20 hours per week
Study full-time while the course is running
Achieve: Year 12 Certificate III or higher
Study and work 25 hours on average per week
Source: Extracted from the TtW Vacancies and Outcomes Guideline v. 3.2, p. 6.

111
Appendix C — TtW study group construction, statistical analysis
The primary study population
The primary study population included people referred to the TtW service during the inflow period
(1 February 2016 to 31 July 2016). As the inflow period coincided with the start of the service, the
group represented the entire TtW population referred during this period. This study population
consisted of the transition group from jobactive, new applicants for Youth Allowance (Other),
disengaged young people recruited by providers, and suitable Stream C participants referred from
jobactive.
Once provider sites and start-up dates were confirmed, the department identified a group of young
people in each employment region who were eligible for TtW and were participating in jobactive.
These participants were then referred to TtW from the contract approval date. This was the
transition group (or start-up caseload) for TtW. To examine time lags between referral and
commencement, a TtW inflow population was constructed for all referrals (both transitioned and
new) to 31 July 2016. This allowed for at least six months of operation for all but one provider
contract. Analysis was restricted to participants who commenced within 30 days of referral, to avoid
inflating the median number of days between referral and commencementxxxvi for the different
phases.
The evaluation followed all commenced participants until the end of the study period, which, unless
indicated, was six months. The study group consisted of participants who commenced in the service;
those who were referred but did not commence; and those who exited services during the study
period.
The sample for the qualitative component of the research was constructed from participants
(caseload) who had a status of ‘commenced’ in TtW at a point in time: 31 July 2016.
Administrative data: matched samples (TtW and jobactive)
A comparison group was constructed from a jobactive inflow population from 1 February 2016 to
31 July 2016. It should be noted that participants in one service may have been different in some
ways from those in the other. For instance, young people who are less motivated or face greater
barriers to workforce participation, such as poor language skills, mental illness or homelessness, may
opt to go or be referred to jobactive rather than participate in 12 months of activity-intensive
services.
xxxvi There are many reasons why young people may not commence in services, including finding employment, moving to full-time study, caring responsibilities, moving house, partnering, living at home with parents or having an income support claim rejected.
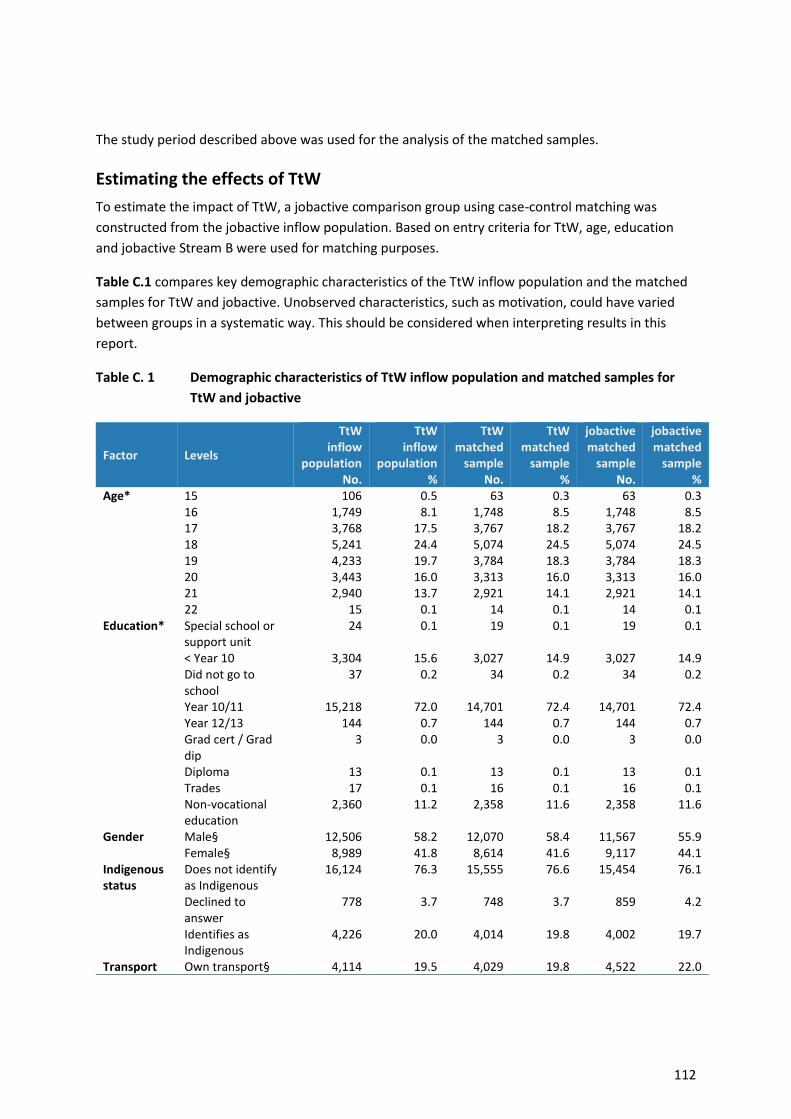
112
The study period described above was used for the analysis of the matched samples.
Estimating the effects of TtW
To estimate the impact of TtW, a jobactive comparison group using case-control matching was
constructed from the jobactive inflow population. Based on entry criteria for TtW, age, education
and jobactive Stream B were used for matching purposes.
Table C.1 compares key demographic characteristics of the TtW inflow population and the matched
samples for TtW and jobactive. Unobserved characteristics, such as motivation, could have varied
between groups in a systematic way. This should be considered when interpreting results in this
report.
Table C. 1 Demographic characteristics of TtW inflow population and matched samples for
TtW and jobactive
Factor Levels
TtW inflow
population No.
TtW inflow
population %
TtW matched
sample No.
TtW matched
sample %
jobactive matched
sample No.
jobactive matched
sample %
Age* 15 106 0.5 63 0.3 63 0.3 16 1,749 8.1 1,748 8.5 1,748 8.5 17 3,768 17.5 3,767 18.2 3,767 18.2 18 5,241 24.4 5,074 24.5 5,074 24.5 19 4,233 19.7 3,784 18.3 3,784 18.3 20 3,443 16.0 3,313 16.0 3,313 16.0 21 2,940 13.7 2,921 14.1 2,921 14.1 22 15 0.1 14 0.1 14 0.1
Education* Special school or support unit
24 0.1 19 0.1 19 0.1
< Year 10 3,304 15.6 3,027 14.9 3,027 14.9 Did not go to school
37 0.2 34 0.2 34 0.2
Year 10/11 15,218 72.0 14,701 72.4 14,701 72.4 Year 12/13 144 0.7 144 0.7 144 0.7 Grad cert / Grad dip
3 0.0 3 0.0 3 0.0
Diploma 13 0.1 13 0.1 13 0.1 Trades 17 0.1 16 0.1 16 0.1 Non-vocational education
2,360 11.2 2,358 11.6 2,358 11.6
Gender Male§ 12,506 58.2 12,070 58.4 11,567 55.9 Female§ 8,989 41.8 8,614 41.6 9,117 44.1
Indigenous status
Does not identify as Indigenous
16,124 76.3 15,555 76.6 15,454 76.1
Declined to answer
778 3.7 748 3.7 859 4.2
Identifies as Indigenous
4,226 20.0 4,014 19.8 4,002 19.7
Transport Own transport§ 4,114 19.5 4,029 19.8 4,522 22.0
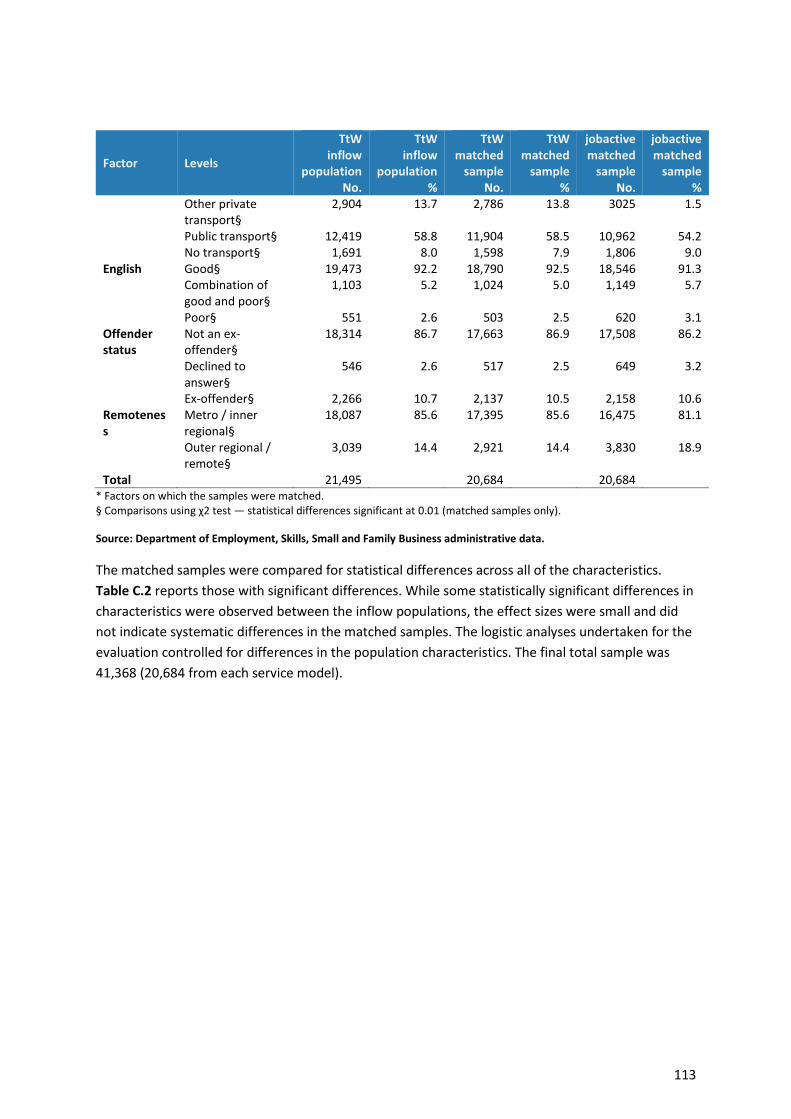
113
Factor Levels
TtW inflow
population No.
TtW inflow
population %
TtW matched
sample No.
TtW matched
sample %
jobactive matched
sample No.
jobactive matched
sample %
Other private transport§
2,904 13.7 2,786 13.8 3025 1.5
Public transport§ 12,419 58.8 11,904 58.5 10,962 54.2 No transport§ 1,691 8.0 1,598 7.9 1,806 9.0
English Good§ 19,473 92.2 18,790 92.5 18,546 91.3 Combination of good and poor§
1,103 5.2 1,024 5.0 1,149 5.7
Poor§ 551 2.6 503 2.5 620 3.1 Offender status
Not an ex-offender§
18,314 86.7 17,663 86.9 17,508 86.2
Declined to answer§
546 2.6 517 2.5 649 3.2
Ex-offender§ 2,266 10.7 2,137 10.5 2,158 10.6 Remoteness
Metro / inner regional§
18,087 85.6 17,395 85.6 16,475 81.1
Outer regional / remote§
3,039 14.4 2,921 14.4 3,830 18.9
Total — 21,495 — 20,684 — 20,684 — * Factors on which the samples were matched. § Comparisons using χ2 test — statistical differences significant at 0.01 (matched samples only).
Source: Department of Employment, Skills, Small and Family Business administrative data.
The matched samples were compared for statistical differences across all of the characteristics.
Table C.2 reports those with significant differences. While some statistically significant differences in
characteristics were observed between the inflow populations, the effect sizes were small and did
not indicate systematic differences in the matched samples. The logistic analyses undertaken for the
evaluation controlled for differences in the population characteristics. The final total sample was
41,368 (20,684 from each service model).
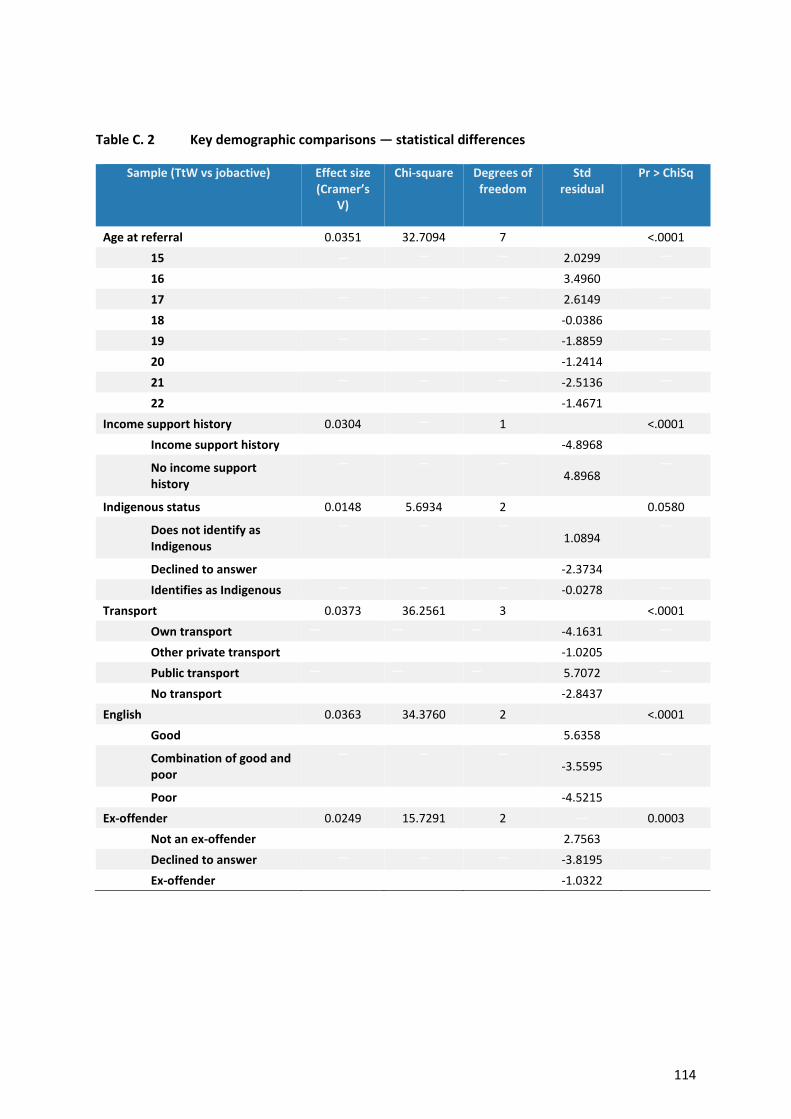
114
Table C. 2 Key demographic comparisons — statistical differences
Sample (TtW vs jobactive) Effect size (Cramer’s
V)
Chi-square
Degrees of freedom
Std residual
Pr > ChiSq
Age at referral 0.0351 32.7094 7 <.0001
15 — — — 2.0299 —
16 — — — 3.4960 —
17 — — — 2.6149 —
18 — — — -0.0386 —
19 — — — -1.8859 —
20 — — — -1.2414 —
21 — — — -2.5136 —
22 — — — -1.4671 —
Income support history 0.0304 — 1 <.0001
Income support history — — — -4.8968 —
No income support history
— — — 4.8968
—
Indigenous status 0.0148 5.6934 2 — 0.0580
Does not identify as Indigenous
— — — 1.0894
—
Declined to answer — — — -2.3734 —
Identifies as Indigenous — — — -0.0278 —
Transport 0.0373 36.2561 3 <.0001
Own transport — — — -4.1631 —
Other private transport — — — -1.0205 —
Public transport — — — 5.7072 —
No transport — — — -2.8437 —
English 0.0363 34.3760 2 <.0001
Good — — — 5.6358 —
Combination of good and poor
— — — -3.5595
—
Poor — — — -4.5215 —
Ex-offender 0.0249 15.7291 2 — 0.0003
Not an ex-offender — — — 2.7563 —
Declined to answer — — — -3.8195 —
Ex-offender — — — -1.0322 —
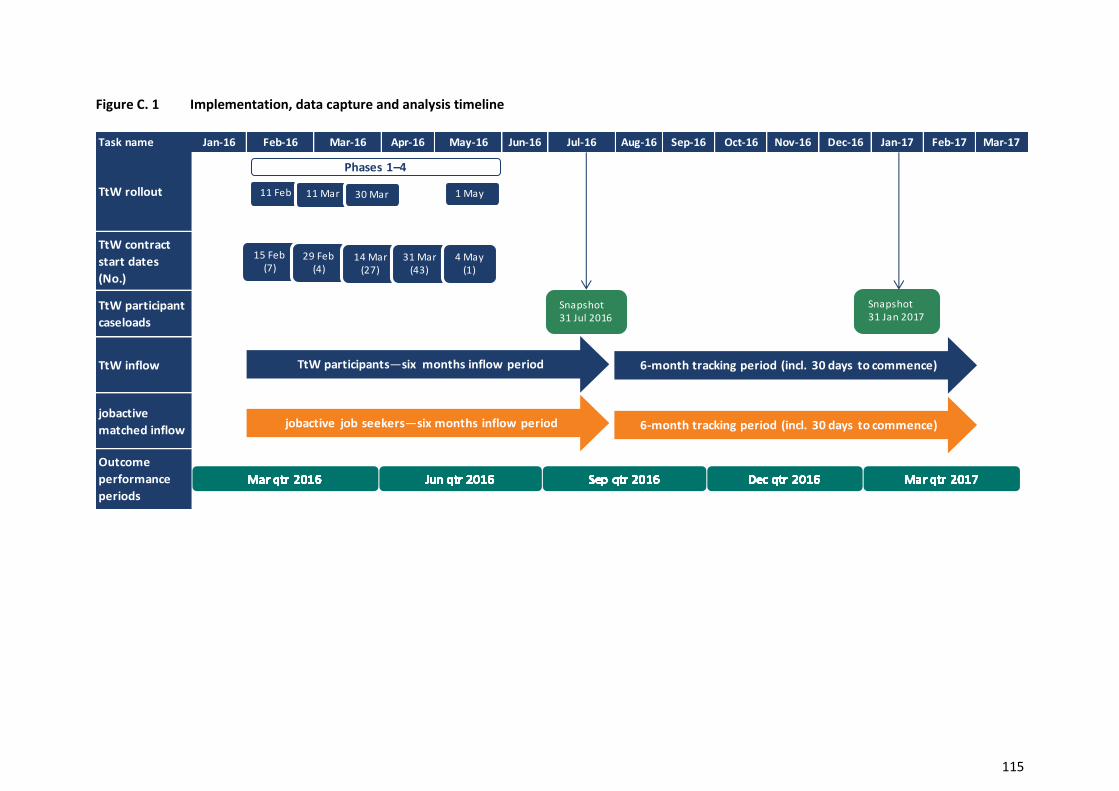
115
Figure C. 1 Implementation, data capture and analysis timeline
Diagrammatic representation of TtW implementation, data capture and analysis timeline.
The diagram has a header row of months from January 2016 to March 2017. Each row below shows the relevant timeline.Row 2: TtW rollout phases 1–4 (11
February, 11 March, 30 March, 1 May)Row 3: TtW contract start dates and number of contracts (15 February: 7; 29 February: 4; 14 March: 27; 31 March: 4;
3/4 May: 1)
Row4: TtW participant caseload snapshots at 31 July 2016, 31 January 2017Row 5: TtW inflow period (six months from February – July 2016) and 6 months
tracking period (including 30 days to commence in services)Row 6: jobactive matched inflow (same rules as Row 5 for TtW)
Row 7: outcome performance periods (quarters from March 2016 to March 2017)
Task name Jan-16 Feb-16 Mar-16 Apr-16 May-16 Jun-16 Jul-16 Aug-16 Sep-16 Oct-16 Nov-16 Dec-16 Jan-17 Feb-17 Mar-17
TtW rollout
TtW contract
start dates
(No.)
TtW participant
caseloads
TtW inflow
jobactive
matched inflow
Outcome
performance
periods
Phases 1–4
11 Feb 11 Mar
15 Feb(7)
29 Feb(4)
14 Mar(27)
31 Mar(43)
4 May(1)
TtW participants—six months inflow period
Snapshot31 Jul 2016
Snapshot31 Jan 2017
jobactive job seekers—six months inflow period
6-month tracking period (incl. 30 days to commence)
6-month tracking period (incl. 30 days to commence)
30 Mar 1 May
116
Appendix D — TtW outcome types There are two ways to achieve an approved education outcome:
26 consecutive weeks of full-time participation in, or attainment of:
a Certificate III course or higher (this includes a diploma, advanced diploma, associate
degree or bachelor degree; it does not include university bridging or preparation courses),
or
secondary education leading to Year 12 (participation outcomes can be claimed for, for
example, Year 10, Year 11 or Year 12, but attainment can only be claimed for completing
Year 12), or
26 consecutive weeks of full-time participation in the Skills for Education and Employment (SEE)
program or Adult Migrant Education Program (AMEP). SEE and AMEP can only track towards a
participation outcome, not an attainment outcome.
Providers can claim an education participation outcome or an education attainment outcome, but
not both, for a qualifying course of study.
An employment outcome consists of 12 cumulative weeksxxxvii of employment (which includes
apprenticeships, traineeships and unsubsidised self-employment) during a participant’s time in the
service. The 12 cumulative weeks can comprise multiple periods of at least four weeks.
A hybrid outcome is 12 consecutive weeks combining education and employment.
TtW pays a sustainability outcome for employment outcomes (for an additional 7 consecutive
fortnights) and hybrid outcomes (for an additional 7 consecutive fortnights) that follow a 12-week
outcome. A 12-week employment outcome can lead to a hybrid sustainability outcome, and a 12-
week hybrid outcome can lead to an employment sustainability outcome. It is important to note that
these two sustainability outcomes do not count towards the Outcome Performance Target.
Table D.1 summarises TtW outcomes achieved by quarter. Outcomes listed as ‘zero base rate’ are
outcomes achieved within the providers’ targets. Outcomes listed as ‘standard rate’ are outcomes
achieved above these targets, and therefore attract a ‘bonus’ outcome payment.
xxxvii The 12 cumulative weeks are not required to be consecutive but the department’s IT system requires that employment outcomes satisfy the criteria for at least two DHS fortnights at a time. Multiple job placements with different employers can count towards one employment outcome.

117
Table D. 1 Outcomes achieved, by outcome type and quarter, to 31 March 2017
TtW outcome type Jun qtr 2016
Sep qtr 2016
Dec qtr 2016
Mar qtr 2017
Total
12-week employment outcome zero base rate
4 427 893 1,133 2,457
12-week employment outcome standard rate 0 0 116 201 317
26-week employment outcome standard rate 0 5 236 714 955
12-week hybrid outcome zero base rate 0 2 13 8 23
12-week hybrid outcome standard rate 0 0 3 3 6
26-week hybrid outcome standard rate 0 0 0 2 2
Education outcome zero base rate* 1 105 276 315 697
Education outcome standard rate* 2 2 99 156 259
Total outcomes 7 541 1,636 2,532 4,716
* Providers can claim an education outcome for attainment (completion of a qualifying course) or participation (26 weeks study in a qualifying course).
Source: Department of Employment, Skills, Small and Family Business administrative data.

118
Appendix E — Education activity types in TtW Figure E. 1 Education activity types
Row 1: 14,590 participants commenced in TtW.
Row 2: 5646 (or 39%) had confirmed placements in 11,124 activities during the study period.
Row 3: Activity types: 3699 were accredited education and training (vocational) activities (type 1);
425 were other government programs activities (type 2); 4903 were non-accredited education and
training (vocational) activities (type 3); 2097 were other activity types (type 4).
Row 4: Education activity subtypes.
1. For accredited education and training, the subtypes are: Certificate I, Certificate II, Certificate III,
Certificate IV, Diploma, Primary school, Secondary school, Accredited units including training for
tickets or licences, Accredited skill set, Accredited units—LLN, Certificate I — LLN, Certificate II —
LLN, Certificate III — LLN, Certificate IV — LLN, Advanced diploma, Associate degree, Bachelor
degree.
2. For other government programs the subtypes are: Adult Migrant English Program, Skills for
Education and Employment, Vocational, training and employment centres, Australian
Apprenticeships Support Network, Innovative Community Action Networks —flexible, Skilling
Queenslanders — community work skills, Empowering YOUth Initiatives, Other government
programs.
3. For non-accredited vocational activities the subtypes are: Adult Migrant English Program, Skills for
Education and Employment, Vocational, training and employment centres, Australian
Apprenticeships Support Network, Innovative Community Action Networks — flexible, Skilling
Queenslanders — community work skills, Empowering YOUth Initiatives, Other government
programs.
4. For other activity types the subtypes are: Approved non-government programs, Interventions,
National Work Experience Programme, Non-vocational assistance, Part-time/casual paid
employment, Voluntary work in community/non-profit sector, Work experience (other).
Row 5: Approved for education outcome. These are subsets of type 1 and type 2 activities:
For type 1: Certificate III, Certificate IV, Diploma, Primary school, Secondary school, Certificate III —
LLN, Certificate IV — LLN.
For type 2: Advanced diploma, Associate degree, Bachelor degree Adult Migrant English Program,
Skills for Education and Employment.
Row 6: 3053 activity placements qualify for education outcomes that count towards annual outcome
performance targets.

119
Appendix F — Labour market attachment and positive outcome measures
Constructing the labour market attachment measure
The labour market attachment indicator constructed for the TtW and jobactive matched
populations is based on the following criteria:
earnings reported to DHS
reduction in base rate of income support payment recorded in DHS administrative data
periods of no income support payment recorded in DHS administrative data following receipt
of 100 per cent of base payment rate
part-time/casual employment recorded as an activity in the department’s IT system
a job placement recorded as confirmed in the department’s IT system.
The evaluation tracked these criteria for each participant across the study period (as described in
Appendix D). If any of the criteria were satisfied during the tracking period, the participant was
judged to have engaged in some paid work and was allocated a labour market attachment
indicator equal to 1. If there was no evidence of paid work across all of the criteria, the labour
market attachment indicator was set to 0. A more detailed analysis of some of these criteria across
the study period is in Appendix H.
Logistic regression modelling
Logistic regression modelling was used to estimate the likelihood of TtW participants being
engaged in the labour market compared with job seekers in the matched jobactive population. The
modelling controlled for a range of job seeker characteristics. The 20 variables tested in the logistic
models were:
Program name — TtW or jobactive
Gender
Age at referral
JSCI — Access to transport
JSCI — Self-reported Indigenous status
JSCI — Income support and crisis payment
JSCI — Country of birth
JSCI — Disability/mental condition
JSCI — Duration on income support
JSCI — Educational attainment
JSCI — English language and literacy
JSCI — Criminal conviction

120
JSCI — Family status
JSCI — Proximity to labour market
JSCI — Vocational qualification
JSCI — Stability of residence
JSCI — Working experience
On income support during month of referral
Income reported to Centrelink at referral
Placed in outcome qualifying education activity during months 1–6 of participation.
The refined model included the key variables of interests and most influential job seeker
characteristics identified by a stepwise selection method. These were:
Program name — TtW or jobactive
Age
Gender
JSCI — Access to transport
JSCI — Self-reported Indigenous status
JSCI — Income support and crisis payment
JSCI — Duration on income support
JSCI — Stability of residence
JSCI — Disability/mental condition
JSCI — Educational attainment
JSCI — English language and literacy
JSCI — Criminal conviction
JSCI — Working experience

121
Table F. 1 Logistic regression — labour market attachment
Effect Odds ratio Lower 95%
confidence limit Upper 95%
confidence limit TtW vs jobactive 1.142* 1.08 1.208 Age 1.037* 1.015 1.06 Female vs male 0.982 0.927 1.04 Declined to answer vs does not identify as Indigenous
0.917 0.783 1.075
Identifies as Indigenous vs does not identify as Indigenous
0.608* 0.559 0.662
Education attainment: Year 12 or above vs below Year 12
1.391* 1.289 1.501
No transport vs public transport 0.857 0.76 0.966 Private transport vs public transport 1.464* 1.379 1.553 Stable residence vs unstable 1.053 0.962 1.153 Work experience: full time vs unpaid part time 1.632* 1.504 1.771 Work experience: none vs unpaid part time 1.836* 1.692 1.992 Income support duration: less than 12 months vs no income support
0.886 0.705 1.114
Income support duration: 12 months or more vs no income support
0.797* 0.639 0.995
Ex-offender: no vs yes 1.64* 1.463 1.839 Ex-offender: unknown vs yes 1.545* 1.212 1.968 Disability: no answer vs some disability 1.767* 1.247 2.503 Disability: none vs some disability 1.231* 1.11 1.365 English: combined vs poor 1.008 0.788 1.289 English: good vs poor 1.585* 1.295 1.941 Income support and crisis payment: received crisis payment vs other
0.593* 0.46 0.763
Income support and crisis payment: more than once on income support vs other
1.016 0.94 1.097
* Effect is statistically significant.
Table F.1 presents the odds ratios of the effects from the fitted model for the labour market
attachment measure. Effect refers to the two variables compared in the ratio. The odds ratio is the
relative change in probability of achieving a labour market attachment from the first effect to the
second effect. An odds ratio greater than 1 indicates that job seekers with the first effect are more
likely to achieve a labour market attachment than those with the second effect; the reverse is true
for odds ratios less than 1. Where the value 1 lies outside the lower and upper confidence limits,
the relative change between the effects is statistically significant. The effects that are statistically
significant are denoted with an asterisk (*).
The logistic regression shows participants in the initial six months of TtW were more likely to
achieve a labour market outcome than those in the jobactive comparison group.
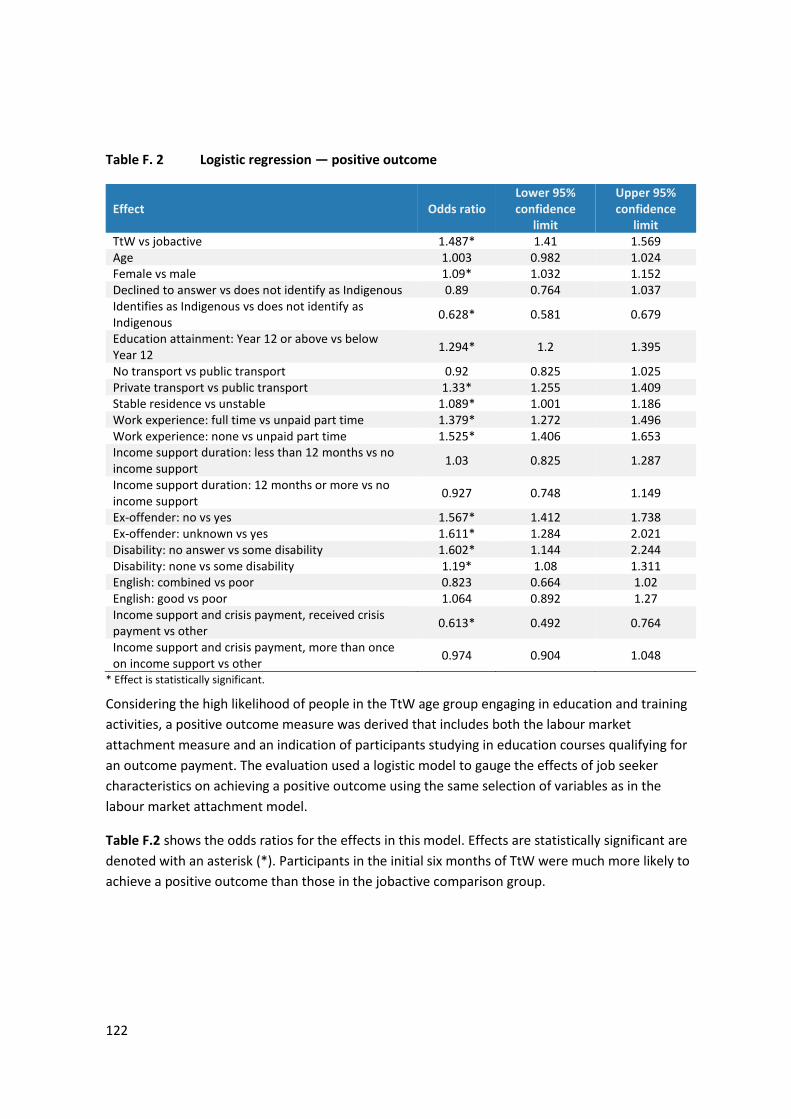
122
Table F. 2 Logistic regression — positive outcome
Effect Odds ratio Lower 95% confidence
limit
Upper 95% confidence
limit TtW vs jobactive 1.487* 1.41 1.569 Age 1.003 0.982 1.024 Female vs male 1.09* 1.032 1.152 Declined to answer vs does not identify as Indigenous 0.89 0.764 1.037 Identifies as Indigenous vs does not identify as Indigenous
0.628* 0.581 0.679
Education attainment: Year 12 or above vs below Year 12
1.294* 1.2 1.395
No transport vs public transport 0.92 0.825 1.025 Private transport vs public transport 1.33* 1.255 1.409 Stable residence vs unstable 1.089* 1.001 1.186 Work experience: full time vs unpaid part time 1.379* 1.272 1.496 Work experience: none vs unpaid part time 1.525* 1.406 1.653 Income support duration: less than 12 months vs no income support
1.03 0.825 1.287
Income support duration: 12 months or more vs no income support
0.927 0.748 1.149
Ex-offender: no vs yes 1.567* 1.412 1.738 Ex-offender: unknown vs yes 1.611* 1.284 2.021 Disability: no answer vs some disability 1.602* 1.144 2.244 Disability: none vs some disability 1.19* 1.08 1.311 English: combined vs poor 0.823 0.664 1.02 English: good vs poor 1.064 0.892 1.27 Income support and crisis payment, received crisis payment vs other
0.613* 0.492 0.764
Income support and crisis payment, more than once on income support vs other
0.974 0.904 1.048
* Effect is statistically significant.
Considering the high likelihood of people in the TtW age group engaging in education and training
activities, a positive outcome measure was derived that includes both the labour market
attachment measure and an indication of participants studying in education courses qualifying for
an outcome payment. The evaluation used a logistic model to gauge the effects of job seeker
characteristics on achieving a positive outcome using the same selection of variables as in the
labour market attachment model.
Table F.2 shows the odds ratios for the effects in this model. Effects are statistically significant are
denoted with an asterisk (*). Participants in the initial six months of TtW were much more likely to
achieve a positive outcome than those in the jobactive comparison group.
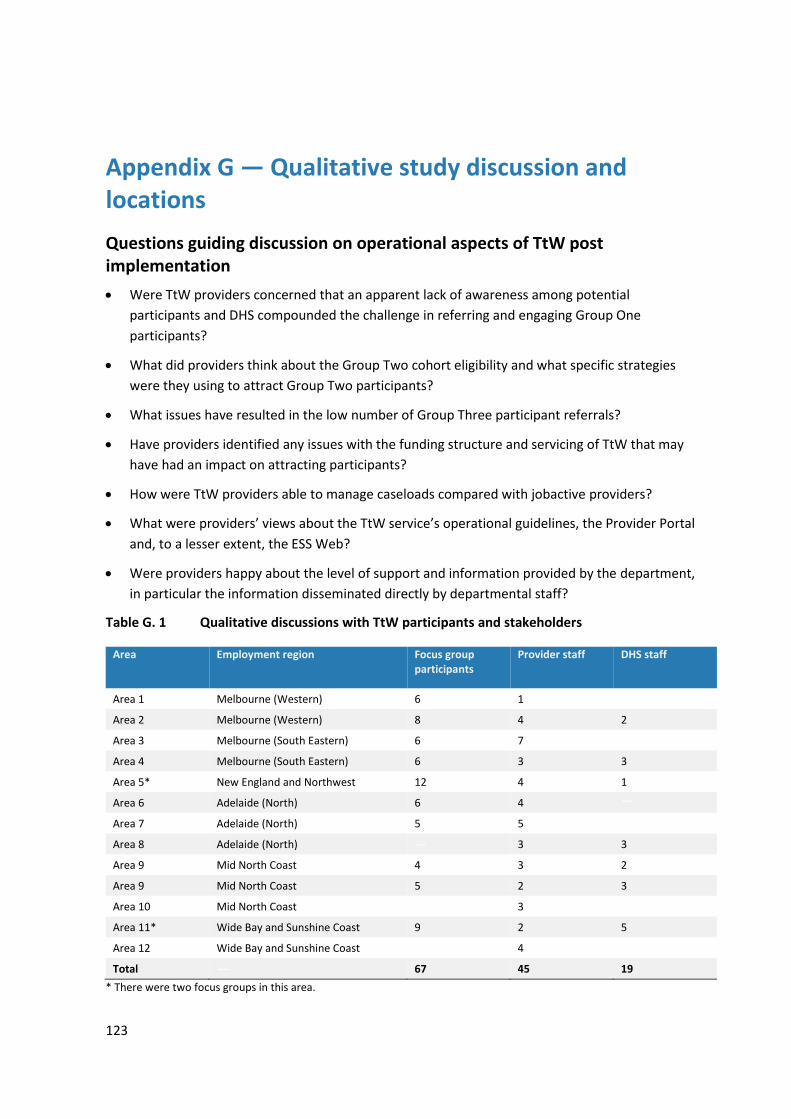
123
Appendix G — Qualitative study discussion and locations
Questions guiding discussion on operational aspects of TtW post implementation
Were TtW providers concerned that an apparent lack of awareness among potential
participants and DHS compounded the challenge in referring and engaging Group One
participants?
What did providers think about the Group Two cohort eligibility and what specific strategies
were they using to attract Group Two participants?
What issues have resulted in the low number of Group Three participant referrals?
Have providers identified any issues with the funding structure and servicing of TtW that may
have had an impact on attracting participants?
How were TtW providers able to manage caseloads compared with jobactive providers?
What were providers’ views about the TtW service’s operational guidelines, the Provider Portal
and, to a lesser extent, the ESS Web?
Were providers happy about the level of support and information provided by the department,
in particular the information disseminated directly by departmental staff?
Table G. 1 Qualitative discussions with TtW participants and stakeholders
Area Employment region Focus group participants
Provider staff DHS staff
Area 1 Melbourne (Western) 6 1 —
Area 2 Melbourne (Western) 8 4 2
Area 3 Melbourne (South Eastern) 6 7 —
Area 4 Melbourne (South Eastern) 6 3 3
Area 5* New England and Northwest 12 4 1
Area 6 Adelaide (North) 6 4 —
Area 7 Adelaide (North) 5 5 —
Area 8 Adelaide (North) — 3 3
Area 9 Mid North Coast 4 3 2
Area 9 Mid North Coast 5 2 3
Area 10 Mid North Coast — 3 —
Area 11* Wide Bay and Sunshine Coast 9 2 5
Area 12 Wide Bay and Sunshine Coast — 4 —
Total — 67 45 19
* There were two focus groups in this area.
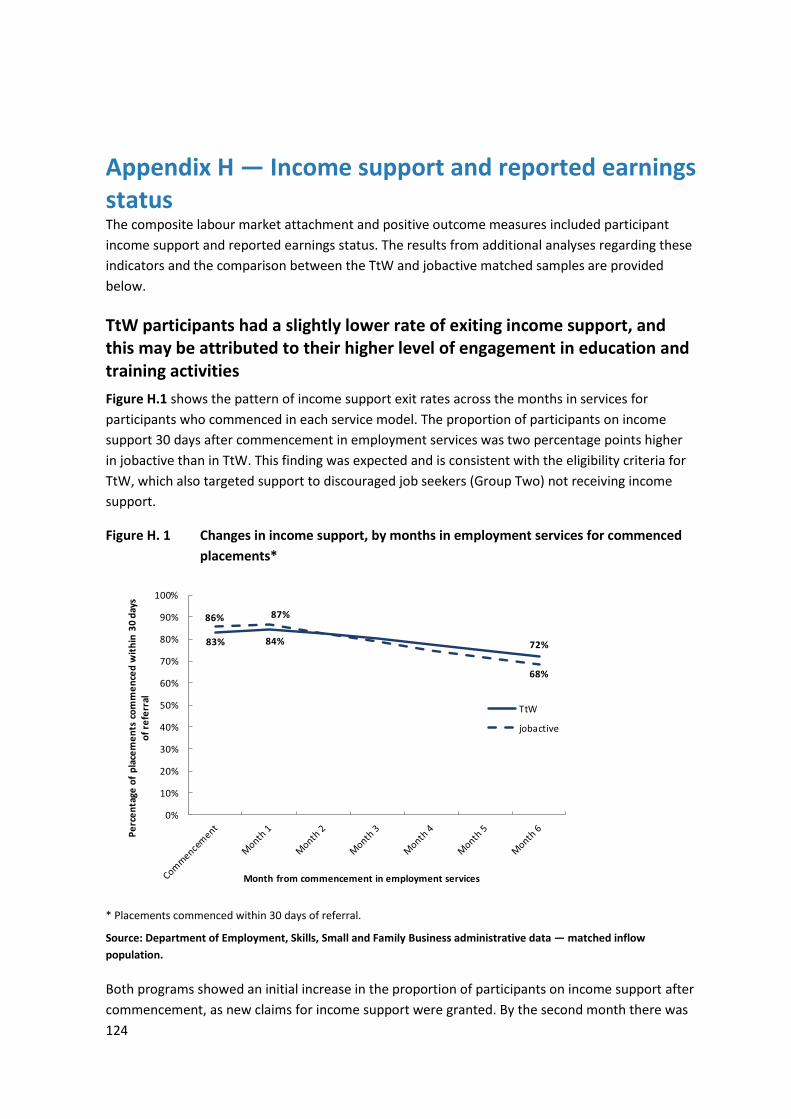
124
Appendix H — Income support and reported earnings status The composite labour market attachment and positive outcome measures included participant
income support and reported earnings status. The results from additional analyses regarding these
indicators and the comparison between the TtW and jobactive matched samples are provided
below.
TtW participants had a slightly lower rate of exiting income support, and this may be attributed to their higher level of engagement in education and training activities
Figure H.1 shows the pattern of income support exit rates across the months in services for
participants who commenced in each service model. The proportion of participants on income
support 30 days after commencement in employment services was two percentage points higher
in jobactive than in TtW. This finding was expected and is consistent with the eligibility criteria for
TtW, which also targeted support to discouraged job seekers (Group Two) not receiving income
support.
Figure H. 1 Changes in income support, by months in employment services for commenced
placements*
* Placements commenced within 30 days of referral.
Source: Department of Employment, Skills, Small and Family Business administrative data — matched inflow
population.
Both programs showed an initial increase in the proportion of participants on income support after
commencement, as new claims for income support were granted. By the second month there was
83% 84% 72%
86% 87%
68%
0%
10%
20%
30%
40%
50%
60%
70%
80%
90%
100%
Pe
rce
nta
ge o
f p
lace
me
nts
co
mm
en
ced
wit
hin
30
day
s o
f re
ferr
al
Month from commencement in employment services
TtW
jobactive

125
a steady increase in rates of exit from income support in both programs, as young people found
jobs and earned enough to reduce their payment to zero.
The greater flexibility to undertake education and training in TtW is likely to be a contributing
factor in reliance on income support, as young people combine work and study but do not earn
enough to totally withdraw from income support. Other young people engaging in full-time study
may transfer to a student payment. For young people tracking towards an educational outcome, it
is still too early for many in the inflow population to have reached the 26-week limit to achieve an
outcome (participation) or complete their course (attainment). Therefore it is not expected that
the TtW group tracking towards an educational outcome or engaged in other prerequisite courses
would be in a position to earn enough to move off income support over the study period.
In essence, this represents the attachment effect of higher level engagement of TtW participants in
education and training activities.
The rate at which young people come off income support is also gender related. The gender
difference in exit rates was statistically significant. Male participants were more likely than female
participants to exit income support. Women generally have more caring responsibilities, are more
likely to work part-time or casually, and receive lower incomes than men. This means that, while
women may have a similar rate of attachment to the labour market, they are less likely to earn
enough to cease reliance on income support completely.
Since the 1970s, the ABS38 has identified a trend of falling full-time job opportunities for young
people. In addition, there has been substantial growth in industries that offer part-time
employment and typically attract young women, such as retail and hospitality services. Many
young women working few hours in low-paying jobs will continue to rely on income support before
securing a full-time job.
The final TtW evaluation report will provide more detailed analysis of the destinations of young
people exiting employment services, including those moving to other non-activity-tested payments
such as Youth Allowance (Student) and Disability Support Pension.
Low earnings among young people meant that few went off income support or reduced their income support payments significantly
While the average earnings for young people reporting earnings to DHS are generally above the
earnings threshold, they are considerably lower than the Youth Allowance (Other) payment cut-out
level for a single person living away from home (or a member of a couple). These findings indicate
that, despite increasing their earnings in the short term, the increase is not enough to move many
TtW participants off their reliance on income support.
38 ABS Cat. No. 4102.0—Australian Social Trends, April 2013.

126
An investigation of reported earnings reveals differences in the amounts earned by TtW
participants and jobactive participants. Figure H.2 shows average earnings reported to DHS over
the study period for the matched inflow populations.
The reported earnings of jobactive participants were initially higher than those of TtW participants
but after the first month remained relatively constant over the study period, although they rose
slightly by the third month. For TtW participants, average earnings gradually increased over the six-
month study period to a level similar to that reported by jobactive participants.
Recipients of income support can earn up to the income threshold amount and still receive their
base rate of payment. For example, a single independent job seeker could earn up to $143 per
fortnight without decreasing their Youth Allowance (Other) payment. For a full-time apprentice an
income-free threshold of $433 per fortnight applied during the study period. Reductions in the
base rate of income support provide another means of investigating the impact of paid work on
income support payments.
Figure H. 2 Average earnings for participants commenced within 30 days of referral who
reported employment income to DHS, by month39
* Applies to a single (or member of couple) Youth Allowance (Other) recipient living away from home.
Source: Department of Employment, Skills, Small and Family Business administrative data — matched inflow
population; DHS administrative data.
39 Does not include earnings for young people who have exited to employment and are no longer eligible for income support.
$713
$888
$825$894
0
200
400
600
800
1000
1200
1400
1600
1800
2000
At referral Month 1 Month 2 Month 3 Month 4 Month 5 Month 6
Ave
rage
ear
nin
gs r
ep
ort
ed
pe
r m
on
th (
$)
Month from commencement
TtW jobactive
YA(O) threshold YA(O) cut-out*
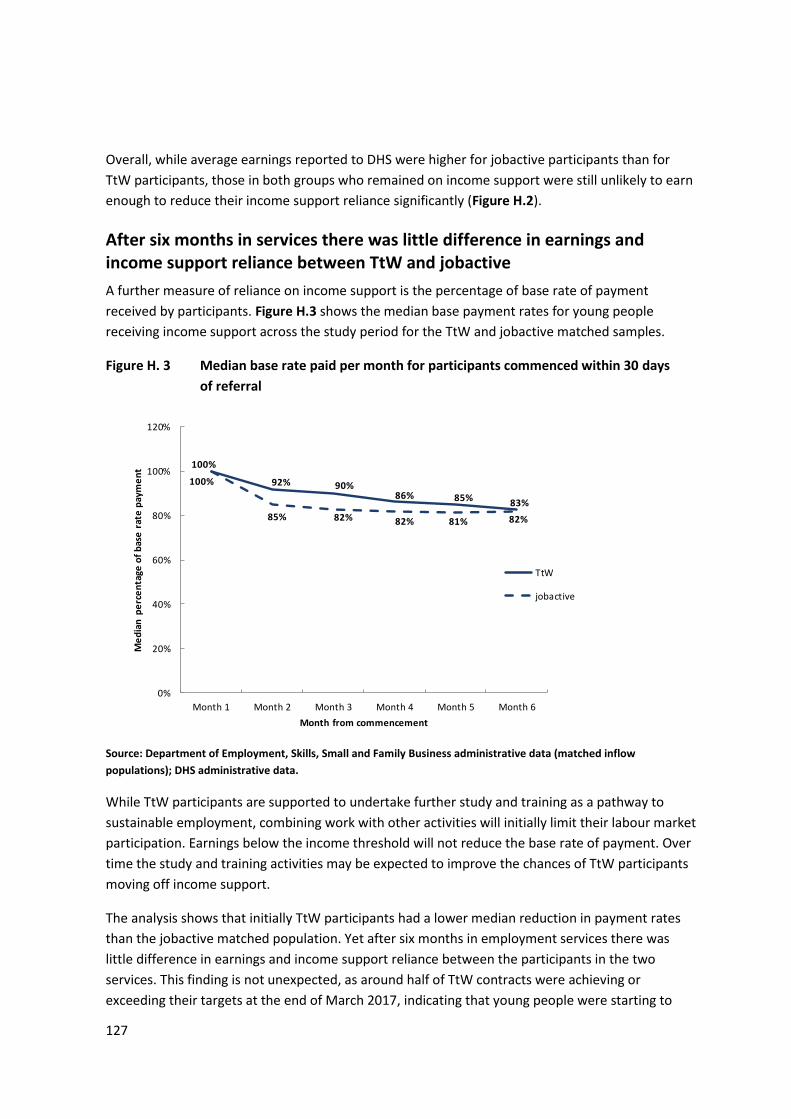
127
Overall, while average earnings reported to DHS were higher for jobactive participants than for
TtW participants, those in both groups who remained on income support were still unlikely to earn
enough to reduce their income support reliance significantly (Figure H.2).
After six months in services there was little difference in earnings and income support reliance between TtW and jobactive
A further measure of reliance on income support is the percentage of base rate of payment
received by participants. Figure H.3 shows the median base payment rates for young people
receiving income support across the study period for the TtW and jobactive matched samples.
Figure H. 3 Median base rate paid per month for participants commenced within 30 days
of referral
Source: Department of Employment, Skills, Small and Family Business administrative data (matched inflow
populations); DHS administrative data.
While TtW participants are supported to undertake further study and training as a pathway to
sustainable employment, combining work with other activities will initially limit their labour market
participation. Earnings below the income threshold will not reduce the base rate of payment. Over
time the study and training activities may be expected to improve the chances of TtW participants
moving off income support.
The analysis shows that initially TtW participants had a lower median reduction in payment rates
than the jobactive matched population. Yet after six months in employment services there was
little difference in earnings and income support reliance between the participants in the two
services. This finding is not unexpected, as around half of TtW contracts were achieving or
exceeding their targets at the end of March 2017, indicating that young people were starting to
100%
92% 90%86% 85% 83%
100%
85% 82% 82% 81% 82%
0%
20%
40%
60%
80%
100%
120%
Month 1 Month 2 Month 3 Month 4 Month 5 Month 6
Me
dia
n p
erc
en
tage
of
bas
e r
ate
pay
me
nt
Month from commencement
TtW
jobactive
128
move into paid work and off income support. This was also consistent with the increase in average
earnings reported by TtW participants over the same period (Section H.2).
On the other hand, the median base payment rate for the jobactive matched population remained
relatively constant over the study period, as job seekers are expected to apply for jobs and move
into paid employment and off income support.
The final evaluation report will examine the outcomes of eligible participants who participated in
TtW services over the full 12 months and examine the outcomes of young people who were
referred back to jobactive.
129
End notes
1 dandolopartners (2012) Interim Evaluation of the National Partnership on Youth Attainment and
Transitions: A Report for the Department of Education, Employment and Workplace Relation.
dandolopartners: Melbourne. 2 Liu, S-H & Nguyen, N (2011) Successful youth transitions. Longitudinal Surveys of Australian Youth: Briefing
Paper 25. National Centre for Vocational Education Research: Adelaide. 3 Anlezark, A (2011) At Risk Youth: A Transitory State? Longitudinal Surveys of Australian Youth: Briefing
Paper 24. National Centre for Vocational Education Research: Adelaide. 4 OECD (2017) Connecting People with Jobs: Key Issues for Raising Labour Market
Participation in Australia. OECD Publishing: Paris. 5 ABS (2018) Labour Force, Australia: Time Series Spreadsheets Table 13. Labour Force Status for 15–24 Year
Olds by Sex—Trend, Seasonally Adjusted and Original. Cat. No. 6202.0, March. 6 European Foundation for the Improvement of Living and Working Conditions (Eurofound) (2012) NEETs —
Young People Not in Employment, Education or Training: Characteristics, Costs and Policy Responses in
Europe. Publications Office of the European Union: Luxembourg. 7 Kluve, J (2014) Youth Labor market interventions. IZA World of Labor, 2014:106. 8 Mourshed, M, Farrell, D & Barton, D (2013) Education to Employment: Designing a System that Works.
McKinsey Center for Government. 9 Eurofound (2012) Effectiveness of Policy Measures to Increase the Employment Participation of Young
People. Report prepared by J Hawley, A-M Hall-Nevala & T Weber. Eurofound: Dublin. 10 Kluve (2014). 11 Eurofound (2012). 12 Hawley, Hall-Nevala & Weber for Eurofound. 13 Eurofound (2012). 14 Eichhorst, W (2015) Does vocational training help young people find a (good) job? IZA World of Labor,
2015:112. 15 Borland, J (2014) Dealing with unemployment: What should be the role of labour market programs?
Evidence Base, 2014(4). 16 Kluve (2014). 17 Borland, J (2015) The Australian labour market: The more things change. The Australian Economic Review,
48(3): 225–242. 18 Borland (2014). 19 Eurofound (2012). 20 Hawley, Hall-Nevala & Weber for Eurofound (2012). 21 Independent Evaluation Group (2013) Youth Employment Programs: An Evaluation of World Bank and IFC
Support. World Bank: Washington, D.C. 22 Commonwealth of Australia, Job Placement, Employment and Training program (JPET), Operation and
outcomes, 2006–07. Unpublished report. 23 Hawley, Hall-Nevala & Weber for Eurofound (2012). 24 O’Higgins, N (2001) Youth Unemployment and Employment Policy: A Global Perspective. International
Labour Office: Geneva. 25 Borland (2014). 26 Eurofound (2012).

130
27 Carcillo, S, Fernandez, R, Konigs, S & Minea, A (2015) NEET Youth in the Aftermath of the Crisis: Challenges
and Policies. OECD Social, Employment and Migration Working Papers, No. 164. OECD Publishing: Paris. 28 Insights MSD (2014) Youth Service Evaluation Report. Ministry of Social Development: Wellington. 29 Australian National Audit Office (2009) Evaluation of the Indigenous Youth Mobility Program: Final Report.
Department of Finance and Deregulation: Canberra. 30 Kluve (2014). 31 Borland (2014). 32 Sanders, M, Kristal, A, Sabri F & Tupper, A (2013) Aspiration & Inspiration — A Pilot Study of Mentoring in
Schools. Centre for Market and Public Organisation Working Paper Series, No. 13/314. Centre for Market and
Public Organisation: Bristol. 33 Insights MSD (2014). 34 dandolopartners (2012). 35 National Youth Affairs Research Scheme (1996) Young People and Self-employment in Australia. Report
prepared by P Kenyon & S White. National Clearinghouse for Youth Studies: Hobart. 36 Valentine, JC, Hirschy, AS, Bremer, CD, Novillo, A, Castellano, M & Banister, A (2009) Systematic Reviews of
Research: Postsecondary Transitions — Identifying Effective Models and Practices. National Research Centre
for Career and Technical Education: Louisville. 37 OECD & International Labour Organisation (2014) Promoting Better Labour Market Outcomes for Youth.
Background paper for the G20 Labour and Employment Ministerial Meeting, Melbourne, 10–11 September
2014. 38 Bell, D. (2012) Labour Market Attachment: Defining the spectrum between the employed and the inactive.
Canadian Career Development Foundation: Ottawa.