Transition to Practice Study: Outcomes Data
20
Transition to Practice Study: Outcomes Data Mary Blegen, PhD, RN, FAAN Mary Lynn, PhD, RN Phase II Site Coordinator Meeting February 1, 2012
-
Upload
benjiro-fujii -
Category
Documents
-
view
26 -
download
0
description
Transition to Practice Study: Outcomes Data. Mary Blegen, PhD, RN, FAAN Mary Lynn, PhD, RN Phase II Site Coordinator Meeting February 1, 2012. Why do outcomes matter?. When outcomes are used something is the “cause” and something is the “effect” even if the study is not “causal” in nature - PowerPoint PPT Presentation
Transcript of Transition to Practice Study: Outcomes Data

Transition to Practice Study:Outcomes Data
Mary Blegen, PhD, RN, FAAN
Mary Lynn, PhD, RN
Phase II Site Coordinator Meeting
February 1, 2012

Why do outcomes matter?
When outcomes are used something is the “cause” and something is the “effect” even if the study is not “causal” in nature
In other words “A” leads to “B” (or “B” is a consequence of “A”)
If A leads to B …
A B

And B isn’t available…
A B

You are left with “A”
AWhich does not allow you to examine the possible impact of “A” on what you think it might effect.

The “causes” are a bit easier In this study - Randomly assigned
organizations to intervention and control groups Surveys can easily be identical for all
participants Fairly easy to prompt for them to be completed
at or about the same time (or the appropriate time)
Some of the “A”s are demographics (personal or institutional) and can be obtained whenever
A

“Outcomes” are not as easy
The same variable will differ in its definition across institutions, even if the same type (e.g., differ hospital to hospital)
In this Phase we have a mix of institutional types (e.g., home care, long term care, etc.) that leads to many different definitions
Outcomes “over time” require more motivation (and nudging) to obtain
B
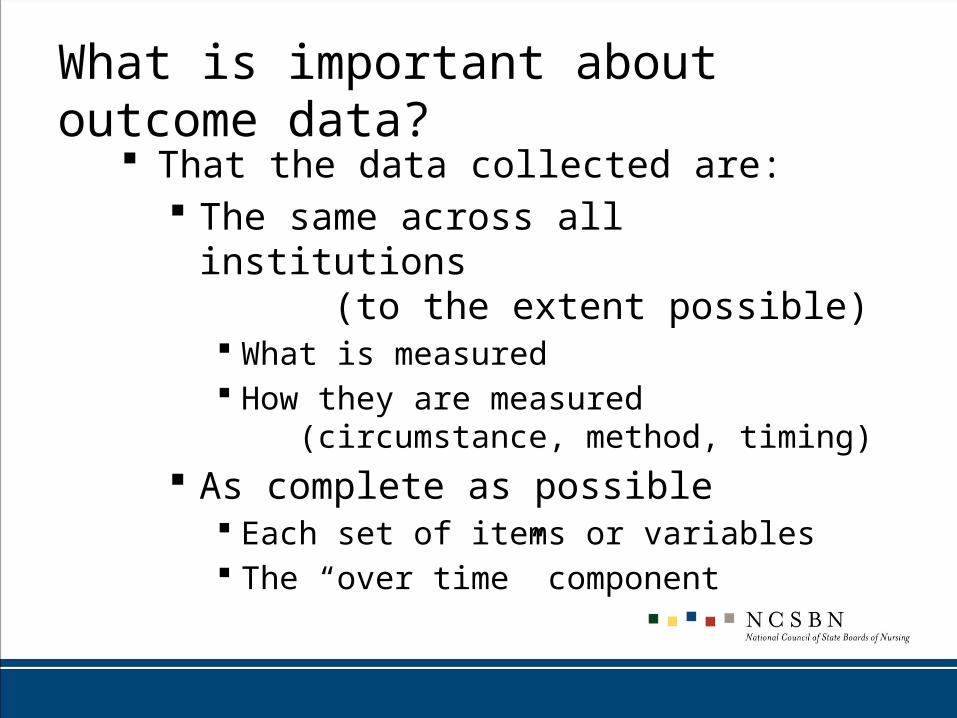
What is important about outcome data? That the data collected are:
The same across all institutions (to the extent possible) What is measured How they are measured
(circumstance, method, timing)
As complete as possible Each set of items or variables The “over time” component
B

The “over time” part is important
Baseline BaselineBaselineBaseline
6 months 6 months 6 months
9 months
12 months
9 months9 months
12 months 12 months
Ideal
Each problematic

For this research studyAim is to determine the effects of the TTP intervention, and the feasibility of this intervention in non-hospital setting Must have valid data for comparison
Across facilities – intervention and control Across time – before and after the study
(Valid means accurate, measuring what we intend to measure, and comparable across agencies and time)
Measures should be similar in all organizations Surveys will be the same Outcomes data will be appropriate for each type of
organization Data collected using the same definitions and care

Obtaining Comparable Data is a major challenge
Particularly with different types of organizations 39 long term care 4 public health 3 home health 2 ambulatory care

Collecting Data TTP project
Outcomes and Context
Nurse Participants Organizations Patient/Client/Resident

Nurse Participants
New Nurse Survey Job satisfaction Knowledge Perception of competence Stress Report of Errors
Preceptor Survey Effectiveness Knowledge Perception of new nurse

Organization Data
Size Number of Beds, Days of Care, Visits, Clients,
Services provided Nursing Staff Size and Composition
Numbers of RNs, LPNs, unlicensed nursing assistants
Budgeted, Actual, New hires, Contract/Per diem Nursing Retention (turnover)
Voluntary – organization could control Voluntary – organization could not control Terminations – organization decides

Outcomes of Nursing Care Provided (patient, resident, client outcomes)
Site Coordinator reporting Patient/client satisfaction
With data available at each organization Use existing data for each type of site

Quality Outcomes Assessment
Site Coordinators will complete this survey Survey was adapted to provide a comparable
measure across our four types of sites from Nursing Intervention subscale of the Community Health Nursing Outcomes Inventory
Nurse considers patients’ prior functioning Nurse identified goals/areas to jointly work with patient Patients are in control of their health outcomes Nurse ensures that services/resources are available Nurse makes appropriate healthcare referrals

Service Outcomes: examples
Nursing Home – Nursing Home Compare Pressure ulcers -- Weight Loss Depression / anxiety -- Restraints Flu/pneumonia vaccine
Home Health – Home Health Compare Pain decreased Improvements in breathing, wound healing Medication accuracy and knowledge Flu/pneumonia vaccine

Service Outcomes: examples Ambulatory - Agency Healthcare Research
Quality Falls and fall risk assessment Medication reconciliation Flu/pneumonia vaccine ER visits within 28 days
Public health – Immunizations for children Rate of Chlamydia Prenatal care in first trimester

Summary The planned data collection will evaluate the
Nurse Participants, Preceptors, Organization, Outcomes It will be similar across all organizations
(outcomes appropriate to site type) Collected at both Intervention and Control sites What is measured is nearly the same How they are measured is nearly the same As complete as possible at each point in time And, collected at two or more points in time to allow
comparison over time within each organization, in types of organizations and for the entire sample.

Questions?