Transit Development Plan - Palm Beach County,...
44
Transit Development Plan Annual Update (FY 2019 – FY 2028) Prepared by: Palm Tran, Inc. 3201 Electronics Way West Palm Beach, FL 33407 Telephone: 561-841-4200 Website: www.palmtran.org
Transcript of Transit Development Plan - Palm Beach County,...

Transit Development
Plan Annual Update (FY 2019 – FY 2028)
Prepared by:
Palm Tran, Inc. 3201 Electronics Way
West Palm Beach, FL 33407 Telephone: 561-841-4200
Website: www.palmtran.org

Palm Tran 2019-2028 TDP Annual Update
2
Table of Contents
PALM TRAN MISSION ................................................................................................................................................................ 5
PALM TRAN VISION ................................................................................................................................................................... 5
INTRODUCTION ......................................................................................................................................................................... 5
TDP ANNUAL UPDATE CHECKLIST ............................................................................................................................................. 5
PALM TRAN SYSTEM OVERVIEW ............................................................................................................................................... 6
FIXED-ROUTE FARE INFORMATION .......................................................................................................................................... 6
FIXED-ROUTE OPERATION STATISTICS ....................................................................................................................................... 7
PARATRANSIT OVERVIEW ......................................................................................................................................................... 8
PALM TRAN SERVICE AND CAPITAL PROJECT ACCOMPLISHMENTS IN FY 2018 ........................................................................ 11
ROUTE PERFORMANCE MAXIMIZATION (RPM) ...................................................................................................................... 12
FREQUENCY IMPROVEMENTS ................................................................................................................................................ 18
SERVICE OF SPAN IMPROVEMENTS ........................................................................................................................................ 19
RPM RESULTS .......................................................................................................................................................................... 20
RPM PROJECT TIMELINE (2017-2018) .................................................................................................................................... 23
ANALYSIS OF DISCREPANCIES ................................................................................................................................................. 26
SUMMARY OF PLANNED FY 2019 SERVICE CHANGES ............................................................................................................ 28
GO GLADES FLEX SERVICE ....................................................................................................................................................... 28
CAPITAL PROJECT/PLANNING STUDY UPDATES ..................................................................................................................... 30
FARE INTEROPERABILITY Project Update ............................................................................................................................... 30
PALM TRAN CONNECTION EFFICIENCY PROJECT .................................................................................................................... 30
PALM TRAN TRANSIT ASSET MANAGEMENT (TAM) PLAN: .................................................................................................... 30
PALM TRAN BUS SHELTER RETIREMENT AND EXPANSION PLAN ........................................................................................... 31
COLLEGE/EMPLOYER BUS PASS PROGRAM ............................................................................................................................ 31
PALM TRAN DELRAY BEACH ADMINISTRATIVE FACILITY UPDATE: ......................................................................................... 31
US 1 MULTIMODAL CORRIDOR STUDY ................................................................................................................................... 32
OTHER UPDATES ..................................................................................................................................................................... 33
FY 2019 PROJECTS SUMMARY/GOALS AND OBJECTIVES MATRIX .......................................................................................... 34
FINANCIAL PLAN FY 2019-2028 .............................................................................................................................................. 35
ANNUAL FAREBOX RECOVERY REPORT .................................................................................................................................. 36
APPENDIX A- GOALS AND OBJECTIVES ................................................................................................................................... 37

Palm Tran 2019-2028 TDP Annual Update
3
List of Tables and Figures
Table 1- Palm Tran Fixed-Route Fare Structure ........................................................................................................................ 6 Table 2 - Palm Tran Fixed-Route Ridership with Percent of Change (FY 2009 – Current) ........................................................ 7 Table 3- Fixed-Route Ridership by Route, FY 2018 vs. FY 2017 .............................................................................................. 10 Table 4 – RPM Before and After Comparison, Frequency by Route ....................................................................................... 18 Table 5 – RPM Service Span Change by Route ....................................................................................................................... 19 Table 6 – OTP and Ridership by Route, Before and After RPM .............................................................................................. 20 Table 7 – People/Jobs Accessible from Major Palm Tran Hubs, Before and After RPM ........................................................ 21 Table 8 - FY 2019-FY 2028 Service Plan Progress Report (Updated from 2018-27 Annual Update TDP) .............................. 27 Table 9 – PT-Stat Completed Intiatives, FY 2018 .................................................................................................................... 33 Table 10 – Palm Tran TDP Goals and Objectives Matrix ......................................................................................................... 34

Palm Tran 2019-2028 TDP Annual Update
4
Figure 1 - Annual Palm Tran Fixed-Route Ridership (FY 2009- Current)................................................................................... 7 Figure 2 – Palm Tran System Map ............................................................................................................................................ 9 Figure 3- Route 4 Extension Ribbon Cutting ........................................................................................................................... 11 Figure 4 – Map of RPM Changes, North County area ............................................................................................................. 14 Figure 5 –Map of RPM Changes, Greater West Palm Beach Area .......................................................................................... 15 Figure 6 – Map of RPM Changes in Lake Worth, Boynton Beach and Greenacres ................................................................ 15 Figure 7 – Map of RPM Changes, Delray Beach ...................................................................................................................... 16 Figure 8 – Map of RPM Changes, Boca Raton ........................................................................................................................ 16 Figure 9 - Map of RPM Changes, Glades Area ....................................................................................................................... 17 Figure 10 – Palm Tran Service to Tri-Rail stations in Palm Beach County .............................................................................. 22 Figure 11- RPM Timeline ......................................................................................................................................................... 23 Figure 12 – Palm Beach County Board of County Commissioners ......................................................................................... 23 Figure 13 – RPM Outreach at Carolyn Sims Center, Boynton Beach ...................................................................................... 24 Figure 14 – Executive Director Clinton B. Forbes and Assistant County Administrator Todd Bonlarron conducting RPM Outreach at Intermodal .......................................................................................................................................................... 24 Figure 15 – Go Glades Map of Belle Glade and South Bay ..................................................................................................... 29 Figure 16 – Go Glades Map of Pahokee .................................................................................................................................. 29 Figure 17 – Delray Beach Administrative Facility (projected to be completed in 2020) ........................................................ 32 Figure 18 - West Palm Beach Brightline ................................................................................................................................. 33 Figure 19 – Flashing Lights Initiative ....................................................................................................................................... 33 Figure 20 - Projected Costs vs. Revenues (FY 2019-2028) ...................................................................................................... 35 Figure 21 - Palm Tran Farebox Recovery (FY 2009-FY 2018) .................................................................................................. 36

Palm Tran 2019-2028 TDP Annual Update
5
PALM TRAN MISSION Palm Tran’s mission is to provide access to opportunity for everyone; safely, efficiently and courteously. PALM TRAN VISION Palm Tran’s vision is to be the premier transportation choice in Palm Beach County.
INTRODUCTION The 2017-2026 Palm Tran Major Update Transit Development Plan (TDP), adopted November 2016, is the strategic guide for public transportation in Palm Beach County over the next ten years. The Florida Department of Transportation (FDOT) requires public transit providers that receive state funding to develop and adopt a TDP consistent with Chapter 14-73.001 of the Florida Administrative Code (FAC), and section 341.071 of the Florida Statutes (FS). A major update to a TDP is conducted every five years and includes a review of transit planning and policy documents, a documentation of study area conditions and demographic characteristics, and evaluation of existing Palm Tran services, a summary of market research and public involvement efforts, the development of a situation appraisal and needs assessment, and the preparation of a ten-year transit development plan. An annual progress report is done in the years following the major update and this document serves as the second annual progress report to Palm Tran’s 2017-2026 Major Update. TDP ANNUAL UPDATE CHECKLIST
This TDP Annual Update meets the requirement for a major TDP update in accordance with Rule 14- – Public Transit, Florida Administrative Code (F.A.C). Per this code, TDP Annual Updates are required to document the following:
• Past year’s accomplishments compared to the original implementation program; • Analysis of any discrepancies between the plan and its implementation for the past year and
steps that will be taken to attain original goals and objectives; • Any revisions to the implementation program for the coming year; • Revised implementation program for the tenth year; • Added recommendations for the new tenth year of the updated plan; • A revised financial plan; and • A revised list of projects and services needed to meet the goals and objectives, including
projects for which funding may not have been identified.

Palm Tran 2019-2028 TDP Annual Update
6
PALM TRAN SYSTEM OVERVIEW Palm Tran is the major public transportation provider in Palm Beach County providing both fixed-route and paratransit service. Fixed-route bus service includes 32 routes and provides connections to the County’s multimodal transportation network to its main hub, the West Palm Beach Intermodal Center, as well as its major transfer locations. Major transfer locations include Wellington Mall, West Palm Beach VA Medical Center, Boca Town Center Mall, and Gardens Mall as well as the six Tri-Rail stations in the County. Palm Tran Connection, Palm Tran’s shared-ride, door-to-door paratransit service, provides transportation for disabled residents and visitors in Palm Beach County. Service is provided under three programs—Americans with Disabilities (ADA) Program, Division of Senior Services (DOSS) and the Transportation Disadvantaged (TD) Program). Palm Tran Connection travels in Palm Beach County from Jupiter to Boca Raton and from Palm Beach to South Bay. As shown in Figure 2 – Palm Tran System Map, Palm Tran also provides connections to its partner agency to the south, Broward County Transit (BCT) at Camino Real via routes 1, 92, and 94 as well as at Sandalfoot Plaza, which are both located in greater Boca Raton. In addition, Palm Tran also serves a northeast section of Broward County along Hillsboro Blvd. in Deerfield Beach where it provides connections with BCT Routes 10 and 48. Transfers to its northern neighbor system, Marty/Martin County Transit, are available at Gardens Mall in Palm Beach Gardens. FIXED-ROUTE FARE INFORMATION Table 1 summarizes Palm Tran’s fare structure. The fares include a 1-Trip fare, an Unlimited 1-Day, and an Unlimited 31-Day Pass.
Table 1- Palm Tran Fixed-Route Fare Structure
Reduced fixed-route fares are available for senior citizens (65 and over), people with disabilities, students (age 21 or under), Medicare cardholders, and Veterans Administration cardholders. Customers with disabilities must show their half-fare identification card issued by Palm Tran or Palm Tran Connection. Customers with a green-striped (issued from CONNECTION) ADA-photo identification card, children 8 years or younger (when accompanied by a fare paying passenger) ride for free. Police officers in uniform also ride for free.

Palm Tran 2019-2028 TDP Annual Update
7
FIXED-ROUTE OPERATION STATISTICS Figure 1 illustrates Palm Tran’s fixed-route ridership from FY 2009 through FY 2018. As shown in Table 2, ridership exceeded 9.1 million passenger trips in FY 2018 an increase from the previous year by 1.6%.
Figure 1 - Annual Palm Tran Fixed-Route Ridership (FY 2009- Current)
Table 2 - Palm Tran Fixed-Route Ridership with Percent of Change (FY 2009 – Current)

Palm Tran 2019-2028 TDP Annual Update
8
As shown in Figure 2, Palm Tran‘s route structure features three main “trunk” lines (Routes 1, 2, and 3) supported by major east-west corridors connecting western suburbs to a consecutive string of coastal downtowns. Major east-west routes include Routes 31,43,46,62, and 91. Key markets served by Palm Tran also include the western communities along Lake Okeechobee (shown in Figure 3) as well as central county communities such as Wellington. PARATRANSIT OVERVIEW
Palm Tran Connection provided 935, 242 completed passenger trips in FY 2018 which represented a slight 5.7% increase over FY 2016 ‘s 883,623 total. The Americans with Disabilities Act (ADA) core service area includes any location within 3/4-mile of fixed-route bus service. Transportation Disadvantaged Program (TD) is located outside of the ADA core service area. TD service is sponsored by the State of Florida Transportation Disadvantaged Trust Fund. Service is provided anywhere in Palm Beach County during the same hours and days as Palm Tran fixed-route bus service. To become eligible for TD service, the applicant must submit proof of income, or a physician completed medical verification form and their completed application. Transportation Disadvantaged (TD) Eligible customers may qualify for a discounted TD Bus Pass if they meet household income guidelines that fall between at 150% of the Federal Poverty Level or below. Connection fares are $3.50 per one-way trip, cash-only. Children age 8 and under riding Connection as well as personal care attendants ride for no charge. Connection schedules all trips, prepares vehicle manifests, handles customer concerns & commendations, determines eligibility, and monitors the performance of the transportation providers (Maruti, First Transit and MV Transportation).

Palm Tran 2019-2028 TDP Annual Update
9
Figure 2 – Palm Tran System Map

Palm Tran 2019-2028 TDP Annual Update
10
Table 3- Fixed-Route Ridership by Route, FY 2018 vs. FY 2017

Palm Tran 2019-2028 TDP Annual Update
11
PALM TRAN SERVICE AND CAPITAL PROJECT ACCOMPLISHMENTS IN FY 2018 SUMMARY OF FY 2018 SERVICE CHANGES
Route 4 Extension Prior to the Palm Tran’s network redesign known as the RPM (Route Performance Maximization), Palm Tran extended Route 4/Haverhill six miles to the FIT-Team Ballpark of the Palm Beaches and VA Medical Center in January 2018 as a precursor to the RPM. As part of the extension, frequency on this route was improved from 88 minutes to 60 minutes and Sunday service was added. Since December 2017, ridership has increased over 200%. The Route 4 extension was supported by the agency, in particular Palm Tran’s PT-Stat (Palm Tran Statistics) program, which visited multiple residential complexes and employers on the corridor to promote and increase awareness of the new service.
Figure 3- Route 4 Extension Ribbon Cutting

Palm Tran 2019-2028 TDP Annual Update
12
ROUTE PERFORMANCE MAXIMIZATION (RPM)
Palm Tran recently completed its highest priority project, entitled the Route Performance Maximization (RPM) initiative. Similar to other transit agency initiatives around the country, the RPM entailed an overhaul of the fixed-route network to maximize service efficiencies to current and future customers. The RPM featured an “enhanced coverage” network that improved span and frequency on key routes with minimal impact to existing customers. A critical component of the network changes involved straightening out routes to provide more direct service and improve travel times. These changes allowed routes to be extended to new areas west of Military Trail. The RPM also strengthened connecting service to its key hubs such as Gardens and Wellington Malls and more service to Tri-Rail stations throughout the County. Some other benefits of the RPM include Saturday service on all routes; previously there were two out of 34 routes that did not provide service on Saturday. In addition, there is an 8% increase in the percentage of routes that have Sunday service; previously 10 out of 34 routes had no service on Sunday. Another improvement of the RPM was the implementation of time of day scheduling as well as an enhanced timed transfer system at major Palm Tran hubs such as the Intermodal, Gardens Mall, Wellington Mall, Boca Town Center and VA Hospital. In addition, WiFi was implemented onboard all Palm Tran fixed-route buses with the start of RPM service.
Palm Tran 2019-2028 TDP Annual Update
13
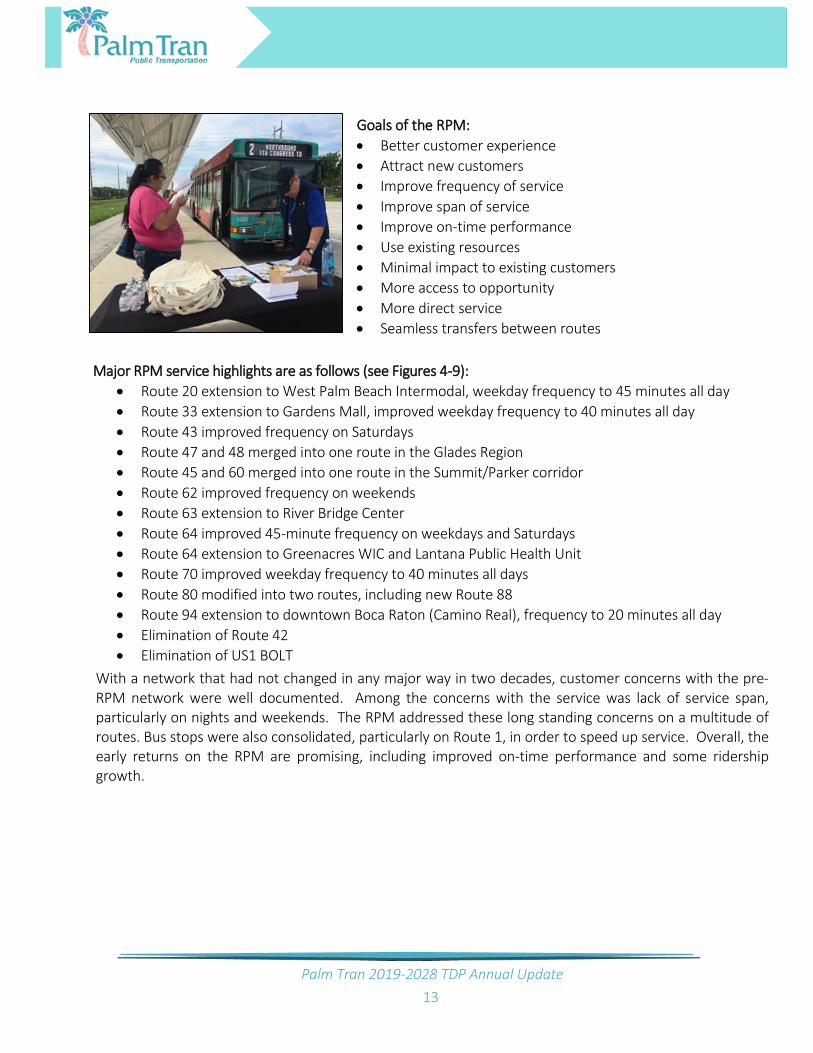
Goals of the RPM: • Better customer experience • Attract new customers • Improve frequency of service • Improve span of service • Improve on-time performance • Use existing resources • Minimal impact to existing customers • More access to opportunity • More direct service • Seamless transfers between routes
Major RPM service highlights are as follows (see Figures 4-9):
• Route 20 extension to West Palm Beach Intermodal, weekday frequency to 45 minutes all day • Route 33 extension to Gardens Mall, improved weekday frequency to 40 minutes all day • Route 43 improved frequency on Saturdays • Route 47 and 48 merged into one route in the Glades Region • Route 45 and 60 merged into one route in the Summit/Parker corridor • Route 62 improved frequency on weekends • Route 63 extension to River Bridge Center • Route 64 improved 45-minute frequency on weekdays and Saturdays • Route 64 extension to Greenacres WIC and Lantana Public Health Unit • Route 70 improved weekday frequency to 40 minutes all days • Route 80 modified into two routes, including new Route 88 • Route 94 extension to downtown Boca Raton (Camino Real), frequency to 20 minutes all day • Elimination of Route 42 • Elimination of US1 BOLT
With a network that had not changed in any major way in two decades, customer concerns with the pre-RPM network were well documented. Among the concerns with the service was lack of service span, particularly on nights and weekends. The RPM addressed these long standing concerns on a multitude of routes. Bus stops were also consolidated, particularly on Route 1, in order to speed up service. Overall, the early returns on the RPM are promising, including improved on-time performance and some ridership growth.

Palm Tran 2019-2028 TDP Annual Update
14
Figure 4 – Map of RPM Changes, North County area

Palm Tran 2019-2028 TDP Annual Update
15
Figure 5 –Map of RPM Changes, Greater West Palm Beach Area
Figure 6 – Map of RPM Changes in Lake Worth, Boynton Beach and Greenacres

Palm Tran 2019-2028 TDP Annual Update
16
Figure 7 – Map of RPM Changes, Delray Beach
Figure 8 – Map of RPM Changes, Boca Raton

Palm Tran 2019-2028 TDP Annual Update
17
Figure 9 - Map of RPM Changes, Glades Area
Palm Tran 2019-2028 TDP Annual Update
18
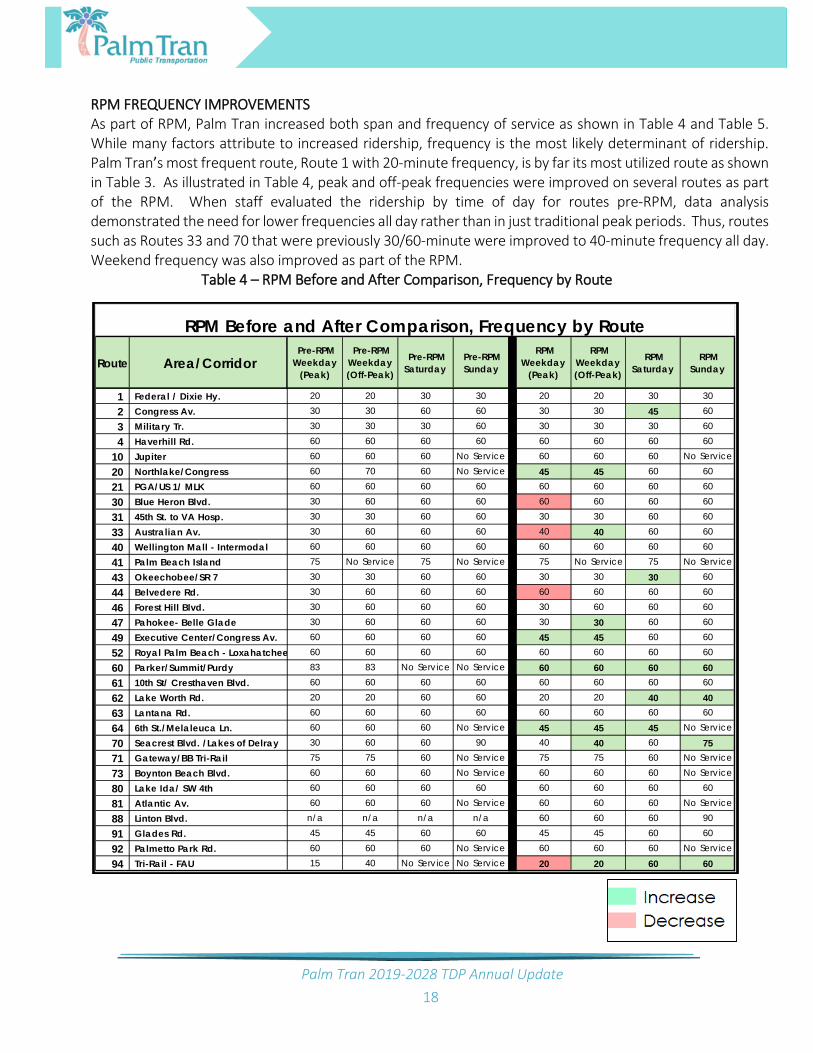
RPM FREQUENCY IMPROVEMENTS As part of RPM, Palm Tran increased both span and frequency of service as shown in Table 4 and Table 5. While many factors attribute to increased ridership, frequency is the most likely determinant of ridership. Palm Tran’s most frequent route, Route 1 with 20-minute frequency, is by far its most utilized route as shown in Table 3. As illustrated in Table 4, peak and off-peak frequencies were improved on several routes as part of the RPM. When staff evaluated the ridership by time of day for routes pre-RPM, data analysis demonstrated the need for lower frequencies all day rather than in just traditional peak periods. Thus, routes such as Routes 33 and 70 that were previously 30/60-minute were improved to 40-minute frequency all day. Weekend frequency was also improved as part of the RPM.
Table 4 – RPM Before and After Comparison, Frequency by Route
Route Area/Corridor Pre-RPM Weekday
(Peak)
Pre-RPM Weekday (Off-Peak)
Pre-RPM Saturday
Pre-RPM Sunday
RPM Weekday
(Peak)
RPM Weekday (Off-Peak)
RPM Saturday
RPM Sunday
1 Federal / Dixie Hy. 20 20 30 30 20 20 30 30
2 Congress Av. 30 30 60 60 30 30 45 60
3 Military Tr. 30 30 30 60 30 30 30 60
4 Haverhill Rd. 60 60 60 60 60 60 60 60
10 Jupiter 60 60 60 No Service 60 60 60 No Service
20 Northlake/Congress 60 70 60 No Service 45 45 60 60
21 PGA/US 1/ MLK 60 60 60 60 60 60 60 60
30 Blue Heron Blvd. 30 60 60 60 60 60 60 60
31 45th St. to VA Hosp. 30 30 60 60 30 30 60 60
33 Australian Av. 30 60 60 60 40 40 60 60
40 Wellington Mall - Intermodal 60 60 60 60 60 60 60 60
41 Palm Beach Island 75 No Service 75 No Service 75 No Service 75 No Service
43 Okeechobee/SR 7 30 30 60 60 30 30 30 60
44 Belvedere Rd. 30 60 60 60 60 60 60 60
46 Forest Hill Blvd. 30 60 60 60 30 60 60 60
47 Pahokee- Belle Glade 30 60 60 60 30 30 60 60
49 Executive Center/Congress Av. 60 60 60 60 45 45 60 60
52 Royal Palm Beach - Loxahatchee 60 60 60 60 60 60 60 60
60 Parker/Summit/Purdy 83 83 No Service No Service 60 60 60 60 61 10th St/ Cresthaven Blvd. 60 60 60 60 60 60 60 60
62 Lake Worth Rd. 20 20 60 60 20 20 40 40 63 Lantana Rd. 60 60 60 60 60 60 60 60
64 6th St./Melaleuca Ln. 60 60 60 No Service 45 45 45 No Service
70 Seacrest Blvd. /Lakes of Delray 30 60 60 90 40 40 60 75 71 Gateway/BB Tri-Rail 75 75 60 No Service 75 75 60 No Service
73 Boynton Beach Blvd. 60 60 60 No Service 60 60 60 No Service
80 Lake Ida/ SW 4th 60 60 60 60 60 60 60 60
81 Atlantic Av. 60 60 60 No Service 60 60 60 No Service
88 Linton Blvd. n/a n/a n/a n/a 60 60 60 90
91 Glades Rd. 45 45 60 60 45 45 60 60
92 Palmetto Park Rd. 60 60 60 No Service 60 60 60 No Service
94 Tri-Rail - FAU 15 40 No Service No Service 20 20 60 60
RPM Before and After Comparison, Frequency by Route

Palm Tran 2019-2028 TDP Annual Update
19
RPM SERVICE OF SPAN IMPROVEMENTS When Palm Tran completed its last major onboard survey as part of the 2015 TDP Annual Update, one of the main concerns existing customers voiced was lack of later service on Saturdays and Sundays. For the RPM, Palm Tran extended service hours on key routes during weekends as shown in Table 5. In addition, seven routes received major span of service improvements on weekdays, most noticeably Route 62/Lake Worth Rd. Span of service is incredibly important to passengers who work later on weeknights and weekends throughout the community.
Table 5 – RPM Service Span Change by Route

Palm Tran 2019-2028 TDP Annual Update
20
RPM RESULTS Palm Tran’s early returns on the RPM project are promising. Ridership has increased nearly five percent over last year and Palm Tran’s on-time performance (OTP) increase significantly from 73% in October 2017 to 82% October 2018. Expecting 5-10% growth in ridership may not be realistic over the course of a year in the fact that October is typically a high ridership month and the first few days of the RPM start featured free rides.
Table 6 – OTP and Ridership by Route, Before and After RPM
75% +Route On Time % Route On Time % 73 -75%
1 75.1 1 82.6 0-73%
10 59.9 10 82.3 ROUTE BOARDINGS ROUTE BOARDINGS
2 86 2 86.1 1 189,247 1 197,373 20 77.9 20 84.9 2 105,521 2 85,297 21 76 21 80.8 3 104,831 3 104,408 3 79.3 3 83.6 4 3,569 4 9,830
30 78.3 30 74 10 7,139 10 7,224 31 85.4 31 92.5 20 8,547 20 25,336 33 71.3 33 78.7 21 7,049 21 7,597 4 85.4 4 72.4 30 7,849 30 7,651
40 79.9 40 78.4 31 27,640 31 29,916 41 74.6 41 84.4 33 17,517 33 22,042 43 72.8 43 83.8 40 16,105 40 15,540 44 85.8 44 89.8 41 1,548 41 1,856 46 74.6 46 74.3 43 45,074 43 50,211 47 75.2 47 78.1 44 8,671 44 11,165 49 72.1 49 91.4 46 19,813 46 19,104 52 84 52 86.3 47 19,398 47 26,119 60 90.2 60 80.1 49 6,350 49 5,969 61 71.9 61 78.5 52 4,717 52 6,368 62 78.6 62 85.8 60 2,798 60 5,492 63 67.2 63 79.4 61 16,363 61 18,166 64 54.2 64 74 62 50,245 62 56,915 70 61.3 70 95 63 10,726 63 12,512 71 87 71 85.8 64 7,553 64 9,398 73 89.5 73 83.5 70 21,709 70 20,507 80 50.2 80 77.8 71 5,771 71 4,939 81 60.4 81 80.6 73 12,060 73 13,601 88 72.9 88 85.6 80 8,910 80 5,577 91 70.6 91 78.7 81 9,923 81 9,392 92 70.6 92 74.7 91 19,898 88 9,858 94 51.8 94 63.4 92 6,889 91 16,315
(X) 42 66.8 OVERALL 82% 94 19,039 92 6,893 (X) 45 75.3 (X) 42 1,815 94 23,852
(X) 48 72.3 (X) 45 3,402 Total 854,010 OVERALL 73% (X) 48 12,906
Total 816,452
October 1 - Oct 31 2017 October 1 - Oct 31 2018
4.6% increase in ridership
On-Time Performance RidershipOTP By Route OTP By Route APC Counts by
RouteAPC Counts by
RouteSEP 1-30, 2018 OCT 1-31, 2018
PRE-RPM POST-RPM PRE- RPM POST - RPM

Palm Tran 2019-2028 TDP Annual Update
21
Enhancing Accessibility and Mobility In line with the agency’s mission statement of providing access, the RPM enhanced the amount of places and jobs passengers could access using transit. Table 7 shows the amount of people and jobs accessible pre-RPM and post-RPM; three major hubs (Intermodal, Wellington Mall and Gardens Mall) were identified at different times of the week. Of particular importance was ensuring that passengers who were employed at the County’s major service industry centers and malls had service after closing time, which typically 15-30 minutes later than when customers leave. As many service industry employees work different schedules week-to-week, improving weekend service was critical.
Table 7 – People/Jobs Accessible from Major Palm Tran Hubs, Before and After RPM
Major HubTime of
Day/Week Population Jobs Population JobsIntermodal 7a, weekday 240,141 171,293 286,368 177,990Intermodal 11a, weekday 174,667 129,014 305,112 187,773Intermodal 5p, weekday 196,365 151,016 286,771 182,615Intermodal 10a, Saturday 138,352 111,709 294,791 178,729Intermodal 530p, Sunday 133,831 99,181 219,880 150,208Gardens Mall 7a, weekday 92,235 58,091 143,212 94,832Gardens Mall 11a, weekday 115,237 68,205 147,338 91,778Gardens Mall 5p, weekday 111,042 65,811 151,759 96,574Gardens Mall 10a, Saturday 142,443 93,922 204,534 117,655Gardens Mall 530p, Sunday 92,150 64,307 84,991 55,021Wellington Mall 7a, weekday 136,308 33,624 274,955 123,373Wellington Mall 11a, weekday 156,718 47,678 256,640 89,002Wellington Mall 5p, weekday 157,306 48,422 249,189 85,268Wellington Mall 10a, Saturday 78,340 29,456 301,593 101,592Wellington Mall 530p, Sunday 47,820 14,542 92,101 24,372
People and Jobs accessible using Palm Tran at Major Palm Tran hubs (before/after RPM)
Pre-RPM Post-RPMWithin 1/4 mile Within 1/4 mile

Palm Tran 2019-2028 TDP Annual Update
22
Palm Tran, as the northernmost County in Tri-Rail’s service area, used the RPM as a chance to improve bus-rail connections (and vice versa) by extending Routes 21, 60, 73 and 88 to Tri-Rail. In addition, bus/rail transfers were improved at key hubs and other span/frequency enhancements were implemented on routes that access rail stations. See below figure for a detailed list of improvement by station. The multimodal connections improved by the RPM will serve both agencies well as the Palm Tran Fare Interoperability project moves forward in 2019.
Figure 10 – Palm Tran Service to Tri-Rail stations in Palm Beach County
Tri-Rail Station
Mangonia Park
West Palm Beach
Lake Worth
Boynton Beach
Delray Beach
Boca Raton
Route 2 - later service on weekends, improved frequency (45 min from 60 min) on Saturdays. Route 70 - frequency improved to 40 min all day, later service on weekends. Route 81 - earlier AM service added on weekdays. Route 88 - new route alignment created out of portions of old Routes 70 and 80.
Route 2 - later service on weekends, improved frequency (45 min from 60 min) on Saturdays. Route 94 - weekday frequency improved (20 min from 15/40/20 min), route extended to Downtown Boca Raton, new weekend service started
RPM Palm Tran Service Improvements to Tri-Rail RPM Service Improvements
Route 21 - extended to service station from Gardens Mall. Route 31 - later service on nights and weekends. Route 33 - extended to Gardens Mall, later service on nights and weekends, weekday frequency improved to 40 minutes all day.
Route 1 - later service on Sundays. Route 2 - later service on weekends, improved frequency (45 min from 60 min) on Saturdays. Route 20 - extended to station from Gardens Mall, later service seven days a week. Sunday service introduced. Route 31 - later service on nights and weekends. Route 43 - improved span and frequency on Saturdays, later service on Sundays. Route 49 - frequency improved (60 min from 45 min). Route 60 - extended to station, improved frequency (60 min from 80 min).
Route 61 - earlier/later service on weekdays and Sundays. Route 62 - later evening service on weekdays, improved span and frequency (60 min to 40 min) on weekends.
Route 70 - frequency improved to 40 min all day, later service on weekends Route 73 - extended from Downtown Boynton Beach to station.

Palm Tran 2019-2028 TDP Annual Update
23
Figure 11- RPM Timeline
RPM PROJECT TIMELINE (2017-2018) RPM took over two years to implement, beginning with Phase I which began in Spring 2017. Phase I took a “deep dive” into the County’s current land use, demographics and Palm Tran ridership data. Phase I, which was overseen by Planning staff working with consultant Jarrett Walker and Associates, concluded with a presentation to the Palm Beach County Board of County Commissioners (BCC) on November 22, 2017. At that meeting, the BCC was tasked with choosing between a “Ridership” or “Coverage” network. The “Ridership” scenario focused primarily on reallocating operational funds –in the form of increase frequency--on Palm Tran’s most utilized routes whereas the “Coverage” scenario opted to ensure that all areas of the County would have some level of service, and most closely mimicked the current network with some modifications. Walker also demonstrated that Palm Tran was middle-of-the-pack in terms of productivity but that Palm Tran was among the lowest of its national peers in terms of transit spending per capita. With the choice set before them, the BCC decided that the “Coverage” scenario offered improved service without overly negatively impacting Palm Tran’s current ridership. After the November BCC meeting, Palm Tran staff continued to refine the “Coverage” network into the “Enhanced Coverage” network which streamlined circuitous and/or non-productive routes and offered some improvements to span and frequency. In addition, the BCC requested an expedited RPM start date from early 2019 to September 2018.
Figure 12 – Palm Beach County Board of County Commissioners
Palm Tran 2019-2028 TDP Annual Update
24
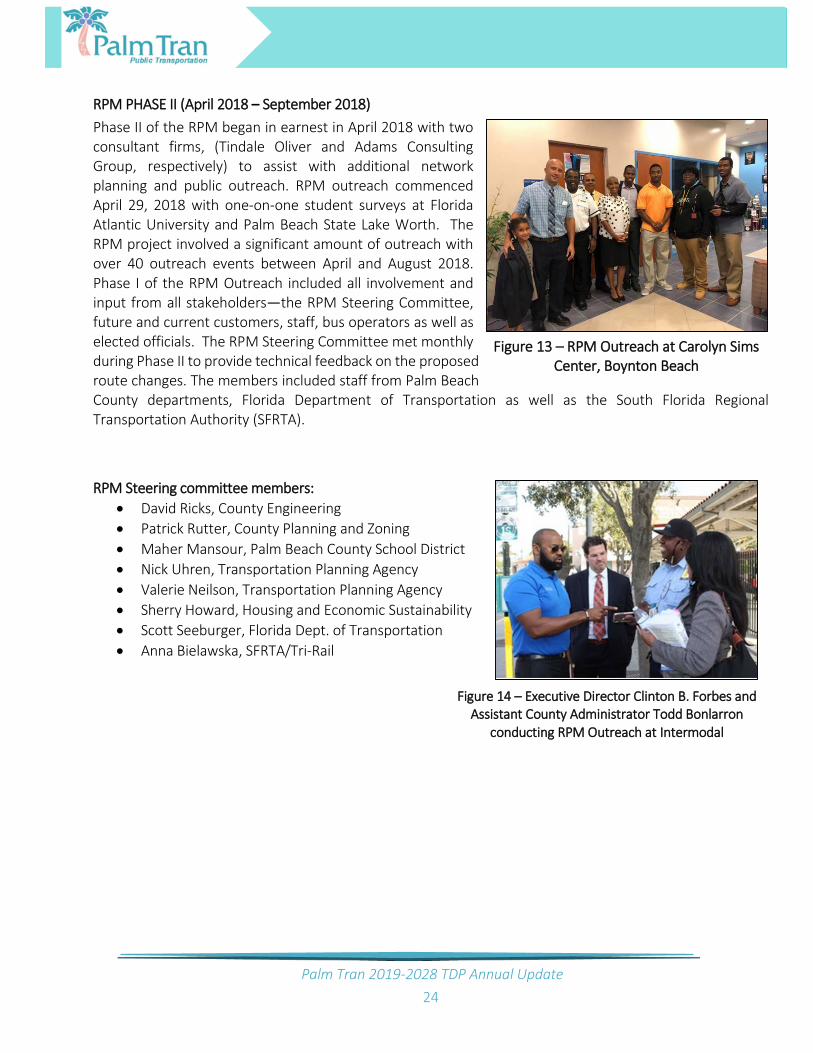
RPM PHASE II (April 2018 – September 2018) Phase II of the RPM began in earnest in April 2018 with two consultant firms, (Tindale Oliver and Adams Consulting Group, respectively) to assist with additional network planning and public outreach. RPM outreach commenced April 29, 2018 with one-on-one student surveys at Florida Atlantic University and Palm Beach State Lake Worth. The RPM project involved a significant amount of outreach with over 40 outreach events between April and August 2018. Phase I of the RPM Outreach included all involvement and input from all stakeholders—the RPM Steering Committee, future and current customers, staff, bus operators as well as elected officials. The RPM Steering Committee met monthly during Phase II to provide technical feedback on the proposed route changes. The members included staff from Palm Beach County departments, Florida Department of Transportation as well as the South Florida Regional Transportation Authority (SFRTA). RPM Steering committee members:
• David Ricks, County Engineering • Patrick Rutter, County Planning and Zoning • Maher Mansour, Palm Beach County School District • Nick Uhren, Transportation Planning Agency • Valerie Neilson, Transportation Planning Agency • Sherry Howard, Housing and Economic Sustainability • Scott Seeburger, Florida Dept. of Transportation • Anna Bielawska, SFRTA/Tri-Rail
Figure 13 – RPM Outreach at Carolyn Sims Center, Boynton Beach
Figure 14 – Executive Director Clinton B. Forbes and Assistant County Administrator Todd Bonlarron
conducting RPM Outreach at Intermodal

Palm Tran 2019-2028 TDP Annual Update
25
Over the course of the next month passengers, operators and other stakeholders all provided feedback at nearly twenty events on the current Palm Tran service. Staff took special care to involve operators by holding early AM sessions in order to get as many operator’s comments as possible. At the same time, a more refined network plan was being developed based on the received feedback. The network was then presented back to the public in a two-month flurry of outreach events which included early-AM meetings with operators, public meeting style town halls in several communities and one-on-one interview with customers at Palm Tran’s major bus hubs. All proposed RPM changes were continuously communicated to the riding public via numerous channels:
• Social Media • Palm Tran website • A dedicated hotline • Specially wrapped buses and shelters • Flyers/public notices • Radio ads • Announcements onboard buses
With widespread public support for the proposed changes, Palm Tran presented the proposed RPM network to its governing board, the Palm Tran Service Board (PTSB) on June 28, 2018. The PTSB unanimously supported the changes. Staff then conducted a series of one-on-ones with the BCC, culminating with a Palm Tran/BCC workshop on July 24, 2018. As the RPM entailed a major service change, all Title VI analysis was conducted an a finding of no disparate impact was presented back to the PTSB on July 26, 2018. A final public hearing at the BCC was then conducted August 14, 2018 where another unanimous approval was received. At this meeting Palm Tran presented not only a new network, but additional improvements for consideration by the Board, including expanded holiday service. The costs for providing a weekend-style schedule (with complementary paratransit) on the seven holidays there is no current service is approximately $1.5 million per year. This recommendation will be added to Palm Tran’s short-term action plan which is contained in the Palm Tran RPM Final Report and Action Plan.

Palm Tran 2019-2028 TDP Annual Update
26
ADDITIONAL RPM RECOMMENDATIONS Enhanced Bus Service in Palm Beach County In addition to expanded holiday service, which has previously been identified as a TDP Objective (3.2) in the 2017-2026 Palm Tran TDP Major Update, Palm Tran received several concerns from PTSB board members regarding enhanced bus service on US1. While the Route 1 Bolt Limited Stop service was eliminated in the RPM due to poor ridership, future enhanced bus service on US1 will be incorporated in future service plans. In 2017, the TPA had preliminarily identified the US1 corridor as a potential enhanced bus/BRT corridor as part of the US1 Multimodal Corridor Study. Palm Tran will further evaluate the US1 corridor (as well as other corridors in the County) for transit feasibility as well as operational costs. The portion of US1/ between Riviera Beach and Boynton Beach has been included in the Regional Transportation Plan and the Transportation Improvement Program for FY 2018-2022.
ANALYSIS OF DISCREPANCIES Table 8 illustrates an updated progress report of its planned 2019-2028 service changes from the Major TDP. There are several improvements from the last TDP Annual Update that were addressed in the RPM including:
• Route 62 weekday and Saturday 1-hr additional span of service improvements Some of the planned span of service and frequency improvements were partially addressed with the RPM project. These improvements include:
• Additional (1) hour of early AM service on Routes 61 and 81 • Additional half-hour of early AM service on Routes 2, 33 and 63 • Frequency improvement on Route 62 on Sundays • Additional (1.5) hour late PM service on Route 63 • Additional (1) hour of late PM service Saturday added for Routes 31, 43, and 63. • Frequency improvement on Routes 2, 43, 62 on Saturday

Palm Tran 2019-2028 TDP Annual Update
27
Table 8 - FY 2019-FY 2028 Service Plan Progress Report (Updated from 2018-27 Annual Update TDP)

Palm Tran 2019-2028 TDP Annual Update
28
SUMMARY OF PLANNED FY 2019 SERVICE CHANGES January 2019 service changes (approved by the PTSB)
The January 2019 service changes encompass minor tweaks to the post-RPM network and are as follows: • Routes 1 and 94 – Minor modification of southbound alignment at Camino Real • Routes 20, 30, 40, 43, 62 – Earlier trips added to support service to key hubs; VA Medical Center,
Wellington Mall and Glades Health Center. • New service approach – Introduction of community circulator service in the Glades Region,
tentatively referred to as the Glades Flex System which will connect the communities of Pahokee, Belle Glade and South Bay. The system is expected to begin in December 2018.
GO GLADES FLEX SERVICE A major component of the RPM is the Go Glades flex system, a pilot program slated to start in the Glades Region in December 2018. The flex service will feature a circulator-style smaller vehicle that will serve the communities of Belle Glade, South Bay and Pahokee. As shown in Figures 16 and 17, The system will operate a flexible, or “flex” style service that can deviate (upon request) to a person’s origin or destination, while still providing a fixed-route style service, complete with bus stops and printed schedules. The Go Glades flex system, which had been in development as part of the Southeast Lake Okeechobee Rural Mobility Initiative (SELORMI) project will replace the expiring Belle Glade Express service. Go Glades is part of continuing partnership with FDOT and will be operated and overseen by Palm Tran. These four routes (two in Belle Glade, one in each Pahokee and South Bay) will operate seven days a week on hourly headways with spans of service similar to existing fixed-route Palm Tran Route 47. Palm Tran is implementing this service through leveraging its existing call center at Palm Tran Connection. Passengers in this part of the County that call Connection will be given the option to utilize the flex service. The flex system fares were set by the Palm Beach County Board of County Commissioners in October 2018. The fares for Go Glades are as follows:
• $1.00 for general public plus $0.50 for route deviations • Free for riders with their ADA ID • Free for Transportation-Disadvantaged (TD) 31-day pass holders
The Go Glades service would operate hourly, seven days a week generally between 5:30am – 9pm on weekdays, 7:00am – 9pm on Saturdays and 9:30am – 7pm on Sundays. The name Go Glades was part of a Name-that-Service contest that was offered to the Glades Region communities; over 50 names were submitted as part of the contest. In addition, the Go Glades Flex system will include implementation of a Dial-a-Ride (DAR) system that will serve customers in the SR 715 corridor that previously had Route 48 fixed-route service; Route 48 was merged into Route 47 as part of the RPM. The DAR will be available to the general public and ADA customers. Trips will need be scheduled at least two hours in advance and will complement the fixed-route services in the Glades communities.

Palm Tran 2019-2028 TDP Annual Update
29
Figure 15 – Go Glades Map of Belle Glade and South Bay
Figure 16 – Go Glades Map of Pahokee
Belle Glade
South Bay
Pahokee

Palm Tran 2019-2028 TDP Annual Update
30
CAPITAL PROJECT/PLANNING STUDY UPDATES The following updates serve as a list of the projects and services designed to meet Palm Tran’s Goals and Objectives, which are located in Appendix A.
FARE INTEROPERABILITY PROJECT UPDATE Palm Tran is in the process of upgrading its fare collection system to provide its riders with more payment options for example, smart cards, mobile payments and online account management. Palm Tran will also be working with its partner transit systems Broward County Transit (BCT), Miami-Dade Transit (MDT) and South Florida Regional Transportation Authority (SFRTA) to provide a seamless transfer between systems. Palm Tran, working with the consultant, reviewed and assessed the agency’s current fare collection system and has developed a plan to proceed with replacing the current system. Palm Tran also completed a Request for Information (RFI) to assess the current state of Fare Technology Hardware and Software. Palm Tran recently issued a Request for Proposal (RFP) to obtain the services of a qualified consultant to assist in the Fare Technology System procurement and implementation process. Palm Tran plans to award a contract for the Fare Technology System in the Summer of 2019 and complete installation by Winter of 2019. PALM TRAN CONNECTION EFFICIENCY PROJECT Besides Miami-Dade Transit, Palm Tran Connection provides more paratransit trips than any other transit provider in the state with nearly one million trips annually. There are various demographic and land use factors for the sheer volume of paratransit service in the community; however, Palm Tran is only the seventh-largest provider of fixed-route service in the state. To ensure that paratransit is provided more efficiently in the community while meeting customer needs, Palm Tran is embarking on a paratransit efficiency project in 2019. The project will focus on four key areas: eligibility, reservation procedures, existing policies and future growth strategies. Any changes to policies will be presented to the Board of County Commissioners with an expected implementation date of late 2019. PALM TRAN TRANSIT ASSET MANAGEMENT (TAM) PLAN: In accordance with the Federal Transit Administration (FTA) requirements, Palm Tran has completed its first TAM Plan which defines Palm Tran’s approach for managing its assets to support the agency’s service goals and objectives. The plan was submitted to FTA on October 1, 2018 and is currently in FTA review. Among other things, the Palm Tran TAM Plan achieves the following:
• Assesses the current condition of Palm Tran’s capital assets • Provides a management performance framework for those assets • Integrates risk management into asset management processes • Provides a capital plan to maintain agency assets in a State of Good
Repair (SGR) • Provides strategies to maximize asset lifecycles, including asset
replacement plans • Provides key improvement actions to be advanced over the next four (4) years

Palm Tran 2019-2028 TDP Annual Update
31
PALM TRAN BUS SHELTER RETIREMENT AND EXPANSION PLAN Palm Tran has identified a need for approximately 250 new shelters over the next five years. While other municipalities in the County have some newer shelters Palm Tran’s existing shelter inventory is aging and will need to be replaced the next 1-2 years. To that end, Palm Tran is developing a Request for Information (RFI) in order to hear from the bus shelter industry how agency infrastructure needs can be best addressed. Palm Tran will continue to work with its agency partners such as the Palm Beach TPA to aggressively expand the quantity and quality of street furniture in Palm Beach County. COLLEGE/EMPLOYER BUS PASS PROGRAM Palm Tran will continue to evaluate the feasibility of a college/employer pass program. Currently the agency is in the planning stages of the program including evaluating peer agency programs and reaching out to local colleges. With growing enrollment at both Palm Beach State College and Florida Atlantic University, a college pass program could greatly enhance accessibility and mobility in the County. There is also an identified need for an employer discount program in Palm Beach County. Palm Tran will continue to evaluate peers, such as SFRTA/Tri-Rail’s Employer Discount Program (EDP) to ascertain best practices for these types of potential partnerships. PALM TRAN DELRAY BEACH ADMINISTRATIVE FACILITY UPDATE: As shown in Figure 17, by 2020, Palm Tran will expand and renovate its existing Palm Tran South County Facility, including: addition of approximately 30,000 square feet of building space consisting of offices, locker rooms, training center for bus operators, auditorium for public meeting space, and ancillary support space. The facility will be the primary location for recruitment, training and public meetings. There will be a new and expanded bus operator area, locker rooms, a training facility, an exercise facility, a state of the art public meeting room, various administrative offices and conference rooms. A standalone generator will serve the entire administrative facility in the event of a power interruption. The exterior of the facility will be proudly decorated by Palm Beach County's Art in Public Places with art inspired by concepts of movement and mobility. The building will three stories tall and will feature the following:
• Additional parking for 20 fixed-route buses • Expanded ADA accessible parking • 9 electric bus charging stations • 150 total parking spaces, 110 of which will be dedicated to employee parking and 40
dedicated to supervisor/relief vehicles • New roof • Repainting of interior/exterior spaces • Renovated bathrooms, offices, break room, lighting upgrade • Renovated maintenance garage • Dedicated clean room for the rebuilding of standard/hybrid transmissions • Upgraded fuel island complete with new 10,000 gal underground fuel tank

Palm Tran 2019-2028 TDP Annual Update
32
Figure 17 – Delray Beach Administrative Facility (projected to be completed in 2020)
US 1 MULTIMODAL CORRIDOR STUDY The US 1 corridor, which is mainly served by Palm Tran’s Route 1, is Palm Tran’s most utilized route, comprising 20% -25% of the entire Palm Tran system ridership. The study was completed in Summer 2018, Palm Tran has continued to work closely with the Transportation Planning Agency (TPA formerly the MPO) to ensure that transit needs are identified, developed and promoted as the MPO’s key partner on this multimodal study effort. The US1 Multimodal Corridor Study was completed in 2018. Palm Tran is exploring different funding mechanisms to implement some type of Bus Rapid Transit and/or enhanced bus service on corridors throughout Palm Beach County.

Palm Tran 2019-2028 TDP Annual Update
33
OTHER UPDATES PT-Stat: As the cornerstone of Palm Tran’s Performance Management Office (PMO), the Palm Tran Statistics (known simply as PT-Stat) is an agency wide initiative to move Palm Tran in the right direction on key metrics such as ridership, on-time performance, mean distance/road calls, etc. The PT-Stat teams, of which there are 11, present and implement initiatives to Palm Tran’s Executive Leadership Team (ELT) in monthly forums.
Table 9 – PT-Stat Completed Initiatives, FY 2018
PT-Stat’s Flashing Lights Initiative (UPDATE): Palm Tran has been honored with the prestigious Achievement Award in the category of Transportation from the National Association of Counties (NACO). NACo recognized Palm Tran for launching its PT Stat (Palm Tran Statistics) program, which focuses on gathering data and analyzing day-to-day operations and agency performance. The PT Stat program facilitated Palm Tran’s “flashing lights” initiative, which resulted in a significant decline in rear-end collisions. WiFi onboard: As part of the RPM implementation, the entire fixed-route Palm Tran fleet was outfitted with free WiFi onboard buses. This specifically addresses Palm Tran’s Strategy 3.1.1. Office of Governmental Affairs: The Office of Governmental Affairs was created in early 2018 to serve as a liaison with every governmental agency in Palm Beach County, including the cities, Board of County Commissioners, the Transportation Planning Agency (TPA) and the South Florida Regional Transportation Authority (SFRTA).
Figure 19 – Flashing Lights Initiative

Palm Tran 2019-2028 TDP Annual Update
34
FY 2019 PROJECTS SUMMARY/GOALS AND OBJECTIVES MATRIX As shown in Table 10, Palm Tran has implemented many initiatives/projects to support the five major goals outlined in the 2017-2026 Major Update. As shown in Appendix A, Palm Tran’s goals and objectives are consistent with the County’s S.M.A.R.T (Specific, Measurable, Achievable, Relevant and Time-Bound) goals program. For more specific information on the goals, objectives and strategies, see Appendix A.
Table 10 – Palm Tran TDP Goals and Objectives Matrix

Palm Tran 2019-2028 TDP Annual Update
35
FINANCIAL PLAN FY 2019-2028 Figure 20 displays the operating and capital cost projections for the next ten years. The projected operating costs are expected to surpass operating revenues by FY 2022.
Figure 20 - Projected Costs vs. Revenues (FY 2019-2028)

Palm Tran 2019-2028 TDP Annual Update
36
ANNUAL FAREBOX RECOVERY REPORT In accordance with HB 985 passed in 2007, Palm Tran monitors its farebox recovery report annually and is providing this report as part of the Transit Development Plan (TDP) Update. Palm Tran regularly monitors its farebox recovery ratio and evaluates potential enhancements to productivity and performance that would increase farebox recovery ratios over the past ten years. The below Figure 21 illustrates the farebox recovery ratio over the last decade at the agency.
Figure 21 - Palm Tran Farebox Recovery (FY 2009-FY 2018)

Palm Tran 2019-2028 TDP Annual Update
37
APPENDIX A- GOALS AND OBJECTIVES
Goal 1: Maximize the efficiency and capacity of the existing Palm Tran system.
Objective 1.1 Increase annual fixed-route ridership consistently from 2016 to 2026.
Strategy 1.1.1 Many of the strategies outlined in this section can and should increase fixed-route ridership. In the next few years, Palm Tran will develop and pursue a number of strategies to increase fixed-route ridership including, but not limited to, our pending Route Performance Maximization (RPM), marketing initiatives as well as multiple user-friendly improvements to the system and its infrastructure.
Current Value 10.7 million annual boardings (FY 2015)
Target 16 million annual boardings by 2026 (50% increase)
Objective 1.2 Improve span and/or frequency of service on high-ridership routes to better serve existing ridership patterns.
Strategy 1.2.1 Implement service span improvements on key routes
Current Value 15 of 33 (45%) of Palm Tran routes have a 14-hour service span; 6 of 33 (20%) Palm Tran routes have a 16-hour service span or greater
Target 80% of all Palm Tran routes have 14-hour or better service span by 2021; 40% of all routes have 16-hour or better service span by 2026
Strategy 1.2.2 Reduce percentage of Palm Tran routes with 60-minute or worse frequency
Current Value 17 of 33 (50%) Palm Tran routes have a 60-minute frequency or worse
Target No greater than 25% of routes have frequencies of 60 minutes or worse by 2026
Strategy 1.2.3 Increase percentage of Palm Tran routes with 15-minute frequency or better
Current Value 1 of 33 routes (3%) have a 15-minute frequency or better
Target No less than 20% of all Palm Tran routes with frequencies of 15 minutes or less by 2026.
Objective 1.3 Increase overall Palm Tran productivity.
Strategy 1.3.1 Establish a minimum threshold for fixed-route productivity; evaluate and modify routes that fall below 60% / 75% of that system standard
Current Value As of Fiscal Year-to-Date 2016, fixed-route systemwide productivity is 19.4 passengers per hour (2016 Fiscal Year-to-Date); with no Palm Tran fixed-route standard for route productivity. Current paratransit productivity is 1.5 passengers per hour (2016 Fiscal Year-to-Date)
Target As an annual goal, maintain a fixed-route systemwide productivity of twenty-five (25) passengers per hour
Target As an annual goal, maintain a paratransit systemwide productivity of two (2) passengers per hour

Palm Tran 2019-2028 TDP Annual Update
38
Strategy 1.3.2 Evaluate implementation of time-of-day and/or time of year scheduling to best meet demand in varying traffic conditions
Current Value As of date, no evaluation time-of-day and/or time-of-year scheduling
Target 100% of all Palm Tran fixed-routes evaluated by 2021
Objective 1.4 Evaluate potential for high-capacity premium transit service.
Strategy 1.4.1 Conduct premium transit corridor studies including express bus, BRT strategies, and light rail/streetcar technologies.
Current Value As of date, no evaluation of premium transit corridor studies evaluated
Target Lead or assist in at least five (5) premium transit corridor analyses by 2021
Objective 1.5 Continue to explore improvements that reduce travel time such as stop consolidation and limited-stop service.
Strategy 1.5.1 Consolidate all stops that are inconsistent with Palm Tran's 1/10 mile stop-distance threshold; evaluate feasibility of additional limited-stop service on key corridors
Current Value As of Fiscal Year-to-Date 2016, one limited-stop/BOLT-style service in operation; approximately 10% of Palm Tran bus stops are closer than 528 feet to each other
Target Three limited-stop/ BOLT-style services implemented by 2021; less than 1% of all Palm Tran stops closer than 528 feet (to each other) by 2021
Goal 2 Deliver safe, reliable, and accessible transit that is environmentally friendly.
Objective 2.1 Provide safe service to Palm Tran customers.
Strategy 2.1.1 Reduce fixed-route collisions (preventable and non-preventable) through annual operator safety training
Current Value As of Fiscal Year-to-Date 2016, 0.8 preventable collisions per 100,000 fixed-route revenue miles; 2.7 non-preventable collisions per 100,000 fixed-route revenue miles
Target As an annual goal, one (1) preventable collision per 100,000 fixed-route revenue miles
Target As an annual goal, one (1) non-preventable collision per 100,000 fixed-route revenue miles
Strategy 2.1.2 Reduce paratransit preventable collisions (preventable and non-preventable) through oversight and operator testing
Current Value As of Fiscal Year-to-Date 2016, 0.8 preventable collisions per 100,000 paratransit revenue miles; 2.4 non-preventable collisions per 100,000 paratransit revenue miles
Target As an annual goal, one (1) preventable collision per 100,000 paratransit revenue miles
Target As an annual goal, one (1) non-preventable collision per 100,000 paratransit revenue miles
Strategy 2.1.3 Pursue additional safety/security improvements including audio recording capability and/or enhanced security onboard buses and/or at bus stops
Current Value As of date, there is no audio recording onboard buses and no off-duty law enforcement/ security on buses or at bus stops

Palm Tran 2019-2028 TDP Annual Update
39
Target Enable audio recording onboard all Palm Tran buses by 2017
Target Explore feasibility of contracted services with off-duty law enforcement to enhance system safety by 2021
Objective 2.2 Maintain all vehicles and facilities in a state of good repair.
Strategy 2.2.1 Manage the average age of vehicles within state and federal guidelines and replace vehicles according to established life cycles
Current Value Average age of fixed-route rolling stock: 6.1 years; paratransit rolling stock: 1.5 years
Target As an annual goal, maintain six (6) years average age of rolling stock for fixed-route fleet and five (5) years average age of rolling stock for paratransit fleet.
Strategy 2.2.2 Adhere to federal requirements regarding preventable maintenance inspections and ensure that critical inspection recommendations are completed in a timely manner
Current Value As of Fiscal Year-to-Date 2016, 99.5% of all inspections completed within required mileage
Target As an annual goal, 100% of all inspections completed within required mileage
Strategy 2.2.3 Improve mean distance between vehicle road failures/road calls
Current Value As of Fiscal Year-to-Date 2016, mean distance between fixed-route vehicle road failures/road calls is 3,723 miles; mean distance between paratransit vehicle road failures/road calls is 27,849.
Target As an annual goal, a minimum of 5,000 miles between fixed-route vehicle road calls/ service interruptions
Target As an annual goal, a minimum of 12,500 miles between paratransit vehicle road calls/ service interruptions
Objective 2.3 Provide timely Palm Tran service.
Strategy 2.3.1 Establish on-time metrics consistent with fixed-route industry standards; conduct annual review of fixed-route on-time performance and compare to prior years.
Current Value As of year-to-date FY 2016, fixed-route on-time percentage is 86%*
Target As an annual goal, Palm Tran's monthly fixed-route systemwide on-time performance to be no lower than 75%
Strategy 2.3.2 Conduct annual review of paratransit on-time performance and compare to prior years.
Current Value As of year-to-date FY 2016, paratransit on-time percentage is 93%
Target As an annual goal, Palm Tran's monthly paratransit systemwide on-time performance to be no lower than 92%
Objective 2.4 Implement improvements to ensure safety, ADA accessibility and connectivity across all Palm Tran facilities, including vehicles, bus stops and buildings.
Strategy 2.4.1 Implement projects and leverage planned/existing construction projects to increase the number of ADA accessible bus stops.
Current Value Approximately 40% (1,250 out of 3,200 bus stops) are ADA-accessible

Palm Tran 2019-2028 TDP Annual Update
40
Target 60% of all Palm Tran bus stops to be ADA-accessible by 2021.
Strategy 2.4.2 Work with partner agencies to implement crosswalks and/or connecting sidewalks to bus stops.
Current Value Zero crosswalks and/or connective sidewalks implemented in FY 2016
Target 10 crosswalks and/or connective sidewalks constructed by 2021.
Objective 2.5 Promote environmental sustainability by minimizing Palm Tran's carbon footprint.
Strategy 2.5.1 Construct all new Palm Tran facilities to green/ LEED building standards for energy efficiency and sustainable design
Current Value Zero new facilities constructed
Target 100% of all future Palm Tran facilities constructed to green/LEED building standards for energy efficiency and sustainable design
Strategy 2.5.2 Explore alternative energy sources for Palm Tran's fleet to minimize vehicle emissions.
Current Value No alternative energy sources evaluated in FY 2016.
Target By 2021, evaluate alternative fuel options for Palm Tran and begin process to transition technologies to best suit the agency and community.
Goal 3 Provide user-friendly and innovative service that connects communities
Objective 3.1 Expand WiFi and introduce other passenger amenities on all buses and bus stops
Strategy 3.1.1 Implement WiFi or similar technology onboard all key fixed-route and paratransit buses by 2021.
Current Value As of Fiscal Year-to-Date 2016, no fixed-route buses or paratransit buses have onboard WiFi fully operational
Target 100% of fixed-route and paratransit fleet with WiFi or similar technology by 2021
Objective 3.2 Provide service on holidays that Palm Tran does not currently operate.
Strategy 3.2.1 Evaluate operational impacts of operating on the seven holidays Palm Tran does not currently operate
Current Value Palm Tran does not provide service on seven (7) holidays
Target Three (3) or fewer holidays without Palm Tran service by 2021.
Objective 3.3 Assess and continually improve Palm Tran's integration in a multimodal mobility system.
Strategy 3.3.1 Integrate service with SFRTA, BCT, and other transit providers by reducing average scheduled transfer time for key routes.
Target As an annual goal, reduce average scheduled transfer time by 25% for key routes when feasible
Strategy 3.3.2 Implement a convenient electronic fare payment system that is interoperable with other regional providers to potentially include improvements such as mobile ticketing and/or offboard fare payment, etc.

Palm Tran 2019-2028 TDP Annual Update
41
Current Value Currently Palm Tran does not have an interoperable fare card system
Target Implementation of an interoperable fare card system by 2021.
Strategy 3.3.3 Work with first/last mile providers such as SkyBike and other potential providers, such as transportation network companies (TNCs) to improve connectivity challenges.
Current Value Currently Palm Tran has five stops within 300 feet of a bicycle rental station. No current agreement with first/last mile providers (such as TNC's) to improve connectivity challenges
Target 10% of all Palm Tran bus stops within 300 feet of a bicycle rental station by 2021
Target By 2021, conduct an evaluation of partnership with TNC's to determine feasibility for Palm Tran and the community
Objective 3.4 Implement regional coordination and public involvement components in all relevant aspects to the transportation planning process including transit-oriented development (TOD).
Strategy 3.4.1 Participate in regional initiatives to promote mixed-use development and TOD.
Current Value Staff attends three meetings annually as part of TOD working group
Target Attend four meetings annually and actively participate in thought process
Strategy 3.4.2 Develop criteria to identify transit stops and corridors with TOD potential.
Current Value As of Fiscal Year-to-Date 2016, no TOD criteria developed
Target Criteria for Palm Tran stops with TOD potential developed by 2021
Strategy 3.4.3 Encourage transit-supportive infill development and redevelopment near Palm Tran bus stops.
Current Value As of Fiscal Year-to-Date 2016, zero private-sector meetings attended
Target As an annual goal, attend four (4) private-sector meetings related to infill development and/or redevelopment and/or provide at least three (3) prescriptive reviews of local comprehensive plans annually
Objective 3.5 Seek and introduce innovative technological improvements to enhance the user experience.
Strategy 3.5.1 Implement ITS (Intelligent Transportation Systems) technologies such as transit signal priority (TSP) and queue jumping to key transit corridors
Current Value Zero routes with transit signal priority or queue jumping
Target Four routes with transit signal priority by 2021; two routes with queue jumping by 2021
Strategy 3.5.2 Implement amenities at high ridership locations such as automated ticket machines, USB charging stations, air-cooling technologies and/or WiFi at bus stops.
Current Value Currently, zero stops with any of these amenities
Target Five high ridership stops with any of these amenities by 2021

Palm Tran 2019-2028 TDP Annual Update
42
Goal 4 Improve the public image of Palm Tran services
Objective 4.1 Develop a campaign to strengthen Palm Tran’s visibility and image in the community.
Strategy 4.1.1 Perform market research to assess the current Palm Tran public image and develop strategies to enhance the public image.
Current Value As of date, no market research assessments completed
Target Market research study completed and key recommendations initiated by 2021
Strategy 4.1.2 Conduct an annual attitudinal survey
Current Value Most recent onboard Palm Tran attitudinal survey conducted in November 2015
Target As an annual goal, conduct one survey per year
Strategy 4.1.3 Development of new Palm Tran website and/or brand/logo
Current Value Current website has been in place for years, logo last changed in 1996
Target Launch of new Palm Tran website and/or logo by 2026
Strategy 4.1.4 Engage community directly through community events and other types of public outreach
Current Value As of Fiscal Year-to-Date 2016, five (5) community events attended by Executive Director and/or Executive Leadership Team
Target As an annual goal, twenty (20) community events attended by Executive Director and/or Executive Leadership Team
Objective 4.2 Provide proactive and effective customer service to all Palm Tran customers
Strategy 4.2.1 Reduce total number of fixed-route complaints
Current Value As of Fiscal Year-to-Date 2016, 3.7 complaints per 10,000 fixed-route passenger boardings
Target As an annual goal, one (1) complaint per 10,000 fixed-route passenger boardings
Strategy 4.2.2 Reduce total number of paratransit complaints
Current Value As of Fiscal Year-to-Date 2016, 2 complaints per 10,000 paratransit boardings
Target As an annual goal, two (2) complaints per 1,000 passenger boardings
Strategy 4.2.3 Provide customer service anytime Palm Tran is in service
Current Value Customer service is not provided on Sundays or holidays
Target Customer service anytime that bus service is provided by 2021
Strategy 4.2.4 Provide travel training and outreach to break down barriers and promote fixed-route ridership
Current Value Outreach and travel training is conducted per request
Target As an annual goal, conduct eight travel training /outreach community events
Objective 4.3 Enhance Palm Tran street infrastructure to meet customer demand.

Palm Tran 2019-2028 TDP Annual Update
43
Strategy 4.3.1 Increase the percentage of Palm Tran bus stops with a bus shelter
Current Value Approximately 19% bus stops have a bus shelter
Target 25% of bus stops with a bus shelter by 2021
Strategy 4.3.2 Increase the percentage of Palm Tran bus stops with a bus bench
Current Value Approximately 36% bus stops have a bus bench
Target 50% of bus stops with a bus bench by 2021
Strategy 4.3.3 Conduct detailed reviews of private development projects and coordinate with County staff and/or other stakeholders to ensure that transit improvements are included
Current Value As of Fiscal Year-to-Date, ten bus shelter easements secured
Target As an annual goal, secure at least 20 transit infrastructure easements and/or other bus stop improvements (including bus bays) built by development projects.
Strategy 4.3.4 Enhance existing and provide new park and ride facilities to best meet customer demand.
Current Value As of Fiscal Year-to-Date 2016, zero park and ride locations provided or enhanced
Target Five (5) new and/or existing park and ride facilities constructed and/or enhanced by 2021
Goal 5 Maximize Palm Tran resources
Objective 5.1 Work with community stakeholders to promote and establish a dedicated transit funding source.
Strategy 5.1 Develop a plan to establish a dedicated transit funding source
Current Value No current plan to establish a dedicated transit funding source
Target Completed plan by 2021; establishment of a dedicated transit funding source by 2026.
Objective 5.2 Actively pursue additional and sustainable sources of funding.
Strategy 5.2.1 Apply for and receive more competitive state and federal service and capital grants
Current Value As of Fiscal Year-to-Date 2016, no competitive grant applications submitted
Target 50% success rate of competitive grant applications annually
Strategy 5.2.2 Pursue additional funding agreements (either public-private and/or public-public partnerships)
Current Value As of Fiscal Year-to-Date 2016, three funding agreements (Century Village, Lakes of Delray, Village of Wellington) under contract
Target Eight (8) new agreements entered into by 2026
Strategy 5.2.3 Pursue additional sources of funds such as sales tax, increased percentage of local option gas tax and/or a mobility fee, etc.
Current Value Currently no sales tax allocation or enactment of a mobility fee to support transit, current percentage of gas tax allocated to transit is 67%

Palm Tran 2019-2028 TDP Annual Update
44
Target Imposition of a mobility fee and/or increased percentage of gas tax and/or county sales tax allocation to support transit by 2026.
Objective 5.3 Effectively steward public resources
Strategy 5.3.1 Improve fixed-route farebox recovery ratio by minimizing fare evasion and other operational improvements
Current Value As of Fiscal Year-to-Date 2016, 18% fixed-route farebox recovery ratio
Target 23% fixed-route farebox ratio as an annual goal
Strategy 5.3.2 Develop an employer and/or college/university pass and/or discount program to attract new customers
Current Value Zero employer and/or college/university discount program implemented
Target Employer and/or college/university discount program implemented by 2021