Transient Thermal Response of a Guarded-Hot-Plate ... · Volume 123, Article No. 123001 (2018)...
24
Volume 123, Article No. 123001 (2018) https://doi.org/10.6028/jres.123.001 Journal of Research of the National Institute of Standards and Technology 1 How to cite this article: Thomas WC, Zarr RR (2018) Transient Thermal Response of a Guarded-Hot-Plate Apparatus for Operation Over an Extended Temperature Range. J Res Natl Inst Stan 123:123001. https://doi.org/10.6028/jres.123.001 Transient Thermal Response of a Guarded-Hot-Plate Apparatus for Operation Over an Extended Temperature Range William C. Thomas 1 and Robert R. Zarr 2 1 Virginia Polytechnic Institute and State University, Blacksburg, VA 24061, USA 2 National Institute of Standards and Technology, Gaithersburg, MD 20899, USA [email protected] A mathematical model is presented for a new-generation guarded-hot-plate apparatus to measure the thermal conductivity of insulation materials. This apparatus will be used to provide standard reference materials for greater ranges of temperature and pressure than have been previously available. The apparatus requires precise control of 16 interacting heated components to achieve the steady temperature and one-dimensional heat-transfer conditions specified in standardized test methods. Achieving these criteria requires deriving gain settings for the 16 proportional-integral-derivative (PID) controllers, comprising potentially 48 parameters. Traditional tuning procedures based on trial-and-error operation of the actual apparatus impose unacceptably lengthy test times and expense. A primary objective of the present investigation is to describe and confirm the incremental control algorithm for this application and determine satisfactory gain settings using a mathematical model that simulates in seconds test runs that would require days to complete using the apparatus. The first of two steps to achieve precise temperature control is to create and validate a model that accounts for heating rates in the various components and interactions with their surroundings. The next step is to simulate dynamic performance and control with the model and determine settings for the PID controllers. A key criterion in deriving the model is to account for effects that significantly impact thermal conductivity measurements while maintaining a tractable model that meets the simulation time constraint. The mathematical model presented here demonstrates how an intricate apparatus can be represented by many interconnected aggregated- capacity masses to depict overall thermal response for control simulations. The major assemblies are the hot plate with four subcomponents, two cold plates with three subcomponents each, and two edge guards with three subcomponents each. Using symmetry about the hot plate, the number of components in the simulation model is reduced to 12 or 15, depending on the mode of operation for the apparatus. Configurations of the main components with embedded heating elements were carefully designed earlier using detailed finite- element analyses to give essentially isothermal surfaces and one-dimensional heat flow through test specimens. It is not tractable, or perhaps justified, to extend these prior analyses to simulate the controlled transient responses of the apparatus. The earlier design criterion does, however, support the aggregated-capacity simplification implemented in the present thermal model. The governing equations follow from dynamic energy balances on components with controlled heating elements and additional intermediate (“floating”) components. Thermal bridges comprise conduction paths, with and without surface convection and radiation, between components and fixed-temperature “heat sinks.” An implicit finite-difference numerical method was used to solve the resulting system of first-order differential equations. The mathematical model was initially validated using measurement data from test runs where a step change in heating rate was applied to single elements in turn, and component temperatures were recorded up to a nearly steady condition. Thermocouples and standard platinum resistance thermometers were used to measure temperatures, and thermopiles were used to measure temperature differences. Next, extensive simulations were conducted with the mathematical model to estimate suitable gain settings for the various controllers. The criteria were tight temperature control after reaching set points and acceptable times to achieve quasi-steady-state operation. Comparisons between measurements and predicted temperatures for heated components are presented. The results show that the model incorporating the above simplifying approximations is satisfactory for components comprising the hot-plate and cold- plate assemblies. For the edge guards, however, the conventional aggregated-capacity criteria are not as fully satisfied because of their configuration. Temperature variations in the edge guards, fortunately, have a lesser effect on the accuracy of the thermal conductivity measurements. Therefore, the thermal response model is deemed satisfactory for simulating PID feedback to investigate “closed-loop” control of the apparatus, thus meeting the primary objective. Key words: building technology; guarded hot plate; mathematical simulation; PID; temperature control; thermal conductivity; thermal response. Accepted: December 22, 2017 Published: January 8, 2018 https://doi.org/10.6028/jres.123.001
Transcript of Transient Thermal Response of a Guarded-Hot-Plate ... · Volume 123, Article No. 123001 (2018)...

Volume 123, Article No. 123001 (2018) https://doi.org/10.6028/jres.123.001
Journal of Research of the National Institute of Standards and Technology
1
How to cite this article:
Thomas WC, Zarr RR (2018) Transient Thermal Response of a Guarded-Hot-Plate Apparatus for Operation Over an Extended Temperature Range.
J Res Natl Inst Stan 123:123001. https://doi.org/10.6028/jres.123.001
Transient Thermal Response of a Guarded-Hot-Plate Apparatus for Operation Over an Extended Temperature Range
William C. Thomas1 and Robert R. Zarr2 1Virginia Polytechnic Institute and State University, Blacksburg, VA 24061, USA
2National Institute of Standards and Technology, Gaithersburg, MD 20899, USA [email protected]
A mathematical model is presented for a new-generation guarded-hot-plate apparatus to measure the thermal conductivity of insulation materials. This apparatus will be used to provide standard reference materials for greater ranges of temperature and pressure than have been previously available. The apparatus requires precise control of 16 interacting heated components to achieve the steady temperature and one-dimensional heat-transfer conditions specified in standardized test methods. Achieving these criteria requires deriving gain settings for the 16 proportional-integral-derivative (PID) controllers, comprising potentially 48 parameters. Traditional tuning procedures based on trial-and-error operation of the actual apparatus impose unacceptably lengthy test times and expense. A primary objective of the present investigation is to describe and confirm the incremental control algorithm for this application and determine satisfactory gain settings using a mathematical model that simulates in seconds test runs that would require days to complete using the apparatus. The first of two steps to achieve precise temperature control is to create and validate a model that accounts for heating rates in the various components and interactions with their surroundings. The next step is to simulate dynamic performance and control with the model and determine settings for the PID controllers. A key criterion in deriving the model is to account for effects that significantly impact thermal conductivity measurements while maintaining a tractable model that meets the simulation time constraint.
The mathematical model presented here demonstrates how an intricate apparatus can be represented by many interconnected aggregated-capacity masses to depict overall thermal response for control simulations. The major assemblies are the hot plate with four subcomponents, two cold plates with three subcomponents each, and two edge guards with three subcomponents each. Using symmetry about the hot plate, the number of components in the simulation model is reduced to 12 or 15, depending on the mode of operation for the apparatus.
Configurations of the main components with embedded heating elements were carefully designed earlier using detailed finite-element analyses to give essentially isothermal surfaces and one-dimensional heat flow through test specimens. It is not tractable, or perhaps justified, to extend these prior analyses to simulate the controlled transient responses of the apparatus. The earlier design criterion does, however, support the aggregated-capacity simplification implemented in the present thermal model.
The governing equations follow from dynamic energy balances on components with controlled heating elements and additional intermediate (“floating”) components. Thermal bridges comprise conduction paths, with and without surface convection and radiation, between components and fixed-temperature “heat sinks.” An implicit finite-difference numerical method was used to solve the resulting system of first-order differential equations.
The mathematical model was initially validated using measurement data from test runs where a step change in heating rate was applied to single elements in turn, and component temperatures were recorded up to a nearly steady condition. Thermocouples and standard platinum resistance thermometers were used to measure temperatures, and thermopiles were used to measure temperature differences. Next, extensive simulations were conducted with the mathematical model to estimate suitable gain settings for the various controllers. The criteria were tight temperature control after reaching set points and acceptable times to achieve quasi-steady-state operation. Comparisons between measurements and predicted temperatures for heated components are presented. The results show that the model incorporating the above simplifying approximations is satisfactory for components comprising the hot-plate and cold-plate assemblies. For the edge guards, however, the conventional aggregated-capacity criteria are not as fully satisfied because of their configuration. Temperature variations in the edge guards, fortunately, have a lesser effect on the accuracy of the thermal conductivity measurements. Therefore, the thermal response model is deemed satisfactory for simulating PID feedback to investigate “closed-loop” control of the apparatus, thus meeting the primary objective. Key words: building technology; guarded hot plate; mathematical simulation; PID; temperature control; thermal conductivity; thermal response. Accepted: December 22, 2017 Published: January 8, 2018 https://doi.org/10.6028/jres.123.001

Volume 123, Article No. 123001 (2018) https://doi.org/10.6028/jres.123.001
Journal of Research of the National Institute of Standards and Technology
2 https://doi.org/10.6028/jres.123.001
Glossary Symbol Units Description Ag m2 guard-gap surface area As m2 meter-plate surface area A m2 cross-sectional area Cp J/(kg·K) specific heat CTj J/K thermal capacity (mCp)j, component j Cij W/K thermal conductance between components or locations, i, j (subscripts are identified below and in Fig. 4) Ci en W/K thermal conductance from component or location i to ambient gas d m diameter dio m partition diameter e K, V error signal (set point minus controlled variable) hv W/(m2·K) convection conductance, component surface to ambient chamber gas hr W/(m2·K) radiation conductance, component surface to ambient atmosphere imax A maximum allowed current for a heating element L m thickness m kg mass (mC) J/K thermal capacity property Pv Pa pressure inside chamber
jq W power input from power supply j, where j = A, B, C, F, G, I, J, M, N, P q W heat-transfer rate
he jq , W power input to heater element from power supply j, where j = A, B, C, F, G, I, J, M, N, P r m radial coordinate Rpl Ω electrical resistance, power leads, constant Rhe(T) Ω electrical resistance, heating element, temperature dependent Rher Ω electrical resistance at reference temperature Tr RM K·m2/W R-value, metric units, L/λ Sλ m conduction shape factor, 1/∫dr/A(r) t s time T K temperature Tr K reference temperature (electrical resistance) UAs W/K surface conductance vc V controller output voltage (0 to 10) V, direct current Vps,j V voltage supplied to heater j element Vpsr,j V rated voltage, power supply j Δt s numerical solution time step Δtsr s controller update interval Δvsc V controller maximum step-change voltage αr K−1 electrical resistivity coefficient
κD,j V/K, V/V derivative gain, incremental algorithm, controller j κP,j V/K·s, V/V·s proportional gain, incremental algorithm, controller j λ W/(m·K) thermal conductivity Additional subscripts cc connection guard, cold-plate assembly, sides A, B cl coolant clamp assembly eg edge guard ei edge guard, inboard, assembly (main) A, B

Volume 123, Article No. 123001 (2018) https://doi.org/10.6028/jres.123.001
Journal of Research of the National Institute of Standards and Technology
3 https://doi.org/10.6028/jres.123.001
el edge-guard lug (bridge), outer zone, assembly A, B eo edge guard, outboard, assembly (auxiliary) A, B cr edge-guard coolant ring (ethanol-water or liquid nitrogen) i, j component identification index gc connection guard, hot-plate assembly gi guard plate, inner go guard plate, outer (rim) h heater plate, cold-plate assembly A, B hx block heat exchanger, hot-plate assembly m meter section, hot-plate assembly si surface plate inner zone, cold-plate assembly A, B so surface plate outer (rim) zone, cold-plate assembly A, B sp spiral fin coolant plate (ethanol-water or liquid nitrogen), cold-plate assembly A, B ta test specimen 1 (denoted Side A in Fig. 4) tb test specimen 2 (denoted Side B in Fig. 4) v chamber ambient (evacuated or pressurized gas) w water, cold-plate assembly back pan or edge-guard assembly jacket xh block heat exchanger
1. Introduction
The National Institute of Standards and Technology (NIST) recently completed design analysis,
fabrication, and initial operation of a 500 mm diameter guarded-hot-plate apparatus. This instrument was designed to measure the thermal resistance, or thermal conductivity, of insulating materials over the temperature range of 90 K to 900 K and over an ambient pressure range from 0.0133 3 Pa to 106.66 kPa in gaseous atmospheres (air and nitrogen). The apparatus will be used primarily to establish Standard Reference Materials (SRMs) for the thermal insulation research community and manufacturing industry. These internationally recognized SRMs are used primarily to calibrate instruments for measuring the thermal conductivity (λ) of materials under development or being manufactured. The unique capabilities of the instrument support NIST’s objectives for assisting the thermal insulation user community in achieving their testing requirements.
1.1 Background
Thermal insulation is generally a porous medium wherein heat transfer occurs through solid and
gaseous phases by conduction, convection, and radiation modes. In the absence of large-scale motion, natural thermal convection occurs within the pores or cells of the material; heat is conducted through the solid and gaseous phases; and thermal radiation occurs within continuous and discontinuous gaseous phases. At a given temperature and ambient gas pressure, heat conductance depends on the type and properties of the gas that permeates the material. Consequently, the guarded-hot-plate (GHP) apparatus is enclosed in a vacuum bell jar to maintain the gas phase composition and ambient pressure.
The guarded-hot-plate method has been standardized by both the International Organization for Standardization [1] and ASTM International [2]. An arrangement of the main mechanical components of a GHP, configured for horizontal heat flow, is shown in Fig. 1 and includes: (a) the guarded hot plate, which consists of a metered section and primary guard (configured for the circular geometry as an annular plate); (b) two cold plates; and (c) secondary edge guards. Ideally, the guarded hot plate and cold plates provide constant-temperature boundary conditions at the surfaces of the test specimens. The apparatus, with proper guarding, is designed to provide one-dimensional heat flow (Q) through test specimens.

Volume 123, Article No. 123001 (2018) https://doi.org/10.6028/jres.123.001
Journal of Research of the National Institute of Standards and Technology
4 https://doi.org/10.6028/jres.123.001
Fig. 1. Primary controlled components for a guarded-hot-plate apparatus (two-sided mode), where SPRTs are standard platinum resistance thermometers.
Cold plate 2 Cold plate 1
Principle: TC < TH; TC1 = TC2 = TC Practice: TC < TH; TC1 ≈ TC2 ≈ TC
Guard plate
Guarded hot plate (meter plate)
TC2 TH
Specimen
Specimen
SPRTs
Gap
C L
dio
do
di
Ambient gas
TC1
Outer guard heater
Inner guard heater
Meter plate heater
Secondary edge guard
Q 2
Guard gap thermopile
Outer guard thermopile
Gap
Q 2
Volume 123, Article No. 123001 (2018) https://doi.org/10.6028/jres.123.001
Journal of Research of the National Institute of Standards and Technology
5 https://doi.org/10.6028/jres.123.001
The GHP apparatus is designed to operate in the two-sided operating mode. Two test specimens—ideally with the same nominal density, size, and thickness—are placed between the hot and cold plates. The apparatus, with proper guard control in the radial direction, provides essentially one-dimensional heat flow through the metered section and, with the two cold plates at the same temperature, equal heat flow (Q/2) through each specimen. With steady-state temperatures and heat flow, the thermal resistance [L/(A·λ)] and thermal conductivity (λ) are determined using Fourier’s equation [3]:
( )g h c
s .2 2
A T TQ AL
λ−
= +
(1)
The reference cross-sectional area, [As + Ag/2], is prescribed by Ref. [2], with As being the meter plate surface area and Ag being the guard gap surface area.
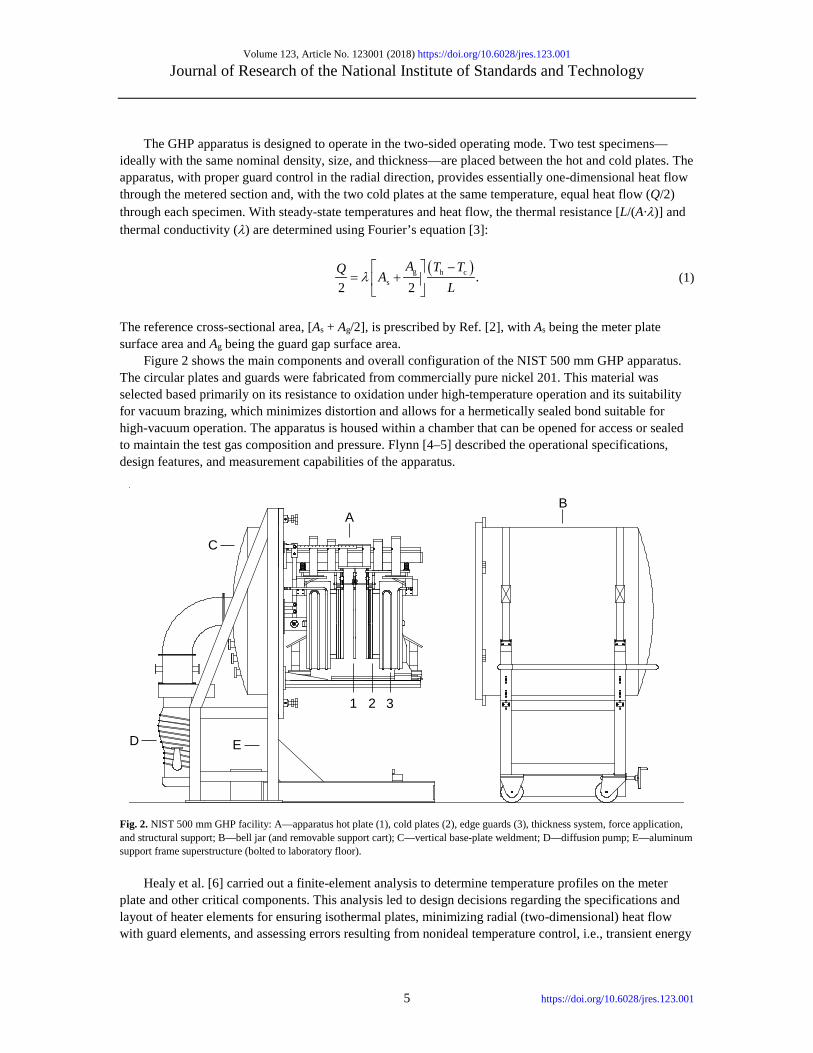
Figure 2 shows the main components and overall configuration of the NIST 500 mm GHP apparatus. The circular plates and guards were fabricated from commercially pure nickel 201. This material was selected based primarily on its resistance to oxidation under high-temperature operation and its suitability for vacuum brazing, which minimizes distortion and allows for a hermetically sealed bond suitable for high-vacuum operation. The apparatus is housed within a chamber that can be opened for access or sealed to maintain the test gas composition and pressure. Flynn [4–5] described the operational specifications, design features, and measurement capabilities of the apparatus.
Fig. 2. NIST 500 mm GHP facility: A—apparatus hot plate (1), cold plates (2), edge guards (3), thickness system, force application, and structural support; B—bell jar (and removable support cart); C—vertical base-plate weldment; D—diffusion pump; E—aluminum support frame superstructure (bolted to laboratory floor).
Healy et al. [6] carried out a finite-element analysis to determine temperature profiles on the meter
plate and other critical components. This analysis led to design decisions regarding the specifications and layout of heater elements for ensuring isothermal plates, minimizing radial (two-dimensional) heat flow with guard elements, and assessing errors resulting from nonideal temperature control, i.e., transient energy
1 2 3
A B
C
D E

Volume 123, Article No. 123001 (2018) https://doi.org/10.6028/jres.123.001
Journal of Research of the National Institute of Standards and Technology
6 https://doi.org/10.6028/jres.123.001
storage effects. The latter investigation indicated that a small drift in the temperature of the metered section of the hot plate can cause a rather large conductivity measurement error resulting from heat energy storage, or release, to or from the meter plate. The present development of a transient temperature response model was initiated to understand these responses and to support satisfactory operation of the apparatus.
Precise temperature control of various components is required to achieve a target expanded uncertainty of approximately 2 % for measurements of steady-state heat transmission properties. There are 16 proportional-integral-derivative (PID) controllers for the electrically heated elements located in various components of the apparatus. The gain settings on each controller need to be determined to achieve the required operational control of the system. Primarily due to this large number of controller parameters and the lengthy time required to complete an actual test run, a mathematical model was developed to simulate the dynamic responses of components to changes in controller settings. These simulations provide a means for deriving a set of control parameters that is several orders of magnitude faster and less expensive compared to operating the instrument in a trial-and-error tuning procedure.
Thomas and Zarr [7] described a similar simulation approach for a much simpler model for the NIST 1016 mm GHP apparatus. That instrument was designed to operate at room temperature in atmospheric air. It has three controlled heating elements in the hot-plate assembly; the cold-plate temperatures are maintained by a water-cooling bath; and there are no edge or plate connection guards. The success of the simulation approach in determining those control parameters was a primary consideration in developing a similar mathematical model for tuning the 500 mm GHP controllers.
1.2 Scope
This paper describes the aggregated (“lumped”) capacity configuration, the system of first-order
differential equations comprising the model, and the implicit finite-difference calculation procedure used to simulate the response of the components to prescribed heating rates. Comparisons between predicted results and measurements for step changes in heating rates are presented. Simulated temperature responses were compared with those measured during actual operation of the apparatus.
2. Mathematical Model of the Apparatus
The goal of this paper is to describe a tractable model of the essential thermal response characteristics
for various component heating rates and ambient conditions within the chamber from an arbitrary starting condition through steady operation. The objectives of these simulations are to determine ranges of operating temperatures, required heating rates, and times required to approach quasi-steady operation for the apparatus.
2.1 Analysis
Instantaneous energy balances on the metering plate, the guard plate, and the heated subcomponents of
the cold plates and various guards provide the basic relationships for dynamic system response. An exploded view of the main components of the GHP apparatus is provided in Fig. 3. The hot plate consists of a center metering plate surrounded by a guard plate, and a connection guard. The connection guard is designed to minimize conduction heat transfer along sheaths for standard platinum resistance thermometers (SPRTs), heater leads, and thermocouple wires (located along the visible lines in the picture). The cold plate consists of a surface plate and heater plate of the same diameter (not shown), separated by a thin insulating material (shown in Fig. 4), and a connection guard. The edge guards are configured as a ring with a top cutaway to accommodate sheaths for sensor and heating wires. The outer ends of the edge guards

Volume 123, Article No. 123001 (2018) https://doi.org/10.6028/jres.123.001
Journal of Research of the National Institute of Standards and Technology
7 https://doi.org/10.6028/jres.123.001
provide a bridge for supporting the edge-guard assembly. In operation, the edge guards enclose the plate assemblies.
Fig. 3. Guarded hot plate, cold surface plate, and edge-guard components (exploded view). Figure 4 shows a schematic of the significant heat-flow paths between components and the ambient
gas for modeling temperature responses. Components comprising the mathematical model are partitioned into different “zones,” with each zone modeled as an aggregated-capacity mass. The mass of each of these components or zones is assumed to have an aggregated thermal capacity that can be represented by a discrete temperature. This partitioning is convenient and realistic for zones served by a separately controlled heating element, namely, the guard plate, cold plates, and edge guards. It also is used for (unheated) components, the temperatures of which depend on thermal interaction with their surroundings, such as the block heat exchanger and dry coolant chambers.
The thermal conductance values along the heat-flow paths shown in Fig. 4 are based on conduction, convection, and radiation principles. Conductance values across composite materials are significantly more uncertain because their evaluation involves thermal contact resistance, conduction and convection in evacuated enclosures, and radiation exchange.
2.1.1 Zone Partitioning
Section 2.1.1 describes the zones used in the analysis. In the model, a zone is defined as an isothermal
region generally with an embedded controlled heating element.
2.1.1.1 Hot Plate Representing the metering plate as a single aggregated-capacity mass, or zone, is clearly justified,
since this component has been carefully designed to be nearly isothermal and is thermally well insulated. The guard plate contains two separately controlled heating elements. The outer region usually operates at a slightly lower temperature than the inner region. The outer zone has a strong thermal conductance to the hot-plate guard connection and a significant conductance to the inboard edge-guard zones, which are difficult to determine analytically. The guard plate is partitioned into inner and outer zones by taking the partition diameter, dio, to be the same as that for the cold surface plates.

Volume 123, Article No. 123001 (2018) https://doi.org/10.6028/jres.123.001
Journal of Research of the National Institute of Standards and Technology
8 https://doi.org/10.6028/jres.123.001
coolant out
cceicp
con
n gu
ard,
cc
gccl
a (f
utur
e)gcxh
Chamber ambient temperature Tvp, gas pressure, Pv
edge guardhp c
onn
guar
d
met
er p
late
m
guar
d rin
g
Inne
r gi
out
er g
o
heat
er p
late
h
msia
soh
gisoa
gosoa
a
gisob
gosob
msib
soei
gio
eoel
gc cca
UA
gc
test
spec
imen
A
ta
test
spec
imen
B
tb
mgi
socc
Side ASide B
gogc
inboard ei outboard eo
Heavy solid lines represent significant heat flow paths and labels denote conductance (C’s) subscripts. Green lines denote paths with convection to chamber gas and radiation. Side B components (not entirely shown, denoted “b” in subscript) are same as side A, denoted “a” in subscripts.
eoec
insulation
eiec
hei or heo
radial
centerline
goeia
coolant in (ec)
bloc
k hx
UAxh
xhspcb
12 to 94 mm thick
bridge elainsulation
cccl
coolant tube clamp cl
goeib
sio
out.
surf
pla
te so
sih
in. s
urf p
late
si
Spira
l fin
coo
lant
pla
te sp
Bac
k pa
n w
(w
ater
jack
et) water in
(w)
water out
eio
UAel
water
in/outedge guard water jacket Tw
EG coolant ring, eccoolant
in/out
fabr
ic in
sul.
mic
ropo
rous
insu
l.
Alu
min
a au
x in
sula
tion
eisp oreosp
hsp spw
crw
UAcr
UAei
UAcc
UAei
cch
soeo
axial centerline
spcl
Fig. 4. Schematic of thermal conductance paths between components and ambient gas within the GHP apparatus. There is a strong thermal conductance between the inner and outer elements (λ∙Sλ). The thermal
conductance between the inner and outer zones is approximated by the one-dimensional “shape factor,” given by

Volume 123, Article No. 123001 (2018) https://doi.org/10.6028/jres.123.001
Journal of Research of the National Institute of Standards and Technology
9 https://doi.org/10.6028/jres.123.001
ioto
ti
2π ,ln
LSdd
λ =
(2)
where L is thickness, dto is the diameter of the outer thermocouple circle, and dti is the diameter of the thermal center of the inner zone. Equation (2) is also used for the conductance between the inner and outer zones of the cold plate, with L as the thickness of that plate.
2.1.1.2 Cold Plate
The surface plate has an embedded perimeter heater and is partitioned into inner and outer zones. The
inner zone temperature is measured by a centrally located SPRT feedback sensor, which controls power to the heater plate as part of a closed-loop feedback system. (The heater plate is separated from the surface plate by a thin layer of insulation.) The inner region of the surface plate was designed to be isothermal by carefully configuring the embedded element across the entire surface of the heater plate.
The perimeter heater is intended to minimize temperature drop near the vicinity of the rim, which may occur in operation at higher temperatures. Its output is controlled using the temperature measured with three embedded thermocouples equally spaced at a radius of 230 mm. The partition between the inner and outer zones was selected such that these thermocouples are located essentially on the thermal center of the outer zone. The partition diameter dio is 423.2 mm. The heater plate is represented as a single zone.
2.1.1.3 Edge Guard
Partitioning the edge guard is less critical, since thermal couplings to the meter plate and cold surface
plates are lessened by increased proximity to these components. The main heating source consists of four elements connected electrically in parallel to one power supply, which is controlled by thermocouples located between the elements. The auxiliary heating source is an additional element connected to another power supply, which is controlled by a thermocouple 12.5 mm from the element. The assumed partition is, therefore, midway between the fourth and fifth heating elements, so approximately 80 % of the mass is assigned to the inboard (main) zone, and 20 % is assigned to the outboard (auxiliary) zone. The outer bridge is defined as the third zone of the edge guard.
2.1.2 Storage Capacities and Heat Conductance Values
The thermal storage capacities (mCp) and conductance values (C, UAs, λ∙Sλ) for all heat-flow paths and
for each component are required to implement the temperature response model. The thermal storage capacities are based on actual weights (mass) and specific heats of the various components. The material for these components is nickel 201. The specific heat, denoted Cp, varies from 232 J/(kg·K) at 100 K to 545 J/(kg·K) at 900 K. This property was evaluated at the set-point temperature of the component and then multiplied by its mass to determine storage capacity. Since measurements show only slight differences between the masses of corresponding Side A and Side B components, an average value can be used.
Referring to Fig. 4, the dynamic system is described by the following first-order differential equations that follow from energy balances. Thermal conductance values, symbolically denoted by (λAs)/L, are through single homogeneous materials; C is used for composite paths; and the conductivity, i.e., conduction shape factor product (λ∙Sλ), is used between adjoining metallic components.

Volume 123, Article No. 123001 (2018) https://doi.org/10.6028/jres.123.001
Journal of Research of the National Institute of Standards and Technology
10 https://doi.org/10.6028/jres.123.001
2.1.3 Hot-Plate Assembly This assembly consists of a heated metering section, a guard plate, a connection guard, and an
unheated block heat exchanger.
2.1.3.1 Meter Section The temperature behavior of the meter section is represented by:
[ ] [ ] ( )s msia m sib m mgi gi m A m
ta tb
λ λ,sA A dTT T T T C T T q mC
L L dt − + − + − + =
(3)
where the subscripts “a” and “b” denote the respective sides in Fig. 4. The symbol Aq denotes the heat
input when the low-temperature power supply is used. It is replaced by Eq when the high-temperature power supply is used.
2.1.3.2 Guard Plate, Inner Zone
The temperature behavior of the inner zone of the guard plate is represented by:
( ) ( ) gis ssoa gi sob gi λ go gi mgi m gi M gigio
gisoa gisob
λ λλ .g
dTA AT T T T S T T C T T q mC
L L dt − + − + − + − + =
(4)
2.1.3.3 Guard Plate, Outer Zone
Noting that the outer edge surface exchanges heat also with the edge guard by convection and radiation
through the gas-filled annular space, in terms of the conductance, Cgoei(a,b), an energy balance gives
( )
( )
s ssoa go sob go g λ gi go gogc gc gogio
gosoa gosob
gogovgc v go goeia eia go goeib eib go F go
λ λλ
,
A AT T T T S T T C T T
L L
dTC T T C T T C T T q mC
dt
− + − + − + − +
− + − + − + =
(5)
where Cgovgc is the conductance from the guard plate to the vacuum chamber gas at Tv.
2.1.4 Connection Guard, Hot-Plate Assembly
Noting that the connection guard also exchanges heat with the ambient gas in terms of surface
conductance from the connection to the block heat exchanger and an overall surface conductance (UAs)gc, an energy balance gives
( ) ( )
gogc go gc govgc v gc gchx hx gc gcvxh xh gc
gcs v gc Bgc gc
.
C T T C T T C T T C T T
dTUA T T q mC
dt
− + − + − + − +
− + =
(6)
Volume 123, Article No. 123001 (2018) https://doi.org/10.6028/jres.123.001
Journal of Research of the National Institute of Standards and Technology
11 https://doi.org/10.6028/jres.123.001
2.1.4.1 Guard Block Heat Exchanger The block heat exchanger is thermally connected to coolant tube clamps to provide supplemental
cooling to the hot-plate connection guard. It has no internal heating element, and its thermal storage capacity is small compared to that of the heated components, such that
[ ] [ ] [ ]
[ ] [ ] ( ) [ ] ( )
gcxh gc xh gcvxh v xh xhcla cla xh xhclb clb xh
xhxhvcla cla xh xhvcl clb xh s v xhxh xh
0.
C T T C T T C T T C T T
dTC T T C T T UA T T mCdt
− + − + − + − +
− + − + − = ≈ (7)
The expressions for the constituent components, denoted as Side A and Side B in Fig. 4, are similar, so the “a” and “b” subscripts are omitted in the following sections.
2.1.5 Cold-Plate Assembly
This construction includes a cold surface plate, a heater plate, a connection guard, a spiral-fin coolant
plate, and a back water jacket. The surface plate is partitioned into two isothermal zones. The outer zone has a rim heater that may be enabled when operating the apparatus at relatively high temperatures. Although the inner zone has no integral heating element, its temperature (Tsi) controls the element distributed across the heater plate (denoted Pq ). The diameter of the inner zone is taken as the diameter of the metering plate. The mathematical relationships for the zones are as follows.
2.1.5.1 Inner Zone, Surface Plate
The temperature behavior of the inner zone (Tsi) of the surface plate is represented by:
[ ] ( ) [ ] [ ] ( ) sim si λ so si sih h sisio si
msi
λλ .sA dT
T T S T T C T T mCL dt
− + − + − =
(8)
2.1.5.2 Outer (Perimeter) Zone, Surface Plate
The temperature of the outer zone (Tso) controls the power to its rim heater ( Gq ), such that
( ) [ ] ( ) ( ) [ ]
[ ] [ ] [ ] [ ] ( )
s sk si so gi so go so socc cc sosio
giso goso
sosovcc ei so soei ei so soeo eo so soh h so G so
λ λλ
.
A AC T T T T T T C T T
L L
dTC T T C T T C T T C T T q mC
dt
− + − + − + − +
− + − + − + − + =
(9)
2.1.5.3 Connection Guard, Cold Plate
The temperature behavior of the connection guard (Tcc) on the cold plate is represented by:

Volume 123, Article No. 123001 (2018) https://doi.org/10.6028/jres.123.001
Journal of Research of the National Institute of Standards and Technology
12 https://doi.org/10.6028/jres.123.001
[ ] [ ] [ ] [ ]
[ ] [ ] ( ) [ ] ( )
socc so cc sovcc v cc gccc gc cc ccei ei cc cch h cc
ccccvh v cc ccsp sp cc ccvsp v cc s v cc C cccc
.
C T T C T T C T T C T T C T T
dTC T T C T T C T T UA T T q mC
dt
− + − + − + − + − +
− + − + − + − + =
(10)
2.1.5.4 Heater Plate
The temperature behavior of the heater plate (Th) is represented by:
[ ] [ ] [ ] [ ]
[ ] [ ] ( )
sih sia h soh so h cch cc h ccvh v h hsp pc h
hhei ei h heo eo h P h
.
C T T C T T C T T C T T C T T
dTC T T C T T q mCdt
− + − + − + − + − +
− + − + =
(11)
2.1.6 Edge-Guard Assembly
This construction has three zones, denoted inboard, outboard, and bridge. The inboard zone has four
embedded heaters with two parallel elements connected in series to a single power supply.
2.1.6.1 Inboard Zone The temperature behavior of the inboard zone of the edge-guard assembly (Tei) is represented by:
[ ] [ ] ( ) [ ] [ ]
[ ] ( )[ ] ( )
goei go ei soei so ei hei h ei λ eo ei eicr cr eieio
eieisp sp ei ccei cc ei ei v ei N ei
λ
.
C T T C T T C T T S T T C T T
dTC T T C T T UA T T q mC
dt
− + − + − + − + − +
− + − + − + =
(12)
2.1.6.2 Outboard Zone
The temperature behavior of the outboard zone of the edge-guard assembly (Teo) is represented by:
( ) [ ] [ ] [ ] [ ] [ ]
( )[ ] ( )
e λ ei eo soeo so eo eoel el eo heo h eo eocr cr eoeio
eoeosp sp eo eo v eo I eo
λ
.
S T T C T T C T T C T T C T TdT
C T T UA T T q mCdt
− + − + − + − + − +
− + − + =
(13)
2.1.6.3 Edge-Guard Bridge (Lug)
The temperature behavior of the bridge of the edge-guard assembly (Tei) is represented by:
( ) [ ] [ ] ( ) [ ] ( ) ele λ eo el elcr cr el s v el Jeoel el el
λ .dT
S T T C T T UA T T q mCdt
− + − + − + = (14)
2.1.7 Coolant Plates and Rings
The expressions for these components are included in the dynamic system only when water jackets are
used to cool or isolate the GHP components from ambient disturbances, and the primary coolant (water, ethanol, ethanol-water mixture, or liquid nitrogen) is not used. The GHP apparatus operates in this mode

Volume 123, Article No. 123001 (2018) https://doi.org/10.6028/jres.123.001
Journal of Research of the National Institute of Standards and Technology
13 https://doi.org/10.6028/jres.123.001
when testing at relatively high temperatures, where the water jackets isolate the critical components from ambient disturbances. In this mode, the chamber’s thermal storage capacities and the coolant-to-water jacket conductance values can significantly affect the thermal response of the cold-plate and edge-guard assemblies.
2.1.7.1 Spiral-Fin Plates
The result of an energy balance for the spiral-fin plates, located in the cold-plate assemblies and
assumed to be dry, is
( ) ( )
hsp h sp eisp ei sp eosp eo sp spcl cl sp spvcl cl sp
spspw w sp s v ep spsp
.
C T T C T T C T T C T T C T T
dTC T T UA T T mC
dt
− + − + − + − + − +
− + − = (15)
2.1.7.2 Coolant-Clamp Assembly
Similar to the block heat exchanger (Sec. 2.1.4.1), the small coolant tube-clamp assembly is included
as a floating component when the apparatus is operated with water cooling only and no coolant flow. An energy balance for this component gives
[ ] [ ] [ ] [ ]
[ ] ( ) [ ] ( )
spcl sp cl spvcl v cl xhcl xh cl xhvcl v cl cccl cc cl
clccvcl v cl s v cl clcl
0.
C T T C T T C T T C T T C T T
dTC T T UA T T mC
dt
− + − + − + − + − +
− + − = ≈ (16)
The change in thermal energy storage is neglected because this storage is much smaller compared to
other components.
2.1.7.3 Coolant Rings An energy balance for the coolant rings, located in the edge-guard assemblies, gives
[ ] [ ] [ ] [ ] ( ) [ ] ( ) creicr ei cr eocr eo cr elcr el cr crw w cr s v cr crcrp
.dT
C T T C T T C T T C T T UA T T mCdt
− + − + − + − + − = (17)
2.2 Model Application
As noted earlier, the equations for the corresponding components on Side B (Fig. 4, left) are the same
as Eq. (8) through Eq. (17) for all components on both sides and with coolant flowing through the cooling rings and spiral-fin plates. This model therefore comprises a system of 19 equations with the capability of simulating both symmetric and asymmetric operation. (The latter mode could be used to simulate operation in the one-sided configuration, with one side of the metering plate effectively insulated, and all the heat flow through one test specimen.)
The design operating approach for the two-sided configuration is symmetrical with respect to the hot-plate center plane. One mode of operation is with coolant flow in the spiral plates and edge-guard cooling rings and with the block heat exchanger disconnected from coolant flow. The corresponding simulation model consists of 12 equations (10 heated elements) and, of course, entails much less calculation time per

Volume 123, Article No. 123001 (2018) https://doi.org/10.6028/jres.123.001
Journal of Research of the National Institute of Standards and Technology
14 https://doi.org/10.6028/jres.123.001
simulation compared to the asymmetrical configuration. Using the incremental control algorithm, controller gain settings are required for each of the 10 power supplies. For the symmetrical conditions in the apparatus, there are 6 additional power supplies for the cold-plate assembly and edge-guard assembly on Side B that use the same control settings as Side A.
In another mode of operation at higher temperatures, the surrounding jacket with water flowing provides the required cooling, and the requirement for coolant flow through the spiral-fin plates and edge-guard cooling rings is eliminated. With water flowing through the jacketing enclosure (and the coolant chambers empty), the model consists of a system of 15 equations to simulate symmetric two-sided operation. This operating mode also requires developing a set of controller gain settings for 10 power supplies.
2.3 Heating Power and Control Algorithm
The system processes temperature and thermocouple voltage feedbacks to provide 0 V to 10 V direct
current (dc) signals to programmable power supplies. The latter, which are essentially linear amplifiers, supply relatively high-level dc voltages to the heating elements in various components. Temperature corrections by controller actions are proportional to heater power, i.e., voltage squared.
Relationships for the heat source terms q in Eq. (3) through Eq. (14) (and corresponding equations for Side B) are developed in this section. The magnitudes of these terms depend on the controlled output voltage of the power supplies.
2.3.1 Algorithm
The mathematical model for response simulations is formulated in state space, which is the same as
implemented in the control program for the actual apparatus. The PID algorithms, using both the so-called “positional” and “incremental” forms [8], were investigated and developed as discussed in Thomas and Zarr [7]. The backward-difference incremental (also called “velocity” or PD) form,
( ) ( )k k 1 P sr k D k k 1κ κ ,v v t e e e− −− = ∆ + − (18)
was selected to control heater voltages. Individual heated elements are protected by limiting the maximum step change ∆vsc intended to control thermal shock. This limit and the extraneous calculation with a nonpositive voltage can be conveniently implemented in terms of the redefined gains, maximum and minimum allowable voltage, and maximum change by the expression
( ) [ ] ( )k i sc k 1 P sr D k k 1max 0, min 10, , κ κ .kv v v v t e e e− − = + ∆ + ∆ + − (19)
This incremental PD algorithm is used in the response simulation model and is also implemented in the control program for the actual apparatus.
Random “white noise” was introduced into feedback signals for the temperature controllers in the mathematical model to simulate uncertainties and real perturbations in the more critical components. This enhancement was intended to investigate potential instabilities or undamped oscillations as a result of perturbations in the hot- and cold-plate components. The feature was implemented by using a random number in the range −0.5 to +0.5 multiplied by an amplitude, and adding the result to the error signal. The amplitudes were approximated by observing real feedback signals on an oscilloscope. The present simulations were based on amplitudes of 0.000 5 K to 0.001 K.
Volume 123, Article No. 123001 (2018) https://doi.org/10.6028/jres.123.001
Journal of Research of the National Institute of Standards and Technology
15 https://doi.org/10.6028/jres.123.001
The controller update frequency is limited by the “settling time” required by precision measuring instruments and additional delays associated with other functions of the desktop computer data-acquisition system. An update rate of 60 times per hour was found to be an approximate, and also convenient, maximum.
2.3.2 Power Supplies and Component Heating Elements
At each controller update, Eq. (19) fixes the output voltage Vps from the power supply to a specific
heater. This voltage is somewhat higher than the actual voltage drop across the active element as a result of losses in the connecting circuit. During tests, the GHP apparatus measures and records voltages near, but not directly at, heating elements (except for the meter plate). In order to better compare measured and calculated voltages and heating rates, the electrical line losses between the power supply and heating element are taken into account.
The complete circuit resistance includes the connecting power leads (Rpl) and the heating element (Rhe). The former values were measured at room temperature and assumed constant for different test temperatures. The heaters for the connection and edge guards are a nickel-chromium-iron alloy that have an electrical resistance change of less than ± 5 % over the operating temperature range of the GHP. These resistances can, therefore, be assumed constant at the measured room temperature values. The heaters in the hot and cold plates, however, have nickel wire, in which the electrical resistance is dependent on temperature. The resistance of the nickel wire at a high and low temperature could be determined directly for the meter-plate heater, since the electrical current and voltage drop at the power supply outlet and essentially across the heater element can be accurately measured. Consequently, the resistance of the nickel heaters versus temperature is taken into account by the linearized expression
( ) [ ]( )he her r1 ,rR T R T Tα= + − (20)
where αr is based on measurements for the meter plate.
Heated subcomponents are also protected by the capability to limit the maximum supplied current, imax, to less than the rated current. Taking this into account, and under the condition that a power supply may be current or voltage limited, the expression in the simulation model for the heat transfer from the element to the heated component as a function of the latter’s temperature (T) is
( ) ( )( ) ( )
2
psrk k 1 sche max he
he pl
min ,min , .
10 v dcVv v v
q T i R TR T R
− + ∆ = +
(21)
2.3.3 Solution Method
The temperature response of the hot-plate instrument with coolant flow in the two-sided (symmetrical)
mode of operation is simulated by solving the system represented by Eq. (3) through Eq. (14), and the above relationships for the heat source terms. Similarly, solving Eq. (3) through Eq. (17) simulates two-sided operation with only water flow through the jackets and no coolant flow. The system of equations is solved numerically using the discrete approximation for the time derivative of temperature,
( ) ( )
,T t t T tdT T T
dt t t+ ∆ − ′ −
≈ =∆ ∆
(22)

Volume 123, Article No. 123001 (2018) https://doi.org/10.6028/jres.123.001
Journal of Research of the National Institute of Standards and Technology
16 https://doi.org/10.6028/jres.123.001
where Δt is the solution time step, and the prime symbol denotes “future temperature.” This expression is used to recast the differential equations into the appropriate form for an implicit solution. The resulting finite-difference temperature equation for each component i has the form
( ) ( ) ( ) ( )J J K
i iij j ij i i ik k i
j 1 j 1 k 1,
mC mCC T C T T C T q
t t= = =
′ ′− + + = + +
∆ ∆ ∑ ∑ ∑ (23)
where j denotes all components connected by heat-flow paths to component i. Solving the system of algebraic equations simultaneously for the T primes at each time step gives the temperature history for each component in response to the controlled heating rates ( )iq t .
The mathematical model was programmed in a commercial graphical-interface software package, which was also used for the apparatus control algorithm. Thus, the simulated controller gain settings are directly applicable to the apparatus. This equation solver is extremely fast, simulating in a few seconds an actual test that takes days.
3. Validation of the Mathematical Model
Initial simulations were conducted to estimate a suitable calculation time step, assess the time required
from a “cold” startup to approach quasi-steady state, and investigate operating limitations.
3.1 Temperature Measurement The simulation model predicts temperature responses for various component heating and cooling
scenarios. Temperature measurement instruments are as follows.
3.1.1 Standard Platinum Resistance Thermometers An SPRT was used for primary temperature measurement in three components of the system being
modeled: the meter plate and two inner surface plates of the cold-plate assemblies.
3.1.2 Thermocouples The GHP instrument has metal-sheathed, mineral-insulated type N (nickel-chromium-silicon vs.
nickel-silicon) thermocouples embedded in the component zones described earlier, except for the heater plates of the cold-plate assemblies, which have no temperature sensor.
3.1.3 Thermopile
Two thermopiles measure the differences across the meter plate–guard plate gap on both faces of the
assembly. Each thermopile has 12 junctions of type K thermocouple wire.
3.2 Validation Tests Validation of the model involved two steps. The first verified the temperature response of the model,
and the second confirmed that derived controller gain settings delivered acceptable operation of the apparatus.

Volume 123, Article No. 123001 (2018) https://doi.org/10.6028/jres.123.001
Journal of Research of the National Institute of Standards and Technology
17 https://doi.org/10.6028/jres.123.001
After preliminary iterations, the initial simulations were based on a test material with a thermal conductivity of 0.0288 W/(m∙K) and a thickness of 50.8 mm (RM = 1.764 m2∙K/W) in air at approximately 295 K and 98.1 kPa. Required material properties were taken from Flynn [4], Incropera and DeWitt [9], and ASHRAE [10]. The testing configuration was symmetrical. Consequently, the simpler model, with centerline symmetry was used to reduce simulation times. The ideal calculation time step (Δt) was as large as possible to minimize computation time and small enough to ensure convergence to the solution of the model. Initial calculations resulted in selecting a 60 s time step.
Data were obtained from initial experiments specifically designed to validate the basic thermal responses of three primary component assemblies of the hot-plate apparatus. In these tests, the apparatus was initially in thermal equilibrium with the chamber air at approximately 295 K. Then, one (or two for symmetrical components) heating element(s) was (were) suddenly powered with a steady voltage, resulting in a nearly constant heat release in the component. The components heated in these separate tests were the meter plate in the hot-plate assembly, the hot-plate assembly connection guard, the heater plate in the cold-plate assemblies, and the inboard edge guards. Heating continued until the temperature of the component approached a steady or predetermined value. The heater was then turned off, and the apparatus was allowed to cool and approach chamber air temperature again. Data were recorded during both the heat-up and cool-down phases.
3.2.1 Step-Change Heating of Individual Components
Figure 5 compares the calculated and measured temperature response of the meter-plate, guard plate
outer (rim) zone, and connection guard. This test was conducted with no coolant flow in either the spiral plate and cooling rings and no water flow in the jackets. At the start of the test, 2.19 V, from calculations for the desired heating rate, was maintained across the heating element in the metering plate. The heating rate, based on the measured electrical current through a 0.1 Ω shunt resistor and the voltage across the element, decreased from an initial 1.72 W to 1.70 W in response to a slight resistance change with temperature. The heat was turned off after 7 h, well before reaching a steady state. Both measured and predicted temperature differences between the inner and outer zones of the guard plate were small (< 0.2 K at 7 h); the results shown are for the outer (rim) zone.
The agreement between the measured temperatures is deemed acceptable, with a maximum deviation of approximately 0.2 K at the end of the heating phase for the meter plate, 0.1 K for the guard plate, and 0.4 K for the connection guard. The most significant uncertainties in the mathematical model are the thermal conductance values across the guard gap and from the outer surface of the guard plate to its surroundings. The thermopile sheaths are press-fit replacements for the original vacuum-brazed nickel-chromium alloy 600 sheaths. The calculations assume that the thermal conductance for the replacements is one half that of the originals. The SPRT well spans the air gap cross section and the space between the guard plate and connection guard (Fig. 3). These conductance values are based on estimated effective lengths. Conductance from the outer surface of the guard plate accounts for heat transfer to the ambient air, radiation to the edge-guard surfaces, and conduction through sheaths for sensor and heating element wires. The agreement during the cool down period is also acceptable. The effects of heating the meter plate on the temperatures of the (unheated) cold-plate and edge-guard assemblies were small (< 0.2 K; not shown in Fig. 5).

Volume 123, Article No. 123001 (2018) https://doi.org/10.6028/jres.123.001
Journal of Research of the National Institute of Standards and Technology
18 https://doi.org/10.6028/jres.123.001
Fig. 5. Temperature response of hot-plate assembly with only meter-plate heating. Figure 6 shows the effect on the hot plate of heating its connection guard. In this test, the temperature
of the ethanol-water coolant entering the spiral plate was maintained at 283 K, and the initial temperatures of the rim and connection guard were 286 K and 290 K, respectively. The latter component was subsequently subjected to a heating rate of 2.82 W. The predicted and measured temperatures of the connection guard tracked closely during the transient period. The maximum difference was about 1 K. The thermal conductance between the two components resulted in a temperature rise of about 4 K in the outer (rim) zone of the hot plate.
Fig. 6. Temperature response of hot plate with only connection guard heating.
294
295
296
297
298
299
300
0 5 10 15 20
Tem
pera
ture
, K
Elapsed time, h
Meter plate, calculatedMeter plate, measuredRim, calculatedRim, measuredConnection guard, calculatedConnection guard, measured
284
286
288
290
292
294
296
298
300
302
304
0 5 10 15 20 25 30 35 40 45 50
Tem
pera
ture
, K
Elapsed time, h
Rim, calculated
Rim, measured
Connection guard, calculated
Connection guard, measured

Volume 123, Article No. 123001 (2018) https://doi.org/10.6028/jres.123.001
Journal of Research of the National Institute of Standards and Technology
19 https://doi.org/10.6028/jres.123.001
Figure 7 shows the responses of cold-plate components suddenly subjected to a 14.8 W heating rate by the heater-plate element. After 74.4 h, the heater was turned off, and the coolant temperature suddenly changed from the initial 284.5 K to 294 K. The figure shows that there was no significant difference between the temperatures of the inner and outer zones of the cold plate. The temperature of the heater plate (calculated but not measured) was essentially the same as that for the surface plate. The difference between the predicted and measured surface plate temperatures at the steady heated state was about 1 K, and the corresponding difference for the cold-plate connection guard was about 0.4 K.
Figure 8 shows the response of the edge-guard components resulting from a sudden combined heating rate of 116 W from the heating elements of the main (inner) zone, consisting of four heating elements. The predicted and measured data agree well for the main (inner) zone of the edge guard, with about a 0.5 K difference at the peaks. The predicted peak for the outer (auxiliary) zone guard was about 4 K below that measured, while the peak predicted temperature for the bridge was about 3 K lower than that measured. The rate of temperature rise for the bridge during the heating phase was somewhat higher than the predicted value, but it was about the same as predicted for the two edge-guard zones.
As discussed later in this paper, the temperature of the auxiliary zone was measured with a single thermocouple located on the bottom surface of the edge-guard assembly. The temperature measurement for the main zone was based on an average from thermocouples spaced around the main zone. When the edge guard was heated, this configuration resulted in a thermal gradient from the effect of natural convection, i.e., the top surface of the relatively large component was warmer than its bottom surface. Although this zone was modelled as an aggregated-capacity subcomponent, significant differences exist between the predicted and measured temperatures for the auxiliary zone (as shown later herein). This difference is not apparent from Fig. 8, likely because it is overshadowed by uncertainties in the heat conductance values associated with the edge-guard assembly.
Fig. 7. Temperature response of cold-plate assembly with power to heater plate only.
284
286
288
290
292
294
296
298
300
302
0 10 20 30 40 50 60 70 80 90
Tem
pera
ture
, K
Elapsed time, h
Surface plate inner zone, calculatedSurface plate inner zone, measuredSurface plate outer (rim) zone, calculatedSurface plate outer (rim) zone, measuredCold plate connection guard, calculatedCold plate connection guard, measured

Volume 123, Article No. 123001 (2018) https://doi.org/10.6028/jres.123.001
Journal of Research of the National Institute of Standards and Technology
20 https://doi.org/10.6028/jres.123.001
Fig. 8. Temperature response of edge-guard assembly with power only to the main (inner zone) heating elements.
3.2.2 Discussion of Diagnostic Tests The initial diagnostic experiments shown in Figs. 5–8 provided essential data to improve estimates of
thermal conductance values between various components and capacitance values of the hot-plate components. The results indicate that steady-state data with only one element (or a pair of elements) powered are more useful to isolate and validate critical conductance values without the uncertainties associated with transients. The mathematical model was therefore deemed sufficiently valid to proceed with simulations to examine control scenarios and develop controller gain settings.
3.3 Simulations of Typical Guarded-Hot-Plate Operation and Comparisons with Test Data
In these tests, the GHP apparatus was operated without the primary coolant, which was drained from
the spiral plates and coolant rings in the edge-guard assemblies. Cooling was provided by water at 293 K flowing through jackets enclosing the spiral-fin plates and edge-guard coolant rings. The test material was a pair of calcium silicate specimens having a bulk density of 345 kg/m3 with a thermal conductivity of 0.076 W/(m∙K) and thickness of 25.69 mm. This mode of operation corresponds to the more complex model represented by Eq. (15) through Eq. (17). Under these conditions, the (dry) plates and rings provide additional thermal resistance and capacitance between the heater plate and water-cooled jacket, and between the edge-guard coolant rings and water jackets. The controller gain settings, i.e., κP and κD values, were derived beforehand by using the simulation model and apparatus properties along with an estimated specimen conductivity. It is important to note that the derived gain settings are specific to the above test conditions and specimen material and do not necessarily apply to other GHP apparatus or other test conditions.
Initially, the hot-plate assembly was at 410.65 K, the cold-plate assembly was at 385.65 K, and the edge-guard components were at 398.15 K. The response is for a hot-plate assembly set point of 435.65 K, cold-plate assembly set point of 410.65 K, and edge-guard assembly set point of 423.15 K. Figures 9–11 show the temperature response for the components of the apparatus initially at a nominal test temperature of 398.15 K, when the test temperature is suddenly increased to 423.15 K.
290
295
300
305
310
315
320
325
330
0 5 10 15 20
Tem
pera
ture
, K
Elapsed time, h
Inner edge guard, calculated
Inner edge guard, measured
Outer (auxiliary) edge guard, calculated
Outer (auxiliary) edge guard, measured
Edge guard bridge, calculated
Edge guard bridge, measured
Volume 123, Article No. 123001 (2018) https://doi.org/10.6028/jres.123.001
Journal of Research of the National Institute of Standards and Technology
21 https://doi.org/10.6028/jres.123.001
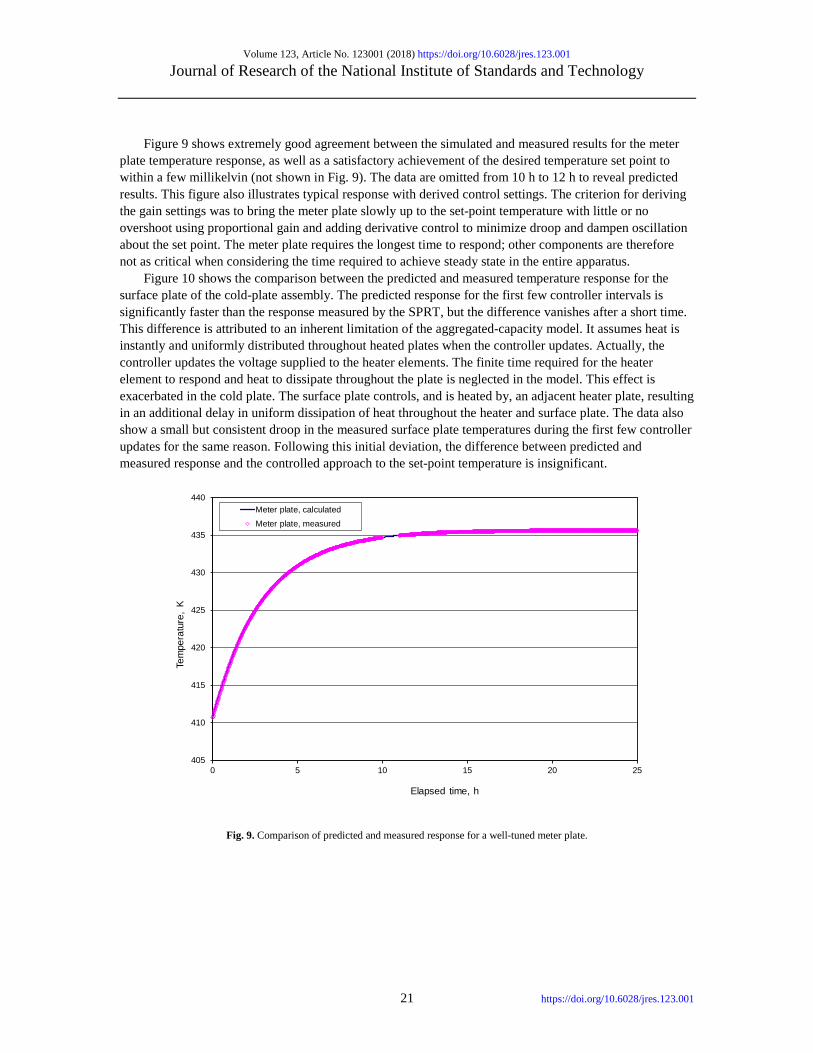
Figure 9 shows extremely good agreement between the simulated and measured results for the meter plate temperature response, as well as a satisfactory achievement of the desired temperature set point to within a few millikelvin (not shown in Fig. 9). The data are omitted from 10 h to 12 h to reveal predicted results. This figure also illustrates typical response with derived control settings. The criterion for deriving the gain settings was to bring the meter plate slowly up to the set-point temperature with little or no overshoot using proportional gain and adding derivative control to minimize droop and dampen oscillation about the set point. The meter plate requires the longest time to respond; other components are therefore not as critical when considering the time required to achieve steady state in the entire apparatus.
Figure 10 shows the comparison between the predicted and measured temperature response for the surface plate of the cold-plate assembly. The predicted response for the first few controller intervals is significantly faster than the response measured by the SPRT, but the difference vanishes after a short time. This difference is attributed to an inherent limitation of the aggregated-capacity model. It assumes heat is instantly and uniformly distributed throughout heated plates when the controller updates. Actually, the controller updates the voltage supplied to the heater elements. The finite time required for the heater element to respond and heat to dissipate throughout the plate is neglected in the model. This effect is exacerbated in the cold plate. The surface plate controls, and is heated by, an adjacent heater plate, resulting in an additional delay in uniform dissipation of heat throughout the heater and surface plate. The data also show a small but consistent droop in the measured surface plate temperatures during the first few controller updates for the same reason. Following this initial deviation, the difference between predicted and measured response and the controlled approach to the set-point temperature is insignificant.
Fig. 9. Comparison of predicted and measured response for a well-tuned meter plate.
405
410
415
420
425
430
435
440
0 5 10 15 20 25
Tem
pera
ture
, K
Elapsed time, h
Meter plate, calculatedMeter plate, measured

Volume 123, Article No. 123001 (2018) https://doi.org/10.6028/jres.123.001
Journal of Research of the National Institute of Standards and Technology
22 https://doi.org/10.6028/jres.123.001
Fig. 10. Temperature response comparison for the surface plate of the cold-plate assembly. Figure 11 shows effects of thermal stratification, which is a limitation associated with using the
aggregated-capacity simplification for the edge-guard subcomponents. The main and auxiliary subcomponents, shown in Fig. 3, are modeled as large horizontal tubes. The measurements in the upper plot are from a thermocouple along the top of the main zone of the assembly. The measurements in the bottom plot are from a thermocouple at the bottom zone. (Thermocouples 41 and 45 are not labeled in Fig. 3.) As expected, the predicted plot is between the two elevation extremes. (The test result show the same pattern for the opposite edge guard.) The difference between the measurements has a significant detrimental effect on controlling the heating element embedded in the auxiliary edge-guard zone. The single controlling thermocouple for the latter zone is located on the bottom outside and therefore may call for increasing the heat rate even though the main zone does not. Consequently, the auxiliary zone heater tends to override control of the main zone and can result in overheating the latter. The short-term solution, which was implemented in the present test, is to disable auxiliary zone heating. The strong thermal bridge between the auxiliary and main zones essentially maintains the former zone near its set-point temperature without the above-noted interference.
Based on the data in these figures and the results of other simulations, step two of the validation testing confirmed that the derived controller gain settings do indeed provide acceptable operation of the apparatus. The aggregated-capacity model captures the essential thermal dynamics of component interactions for deriving controller gain settings quickly and satisfactorily. Typically, simulation of a run that requires the apparatus several days to achieve steady conditions takes a few seconds using the model. Simulation models can be used to investigate the sensitivity to changes in operating conditions, such as mean higher and lower temperatures, specimen thermal conductivity and thickness, and coolant temperatures. Comparisons between predicted and measured results with coolant flow operation have been performed, and the results are similar. Simulations accurately derive suitable controller gain settings for the investigated insulation materials and test conditions.
380
385
390
395
400
405
410
415
0 5 10 15 20 25
Tem
pera
ture
, K
Elapsed time, h
Surface plate, calculated
Surface plate, measured

Volume 123, Article No. 123001 (2018) https://doi.org/10.6028/jres.123.001
Journal of Research of the National Institute of Standards and Technology
23 https://doi.org/10.6028/jres.123.001
Fig. 11. Comparison of predicted temperature response with measurements using thermocouples.
4. Conclusion
A mathematical simulation model for a GHP apparatus having extended temperature and gas pressure
capabilities has been developed. The model provides the thermal response characteristics for various component heating rates and ambient temperature and pressure conditions within the apparatus chamber from an arbitrary starting condition through steady-state operation. The predicted temperature responses for the plate components compared favorably with corresponding measurement data obtained during a test run. Predicted temperature responses for the edge guard were not fully satisfied due to the measured temperature differences in the edge guard. The temperature variations in the edge guard, however, have only a minor effect on the measured thermal conductivity. The aggregated-capacity analysis model is acceptable for capturing dynamic interactions between the various subcomponents. An actual test that takes days to run with the apparatus can be simulated in seconds with the model.
Diagnostic tests in which only one component is heated with a constant input are shown to provide useful information for assessing estimated thermal conductance parameters between components while minimizing the uncertainties associated with transient (thermal storage) effects. Comparisons between predicted and measured temperatures simulated for full-duration tests agree well and show satisfactory control for achieving desired set-point temperatures from arbitrary initial conditions.
Extensive simulations with the model have been used to derive controller gain settings that give satisfactory responses by the actual apparatus. Different versions of the simulation models, corresponding to different operating scenarios, are essential to derive the multiple controller gain settings quickly in comparison to previous trial-and-error operation of the apparatus. For the two-sided symmetrical configuration with coolant flows in the cold plates and edge guards, the corresponding simulation model consists of 12 equations (10 heated elements). For high-temperature, two-sided symmetrical operation, without primary coolant, the corresponding simulation model involves 15 equations (10 heated elements). The power supply controllers use incremental proportional-derivative (PD) control and thus require the determination of 10 proportional gain and 10 derivative gain settings.
390
395
400
405
410
415
420
425
430
0 5 10 15 20 25
Tem
pera
ture
, K
Elapsed time, h
Edge guard, calculatedEdge guard, measured upper elevation (thermocouple 41)Edge guard, measured lower elevation (thermocouple 45)

Volume 123, Article No. 123001 (2018) https://doi.org/10.6028/jres.123.001
Journal of Research of the National Institute of Standards and Technology
24 https://doi.org/10.6028/jres.123.001
5. References
[1] International Organization for Standardization (1991) ISO 8302:1991 Thermal insulation—Determination of Steady-State Thermal Resistance and Related Properties: Guarded Hot Plate Apparatus (International Organization for Standardization, Geneva, Switzerland). https://www.iso.org/standard/15422.html.
[2] ASTM International (2013) ASTM C177-13 Standard Test Method for Steady-State Heat Flux Measurements and Thermal Transmission Properties by Means of the Guarded-Hot-Plate Apparatus (ASTM International, West Conshohocken, Pennsylvania). https://www.astm.org/Standards/C177.htm.
[3] ASTM International (2013) ASTM C1045-07 Standard Practice for Calculating Thermal Transmission Properties Under Steady-State Conditions (ASTM International, West Conshohocken, Pennsylvania). https://www.astm.org/Standards/C1045.htm.
[4] Flynn DR (2005) Design of a 500 mm Guarded Hot Plate Apparatus for Measuring Thermal Transmission Properties of Insulations from 90 to 900 K: Phase II (National Institute of Standards and Technology, Gaithersburg, Maryland), NIST GCR 05-881.
[5] Flynn DR, Zarr RR, Hahn M-H, Healy WM (2002) Design concepts for a new guarded hot plate apparatus for use over an extended temperature range with controlled gas pressure or in vacuum. ASTM Fourth Symposium on Insulation Materials: Testing and Applications (ASTM International, West Conshohocken, Pennsylvania), pp. 98–115. https://www.nist.gov/publications/design-concepts-new-guarded-hot-plate-apparatus-use-over-extended-temperature-range.
[6] Healy WM, Flynn, DR (2002) Thermal modeling of multiple-line-heat source guarded hot plate apparatus. ASTM Fourth Symposium on Insulation Materials: Testing and Applications (ASTM International, West Conshohocken, Pennsylvania), pp. 79–97. https://www.nist.gov/publications/thermal-modeling-multiple-line-heat-source-guarded-hot-plate-apparatus.
[7] Thomas WC, Zarr RR (2011) Thermal response simulation for tuning PID controllers in a 1016 mm guarded hot plate apparatus. ISA Transactions 50(3):504–520. https://doi.org/10.1016/j.isatra.2011.02.001.
[8] Stoecker WF, Stoecker PA (1988) Microcomputer Control of Thermal and Mechanical Systems (Van Nostrand Reinhold, New York), pp. 317–429. https://doi.org/10.1007/978-1-4684-6560-0.
[9] Incropera FP, DeWitt DP (1996) Fundamentals of Heat and Mass Transfer (John Wiley and Sons, New York), 4th Ed. [10] ASHRAE (2005) Handbook of Fundamentals (American Society of Heating, Refrigerating, and Air-Conditioning Engineers,
Inc., Atlanta, Georgia). About the authors: William Thomas is Professor Emeritus of Mechanical Engineering, Virginia Polytechnic Institute and State University. Robert Zarr is a mechanical engineer in the Energy and Environment Division of the NIST Engineering Laboratory. The National Institute of Standards and Technology is an agency of the U.S. Department of Commerce.


![[MS-IPHTTPS]: IP over HTTPS (IP-HTTPS) Tunneling Protocol€¦ · IP over HTTPS (IP-HTTPS) Tunneling Protocol Intellectual Property Rights Notice for Open Specifications Documentation](https://static.fdocuments.in/doc/165x107/5f5d18b22a82be0e3640e86d/ms-iphttps-ip-over-https-ip-https-tunneling-protocol-ip-over-https-ip-https.jpg)