Transient Kinetics of Electron Transfer Reactions of ... · crystallography, it is highly...
10
6366 Biochemistry 1982, 21, 6366-6375 Transient Kinetics of Electron Transfer Reactions of Flavodoxin: Ionic Strength Dependence of Semiquinone Oxidation by Cytochrome c, Ferricyanide, and Ferric Ethylenediaminetetraacetic Acid and Computer Modeling of Reaction Complexest Royce P. Simondsen, Patricia C. Weber,t F. R. Salemme,* and Gordon Tollin* ABSTRACT: Electron transfer reactions between Clostridum pasteurianum flavodoxin semiquinone and various oxidants [horse heart cytochrome c, ferricyanide, and ferric ethylene- diaminetetraacetic acid (EDTA)] have been studied as a function of ionic strength by using stopped-flow spectropho- tometry. The cytochrome c reaction is complicated by the existence of two cytochrome species which react at different rates and whose relative concentrations are ionic strength dependent. Only the faster of these two reactions is considered here. At low ionic strength, complex formation between cy- tochrome c and flavodoxin is indicated by a leveling off of the pseudo-first-order rate constant at high cytochrome c con- centration. This is not observed for either ferricyanide or ferric EDTA. For cytochrome c, the rate and association constants for complex formation were found to increase with decreasing %e dependence of a rate constant upon ionic strength can yield valuable information about electrostatic interactions which occur between reactants which are electrically charged. In the present study, we have determined the ionic strength dependence of the electron transfer reactions of flavodoxin semiquinone with oxidized cytochrome c, ferricyanide, and ferric ethylenediaminetetraacetic acid (EDTA). Although flavodoxin and cytochrome c are not natural physiological partners, a major advantage of investigating this reaction is that the structures of both classes of proteins are known (Burnett et al., 1974; Smith et al., 1977; Swanson et al., 1977). Thus, experimental and theoretical results can be evaluated in terms of this structural information. Although the particular flavodoxin used in this work has not been studied by X-ray crystallography, it is highly homologous in critical structural regions to the clostridial flavodoxin whose structure is known (Dubourdieu & Fox, 1977), and great similarities are found among the various flavodoxins which have been investigated (Mayhew & Ludwig, 1975; Simondsen & Tollin, 1980). This will be considered in more detail below. Flavodoxin is a highly acidic protein (Simondsen & Tollin, 1980), and cytochrome c is highly basic (Margoliash & Schejter, 1966). The struc- tural studies have shown a region of uncompensated negatively charged carboxyl groups in the vicinity of the flavin mono- nucleotide (FMN) prosthetic group of flavodoxin (Mayhew ' From the Departments of Biochemistry and Chemistry, University of Arizona, Tucson, Arizona 85721. Received January 5, 1982; revised manuscript received September 1,1982. Supported in part by Research Grants AM 15057 (to G.T.) and GM 21534 and GM 25664 (to F.R.S.) from the National Institutes of Health. Computations were partially supported by the University of Arizona Computer Center. Software exchange and hardware maintenance for the MMSX computer graphics systems were supported by National Institutes of Health Grant RR 00936. 4 Present address: Department of Molecular Biophysics and Bio- chemistry, Yale University, New Haven, CT 06511. 0006-2960/82/042 1 -6366$01.25/0 ionic strength, consistent with negative charges on flavodoxin interacting with the positively charged cytochrome electron transfer site. Both ferricyanide and ferric EDTA are nega- tively charged oxidants, and the rate data respond to ionic strength changes as would be predicted for reactants of the same charge sign. These results demonstrate that electrostatic interactions involving negatively charged groups are important in orienting flavodoxin with respect to oxidants during electron transfer. We have also carried out computer modeling studies of putative complexes of flavodoxin with cytochrome c and ferricyanide, which relate their structural properties to both the observed kinetic behavior and some more general features of physiological electron transfer processes. The results of this study are consistent with the ionic strength behavior described above. & Ludwig, 1975) and a number of positively charged lysines distributed around the heme edge of cytochrome c (Salemme, 1976). Such residues are likely candidates for involvement in formation of salt links, if electrostatic interactions are im- portant in the orientation of these redox proteins for electron transfer. The participation of lysines has, in fact, been pro- posed for a number of other cytochrome c electron transfer reactions [cf. Salemme (1977) and references contained therein], and a variety of experimental studies have provided support for this [cf., for example, Speck et al. (1981) and Smith et al. (1981) and references cited therein]. So as to provide a comparison with the protein-protein system, we have also investigated the oxidation of flavodoxin semiquinone by the two smaller nonprotein reagents, ferricyanide and ferric EDTA. Previous kinetic studies (Jung & Tollin, 1981) of the oxi- dation of flavodoxin semiquinone by either cytochrome c or ferricyanide suggest that electron transfer occurs via an outer-sphere mechanism (Marcus, 1964), involving the sol- vent-exposed portion of the flavin coenzyme. This, in turn, implies that the reacting prosthetic groups are near or within van der Waals contact during the electron transfer event. As well be documented below, the observed flavodoxin reaction rates depend strongly on ionic strength, which is consistent with the importance of electrostatic interactions in the sta- bilization of the intermolecular electron transfer complex. Similar effects have been observed for the reactions of a variety of other electron transfer proteins with both protein [e.g., see Foust et al. (1969) and Smith et al. (1981)l and inorganic redox partners [e.g., see Wherland & Gray (1976) and Cu- sanovich (1978)l. In the case of redox reactions between proteins and inorganic ions, a generalized electrostatic effect is postulated in which the approach of the reacting ion is influenced by charged amino acid side chains situated near the protein's prosthetic group. Similarly, the ionic strength 0 1982 American Chemical Society
Transcript of Transient Kinetics of Electron Transfer Reactions of ... · crystallography, it is highly...

6366 Biochemistry 1982, 21, 6366-6375
Transient Kinetics of Electron Transfer Reactions of Flavodoxin: Ionic Strength Dependence of Semiquinone Oxidation by Cytochrome c, Ferricyanide, and Ferric Ethylenediaminetetraacetic Acid and Computer Modeling of Reaction Complexest
Royce P. Simondsen, Patricia C . Weber,t F. R. Salemme,* and Gordon Tollin*
ABSTRACT: Electron transfer reactions between Clostridum pasteurianum flavodoxin semiquinone and various oxidants [horse heart cytochrome c, ferricyanide, and ferric ethylene- diaminetetraacetic acid (EDTA)] have been studied as a function of ionic strength by using stopped-flow spectropho- tometry. The cytochrome c reaction is complicated by the existence of two cytochrome species which react at different rates and whose relative concentrations are ionic strength dependent. Only the faster of these two reactions is considered here. At low ionic strength, complex formation between cy- tochrome c and flavodoxin is indicated by a leveling off of the pseudo-first-order rate constant at high cytochrome c con- centration. This is not observed for either ferricyanide or ferric EDTA. For cytochrome c, the rate and association constants for complex formation were found to increase with decreasing
%e dependence of a rate constant upon ionic strength can yield valuable information about electrostatic interactions which occur between reactants which are electrically charged. In the present study, we have determined the ionic strength dependence of the electron transfer reactions of flavodoxin semiquinone with oxidized cytochrome c, ferricyanide, and ferric ethylenediaminetetraacetic acid (EDTA). Although flavodoxin and cytochrome c are not natural physiological partners, a major advantage of investigating this reaction is that the structures of both classes of proteins are known (Burnett et al., 1974; Smith et al., 1977; Swanson et al., 1977). Thus, experimental and theoretical results can be evaluated in terms of this structural information. Although the particular flavodoxin used in this work has not been studied by X-ray crystallography, it is highly homologous in critical structural regions to the clostridial flavodoxin whose structure is known (Dubourdieu & Fox, 1977), and great similarities are found among the various flavodoxins which have been investigated (Mayhew & Ludwig, 1975; Simondsen & Tollin, 1980). This will be considered in more detail below. Flavodoxin is a highly acidic protein (Simondsen & Tollin, 1980), and cytochrome c is highly basic (Margoliash & Schejter, 1966). The struc- tural studies have shown a region of uncompensated negatively charged carboxyl groups in the vicinity of the flavin mono- nucleotide (FMN) prosthetic group of flavodoxin (Mayhew
' From the Departments of Biochemistry and Chemistry, University of Arizona, Tucson, Arizona 85721. Received January 5, 1982; revised manuscript received September 1,1982. Supported in part by Research Grants AM 15057 (to G.T.) and GM 21534 and GM 25664 (to F.R.S.) from the National Institutes of Health. Computations were partially supported by the University of Arizona Computer Center. Software exchange and hardware maintenance for the MMSX computer graphics systems were supported by National Institutes of Health Grant RR 00936.
4 Present address: Department of Molecular Biophysics and Bio- chemistry, Yale University, New Haven, CT 06511.
0006-2960/82/042 1 -6366$01.25/0
ionic strength, consistent with negative charges on flavodoxin interacting with the positively charged cytochrome electron transfer site. Both ferricyanide and ferric EDTA are nega- tively charged oxidants, and the rate data respond to ionic strength changes as would be predicted for reactants of the same charge sign. These results demonstrate that electrostatic interactions involving negatively charged groups are important in orienting flavodoxin with respect to oxidants during electron transfer. We have also carried out computer modeling studies of putative complexes of flavodoxin with cytochrome c and ferricyanide, which relate their structural properties to both the observed kinetic behavior and some more general features of physiological electron transfer processes. The results of this study are consistent with the ionic strength behavior described above.
& Ludwig, 1975) and a number of positively charged lysines distributed around the heme edge of cytochrome c (Salemme, 1976). Such residues are likely candidates for involvement in formation of salt links, if electrostatic interactions are im- portant in the orientation of these redox proteins for electron transfer. The participation of lysines has, in fact, been pro- posed for a number of other cytochrome c electron transfer reactions [cf. Salemme (1977) and references contained therein], and a variety of experimental studies have provided support for this [cf., for example, Speck et al. (1981) and Smith et al. (1981) and references cited therein]. So as to provide a comparison with the protein-protein system, we have also investigated the oxidation of flavodoxin semiquinone by the two smaller nonprotein reagents, ferricyanide and ferric EDTA.
Previous kinetic studies (Jung & Tollin, 1981) of the oxi- dation of flavodoxin semiquinone by either cytochrome c or ferricyanide suggest that electron transfer occurs via an outer-sphere mechanism (Marcus, 1964), involving the sol- vent-exposed portion of the flavin coenzyme. This, in turn, implies that the reacting prosthetic groups are near or within van der Waals contact during the electron transfer event. As well be documented below, the observed flavodoxin reaction rates depend strongly on ionic strength, which is consistent with the importance of electrostatic interactions in the sta- bilization of the intermolecular electron transfer complex. Similar effects have been observed for the reactions of a variety of other electron transfer proteins with both protein [e.g., see Foust et al. (1969) and Smith et al. (1981)l and inorganic redox partners [e.g., see Wherland & Gray (1976) and Cu- sanovich (1978)l. In the case of redox reactions between proteins and inorganic ions, a generalized electrostatic effect is postulated in which the approach of the reacting ion is influenced by charged amino acid side chains situated near the protein's prosthetic group. Similarly, the ionic strength
0 1982 American Chemical Society

E L E C T R O S T A T I C S O F F L A V O D O X I N E L E C T R O N T R A N S F E R V O L . 2 1 , N O . 2 5 , 1 9 8 2 6367
dependence of electron transfer between proteins has been related to the surface charge environments in the vicinity of the interacting prosthetic groups.
Because of the lack of X-ray crystallographic data on protein electron transfer complexes, investigations of their structural properties have been pursued which utilize computer graphical approaches to model potential interaction patterns. By uti- lization of structural coordinates derived from X-ray studies on isolated electron transfer proteins, hypothetical structures have been generated for electron transfer complexes of cyto- chrome c-cytochrome b5 (Salemme, 1976) and cytochrome c-cytochrome c peroxidase (Poulos & Kraut, 1980). These studies have been of use in establishing some fundamental features of interacting redox proteins and have proved subject to test by a variety of chemical modification studies (Ng et al., 1977, Speck et al., 1979).
The present work utilizes computer graphics to investigate possible electron transfer complexes between flavodoxin and either ferricyanide or eukaryotic cytochrome c. The structural properties of the complexes obtained are related to the observed kinetic behavior and suggest an alternative mathematical formulation for the treatment of ionic strength effects.
A preliminary report of this work was presented at the Seventh International Symposium on Flavins and Flavoproteins (Simondsen & Tollin, 1982).
Experimental Procedures
Materials Clostridium pasteurianum flavodoxin was isolated and
purified according to published procedures (Mayhew, 1971). Horse heart cytochrome c (type VI) was purchased from Sigma Chemical Co. and used without further purification. Potassium ferricyanide was AR grade purchased from Mal- linckrodt Chemical and used without further purification. Ferric EDTA was synthesized by using Fe(N03)3-9H20 and Na2H,EDTA.2H20 (Sawyer & McKinnie, 1960).
Methods The experiments were carried out in 0.005 M potassium
phosphate buffer, pH 7.2. The temperature was 23.5 OC. The concentrations of flavodoxin, EDTA, and deazariboflavin were 4.71 X lo”, 8.52 X lo4, and 2.46 X 10” M, respectively. Deazariboflavin and EDTA were used to photochemically generate flavodoxin semiquinone (Massey & Hemmerich, 1978). Samples were degassed for 1 h and then transferred to the stopped-flow spectrophotometer where they were irra- diated with white light for 15 min. This served to produce the semiquinone and to remove any residual oxygen. The reactions were observed at 580 nm, a wavelength which allows the disappearance of flavodoxin semiquinone to be followed. Ionic strength was varied by addition of appropriate amounts of NaCl. The stopped-flow apparatus has been described previously ( J u g & Tollin, 1981).
The calculation of the Marcus and Debye-Hiickel param- eters was performed with a computer by using an iterative program which minimized the least-squares errors for the observed second-order rate constants. The program was adapted from one developed by Dr. Michael Cusanovich.
Computer Graphics. Coordinates for the ferricyanide ion were derived from X-ray crystallographic data on structurally related compounds (Wilford et al., 1968). Although the rate of electron transfer between flavodoxin and cytochrome c has been studied by using C. pasteurianum flavodoxin and horse heart cytochrome c, computer graphics experiments were carried out by using coordinates derived from two closely related molecules, C. MP flavodoxin (Smith et al., 1977) and
tuna cytochrome c (Swanson et al., 1977), whose coordinates were obtained from the Brookhaven Protein Data Bank (Bernstein et al., 1977). The tertiary structures of the cyto- chromes c from tuna and horse heart are quite similar (Tim- kovich & Dickerson, 1976; Swanson et al., 1977; Salemme, 1977). The 104-residue horse heart cytochrome c contains one more amino acid than tuna cytochrome c, and although amino acid sequences of these proteins differ in 18 other positions, most involve conservative substitutions (Dayhoff, 1976). Greater sequence diversity exists between the flavo- doxin molecules from C. MP and C. pasteurianum (Du- bourdieu & Fox, 1977). Nevertheless, given the similarity in overall tertiary structure exhibited by various flavodoxin molecules (Watenpaugh et al., 1973; Smith et al., 1977), substitution of C. MP for C. pasteurianum flavodoxin appears justified in the absence of structural information for the latter protein. Furthermore, as will be described below, negatively charged residues close to the flavin binding site are conserved.
The prosthetic group exposure was estimated from static accessibility calculations carried out by J. Rupley (Shrake & Rupley, 1973) in order to determine which prosthetic group atoms might potentially be involved in an outer-sphere electron transfer reaction during complex formation. These calculations showed, respectively, that atoms at the dimethylbenzene end of the flavin in flavodoxin and at one edge of the porphyrin ring in cytochrome c were partially exposed to solvent. Jung & Tollin (1981) have provided evidence for the participation of the dimethylbenzene ring of flavin in the redox reactions of C. pasteurianum flavodoxin.
Possible interactions between redox partners were examined by using an MMSX computer graphics system (Barry et al., 1974). Individual molecules were initially represented as covalently bonded skeletal structures which could be simul- taneously displayed on the viewing screen and independently translated and rotated. The objective in fitting the molecules together was to minimize the interaction distance between the exposed atoms of the respective prosthetic groups, subject to (1) the absence of unfavorable steric interactions among atoms at the intermolecular interface and (2) the optimization of possible intermolecular charge pairs. Steric interactions were checked both by computations of interatomic distances and by visual inspection of van der Waals surfaces corresponding to all atoms situated at the molecular interface. At later stages of the fitting procedure, it became apparent that some im- provement in intermolecular charge pairing could be achieved by allowing some small conformational alterations in the crystallographically observed positions of the lysine residues in cytochrome c, and the acidic side chains in flavodoxin. These alterations are physically reasonable, insofar as the side chains involved are located on the molecular surface and so are sterically unconstrained in solution. Optimal comple- mentary charge-pair interactions were assumed to correspond to a heteroatom separation (e.g., carboxylic acid oxygen to lysine terminal nitrogen) of 3.0 A. Animation of side chains and calculation of atomic positions in the electron transfer complex were accomplished by using computer software de- veloped by P. H. Bethge (Lederer et al., 1981).
Results and Discussion Stopped-Flow Experiments. When flavodoxin semiquinone
and cytochrome c are mixed in the stopped-flow apparatus, a net absorbance decrease is observed at 580 nm due to electron transfer from the former to the latter which results in semiquinone oxidation. Under the concentration conditions used (excess cytochrome c), the reaction follows pseudo- first-order kinetics. Some representative plots of log As vs.

6368 B I O C H E M I S T R Y
60
S I M O N D S E N E T A L .
100 lsli 1 !
TIME (msec) FIGURE 1: Semilog plots of transient absorbance changes at 580 nm obtained at 23.5 OC upon stopped-flow mixing of C. pasteurianum flavodoxin semiquinone (4.71 X 10⁻⁶ M before mixing) and horse heart cytochrome c at various concentrations under anaerobic conditions in 0.005 M phosphate buffer, pH 7.2, and Z = 0.058 M. Absorbance decrease due to oxidation of flavodoxin semiquinone. (X) 3.75 X IO" M; (A) 7.84 X IO" M; (0) 1.18 X M; (0) 2.59 X M. The data shown are for the fast phase of the reaction obtained as described in the text.
time at various cytochrome c concentrations are shown in Figure 1. In general, the plots were linear over at least 3 half-times. Similar results were obtained with ferricyanide or ferric EDTA as oxidants. From data such as these, it is possible to determine a relationship between kobd (obtained from the slopes of plots such as those in Figure 1) and cyto- chrome c concentration, as a function of ionic strength. However, the reaction of oxidized cytochrome c with flavo- doxin semiquinone is complicated by the fact that two rate processes are observed, one fast and one slow. Similar biphasic kinetics have been found for ascorbate (Goldkorn & Schejter, 1977a) and dithionite (Goldkorn & Schejter, 1977b) reduc- tions of cytochrome c. This phenomenon has been ascribed to an ionic strength dependent altered conformation of the cytochrome c which reacts more slowly than does the native conformation. As in the earlier work, we found that the proportion of the slow component increased with decreasing ionic strength. All rate data were corrected for this process in the following way. At each of the relevant ionic strengths and for each cytochrome c concentration, the rate data were collected on both rapid and slow time scales on which the observed changes in absorption would be due to only one of the two forms of the cytochrome. The percentage of cyto- chrome c in the native conformation was calculated from such data and used to determine the effective concentration of native cytochrome c which participated in the initial fast reaction. These values were then used in rate constant calculations. As expected, biphasic kinetics were not observed for the ferri-
4ot I
oIv ; ;o 15 ;o 215 $0 $5 40 45 20
[cytochrome c ] x 10' M
FIGURE 2: Dependence of /cow on cytochrome c concentration. Rate constants obtained from semilog plots such as shown in Figure 1. Conditions as in Figure 1 with ionic strength changed by the ap- propriate addition of a sodium chloride solution. (X) Z1/* = 0.220; (@) Z'/* = 0.240; (0 Z'/* = 0.255; (A) 1'/* = 0.275; (0) =
text for details). 0.312. Curves for Z'/ 1 5 0.275 represent computer fits to data (see
6 -
2
2 0 4 0 60 8 0 100 120 140 160 2 0 4 0 60 8 0 100 120 140 160 180 1 18 0
[ Fe (CN):.] x IO'M
FIGURE 3: Dependence of kobd on ferricyanide concentration. Rate constants obtained from semilog plots such as shown in Figure 1. Conditions as in Figure 1 with ionic strength changed by the ap- propriate addition of a sodium chloride solution. (Slashed circle) Z'/' = 0.150; (0) 1"' = 0.180; (X) Z'/' = 0.224; (0) 11/2 = 0.251; (A) Z1/' = 0.283; (A) 1'1' = 0.316.
cyanide or ferric EDTA reactions with flavodoxin semiquinone, thus confirming that ionic strength was affecting cytochrome c rather than flavodoxin.
At low ionic strength, kow (the apparent pseudo-first-order rate constant for the fast reaction) shows a saturation effect with respect to cytochrome c concentration (Figure 2). This has also been shown to occur for the dichloroflavin mono- nucleotide analogue bound to apoflavodoxin (Jung & Tollin, 1981) at high ionic strength, but not previously for the native flavodoxin. This behavior is evidence for complex formation between cytochrome c and flavcdoxin.' As in the earlier study
I It is also possible that saturation effects can be a consequence of reaching a diffusion-limited rate, rather than of a change in the rate- limiting step resulting from complex formation. This is considered un- likely in the present case for two reasons: Saturation effects have been previously observed (Jung & Tollin, 1981) for the dichloroflavin mono- nucleotide-flavodoxin with all three oxidants for which the limiting kabd values ranged over 3 orders of magnitude; with native flavodoxin and cytochrome c, saturation is not observed at high ionic strength, under which conditions the diffusion limit should be smaller because of elec- trostatic screening of opposite charges (see below) and thus more easily reached.

E L E C T R O S T A T I C S O F F L A V O D O X I N E L E C T R O N T R A N S F E R V O L . 2 1 , N O . 2 5 , 1 9 8 2 6369
(Jung & Tollin, 1981), saturation is not observed at higher ionic strengths or for the ferricyanide or ferric EDTA reactions at any ionic strength (Figure 3) .
The simplest kinetic mechanism for the electron transfer reaction which includes a complex-formation step is as follows [cf. Jung & Tollin (1981)l:
k kl
k-1 FldH- + cyt cox complex - Fld,, + cyt crd (1)
Because of the large redox potential difference between fla- vodoxin and cytochrome c, the reverse reaction (k-2) is ne- glected.
When the steady-state approximation is applied to this mechanism, the following relationship for koW is found:
kobsd = kIkZ(cyt c)/[kl(cyt c) + k-1 + k21 (2)
At low (cyt c), kobsd = klk2(cyt c)/(k-, + k2), and
kobsd/(CYt C) = kikz/(k-i -t- k2) 5 ki (3)
In eq 3, the equal sign applies when k2 >> k-l. The absence of saturation effects for some of the cytochrome c data (e.g., Figure 2) implies that under these conditions k2 >> kl(cyt c) + k-, for the above mechanism and koM = k,(cyt c). A value for kl may thus be obtained by dividing koW by (cyt c). If k2 << kl(cyt c) + k-,, then saturation behavior will be observed (e.g., Figure 2). Equation 2, under these conditions, becomes
(4)
When saturation behavior is observed, a minimum value for kl is all that can be obtained from the experimental data. Such a value can be calculated in the following two ways: from the initial slopes of plots of kobd vs. (cyt c), i.e., Figure 2, and by using a computer to fit the koW vs. (cyt c) data according to the mechanism of eq 1 [cf. Ahmad et al. (1982)l. The latter procedure involves treating the mechanism as two consecutive first-order reactions (since all reactions were conducted under pseudo-first-order conditions) and programming an explicit mathematical solution of the rate equations (Frost & Pearson, 1961) into the computer. We restricted possible solutions with the constraint that they be 90% or greater monophasic (which corresponds to our experimental observations, e.g., Figure 1). The program used a steepest descents procedure to obtain a minimum least-squares error in fitting the experimental data. It was found that K, (k , /k_ , ) and k2 could be determined directly. However, for k , , we could only specify a minimum value, with any value larger than this giving identical fits within experimental error (with K, constant).
Both the graph and computer procedures yielded closely equivalent results. We report only the computer-derived values, inasmuch as these are probably more reliable.
Table I lists the calculated association constants and rate constants obtained as described for all of the reactions in- vestigated here.
Besides the mechanism described in eq 1, mechanisms in- volving a nonproductive dead-end complex or an activated form of flavodoxin also yield the same rate equations. The latter mechanism is considered unlikely since saturation behavior is not observed for the oxidation of flavodoxin semiquinone by either ferricyanide or ferric EDTA. However, the present data do not allow a distinction to be made between the mechanism of eq 1 and that involving a dead-end complex. Since both mechanisms do involve complex formation, the conclusions to be drawn below would be valid in either case inasmuch as we are not considering the electron transfer step at this time. In the case of the inorganic oxidants, we cannot determine whether or not an encounter complex has a long
k b s d = klk2(cyt c)/[kl(cyt c, + k-ll
Table I: Rate Constants and Association Constants for Flavodoxin Semiquinone Oxidation by Various Oxidantsa
Horse Heart Cytochrome c 0.220 4.3 x 10⁷ 85 8.0 x 10⁵ 0.240 1.6 x 10⁷ 82 2.7 x 10⁵ 0.255 1.3 X 10' 78 2.1 x 10⁵ 0.275 8.2 X lo6 66 1.8 x 10⁵ 0.300 1.9 x 10⁶ 0.312 1.6 X lo6 0.319 1.5 X lo6 0.355 6.7 x 10⁵ 0.390 3.0 x 10⁵ 0.426 1.3 x 10⁵
0.180 3.6 x 10⁴ 0.224 5.5 x 10⁴ 0.25 1 9.0 x 10⁴ 0.283 1.2 x 1 0 5 0.316 1.8 x 10⁵
Ferricyanide 0.150 2.4 X lo4
Ferric EDTA 0.283 7.6 0.531 15.4
Estimated error is *lo%. lower limits to k, determined by computer analysis (see text for details).
a Data obtained at 23.5 "C in 0.005 M phosphate buffer, pH 7.2. Values for 1'" < 0.275 represent
enough lifetime to be considered a true intermediate in the reaction.
The calculated K, for the association between flavodoxin and Cytochrome c at the lowest ionic strength investigated was 8.0 X lo5 M-' and decreased to 1.8 X lo5 M-' at an ionic strength of 0.076 M (Table I), above which value of ionic strength the saturation effect was not observed. Complex formation thus is strongest at low ionic strength where elec- trostatic interactions would be expected to be most important. Since the K, value was diminished by increasing the ionic strength, complex formation can be ascribed to such charged group interactions. At the higher ionic strengths, the lowered K, precluded any observation of saturation effects in the kinetic data, although it seems reasonable to expect that complex formation was still occurring along the reaction pathway.
Table I also lists values for the limiting first-order rate constant k2. A small ionic strength dependence is found for this rate constant. These values of k2 are significantly smaller than the previous estimate by Jung & Tollin (1 98 1) at high ionic strength (Z1/2 = 0.483) for the flavodoxin-cytochrome c reaction (>250 s-l). This difference may be partly attrib- utable to the different pH (7.5 vs. 7.2) used in the two sets of experiments. However, there may also be a change in the physicochemical processes which determine k2. Thus, at the lower ionic strengths used here, the initial complex which is formed may not be oriented properly for electron transfer due to improper pairing of the charged groups. In this situation, kz may reflect the rate of attainment of a productive orien- tation within the complex which allows reaction to occur. This could be the cause of the small ionic strength dependence observed here. At high ionic strengths, the electrostatic in- teractions are diminished, and the proper orientation may be more easily and rapidly achieved before a nonproductive complex can be formed, thus causing the actual electron transfer to be rate limiting. These suggestions require further investigation.
The calculated second-order rate constants have been plotted vs. Z1/2 for the flavodoxin-cytochrome c reacton (Figure 4).
6370 B I O C H E M I S T R Y S I M O N D S E N E T A L .
/ ' I \
x
x I I I I 1 I
lo'' 012 0.3 0 A 0.5 Jr
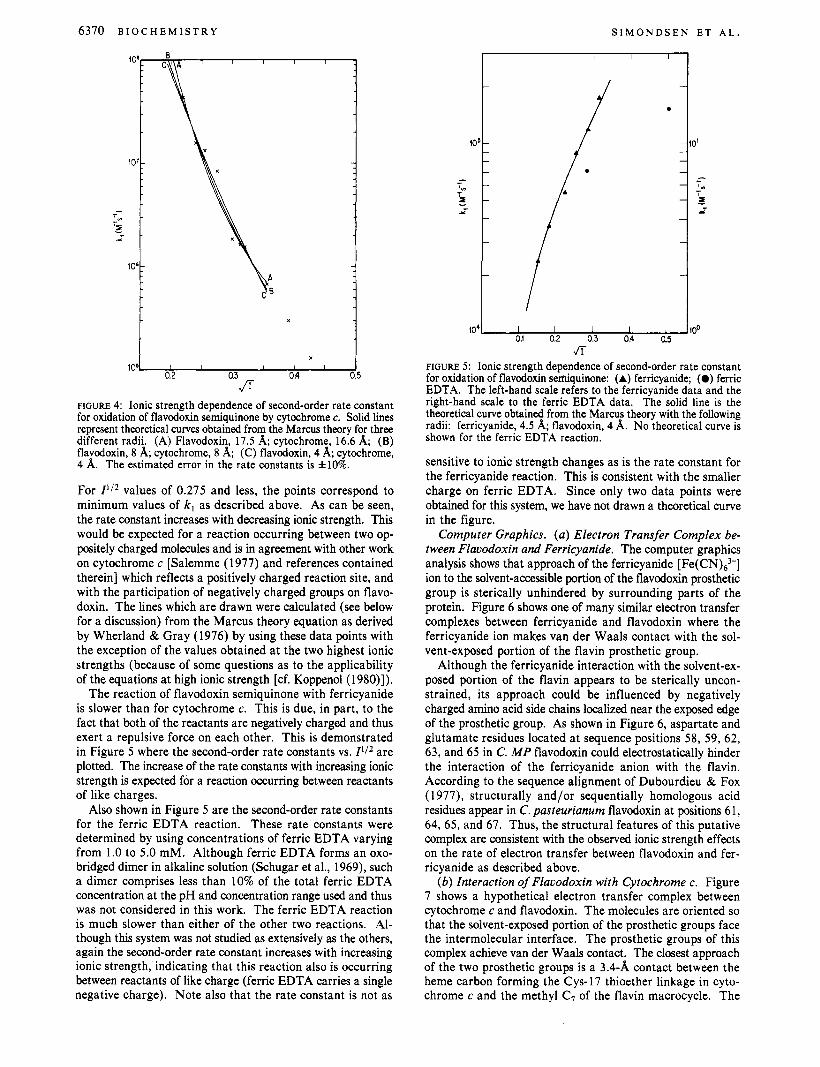
FIGURE 4: Ionic strength dependence of second-order rate constant for oxidation of flavodoxin semiquinone by cytochrome c. Solid lines represent theoretical curves obtained from the Marcus theory for three different radii. (A) Flavodoxin, 17.5 A; cytochrome, 16.6 A; (B) flavodoxin, 8 A; cytochrome, 8 A; (C) flavodoxin, 4 A; cytochrome, 4 A. The estimated error in the rate constants is &lo%.
For I * / * values of 0.275 and less, the points correspond to minimum values of k, as described above. As can be seen, the rate constant increases with decreasing ionic strength. This would be expected for a reaction occurring between two op- positely charged molecules and is in agreement with other work on cytochrome c [Salemme (1977) and references contained therein] which reflects a positively charged reaction site, and with the participation of negatively charged groups on flavo- doxin. The lines which are drawn were calculated (see below for a discussion) from the Marcus theory equation as derived by Wherland & Gray (1976) by using these data points with the exception of the values obtained at the two highest ionic strengths (because of some questions as to the applicability of the equations at high ionic strength [cf. Koppenol (1980)l).
The reaction of flavodoxin semiquinone with ferricyanide is slower than for cytochrome c. This is due, in part, to the fact that both of the reactants are negatively charged and thus exert a repulsive force on each other. This is demonstrated in Figure 5 where the second-order rate constants vs. I l l2 are plotted. The increase of the rate constants with increasing ionic strength is expected for a reaction occurring between reactants of like charges.
Also shown in Figure 5 are the second-order rate constants for the ferric EDTA reaction. These rate constants were determined by using concentrations of ferric EDTA varying from 1.0 to 5.0 mM. Although ferric EDTA forms an oxo- bridged dimer in alkaline solution (Schugar et al., 1969), such a dimer comprises less than 10% of the total ferric EDTA concentration at the pH and concentration range used and thus was not considered in this work. The ferric EDTA reaction is much slower than either of the other two reactions. Al- though this system was not studied as extensively as the others, again the second-order rate constant increases with increasing ionic strength, indicating that this reaction also is occurring between reactants of like charge (ferric EDTA carries a single negative charge). Note also that the rate constant is not as
0.1 0.2 0.3 0.4 0.5 JT
FIGURE 5: Ionic strength dependence of second-order rate constant for oxidation of flavodoxin semiquinone: (A) ferricyanide; (0) ferric EDTA. The left-hand scale refers to the ferricyanide data and the right-hand scale to the ferric EDTA data. The solid line is the theoretical curve obtained from the Marcus theory with the following radii: ferricyanide, 4.5 A; flavodoxin, 4 A. No theoretical curve is shown for the ferric EDTA reaction.
sensitive to ionic strength changes as is the rate constant for the ferricyanide reaction. This is consistent with the smaller charge on ferric EDTA. Since only two data points were obtained for this system, we have not drawn a theoretical curve in the figure.
Computer Graphics. ( a ) Electron Transfer Complex be- tween Flauodoxin and Ferricyanide. The computer graphics analysis shows that approach of the ferricyanide [Fe(CN),3-] ion to the solvent-accessible portion of the flavodoxin prosthetic group is sterically unhindered by surrounding parts of the protein. Figure 6 shows one of many similar electron transfer complexes between ferricyanide and flavodoxin where the ferricyanide ion makes van der Waals contact with the sol- vent-exposed portion of the flavin prosthetic group.
Although the ferricyanide interaction with the solvent-ex- posed portion of the flavin appears to be sterically uncon- strained, its approach could be influenced by negatively charged amino acid side chains localized near the exposed edge of the prosthetic group. As shown in Figure 6, aspartate and glutamate residues located at sequence positions 58, 59, 62, 63, and 65 in C. MP flavodoxin could electrostatically hinder the interaction of the ferricyanide anion with the flavin. According to the sequence alignment of Dubourdieu & Fox ( 1 977), structurally and/or sequentially homologous acid residues appear in C. pasteurianum flavodoxin at positions 61, 64, 65, and 67. Thus, the structural features of this putative complex are consistent with the observed ionic strength effects on the rate of electron transfer between flavodoxin and fer- ricyanide as described above.
( b ) Interaction of Flauodoxin with Cytochrome c. Figure 7 shows a hypothetical electron transfer complex between cytochrome c and flavodoxin. The molecules are oriented so that the solvent-exposed portion of the prosthetic groups face the intermolecular interface. The prosthetic groups of this complex achieve van der Waals contact. The closest approach of the two prosthetic groups is a 3.4-A contact between the heme carbon forming the Cys-17 thioether linkage in cyto- chrome c and the methyl C7 of the flavin macrocycle. The
E L E C T R O S T A T I C S O F F L A V O D O X I N E L E C T R O N T R A N S F E R V O L . 2 1 , N O . 2 5 , 1 9 8 2 6371
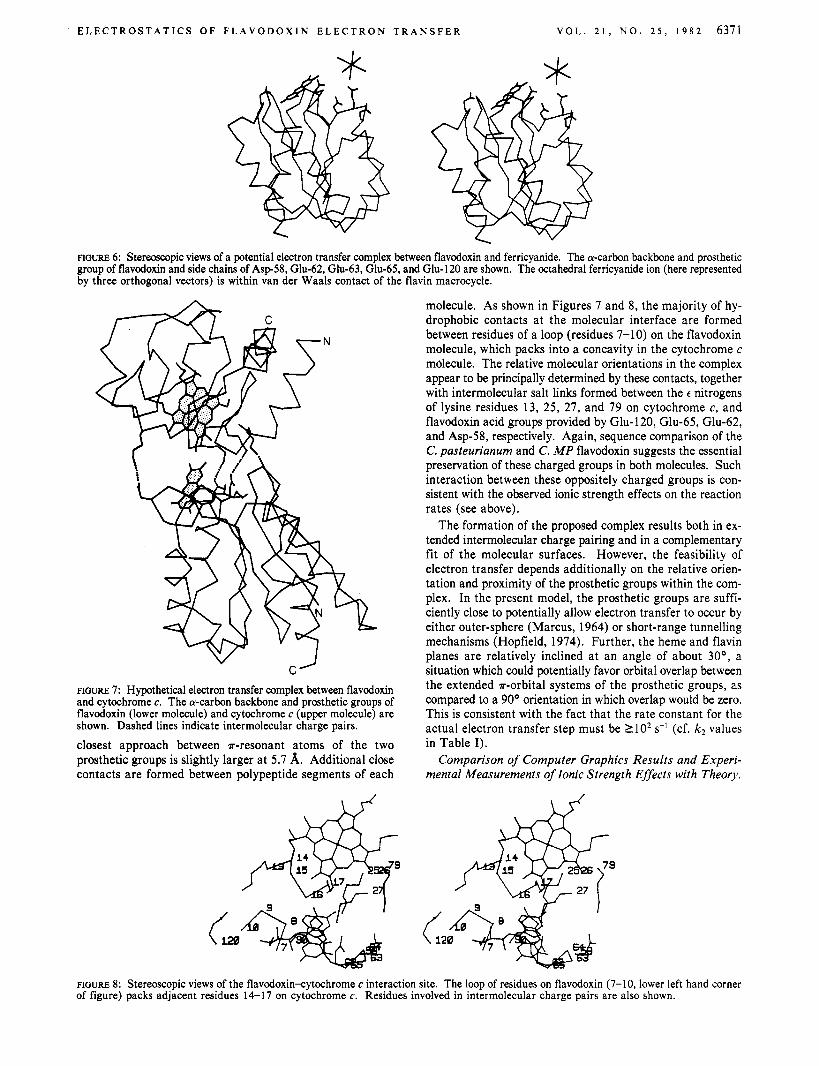
FIGURE 6: Stereoscopic Views of a potential electron transfer complex between flavodoxin and ferricyanide. The a-carbon backbone and prosthetic group of flavodoxin and side chains of Asp58, Glu-62, Glu-63, Glu-65, and Glu-120 are shown. The octahedral ferricyanide ion (here represented by three orthogonal vectors) is within van der Waals contact of the flavin macrocycle.
C’ FIGURE 7: Hypothetical electron transfer complex between flavodoxin and cytochrome c. The a-carbon backbone and prosthetic groups of flavodoxin (lower molecule) and cytochrome c (upper molecule) are shown. Dashed lines indicate intermolecular charge pairs.
closest approach between ?r-resonant atoms of the two prosthetic groups is slightly larger at 5.7 A. Additional close contacts are formed between polypeptide segments of each
molecule. As shown in Figures 7 and 8, the majority of hy- drophobic contacts at the molecular interface are formed between residues of a loop (residues 7-10) on the flavodoxin molecule, which packs into a concavity in the cytochrome c molecule. The relative molecular orientations in the complex appear to be principally determined by these contacts, together with intermolecular salt links formed between the t nitrogens of lysine residues 13, 25, 27, and 79 on cytochrome c, and flavodoxin acid groups provided by Glu- 120, Glu-65, Glu-62, and Asp-58, respectively. Again, sequence comparison of the C. pasteurianum and C. MP flavodoxin suggests the essential preservation of these charged groups in both molecules. Such interaction between these oppositely charged groups is con- sistent with the observed ionic strength effects on the reaction rates (see above).
The formation of the proposed complex results both in ex- tended intermolecular charge pairing and in a complementary fit of the molecular surfaces. However, the feasibility of electron transfer depends additionally on the relative orien- tation and proximity of the prosthetic groups within the com- plex. In the present model, the prosthetic groups are suffi- ciently close to potentially allow electron transfer to occur by either outer-sphere (Marcus, 1964) or short-range tunnelling mechanisms (Hopfield, 1974). Further, the heme and flavin planes are relatively inclined at an angle of about 30°, a situation which could potentially favor orbital overlap between the extended *-orbital systems of the prosthetic groups, as compared to a 90° orientation in which overlap would be zero. This is consistent with the fact that the rate constant for the actual electron transfer step must be I lo2 s-l (cf. k2 values in Table I).
Comparison of Computer Graphics Results and Experi- mental Measurements of Ionic Strength Effects with Theory.
FIGURE 8: Stereoscopic views of the flavodoxin-cytochrome c interaction site. The loop of residues on flavodoxin (7-10, lower left hand corner of figure) packs adjacent residues 14-17 on cytochrome c. Residues involved in intermolecular charge pairs are also shown.

6372 B I O C H E M I S T R Y S I M O N D S E N ET A L .
Table 11: Theoretical Calculations of Ionic Strength Effects' Marcus equation deb ye-Huckel equation
cytochrome c 17.5 8.0 4.0 3.5 3.0
Fe(CN),)- 17.5 8.0 4.0 3.0
Fe(EDTA) 17.5 8.0 4.0 3.0
16.6 8.0 4.0 3.5 3.0 4.5 4.5 4.5 3.0 4.0 4.0 4.0 3.0
-224.4 -59.2 -29.2 -24.1 -19.5
25.7 13.3 9.7 8.0
15.9 5.5 3.6 2.8
2.18 X loz6 2.48 X 10l6 3.91 X lo', 6.06 X 10" 1.05 x 10"
100 676
1380 1980
9.12 X lo-' 0.89 1.42 1.83
7.35 x 10⁴ 2.13 x 10³ 4.64 3.63 2.65
2.05 x l o6 7.42 X lo6
6.43 x 10⁵
4.31 x 10⁷ 23.3 27.4 41.2 59.4
z,z, k , (M-l s-l) 2 2
-93.6 8.86 X 10l6 I .5 -44.6 9.39 x 10¹³ 5 .O -25.2 8.62 X 10" 5 .O -21.6 2.26 X 10" 5.0 -20.5 1.93 X 10" 5.0
38.6 19.8 -3.0 14.9 620 -3.0 8.5 1880 -3.0 7.7 2200 -3.0
14.6 0.21 -1 .o 5.5 0.98 -1 .o 2.9 1.88 -1 .o 2.4 2.17 -1 .o
Total net charge estimated from sequence data: cytochrome c = 7; flavodoxin = -10. Abbreviations: RFld = radius of flavodoxin; R , = radius of oxidant; k , = rate constant at zero ionic strength; ki = rate constant at infinite ionic strength; Z,Z, = calculated charge product; 2, = selected charge for oxidant.
Theoretical treatments of the effect of ionic strength upon reaction rates include the extended Debye-Hiickel equation
(22122 + Z22)a.\/I z22a.\/I ( 5 ) -- In k = In ko +
1 + K R ~ 1 + K R ~
and the WherlandGray equation (Wherland & Gray, 1976) derived by using the Marcus theory of electron transfer (Marcus & Sutin, 1975) (eq 6). In these expressions, k is
( 6 ) In k = In ki - 3.576 +e)- ZlZ2 1 + K R ~ R1 + R2
the rate constant at a particular ionic strength, ko is the constant at zero ionic strength, ki is the constant at infinite ionic strength, I is the ionic strength, Z1 and Z2 are the reactant charges, R1 and R2 are the reactant radii, K = 0.329 11/2 and a is a constant. Other treatments have recently been given (Koppenol, 1980; Stonehuerner et al., 1979), but these are somewhat less useful and, in the latter case, less well- founded theoretically [cf. Koppenol (19-80)l. The use of eq 5 and 6 to fit a set of k vs. Z1/2 data allows a determination (by extrapolation) of ko and of the charge product (Z,Z2). The latter can be compared with the known amino acid composition of the protein reactants which defines their charge at a given pH. An adjustable parameter in both equations is the R value; this may also provide a test of the applicability of the theo- retical analysis by comparison with structural information.
In the Wherland and Gray analysis, the electrostatic com- ponents of the interaction are considered as work terms in- volved in the production of the transition-state complex. In this treatment, the reacting species were modeled as uniformly charged spheres which are in contact, so that the potential between them is proportional to
ZlZ2/(Rl + R2) (7)
where the terms are as defined above. This expression derives from the work term associated with charge separation, which equals
where ~ 4 , ~ is the distance between charges and eo is the per- mittivity constant.
The solid curves drawn in Figures 4 and 5 were obtained from a least-squares fit of the Marcus theory equation to the data for several values of R. The calculated curves which were
chosen had the lowest average error and were not biased to- ward a particular section of the curve. For the fits shown, the average least-squares errors for all the experimental points were 1.6% for curve A, 1.4% for curve B, and 1.6% for curve C. The average errors for the smallest radii used in the calculations (curves not shown) were approximately 4.0%. The average errors for the extended Debye-Hiickel calculations were in the range of 1 .O-4.0%. Table I1 lists charge products and ko values for all three reactions calculated from both theoretical expressions. As is evident from Figures 4 and 5, the fit to the data is within experimental error for a wide range of R values and charge products. Furthermore, as Table I1 shows, both theories yield comparable values for the charge product and ko at small values of R but deviate appreciably at large values. Inasmuch as neither of the theoretical ap- proaches explicitly includes diffusion as a limitation, the fact that large R values yield impossibly large ko values is probably not significant. That good fits are obtained over a large range of parameters emphasizes the difficulties involved in detailed structural interpretations of ionic strength/rate data based on the Marcus and Debye-Huckel formulations.
The use of full protein radii and total net charge in calcu- lating the electrostatic work involved in reaching the transition state for complex formation is based upon the idea that the protein molecules are rapidly tumbling along the reaction pathway and thus present a spherically smeared averaged field to one another which includes all of the charged groups on the protein surface. This is most likely the case at large distances. As the molecules approach each other, however, localized clusters of charge, multiple salt bridge interactions, and di- pole-dipole effects begin to dominate the electrostatic inter- action. Although it is clearly physically unreasonable to at- tempt to model the electrostatics by using smaller spheres with lower net charges, the computer graphics analysis suggests that such cluster interactions might be better modeled by charged parallel plates. We will return to this point again below. It is noteworthy in this context that Stonehuerner et al. (1979) have utilized localized charge-charge interactions in their considerations of ionic strength effects on rate constants. The recent work of Koppenol & Margoliash (1 982) clearly illus- trates the complex nature of the electrostatic potential field around molecules such as cytochrome c. It is also interesting that in their model for electrostatic interactions between cy- tochrome c and other proteins, Koppenol and Margoliash assume that the cytochrome orients itself with its dipole vector pointing toward its partner, rather than presenting a spherically averaged field. Because of the distance dependence of the
E L E C T R O S T A T I C S O F F L A V O D O X I N E L E C T R O N T R A N S F E R V O L . 2 1 , N O . 2 5 , 1 9 8 2 6373
electrostatic interactions, this would lead to the possibility of localized charge clusters being a dominant factor.
In the present case, localized charge interactions are possible if one assumes that only the lysine residues which are in close proximity to the heme edge of cytochrome c (Salemme, 1976), and the glutamic acid and aspartic acid residues in proximity to the FMN of flavodoxin (Mayhew & Ludwig, 1975), play a dominant role in complex formation. Such a restriction is not unreasonable, at least for cytochrome c, inasmuch as Geren & Millet (198 1) were able to account for the ionic strength dependence of the electron transfer between reduced adre- nodoxin and cytochrome c by neglecting interactions between charged residues separated by more than 10 8, [cf. also Smith et al. (1981)l. This suggestion is consistent with the properties of the complex shown in Figure 7, whose calculated interaction charge product is -16, taking into account only the four positively charged lysine residues of cytochrome c and the four negatively charged residues on flavodoxin directly involved in intermolecular charge pairs. However, additional electrostatic interactions (e.g., those arising from delocalized positive charge on the ferriheme iron and additional nearby negative groups on flavodoxin) could also contribute to the interaction, and so increase the magnitude of the interaction charge product.
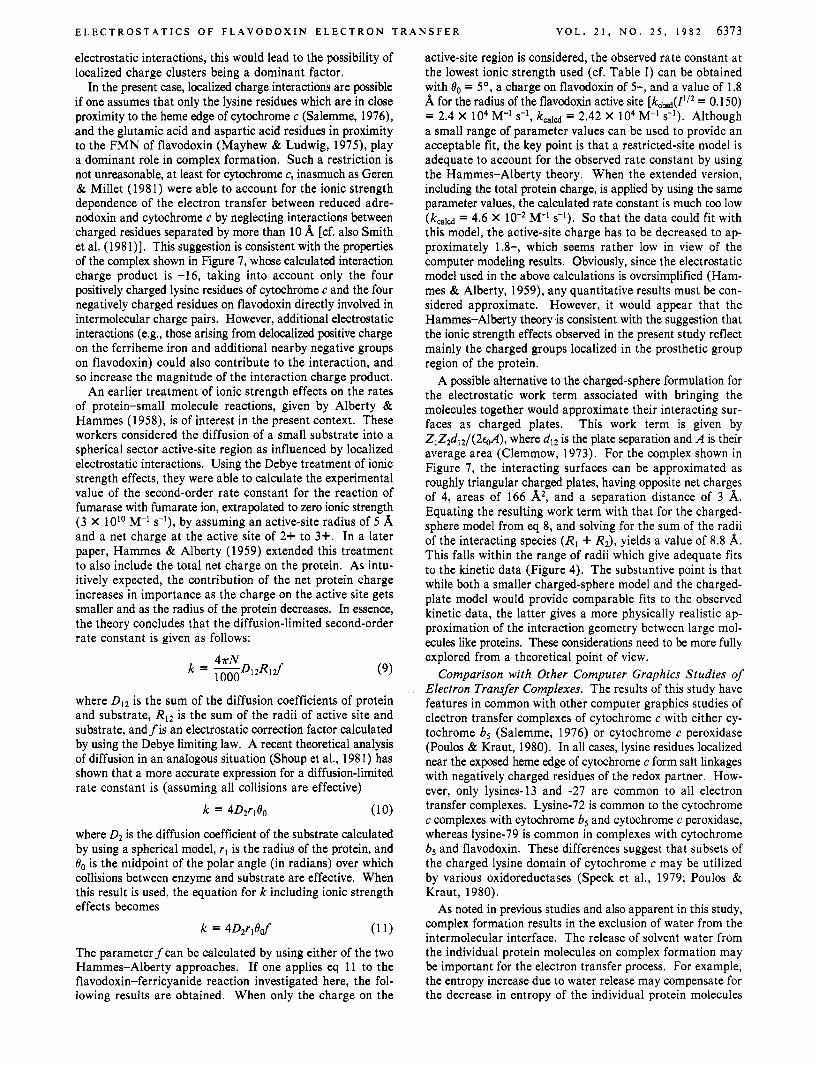
An earlier treatment of ionic strength effects on the rates of protein-small molecule reactions, given by Alberty & Hammes (1958), is of interest in the present context. These workers considered the diffusion of a small substrate into a spherical sector active-site region as influenced by localized electrostatic interactions. Using the Debye treatment of ionic strength effects, they were able to calculate the experimental value of the second-order rate constant for the reaction of fumarase with fumarate ion, extrapolated to zero ionic strength (3 X 1Olo M-' s-l), by assuming an active-site radius of 5 8, and a net charge at the active site of 2+ to 3+. In a later paper, Hammes & Alberty (1959) extended this treatment to also include the total net charge on the protein. As intu- itively expected, the contribution of the net protein charge increases in importance as the charge on the active site gets smaller and as the radius of the protein decreases. In essence, the theory concludes that the diffusion-limited second-order rate constant is given as follows:
(9)
where D12 is the sum of the diffusion coefficients of protein and substrate, Rlz is the sum of the radii of active site and substrate, and f is an electrostatic correction factor calculated by using the Debye limiting law. A recent theoretical analysis of diffusion in an analogous situation (Shoup et al., 1981) has shown that a more accurate expression for a diffusion-limited rate constant is (assuming all collisions are effective)
k = 4D2rlBo
where D2 is the diffusion coefficient of the substrate calculated by using a spherical model, rl is the radius of the protein, and Bo is the midpoint of the polar angle (in radians) over which collisions between enzyme and substrate are effective. When this result is used, the equation for k including ionic strength effects becomes
k = 4Dzr,Baf (1 1)
The parameter f can be calculated by using either of the two Hammes-Alberty approaches. If one applies eq 11 to the flavodoxin-ferricyanide reaction investigated here, the fol- lowing results are obtained. When only the charge on the
active-site region is considered, the observed rate constant at the lowest ionic strength used (cf. Table I) can be obtained with Bo = 5', a charge on flavodoxin of 5-, and a value of 1.8 8, for the radius of the flavodoxin active site [ koM(I1/z = 0.150) = 2.4 X lo4 M-ls-l, kWld = 2.42 X lo4 M-ls-l ). Although a small range of parameter values can be used to provide an acceptable fit, the key point is that a restricted-site model is adequate to account for the observed rate constant by using the Hammes-Alberty theory. When the extended version, including the total protein charge, is applied by using the same parameter values, the calculated rate constant is much too low (kald = 4.6 X M-' s-l). So that the data could fit with this model, the active-site charge has to be decreased to ap- proximately 1.8-, which seems rather low in view of the computer modeling results. Obviously, since the electrostatic model used in the above calculations is oversimplified (Ham- mes & Alberty, 1959), any quantitative results must be con- sidered approximate. However, it would appear that the Hammes-Alberty theory is consistent with the suggestion that the ionic strength effects observed in the present study reflect mainly the charged groups localized in the prosthetic group region of the protein.
A possible alternative to the charged-sphere formulation for the electrostatic work term associated with bringing the molecules together would approximate their interacting sur- faces as charged plates. This work term is given by ZlZ2d12/(2+4), where d12 is the plate separation and A is their average area (Clemmow, 1973). For the complex shown in Figure 7, the interacting surfaces can be approximated as roughly triangular charged plates, having opposite net charges of 4, areas of 166 A2, and a separation distance of 3 A. Equating the resulting work term with that for the charged- sphere model from eq 8, and solving for the sum of the radii of the interacting species (R, + R2), yields a value of 8.8 A. This falls within the range of radii which give adequate fits to the kinetic data (Figure 4). The substantive point is that while both a smaller charged-sphere model and the charged- plate model would provide comparable fits to the observed kinetic data, the latter gives a more physically realistic ap- proximation of the interaction geometry between large mol- ecules like proteins. These considerations need to be more fully explored from a theoretical point of view.
Comparison with Other Computer Graphics Studies of Electron Transfer Complexes. The results of this study have features in common with other computer graphics studies of electron transfer complexes of cytochrome c with either cy- tochrome b5 (Salemme, 1976) or cytochrome c peroxidase (Poulos & Kraut, 1980). In all cases, lysine residues localized near the exposed heme edge of cytochrome c form salt linkages with negatively charged residues of the redox partner. How- ever, only lysines-13 and -27 are common to all electron transfer complexes. Lysine-72 is common to the cytochrome c complexes with cytochrome b5 and cytochrome c peroxidase, whereas lysine-79 is common in complexes with cytochrome b5 and flavodoxin. These differences suggest that subsets of the charged lysine domain of cytochrome c may be utilized by various oxidoreductases (Speck et al., 1979; Poulos & Kraut, 1980).
As noted in previous studies and also apparent in this study, complex formation results in the exclusion of water from the intermolecular interface. The release of solvent water from the individual protein molecules on complex formation may be important for the electron transfer process. For example, the entropy increase due to water release may compensate for the decrease in entropy of the individual protein molecules

6374 B I O C H E M I S T R Y S I M O N D S E N E T A L .
when the electron transfer complex is formed. In addition, exclusion of water at the intermolecular interface lowers the dielectric constant about the previously solvent-exposed atoms of the prosthetic groups. This effect, coupled with neutrali- zation of the charged residues clustered near the prosthetic group, serves to deshield the prosthetic groups relative to their situation in the isolated molecules and may facilitate electron transfer.
Conclusions This investigation indicates that electrostatic interactions
are important in orienting flavodoxin with respect to oxidants during an electron transfer encounter, at least for the in vitro systems investigated here. Inasmuch as these include a wide variety of molecular structures, it seems reasonable to expect that electrostatics are important in vivo as well. The computer analysis suggests that charges which are localized in the vi- cinity of the prosthetic group, rather than the overall charge on the protein, may be a dominant factor in the interaction. A similar conclusion has been reached by other workers for a variety of cytochrome c-protein interactions [cf. Stone- huerner et al. (1 979) and Geren & Millet (1 98 l)] , as well as for reactions with nonprotein redox reagents (Hodges et al., 1974; McArdle et al., 1974; Wood & Cusanovich, 1975; Cusanovich, 1978). It is important to note, however, that at very low ionic strengths ( I < 0.01) where the shielding is minimal electrostatic interactions including more distant charged groups may affect reaction rates (Goldkorn & Schejter, 1979).
Examination of hypothetical complexes of flavodoxin with either ferricyanide or cytochrome c by using computer graphics techniques suggests that both interactions involve the partic- ipation of a similar set of negatively charged residues on the flavodoxin molecular surface. These residues are sequentially and/or structurally conserved in various species of flavodoxin (Smith et al., 1977; Watenpaugh et al., 1973; Dubourdieu & Fox, 1977). The interaction between flavodoxin and ferri- cyanide is accompanied by electrostatic repulsion between the negatively charge reactant and aspartate and glutamate res- idues on flavodoxin. In contrast, the interaction between cytochrome c and flavodoxin is promoted by intermolecular charge pairs formed between positively charged residues on cytochrome c and negatively charged residues on flavodoxin. Most interesting, since cytochrome c and flavodoxin are not physiological electron transfer partners, is the observation that surface structural complementarity appears to play an im- portant role in formation of a favorable electron transfer complex (assuming that the complex is on the main reaction pathway). Nevertheless, the results presented are consistent with previous proposals (Salemme et al., 1973; Salemme, 1976, 1977; Poulos & Kraut, 1980) that emphasize the role of complementary electrostatic interactions in mediation of electron transfer reactions between proteins.
References Ahmad, I., Cusanovich, M. A., & Tollin, G. (1982) Bio-
Alberty, R. A., & Hammes, G. G. (1958) J . Phys. Chem. 62,
Barry, C. D., Bosshard, H. E., Ellis, R. A., & Marshall, G. R. (1974) Fed. Proc., Fed. Am. SOC. Exp. Biol. 33,
Bernstein, F. C., Koetzle, T. F., Williams, G. J . B., Meyer, E. F., Jr., Brice, M. D., Rodgers, J . R., Kennard, O., Schimanouchi, T., & Tasume, M. (1977) J. Mol. Biol. 112,
chemistry 21, 3 122-3 128.
154-1 59.
2368-2372.
535-542.
Burnett, R. M., Darling, G. D., Kendall, D. S . , LeQuesne, M. E., Mayhew, S. G., Smith, W. W., & Ludwig, M. L. (1974) J . Biol. Chem. 249, 4383-4392.
Clemmow, P. C. (1973) in An Introduction to Electromagnetic Theory, pp 88-9 1, Cambridge University Press, New York.
Cusanovich, M. A. (1978) in Bioorganic Chemistry, Vol. 4, pp 117-145, Academic Press, New York.
Dayhoff, M. 0. (1976) in Atlas of Protein Sequence and Structure, Vol. 5,2nd ed., pp 26-27, Academic Press, New York.
Dubourdieu, M., & Fox, J . L. (1977) J . Biol. Chem. 252,
Foust, G. P., Mayhew, S. G., & Massey, V. (1969) J. Biol.
Frost, A. A., & Pearson, R. G. (1961) in Kinetics and
Geren, L. M., & Millet, F. (1981) J . Biol. Chem. 256,
Goldkorn, T., & Schejter, A. (1977a) FEBS Lett. 75,44-46. Goldkorn, T., & Schejter, A. (1977b) FEBS Lett. 82,293-296. Goldkorn, T., & Schejter, A. (1979) J. Biol. Chem. 254,
Hammes, G. G., & Alberty, R. A. (1959) J . Phys. Chem. 63,
Hodges, H. L., Holwerda, R. A., & Gray, H. B. (1974) J. Am.
Hopfield, J. J. (1974) Proc. Natl. Acad. Sci. U.S.A. 71,
Jung, J., & Tollin, G. (1981) Biochemistry 20, 5124-5127. Koppenol, W. H. (1980) Biophys. J . 29, 493-508. Koppenol, W. H., & Margoliash, E. (1982) J . Biol. Chem.
Lederer, F., Glatigny, A., Bethge, P. H., Bellamy, H. D., &
Marcus, R. A. (1964) Annu. Rev. Phys. Chem. 15, 155-172. Marcus, R. A., & Sutin, N. (1975) Inorg. Chem. 14,213-216. Margoliash, E., & Schejter, A. (1966) Adu. Protein Chem.
Massey, V., & Hemmerich, P. (1978) Biochemistry 17, 9-17. Mayhew, S . G. (1971) Biochim. Biophys. Acta 235,289-302. Mayhew, S. G., & Ludwig, M. L. (1975) Enzymes, 3rd Ed.
McArdle, J . V., Gray, H. B., Cruetz, C., & Sutin, N. (1 974)
Ng, S., Smith, M. B., Smith, H. T., & Millett, F. (1977)
Poulos, T. L., & Kraut, J . (1980) J . Biol. Chem. 255,
Salemme, F. R. (1976) J . Mol. Biol. 102, 563-568. Salemme, F. R. (1977) Annu. Rev. Biochem. 46, 299-329. Salemme, F. R., Kraut, J., & Kamen, M. D. (1973) J. Biol.
Sawyer, D. S., & McKinnie, J. M. (1960) J . Am. Chem. SOC.
Schugar, H. J. , Hubbard, A. T., Anson, F. C., & Gray, H.
Shoup, D., Lipari, G., & Szabo, A. (1981) Biophys. J . 36,
Shrake, A., & Rupley, J. A. (1973) J . Mol. Biol. 79, 351-371. Simondsen, R. P., & Tollin, G. (1980) Mol. Cell. Biochem.
1453-1463.
Chem. 244, 964-970.
Mechanism, 2nd ed., Wiley, New York.
4851-4855.
12562-12566.
274-279.
Chem. SOC. 96, 3132-3137.
3640-3644.
257, 4426-4437.
Mathews, F. S . (1981) J . Mol. Biol. 148, 427-448.
26, 11 3-286.
12, 57.
J. Am. Chem. SOC. 96, 5737-5741.
Biochemistry 16, 4975-4978.
103 22-1 03 30.
Chem. 245, 7701-7716.
82, 4191-4196.
B. (1969) J . Am. Chem. SOC. 91, 71-77.
697-714.
33, 13-24.

Biochemistry 1982, 21, 6375-6382 6375
Simondsen, R. P., & Tollin, G. (1982) BBA Lib. 21,719-724. Smith, H. T., Ahmed, A. J., & Millet, F. (1981) J . Biol.
Chem. 256, 4984-4990. Smith, W. W., Burnett, R. M., Darling, G. D., & Ludwig,
M. L. (1977) J . Mol. Biol. 117, 195-225. Speck, S. H., Ferguson-Miller, S., Osheroff, N., & Margoliash,
E. (1979) Proc. Natl. Acad. Sci. U.S.A. 76, 115-159. Speck, S. H., Koppenol, W. H., Dethmers, J. K., Osherhoff,
N., Margolaish, E., & Rajagopalan, K. V. (1981) J . Biol. Chem. 256, 7394-7400.
Stonehuerner, J., Williams, J. B., & Millet, F. (1979) Bio- chemistry 18, 5422-5427.
Swanson, R., Trus, B. L., Mandel, N., Mandel, G., Kallai, O., & Dickerson, R. E. (1977) J . Biol. Chem. 252, 759-775.
Timkovich, R., & Dickerson, R. E. (1 976) J . Biol. Chem. 251,
Watenpaugh, K. D., Sieker, L. C., & Jensen, L. H. (1973)
Wherland, S., & Gray, H. B. (1976) Proc. Natl. Acad. Sci.
Wilford, J. B., Smith, N. O., & Powell, H. M. (1968) J. Chem.
Wood, F. E., & Cusanovich, M. A. (1975) Arch. Biochem.
403 3-4046.
Proc. Natl. Acad. Sci. U.S.A. 70, 3857-3860.
U.S.A. 73, 2950-2954.
SOC. A , 1544-1 549.
Biophys. 168, 333-342.
Local Conformational Changes Induced by Successive Nicotinamide Adenine Dinucleotide Binding to Dissociable Tetrameric ~-Glyceraldehyde-3-phosphate Dehydrogenase. Quantitative Analysis of a Two-step Dissociation Process?
J. OvBdi,* I. R. Mohamed Osman,t and J. Batke
ABSTRACT: Covalent binding of FITC up to 2 mol/mol of tetrameric enzyme does not affect the enzymatic activity and dissociation properties of pig muscle ~-glyceraldehyde-3- phosphate dehydrogenase (GAPD). The binding of NAD to dehydrogenase-FITC complex partially reverts the quenching caused by the binding of dye to apo-GAPD. This phenomenon, as well as the formation of a characteristic absorption dif- ference spectrum caused by the binding of NAD, makes it possible to follow the NAD-induced local conformational changes near the dye-binding region. The time course of NAD-induced spectral changes shows biphasic kinetics: a burst and a slow phase. The amplitude of burst phase as a function of NAD equivalents has sigmoidal shape due to the cooperative interaction between subunits. The same conclusion could be drawn from fluorescence anisotropy measurements.
Glyceraldehyde-3-phosphate dehydrogenase (GAPD)' is a tetrameric enzyme composed of four chemically identical subunits (Harris & Waters, 1976). It has long been known that the mammalian enzyme exhibits negative cooperativity in the binding of NAD in the pH range 7.6-8.4, and four dissociation constants were required to describe the binding of NAD to the tetrameric enzyme (Conway & Koshland, 1968; DeVijlder & Slater, 1968; DeVijlder et al., 1969; Schlessinger & Levitzki, 1974; Bell & Dalziel, 1975; Henis & Levitzki, 1980; Price & Radda, 1971). Recently, the less cooperative binding of NAD to a special preparation of GAPD was shown (Price & Radda, 1971; Scheek & Slater, 1978; Scheek et al., 1979). Moreover, the results at pH 9.4 are consistent with independent binding of NAD at identical sites (Reynolds & Dalziel, 1979). In an assay for GAPD activity
' From the Institute of Enzymology, Biological Research Center, Hungarian Academy of Sciences, Budapest, Hungary, H- 1502. Received January 28, 1982; revised manuscript received July 23, 1982.
f Permanent address: Faculty of Sciences, Cairo University, Egypt.
0006-2960/82/0421-6375$01.25/0
In the presence of excess NAD a slow conformational change can be detected, the amplitude of which is a function of NAD concentration. This phenomenon can be attributed to the binding of further NAD molecules to the holoenzyme. The slow phase follows first-order kinetics, and the rate constant depends on enzyme concentration. The specific fluorescence intensity and the fluorescence anisotropy of fluorescent dye labeled apo-GAPD and GAPD saturated with NAD are also dependent on enzyme concentration. We suggest that NAD binding induces major changes in the steric structure of tet- rameric enzyme without influencing remarkably the interacting forces between the contact surfaces of subunits. Data are quantitatively interpreted in terms of a two-step dissociation model.
in which none of the primary products accumulate, the co- operativity for NAD tended to be positive (Aragon & Sols, 1978).
Numerous authors have also reported controversial results concerning the contribution of each of the four active sites to the gross structural and functional changes of the tetrameric enzyme upon coenzyme binding (Bell & Dalziel, 1975; Scheek & Slater, 1978; Simon, 1972; Kelemen et al., 1974; Gafni, 1981). However, in all of these studies the conformational changes of the tetrameric enzyme as a whole or of the NAD binding sites of the neighboring subunits were detected.
The association-dissociation properties of mammalian muscle apo-glyceraldehyde-3-phosphate dehydrogenase have earlier been investigated by ultracentrifugation (Hoagland &
I Abbreviations: GAPD, ~-glycera!dehyde-3-phosphate de- hydrogenase (EC l .2. l .12); GAP, D-glyceraldehyde 3-phosphate; FITC, fluorescein isothiocyanate; Tris, tris(hydroxymethy1)aminomethane; EDTA, ethylenediaminetetraacetate; Hepes, N-(2-hydroxyethyl)- piperazine-N'-2-ethanesulfonic acid; NaDodS04, sodium dodecyl sulfate.
0 1982 American Chemical Society