TRANSIENT BEHAVIOR OF VARIABLE SPEED PUMP-TURBINE UNITS€¦ · TRANSIENT BEHAVIOR OF VARIABLE...
14
IAHR 24th Symposium on Hydraulic Machinery and Systems OCTOBER 27-31, FOZ DO IGUASSU RESERVED TO IAHR TRANSIENT BEHAVIOR OF VARIABLE SPEED PUMP-TURBINE UNITS Y. Pannatier EPFL, Laboratory of Electrical Machines C. Nicolet Power Vision Engineering Sàrl B. Kawkabani EPFL, Laboratory of Electrical Machines J.-L. Deniau ALSTOM Power Hydro CH-1015 Lausanne, Switzerland Tel (+41)-21-6934690, fax (+41)-21-6932687 e-mail: [email protected] CH-1024 Ecublens, Switzerland e-mail: christophe.nicolet@ powervision-eng.ch CH-1015 Lausanne, Switzerland e-mail: basile.kawkabani@ epfl.ch FR-38041 Grenoble, France e-mail: jean-loup.deniau@ power.alstom.com A. Schwery ALSTOM Power Hydro F. Avellan EPFL, Laboratory for Hydraulic Machines J.-J. Simond EPFL, Laboratory of Electrical Machines CH-5242 Birr, Switzerland e-mail: alexander.schwery@ power.alstom.com CH-1007 Lausanne, Switzerland e-mail: [email protected] CH-1015 Lausanne, Switzerland e-mail: [email protected] ABSTRACT This paper presents the modeling, simulation and analysis of the dynamic behavior of a fictitious 2x320 MW variable speed pump-turbine power plant including hydraulic system, electrical installations, rotating inertias and control systems. First, the modeling of hydraulic and electrical components of the power plant is presented. Then, the possible control strategies and the related block diagram are presented. The dynamic performances of the different control strategies are compared by the simulation of change of active power set points. Dynamic performances of the different control strategies are discussed. KEY WORDS: Transients, variable speed, pump-turbine, control strategy.
Transcript of TRANSIENT BEHAVIOR OF VARIABLE SPEED PUMP-TURBINE UNITS€¦ · TRANSIENT BEHAVIOR OF VARIABLE...

IAHR 24th Symposium on Hydraulic Machinery and Systems OCTOBER 27-31, FOZ DO IGUASSU RESERVED TO IAHR
TRANSIENT BEHAVIOR OF VARIABLE SPEED PUMP-TURBINE UNITS
Y. Pannatier EPFL, Laboratory of Electrical Machines
C. Nicolet Power Vision
Engineering Sàrl
B. Kawkabani
EPFL, Laboratory of Electrical Machines
J.-L. Deniau ALSTOM Power Hydro
CH-1015 Lausanne, Switzerland
Tel (+41)-21-6934690, fax (+41)-21-6932687
e-mail: [email protected]
CH-1024 Ecublens, Switzerland
e-mail: christophe.nicolet@ powervision-eng.ch
CH-1015 Lausanne, Switzerland
e-mail: basile.kawkabani@
epfl.ch
FR-38041 Grenoble, France e-mail:
jean-loup.deniau@ power.alstom.com
A. Schwery ALSTOM Power Hydro
F. Avellan
EPFL, Laboratory for Hydraulic Machines
J.-J. Simond EPFL, Laboratory of Electrical
Machines CH-5242 Birr,
Switzerland e-mail:
alexander.schwery@ power.alstom.com
CH-1007 Lausanne, Switzerland
e-mail: [email protected]
CH-1015 Lausanne, Switzerland
e-mail: [email protected]
ABSTRACT This paper presents the modeling, simulation and analysis of the dynamic behavior of a fictitious 2x320 MW variable speed pump-turbine power plant including hydraulic system, electrical installations, rotating inertias and control systems. First, the modeling of hydraulic and electrical components of the power plant is presented. Then, the possible control strategies and the related block diagram are presented. The dynamic performances of the different control strategies are compared by the simulation of change of active power set points. Dynamic performances of the different control strategies are discussed.
KEY WORDS: Transients, variable speed, pump-turbine, control strategy.

24th Symposium on Hydraulic Machinery and Systems 2
INTRODUCTION
Variable speed pump-turbine units have become nowadays an interesting way to increase stability of electrical power networks due to their high level of operating flexibility. Indeed, variable speed pump-turbine units offer several advantages for both pumping and generating modes such as: (i) possibility of active power control in pumping mode, (ii) efficiency increase and wide range of operation in generating mode especially under partial load, (iii) network stability improvement by reactive power control and (iv) network stability improvement by instantaneous active power injection in the grid (flywheel effect), [1], [4], [9], [10]. For operating stability purposes, the increase of dynamic performance is of major concerns and its optimization requires reliable simulation models.
This paper presents the modeling, simulation and analysis of the dynamic behavior of a
fictitious 2x320 MW variable speed pump-turbine power plant including the hydraulic system, electrical equipments, rotating inertias and control systems using the software SIMSEN. First, the modeling of hydraulic and electrical components of the power plant is presented. The model of the hydraulic circuit takes into account, the upstream reservoir, the gallery, the surge tank, the penstock, the pump-turbines, the turbine regulator and the tailrace water tunnel. The modeling of the hydraulic system enables to take into consideration waterhammer, mass oscillations and turbine characteristics effects. The model of the electrical system comprises a doubly - fed induction generator, with VSI (Voltage Source Inverter) cascade in the rotor side. In generating mode, two control strategies are investigated. The first strategy considers turbine power governor and generator speed controller while the second one is based on turbine speed governor and generator power controller. For pumping mode, only one strategy based on generator power controller is possible; the speed being defined in pumping mode if the head and power level are specified.
The performances of the different control strategies are compared by the simulation of
change of active power set point. Finally, the benefits of variable speed structure are discussed in terms of dynamic performances and global efficiency.
MODELING OF THE POWER PLANT
The complete SIMSEN model of the fictitious 2x320 MW variable speed pump-turbines power plant is presented in Figure 1. It comprises a hydraulic system and an electrical one. The modeling of both systems is described in the subsections below.
Figure 1 Complete 2x230 MW variable speed pump-turbine SIMSEN model.
24th Symposium on Hydraulic Machinery and Systems 3
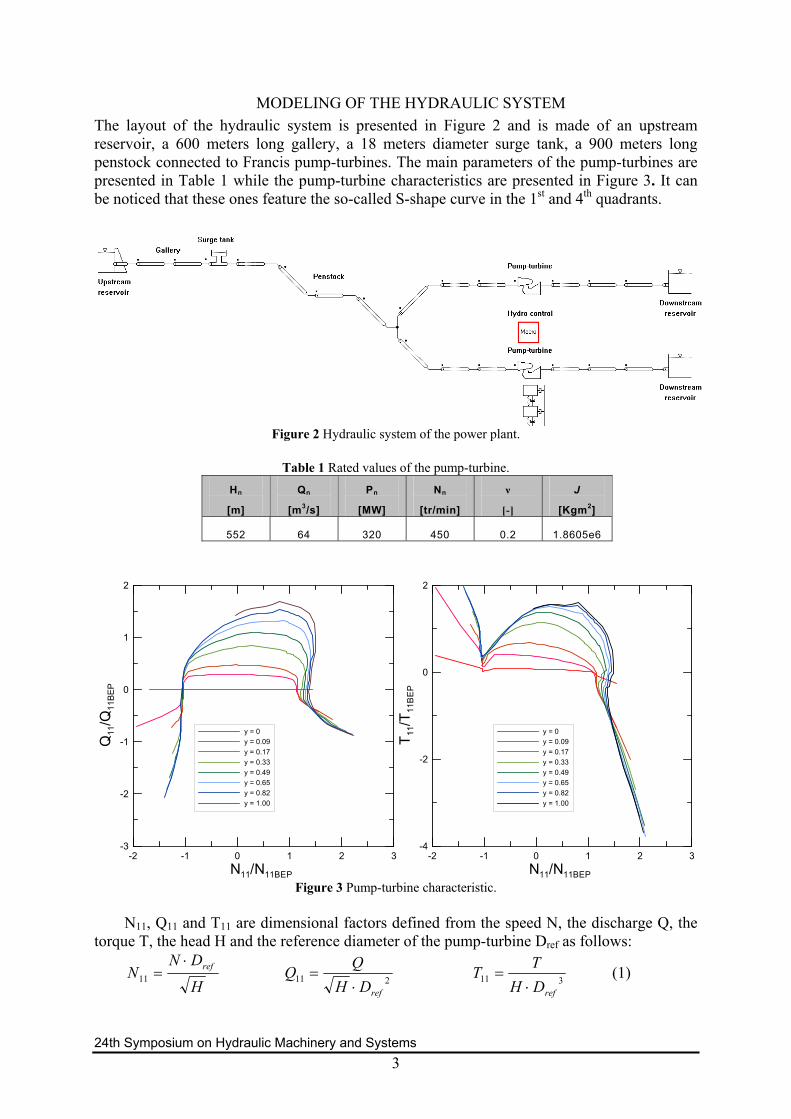
MODELING OF THE HYDRAULIC SYSTEM The layout of the hydraulic system is presented in Figure 2 and is made of an upstream reservoir, a 600 meters long gallery, a 18 meters diameter surge tank, a 900 meters long penstock connected to Francis pump-turbines. The main parameters of the pump-turbines are presented in Table 1 while the pump-turbine characteristics are presented in Figure 3. It can be noticed that these ones feature the so-called S-shape curve in the 1st and 4th quadrants.
Figure 2 Hydraulic system of the power plant.
Table 1 Rated values of the pump-turbine.
Hn
[m]
Qn
[m3/s]
Pn
[MW]
Nn
[tr/min]
ν
[-]
J
[Kgm2]
552 64 320 450 0.2 1.8605e6
-2 -1 0 1 2 3N11/N11BEP
-3
-2
-1
0
1
2
Q11
/Q11
BEP
y = 0y = 0.09y = 0.17y = 0.33y = 0.49y = 0.65y = 0.82y = 1.00
-2 -1 0 1 2 3N11/N11BEP
-4
-2
0
2
T 11/T
11B
EP
y = 0y = 0.09y = 0.17y = 0.33y = 0.49y = 0.65y = 0.82y = 1.00
Figure 3 Pump-turbine characteristic.
N11, Q11 and T11 are dimensional factors defined from the speed N, the discharge Q, the
torque T, the head H and the reference diameter of the pump-turbine Dref as follows:
H
DNN ref⋅
=11 211refDH
QQ⋅
= 311refDH
TT⋅
= (1)

24th Symposium on Hydraulic Machinery and Systems 4
Modeling of the different hydraulic components is based on an electrical analogy. By assuming uniform pressure and velocity distributions in the cross section and neglecting the convective terms, the one-dimensional momentum and continuity balance equations for an elementary pipe filled with water of length dx, cross section A and wave speed a, see Figure 4, yields to the following set of hyperbolic partial differential equations [12]:
2
2
0
1 02
h a Qt gA x
Qh Q Qx gA t gDA
λ
⎧∂ ∂+ ⋅ =⎪
∂ ∂⎪⎨∂ ∂⎪ + ⋅ + ⋅ =⎪∂ ∂⎩
(2)
The system (2) is solved using the Finite Difference Method with a 1st order centered
scheme discretization in space and a scheme of Lax for the discharge variable. This approach leads to a system of ordinary differential equations that can be represented as a T-shaped equivalent scheme [3], [7], [11] as presented in Figure 5. The RLC parameters of this equivalent scheme are given by:
22
Q dxR
g D A
λ ⋅ ⋅=
⋅ ⋅ ⋅
dxLg A
=⋅ 2
g A dxCa⋅ ⋅
= (3)
where λ is the local loss coefficient. The hydraulic resistance R, the hydraulic inductance
L, and the hydraulic capacitance C correspond respectively to energy losses, inertia and storage effects.
The model of a pipe of length L is made of a series of nb elements based on the equivalent scheme of Figure 5. The system of equations relative to this model is set-up using Kirchoff laws. The model of the pipe, as well as the model of valve, surge tank, Francis turbine, etc, are implemented in the EPFL software SIMSEN, developed for the simulation of the dynamic behavior of hydroelectric power plants, [5], [8]. The time domain integration of the full system is achieved in SIMSEN by a Runge-Kutta 4th order procedure.
Figure 4 Elementary hydraulic pipe of
length dx. Figure 5 Equivalent circuit of an elementary pipe of
length dx. The modeling approach based on equivalent schemes of hydraulic components is
extended to all the standard hydraulic components such as valve, surge tanks, air vessels, cavitation development, Francis pump-turbines, Pelton turbines, Kaplan turbines, pump, etc, see [5].

24th Symposium on Hydraulic Machinery and Systems 5
The simulation model of Figure 2 was initially designed using a time basis of dt=0.01 for the selection of the length of pipe element dx=a*dt, what leads to a large computation time if the integration time step is adapted to electrical systems, i.e. dt=0.0002s. In order to reduce this time, the simulation model of Figure 2 is simplified by: (i) using equivalent pipe for pipes in series and (ii) reducing the number of elements modelling each pipe.
The equivalent parameters, Ltot, Dequ and aequ are calculated according to length
conservation, inertia conservation and propagation time conservation. The equivalent dimensions are calculated as follows:
∑= itot LL ∑
=
2i
i
totequ
DL
LD
∑=
i
i
totequ
aL
La (4)
Where Ltot, Dequ and aequ are the total length, equivalent diameter and wave speed of the equivalent pipe. Then, the number of elements modelling each pipes has been reduced and the wave speed adapted in order to fulfil the CFL criteria: dt=dx/a. Using this simplification procedure, the number of pipe elements to model the entire system is reduced from 267 elements to 36 elements, i.e. by a factor 7.4. The resulting simplified simulation model is presented in Figure 6. The computation time obtained with the simplified model is reduced by a factor 10 compared to the initial model.
Figure 6 Simplified hydraulic system of the power plant.
To validate the simplified model, the simulation of an emergency shutdown in case of
servomotor failure on turbine 2 is simulated and compared with the results obtained using the initial model. The comparison of the transient behaviour of turbine 1 obtained with the 2 models is presented in Figure 7.
Figure 7 Transient behavior of pump-turbine 1.

24th Symposium on Hydraulic Machinery and Systems 6
It can be seen that the simulation results show very good agreement until the end of the
closure of the guide vanes and that small discrepancies appears after. The discrepancies are due to the difference in the wave speed between the initial and the simplified models that induces different propagation time of pressure waves in the hydraulic system. Nevertheless, the differences are sufficiently small to consider the simplified model as valid.
MODELING OF THE ELECTRICAL SYSTEM The complete model of the electrical system comprises a doubly - fed induction
generator, whose main parameters are presented in Table 2, with VSI (Voltage Source Inverter) cascade in the rotor side. This electrical system can be divided into two sections, a transformer section and a machine one, as identified in Figure 8.
Table 2 Rated values of the generator.
Figure 8 Electrical system of the power plant.
Transformer section operates as a Static Var Compensator (SVC), its main role being to
exchange reactive power with the grid. Indeed, this reactive power and the capacitors voltage can be controlled by acting on the transformer primary side currents through the left-side converter. The control structure is shown in Figure 9, see [1], [2].
Figure 9 Control structure of the transformer section.
The main role of the machine section is to control the speed of the machine. Indeed the
speed and the stator reactive power of the machine can be controlled by acting on the rotor currents through the right-side converter. The control structure is shown in Figure 10, see [1], [2].
Nn [t/min]
Sn [MVA]
Un [kV]
fn [Hz]
2p [-]
smax [%]
450 380 18 60 16 7

24th Symposium on Hydraulic Machinery and Systems 7
Figure 10 Control structure of the machine section.
Voltage Source Inverters require a very small integration step, which results in expensive
time consuming simulations. Simulation time can be considerably reduced by using a pseudo continuous approximation of the cascade, which consists in replacing the voltage source inverter on the rotor side by three controlled voltage sources and suppressing the inverter on the transformer side [6]. As there is no more physical link between the rotor and the grid, see Figure 11, the rotor power transit with the grid has to be taken into account through a calculation block included in the machine control. Using such pseudo-continuous model leads to a computation time reduction of factor 60 compared to the computation time obtained with the complete model. This gain is mainly due to the fact that semi-conductors elements featuring small time constants are replaced by voltage sources enabling to increase the integration time step, reducing the number of equations and avoid switch induced events.
Figure 11 Complete and pseudo continuous models.
CONTROL STRATEGIES
GENERATING MODE In generating mode, two control strategies are investigated. The first strategy is
illustrated in Figure 12 and considers turbine power governor and generator speed controller, see [4].
Figure 12 First strategy in generating mode with the power control structure.
The speed control structure is detailed in Figure 10. The power control structure is shown
in Figure 12 and consists of a PI type regulator whose output acts on the guide vane opening

24th Symposium on Hydraulic Machinery and Systems 8
through a servomotor. The maximum displacement speed of the servomotor is restricted by a rate limiter.
The second strategy is presented in Figure 13 and based on turbine speed governor and
generator power controller, see [4].
Figure 13 Second strategy in generating mode with the speed control structure.
The power control structure can be deduced from the structure detailed in Figure 10 by
simply replacing the speed control block by a power control block. The speed control structure is shown in Figure 13 and consists of a PID type regulator acting on the guide vane opening as explained before.
The power set point is imposed by the grid conditions and the speed set point is
calculated by a speed optimizer in order to maximize the turbine efficiency. This speed optimizer is a look-up table defined as a surface representing the optimal speed as a function of the power and the head. This surface is shown in Figure 14 and is calculated according to the procedure detailed in Figure 15. The optimum rotational speed is calculated from the dimensionless turbine characteristic, from which efficiency hill-charts are deduced as function of head and mechanical power for different rotational speeds Ni via interpolation process. For each combination of head and power in the operating range of the turbine, the rotational speed presenting the highest efficiency is selected. This approach provides the speed look-up table of Figure 14. It might be noticed that, as expected, the optimum rotational speed is the lowest for low power under low head, and is the highest for high power under high head.
Figure 14 Speed look-up table N=N(H/Hn, P/Pn).

24th Symposium on Hydraulic Machinery and Systems 9
Figure 15 Procedure for the calculation of the optimum speed surface.
PUMPING MODE For pumping mode, only one strategy based on generator power controller is possible;
the speed being defined in pumping mode if the head and power level are specified. Nevertheless it is possible to optimize the guide vane opening in order to improve the efficiency of the pump. A law yoptimum = f(N11) can be established from curves η = f(N11) considered for different guide vane opening values, see Figure 16 and Figure 17.
Figure 16 Identification of the law yoptimum = f(N11).
Figure 17 Law yoptimum = f(N11).
The strategy in pumping mode consists of a generator power controller similar to the one
developed for the second strategy in generating mode and of a guide vane opening optimization based on the law defined in Figure 17. This strategy is illustrated in Figure 18.
Figure 18 Strategy in pumping mode with the guide vane opening optimization structure.

24th Symposium on Hydraulic Machinery and Systems 10
SIMULATION RESULTS
TRANSIENT BEHAVIOR IN GENERATING MODE STRATEGY 1 The simulation results are presented for both strategies 1 and 2 in generating mode, for a
decrease of the active power set point of about 20% from the nominal operating point, while unit 1 is considered at standstill. As shown in Figure 19, the new speed set point is calculated instantly by the speed optimizer depending on the new power set point and the head. The new speed set point is reached very fast, in about 4s, because the speed is controlled by the electrical system, see Figure 20.
Figure 19 Power set point (red), filtered head (blue) and
speed set point (green) in (pu). Figure 20 Speed set point (red) and speed (blue) in (pu).
This speed diminution leads to a power injection in the grid resulting from the transfer of kinetic energy from the rotating inertia to the grid. This phenomenon, visible on Figure 21, is called flywheel effect. Then the power is slowly regulated by the turbine as illustrated in Figure 22. However, one can notice that the flywheel effect resulting from this control strategy 1 is detrimental for the grid stability as the output active power provided by the unit first increases and decreases only after 4s, see Figure 21. Moreover, the power output reaches the set point only after 20s. Nevertheless the transient behavior resulting from the quick change of rotational speed and guide vane change leads to acceptable head variations as shown in Figure 22. Indeed, the turbine head increase is only 8 % of the nominal head which is lower than the one (35 %) obtained in case of emergency shutdown and shown in Figure 7.
Figure 21 Power set point (red) and output power (blue)
in (pu).
Figure 22 Transient behaviour of the turbine in (pu).
Simulated results obtained by the first strategy show that the transient behavior (particularly the active power represented in Figure 21) resulting from the set point variation of the active power is not acceptable. The use of a rate limitation of the set point of the speed controller is necessary in order to avoid the undesirable transients of the active power. However such modification would increase the time to reach steady-state conditions and would be detrimental to the dynamic performances of the system.

24th Symposium on Hydraulic Machinery and Systems 11
STRATEGY 2 Concerning the second strategy, the new power set point is reached very fast, in less than
0.3 second because the power is controlled by the electrical system, as presented in Figure 23.
Figure 23 Power set point (red) and power (blue) in (pu).
This power diminution leads to an acceleration of the machine resulting from the
accumulation of kinetic energy in the rotating inertia. Then the speed is slowly regulated by the pump-turbine as shown in Figure 24 and Figure 25. As it is the case for the strategy 1, the transient behavior of the pump-turbine resulting from the rotational speed change and guide vane change leads to acceptable head variations (12 %) as shown in Figure 25.
Figure 24 Speed set point (red) and speed (blue) in
(pu).
Figure 25 Transient behaviour of the turbine in (pu).
It is finally interesting to compare the dynamic behavior resulting from strategies 1 and 2 in terms of both active power and rotational speed variations as presented respectively in Figure 26 and Figure 27. One can notice that the second strategy is capable of power set point changes about 84 times quicker than using the first strategy and therefore this strategy will be preferred. This difference is due to positive consequence of the flywheel effect in the second strategy.
Figure 26 Power set point (red), power with strategy 1 (blue), power with strategy 2 (green) in (pu).
Figure 27 Speed set point (red), speed with strategy 1 (blue), speed with strategy 2 (green) in (pu).

24th Symposium on Hydraulic Machinery and Systems 12
TRANSIENT BEHAVIOR IN PUMPING MODE The transient behaviour of Unit 2 while unit 1 is at stand still is simulated for a power set
point change of 10%. As it is the case for the strategy 2 in generating mode, the new power set point is reached very fast because the power is controlled by the electrical system, see Figure 28.
Figure 28 Power set point (red) and power (blue) in (pu).
The new speed is adapted, according to the new power level and the turbine net head.
The guide vane opening is optimized according to the law yoptimum = f(N11) in order to improve the efficiency of the pump within 10 seconds, as shown in Figure 29. The quasi instantaneous power set point change is again possible because of the flywheel effect inducing rotational speed decrease. It leads to a power injection in the network by decreasing the kinetic energy of the rotating inertias until new active power set point is reached. Again the resulting turbine head variations are acceptable as it is shown in Figure 29 left.
Figure 29 Transient behaviour of the pump in (pu).
CONCLUSION
This article presents the modeling of a 2x320 MW variable speed pump-turbine taking into account hydraulic, electrical, rotating inertias and control systems for transient analysis purposes. The complexity of both hydraulic and electrical models is reduced to enable fast computation time in order to meet requirements of control strategy optimization. Using a full hydroelectric simulation model, 2 control strategies in generating mode and one strategy in pumping mode are simulated and discussed. It appears that the strategy based on generator power control coupled with turbine speed control provides extremely high dynamic performances in full compatibility with safety requirements. Indeed, a 20% active power change can be achieved in 0.3s with this strategy; thanks to the flywheel effect. Similar results are obtained in pumping mode. Finally, variable speed pump-turbine power plants are shown to be very efficient in stabilizing power network due to high dynamic performances and it makes hydropower an ideal partner of highly volatile renewable energies sources such as wind power. Actual investments in large variable speed projects in Switzerland show that the

24th Symposium on Hydraulic Machinery and Systems 13
technology is considered economically interesting despite the larger investments in electromechanical equipment involved.
NOMENCLATURE A: pipe cross section area [m2] D: diameter [m] E: energy -to-weight ratio E=gH [J/Kg] H: head [m] J: inertia [kg/m2] Q: discharge [m3/s] N: rotational speed [rpm] P: Power [W] R: radius [m] S: apparent power [VA] T: Torque [Nm] U: voltage [V] a: wave speed [m/s] f: frequency [Hz] g: gravity [m/s2] h: rated head [-]
n: rated speed [-] p: rated power [-] p: number of pair poles [-] q: rated discharge [-] s: slip [-] t: rated torque [-] y: rated guide vane opening [-] η: efficiency [-] λ: friction losses coefficient [-] ω: rotational pulsation [rd/s] ϕ: discharge factor 3/( )refQ Rϕ πω= [-]
ψ: energy–to-weight factor 2 22 /( )refE Rψ ω= [-]
ν: turbine specific speed 1/ 2 3/ 4ν ϕ ψ= [-]
ACKNOWLEDGMENT The authors would like to gratefully thank the partners of this project ALSTOM Power Hydro in Birr, Switzerland and in Grenoble, France for their financial support and assistance. The authors also would like to thank the CTI, Swiss Federal Commission for Technology and Innovation, for its funding under contract award No 8330.
REFERENCES [1] HODDER, A., 2004, Double-fed asynchronous motor-generator equipped with a 3-
level VSI cascade, Thesis EPFL n° 2939, Switzerland, Lausanne (http://library.epfl.ch/theses/?nr=2939).
[2] HODDER, A., SIMOND, J.-J., SCHWERY, A., 2008, Double trouble, Industry Applications Magazine, IEEE Volume 14, Issue 2, March-April 2008, pp. 32 – 39.
[3] JAEGER, R. C., 1977, Fluid transients in hydro-electric engineering practice, Glasgow: Blackie.
[4] KOPF, E., BRAUSEWETTER, S., GIESE, M., MOSER, F., June 29-July 2, 2004, Optimized control strategies for variable speed machines, In Proceeding of the 22nd IAHR Symposium on Hydraulic Machinery and Systems, Sweden, Stockholm.
[5] NICOLET, C., 2007, Hydroacoustic modelling and numerical simulation of unsteady operation of hydroelectric systems, Thesis EPFL n° 3751, Switzerland, Lausanne (http://library.epfl.ch/theses/?nr=3751).
[6] PANNATIER, Y., NICOLET, C., KAWKABANI, B., SIMOND, J.-J., ALLENBACH, P., 2008, Dynamic Behavior of a 2 Variable Speed Pump-Turbines Power Plant, Proc. of ICEM, Vilamoura, Portugal, Sept. 2008.
[7] PAYNTER, H. M., 1953, Surge and water hammer problems, Transaction of ASCE, vol. 146, p 962-1009.

24th Symposium on Hydraulic Machinery and Systems 14
[8] SAPIN, A., 1995, Logiciel modulaire pour la simulation et l’étude des systèmes d’entraînement et des réseaux électriques, Thesis EPFL n° 1346, Switzerland, Lausanne (http://library.epfl.ch/theses/?nr=1346).
[9] SCHWERY, A., FASS, E., HENRY, J-M., BACH, W., MIRZAIAN, A., 2005, Pump storage power plants, ALSTOM’s long experience and technological innovation, Hydro 2005, Villach, Austria
[10] SIMOND, J.-J., SAPIN, A., SCHAFER, D. 1999, Expected benefits of adjustable speed pumped storage in the European network, Hydropower into the next century, pp. 579-585, Gmunden, Austria.
[11] SOUZA, O. H., JR., BARBIERI, N., SANTOS, A.H.M., 1999, Study of hydraulic transients in hydropower plants through simulation of nonlinear model of penstock and hydraulic turbine model, IEEE Transactions on Power Systems, vol. 14, issue 4, pp. 1269 – 1272.
[12] WYLIE, E. B. & STREETER, V.L., 1993, Fluid transients in systems, Prentice Hall, Englewood Cliffs, N.J.