
Transient 2017/ ISSN - 2250-0650€¦ · ii Transient 2017/ ISSN - 2250-0650 TRANSIENT A Journal of...
116
1 Transient 2017/ ISSN - 2250-0650
Transcript of Transient 2017/ ISSN - 2250-0650€¦ · ii Transient 2017/ ISSN - 2250-0650 TRANSIENT A Journal of...
1
Transient 2017/ ISSN - 2250-0650


i
Transient 2017/ ISSN - 2250-0650
TRANSIENTA Journal of Natural Sciences and Allied Subjects
(a peer reviewed journal)VOLUME VI
2017
DON BOSCO COLLEGE, TURAMeghalaya, India
ii
Transient 2017/ ISSN - 2250-0650
TRANSIENTA Journal of Natural Sciences and Allied Subjects
(a peer reviewed journal)VOLUME VI - 2017
1. Prof D K Singh, Dept of Vegetable Science, G B Pant University of Agriculture and Technology, India
2. Prof O P Singh, Department of Environmental Sciences, North Eastern Hill University, Shillong India
3. Prof B Koikara, Department of Mathematics, Assam Don Bosco University, In-dia
4. Prof R K Singh, Department of Physics, Banaras Hindu University, Varanasi, India
5. Prof P R Alapati, Department of Physics, North Eastern Regional Institute of Science and Technology, India
6. Prof G Bez, Department of Chemistry, North Eastern Hill University, Shillong, India
7. Prof C R Bhattacharjee, Department of Chemistry, Assam University, Silchar, India
8. Prof B Roy, Department of Zoology, North Eastern Hill University, Shillong, India
9. Prof B Deb, Department of Materials Science, Indian Association for the Culti-vation of Science (IACS), Jadavpur, Kolkata, India
10. Dr (Mrs) P Ramanujam, Associate Professor, Department of Botany, North Eastern Hill University, Shillong, India
11. Dr D C Kalita, Associate Professor, Department of Rural Development and Agricultural Production, North eastern Hill University, Tura Campus, Tura, Meghalaya, India
12. Dr (Mrs) J R Das, Center for Genetic Medicine, Children’s National Medical Center, The George Washington University School of Medicine, Washington DC, USA
13. Dr J C Dang, Associate Professor, Department of Botany, Don Bosco College, Tura, Meghalaya, India
ADVISORY BOARD MEMBERS
iii
Transient 2017/ ISSN - 2250-0650
JOURNAL OFFICIALS/OFFICE BEARERS
EDITORIAL BOARD MEMBERS
CONTRIBUTORS
Chief Editor: Dr Biswajit Paul
Editorial Board Members:Dr Ratan Chakraborty Smt Lilybell MarakDr Madhusudhan Saha Shri Samrat DeyShri Habul Ch Das Shri Sanjeev LyngdohDr Arindam Ghosh Dr Yubaraj SharmaDr Anup Paul
Debashish Borah and Chira R Bhattacharjee*Department of Chemistry, Assam University, Silchar 788011, IndiaE-mail: [email protected]
Ayon BhattacharjeeDepartment of PhysicsNational Institute of Technology Meghalaya, Shillong 793003E-mail: [email protected]
Mautushi Das1*, Monalisha D Sangma1 and P Ramanujam2
1University of science and Technology, Baridua, Meghalaya, India2North Eastern Hill University, Shillong, Meghalaya, IndiaE-mail: [email protected]
Joyoshree Mahanta1*and A S Singh2
1KVK, ICAR, West Garo Hills, Meghalaya, India2 Senior Scientist and Head (i/c), KVK, ICAR, West Garo Hills, MeghalayaE-mail: [email protected]
Chief Patron: Fr. Bivan Rodrigues Mukhim, sdb, Principal, Don Bos-co College, Tura,
Patron: Fr. Albert T Sangma, sdb, Vice Principal, Don Bosco College, Tura,
Publication Manager: Shri Mridul Barman, Dept of Commerce, Don Bosco College, Tura,

iv
Transient 2017/ ISSN - 2250-0650
Krishnakhi Choudhury1* and Dr D C Kalita1
1Department of Rural Development and Agricultural Production, NEHU, Tura Campus, TuraEmail: [email protected]
N Uttam Singh1*, Kishore K Das2, A Roy1, Anjoo Yumnam1, P K Sinha1, Bagish Kumar1 and A K Tripathi1
1ICAR Research Complex for NEH Region, Umiam, Meghalaya2Department of Statistics, Gauhati University, Guwahati, AssamE-mail: [email protected]
Mokidul IslamKrishi Vigyan Kendra, Ri-BhoiICAR Research Complex for NEH RegionUmroi Road, Umiam-793103, MeghalayaE-mail: [email protected]
D Maibam1*, Y Sharma2, A Khardewsaw1, A Saxena1
1Department of Physics, NEHU, Shillong, Meghalaya, India2Department of Physics, Don Bosco College, Tura, Meghalaya, IndiaE-mail: [email protected]
Mithu SahaState Key Laboratory of Physical Chemistry of Solid Surfaces and College of Chem-istry and Chemical Engineering, Xiamen University, Xiamen 361005, China.E-mail: [email protected]
Sandeep Kumar Dey Department of Chemistry, Goa University, Taleigao Plateau, GoaE-mail: [email protected]
Nalanda BalaMurugan* and Birendra Kumar Mishra1Department of Rural Development and Agricultural Production, North Eastern Hill University, Tura Campus, Tura, Meghalaya, IndiaE-mail: [email protected]
v
Transient 2017/ ISSN - 2250-0650
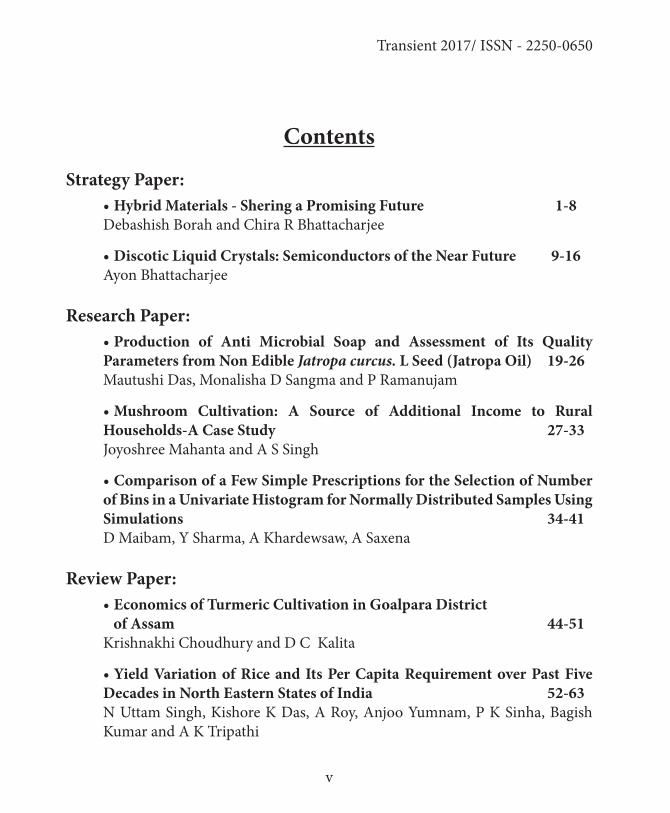
Contents
Strategy Paper:• Hybrid Materials - Shering a Promising Future 1-8 Debashish Borah and Chira R Bhattacharjee
• Discotic Liquid Crystals: Semiconductors of the Near Future 9-16 Ayon Bhattacharjee
Research Paper:• Production of Anti Microbial Soap and Assessment of Its Quality Parameters from Non Edible Jatropa curcus. L Seed (Jatropa Oil) 19-26 Mautushi Das, Monalisha D Sangma and P Ramanujam
• Mushroom Cultivation: A Source of Additional Income to Rural Households-A Case Study 27-33 Joyoshree Mahanta and A S Singh
• Comparison of a Few Simple Prescriptions for the Selection of Number of Bins in a Univariate Histogram for Normally Distributed Samples Using Simulations 34-41 D Maibam, Y Sharma, A Khardewsaw, A Saxena
Review Paper:• Economics of Turmeric Cultivation in Goalpara District of Assam 44-51 Krishnakhi Choudhury and D C Kalita
• Yield Variation of Rice and Its Per Capita Requirement over Past Five Decades in North Eastern States of India 52-63 N Uttam Singh, Kishore K Das, A Roy, Anjoo Yumnam, P K Sinha, Bagish Kumar and A K Tripathi
vi
Transient 2017/ ISSN - 2250-0650
• Prospects of Quality Protein Maize (QPM) Production for Food and Nutritional Security -An Overview 64-80 Mokidul Islam
• Magnetite (Fe3O4/Fe2O3): An Efficient Catalyst for the Multicomponent Reactions 81-90 Mithu Saha
• Metal Complexes of Dipyrrolylquinoxaline-based Receptors for Anion Sensing 91-97 Sandeep Kumar Dey
Short Communication:• Fermented Food and Beverage of the Ethnic Tribes of West Garo Hills, Meghalaya 100-103 Nalanda Bala Murugan and Birendra Kumar Mishra

Transient 2017/ ISSN - 2250-0650
STRATEGY PAPER

Transient 2017/ ISSN - 2250-0650
1
Transient 2017/ ISSN - 2250-0650
Hybrid Materials - Ushering a Promising Future
Debashish Borah and Chira R Bhattacharjee*Department of Chemistry, Assam University, Silchar 788011, India
E-mail: [email protected]
Hybrid materials also referred to as ‘composites’ consists of two constituents (inorganic – organic) at the nanome-ter or molecular level. Hybrid materials differ from the traditional composites in which the constituents are at the macro-scopic level (micrometer to millimeter). Composites accessed at the microscopic scale are more homogeneous materi-al revealing characteristics of both the original phases or even new properties. Usually, the inorganic component pro-vides mechanical strength and the or-ganic part connects the inorganic build-ing blocks and/or the soft tissue. Bones or nacre is typical examples of such ma-terials. The field of functional nanoscale hybrid materials is one of the most promising and rapidly emerging areas in materials chemistry.
Nanoscale hybrid materials can be broadly defined as synthetic materials with organic and inorganic components
linked together by noncovalent bonds (Class I, linked by hydrogen bond, elec-trostatic force, or van der Waals force) or covalent bonds (Class II) at nanometer scale. The wide range of possiblities of combinations of the distinct properties of inorganic, organic, or even bioactive components in a single material have been a fascinating aspect of such ma-terials. Vast number of novel advanced materials possessing structures that are well defined with variety of functions furnishes immense opportunities for practical innovations. The field of appli-cations include optoelectronic materials, biomaterials, catalysis, sensing, coating, and energy storage. The preparative methods, evaluation procedures, the sta-bility mechanisms, and their potential applications in heat transfer intensifica-tion, mass transfer enhancement, energy fields, mechanical fields, and biomedical fields are of widespread interests.
2
Transient 2017/ ISSN - 2250-0650
The obvious advantages of hybrid materials over traditional composites are -
• Inorganic clusters or nanoparticles with specific optical, electronic or magnetic properties can be incorporat-ed in organic polymer matrices.
• While pure inorganic materials often require a high temperature treatment for their synthesis, processing, hybrid materials due to their higher organic content or cross linked inorganic net-works from small molecular precursors are much softer and readily processed at a relatively lower temperature.
• Hybrid materials and nanocompos-ites are optically more transparent. [1]
Development of state-of-the-art low cost electrocatalysts using commercially available precursors is important crite-rion in the advancement of next-gen-eration electrochemical energy storage/conversion systems. Noble metal-free and graphene-supported nanocom-posites are of are considered excellent candidate as energy-device and sen-
sor-related electrode materials for their high electrical conductivity, large spe-cific surface area, high-speed electron/heat mobility, and reasonably good me-chanical strength. In the wide domain of graphene based hybrid materials, graphene-metal oxide nanohybrids hold great promise toward engineering effi-cient electrocatalysts drawing attention of scientific communities and industrial partners internationally [1-4]. There are several advantages - firstly, the large sur-face area and 2D flexibility of graphene nanosheets can offer sufficient space to accommodate different nanomaterials and prevent their agglomeration; sec-ondly, due to the good superficial char-acteristics of graphene, solid-air contact efficiency increases enhancing oxygen adsorption; third, the electrical conduc-tivity of graphene promotes the electron transfer rate on the surface. The struc-tural defects of graphene also provide more active sites for newer modification by different functional groups promot-ing selective electrocatalysis [5]. Most metal oxides nanomaterials TiO2, Fe2O3, Co3O4, MnO2, CuO, NiO, ZnO have been incorporated in graphene forming nanohybrids.

3
Transient 2017/ ISSN - 2250-0650
Figure 1. Illustration of the MW-assisted synthesis of CuO nanoparticle sup-ported on S-doped graphene/SG and CuO/SG on glassy carbon electrode for glu-cose sensing. (Y. Tian, Y. Liu, W. Wang, X. Zhang, and W. Peng, Electrochim. Acta, 2015,156, 244.)
Various chalcogenide quantum dots (QDs) such as CdS, ZnS, Cu2S, MoS2, Sn3S4, and CdTe have been successful-ly immobilized on graphene by hydro-thermal methods. These semiconduc-tor hybrid nanostructures have drawn enormous interests due to their tremen-dous potential in optoelectronic, mag-netic, and catalytic applications. Specif-ically, for biological applications, QDs provide a high quantum yield (0.1- 0.8 [visible], 0.2-0.7 [NIR] vs 0.5−1.0 [visi-ble], 0.05−0.25 [NIR] for organic dyes), high molecular extinction coefficients (~10−100× that of organic dyes), broad absorption with narrow symmetric pho-
toluminescence spectra (full-width at half-maximum ~25−40 nm) spanning from ultraviolet (UV) to NIR, high re-sistance to photobleaching, and excep-tional resistance to photo- and chemical degradation. Size-tunable fluorescence emission and the broad excitation spec-tra of QDs offer significant advantage over molecular dyes [6]. Some transi-tion metal nitrides exhibit noble-met-al-like behaviors toward the reduction of tri-iodide ions because of their similar electronic structures and hence can be utilized as low-cost and platinum-free counter electrode in dye-sensitized solar cells (DSSCs). Highly ordered titanium
4
Transient 2017/ ISSN - 2250-0650
nitrides (TiN), with high electrical and thermal conductivity, high catalytic ac-tivity as well as low-temperature super-conductivity, are excellent alternatives as counter electrodes for DSSCs. But TiN electrode is not as efficient due to low electrical conductivity because of elec-tron transport barrier across the bound-aries of TiN nanocrystallites. Titanium nitride/graphene hybrid has been pre-pared and demonstrated comparable catalytic ability for triiodide ions reduc-tion with Pt counter electrode in DSSCs [7]. Development of a facile approach for the synthesis of Au-reduced graphene oxide (RGO) nanohybrids with uniform distribution of Au NPs over RGO. High surface area and negative surface charge renders Au-RGO nanohybrids highly ef-ficient for dye removal through electro-static and π–π interactions [8].
Another interesting facet is the in-corporation of nanomaterials into the self-assembly of discotic liquid crystals exploring new functional materials and realize their technological applications.
The liquid crystal field has witnessed a paradigm shift with the advent of na-noscience and nanotechnology. Liquid crystal- nano composites is an emerging area of research dealing with the symbi-otic association between liquid crystals and nanoscience. Thermotropic(tem-perature dependent) as well as lyotropic (concentration dependent) liquid crys-tals have been employed in recent times to access nano-LC hybrids. Dispersion of nanoparticles into liquid crystals is a captivating area of research [9]. The Liquid crystal (LC)-nano hybrid materi-al allows for investigation of a mutual-ly beneficial combination of the unique properties of the individual entities of liquid crystals and nanomaterials. Mod-ulation of nanoparticle properties using LCs as well as tuning the LC properties through nanomaterial has been an at-tractive option for researchers as such hybrid materials are anticipated to be very useful in many high performance device applications viz. photoconduc-tors, light emitting diodes, photo-voltaic solar cells, thin film transistors, etc. [10].
5
Transient 2017/ ISSN - 2250-0650
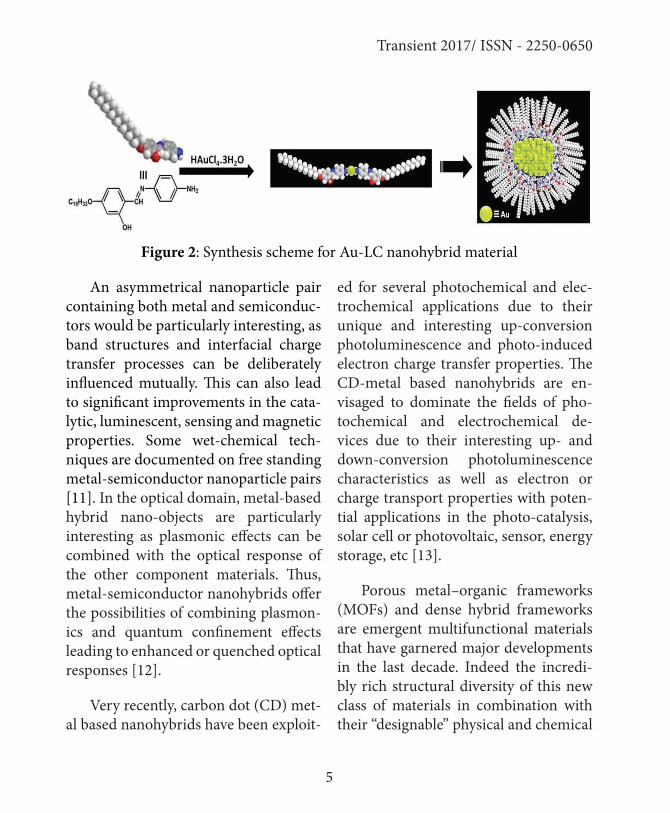
Figure 2: Synthesis scheme for Au-LC nanohybrid material
An asymmetrical nanoparticle pair containing both metal and semiconduc-tors would be particularly interesting, as band structures and interfacial charge transfer processes can be deliberately influenced mutually. This can also lead to significant improvements in the cata-lytic, luminescent, sensing and magnetic properties. Some wet-chemical tech-niques are documented on free standing metal-semiconductor nanoparticle pairs [11]. In the optical domain, metal-based hybrid nano-objects are particularly interesting as plasmonic effects can be combined with the optical response of the other component materials. Thus, metal-semiconductor nanohybrids offer the possibilities of combining plasmon-ics and quantum confinement effects leading to enhanced or quenched optical responses [12].
Very recently, carbon dot (CD) met-al based nanohybrids have been exploit-
ed for several photochemical and elec-trochemical applications due to their unique and interesting up-conversion photoluminescence and photo-induced electron charge transfer properties. The CD-metal based nanohybrids are en-visaged to dominate the fields of pho-tochemical and electrochemical de-vices due to their interesting up- and down-conversion photoluminescence characteristics as well as electron or charge transport properties with poten-tial applications in the photo-catalysis, solar cell or photovoltaic, sensor, energy storage, etc [13].
Porous metal–organic frameworks (MOFs) and dense hybrid frameworks are emergent multifunctional materials that have garnered major developments in the last decade. Indeed the incredi-bly rich structural diversity of this new class of materials in combination with their “designable” physical and chemical
6
Transient 2017/ ISSN - 2250-0650
properties has caught the imagination of scientists, engineers and technologists from multiple cognate disciplines. By virtue of their immense versatility and functionalities, a number of promising applications have already been proposed many of which aimed at challenging in-dustrial sectors, e.g. energy harvesting and storage, biomedicine, sensing and microelectronics, carbon capture and environmental sustainability.
Search for advanced hybrid materi-als has generated cutting-edge research at the interface where crystalline engi-neering meets materials science, chem-istry, solid-state physics and biology [14].
Currently, the most intricate tech-nological challenges are - the need to reduce fossil fuel consumption and to capture CO2 - producing hydrogen fuel from water, to efficiently sequester and store CO2, and improve energy storage and rechargeable batteries have engaged the attention of present researchers. Mi-croelectronics and smart technologies based on advances in optoelectronics, actuation and sensing are the key cur-rent issues having bearing on the devel-opment of public health and medicine, inexpensive, benign and efficient water desalination methods, drug encapsula-tion and targeted delivery technologies.
An exciting class of materials called metal organic frameworks (MOFs) first developed in the 1990s is crystalline hy-brid materials accessed from both or-ganic and inorganic molecules via mo-lecular self-assembly. Their fabrication involves linkers - long chains, typically of carbon and hydrogen oxides decorat-ed with nitrogen atoms - and positively charged metal ions, which form nodes that bind the arms of the linkers togeth-er. Strategically the linker and metal are heated in a solvent for anything from hours to days until they settle into an orderly MOF structure. These MOFs have been processed into porous fabrics, glass, flexible thin films and biocompat-ible membranes. Given the large vari-ations in metals and solvents that can be employed, MOFs have emerged as highly diverse chemical and structural make ups that suit specific functional-ities. The enormous surface areas with-in their 3D open-framework structures are the highest of any known materials. MOFs are also extremely light - a pea-sized gram of MOF material can host the equivalent surface area of 40 tennis courts as most of their bulk is empty space. These material offers perfectly re-peating networks of functionalized, mo-lecular-scale cages, which can be tuned in size and shape to serve a specific func-tion by adapting their chemistry[15].The MOFs are crystalline hybrid ma-
7
Transient 2017/ ISSN - 2250-0650
terials constructed from inorganic and organic building blocks and accessed via the fundamental process of self-assem-bly at the molecular level. The result-ing nanoporous materials encompass a myriad of 3D open-framework struc-tures which vast chemical and structural diversity. The current research activities on MOF - materials are quite vibrant with cross-cutting disciplines capturing the attention and imagination of sci-entists, researchers and technologists alike. The option and handle to precisely control and functionalize the nanosized pore volume to afford unique multi-functional properties, unconventional physicochemical and thermomechani-cal characteristics have opened up new vistas for exploring multiple branches of chemistry, cognate fields of materi-als science, nanotechnology, physics, biology, medicine, and environmental engineering. Multitude of applications related to gas adsorption characteristics, selective separations and gas storage capacities; luminescence and chemical sensing response; ferroelectric, magnet-ic, and catalytic properties of MOFs are anticipated to evolve [16-21].
Conclusion
In conclusion, research related to hybrid materials have made tremendous progress in establishing a very prom-
ising field, which is now at a crossroad destined to make a significant impact in the future technology sector in turn bringing dramatic development in our modern living style in tandem with keeping a balance with the environment and energy. It is indeed exhilarating to anticipate smart applications and new innovations that are yet to be achieved next, and to realise the applications on a sustainable and commercial scale. In-tense research in forthcoming years, discovery of newer materials and related fundamental studies will certainly hold key to such prospects.
References
[1] Geim A K and Novoselov K S 2007. Nat. Mater. 6:181
[2] Dreyer D R, Park S, Bielawski C W and Ruoff R S 2010. Chem. Soc. Rev. 39:228
[3] Zhu Y, Murali S, Cai W, Li X, Suk J W, Potts JR and Ruoff RS 2010. Adv. Mater.22:3906
[4] Huang X, Yin Z, Wu S, Qi X, He Q, Zhang Q, Yan Q, Boey F and Zhang H 2011. Small. 7:1876
[5] Halder A, Zhang M and Chi Q 2016. Current Trends. 380

8
Transient 2017/ ISSN - 2250-0650
[6] Yin P T, Shah S, Chhowalla M and Lee K 2015. Chem. Rev. 115:2483
[7] Wang R, Wu Q, Lu Y, Liu H, Xia Y, Liu J, Yang D, Huo Z and Yao X 2014. ACS Appl. Mater. In-terfaces. 6:2118
[8] Kar P, Sardar S, Liu B, Sreemany M, Lemmens P, Ghosh S and Pal SK 2016. Sci. Technol. Adv. Mater. 17:376
[9] Kumar S and Sagar L K 2011. Chem. Commun. 47:12182
[10] Das N, Acharya H, Prasad S K, Rao D S S and Bhattacharjee C R 2017. Liq.Cryst. (DOI: 1080/02678292.2017.1370144)
[11] Kala S, Theissmann R, Rouenhoff M and Krui, FE 2016. Nano-technology. 27:125604
[12] Mongin D, Shaviv E, Maioli P, CRUT A, Banin U, Fatti N D and Vallee F 2012. ACS Nano. 6:7034
[13] De B and Karak N 2016. J. Mater. Chem. 5:1826
[14] Tan J-C and Civalleri 2015. Cryst Eng Comm. 17:197
[15] Frost S. 3 Oct 2016. Materials World magazine
[16] Ryder M R and Tan J-C 2014. Mate-rials Science and Technology. 30:1598
[17] Furukawa H, Cordova K E, O’Keef-fe M and Yaghi O M 2013. Sci-ence. 341:974
[18] Cheetham A K, Rao C N and Fell-er R K 2006. Chem. Commun. 4780
[19] Banerjee R, Phan A, Wang B, Kno-bler C, Furukawa H, O’Keeffe M and Yaghi O M 2008. Sci-ence. 319:939
[20] Hoskins B F and Robson R 1990. J. Am. Chem. Soc. 112:1546
[21] Tranchemontagne D J, Mendo-za-Cortes J L, O’Keeffe M and Yaghi O M 2009. Chem. Soc. Rev.38:1257
9
Transient 2017/ ISSN - 2250-0650
Discotic Liquid Crystals: Semiconductors of the Near Future.
Ayon BhattacharjeeDepartment of Physics, National Institute of Technology Shillong, Meghalaya - 793003E-mail: [email protected]
These days everybody is using a large variety of electronic devices such as notebook and tablet computers, smart phones, digital cameras, MP3 players, flat panel TVs, as well as embedded systems in household appliances, auto-mobiles, and large industrial facilities. However, there is still an urgent need for downsizing such electronic equipment in order to save costs, space, weight, raw materials and more importantly energy and the carbon footprint. While calamit-ic (rod-like) liquid crystals have already contributed a lot to this development such as in large area flat panel displays, their corresponding discotic (disk-like) counterparts, besides some selected ap-plications as optical compensator films for LCD and gas sensors, are still in the proof-of concept device state. Nev-ertheless, a lot of progress has been in this field and extensive research efforts world wide have been devoted to the development of such novel materials.
There is a focussed effort in understand-ing of structure−property relationships in order to tailor compounds with de-sirable mesomorphic and other physical properties for the use of discotic liquid crystals asanisotropic organic semicon-ductors in organic field effect transistors (OFETs), organic light emitting diodes (OLEDs), and organic photovoltaic de-vices (OPVs). The discussion of discot-ic liquid crystals started in 1923, when Vorlander suggested the possibility of liquid crystalline phases with a pack-ing behaviour similar to “Voltas col-umns”while studying flat molecules such as triphenylene and perylene. Un-fortunately, he was not able to observe any mesomorphism (liquid crystalline behaviour) for these compounds, which were later recognized as the archetypal core units of many discotics. The ex-perimental breakthrough came in 1977, when Chandrasekhar published his findings on the mesomorphic properties
10
Transient 2017/ ISSN - 2250-0650
of benzene-hexa-n-alkanoates, which were studied by differential scanning calorimetry (DSC), polarizing optical microscopy(POM), and X-ray diffrac-tion (XRD). This is today considered as the birth of discotic liquid crystals. Be-sides this first observation of thermo-tropic mesomorphism of a disk-shaped molecule, Chandrasekhar made a com-ment in the introduction of his seminal paper, which must be considered from retrospective as a statement of great foresight. He wrote that “Mesophases composed of large plate-like molecules are known to occur at high tempera-tures during the carbonization of graph-itizable substances, such as petroleum and coal tar pitches, but these are rather complex materials and certainly cannot be regarded as single-component liquid crystalline systems.” Thus, Brooks and Taylor, who already in 1965 described mesophases consisting of planar aro-matic compounds of high molecular weight as well as Zimmer and White, who reported on disclinations in the carbonaceous mesophase and propose-da model with lamellar organization can be considered as the grandfathers of graphene and polycyclicaromatic hydrocarbon derived columnar liquid crystals, which have received enormous interest over the last two decades due to their high electronic charge carrier
mobility up to1.1 cm2 V−1 s−1, which is comparable to amorphous silicon. How-ever, not only potential applications of discotic liquid crystals have driven the research but also basic questions regard-ing the origin of self-assembly in such systems. According to the classical view, liquid crystalline phases appear due to strong interactions between π-conjugat-ed cores that are counter-balanced by the thermal motion of the alkyl chains thus inhibiting crystallization into a 3D structure with true 3D long-range trans-lational and orientational order. Thus, it was generally thought that shape-aniso-tropic rod-like molecules prefer the formation of nematic or smectic me-sophases, whereas disk-shaped mole-cules favour the self-assembly into1D columns eventually leading to 2D co-lumnar mesophases with 1D long-range orientational order and 2D translation-al order or alternatively into 3D cubic mesophases. However, with the occur-rence of non conventional mesogens, which are neither rod-nor disk-shaped, such as polyphilic mesogens, the signif-icance of nano segregation between ar-omatic cores and alkyl chains as driving force for mesophases formation became commonly accepted. Therefore, incom-patible side chains (alkyl, oligoethylene glycol, perfluoroalkyl, etc.) can induce liquid crystalline phases.
11
Transient 2017/ ISSN - 2250-0650
Structures of Discotic Liquid Crys-tals
The basic structures of discotic liq-uid crystals are:
Columnar Stacking: The stacking of the disk-like mesogens of discotic liquid crystals into 1D columns is fundamen-tal for their most common phases. The columns are in the ideal case of infinite length and the molecules in a column exhibit only short-range positional or-der. The mesogens with their rigid, rel-atively flat cores self-organize into col-umns. This is caused by steric packing and π−π interactions between the cores. As a result of the high entropy and disor-der of the flexible aliphatic chains on the periphery, the formation of a 3D crys-tal is hindered. The columnar stacking also leads to nano segregation between the cores and the tails. Different types of stacking can be found in the columns: There are “disordered columns” with irregular stacking of the disks, “ordered columns” where the cores are equidis-tant while the flexible alkyl-tails are still disordered as well as “tilted columns” with the cores of the disks being tilted with respect to the column axis. All these columns do not exhibit true 1D-transla-tional order and can therefore be con-sidered as 1D-fluids.
Nematic Phases: Nematic phases (also called the ND) are the simplest liq-
uid crystalline phases formed since they only have long-range orientational order (of molecules, columns, etc.) and no de-gree of long-range translational order. For discotic molecules different kinds of nematic phases are known. In a dis-cotic nematic mesophase ND the nem-atic phase is built of single flat molecules which possess full translational and ori-entational freedom around their princi-pal short axes. Their long axes however are on average oriented parallel to a gen-eral plane in contrast to the rather waxy columnar phases the nematic phases are fluid. There is also a chiral variant of the discotic nematic phase known as the cholesteric phase ND* which is formed by chiral discotic mesogens or after the addition of a chiral dopant to an achi-ral discoticnematic phase. It exhibits a twisted nematic structure where the di-rector field is continuously twisted in the direction normal to the local directions (r) with the pitch p of the helical struc-ture. The columnar nematic mesophase Nc is formed out of columns as building blocks. The columns arrange parallel to each other in a columnar nematicme-sophase and therefore exhibit position-al short-range and orientational long-range order. Besides these two nematic phases also the lateral nematic phase NL has been reported. The lateral nematic phase is built of aggregates formed by multiple discoticmesogens. These su-pra-molecular aggregates then organize
12
Transient 2017/ ISSN - 2250-0650
into a nematic phase one direction but also in two additional mutually perpen-dicular directions. These biaxial nematic phases are known for quite some time in lyotropic, polymeric, and more re-cently in mineral liquid crystals. In the case of discotic liquid crystals the for-mation of a biaxial nematic phase is ex-pected in mixtures of rod- and disc-like mesogens. This mixing of rod- and disc like molecules was investigated by many groups using computer simulation. In these simulations the occurrence of a bi-axial nematic phase was shown.
Columnar Phases: Discoticme-sogens tend to form columns that are the building blocks of the columnar phases. In these phases, the columns or-der in a 2D-lattice with the column axes being parallel to each other. Due to the arrangement of the columns in a 2D-lat-tice, columnar phases can be considered as 1D fluid (along the columns) and 2Dcrystalline (along the 2D lattice vec-tors). Depending on the crystal system hexagonal (Colh), rectalgular (Colr) or oblique (Colob) phases are distin-guished.
Lamellar Mesophase: In a lamel-lar mesophase DL the mesogens are or-dered in layers like in calamitic smectic phases. The structure of the lamellar mesophase is still not completely under-stood. Recently lamellar discotic phases were observed for triphenylenesilanes
by Mansueto et al. and in dimeric dis-cotic mesogens by Prasad et al. and Ong et al.
Intra-columnar Helical: Order Unique macroscopic chirality effects in liquid crystals such as helicity and fer-ro electricity have been widely investi-gated in the case of rod-like calamitic mesogens since many years. In chiral nematic (cholesteric) or chiral smectic C (SmC*) phases of rod-like molecules the helical structures (as well as the sponta-neous electric polarization of the SmC* layers) originate from the molecular chirality of the mesogens. In the more recently discovered case of bent-core (“banana-shaped”) mesogens, however, spontaneous a chiral symmetry breaking results from steric interactions and close chiral packing of inherently non chiral but bent-shaped mesogens. This partic-ular case of supra-molecular chirality gives rise to a plethora of chirality relat-ed phenomena such as the spontaneous formation of chiral domains, polar elec-tro-optics witching, electric-field-driv-en deracemization, and helicalnano-fil-ament phases. In comparison to their calamitic counterparts, the understand-ing of chirality effects and helical struc-tures in discotic liquid crystals is not so far developed, even though indications of an intra-columnar helical structure in nonchiral hexa-alkoxytriphenylenes were found by Levelut et al. as early as in 1979, only two years after the discov-
13
Transient 2017/ ISSN - 2250-0650
ery of discotic liquid crystals by Chan-drasekhar et al.
Ferroelectric Columnar Liquid Crys-tals: Pyroelectric crystals have nonzero electric polarization even in the absence of an electric field. This polarization is thus denoted as spontaneous electric po-larization Ps. If the direction of Ps can be switched by an external electric field be-tween two stable states of equivalent en-ergy, the material is called ferroelectric. Pyro- and ferro-electricity are by sym-metry allowed only in media belonging to the ten polar point groups, namely Cs, Cn (n = 1, 2, 3, 4, and 6), and Cnv (n = 2, 3, 4, and 6). As ferro-electricity requires long-range dipole correlations it was be-lieved that it is unique to the crystalline state of matter. In 1974 however, Meyer realized that a smectic C phase of chi-ral (rod-shaped) molecules has indeed polar C2 symmetry and thereby enables a spontaneous electric polarization in a fluid, liquid-crystalline state of matter. The pioneering work of Meyer et al. set-off a whole new field of liquid crystal research, namely that on ferro-electric, and lateral so anti-ferroelectric liquid crystals. Following the symmetry ar-gument from Meyer, columnar phases of tilted, disc-shaped and chiral mole-cules also have polar C2-symmetry and should thus allow the appearance of a spontaneous electric polarization along the polar C2 axis, transverse to the col-umn axis
Charge Transport Properties
Discotic Liquid Crystals are des-tined to become the Organic Semicon-ductors in near future. Organic semi-conductors differ in many aspects from in organic semiconductors In inorganic semi-conducting materials, like e.g. sili-con, all atoms are arranged on the fixed sites of a crystal lattice. Because of the dense packing and the resulting signif-icant orbital overlaps of the single at-oms, broad energy bands are formed (several eV wide).The delocalization of the energy states of the electrons leads to a large energy gain. The valence or-bitals are responsible for the formation of the valence band and the conduction band. The valence band has binding character and is occupied with electrons down to zero absolute temperature. The conduction band in contrast is of non-binding character. At room tempera-ture, electrons can also be found in the conduction band depending on the size of the band gap, so the Fermi level can be localized between the valence and conduction band. By the transfer of an electron from the valence band into the conduction band via optical or thermic stimulation a weakly bonded electron−hole pair (Mott exciton) is formed. If the binding energy is overcome, the charge carriers (electron and hole) can move separately in the delocalizedstates of the conduction and valence band. This is possible in inorganic semiconductors
14
Transient 2017/ ISSN - 2250-0650
because of the hindered recombination of the charge carriers by the large width of the bands. Due to the easy creation of free charge carriers silicon fulfills the re-quirements for its application in micro-electronic systems. The charge carrier mobility is one of the crucial parameters for the application of semiconductors in electronic devices, because fast switch-ing times, especially in transistors, can only be achieved with high mobilities. Charge transport in in organic semicon-ductors, which can be described with the band theory, is very dependent on the temperature. With increasing tempera-ture lattice vibrations increase, which increase the scattering of charge carri-ers and thus decrease their mobility. The mobility also depends on the degree of crystallinity. In a single crystal of silicon a very high electron mobility up to 1400 cm2 V−1 s−1at room temperature can be observed. In amorphous silicon charge carriers have to overcome grain bound-aries. Here, the mobility is in the range of 0.5−1 cm2 V−1 s−1 measured with thin film transistors (TFT). Although the mo-bility is much lower than in single crys-tal silicon, amorphous silicon is used in electronic devices, because the process-ing is very cost- and energy-efficient. In crystalline organic semiconductors the transport of charge carriers normally depends strongly on the packing of the molecules. Delocalized π-states are gen-erated by overlapping of p-orbitals of
the carbon atoms in the plane of the flat aromatic system. The molecules indeed are usually very small (except graphene) and the electrons are free to move within the π-system. Because of the limited di-mensions of the conjugated systems the energy gap between the highest occu-pied and the lowest unoccupied molec-ular orbital (HOMO and LUMO) of the molecules is comparatively large (sever-al eV). In organic molecular crystals the dimensions of the π-orbitals (HOMOs or LUMOs) are large enough to over-lap with neighbouring molecules in the crystal. Therefore, a transfer of charge carriers is enabled. The transport of elec-trons takes place in the overlapping LU-MOs and holes are transported through the HOMOs (comparable to conduction and valence band). In the past few years research in the field of organic electron-ic was intensified. Molecular crystals of conjugated organic semiconductors with mobilities of 40−60 cm2 V−1 s−1 are suitable for the prospective application in electronic devices. In disordered or-ganic semiconductors the charge carrier transport is basically treated differently. By investigations of the transport in var-ious organic semi-conducting materials one could show that the mean free path length of a charge carrier is often shorter than the lattice constant. The overlap of the orbitals is thus not sufficient to form broad energy bands. Additionally, the charge transport in disordered semicon-
15
Transient 2017/ ISSN - 2250-0650
ductors is nearly independent from tem-perature. The band model is therefore not suitable to explain charge carrier transport in disordered organic semi-conductors (as the columnar phases of discotic liquid crystals). For mesogens of appropriate molecular shape colum-nar liquid crystal phases can be observed with a mean intra-columnar stacking distance less than 3.5 Å .With an aro-matic π-system in the center of the me-sogens, an overlap between theπ-orbitals (HOMOs or LUMOs) of adjacent mole-cules can be observed. Due to the large HOMO−LUMO energy gap of the single molecule no intrinsic charge carriers ex-ist in the material. Charge carriers can, however, be generated in the columnar system by chemical doping (oxidation or reduction), optical stimulation or in-jection at metallic surfaces and can then be transported through the material. The electric contact between a metal and the disordered columnar semiconductor can be of Ohmic or Schottky character, due to the different Fermi levels of the metal and the semiconductor. In the case of electrical contact, electrons will flow from the metal into the semiconductor or reverse until the Fermi levels match each other. This leads to the formation of a space-charge region at the contact surface and to a band bending in the semiconductor. If the Fermi level of the semiconductor is higher, electrons will be rejected from the negative charged
The overall objectives of the research conducted on discotic semiconductors are to achieve the control of: (i) function through molecular structure and su-pra-molecular order; (ii) order from nm to mm scales; (iii) alignment to reach performance in devices and finally (iv) to link charge transport to dynamics and supra-molecular order. Although the field of discotics as semiconductors is still in its infancy, impressive achieve-ments have been obtained. Original disc-like molecules of unprecedented size and structure have been synthe-sized. Their thermotropic behavior, solid state packing, alignment and processing have been tailored with the structural modifications of their side chains. The availability of pure discotic mesogens in sufficient amounts and with tailored me-sophases has prompted their studies as semiconductors. It has become evident that the electronic delocalization in the x, y plane of the molecules and in the z direction of the column axes presents unusual aspects: (i) low band gap and low reorganization energies associated with the chemical stability in ambient conditions, (ii) high charge carrier mo-bility for electrons even in the presence of water and oxygen, (iii) high sensitivity of charge transport to structural defects and dynamics due to its quasi one-di-mensional character, (iv) bandwidth comparable to that of graphite, (v) high quantum yield of fluorescence, and (vi)
16
Transient 2017/ ISSN - 2250-0650
large exciton diffusion length, to men-tion only the most prominent features. It is stressed that the two-dimensional de-localization of electrons which is char-acteristic for disc-like molecules leads to molecular electronic features that are not observed in linear oligomers and polymers. In addition, molecular elec-tronic properties are amplified at the su-pra-molecular level due to the extended interactions between p-systems. There-fore, discotics are a truly new generation of organic semiconductors, even if they have seldom been exploited in devices until now. Considerable work on device fabrication and optimization is obvious-
ly needed to uncover the full potential of discotic semiconductors. Numerous perspectives of new and exciting re-search exist, notably the control of su-pra molecular order, the miscibility and the morphology of discotic blends, the understanding of solution self-assembly and its translation into solid state pack-ing, the use of helical columnar struc-tures for generation of large non-linear optical responses, the combination of charge transport with magnetic proper-ties, and the incorporation of columnar structures in membranes.
Transient 2017/ ISSN - 2250-0650
RESEARCH PAPER

Transient 2017/ ISSN - 2250-0650
19
Transient 2017/ ISSN - 2250-0650
Production Of Anti Microbial Soap And Assessment of its Quality Parameters from Non-Edible Jatropa curcus. L Seed (Jatropa Oil)
Mautushi Das1*, Monalisha D Sangma1 and P Ramanujam2
1 University of Science and Technology, Meghalaya, India2 North Eastern Hill University, Shillong, IndiaE-mail: [email protected]
Abstract In this paper, Jatropha seeds were collected from Garo hills, a dis-trict in the state of Meghalaya, India. Oil was extracted using Soxlet appara-tus to prepare sample soap with Jatro-pha oil adding caustic soda solution in appropriate temperature range. Dif-ferent quality parameters of the soap were tested including antimicrobial activity against two species of bacteria i.e E. coli and Bacillus thurengensis. It was recorded that pH value, total alkali content, conductivity were within the permissible limit prescribed by Bureau of Indian Standards. Moreover, total fatty matter value of the prepared sam-ple soap was 80% which can be consid-ered as a Grade I soap according to the standards given by BIS. Antibacterial activity against two species of bacteria has revealed significant bactericidal
effect as compared to the commercial antiseptic soap purchased from mar-ket which designate that Jatropha soap prepared from Jatropha oil can be uti-lized for production of high quality soap having medicinal value.
Keywords: Jatropha, Medicinal soap, Jatropha oil, Garo hills
Introduction
Jatropha is known for its use as purgative/laxative, and other medici-nal uses. All parts of the plant, includ-ing seeds, leaves and bark, fresh or as a decoction, are used in traditional and folk medicine and veterinary purposes (Duke,1988). The oil is a strong purga-
20
Transient 2017/ ISSN - 2250-0650
tive and is used in skin ailments and in rheumatism (Warra,2012). Antifungal and antibacterial properties of Jatropa oil could be found in many studies world-wide (Warra and Singh,2012). Oleic acid (44%), Linoleic acid (34%),Palmitic acid (14%) and Stearic acid (6%) are the main fatty acid components of Jatropha curcas seed oil. The oil is classified as unsatu-rated due to the presence of sufficient amounts of Oleic and Linoleic acids (Joshi et al., 2011).Local soap industries use Jatropha oil which is one of the most economically attractive alternative uses of the oil. The glycerin by-product of the trans-esertification process of Jatropha oil can be used to make a high quality soap, or it can be refined and sold at a range of prices, depending on its puri-ty, to be used in an immense range of products, including cosmetics, tooth-paste, embalming fluids, pipe joint ce-ment, cough medicine, and tobacco (as a moistening agent). The soap has pos-itive effects on the skin and is therefore marketed for medicinal purposes. Oil for soap making is the most profitable use; the fruit of Jatropha contain viscous oil that can be used for soap making (Openshaw, 2000). It is rich in palmitic acid, with high levels of hydrophobicity, and makes a soft, durable soap under even the simplest of manufacturing pro-cesses. Soap from Jatropha Oil contains ingredients which have antifungal and
bactericidal effect and it also prevents skin rashes (Gupta et al., 2009).
Jatropha plants are abundantly growing in Garo hills, a district located in Meghalaya, the North eastern part of India. As there are many small scale industries for preparation of different products by utilizing native plants of the region, Jatropha oil can be used for such industries in preparation of soap.
Materials and Methods
Oil extraction from Jatropha curcas seeds by Soxhlet Extractor
From 3-6 years old plant, ma-ture/ripe seeds of Jatropha curcas.Linn were collected from West Garo Hills , Meghalaya.
150 grams of Jatropha curcas.Linn seeds were used for extraction of oil in the Soxhlet apparatus. A soxhlet extractor is a piece of laboratory appa-ratus designed for the extraction od a lipid from a solid material. Typically, a soxhlet extraction is used when the de-sired compound has a limited solubility in a solvent, and the impurity is insolu-ble in that solvent. It allows for unmon-itored and unmanaged operation while efficiently recycling a small amount of solvent to dissolve a large amount of ma-terial.
21
Transient 2017/ ISSN - 2250-0650
Soap preparation in the laboratory
Jatropha curcas seed oil has been used as one of the essential oil in mak-ing a antimicrobial/ antibacterial soap. The soap is prepared by using the tra-ditional soap making method, first a lye solution is prepared by making a solu-tion of Sodium hydroxide with distilled water, 100 grams of the Sodium hydrox-ide pellets was dissolved in 200 ml of dis-tilled water. Then the solution is stirred with a wooden spoon , it is a exothermic reaction (care is taken not to put the wa-ter into the pellet) then the different oils i.e refined vegetable oil (100ml) Avacado oil (30ml) and Jatropha oil (3ml) is mea-sured and mixed well. The lye solution is poured into the oil and then it is mixed properly using a hand mixer. When the reaction mass turned viscous like honey it was poured in moulds for solidifica-tion. After complete drying, crude soap was unloaded from mould and spray washed with water so as to remove un-reacted caustic soda.
Antimicrobial activity in seed oil of Jatropha curcas L plant
Pure bacterial cultures namely Bacillus thuringiensis and Escherichia coli are obtained from Department of Biotechnology, University of Science and Technology Meghalaya, Ribhoi, Me-ghalaya.
In vitro antimicrobial studies were carried out on different bacterial cultures against test extract (seed oil) by agar disc diffusion assay method. 100µl aliquots of bacterial (about 106 cells/ml) were evenly spread on the agar plates us-ing a sterile glass rod spreader, respec-tively. The plates were left at room tem-perature for 15 minutes to allow the agar surface to dry. The sterile disc contain-ing the standard compounds and test compounds were placed on the inocu-lated plates. Then the plates are incubat-ed at 370C and 30oC for 24 hours to 48 hours, respectively. Experiment was per-formed under strict aseptic conditions. Cleared zones were scored as antimi-crobial activity of standard compound against different tested microorganisms. The antimicrobial activity was evaluated by measuring the diameter of the inhi-bition zone. The experiment were per-formed in triplicate and the data were calculated as mean ± SD.
Calculation of % yield of Jatropha Soap
% Yield = (out/input) x 100
Determination of pH
pH of aquous Jatropha soap solu-tion was recorded by using pH meter .
22
Transient 2017/ ISSN - 2250-0650
Determination of conductivity
0.1 M solution of Pure Jatropha soap was prepared. Conductivity of this soap solution was determined by using well calibrated conductivity meter. By using the above stock solution various dilutions were prepared viz. 0.05 M, 0.01 M , 0.005 M, 0.001M, 0.0001M .Con-ductivity of all above solutions were re-corded with the help of conductivity meter and a graph was plotted between conductivity v/s concentration.
Determination of Total Alkali Content in the Soap Samples
5gm of soap sample is dissolved in 100ml hot water. About 40ml of 0.5N HNO3 is added to make it acidic. The mixture is heated until fatty acids are floating as a layer above the solution. It is cooled in ice water to solidify the fatty acids. The fatty acids were separated and the aqueous solution was treated with 50ml chloroform to remove the remain-ing fatty acids. The aqueous solution was measured and 10ml of it was titrated against 0.5N NaOH using methyl orange as indicator and from the titer value the total alkali content was calculated using the following method.
Calculation:
Total volume of the aqueous
solution: V ml10 ml of aqueous solution required t ml of NaOHV ml of aqueous solution requires: V x t /10 = A ml.Amount of NaOH required by acid in aqueous solution: A mlVolume of HNO3 required, B ml : A x Normality of NaOH / Normality of HNO3Volume of HNO3 required for neutral-izing NaOH : C=40 – BAmount of NaOH in 1000 cc of soap solution (E): (C x 40 x Normality of HNO3 g) /1000250 cc of soap solution contains (F): (E x 250) / 1000 g2 NaOH ------- Na2O + H2O 80 gram of NaOH 62 g of Na2OF g of NaOH requires (Y) = (62 x F) / (80) g of Na2OWeight of soap taken: 5 g% of alkalinity: (Y x 100) / w Determination of the Total Fatty Mat-ter in Soaps
5gm of soap sample is dissolved in 100ml hot water. About 40ml of 0.5N HNO3 is added to make it acidic. The mixture is heated until fatty acids are floating as a layer above the solution. It is cooled in ice water to solidify the fat-
23
Transient 2017/ ISSN - 2250-0650
ty acids. The fatty acids were separated and the aqueous solution was treated with 50ml chloroform to remove the re-maining fatty acids. The separated fatty matter was mixed together, solvent was evaporated and the yield is noted. The total fatty matter can be calculated using the following method.
CalculationWeight of the china dish (x) Weight of china dish + Soap after drying (y) Weight of soap sample = 5 g% of fatty mater = (y – x) x 100
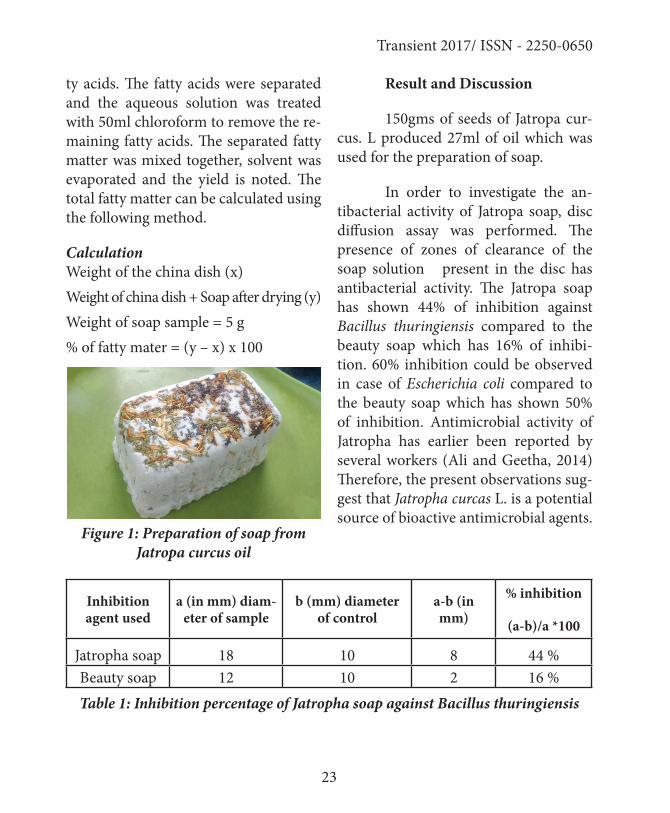
Figure 1: Preparation of soap from
Jatropa curcus oil
Result and Discussion
150gms of seeds of Jatropa cur-cus. L produced 27ml of oil which was used for the preparation of soap.
In order to investigate the an-tibacterial activity of Jatropa soap, disc diffusion assay was performed. The presence of zones of clearance of the soap solution present in the disc has antibacterial activity. The Jatropa soap has shown 44% of inhibition against Bacillus thuringiensis compared to the beauty soap which has 16% of inhibi-tion. 60% inhibition could be observed in case of Escherichia coli compared to the beauty soap which has shown 50% of inhibition. Antimicrobial activity of Jatropha has earlier been reported by several workers (Ali and Geetha, 2014) Therefore, the present observations sug-gest that Jatropha curcas L. is a potential source of bioactive antimicrobial agents.
Inhibition agent used
a (in mm) diam-eter of sample
b (mm) diameter of control
a-b (in mm)
% inhibition
(a-b)/a *100
Jatropha soap 18 10 8 44 %Beauty soap 12 10 2 16 %Table 1: Inhibition percentage of Jatropha soap against Bacillus thuringiensis
24
Transient 2017/ ISSN - 2250-0650
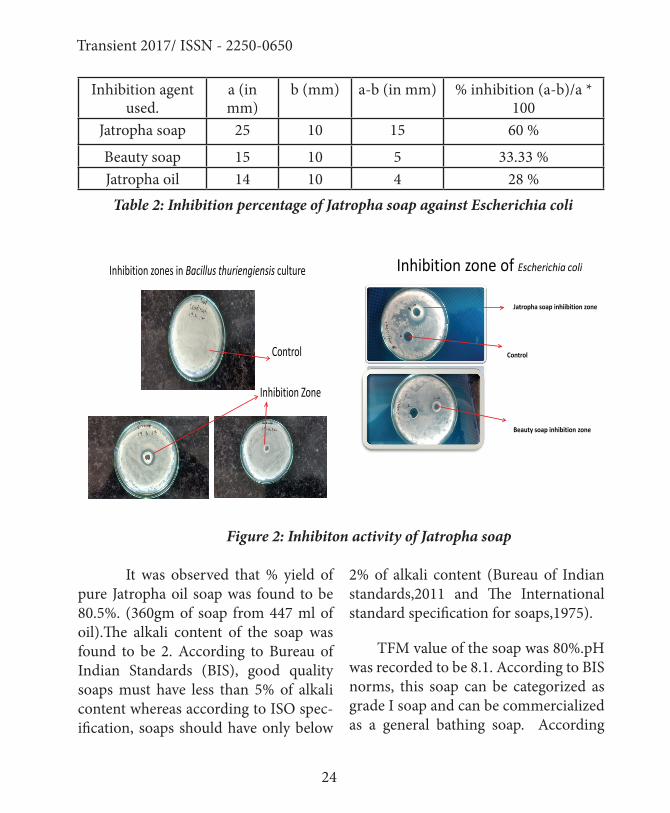
Inhibition agent used.
a (in mm)
b (mm) a-b (in mm) % inhibition (a-b)/a * 100
Jatropha soap 25 10 15 60 %
Beauty soap 15 10 5 33.33 %Jatropha oil 14 10 4 28 % Table 2: Inhibition percentage of Jatropha soap against Escherichia coli
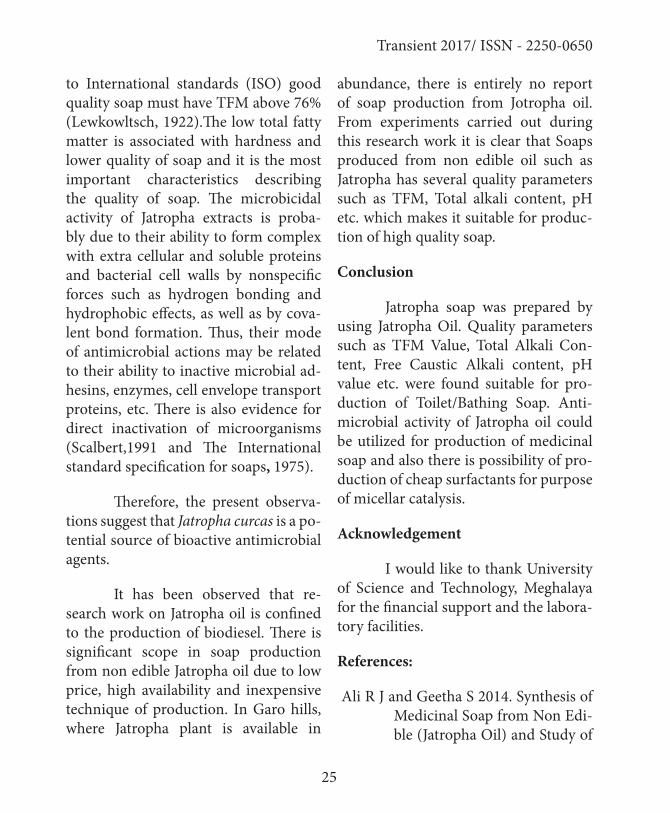
Inhibition zones in Bacillus thuriengiensis culture
• Control
Inhibition Zone
Inhibition zone of Escherichia coli
Beauty soap inhibition zone
Control
Jatropha soap inhiibition zone
Figure 2: Inhibiton activity of Jatropha soap
It was observed that % yield of pure Jatropha oil soap was found to be 80.5%. (360gm of soap from 447 ml of oil).The alkali content of the soap was found to be 2. According to Bureau of Indian Standards (BIS), good quality soaps must have less than 5% of alkali content whereas according to ISO spec-ification, soaps should have only below
2% of alkali content (Bureau of Indian standards,2011 and The International standard specification for soaps,1975).
TFM value of the soap was 80%.pH was recorded to be 8.1. According to BIS norms, this soap can be categorized as grade I soap and can be commercialized as a general bathing soap. According
25
Transient 2017/ ISSN - 2250-0650
to International standards (ISO) good quality soap must have TFM above 76% (Lewkowltsch, 1922).The low total fatty matter is associated with hardness and lower quality of soap and it is the most important characteristics describing the quality of soap. The microbicidal activity of Jatropha extracts is proba-bly due to their ability to form complex with extra cellular and soluble proteins and bacterial cell walls by nonspecific forces such as hydrogen bonding and hydrophobic effects, as well as by cova-lent bond formation. Thus, their mode of antimicrobial actions may be related to their ability to inactive microbial ad-hesins, enzymes, cell envelope transport proteins, etc. There is also evidence for direct inactivation of microorganisms (Scalbert,1991 and The International standard specification for soaps, 1975).
Therefore, the present observa-tions suggest that Jatropha curcas is a po-tential source of bioactive antimicrobial agents.
It has been observed that re-search work on Jatropha oil is confined to the production of biodiesel. There is significant scope in soap production from non edible Jatropha oil due to low price, high availability and inexpensive technique of production. In Garo hills, where Jatropha plant is available in
abundance, there is entirely no report of soap production from Jotropha oil. From experiments carried out during this research work it is clear that Soaps produced from non edible oil such as Jatropha has several quality parameters such as TFM, Total alkali content, pH etc. which makes it suitable for produc-tion of high quality soap.
Conclusion
Jatropha soap was prepared by using Jatropha Oil. Quality parameters such as TFM Value, Total Alkali Con-tent, Free Caustic Alkali content, pH value etc. were found suitable for pro-duction of Toilet/Bathing Soap. Anti-microbial activity of Jatropha oil could be utilized for production of medicinal soap and also there is possibility of pro-duction of cheap surfactants for purpose of micellar catalysis.
Acknowledgement
I would like to thank University of Science and Technology, Meghalaya for the financial support and the labora-tory facilities.
References:
Ali R J and Geetha S 2014. Synthesis of Medicinal Soap from Non Edi-ble (Jatropha Oil) and Study of
26
Transient 2017/ ISSN - 2250-0650
its Quality Parameters includ-ing Antimicrobial Activity. Res J. of Chem. Sci. (4): 58-62.
Bureau of Indian standards 2011. DOC: CHD 20 (1861) C, May
Duke J A 1988. CRC Handbook of Me-dicinal Herbs. CRC Press, Boca Raton, FL, 1988; 253-254.
Gupta S, Kumar N and Gupta S M 2009.Antibacterial and antifungal activity in extract and oil of piper beetle landrace bangla mahoba. J. Adv. Zoo. 30(1): 16-20.
Joshi A, Singhal P and Bachheti R K 2011. Physicochemical Char-acterization of Seed Oil of Jatropha curcas L., Collected from Dehradun (Uttarakhand) India. Int.J. Appl.Biol. Pharm.Technol. 2: 123-127.
Lewkowltsch J 1922. Chemical Technol-ogy and Analysis of Oils, Fats,
and Waxes, 6th Edition, Lon-don, Macmillan, Vol.3.
Openshaw K A 2000. Review of Jatro-pha curcas: an oil plant of un-fulfilled promise. Biomass and Bioener; 2 19(1): 1-15.
Scalbert A 1991. Antimicrobial proper-ties of tannin. Photochem. 30: 3875-3883.
Singh R, Agarwal T, Rastogi R, Arora N and Rastogi M 2012. Com-parative Analysis of Antibacte-rial Activity of Jatropha curcas Fruit Part; J Pharm. Biomed. S. 15(15).
The International standard specification for soaps 195. ISO 685
Warra A 2012. Cosmetic potentials of physic nut (Jatropha curcas Linn.) seed oil: A review; Amer-ican Journal of Science and Re-search. 3(6): 358-366.
27
Transient 2017/ ISSN - 2250-0650
Mushroom Cultivation: A Source of Additional Income to Rural Households-A Case Study
Joyoshree Mahanta* and A S SinghKVK ICAR, West Garo Hills, Meghalaya
E-mail: [email protected]
Abstract
West Garo Hills district of Megha-laya enjoys climatic condition conge-nial for growing oyster mushroom. Farmers are mostly small, marginal and landless labourers. Mushrooms are considered to be a good cash crop as it gives quick return and requires minimum land. Hence under the NICRA Project, KVK, West Garo Hills for the first time introduced Oyster mushroom cultivation among women SHGs in three villages viz. Marapara, Sanangre and Rongbokgre under Dalu Block of West Garo Hills district. Re-sults obtained were encouraging as the SHGs on an average earned a net profit of Rs 5375/- per cycle of 50 days and have got heavy demand and market too. Thus, it is concluded that Oyster mushroom can be grown successfully
to supplement additional income for the family.
Keywords: Oyster mushroom, Wom-en SHG, income generating activity, West Garo Hills
Introduction
Agriculture is the back bone of Indian economy. After achieving food security by growing various kinds of agricultur-al crops, quest for achieving nutritional security is on. As the demand for qual-ity food is increasing with the changes in lifestyle and income, these challeng-es can be meted out by diversifying the agricultural activity. Mushroom is one such component that imparts diversi-fication and also provide quality food along with health and environmental
28
Transient 2017/ ISSN - 2250-0650
security. Mushroom production in India is about 1.2 lakh metric tonnes, which is 3 % of world production (Prakasam,V., 2012). Per capita consumption of oyster mushroom in India is dismal 30-40 g as compared to 2-3 kg in USA and Europe (Singh, et. al., 2012). Meghalaya produc-es 2 tonnes of oyster mushroom annu-ally (Singh et al.,2011).West Garo Hills district of Meghalaya enjoys environ-mental conditions congenial for grow-ing oyster mushroom. The local farmers grow Sali paddy with intermittent vege-table output during rainy season. Paddy straw after harvest are either fed to the cattle or are burnt to ashes which other-wise could have been profitably used for
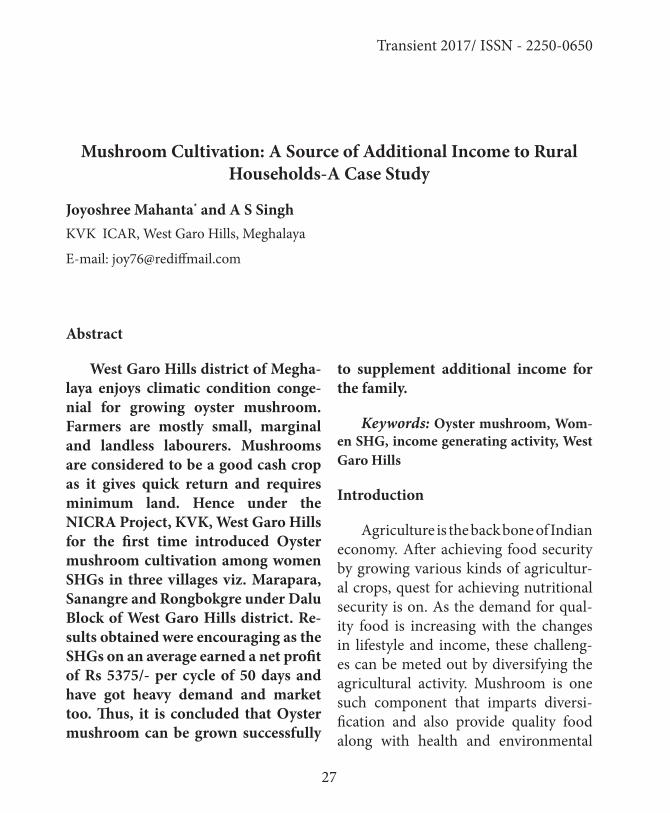
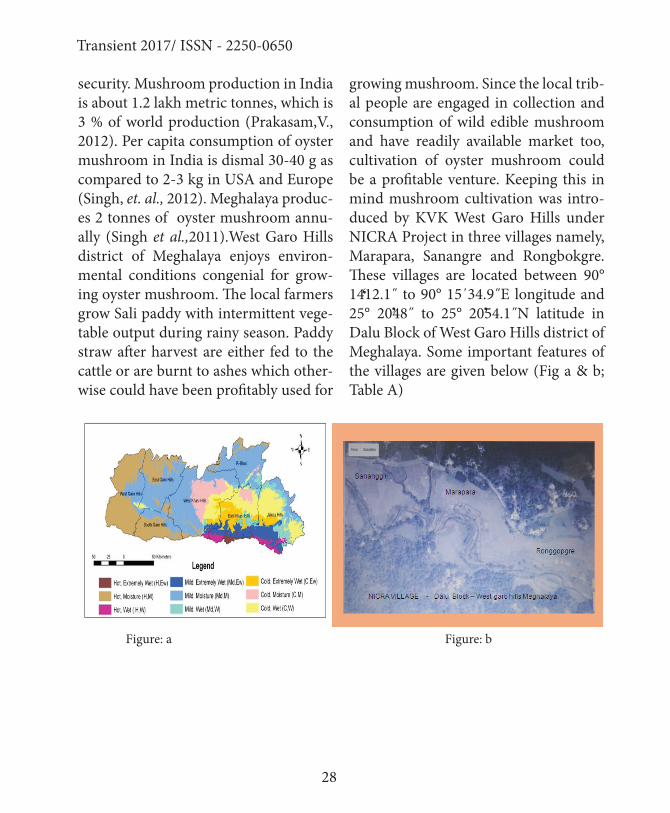
growing mushroom. Since the local trib-al people are engaged in collection and consumption of wild edible mushroom and have readily available market too, cultivation of oyster mushroom could be a profitable venture. Keeping this in mind mushroom cultivation was intro-duced by KVK West Garo Hills under NICRA Project in three villages namely, Marapara, Sanangre and Rongbokgre. These villages are located between 90° 1412.1˝ to 90° 15΄34.9˝E longitude and 25° 2048˝ to 25° 2054.1˝N latitude in Dalu Block of West Garo Hills district of Meghalaya. Some important features of the villages are given below (Fig a & b; Table A)
Figure: a Figure: b
29
Transient 2017/ ISSN - 2250-0650
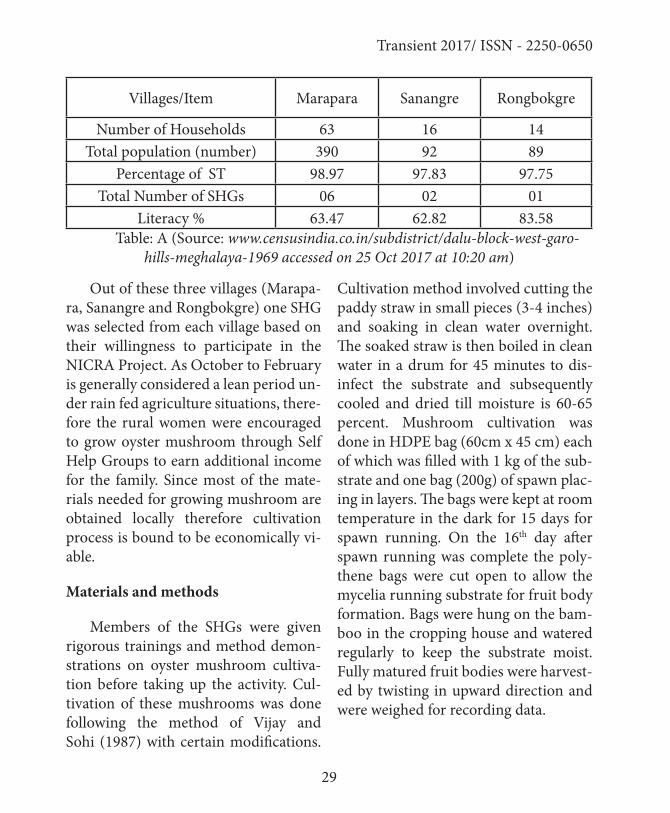
Villages/Item Marapara Sanangre Rongbokgre
Number of Households 63 16 14Total population (number) 390 92 89
Percentage of ST 98.97 97.83 97.75Total Number of SHGs 06 02 01
Literacy % 63.47 62.82 83.58 Table: A (Source: www.censusindia.co.in/subdistrict/dalu-block-west-garo-
hills-meghalaya-1969 accessed on 25 Oct 2017 at 10:20 am)
Out of these three villages (Marapa-ra, Sanangre and Rongbokgre) one SHG was selected from each village based on their willingness to participate in the NICRA Project. As October to February is generally considered a lean period un-der rain fed agriculture situations, there-fore the rural women were encouraged to grow oyster mushroom through Self Help Groups to earn additional income for the family. Since most of the mate-rials needed for growing mushroom are obtained locally therefore cultivation process is bound to be economically vi-able.
Materials and methods
Members of the SHGs were given rigorous trainings and method demon-strations on oyster mushroom cultiva-tion before taking up the activity. Cul-tivation of these mushrooms was done following the method of Vijay and Sohi (1987) with certain modifications.
Cultivation method involved cutting the paddy straw in small pieces (3-4 inches) and soaking in clean water overnight. The soaked straw is then boiled in clean water in a drum for 45 minutes to dis-infect the substrate and subsequently cooled and dried till moisture is 60-65 percent. Mushroom cultivation was done in HDPE bag (60cm x 45 cm) each of which was filled with 1 kg of the sub-strate and one bag (200g) of spawn plac-ing in layers. The bags were kept at room temperature in the dark for 15 days for spawn running. On the 16th day after spawn running was complete the poly-thene bags were cut open to allow the mycelia running substrate for fruit body formation. Bags were hung on the bam-boo in the cropping house and watered regularly to keep the substrate moist. Fully matured fruit bodies were harvest-ed by twisting in upward direction and were weighed for recording data.
30
Transient 2017/ ISSN - 2250-0650
In this study each of the self help groups viz. Niji SHG, Sanangre SHG and Tangkame SHG from Marapara, Sanangre and Rongbokgre respectively were supported with low cost mushroom house and other basic requisites like spawn, HDPE bags, plastic rope, dettol, cotton, Knapsack sprayer, weighing balance, drum, bucket, black polythene required to grow mushroom. Paddy straw and fire wood were obtained locally. Monitoring was done timely and frequently by KVK officials to help the Self help groups to overcome the problems faced by them during growing mushrooms. Technical literature of mushroom cultivation was also provided to the SHG members after the training
programme.
Results
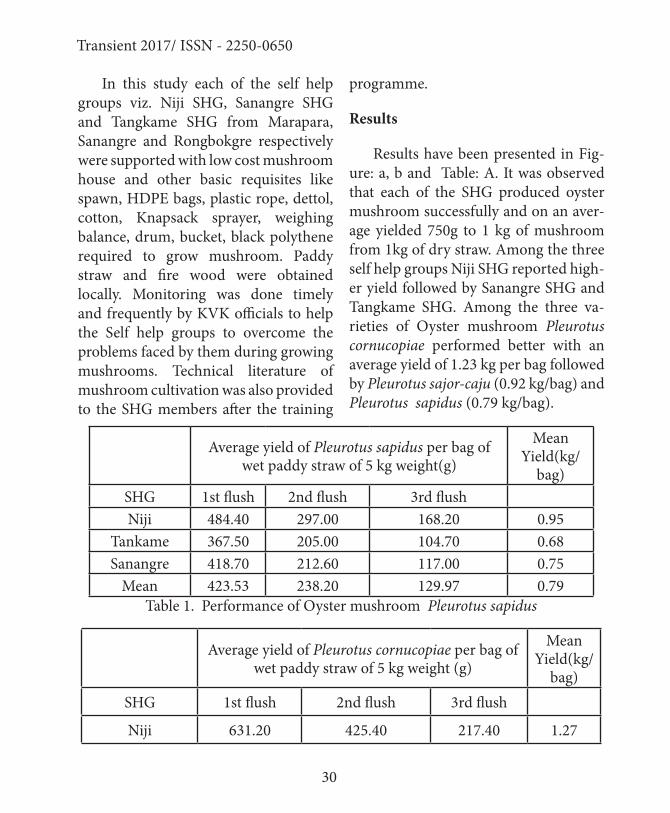
Results have been presented in Fig-ure: a, b and Table: A. It was observed that each of the SHG produced oyster mushroom successfully and on an aver-age yielded 750g to 1 kg of mushroom from 1kg of dry straw. Among the three self help groups Niji SHG reported high-er yield followed by Sanangre SHG and Tangkame SHG. Among the three va-rieties of Oyster mushroom Pleurotus cornucopiae performed better with an average yield of 1.23 kg per bag followed by Pleurotus sajor-caju (0.92 kg/bag) and Pleurotus sapidus (0.79 kg/bag).
Average yield of Pleurotus sapidus per bag of wet paddy straw of 5 kg weight(g)
Mean Yield(kg/
bag)SHG 1st flush 2nd flush 3rd flushNiji 484.40 297.00 168.20 0.95
Tankame 367.50 205.00 104.70 0.68Sanangre 418.70 212.60 117.00 0.75
Mean 423.53 238.20 129.97 0.79Table 1. Performance of Oyster mushroom Pleurotus sapidus
Average yield of Pleurotus cornucopiae per bag of wet paddy straw of 5 kg weight (g)
Mean Yield(kg/
bag)SHG 1st flush 2nd flush 3rd flush
Niji 631.20 425.40 217.40 1.27

31
Transient 2017/ ISSN - 2250-0650
Tankame 596.70 388.20 194.20 1.18
Sanangre 622.50 415.20 206.70 1.24
Mean 616.80 409.60 206.10 1.23
Table 2. Performance of Oyster mushroom Pleurotus cornucopiae
Average yield of Pleurotus sajorcaju per bag of wet paddy straw of 5 kg weight (g)
SHG 1st flush(g) 2nd flush(g) 3rd flush(g) Mean Yield(kg/bag)
Niji 570.40 283.40 140.40 0.99Tankame 450.00 211.00 139.30 0.80Sanangre 545.20 274.50 143.00 0.96
Mean 521.87 256.30 140.90 0.92Table 3. Performance of Oyster mushroom Pleurotus sajorcaju
Mushroom was cultivated from September 2011 to March 2012, as it is generally considered to be congenial period for growing Oyster mushroom under Garo Hills condition, where the temperature ranges from 20-30°C and RH 80-85 %. Each of the SHGs on an average produced 50.5 kg from 60 bags prepared in a cycle lasting for about 50 days till the harvesting of the third flush. Total Cost involvement for preparing one bag ( 1 packet spawn (200g) for Rs 20/-,1 HDPE bag for Rs 3/- and dettol, cotton, plastic rope, drum etc for Rs 7/-) is Rs 30/-. For preparing 60 bags Rs 1800/- was required. The nominal sell-ing price of oyster mushroom in West
Garo Hills is Rs150/- per kg. Transpor-tation and other miscellaneous cost like plastic bags for packaging mushroom included Rs 400/-.Thus, selling price of 50.5 kg @ of Rs 150/- per kg of fresh mushroom was Rs 7575/-with a net prof-it of Rs (7575-1800-400)= Rs 5375/- in one cycle of production. A farmer can have a minimum of four cycles during September to March season. Thus by selling oyster mushroom each of the self help groups contributed immensely to their common fund. Similar findings were reported by (Dass et al., 2008)
32
Transient 2017/ ISSN - 2250-0650
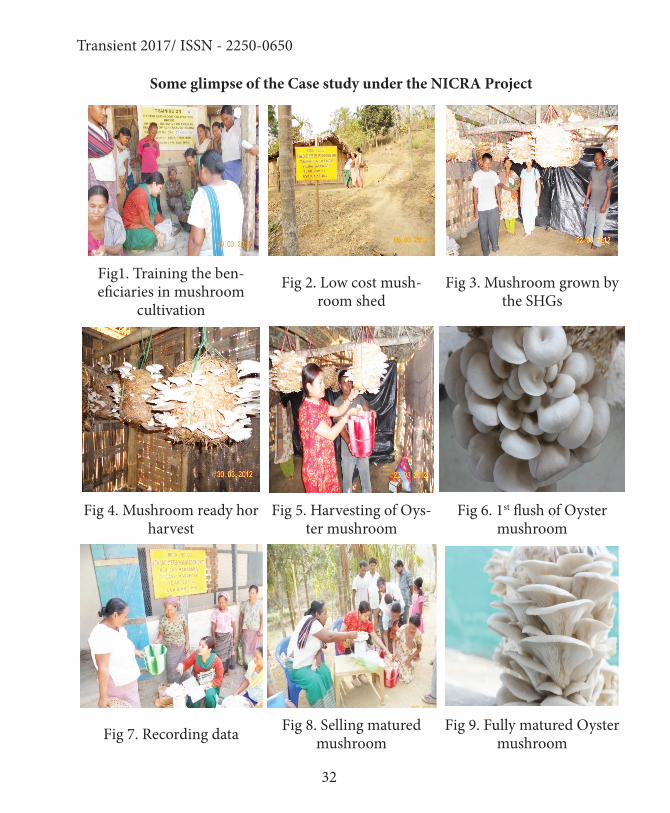
Some glimpse of the Case study under the NICRA Project
Fig1. Training the ben-eficiaries in mushroom
cultivation
Fig 2. Low cost mush-room shed
Fig 3. Mushroom grown by the SHGs
Fig 4. Mushroom ready hor harvest
Fig 5. Harvesting of Oys-ter mushroom
Fig 6. 1st flush of Oyster mushroom
Fig 7. Recording data Fig 8. Selling matured mushroom
Fig 9. Fully matured Oyster mushroom
33
Transient 2017/ ISSN - 2250-0650
Conclusion
Thus it is seen that under the NICRA project through KVK’s intervention each of the Self Help group on an av-erage earned an additional net profit of Rs 5375/ per cycle by growing oyster mushroom. All the SHGs selected had only women members. Hence each of the beneficiaries contributed additional income for their family along with easy source of nutrition in their diet. Since Oyster mushrooms are rich in protein, vitamins and minerals can provide an affordable alternative which in turn can reduce malnutrition.
The net profit obtained in mush-room cultivation attracted and encour-aged other SHGs to take up the venture on small scale. People from the nearby villages also showed interest for mush-room cultivation and approached KVK for imparting technical support. As current market value and demand for mushrooms are high, the SHGs are in-terested to take up mushroom cultiva-tion throughout the year to generate ad-ditional income and employment.
References:Dass A and Sudhishrii S 2008. A study
of mushroom cultivation and growers in tribal watershed de-velopment in Orissa. Interna-tional Journal of Agricultural Sci-ence. 4(1):314-320
Poudel S and Bajracharya A 2011. Pros-pects and challenges of Mush-room Cultivation in Nepal: A case study of Lakuri Bhanjyang, Lalitpur. www.forestrynepal.org.
Prakasham V 2012. Current scenario of mushroom research in India. In-dian Phytopathology. 65(1):1-11
Ranasingh N, Mohanty S and Behera S 2010. Oyster Mushroom Culti-vation: A profitable Enterprise-A case study. Orissa Review May-June. 86-88
Singh M, Vijay B, Kamal S and Wak-caure G C 2011. Mushrooms- Cultivation, Marketing and Consumption. Directorate of Mushroom Research, Solan. https://www.researchgate.net/...Wakchaure/. pp. 266.
Singh M and Shwet K 2012. Mushroom Scenario in India. Agriculture Year Book.83-87
Vijay B and Sohi H S 1987. Cultivation of Oyster Mushroom Pleuro-tus sajor- caju (Fr.) singer on chemically sterilized wheat straw. Mushroom Journal Trop-ics.7:67-75
www.censusindia.co.in/subdistrict/da-lu-block-west-garo-hills-megha-laya-1969 accessed on 25 Oct 2017 at 10:20 am
34
Transient 2017/ ISSN - 2250-0650
Comparison of a Few Simple Prescriptions for the Selection of Number of Bins in a Univariate Histogram for Normally Distributed
Samples Using Simulations
D Maibam1*, Y Sharma2, A Khardewsaw1 and A Saxena1
1 Department of Physics, NEHU, Shillong, Meghalaya, India2 Department of Physics, Don Bosco College, Tura, Meghalaya, India
E-mail: [email protected]
AbstractThe mean squared error estimate is
used to characterise the performance of 7 methods for determining the number of bins in a histogram, which serves to determine the underlying normal probability density function that generated the samples. The sim-pler and direct method of simulation is used to achieve the objectives of the present study. Random samples from normal distributions with 10 differ-ent values of standard deviation and 20 different sample sizes are used with 1000 runs for each combination. A fit-ting procedure is performed on the es-timated mean squared error, which is then used to identify the prescription that gives the least error– determined to be the rule prescribed by Scott in the
present study.
Keywords – histogram, simulation, least-square fit, mean squared error
Introduction
One of the simplest methods of es-timating the underlying probability distribution of a given set of samples is the histogram[1, 2]. Although, the term histogram is usually associated with the visual representation similar to a bar-graph with touching adjacent sides, but, in the current context it was deemed useful to expand the definition to in-clude the entire process of generating the processed data for the graph from the raw dataset. For the construction of
35
Transient 2017/ ISSN - 2250-0650
a histogram for a given dataset (assumed univariate in the present case), the total range of the data values is divided into non-overlapping intervals or ‘bins’ of equal size1 and then for each interval the number of data points that lie in that in-terval is counted; with this data we can generate a frequency table with bound-ary values of the bins in one column and the corresponding frequencies (number of data points in that particular bin) in another column. The bar-graph plotted with each bar-width enclosing a bin and the bar-height equal to the correspond-ing frequency of data points is a histo-gram. Sometimes a few values are either too high or too low in comparison to the bulk of the dataset; such values are called outliers and may be either valid data points or the result of some gross errors in the measurements/calcula-tions; in either case, the outliers are gen-erally removed before the construction of the histogram and analysed separate-ly. In the present case, it is assumed that the dataset has no outliers or that it has been removed. To obtain the probabili-ty density values, the frequency in each data bin is divided by the total number of data points, further divided by the bin-width.
1 The conditions of non-overlapping and equal size for the bins is not a strict requirement but is generally used to simplify the construction of the histogram.
The basic purpose of the histogram is to show the shape of the generating fre-quency distribution over the given range of values; in its construction, the prima-ry concern is the number of bins to be taken – too few bins could over-smooth the shape leaving out important details and too many bins could under-smooth the shape and generate spurious details. Over the years, there have been a hand-ful of suggestions for determination of the optimal bin-width or alternatively number of bins – some ad hoc methods (see table 1) and some based on statis-tical optimisation procedures. In the present paper, we will analyse the per-formance of 7 methods of determining the number of bins for a given univari-ate dataset taken from normal distribu-tion. The comparative effectiveness and the simplicity of the ad hoc methods for the estimation of the bin-widths or the number of bins is exemplified in their usage in popular software packages for statistical calculations like Microsoft Ex-cel 20172, which uses the Scott’s rule.
Methodology
The 7 methods for determining the number of bins or the bin-number for the construction of the histogram used in the present paper are listed in table 1.
2 from online Microsoft Excel 2017 help at https://support.office.com/
36
Transient 2017/ ISSN - 2250-0650
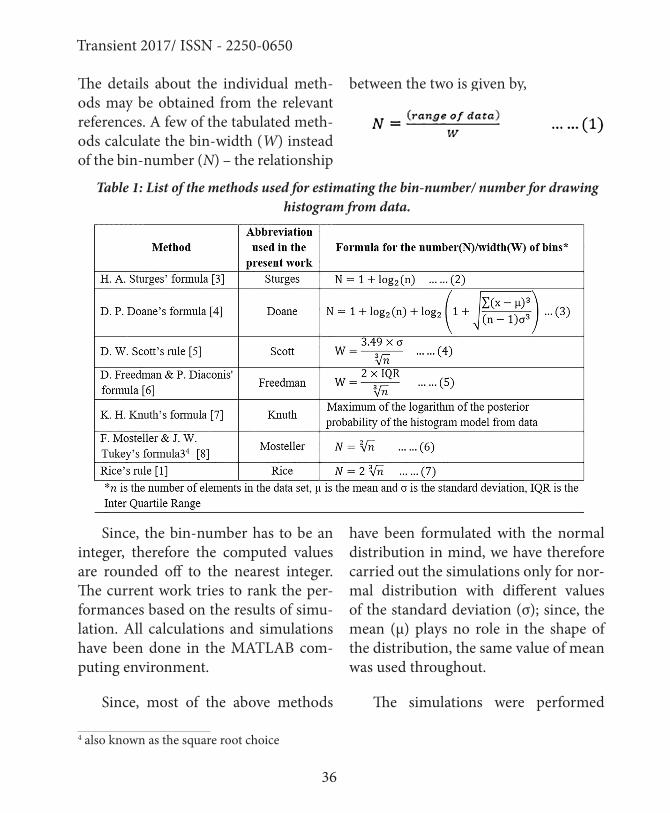
The details about the individual meth-ods may be obtained from the relevant references. A few of the tabulated meth-ods calculate the bin-width (W) instead of the bin-number (N) – the relationship
between the two is given by,
Table 1: List of the methods used for estimating the bin-number/ number for drawing histogram from data.
Since, the bin-number has to be an integer, therefore the computed values are rounded off to the nearest integer. The current work tries to rank the per-formances based on the results of simu-lation. All calculations and simulations have been done in the MATLAB com-puting environment.
Since, most of the above methods
have been formulated with the normal distribution in mind, we have therefore carried out the simulations only for nor-mal distribution with different values of the standard deviation (σ); since, the mean (μ) plays no role in the shape of the distribution, the same value of mean was used throughout.
The simulations were performed
4 also known as the square root choice
37
Transient 2017/ ISSN - 2250-0650
as follows 10 different normal distri-butions were considered with values ranging from 0.5 to 50 with almost ex-ponential spacing viz. 0.5, 1, 2, 3, 5, 8, 13, 20, 32 and 50. For each of the nor-mal distribution constructed, 20 differ-ent values of sample sizes ranging from 30 to 10000 were studied, again with almost exponential spacing between them. A certain number –the sample size – of pseudo-random numbers are then generated from the given normal distribution using MATLAB. 1000 sim-ulations were done for each type. Using the various prescriptions, the histogram is constructed for each simulated sample and, from the data of the histogram, the probability distribution is computed. To estimate the difference of the computed probability distribution with the actu-al probability distribution function, we have used the mean squared error (MSE) as a measure of the difference. The MSE [2] is the mean value of the squared dif-ference between the values of the con-structed and actual probability densities at each evaluated point for each sample considered. The lower the MSE value the better is the agreement between the computed and actual values.
Results and Discussion
The mean value (of the 1000 simula-tion runs) of the probability density for
each of the bin-number prescriptions along with standard deviation (shown as error-bars) is plotted in figure 1.It may be mentioned here that the pre-scriptions as given by Sturges, Mosteller and by Rice are purely functions of the sample size and hence the simulations do not affect their output i.e. bin-num-bers prescribed, therefore, there are no error-bars in the corresponding plots in figure 1. Plots corresponding to different standard deviation (σ) values (of normal distribution for the same method are plotted in similar colour immediately adjacent to each other. It can be observed that the prescriptions of Mosteller and that of Freedman have relatively larger bin-numbers for higher sample sizes.
The mean values of the MSE score as a function of the sample size for different σ values are plotted in figure 2 as sep-arate graphs for each prescription. We observe the expected pattern of higher MSE values at lower sample sizes and lower MSE values at higher sample siz-es i.e. the MSE values decreases almost steadily with increasing sample size (n). This decrease in the MSE values with increasing n is found to nearly follow an inverse law i.e. the MSE values decreas-es as the reciprocal of n, therefore we decided to fit the MSE values from the various prescriptions to a function of the form:

38
Transient 2017/ ISSN - 2250-0650
where, ‘a’ is a parameter to be deter-mined from least square fitting.
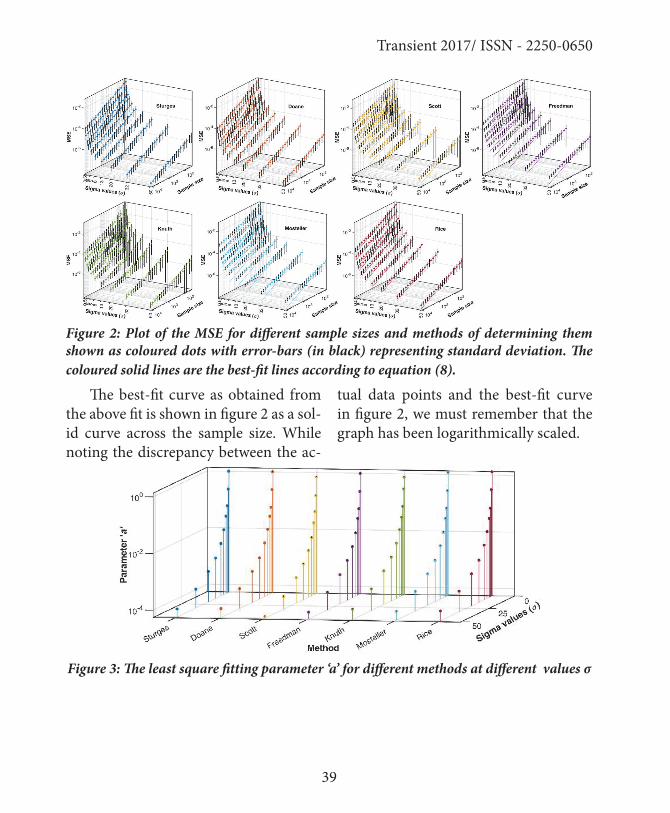
The values of the fitting parameter ‘a’ obtained after performing a least square fit (at 95% confidence bounds) between the MSE values and n are plotted in fig-
ure 3; the error-bar represents the lower and upper confidence bounds. The pa-rameter ‘a’ also shows a non-linear de-crease with increasing values, similar to (1/σ) trend; this can be understood as the result of the difficulty in capturing sharper peaks of a normal distribution curve (characteristic of small σ values) with relatively few equally spaced histo-gram bins.
Figure 1: Plot of the number of bins of histogram for different sample sizes and methods of determining them. The name of the method employed is plotted in the x-axis and is self-evident. The 10 different values of σ are plotted in the same colour adjacently with their separation proportional to the value of σ .
39
Transient 2017/ ISSN - 2250-0650
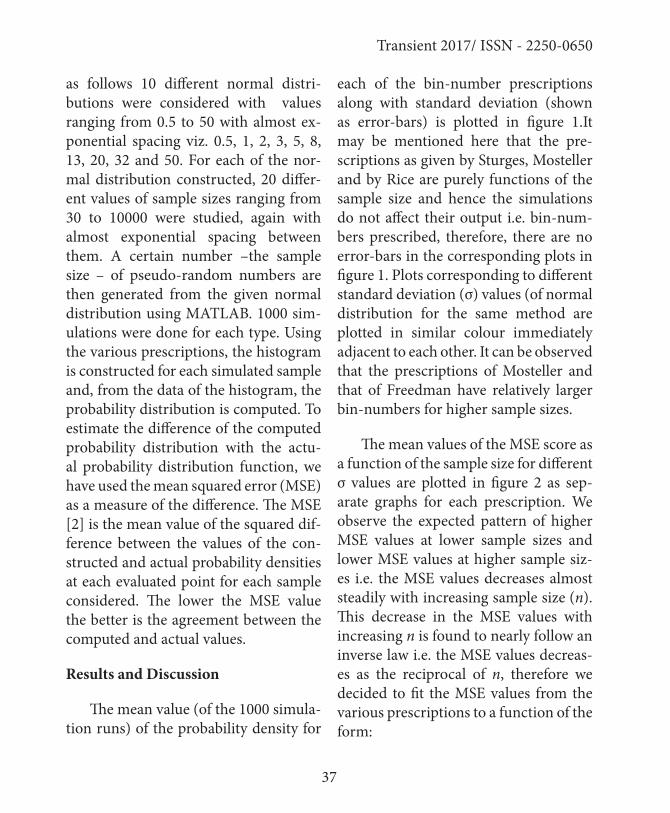
Figure 2: Plot of the MSE for different sample sizes and methods of determining them shown as coloured dots with error-bars (in black) representing standard deviation. The coloured solid lines are the best-fit lines according to equation (8).
The best-fit curve as obtained from the above fit is shown in figure 2 as a sol-id curve across the sample size. While noting the discrepancy between the ac-
tual data points and the best-fit curve in figure 2, we must remember that the graph has been logarithmically scaled.
Figure 3: The least square fitting parameter ‘a’ for different methods at different values σ

40
Transient 2017/ ISSN - 2250-0650
Figure 4: The values of the parameter ‘a’ for the different values of σ with colour coding for differ-ent methods employed in the estimation of the bin-number.
The figure 3 viewed as a 2D plot (as seen from the side) is given in figure 4. In this figure, the y-axis representing σ has been changed to logarithmic scale and since the 95% confidence bounds fall within the marker size of the scat-ter plot (as seen in figure 3), we have removed the error-bars in this plot. The figure 4 is plotted to show the variation of the MSE values between the different prescriptions. It is easily seen that the prescription given by Scott has the low-est ‘a’ value for every σ value used in the present simulation.
From equation (8), it is easily seen that the value of ‘a’ controls the rate
of decrease of MSE with increase in n – lower the value ‘a’ the faster is the decrease and vice-versa. Thus, we can take the value of ‘a’ as the overall per-formance index of a given prescription in terms of the MSE measure. From fig-ure 3, the Scott’s prescription is found to have the lowest value of ‘a’ and thus can be considered the optimal method as per the MSE measure.
Conclusion
The decrease in discrepancy in the estimation of the probability density function of a normal distribution using the method of histograms in terms of the

41
Transient 2017/ ISSN - 2250-0650
MSE measure is seen to have a non-lin-ear rate of decrease viz. a decrease pro-portional to the reciprocal of the sample size with reasonable accuracy. This rela-tion can be used to infer the number of samples that would be required to esti-mate the underlying normal probability density function for a given experiment to a specified level of accuracy. Further, from among the different methods for the estimation of the bin-number of his-togram, the Scott’s prescription is found to perform the best in our simulations in terms of the MSE score.
References
[1] Lane D M, Scott D, Hebl M, Guerra R, Osherson D and Zimmer H 2014. Introduction to statistics. United States
[2] Scott D W 2015. Multivariate density estimation: theory, practice, and visualization. United States, John Wiley & Sons
[3] Sturges H A 1926. The choice of a class interval. Journal of the american statistical association
21(153): 65-66
[4] Doane D P 1976. Aesthetic frequen-cy classifications. The American Statistician 30(4): 181-183
[5] Scott D W 1979. On optimal and da-ta-based histograms. Biometrika 66(3): 605-610
[6] Freedman D and Diaconis P, 1981. On the histogram as a density estimator: L2 theory. Zeitschrift für Wahrscheinlichkeitstheorie und verwandte Gebiete 57(4): 453-476
[7] Knuth K H 2006. Optimal data-based binning for histograms. arXiv preprint physics/0605197
[8] Mosteller F and Tukey J W 1977. Data analysis and regression: a second course in statistics. Unit-ed States, Addison-Wesley Pub. Co.

Transient 2017/ ISSN - 2250-0650
REVIEW PAPER

Transient 2017/ ISSN - 2250-0650
44
Transient 2017/ ISSN - 2250-0650
Economics of Turmeric (Curcura longa) Cultivation in Goalpara District of Assam
Krishnakhi Choudhury* and D C Kalita1
1 Department of Rural Developments and Agricultural Producatio, NEHU, Tura Campus, Tura
E-mail: [email protected]
Abstract
The present paper is an attempt to study the participation of people in the form of Cluster approach in turmeric (Curcura longa) cultivation in Goalpa-ra district of Assam. The present study is based on Primary data collected from Balijana block of Goalpara dis-trict, where 140 sample farmers were randomly selected from seven villages of the block. The Economics of Tur-meric cultivation was examined by using various cost concepts. The study revealed that the return from manage-ment in the average farm situation of individual turmeric growers was esti-mated to be Rs 6188.89. Amongst the various size groups, return from man-agement was found to be exhibited a decreasing trend with the increase in farm size. While the return from man-
agement in the average farm situation of cluster turmeric growers was esti-mated to be Rs 4649.33. Amongst the various size groups, return from man-agement was found to be exhibited an increasing trend with the increase in farm size.
Keywords: Economics, Cost Concept, Turmeric Cultivation, Cluster Based Ap-proach.
Introduction
Turmeric (Curcura longa) is known as the king of spices, and it is said that this spice belongs to India and also called ‘Indian Saffron’. India is the larg-est producer, consumer and exporter of turmeric which constitutes 82% of
45
Transient 2017/ ISSN - 2250-0650
world production followed by China, Myanmar and Bangladesh. As per Spice board of India- Annual report 2012-13, turmeric occupies about 6% of the total area under spices and condiment products in India. In the year 2008-09 the production was 94.59 thousand tons under 195.07 thousand ha of land which increased up to 973.09 tons under 192.91 thousand ha of land (Spice board of India- Annual report 2012-13).
Similarly the production of turmeric in Assam was 15583 tons with an area of 16309 ha in 2012-13 which has increased to 15906 tons with an area of 16244 ha in 2014-15 (Government of Assam, Direc-torate of economics and statistic, 2015). Turmeric is a valuable cash crop for cul-tivators as it is a ready cash crop and contributes to national economy as one of the major export commodities. The increase in production is possible main-ly through improvement in productivity of the crop that could be achieved by ef-ficient utilization of available resources.
As per 2010-11 turmeric production in North Eastern region is 6400.2 tons under 22,848 ha of land. Assam is en-dowed with diverse agro-climatic con-ditions, which permit growing of wide range of horticultural crops including spices and condiments. Horticulture crops cover an area of 5.75 lakh hect-
ares which account for 14.04 per cent of the total cultivable area of 40.99 lakh hectares in the state in the year 2011-12 (NEDFI).
Concerned over low agricultural growth rate and low levels of farm in-come, the Union agricultural ministry is working towards a plan to introduce cluster-based farming in the country. The cluster-based approach is aimed at forming a consolidated cultivable hold-ing dedicated to specific food grains, vegetables, spices and condiments, fruits and other horticulture crops (Leisa In-dia, Jun 2013). Cluster approach has the potential to contribute immensely as it involves organized effort for collective production and sharing of knowledge and available resources.
The cluster concept has gained prominence as an economic policy tool aimed to foster innovation and the growth of a competitive private sector in developing countries. A cluster consists of firms and related economic actors and institutions that draw productive advan-tage from their mutual proximity and connections. Over the last 2-3 decades, clusters approach has drawn substantial interest from policy makers, legislatures, business leaders, academics, economic development practitioners and develop-ment agencies (Irshad, 2009).

46
Transient 2017/ ISSN - 2250-0650
Methods and Materials
The present study was conducted in Goalpara district of Assam covering a total 140 sample turmeric growers. Out of 140 sample turmeric growers, 70 each belong to individual and cluster turmer-ic growers. The samples were selected by using random sampling procedure. The selected turmeric cultivator then strati-fied into three groups based on the area under turmeric cultivation viz., Group I (0-1.0 ha), Group II (1.01 to 2.00 ha) and Group III (2.01ha and above). The study mainly based on primary data which was collected by using survey schedule through the personal interview method of sampling.
Economics of turmeric cultivation was estimated based on various cost con-cepts like Cost-A, Cost-B and Cost-C along with per quintal net return, per hectare gross and net income following tabular analysis (Sharma et al.,1989). The cost and income concepts used in the present study are discussed below:
Cost Cost C2: It includes 10% of the total Cost (C1) on account of manageri-al function performed by the turmeric farmers.
Concept: Cost A1: Cost A1 includes hired human labour, value of seed of turmeric, marketing transportation cost
and depreciation on equipments and in-terest on working capital.
Cost B1: Cost A1 + interest value on fixed capital asset.
Cost C1: Cost B1 + imputed value of family labour
Variable Cost: Variable cost used in the present study includes the cost of la-bour, seed value and implements.
Fixed cost: Fixed cost includes the depreciation cost of land, implements and interest on fixed capital.
The family labour income was cal-culated by deducting cost B1 from gross income.
Net income: Net income was cal-culated by deducting Cost C1 from gross income.
Return from management: It was calculated by deducting Cost C2 from gross income.
Benefit cost ratio: Benefit cost ratio based on variable cost
BCR = Gross income / Variable cost
Benefit cost ratio on total cost (BCR) = Gross income / Total cost
47
Transient 2017/ ISSN - 2250-0650
Result and Discussion
Economics of turmeric production of individual turmeric growers across size groups:
In order to estimate the economics of turmeric production of individual turmeric growers, the concept of cost A1, Cost B1, Cost C1 and Cost C2 were estimated and discussed below.
Cost A1: The average cost A1 per hectare was estimated 61815.20 which was found to be highest in group-III farm (Rs 68386.73) and lowest group-II farm (Rs 57834.71). It was observed from the table that amongst the various items of Cost A1 in turmeric production of individual turmeric growers, value of rhizomes was highest at Rs 31588.95 per hectare in average situation followed by cost of fencing Rs 10280.02 per hectare.
Cost B1: Cost B1 was computed by adding the interest on value of own capi-tal asset to Cost A1. The average Cost B1 per hectare was found to be Rs 61858.62 which were found to be highest in the group-III and lowest in group-II farm.
Cost C1: In the present study Cost C1 was worked by adding the imputed value of family labour to Cost B1. The average Cost C1 per hectare was Rs 66393.86, which was found to be highest
in group-III and lowest in group-II farm.
Cost C2: Cost C2 was computed by taking 10% of the total cost on account of managerial function performed by in-dividual turmeric growers. The average Cost C2 was found to be Rs 72575.38 per hectare. Like the Cost C1, the Cost C2 per hectare was highest in group-III and lowest in group-II farm.
BCR based on variable cost: the variable cost used in the present study were cost of labour, rhizome, fencing, land preparation, fertilizer, mulching and cost of harvesting etc. The BCR based on variable cost was estimated to be 1.28 in the average farm situation. This was found to be exhibited a de-creasing trend with the increase in farm size being varied from 1.39 in group-I to 1.11 in group-III.
BCR based on total cost: The BCR based on total cost was also estimat-ed and it was 1.10 in the average farm situation. Like the BCR based on vari-able cost, this was also The BCR based on variable cost was estimated to be 1.28 in the average farm situation. This was found to be exhibited a decreasing trend with the increase in farm size be-ing varied from 1.22 in group-I to 0.92 in group-III.
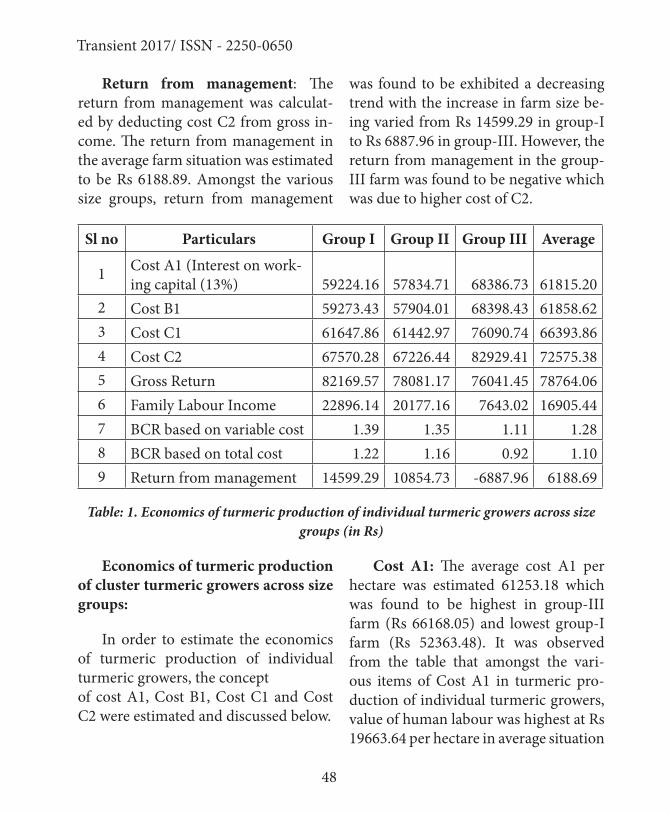
48
Transient 2017/ ISSN - 2250-0650
Return from management: The return from management was calculat-ed by deducting cost C2 from gross in-come. The return from management in the average farm situation was estimated to be Rs 6188.89. Amongst the various size groups, return from management
was found to be exhibited a decreasing trend with the increase in farm size be-ing varied from Rs 14599.29 in group-I to Rs 6887.96 in group-III. However, the return from management in the group-III farm was found to be negative which was due to higher cost of C2.
Sl no Particulars Group I Group II Group III Average
1 Cost A1 (Interest on work-ing capital (13%) 59224.16 57834.71 68386.73 61815.20
2 Cost B1 59273.43 57904.01 68398.43 61858.623 Cost C1 61647.86 61442.97 76090.74 66393.864 Cost C2 67570.28 67226.44 82929.41 72575.385 Gross Return 82169.57 78081.17 76041.45 78764.066 Family Labour Income 22896.14 20177.16 7643.02 16905.447 BCR based on variable cost 1.39 1.35 1.11 1.288 BCR based on total cost 1.22 1.16 0.92 1.109 Return from management 14599.29 10854.73 -6887.96 6188.69
Table: 1. Economics of turmeric production of individual turmeric growers across size groups (in Rs)
Economics of turmeric production of cluster turmeric growers across size groups:
In order to estimate the economics of turmeric production of individual turmeric growers, the concept of cost A1, Cost B1, Cost C1 and Cost C2 were estimated and discussed below.
Cost A1: The average cost A1 per hectare was estimated 61253.18 which was found to be highest in group-III farm (Rs 66168.05) and lowest group-I farm (Rs 52363.48). It was observed from the table that amongst the vari-ous items of Cost A1 in turmeric pro-duction of individual turmeric growers, value of human labour was highest at Rs 19663.64 per hectare in average situation

49
Transient 2017/ ISSN - 2250-0650
followed by cost of fencing Rs 10280.02 per hectare.
Cost B1: Cost B1 was computed by adding the interest on value of own capi-tal asset to Cost A1. The average Cost B1 per hectare was found to be Rs 61260.00 which were found to be highest in the group-III and lowest in group-I farm.
Cost C1: In the present study Cost C1 was worked by adding the imputed value of family labour to Cost B1. The average Cost C1 per hectare was Rs 80923.64, which was found to be highest in group-II and lowest in group-I farm.
Cost C2: Cost C2 was computed by taking 10% of the total cost on account of managerial function performed by in-dividual turmeric growers. The average Cost C2 was found to be Rs 87048.96 per hectare. Like the Cost C1, the Cost C2 per hectare was highest in group-II and lowest in group-I farm.
BCR based on variable cost: The variable cost used in the present study were cost of labour, rhizome, fencing, land preparation, fertilizer, mulching and cost of harvesting etc. The BCR based on variable cost was estimated to
be 1.50 in the average farm situation. This was found to be exhibited a de-creasing trend with the increase in farm size being varied from 1.55 in group-I to 1.67 in group-III.
BCR based on total cost: The BCR based on total cost was also estimated and it was 1.06 in the average farm sit-uation. Like the BCR based on variable cost, this was also The BCR based on variable cost was estimated to be 1.50 in the average farm situation. This was found to be highest in group-III (1.17) and lowest in group-II (0.88).
Return from management: The return from management was calculat-ed by deducting cost C2 from gross in-come. The return from management in the average farm situation was estimated to be Rs 4649.33. Amongst the various size groups, return from management was found to be exhibited an increasing trend with the increase in farm size be-ing varied from Rs 8445.45in group-I to Rs 16410.36 in group-III. However, the return from management in the group-II farm was found to be negative which was due to higher cost of family labour included in cost C2.
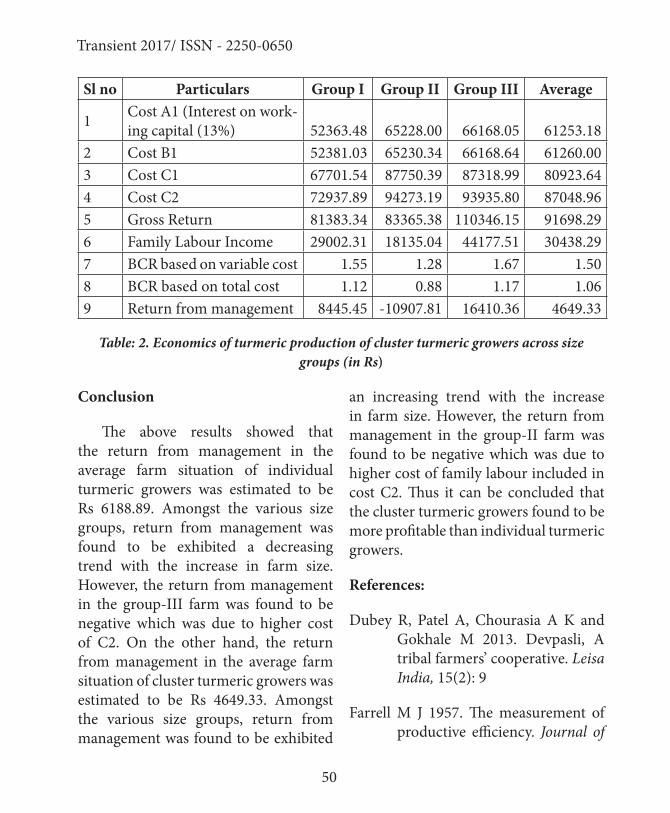
50
Transient 2017/ ISSN - 2250-0650
Sl no Particulars Group I Group II Group III Average
1 Cost A1 (Interest on work-ing capital (13%) 52363.48 65228.00 66168.05 61253.18
2 Cost B1 52381.03 65230.34 66168.64 61260.003 Cost C1 67701.54 87750.39 87318.99 80923.644 Cost C2 72937.89 94273.19 93935.80 87048.965 Gross Return 81383.34 83365.38 110346.15 91698.296 Family Labour Income 29002.31 18135.04 44177.51 30438.297 BCR based on variable cost 1.55 1.28 1.67 1.508 BCR based on total cost 1.12 0.88 1.17 1.069 Return from management 8445.45 -10907.81 16410.36 4649.33
Table: 2. Economics of turmeric production of cluster turmeric growers across size groups (in Rs)
Conclusion
The above results showed that the return from management in the average farm situation of individual turmeric growers was estimated to be Rs 6188.89. Amongst the various size groups, return from management was found to be exhibited a decreasing trend with the increase in farm size. However, the return from management in the group-III farm was found to be negative which was due to higher cost of C2. On the other hand, the return from management in the average farm situation of cluster turmeric growers was estimated to be Rs 4649.33. Amongst the various size groups, return from management was found to be exhibited
an increasing trend with the increase in farm size. However, the return from management in the group-II farm was found to be negative which was due to higher cost of family labour included in cost C2. Thus it can be concluded that the cluster turmeric growers found to be more profitable than individual turmeric growers.
References:
Dubey R, Patel A, Chourasia A K and Gokhale M 2013. Devpasli, A tribal farmers’ cooperative. Leisa India, 15(2): 9
Farrell M J 1957. The measurement of productive efficiency. Journal of
51
Transient 2017/ ISSN - 2250-0650
the Royal Statistical Society. 120: 253-290
Irshad H 2009. Cluster- A key to rural prosperity, Rural Development Division, Government of Alber-ta
Rahman M H, Shofiquzzoha A F M, Ali M Z and Nurullah M 1997. Nursery fish production in Ban-gladesh, An Empirical Study on Income and Efficiency Economic Affairs. 42 (1): 23-27.
Sharma L R and Tiwari S C 1989. Eco-nomics of Dry Ginger Produc-tion in Himachal Pradesh. Agri-
cultural Situation in India. 44 (9): 689-691.
http://www.business-standard.com/ar-ticle/markets/agri-min-work-ing-towards-cluster-based-farming-111021100040_1.html. Accessed on:30.7.2016
http://databank.nedfi.com/content/hor-ticultural-crops-0. Accessed on: 13.08.2016.
http://www.indianspice.com/sites/default/files/majoritemwise-Export2016/pdf.Accessed on: 13.08.2016.

52
Transient 2017/ ISSN - 2250-0650
Yield Variation of Rice and its Per Capita Requirement over Past Five Decades in North Eastern States of India
N Uttam Singh1*, Kishore K Das2, A Roy1, AnjooYumnam1, P K Sinha1, Bagish Kumar1 and A K Tripathi1
1 ICAR Research Complex for NEH Region, Umiam, Meghalaya2 Department of Statistics, Gauhati University, Guwahati, Assam
E-mail: [email protected]
Abstract
This paper investigates the tempo-ral variations in rice yield along with per capita requirement in the states of north eastern India. The study peri-od was from 1966-67 to 2014-15 and it had been divided into five periods: 1966-67 to 1974-75, 1975-76 to 1984-85, 1985-86 to 1994-95, 1995-96 to 2004-05 and 2005-06 to 2014-15 to have an understanding of decadal per-formance among the states. Variance analysis has depicted that yield varies slowly over each study period with a large variability among the states suggesting the identifiable state specif-ic factors. During the last decade i.e. 2005-06 to 2014-15 the average yield of an individual state over the years was between 287.5 (Mizoram in 2008) to
2903.3 (Tripura in 2015) and varied by 1316.3 across the states, but varied by 350 for each individual state over time. Similar pattern was observed in rest of the periods as well as in the entire period. Despite the north eastern re-gionhas shown a steady upward trend in area, production and productivity of rice in every period of the study, the region still has a deficit of 613 thou-sand tons of rice against the require-ment of the last census year during which only Arunachal Pradesh, Mani-pur Nagaland and Tripura are well suf-ficient while other states are all deficit in rice requirement. Though the pro-jected figure of deficit in 2021 (5.9%) is lower than that of 2011(8.6%), the region will fail to feed its population

53
Transient 2017/ ISSN - 2250-0650
of 53.25 million in 2021. Considering that rice is an irreplaceable staple of the region and states like Mizoram and Sikkim showing decreasing growth in area under rice during the last decade, the scope of meeting the rice require-ment of the region depend highly on productivity improvement.
Keywords: Rice yield, between vari-ance and within variance, surplus, deficit.
Introduction
Household food and nutritional se-curity of North-eastern region (NER) of India predominantly depends on rice. Rice is the principal food grain crop of the North Eastern hilly ecosystem fol-lowed by maize, occupying 3.51 million hectares which accounts for more than 80% of thetotal cultivated area of the re-gion and 7.8 per cent of the total rice area in India while its share in national rice production is only 5.9 per cent (RKMP, DRR). The total rice production of the region is estimated to be around 7.1 million tones with average productivi-ty of 2.1 t/ha, which is much below the national average of 2.4 t/ha as per trien-nium ending 2015 (GOI, 2016). During the post-green revolution period due to introduction of improved varieties, the rice yield in the region has been en-hanced up to 40% that plays a pivotal role
in increasing the productivity (RKMP, DRR). Rice cultivation in the region is exposed to different biotic and abiotic stresses that include extreme tempera-tures at the time of flowering and grain filling stages thus resulting a very dismal figure in rice productivity and produc-tion of the region which in turn reflects a lower per capita consumption as well. The NE region is considered to be one of the hot pockets of rice genetic resources in the world and a potential rice-grow-ing region with extremely diverse rice growing conditions as compared to oth-er parts of the country. With the above background and with broad objective of analyzing the variability of domestic rice yield, the present study was taken up with the specific objective to analyze the temporal dynamics of between and within vitiation whereby estimating the per capita requirement of rice in the re-gion.
Materials and methods
Secondary data on area, produc-tion and productivity of rice from de-partment of economics and statistics, Ministry of agriculture were compiled. According to the availability of data the study was made for the entire peri-od 1966-67 to 2014-15 and in turn the entire period was decomposed into five periods viz Period 1: 1966-67 to 1974-

54
Transient 2017/ ISSN - 2250-0650
75, Period 2:1975-76 to 1984-85, Period 3:1985-86 to 1994-95, Period 4:1995-96 to 2004-05 and Period 5:2005-06 to 2014-15 to have an understanding of decadal performance.
Variation types
Variance analysis was carried out to measure the average degree to which each point differs from the average of area, production and yield across the individual states over the sequence of five consecutive decades. By inspection through the time series cross sectional data used in the study it is obvious and vivid that, there is a large variation in area and production among the states while yield being the ratio of the two is more stationery and proportionate; and
hence, variation analysis on yield, rath-er than area and production, is more meaningful. Here, three variation types viz overall, between and within varia-tions are discussed. Overall variation refers to variation over time and indi-viduals. Between variations examines the variation that exists between indi-viduals that may be caused by specific identifiable factors. Within variation is a measure of how much an individ-ual in the sample tends to change (or vary) over time. In other words, with-in variation is the mean of the change for the average individual case in the sample. These variations are inspected to have an idea of variation across the individuals over time. [Gelman, An-drew (2005), Anscombe, F. J. (1948), Bailey, R. A. (2008).]
Per capita requirement analysis
To work out whether the rice pro-duction in the states of the region is sufficient in feeding the increasing pop-ulation, triennium ending (TE) pro-
ductions of 1970-71, 1980-81, 1990-91, 2000-01 and 2010-11 have been worked out and corresponding surplus or defi-cits were generated using population data of 1971, 1981, 1991, 2001 and 2011. ICMR recommendation of 157Kg per
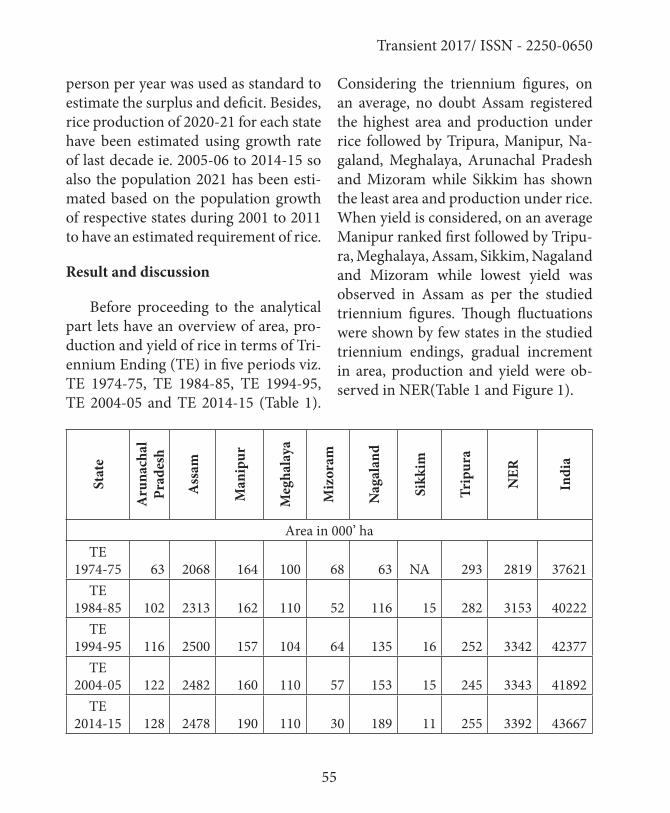
55
Transient 2017/ ISSN - 2250-0650
person per year was used as standard to estimate the surplus and deficit. Besides, rice production of 2020-21 for each state have been estimated using growth rate of last decade ie. 2005-06 to 2014-15 so also the population 2021 has been esti-mated based on the population growth of respective states during 2001 to 2011 to have an estimated requirement of rice.
Result and discussion
Before proceeding to the analytical part lets have an overview of area, pro-duction and yield of rice in terms of Tri-ennium Ending (TE) in five periods viz. TE 1974-75, TE 1984-85, TE 1994-95, TE 2004-05 and TE 2014-15 (Table 1).
Considering the triennium figures, on an average, no doubt Assam registered the highest area and production under rice followed by Tripura, Manipur, Na-galand, Meghalaya, Arunachal Pradesh and Mizoram while Sikkim has shown the least area and production under rice. When yield is considered, on an average Manipur ranked first followed by Tripu-ra, Meghalaya, Assam, Sikkim, Nagaland and Mizoram while lowest yield was observed in Assam as per the studied triennium figures. Though fluctuations were shown by few states in the studied triennium endings, gradual increment in area, production and yield were ob-served in NER(Table 1 and Figure 1).
Stat
e
Aru
nach
al
Prad
esh
Ass
am
Man
ipur
Meg
hala
ya
Miz
oram
Nag
alan
d
Sikk
im
Trip
ura
NER
Indi
a
Area in 000’ haTE
1974-75 63 2068 164 100 68 63 NA 293 2819 37621TE
1984-85 102 2313 162 110 52 116 15 282 3153 40222TE
1994-95 116 2500 157 104 64 135 16 252 3342 42377TE
2004-05 122 2482 160 110 57 153 15 245 3343 41892TE
2014-15 128 2478 190 110 30 189 11 255 3392 43667
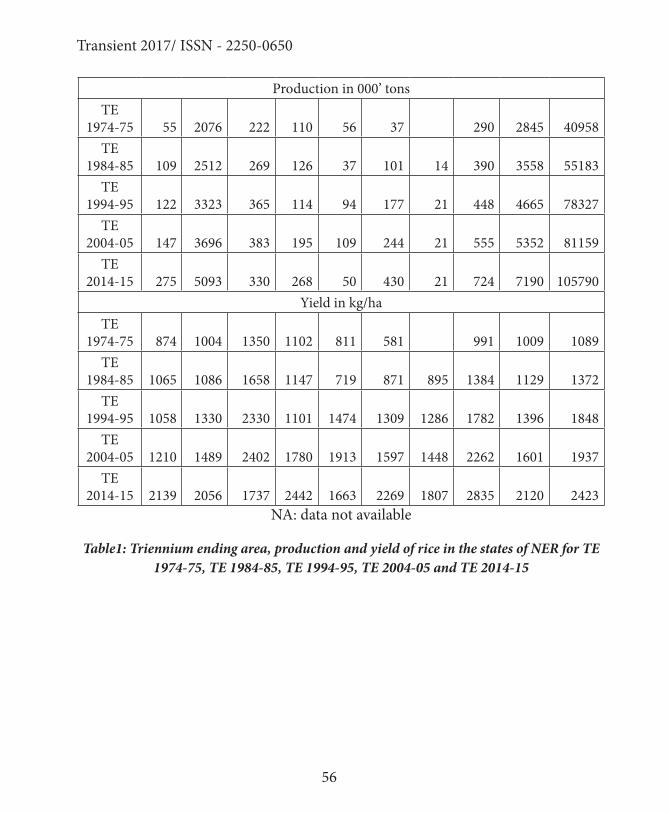
56
Transient 2017/ ISSN - 2250-0650
Production in 000’ tonsTE
1974-75 55 2076 222 110 56 37 290 2845 40958TE
1984-85 109 2512 269 126 37 101 14 390 3558 55183TE
1994-95 122 3323 365 114 94 177 21 448 4665 78327TE
2004-05 147 3696 383 195 109 244 21 555 5352 81159TE
2014-15 275 5093 330 268 50 430 21 724 7190 105790Yield in kg/ha
TE 1974-75 874 1004 1350 1102 811 581 991 1009 1089
TE 1984-85 1065 1086 1658 1147 719 871 895 1384 1129 1372
TE 1994-95 1058 1330 2330 1101 1474 1309 1286 1782 1396 1848
TE 2004-05 1210 1489 2402 1780 1913 1597 1448 2262 1601 1937
TE 2014-15 2139 2056 1737 2442 1663 2269 1807 2835 2120 2423
NA: data not available
Table1: Triennium ending area, production and yield of rice in the states of NER for TE 1974-75, TE 1984-85, TE 1994-95, TE 2004-05 and TE 2014-15

57
Transient 2017/ ISSN - 2250-0650
Figure 1: Area, production and yield of rice in NER for TE 1974-75, TE 1984-85, TE 1994-95, TE 2004-05 and TE 2014-15
Variation of yield across the individual states over the years
TE ending average of area, produc-tion and yield as discussed above is sim-ply the average of the data point used. Here the interest is on variation to mea-sure the average degree to which each point differs from the average. In all the five periods as well as the entire period yield was found more between varia-tions than within variation. Overall vari-ation of yield across the individual states over each period of years was quite less than that of the between variation as the within variation is comparatively lower. This indicates the existence of specific identifiable state specific factors that causes the variation in a large scale. The probable state specific factors may be
government policies, agriculture input technologies, topography, soil fertility, natural resources, agriculture function-aries, etc. As an example for discussion let’s take period 5, being the most recent decade (2005-06 to 2014-15) in which the average yield of Mizoram, by inspec-tion the studied dataset is 1227 kg/ha being the lowest while that of Manipur is 2180.6 kg/ha being the highest. The year 2007 has the lowest average (1481.1 kg/ ha) and the year 2013 has the high-est average (2034.2 kg/ha) yield when we look time wise during the period.How-ever, in this period the average yield of an individual state over the years is be-tween 287.5 kg/ha (Mizoram in 2008) to 2903.3 kg/ha (Tripura in 2015) and varies by 1316.3 across the states (be-
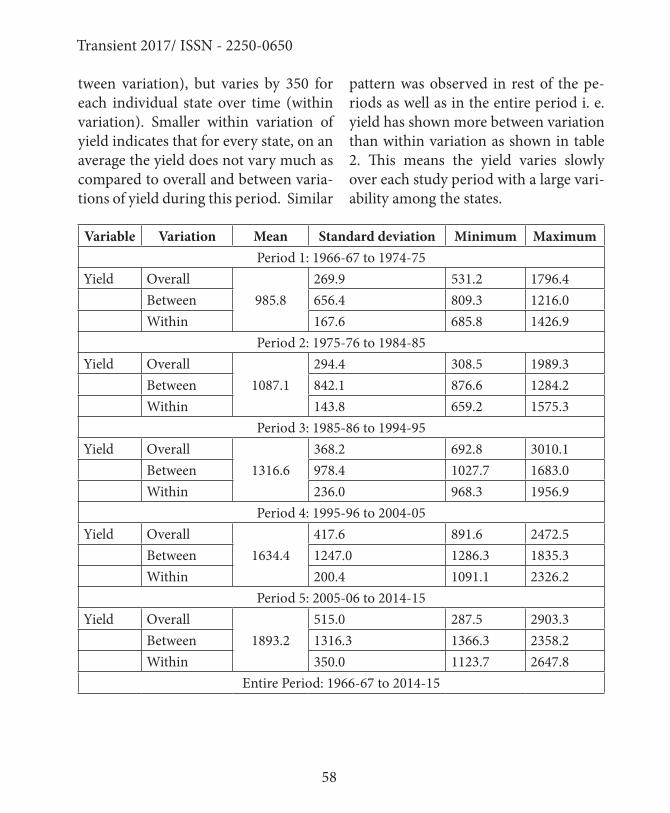
58
Transient 2017/ ISSN - 2250-0650
tween variation), but varies by 350 for each individual state over time (within variation). Smaller within variation of yield indicates that for every state, on an average the yield does not vary much as compared to overall and between varia-tions of yield during this period. Similar
pattern was observed in rest of the pe-riods as well as in the entire period i. e. yield has shown more between variation than within variation as shown in table 2. This means the yield varies slowly over each study period with a large vari-ability among the states.
Variable Variation Mean Standard deviation Minimum Maximum Period 1: 1966-67 to 1974-75
Yield Overall985.8
269.9 531.2 1796.4Between 656.4 809.3 1216.0Within 167.6 685.8 1426.9
Period 2: 1975-76 to 1984-85Yield Overall
1087.1294.4 308.5 1989.3
Between 842.1 876.6 1284.2Within 143.8 659.2 1575.3
Period 3: 1985-86 to 1994-95Yield Overall
1316.6368.2 692.8 3010.1
Between 978.4 1027.7 1683.0Within 236.0 968.3 1956.9
Period 4: 1995-96 to 2004-05Yield Overall
1634.4417.6 891.6 2472.5
Between 1247.0 1286.3 1835.3Within 200.4 1091.1 2326.2
Period 5: 2005-06 to 2014-15Yield Overall
1893.2515.0 287.5 2903.3
Between 1316.3 1366.3 2358.2Within 350.0 1123.7 2647.8
Entire Period: 1966-67 to 2014-15

59
Transient 2017/ ISSN - 2250-0650
Yield Overall1415.2
512.6 287.5 3010.1Between 1830.2 734.0 2404.2Within 450.5 910.1 1998.0
Table 2: Overall, between and within variation of yield
Referring figure. 2, it was clearly ob-served that overall, between and within variation of rice yield exhibit gradual increase over the period 1 to period 5 where the quantity and rate of increment is highest for between variation and least for within variation during this five con-secutive periods. This means that state
specific factors are becoming more spe-cific resulting into the variability larger among the states in the course of time. If the between variance is smaller than the within variance, then the means are really close to each other and we will fail to reject the claim that they are all equal.
Figure. 2: Overall, between and within variation of rice yield during the decades 1966-67 to 1974-75, 1975-76 to 1984-85, 185-86 to 1994-95, 1995-96 to 2004-05 and 2005-06 to 2014-15 and entire period 1966-67 to 2014-15
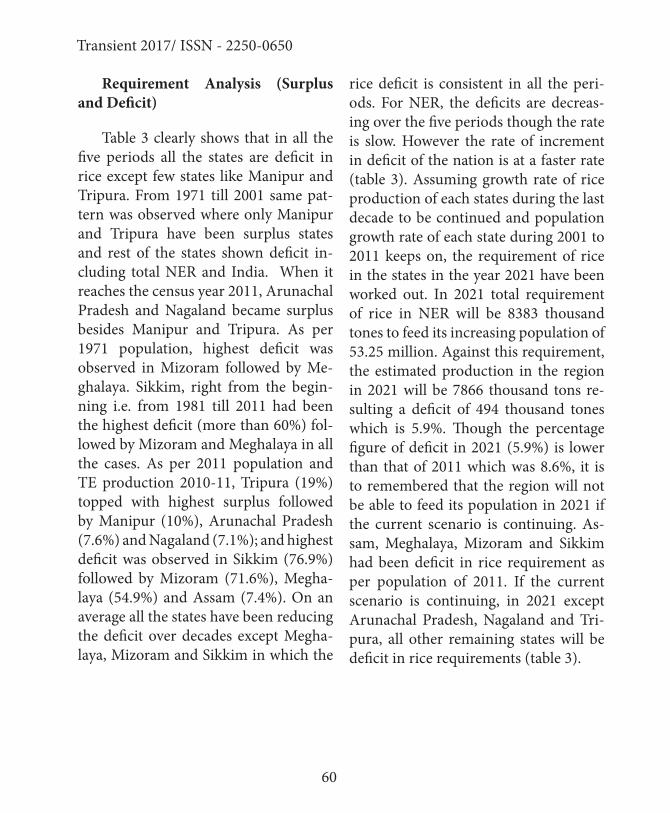
60
Transient 2017/ ISSN - 2250-0650
Requirement Analysis (Surplus and Deficit)
Table 3 clearly shows that in all the five periods all the states are deficit in rice except few states like Manipur and Tripura. From 1971 till 2001 same pat-tern was observed where only Manipur and Tripura have been surplus states and rest of the states shown deficit in-cluding total NER and India. When it reaches the census year 2011, Arunachal Pradesh and Nagaland became surplus besides Manipur and Tripura. As per 1971 population, highest deficit was observed in Mizoram followed by Me-ghalaya. Sikkim, right from the begin-ning i.e. from 1981 till 2011 had been the highest deficit (more than 60%) fol-lowed by Mizoram and Meghalaya in all the cases. As per 2011 population and TE production 2010-11, Tripura (19%) topped with highest surplus followed by Manipur (10%), Arunachal Pradesh (7.6%) and Nagaland (7.1%); and highest deficit was observed in Sikkim (76.9%) followed by Mizoram (71.6%), Megha-laya (54.9%) and Assam (7.4%). On an average all the states have been reducing the deficit over decades except Megha-laya, Mizoram and Sikkim in which the
rice deficit is consistent in all the peri-ods. For NER, the deficits are decreas-ing over the five periods though the rate is slow. However the rate of increment in deficit of the nation is at a faster rate (table 3). Assuming growth rate of rice production of each states during the last decade to be continued and population growth rate of each state during 2001 to 2011 keeps on, the requirement of rice in the states in the year 2021 have been worked out. In 2021 total requirement of rice in NER will be 8383 thousand tones to feed its increasing population of 53.25 million. Against this requirement, the estimated production in the region in 2021 will be 7866 thousand tons re-sulting a deficit of 494 thousand tones which is 5.9%. Though the percentage figure of deficit in 2021 (5.9%) is lower than that of 2011 which was 8.6%, it is to remembered that the region will not be able to feed its population in 2021 if the current scenario is continuing. As-sam, Meghalaya, Mizoram and Sikkim had been deficit in rice requirement as per population of 2011. If the current scenario is continuing, in 2021 except Arunachal Pradesh, Nagaland and Tri-pura, all other remaining states will be deficit in rice requirements (table 3).

61
Transient 2017/ ISSN - 2250-0650
Stat
e
Aru
nach
al
Prad
esh
Ass
am
Man
ipur
Meg
hala
ya
Miz
oram
Nag
alan
d
Sikk
im
Trip
ura
NER
Indi
a
1971TE Pro-duction 47 1982 183 74 18 46 NA 254 2604 41908
Require-ment 74 2296 169 159 52 81 33 244 3108 86061
Surplus/Deficit -26 -314 15 -85 -34 -35 NA 10 -503 -44153
% Surplus/Deficit -36.0 -13.7 8.1 -53.4 -65.0 -43.6 NA 3.8 -16.2 -51.3
1981TE Pro-duction 87 2213 251 126 25 81 12 347 3134 49737
Require-ment 99 2832 223 210 78 122 50 322 3936 107283
Surplus/Deficit -13 -619 28 -83 -52 -41 -38 25 -802 -57546
% Surplus/Deficit -12.6 -21.9 11.2 -39.7 -67.3 -33.9 -75.9 7.1 -20.4 -53.6
1991TE Pro-duction 141 3087 287 119 65 152 24 478 4353 74181
Require-ment 136 3519 289 279 108 190 64 433 5017 132888
Surplus/Deficit 6 -432 -2 -159 -44 -38 -40 45 -664 -58708
% Surplus/Deficit 3.9 -12.3 -0.7 -57.2 -40.4 -20.0 -63.1 9.5 -13.2 -44.2
2001TE Pro-duction 134 3905 378 180 99 200 22 536 5453 89333
62
Transient 2017/ ISSN - 2250-0650
Require-ment 172 4182 360 362 140 312 85 501 6115 161512
Surplus/Deficit -38 -278 18 -183 -40 -113 -63 34 -662 -72179
% Surplus/Deficit -22.3 -6.6 4.7 -50.4 -28.9 -36.0 -73.7 6.4 -10.8 -44.7
2011TE Pro-duction 235 4530 478 210 49 335 22 687 6544 96795
Require-ment 217 4894 427 465 171 311 95 576 7157 190000
Surplus/Deficit 18 -364 50 -255 -123 24 -73 111 -613 -93206
% Surplus/Deficit 7.6 -7.4 10.5 -54.9 -71.6 7.1 -76.9 19.2 -8.6 -49.1
2021Estimated Production 315 5581 330 317 62 489 20 772 7866 107519
Estimated Require-ment
274 5736 479 596 213 309 108 662 8360 223681
Estimated Surplus/Deficit
41 -154 -148 -279 -150 180 -88 109 -494 -116161
% Surplus/Deficit 13.0 -2.7 -31.0 -46.7 -70.6 36.8 -81.7 14.2 -5.9 -51.9
–ve: deficit otherwise surplusAll figures being in ‘000 tones ICMR recommendation: 157Kg per person per yearNA: data not available
Table 3: Requirement of rice as per the population of 1971, 1981, 1991, 2001 and 2011 with corresponding productions of TE 1970-71, TE 1980-81, TE 1990-91, TE 2000-01
and TE 2010-11 along with corresponding surplus or deficit in the states of NER.
Summary and Conclusion Temporal analysis of variation in five
decades reveals that in all the five pe-riods as well as the entire period yield has more between variations than with-

63
Transient 2017/ ISSN - 2250-0650
in variation. Overall variation of yield across the individual states over each period of years is quite less than that of the between variation as the within vari-ation is comparatively lower. This indi-cates the existence of identifiable state specific factors that causes the variation in a large scale. The probable state specif-ic factors may be government policies, agriculture input technologies, topogra-phy, soil fertility, natural resources, ag-riculture functionaries, etc. Among the various state specific factors, location specific high yielding varieties (HYVs) and their adoption are most important. Because of wide variation in agrocli-matic conditions varietal requirements are highly specific and a good number of HYVs are needed to fulfill require-ment. Though area, production and pro-ductivity of rice in NER have shown a steady upward trend in every period of the study, the result of surplus and defi-cit analysis shows that only Arunachal Pradesh, Manipur Nagaland and Tripura are well sufficient while other states are all deficit in rice requirement as per the population of census year 2011. In spite of the projected figure of deficit in 2021 (5.9%) is lower than that of 2011(8.6%), it is to remember that the region will not be able to feed its 53. 25 million popu-lation in 2021 where only Arunachal Pradesh, Nagaland and Tripura will be rice sufficient states if the current sce-
nario is continuing. Considering that rice is an irreplaceable staple of the re-gion and states like Mizoram and Sik-kim showing decreasing growth in area under rice during the last decade as seen from the dataset used in the study, the scope of meeting the rice requirement of the region depend highly on productivi-ty improvement.
ReferencesAnscombe F J 1948. “The Validi-
ty of Comparative Experi-ments”. Journal of the Royal Statistical Society. Series A (General). 111 (3): 181–211
Bailey R A 2008. Design of Compara-tive Experiments. Cambridge University Press. ISBN 978-0-521-68357-9.
Directorate of Economics and Statistics, Department of Agriculture, Co-operation and Farmers Welfare, Ministry of Agriculture and Farmers Welfare, Govt. of In-dia. http://eands.dacnet.nic.in/
Gelman A 2005. “Analysis of variance? Why it is more important than ever”. The Annals of Statis-tics. 33: 1–53.
Rice Knowledge Management Portal (RKMP) http://www.rkmp.co.in, Directorate of Rice Re-search, Rajendranagar, Hyder-abad 500030
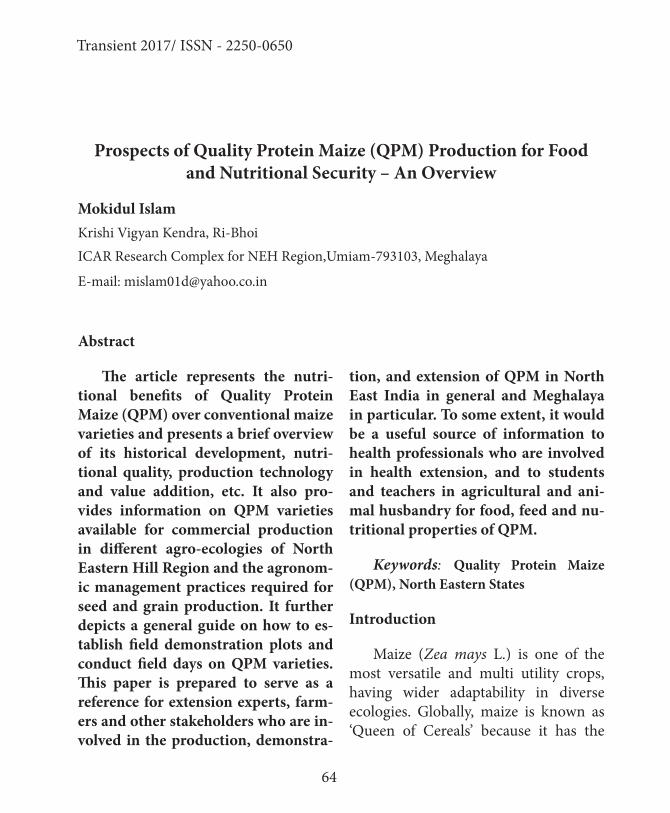
64
Transient 2017/ ISSN - 2250-0650
Prospects of Quality Protein Maize (QPM) Production for Food and Nutritional Security – An Overview
Mokidul IslamKrishi Vigyan Kendra, Ri-BhoiICAR Research Complex for NEH Region,Umiam-793103, Meghalaya
E-mail: [email protected]
Abstract
The article represents the nutri-tional benefits of Quality Protein Maize (QPM) over conventional maize varieties and presents a brief overview of its historical development, nutri-tional quality, production technology and value addition, etc. It also pro-vides information on QPM varieties available for commercial production in different agro-ecologies of North Eastern Hill Region and the agronom-ic management practices required for seed and grain production. It further depicts a general guide on how to es-tablish field demonstration plots and conduct field days on QPM varieties. This paper is prepared to serve as a reference for extension experts, farm-ers and other stakeholders who are in-volved in the production, demonstra-
tion, and extension of QPM in North East India in general and Meghalaya in particular. To some extent, it would be a useful source of information to health professionals who are involved in health extension, and to students and teachers in agricultural and ani-mal husbandry for food, feed and nu-tritional properties of QPM.
Keywords: Quality Protein Maize (QPM), North Eastern States
Introduction
Maize (Zea mays L.) is one of the most versatile and multi utility crops, having wider adaptability in diverse ecologies. Globally, maize is known as ‘Queen of Cereals’ because it has the
65
Transient 2017/ ISSN - 2250-0650
highest genetic yield potential among the cereals. It is cultivated on nearly 150 m ha in about 160 countries having wid-er diversity of soil, climate, biodiversity and management practices that contrib-utes 36 % (782 mt) in the global grain production. The United States of Amer-ica (USA) is the largest producer of maize contributes nearly 35 % of the to-tal production in the world and maize is the driver of the US economy. The USA has the highest productivity (> 9.6 t ha-1) which is double than the global average (4.92 t ha-1). Whereas, the average pro-ductivity in India is only 2.43 t ha-1. In India, maize is the third most important food crops after rice and wheat. Accord-ing to advance estimate it is cultivated in about 8.7 m ha (2010) mainly during Kharif season which covers 80% area. Maize in India, contributes nearly 9 % in the national food basket and more than Rs. 100 billion to the agricultural GDP at current prices apart from the generating employment to over 100 million man-days at the farm and downstream agri-cultural and industrial sectors. In addi-tion to staple food for human being and quality feed for animals, maize serves as a basic raw material as an ingredient to thousands of industrial products that in-cludes starch, oil, protein, alcoholic bev-erages, food sweeteners, pharmaceutical, cosmetic, film, textile, gum, package and paper industries, etc is the major source
of staple food (17%), feed (61%), fod-der and industrial raw material (22%) and provides enormous opportunity for crop diversification, value addition and employment generation (Jat et al., 2011). Presently, maize production is 21.8mil-lion tons and projected demand of maize to be 45 million tonnes by 2030 (Kumar et al., 2013). This demand of maize will be met either by technological inter-vention or by bringing more area under maize cultivation. The technological interventions for meeting this demand will be adoption of high yielding single cross hybrids seeds, biotechnological intervention and improved package of practices in different agro- ecological regions of the country. Maize is also grown for many other special purposes viz . quality protein maize, sweet corn, baby corn, pop corn, waxy corn, high oil and high amylase corn. It is also a solu-tion for various stresses like weed and lowering water table and abiotic stress-es like drought, terminal heat, cold, etc. besides providing opportunity for farm mechanization and conservation agri-culture and consequently increasing the resource-use efficiency and farm profit-ability. It is now well established that the adoption of appropriate management practices may prove favourable for sus-taining crop productivity and reducing ecological hazards. There is a scope of manipulating production technologies

66
Transient 2017/ ISSN - 2250-0650
in respect of crop diversification, re-source conservation, insect-pest control for improving crop yields on sustainable basis. To make farming sustainable and economically viable, there is a need for rethinking, planning and management in order to face the emerging challeng-es. Research on maize production sys-tems has therefore provided exciting opportunities for improving input use ef-ficiency, productivity and sustainability. Innovative practices are being attempted to improve productivity, resource-use efficiency and livelihood security. Pres-ently, in India, maize is mainly used for preparation of poultry feed (51%) and extraction of starch (12%) and also provides food (23%), cattle feed (12%), brewery (1%), seeds (1%) fodder and basic raw material for the various indus-tries viz. bio-fuel, food sweeteners, cos-metics and alcoholic beverages etc (Jat et al., 2011). These diversified uses of maize also prompted higher production across the country.
Maize is the second largest cereal crop cultivated in the North Eastern Re-gion except Sikkim where it is the prin-cipal crop. It is grown in a wide range of climatic conditions and altitude rang-ing from low (upto 800m), medium ( 800-1300 m) to high (1300 and above) as a rainfed crop in Jhum land both as monocrop or mixed crop. It has very
high potential and is a promising crop for the purpose of human consump-tion as well as animal feed. The average productivity of maize in North Eastern Hill (NEH) region is even lower than that of national average and far behind global average, showing a greater need to enhance the yield potential of this crop. The yield can be increased through adoption of high yielding varieties and improved management technologies. Maize is a good source of carbohydrates, fats, proteins and some of the import-ant vitamins and minerals. However, in spite of several important uses, maize has been found to be deficient in two es-sential amino acids i.e. lysine and tryp-tophan. This leads to poor net protein utilization and low biological value of traditional maize. In order to overcome this problem, quality protein maize has been developed by maize breeders by incorporating opaque-2 mutant gene which is responsible for enhancing ly-sine and tryptophan content of maize endosperm protein. QPM looks and taste like ordinary maize with same or higher yield potential, but it contains nearly twice the quantity of essential amino acids, lysine and tryptophan which makes it rich in quality proteins. The maize varieties presently grown by farmers, hereafter referred to as conven-tional maize (CM) varieties, are deficient in this two essential amino acids i.e., ly-
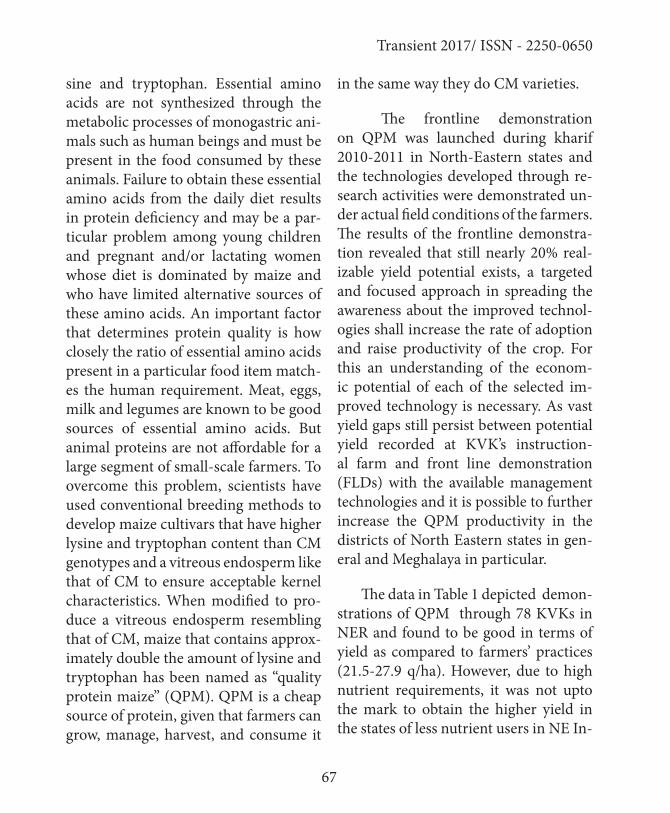
67
Transient 2017/ ISSN - 2250-0650
sine and tryptophan. Essential amino acids are not synthesized through the metabolic processes of monogastric ani-mals such as human beings and must be present in the food consumed by these animals. Failure to obtain these essential amino acids from the daily diet results in protein deficiency and may be a par-ticular problem among young children and pregnant and/or lactating women whose diet is dominated by maize and who have limited alternative sources of these amino acids. An important factor that determines protein quality is how closely the ratio of essential amino acids present in a particular food item match-es the human requirement. Meat, eggs, milk and legumes are known to be good sources of essential amino acids. But animal proteins are not affordable for a large segment of small-scale farmers. To overcome this problem, scientists have used conventional breeding methods to develop maize cultivars that have higher lysine and tryptophan content than CM genotypes and a vitreous endosperm like that of CM to ensure acceptable kernel characteristics. When modified to pro-duce a vitreous endosperm resembling that of CM, maize that contains approx-imately double the amount of lysine and tryptophan has been named as “quality protein maize” (QPM). QPM is a cheap source of protein, given that farmers can grow, manage, harvest, and consume it
in the same way they do CM varieties.
The frontline demonstration on QPM was launched during kharif 2010-2011 in North-Eastern states and the technologies developed through re-search activities were demonstrated un-der actual field conditions of the farmers. The results of the frontline demonstra-tion revealed that still nearly 20% real-izable yield potential exists, a targeted and focused approach in spreading the awareness about the improved technol-ogies shall increase the rate of adoption and raise productivity of the crop. For this an understanding of the econom-ic potential of each of the selected im-proved technology is necessary. As vast yield gaps still persist between potential yield recorded at KVK’s instruction-al farm and front line demonstration (FLDs) with the available management technologies and it is possible to further increase the QPM productivity in the districts of North Eastern states in gen-eral and Meghalaya in particular.
The data in Table 1 depicted demon-strations of QPM through 78 KVKs in NER and found to be good in terms of yield as compared to farmers’ practices (21.5-27.9 q/ha). However, due to high nutrient requirements, it was not upto the mark to obtain the higher yield in the states of less nutrient users in NE In-
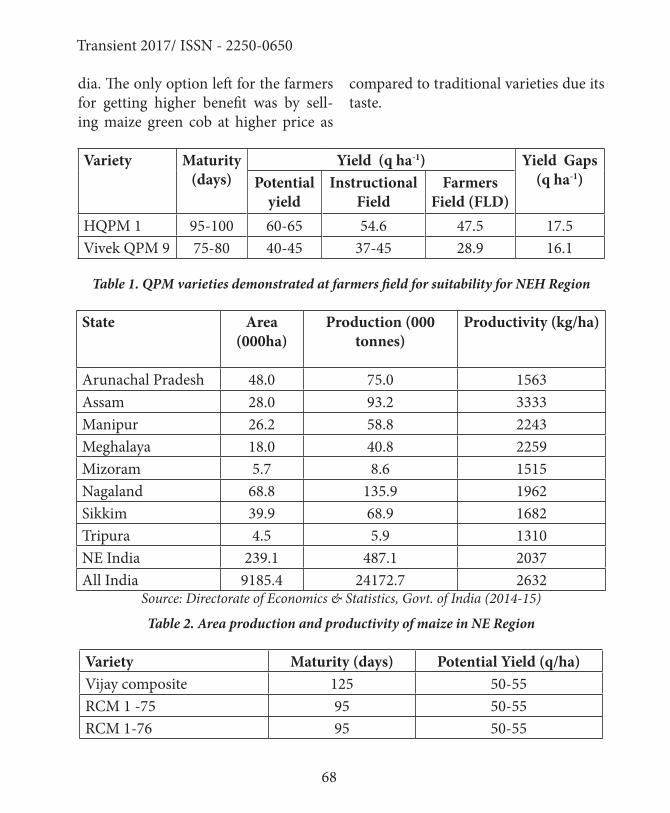
68
Transient 2017/ ISSN - 2250-0650
dia. The only option left for the farmers for getting higher benefit was by sell-ing maize green cob at higher price as
compared to traditional varieties due its taste.
Variety Maturity (days)
Yield (q ha-1) Yield Gaps (q ha-1)Potential
yieldInstructional
FieldFarmers
Field (FLD)HQPM 1 95-100 60-65 54.6 47.5 17.5Vivek QPM 9 75-80 40-45 37-45 28.9 16.1
Table 1. QPM varieties demonstrated at farmers field for suitability for NEH Region
State Area (000ha)
Production (000 tonnes)
Productivity (kg/ha)
Arunachal Pradesh 48.0 75.0 1563Assam 28.0 93.2 3333Manipur 26.2 58.8 2243Meghalaya 18.0 40.8 2259Mizoram 5.7 8.6 1515Nagaland 68.8 135.9 1962Sikkim 39.9 68.9 1682Tripura 4.5 5.9 1310NE India 239.1 487.1 2037All India 9185.4 24172.7 2632
Source: Directorate of Economics & Statistics, Govt. of India (2014-15)
Table 2. Area production and productivity of maize in NE Region
Variety Maturity (days) Potential Yield (q/ha)Vijay composite 125 50-55RCM 1 -75 95 50-55RCM 1-76 95 50-55
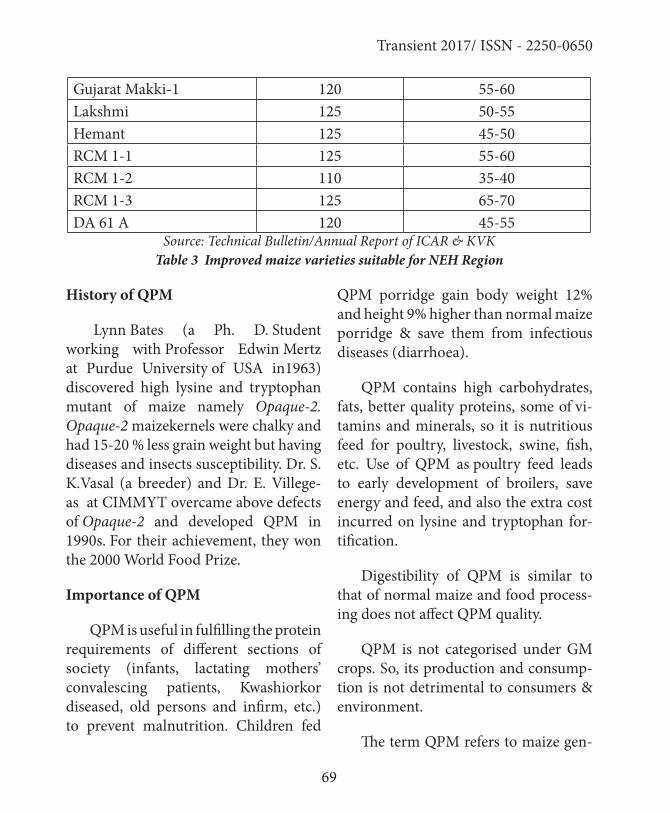
69
Transient 2017/ ISSN - 2250-0650
Gujarat Makki-1 120 55-60Lakshmi 125 50-55Hemant 125 45-50RCM 1-1 125 55-60RCM 1-2 110 35-40RCM 1-3 125 65-70DA 61 A 120 45-55
Source: Technical Bulletin/Annual Report of ICAR & KVKTable 3 Improved maize varieties suitable for NEH Region
History of QPM
Lynn Bates (a Ph. D. Student working with Professor Edwin Mertz at Purdue University of USA in1963) discovered high lysine and tryptophan mutant of maize namely Opaque-2. Opaque-2 maizekernels were chalky and had 15-20 % less grain weight but having diseases and insects susceptibility. Dr. S. K.Vasal (a breeder) and Dr. E. Villege-as at CIMMYT overcame above defects of Opaque-2 and developed QPM in 1990s. For their achievement, they won the 2000 World Food Prize.
Importance of QPM
QPM is useful in fulfilling the protein requirements of different sections of society (infants, lactating mothers’ convalescing patients, Kwashiorkor diseased, old persons and infirm, etc.) to prevent malnutrition. Children fed
QPM porridge gain body weight 12% and height 9% higher than normal maize porridge & save them from infectious diseases (diarrhoea).
QPM contains high carbohydrates, fats, better quality proteins, some of vi-tamins and minerals, so it is nutritious feed for poultry, livestock, swine, fish, etc. Use of QPM as poultry feed leads to early development of broilers, save energy and feed, and also the extra cost incurred on lysine and tryptophan for-tification.
Digestibility of QPM is similar to that of normal maize and food process-ing does not affect QPM quality.
QPM is not categorised under GM crops. So, its production and consump-tion is not detrimental to consumers & environment.
The term QPM refers to maize gen-
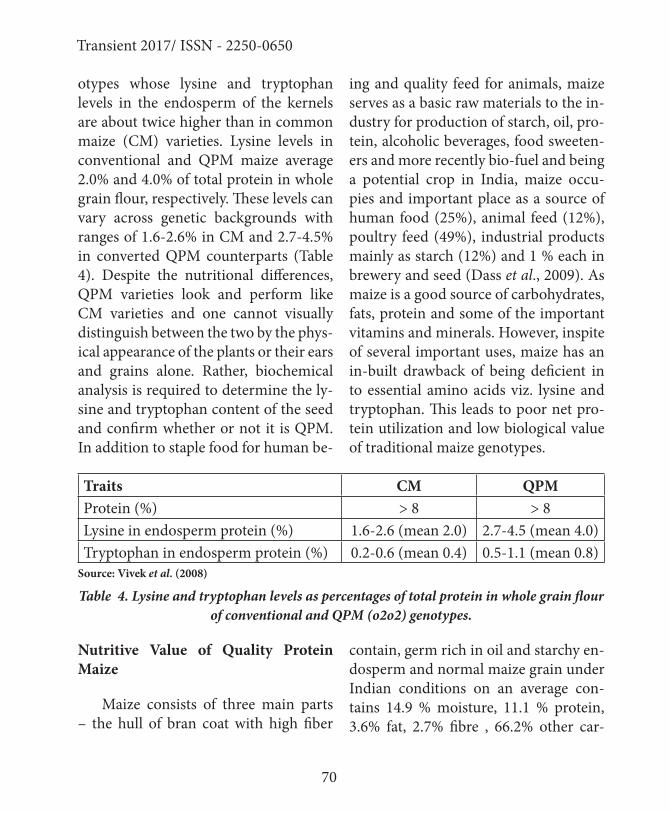
70
Transient 2017/ ISSN - 2250-0650
otypes whose lysine and tryptophan levels in the endosperm of the kernels are about twice higher than in common maize (CM) varieties. Lysine levels in conventional and QPM maize average 2.0% and 4.0% of total protein in whole grain flour, respectively. These levels can vary across genetic backgrounds with ranges of 1.6-2.6% in CM and 2.7-4.5% in converted QPM counterparts (Table 4). Despite the nutritional differences, QPM varieties look and perform like CM varieties and one cannot visually distinguish between the two by the phys-ical appearance of the plants or their ears and grains alone. Rather, biochemical analysis is required to determine the ly-sine and tryptophan content of the seed and confirm whether or not it is QPM. In addition to staple food for human be-
ing and quality feed for animals, maize serves as a basic raw materials to the in-dustry for production of starch, oil, pro-tein, alcoholic beverages, food sweeten-ers and more recently bio-fuel and being a potential crop in India, maize occu-pies and important place as a source of human food (25%), animal feed (12%), poultry feed (49%), industrial products mainly as starch (12%) and 1 % each in brewery and seed (Dass et al., 2009). As maize is a good source of carbohydrates, fats, protein and some of the important vitamins and minerals. However, inspite of several important uses, maize has an in-built drawback of being deficient in to essential amino acids viz. lysine and tryptophan. This leads to poor net pro-tein utilization and low biological value of traditional maize genotypes.
Traits CM QPMProtein (%) > 8 > 8Lysine in endosperm protein (%) 1.6-2.6 (mean 2.0) 2.7-4.5 (mean 4.0)Tryptophan in endosperm protein (%) 0.2-0.6 (mean 0.4) 0.5-1.1 (mean 0.8)
Source: Vivek et al. (2008)
Table 4. Lysine and tryptophan levels as percentages of total protein in whole grain flour of conventional and QPM (o2o2) genotypes.
Nutritive Value of Quality Protein Maize
Maize consists of three main parts – the hull of bran coat with high fiber
contain, germ rich in oil and starchy en-dosperm and normal maize grain under Indian conditions on an average con-tains 14.9 % moisture, 11.1 % protein, 3.6% fat, 2.7% fibre , 66.2% other car-
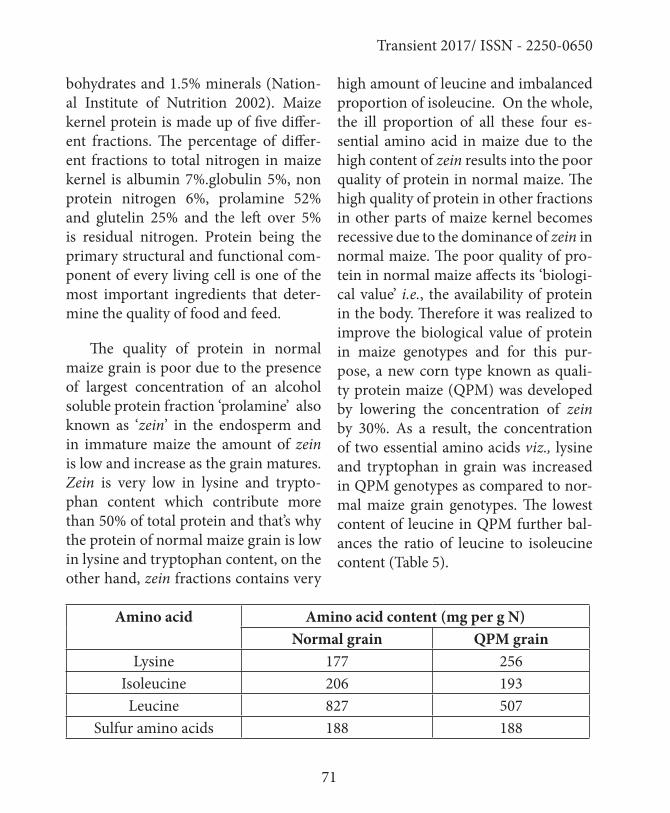
71
Transient 2017/ ISSN - 2250-0650
bohydrates and 1.5% minerals (Nation-al Institute of Nutrition 2002). Maize kernel protein is made up of five differ-ent fractions. The percentage of differ-ent fractions to total nitrogen in maize kernel is albumin 7%.globulin 5%, non protein nitrogen 6%, prolamine 52% and glutelin 25% and the left over 5% is residual nitrogen. Protein being the primary structural and functional com-ponent of every living cell is one of the most important ingredients that deter-mine the quality of food and feed.
The quality of protein in normal maize grain is poor due to the presence of largest concentration of an alcohol soluble protein fraction ‘prolamine’ also known as ‘zein’ in the endosperm and in immature maize the amount of zein is low and increase as the grain matures. Zein is very low in lysine and trypto-phan content which contribute more than 50% of total protein and that’s why the protein of normal maize grain is low in lysine and tryptophan content, on the other hand, zein fractions contains very
high amount of leucine and imbalanced proportion of isoleucine. On the whole, the ill proportion of all these four es-sential amino acid in maize due to the high content of zein results into the poor quality of protein in normal maize. The high quality of protein in other fractions in other parts of maize kernel becomes recessive due to the dominance of zein in normal maize. The poor quality of pro-tein in normal maize affects its ‘biologi-cal value’ i.e., the availability of protein in the body. Therefore it was realized to improve the biological value of protein in maize genotypes and for this pur-pose, a new corn type known as quali-ty protein maize (QPM) was developed by lowering the concentration of zein by 30%. As a result, the concentration of two essential amino acids viz., lysine and tryptophan in grain was increased in QPM genotypes as compared to nor-mal maize grain genotypes. The lowest content of leucine in QPM further bal-ances the ratio of leucine to isoleucine content (Table 5).
Amino acid Amino acid content (mg per g N)Normal grain QPM grain
Lysine 177 256Isoleucine 206 193Leucine 827 507
Sulfur amino acids 188 188

72
Transient 2017/ ISSN - 2250-0650
Aromatic amino acids 505 502Threonine 213 199
Tryptophan 35 78Valine 292 298
Table 5. Comparisons on essential amino acid content in normal maize and QPM grain
The balanced proportion of all these essential amino acid in Quality Protein Maize (QPM) enhanced the biological value of protein. The true protein di-
gestibility of normal maize and QPM is almost same, but the biological value of normal maize is just half as compared to that QPM varieties (Table 6).
Quality measures Normal QPMTrue protein digestibility (%) 82-91 92
Biological value (%) 40-47 80Amount needed for equilibrium 547 230
Table 6. Protein quality of maize grain
The quality parameters viz. protein content as well as lysine and tryptophan
content of QPM hybrids released for cultivation in India are given in Table 7.
Hybrid name Hybrid type Protein content in grains (%)
Tryptophan con-tent in protein (%)
HQPM-7 Single cross 9.42 0.72Vivek QPM-9 Single cross 8.46 0.83
HQPM-5 Single cross 9.80 0.76HQPM-1 Single cross 9.36 0.94
Shaktiman -4 Single cross 9.98 0.93Shaktiman -3 Single cross 9.63 0.73Shaktiman -2 Single cross 9.30 1.04Shaktiman -1 Three way cross 9.60 1.01
Table 7. Quality characters of QPM hybrids released in India
73
Transient 2017/ ISSN - 2250-0650
Impact Dietary Assessment Studies
Most important target group for QPM consumption are children. Out of the 189 nations listed by UNICEF, Ma-lawa, Mozambique, India and Bolivia have highest under five mortalities. The impact of QPM can be highly significant in such target group in these vulnerable nations. An early study on Indian chil-dren fed with food supplemented with normal maize, QPM and milk. The re-sults from children taking QPM were encouraging as the growth parameters recorded were comparable to those of milk (Singh, et al., 1980).
A more comprehensive study was carried out in Ghanaian children (0-15 months) given food supplemented with QPM and normal maize (Afriyiet et al., 1998). The QPM fed children were healthier, suffered fewer fatalities and had better growth rates. The impact of QPM in human nutrition will however, depend on a number of factors. It needs to be established whether the intake of QPM essentially results in enhanced protein utilization in children and adults. Moreover, the results have to be validated especially in the areas where malnutrition is prevalent and maize is an important component of diet.
Another application of QPM is as
animal feed, especially for monogastric animals such as pigs and poultry, which require a more complete protein than cereals alone can provide, as is case with normal maize that is deficient in lysine and tryptophan. A number of studies have proved that the more potential im-pact of QPM can be its use in commer-cial feeds for pigs and poultry as it re-sults in improved growth. In Brazil and El-Salvador, use of QPM in animal feed reduced use of soybean meal by about 50% besides reducing use of synthetic lysine substantially (Pereira, 1992). It also resulted in saving of 3-5% in devel-opment of feed for pig and poultry. In China, the QPM variety Zhong Dan-9409 has been used in animal feed. It has 8-15 per cent yield advantage and about 80 per cent more lysine and tryptophan.
Zhai (2002) analysed the effect of replacing normal maize with QPM and found that in case of poultry, there was no apparent increase in amino acid digestibility but in case of pigs, there was a significantly higher amino acids and weight gain in case of pigs at various growth stages. Similarly, in Ghana, the QPM variety “Obatampa” has been used in both human nutrition as well as `animal feed. The potential impact of QPM as animal feed is restricted to Mexico, Brazil, China, Bolivia, which have high percapita meat supply.
74
Transient 2017/ ISSN - 2250-0650
Contrarily, in African countries, due to the low meat supply market it a less potential marked for QPM as animal feed component.
Babies and adults consuming QPM are healthier and at lower risk for malnutrition disorders such as maras-mus and kwashiorkor, and data from Latin America and Africa show the grain’s role in reversing the effects of malnutrition in those already affected. About 90% the nutritional value of skim milk, the standard for adequate nutrition value. At a time when UNICEF reports that 1,000,000 infants and small chil-dren are starving each month, the inclu-sion of QPM in daily rations improves health and saves lives. Additionally, pigs fed QPM experience rapid weight gain and are ready for market sooner or can provide an additional quality protein source for small farm families (Mande-fro et al., 2001). In India Centre of Ex-cellence on Processing & Value Addition of Maize has been established at Udai-pur city of Rajasthan under the Rashtri-ya Krishi Vikas Yojna to ensure better utilization of quality Protein maize in commercial food products and Industry. This centre has developed several bak-ery products like Biscuit, cake muffins, extruded products puffcorns and pasta using QPM flour (Patil and Babu 2003). The great impact might be due to QPM’s High yield potential (7.2-8.8 t/ha), and
its potentiality towards crop diversifica-tion and export potential.
Production Technology of Qpm
There are 9 QPM hybrids of different grain colours have been developed and relased in India for their cultivation in different agro-climatic conditions across the country. The production technolo-gy of QPM is same as of normal grain maize except isolation as to maintain the purity of QPM, it should be grown in isolation with normal maize.
Soils
Maize can be grown successfully in variety of soils ranging from loamy sand to clay loam. However, soils with good organic matter content having high wa-ter holding capacity with neutral pH (5.5 to7.5) are considered good for high-er productivity. Being a sensitive crop to moisture stress particularly excess soil moisture and salinity stresses; it is de-sirable to avoid low lying fields having poor drainage and also the field having higher salinity. Therefore, the fields hav-ing provision of proper drainage should be selected for cultivation of maize. The soil of NE is acidic in reaction and need to apply lime in furrows @ 500kg/ha to maintain the required pH.
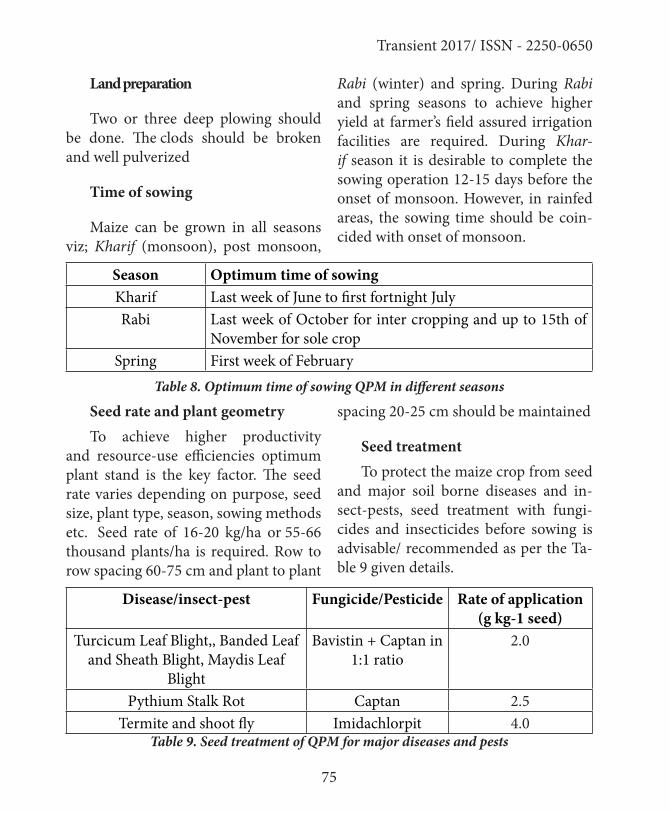
75
Transient 2017/ ISSN - 2250-0650
Land preparation
Two or three deep plowing should be done. The clods should be broken and well pulverized
Time of sowing
Maize can be grown in all seasons viz; Kharif (monsoon), post monsoon,
Rabi (winter) and spring. During Rabi and spring seasons to achieve higher yield at farmer’s field assured irrigation facilities are required. During Khar-if season it is desirable to complete the sowing operation 12-15 days before the onset of monsoon. However, in rainfed areas, the sowing time should be coin-cided with onset of monsoon.
Season Optimum time of sowingKharif Last week of June to first fortnight July Rabi Last week of October for inter cropping and up to 15th of
November for sole crop Spring First week of February
Table 8. Optimum time of sowing QPM in different seasons
Seed rate and plant geometryTo achieve higher productivity
and resource-use efficiencies optimum plant stand is the key factor. The seed rate varies depending on purpose, seed size, plant type, season, sowing methods etc. Seed rate of 16-20 kg/ha or 55-66 thousand plants/ha is required. Row to row spacing 60-75 cm and plant to plant
spacing 20-25 cm should be maintained
Seed treatment To protect the maize crop from seed
and major soil borne diseases and in-sect-pests, seed treatment with fungi-cides and insecticides before sowing is advisable/ recommended as per the Ta-ble 9 given details.
Disease/insect-pest Fungicide/Pesticide Rate of application (g kg-1 seed)
Turcicum Leaf Blight,, Banded Leaf and Sheath Blight, Maydis Leaf
Blight
Bavistin + Captan in 1:1 ratio
2.0
Pythium Stalk Rot Captan 2.5Termite and shoot fly Imidachlorpit 4.0
Table 9. Seed treatment of QPM for major diseases and pests
76
Transient 2017/ ISSN - 2250-0650
Manures and fertilizers
The chemical fertilizer 150:80:80 kg NPK/ha, 10 tones FYM/ha before one month of land preparation are to be ap-plied. Full dose of phosphorous and pot-ash and 20% of nitrogen should be used as basal at the time of final land prepa-ration. The remaining 25% nitrogen at four leaf stage, 30 % at knee height/ eight leaf stage and 20% nitrogen at tasseling time and 5 % at grain filling stage should be applied.
Water management
Irrigation should be given as and when required by the crop depending upon the rains and moisture holding ca-pacity of the soil. Light and frequent ir-rigations are desirable Young seedlings, knee high stage, flowering and grain fill-ing and 10 days after grain filling are the most sensitive stages for water stress for inbreds and irrigation should ensured at these stages. Water should not over-flow on the ridges. The irrigation should be applied in furrows upto 2/3rd height of the ridges. There should be adequate water for growth period upto 40-50 DAS and silking and grain filling period.
Weed management
Weeds are the serious problem in maize seed production plot, particularly
in wet (monsoon) season that competes with maize for nutrient and causes yield loss up to 35 %. Atrazine being a selectiveand broad-spectrum herbicide in maize checks the emergence of both broad leaves and most of the grasses. Pre-emergence application of atrazine @ of 1.0-1.5 kg a.i /ha in 600 litre water is effectivefor controlling weeds. While spraying, the person who is doing spray should move backward sothat the atrazine film on the soil surface may not be disturbed. Preferably, three nozzle booms may be used for proper ground coverage and saving time. Two hand weeding (hoeing) are recommendedfor aeration and uprooting of the remaining weeds at 20 and 40 days after sowing.
Eliminating undesirable plants (Roguing)
At early stage i.e. after 12-15 days of sowing, off-type plants and excess plants should be removed and proper. Off types (very tall, very dwarf, or flower much earlier or later) disease and insect infested removed (Rogued out) before pollen shedding starts. If off-type maize plants are detasseled, seeds from such plants should not be used.
Harvesting of seed
The cobs for seed purpose are select-ed from middle part of fields, away from
77
Transient 2017/ ISSN - 2250-0650
possible contamination. Ears should be harvested only after black layer is formed on grains attached to cob.
Drying and sorting of seed parent cobs
The drying of the cobs should not be done either on the kuccha or pucca flour, rather it should bedried on tar-poline sheets to avoid seed injury and during night the cobs should be kept covered. Tomaintain the purity, dis-similar, diseased and pest infested cobs should be removed before shelling.The cobs should be dried upto 13-14% mois-ture content before shelling
Seed processing:
All under size, broken, damaged etc seeds should be removed for maintain-ing the quality of seed.
Storage and marketing
Seed drying should be done till the moisture content of the seed is re-duced to 8% and it should be kept in aerated jute bags. Seed should be stored at cool and dry place preferably in cold storage. Poor storage conditions will lead to loss of vigour and poor germi-nation. Use “super bag” developed by IRRI, Philippines for minimizing insect pest attack. Fumigation with 1 celphos tablet per ton of maize, 10 gm Bojho
powder per kg of maize kills insects in storage. Marketing should be done with specifications and standards.
Value Addition
Value addition in maize has a great potential and there are several value add-ed products of maize particularly QPM and baby corn that not only increase the farm income but also provides employ-ment to rural youth and farm women. Value added products developed using normal maize, QPM are:
Baked products: Bread and cake
Extruded products: Vermicelli and pasta
Convenience foods: Instant idli and dhokla mix, porridge mix and sprouted chaat
Popped products: Popcorn and popped laddoo
Traditional products: Laddoo, halwa, Kheer, chapatti, sev, mathi, pakora and cheela
Constraints of Qpm Production In Ner
1. The main constraint in QPM taking off is non-availability of seeds for cul-tivation and that has to do with the absence of an active seed production
78
Transient 2017/ ISSN - 2250-0650
programme, which has been the bane of public sector farm research in re-cent times.
2. There is no dearth of good public-ly-bred hybrid seed material in maize, be it QPM or normal single-crosses. But these cannot reach the farmer unless we have a strong public-pri-vate partnership for their large-scale production and multiplication.
3. The Food Corporation of India should be directed to procure QPM for the public distribution system, with the objective of providing a market for farmers as well as meeting broader nutritional security goals.
Conclusion
•QPM is superior to normal maize in its amino acids balance and nutrient composition
•Seed should be obtained from reli-able sources and replacement should be done every year to ensure quality seed production
•Quality seed must meet the mini-mum field, crops and seed standards
•Maintenance of proper isolation dis-tance and rouging of off-type plants are important field operation
for seed production
•The proper agronomic practices during different stages of seed mul-tiplication produce greater quantities of high quality seed.
This technology is certainly going to provide solution to the climate change that is rising temperature in northeast-ern, eastern and some part of central India, lowering water table in rice dom-inated area and weed menace in wheat belt etc. Therefore it is a potential tech-nology in achieving the nutritional and food security of the nation.
About 86% of the maize produced in the country is directly used as feed (61%) and food (25%). To meet the requirement of food/feed and nutritional security quality protein maize has better say than the normal maize. Therefore in Indian maize programme greater emphasis is given to promote the quality protein maize research. The development of quality protein maize, their cultivation and availability of QPM grain will provide a nutritious feed to poultry/cattle and for poor people particularly those consuming maize as their staple food. QPM can save the poor people - who cannot afford meat and egg from diseases caused due to malnutrition particularly
79
Transient 2017/ ISSN - 2250-0650
due to non-availability of rich lysine and tryptophan protein in their diet. India has large number of people with protein malnutrition. On the other hand, price of the meat and meat products has also gone up in recent years and has become unaffordable to meet their nutrition requirement. Thus QPM maize is solution to food and nutritional security. QPM is nutritionally superior with high lysine and tryptophan as compared to normal maize. The biological value of QPM is high (80%) as compared to normal maize (45%), which is near to that of the milk (90%). The biological value of QPM is the highest among all cereals. In India seven single cross QPM maize hybrids viz., HQPM 1, HQPM 5, HQPM 7, Vivek QPM 9, Shaktiman 1, Shaktiman 2, Shaktiman 3 and Shaktiman 4 with different maturity groups have been developed, which suits to different agro-climatic conditions under different cropping systems in North Eastern Region in general and Meghalaya in particular.
References
Cordova H 2001. Quality protein maize: improved nutrition and liveli-hoods for the poor. Maize Re-search Highlights 1999-2000, CIMMYT pp. 27-31.
Dass S, Kaul J, Manivannan, Singode A and Chikkappa G K 2009. Sin-gle cross hybrid maize – A via-ble solution in the changing cli-mate scenario. Indian J. Genet., 69(4) (Spl. issue): 331-334.
Gibbon B and Larkin B 2005. Molecu-lar genetic approaches to de-veloping quality protein maize. Trends Genet. 21: 227-233.
Jat S L, Parihar C M, Singh A K, Jat M L, Jat R K, Singh D K and Sai Kumar R 2011. Conservation Agriculture in Maize Produc-tion Systems. DMR Technical Bulletin 2011/4. Directorate of Maize Research, Pusa Campus, New Delhi-110 012. pp 25.
Krivanek A, Groote H, Gunaratna N, Diallo A and Freisen D 2007. Breeding and disseminating quality protein maize for Afri-ca. Afr. J. Biotech. 6: 312-324.
Kumar A, Jat S L, Ramesh Kumar and Yadav OP 2013(eds). Maize production systems for improv-ing resource-use efficiency and livelihood security. Directorate of Maize Research, Pusa Cam-pus, New Delhi- 110 012, 123p.

80
Transient 2017/ ISSN - 2250-0650
Mandefro N, Tanner D and Twuma-si-Afriyie S 2001. Enhancing the Contribution of Maize to Food Security in Ethio-pia (PDF). Ethiopian Agricul-tural Research Organization, and International Maize and Wheat Improvement Center. p. 46.
Palit K K and Babu S C 2003. Food Systems for Improved Hu-man Nutrition: linking agri-
culture, nutrition, and pro-ductivity. Haworth Press. p. 193. ISBN 1-56022-103-8.
Zhai S 2002. Nutritional evaluation and utilization of QPM Zhang Dan 9404 in laying ren feeds. M.Sc. Thesis. North Western Agri. & Forestry Univ. of Sci. & Tech, China, pp. 13-21.

81
Transient 2017/ ISSN - 2250-0650
Magnetite (Fe3o4/Fe2o3): An Efficient Catalyst for the Multicomponent Reactions
Mithu SahaState Key Laboratory of Physical Chemistry of Solid Surfaces and College of Chemistry and Chemical Engineering, Xiamen University, Xiamen 361005, China.
E-mail: [email protected]
Abstract
The introduction of Magnetite (Fe3O4/Fe2O3) has favored the recovery of catalysts with techniques of mag-netic separation. Moreover, the small size of these functionalized particles becomes a well-designed way to bridge the gap between heterogeneous and homogeneous catalysis. This review deals with the main advances in the development of magnetitenano cata-lytic systems by the immobilization of homogeneous catalysts.
Keywords: Magnetite, Nanocatalyst, Multicomponent reactions, 1, 3-cyclohex-anediones
Introduction
Nanotechnology is of growing im-portance in many branches of research
because of the opportunity for minia-turization and the interesting properties associated with small particle size. In recent decades, nanostructures mate-rials have attracted much attention for their novel electronic, magnetic, optical, chemical, and mechanical properties due to their unique characteristics which are different from bulk materials.1 Metal nanoparticles have attracted a remark-able academic and industrial research effort due to their potential applications, ranging from fundamental studies in quantum physics to catalysts.2 Control of the surface properties and reactivates of metal nanoparticles is an important aspect of developing nanomaterial ap-plications. The size, shape, and surface properties of metal nanoparticles are crucially controlled by the nature of pro-tective ligands.3The physical and chem-
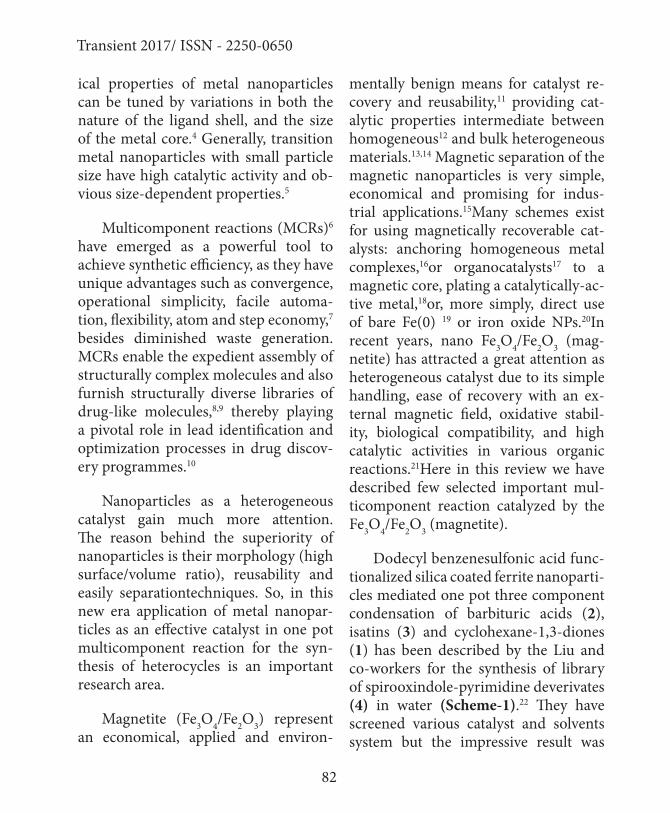
82
Transient 2017/ ISSN - 2250-0650
ical properties of metal nanoparticles can be tuned by variations in both the nature of the ligand shell, and the size of the metal core.4 Generally, transition metal nanoparticles with small particle size have high catalytic activity and ob-vious size-dependent properties.5
Multicomponent reactions (MCRs)6 have emerged as a powerful tool to achieve synthetic efficiency, as they have unique advantages such as convergence, operational simplicity, facile automa-tion, flexibility, atom and step economy,7 besides diminished waste generation. MCRs enable the expedient assembly of structurally complex molecules and also furnish structurally diverse libraries of drug-like molecules,8,9 thereby playing a pivotal role in lead identification and optimization processes in drug discov-ery programmes.10
Nanoparticles as a heterogeneous catalyst gain much more attention. The reason behind the superiority of nanoparticles is their morphology (high surface/volume ratio), reusability and easily separationtechniques. So, in this new era application of metal nanopar-ticles as an effective catalyst in one pot multicomponent reaction for the syn-thesis of heterocycles is an important research area.
Magnetite (Fe3O4/Fe2O3) represent an economical, applied and environ-
mentally benign means for catalyst re-covery and reusability,11 providing cat-alytic properties intermediate between homogeneous12 and bulk heterogeneous materials.13,14 Magnetic separation of the magnetic nanoparticles is very simple, economical and promising for indus-trial applications.15Many schemes exist for using magnetically recoverable cat-alysts: anchoring homogeneous metal complexes,16or organocatalysts17 to a magnetic core, plating a catalytically-ac-tive metal,18or, more simply, direct use of bare Fe(0) 19 or iron oxide NPs.20In recent years, nano Fe3O4/Fe2O3 (mag-netite) has attracted a great attention as heterogeneous catalyst due to its simple handling, ease of recovery with an ex-ternal magnetic field, oxidative stabil-ity, biological compatibility, and high catalytic activities in various organic reactions.21Here in this review we have described few selected important mul-ticomponent reaction catalyzed by the Fe3O4/Fe2O3 (magnetite).
Dodecyl benzenesulfonic acid func-tionalized silica coated ferrite nanoparti-cles mediated one pot three component condensation of barbituric acids (2), isatins (3) and cyclohexane-1,3-diones (1) has been described by the Liu and co-workers for the synthesis of library of spirooxindole-pyrimidine deverivates (4) in water (Scheme-1).22 They have screened various catalyst and solvents system but the impressive result was
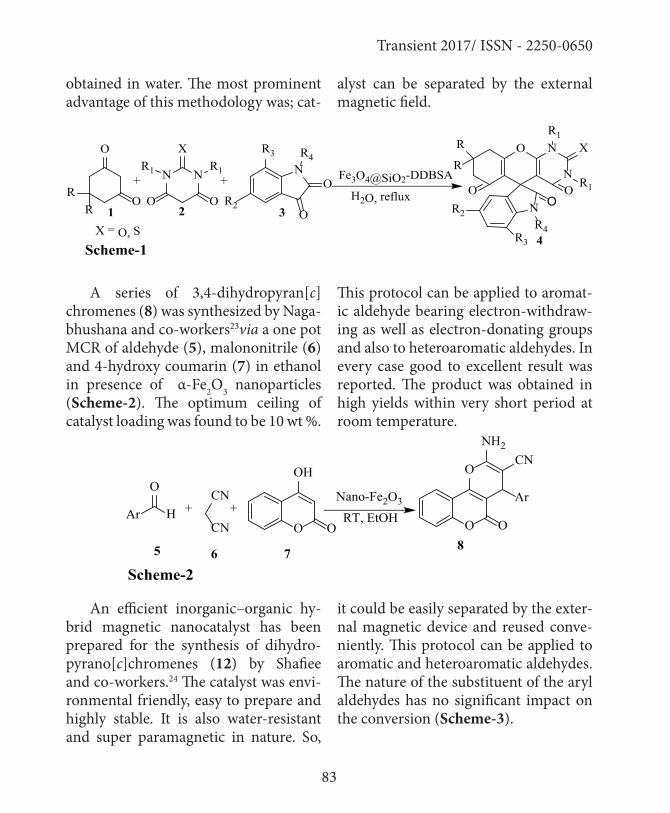
83
Transient 2017/ ISSN - 2250-0650
obtained in water. The most prominent advantage of this methodology was; cat-
alyst can be separated by the external magnetic field.
N N
O
OR
R
XR1R1
OO
NR4
O
O
R3
R2
Fe3O4@SiO2-DDBSA
H2O, reflux
O
N
N
NO
R1
R1
XR
R
R2R4
OO
+ +
R3
1 2 3
4X = O, S
Scheme-1
A series of 3,4-dihydropyran[c]chromenes (8) was synthesized by Naga-bhushana and co-workers23via a one pot MCR of aldehyde (5), malononitrile (6) and 4-hydroxy coumarin (7) in ethanol in presence of α-Fe2O3 nanoparticles (Scheme-2). The optimum ceiling of catalyst loading was found to be 10 wt %.
This protocol can be applied to aromat-ic aldehyde bearing electron-withdraw-ing as well as electron-donating groups and also to heteroaromatic aldehydes. In every case good to excellent result was reported. The product was obtained in high yields within very short period at room temperature.
Ar H
O
CN
CN++
O O
OH
Nano-Fe2O3
RT, EtOH O
O
NH2CN
Ar
O
5 6 78
Scheme-2
An efficient inorganic–organic hy-brid magnetic nanocatalyst has been prepared for the synthesis of dihydro-pyrano[c]chromenes (12) by Shafiee and co-workers.24 The catalyst was envi-ronmental friendly, easy to prepare and highly stable. It is also water-resistant and super paramagnetic in nature. So,
it could be easily separated by the exter-nal magnetic device and reused conve-niently. This protocol can be applied to aromatic and heteroaromatic aldehydes. The nature of the substituent of the aryl aldehydes has no significant impact on the conversion (Scheme-3).

84
Transient 2017/ ISSN - 2250-0650
A green approach for the synthesis of xanthene derivatives (15) was elaborated by Karami and co-workers25 by conden-sation of aryl aldehydes (14) and 1,3-cy-clohexanediones (13) in water using a catalytic amount of Fe3O4nanoparticles.The attractive features of this protocol were simple workup, short reaction time, and reusability of the catalyst. Further-more, products were isolated in excel-lent yields. Comparison of this method with other synthetic methods have also
been investigated but nano Fe3O4 was found to best catalyst for this conver-sion. Under similar reaction conditions several aromatic aldehydes containing electron donating as well as electron withdrawing groups at different posi-tions in aromatic ring gave 9-aryl substi-tuted 1,8-dioxo-octahydroxanthenes in good yields. The products were isolated simply by filtration without any chroma-tography separation (Scheme-4).
O
O
2 + ArCHOFe3O4 NPs
H2O, 80 oCO
OO ArH
13 14 15
Scheme-4
An efficient one pot three-compo-nent reaction of aldehydes (16), dim-edone (17) and amines (18) has been described by Ghomiet al.25in presence of nano-Fe3O4 NPs under solvent free condition at 120oC, which generated a variety of 1,8-dioxo-decahydroacridine
derivatives (19) in fairly good yields. The yield was obviously affected by the cata-lyst loading. It is found that 10 mol % of catalyst was sufficient enough to afford the desired product in good yields. The yield remains unaffected when the cata-lyst loading was increased up to 20 mol %.
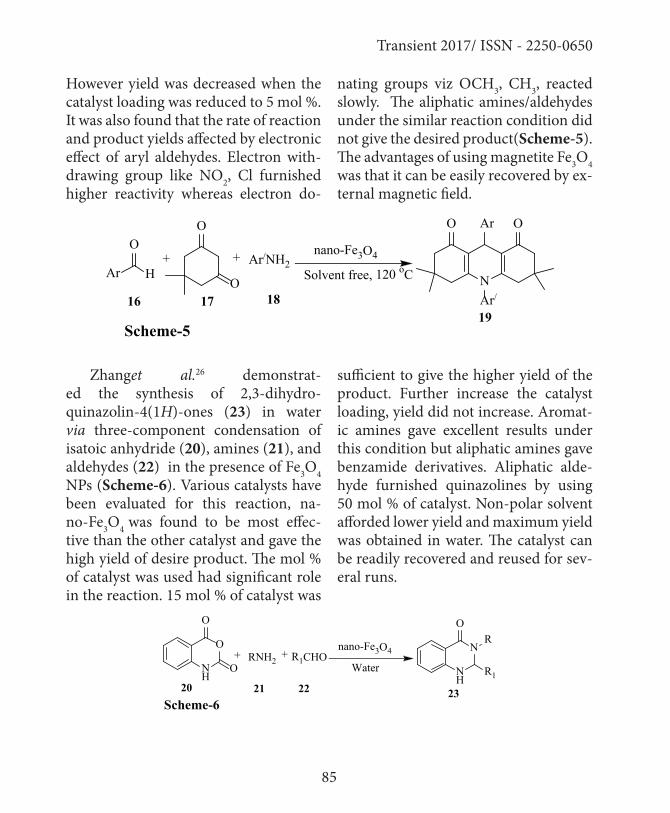
85
Transient 2017/ ISSN - 2250-0650
However yield was decreased when the catalyst loading was reduced to 5 mol %. It was also found that the rate of reaction and product yields affected by electronic effect of aryl aldehydes. Electron with-drawing group like NO2, Cl furnished higher reactivity whereas electron do-
nating groups viz OCH3, CH3, reacted slowly. The aliphatic amines/aldehydes under the similar reaction condition did not give the desired product(Scheme-5). The advantages of using magnetite Fe3O4 was that it can be easily recovered by ex-ternal magnetic field.
Ar
O
H
O
O
+ + Ar/NH2nano-Fe3O4
Solvent free, 120 oC N
ArO O
Ar/16 17 1819
Scheme-5
Zhanget al.26 demonstrat-ed the synthesis of 2,3-dihydro-quinazolin-4(1H)-ones (23) in water via three-component condensation of isatoic anhydride (20), amines (21), and aldehydes (22) in the presence of Fe3O4 NPs (Scheme-6). Various catalysts have been evaluated for this reaction, na-no-Fe3O4 was found to be most effec-tive than the other catalyst and gave the high yield of desire product. The mol % of catalyst was used had significant role in the reaction. 15 mol % of catalyst was
sufficient to give the higher yield of the product. Further increase the catalyst loading, yield did not increase. Aromat-ic amines gave excellent results under this condition but aliphatic amines gave benzamide derivatives. Aliphatic alde-hyde furnished quinazolines by using 50 mol % of catalyst. Non-polar solvent afforded lower yield and maximum yield was obtained in water. The catalyst can be readily recovered and reused for sev-eral runs.
NH
O
O
O+ RNH2
+ R1CHONH
N
O
R1
Rnano-Fe3O4
Water
20 21 22 23Scheme-6
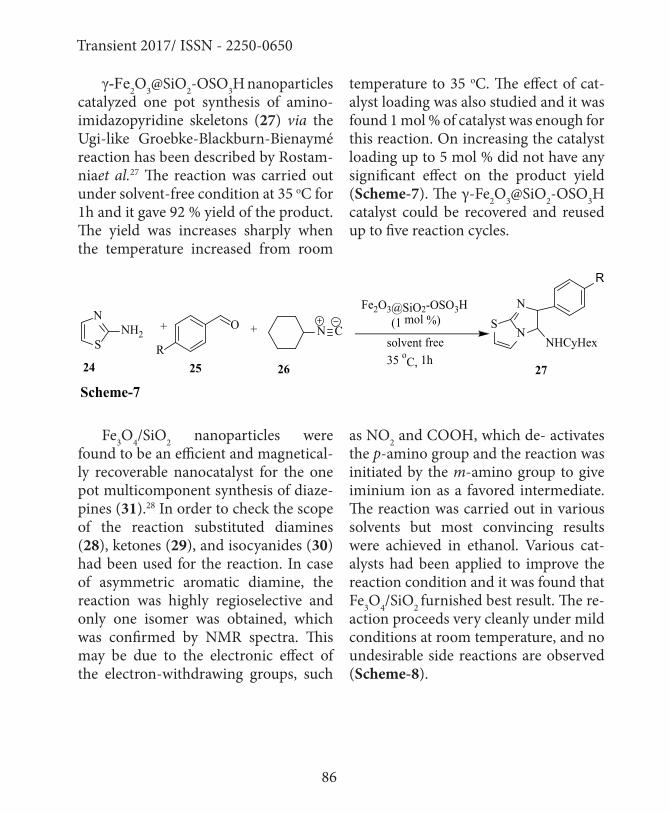
86
Transient 2017/ ISSN - 2250-0650
γ-Fe2O3@SiO2-OSO3H nanoparticles catalyzed one pot synthesis of amino-imidazopyridine skeletons (27) via the Ugi-like Groebke-Blackburn-Bienaymé reaction has been described by Rostam-niaet al.27 The reaction was carried out under solvent-free condition at 35 oC for 1h and it gave 92 % yield of the product. The yield was increases sharply when the temperature increased from room
temperature to 35 oC. The effect of cat-alyst loading was also studied and it was found 1 mol % of catalyst was enough for this reaction. On increasing the catalyst loading up to 5 mol % did not have any significant effect on the product yield (Scheme-7). The γ-Fe2O3@SiO2-OSO3H catalyst could be recovered and reused up to five reaction cycles.
S
NNH2
+
R
O + N C SN
N
NHCyHex
R
Fe2O3@SiO2-OSO3H(1 mol %)
solvent free35 oC, 1h24 26 2725
Scheme-7
Fe3O4/SiO2 nanoparticles were found to be an efficient and magnetical-ly recoverable nanocatalyst for the one pot multicomponent synthesis of diaze-pines (31).28 In order to check the scope of the reaction substituted diamines (28), ketones (29), and isocyanides (30) had been used for the reaction. In case of asymmetric aromatic diamine, the reaction was highly regioselective and only one isomer was obtained, which was confirmed by NMR spectra. This may be due to the electronic effect of the electron-withdrawing groups, such
as NO2 and COOH, which de- activates the p-amino group and the reaction was initiated by the m-amino group to give iminium ion as a favored intermediate. The reaction was carried out in various solvents but most convincing results were achieved in ethanol. Various cat-alysts had been applied to improve the reaction condition and it was found that Fe3O4/SiO2 furnished best result. The re-action proceeds very cleanly under mild conditions at room temperature, and no undesirable side reactions are observed (Scheme-8).
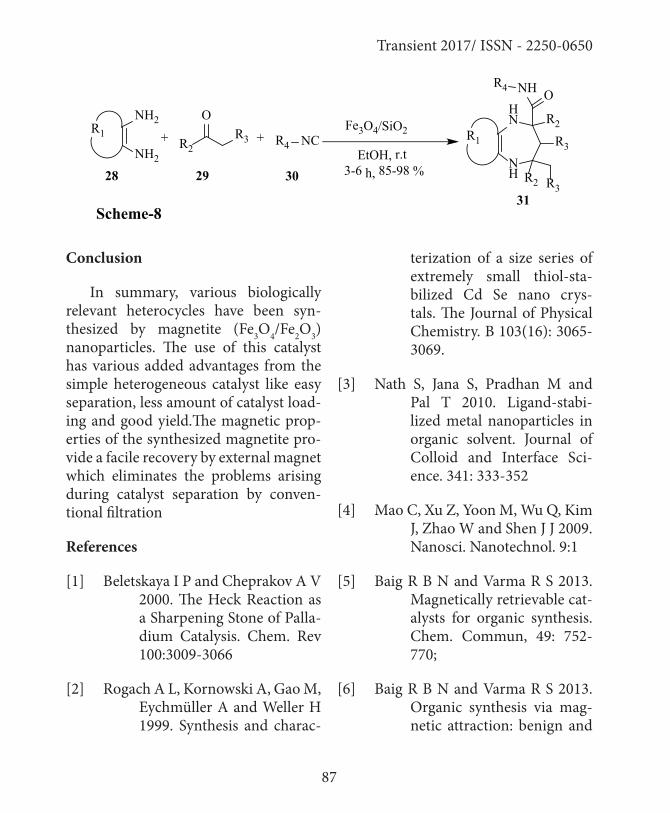
87
Transient 2017/ ISSN - 2250-0650
NH2
NH2
R1R2
OR3+ + R4 NC
Fe3O4/SiO2
EtOH, r.t3-6 h, 85-98 %
R1
NH
HN
R2 R3
R3
R2
ONHR4
Scheme-8
28 29 30
31
Conclusion
In summary, various biologically relevant heterocycles have been syn-thesized by magnetite (Fe3O4/Fe2O3) nanoparticles. The use of this catalyst has various added advantages from the simple heterogeneous catalyst like easy separation, less amount of catalyst load-ing and good yield.The magnetic prop-erties of the synthesized magnetite pro-vide a facile recovery by external magnet which eliminates the problems arising during catalyst separation by conven-tional filtration
References
[1] Beletskaya I P and Cheprakov A V 2000. The Heck Reaction as a Sharpening Stone of Palla-dium Catalysis. Chem. Rev 100:3009-3066
[2] Rogach A L, Kornowski A, Gao M, Eychmüller A and Weller H 1999. Synthesis and charac-
terization of a size series of extremely small thiol-sta-bilized Cd Se nano crys-tals. The Journal of Physical Chemistry. B 103(16): 3065-3069.
[3] Nath S, Jana S, Pradhan M and Pal T 2010. Ligand-stabi-lized metal nanoparticles in organic solvent. Journal of Colloid and Interface Sci-ence. 341: 333-352
[4] Mao C, Xu Z, Yoon M, Wu Q, Kim J, Zhao W and Shen J J 2009. Nanosci. Nanotechnol. 9:1
[5] Baig R B N and Varma R S 2013. Magnetically retrievable cat-alysts for organic synthesis. Chem. Commun, 49: 752-770;
[6] Baig R B N and Varma R S 2013. Organic synthesis via mag-netic attraction: benign and
88
Transient 2017/ ISSN - 2250-0650
sustainable protocols us-ing magnetic nanoferrites. Green Chem. 15:398-417
[7] Toure B B and Hall D G 2009. Nat-ural Product Synthesis Using Multicomponent Reaction Strategies. Chem Rev. 109: 4439-4486;
[8] Domiling A, Wang W and Wang K 2012. Chemistry and Biolo-gy of Multicomponent.
[9] Reactions. Chem. Rev. 112: 3083-3135
[10] Clarke P A, Santosa S and Mar-tin WHC 2007. Combining pot, atom and step economy (PASE) in organic synthesis. Synthesis of tetrahydropy-ran-4-ones. Green Chem., 2007: 438-440
[11] Connor J O C, Beckmannw H S G and Spring D R 2012. Di-versity-oriented synthesis: producing chemical tools for dissecting biology. Chem. Soc. Rev. 41:4444-4456
[12] Ruijter E, Scheffelaar R and Orru R V A 2011. Multicom-ponent Reaction Design in the Quest for Molecular Complexity and Diversity.
Angew. Chem. Int. Ed. 50: 6234-6246
[13] Hulme C and Gore V 2003. Curr. Med. Chem. 10:51
[14] Dam B, Saha M, Jamatia R and Pal A K 2106. Nano-ferrite supported glutathione as a reusable nano-organocat-alyst for the synthesis of phthalazine-trione and di-one derivatives under sol-vent-free conditions. RSC Adv. 6:54768-54776
[15] Cole-Hamilton D J 2003. Ho-mogeneous Catalysis-New Approaches to Catalyst Separation, Recovery, and Recycling. Science. 299:1702-1706.
[16] Shylesh S, Schunemann V and Thiel W R 2010. Magnetical-ly Separable Nanocatalysts: Bridges between Homoge-neous and Heterogeneous Catalysis. Angew. Chem. Int. Ed. 49: 3428-3459
[17] Lu A U, Salabas E L and Schüth F 2007.Magnetic Nanoparti-cles: Synthesis, Protection, Functionalization, and Ap-plication. Angew. Chem. Int. Ed. 46:1222-1244
89
Transient 2017/ ISSN - 2250-0650
[18] Laurent S, Forge D, Port M, Roch A, Robic C, Elst LV and Muller RN 2008. Magnetic Iron Oxide Nanoparticles: Synthesis, Stabilization, Vec-torization, Physicochemical Characterizations, and Bio-logical Applications. Chem. Rev. 108: 2064-2110
[19] Zheng T, Yang L, Hudson R, Song G, Moores A R and Li CT 2011. Fe3O4 Nanoparti-cle-SupportedCopper (I) Pybox Catalyst: Magnetical-ly Recoverable Catalyst for Enantioselective Direct-Ad-dition of Terminal Alkynes to Imines. Org. Lett. 13: 442-445.
[20] Polshettiwar V, Baruwati B and Varma R S 2009. Magnet-ic nanoparticle-supported glutathione: a conceptually sustainable organocatalyst. Chem. Commun. 1837-1839
[21] Rossi L M, Silva F P, Vono L L R, Kiyohara P K, Duarte E L, Itri R, Landers R and Mach-ado G 2007. Superpara-magnetic nanoparticle-sup-ported palladium: a highly stable magnetically recov-erable and reusable catalyst for hydrogenation reactions.
Green Chem. 9:379-385
[22] Phua P H, Lefort L, Boogers J A F, Tristany M and Vries J G D 2009. Soluble iron nanopar-ticles as cheap and environ-mentally benign alkene and alkyne hydrogenation cata-lysts. Chem Commun. 3747-3749
[23] Zeng T, Chen W W, Cirtiu C M, Moores A, Song G and LI C J 2010. Fe3O4 nanoparti-cles: a robust and magneti-cally recoverable catalyst for three-component coupling of aldehyde, alkyne and amine. Green Chem. 12:570-573
[24] Zhang Z H, Lu H Y, Yang S H and Gao JW 2010. pIarpo-ern-Catalyzed Formation of C–Se and C–Te Bonds through Cross Coupling of Aryl Halides with Se(0) and Te(0)/Nano-Fe3O4@GO. Synthesis. 45: 2337-2342
[25] Nagabhushana H, Saundalkar S S, Muralidhar L, Naga-bhushana B M, Girija C R, Nagaraja D, Pasha M A and Jayashankar V P 2011. Fe2O3 nanoparticles: An ef-ficient, inexpensive catalyst
90
Transient 2017/ ISSN - 2250-0650
for the one-pot preparation of 3, 4-dihydropyrano[c]chromenes. Chines. Chem. Lett. 22: 143-146.
[26] Khoobi M, Ma’mani L, Rezazadeh F, Zareie Z, Foroumadi A, Ramazani A and Shafiee A 2102. One-pot synthesis of 4H-benzo[b]pyrans and di-hydropyrano[c]chromenes using inorganic–organic hy-brid magnetic nanocatalyst in water. J. Mol. Catal. A: Chem. 359: 74-80.
[27] Karami B, Hoseini S J, Eskandari K, Ghasemi A and Nasraba-di H 2012. Synthesis of xan-thene derivatives by employ-ing Fe3O4 nanoparticles as an effective and magnetically recoverable catalyst in water. Catal. Sci. Technol. 2: 331-238
[28] Ghasemzadeh M A, Safa-ei-Ghomi, J and Molaei H 2012. Fe3O4 nanoparticles: As an efficient, green and magnetically reusable cata-lyst for the one-pot synthesis of 1,8-dioxo-decahydroacri-dine derivatives under sol-vent-free conditions. C. R.
Chimie. 15: 969:974
[29] Zhan H Z, Lu H Y, Yang S H and Gao J W 2010. Syn-thesis of 2,3-Dihydro-quinazolin-4(1H)-ones by Three-Component Cou-pling of Isatoic Anhydride, Amines, and Aldehydes Cat-alyzed by Magnetic Fe3O4 Nanoparticles in Water. J. Comb. Chem. 12: 643:646
[30] Rostamnia S, Lamei K, Moham-madquli M, Sheykhan M and Heydari A 2012. Nano-magnetically modified sulfu-ric acid (Fe2O3@SiO2-OS-O3H): an efficient, fast, and reusable green catalyst for the Ugi-like Groebke-Black-burn-Bienaymé three-com-ponent reaction under solvent-free conditions. Tetrahedron. Lett. 53:5257-5260
[31] Maleki A 2012. Fe3O4/SiO2 nanoparticles: an efficient and magnetically recover-able nanocatalyst for the one-pot multicomponent synthesis of diazepines. Tet-rahedron. 68:7827-7833.
91
Transient 2017/ ISSN - 2250-0650
Metal Complexes of Dipyrrolylquinoxaline-Based Receptors for Anion Sensing
Sandeep Kumar Dey Department of Chemistry, Goa University, Taleigao Plateau, Goa - 403206E-mail: [email protected]
Abstract
This is a research note which dis-cusses the solution–state anion recog-nition chemistry of dipyrrolylquinox-aline system and metal complexes of dipyrrolylquinoxaline–based ligands.
Keywords: Chromogenic, Fluorogen-ic, anion-receptor
Introduction
The development of new chromo-genic and fluorogenic molecules for an-ion detection has gained considerable research attention due to their funda-mental roles in biological, environmen-tal, and chemical processes.[1] Chemo-sensors for anions generally involve the covalent linking of a signaling subunit (chromophore/fluorophore) capable of giving information about the anion binding event with the receptor mol-
ecule, which employ hydrogen bond donor functionalities such as, amide, urea, thiourea, pyrrole and indole for anion coordination.[2] Sensors capable of representing anoptical response upon receptor–anion interactions are viable due to the low cost and easy detection of anions in solution. In general, hydrogen bond induced π–electron delocaliza-tion, or anion–induced –NH deproton-ation, are believed to be responsible for signaling the binding event in sensors that generally employ polarized –NH functions.[3] The ability to establish hy-drogen bonds between the anion and receptors with –NH group(s) is usually determined by the degree of electron de-ficiency on the interacting –NH proton (or proton acidity) and the electro nega-tivity of the anion (or anion basicity). In-tense colorations with emergence of new bands in the visible spectral region can
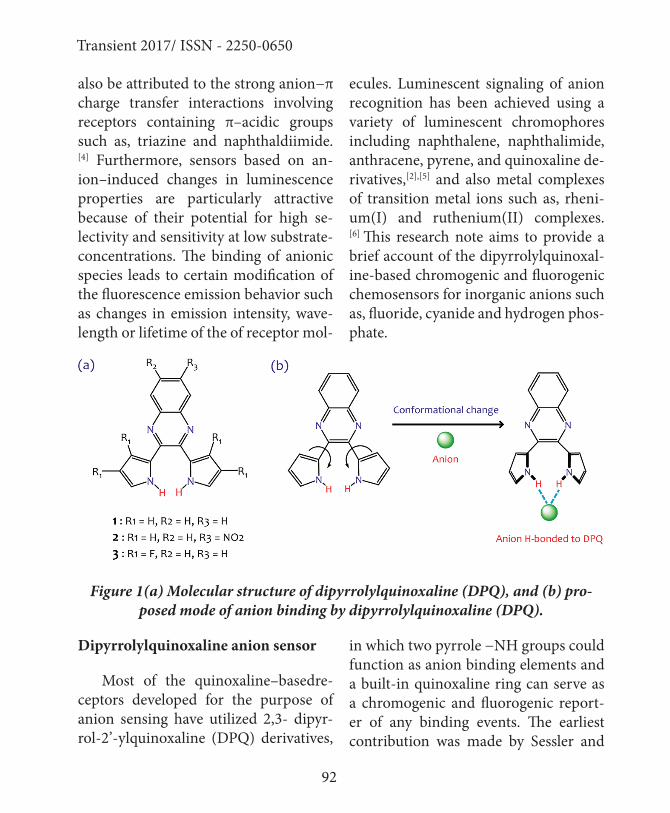
92
Transient 2017/ ISSN - 2250-0650
also be attributed to the strong anion−π charge transfer interactions involving receptors containing π–acidic groups such as, triazine and naphthaldiimide.[4] Furthermore, sensors based on an-ion–induced changes in luminescence properties are particularly attractive because of their potential for high se-lectivity and sensitivity at low substrate-concentrations. The binding of anionic species leads to certain modification of the fluorescence emission behavior such as changes in emission intensity, wave-length or lifetime of the of receptor mol-
ecules. Luminescent signaling of anion recognition has been achieved using a variety of luminescent chromophores including naphthalene, naphthalimide, anthracene, pyrene, and quinoxaline de-rivatives,[2],[5] and also metal complexes of transition metal ions such as, rheni-um(I) and ruthenium(II) complexes.[6] This research note aims to provide a brief account of the dipyrrolylquinoxal-ine-based chromogenic and fluorogenic chemosensors for inorganic anions such as, fluoride, cyanide and hydrogen phos-phate.
Figure 1(a) Molecular structure of dipyrrolylquinoxaline (DPQ), and (b) pro-posed mode of anion binding by dipyrrolylquinoxaline (DPQ).
Dipyrrolylquinoxaline anion sensor
Most of the quinoxaline–basedre-ceptors developed for the purpose of anion sensing have utilized 2,3- dipyr-rol-2’-ylquinoxaline (DPQ) derivatives,
in which two pyrrole −NH groups could function as anion binding elements and a built-in quinoxaline ring can serve as a chromogenic and fluorogenic report-er of any binding events. The earliest contribution was made by Sessler and
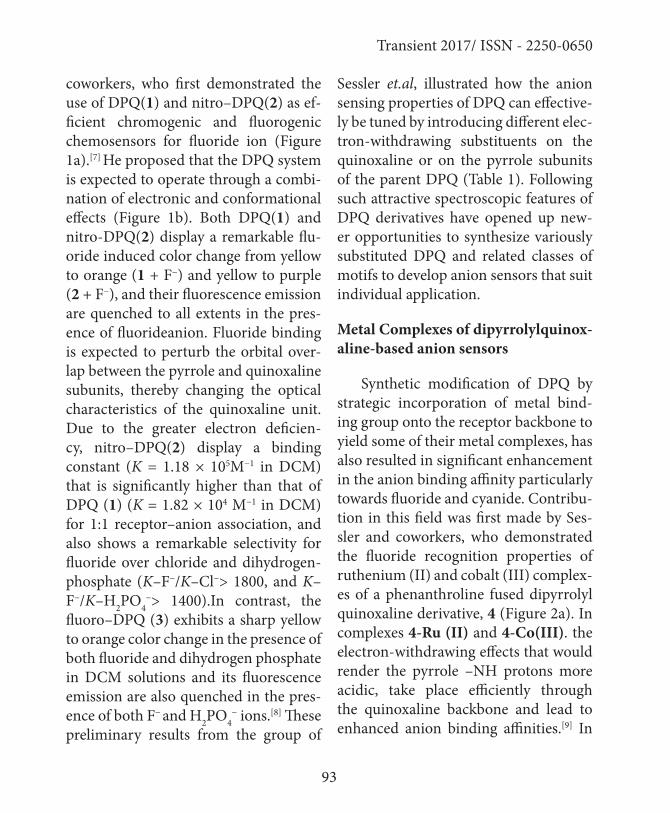
93
Transient 2017/ ISSN - 2250-0650
coworkers, who first demonstrated the use of DPQ(1) and nitro–DPQ(2) as ef-ficient chromogenic and fluorogenic chemosensors for fluoride ion (Figure 1a).[7] He proposed that the DPQ system is expected to operate through a combi-nation of electronic and conformational effects (Figure 1b). Both DPQ(1) and nitro-DPQ(2) display a remarkable flu-oride induced color change from yellow to orange (1 + F−) and yellow to purple (2 + F−), and their fluorescence emission are quenched to all extents in the pres-ence of fluorideanion. Fluoride binding is expected to perturb the orbital over-lap between the pyrrole and quinoxaline subunits, thereby changing the optical characteristics of the quinoxaline unit. Due to the greater electron deficien-cy, nitro–DPQ(2) display a binding constant (K = 1.18 × 10⁵M−1 in DCM) that is significantly higher than that of DPQ (1) (K = 1.82 × 10⁴ M−1 in DCM) for 1:1 receptor–anion association, and also shows a remarkable selectivity for fluoride over chloride and dihydrogen-phosphate (K–F−/K–Cl−> 1800, and K–F−/K–H2PO4
−> 1400).In contrast, the fluoro–DPQ (3) exhibits a sharp yellow to orange color change in the presence of both fluoride and dihydrogen phosphate in DCM solutions and its fluorescence emission are also quenched in the pres-ence of both F− and H2PO4
− ions.[8] These preliminary results from the group of
Sessler et.al, illustrated how the anion sensing properties of DPQ can effective-ly be tuned by introducing different elec-tron-withdrawing substituents on the quinoxaline or on the pyrrole subunits of the parent DPQ (Table 1). Following such attractive spectroscopic features of DPQ derivatives have opened up new-er opportunities to synthesize variously substituted DPQ and related classes of motifs to develop anion sensors that suit individual application.
Metal Complexes of dipyrrolylquinox-aline-based anion sensors
Synthetic modification of DPQ by strategic incorporation of metal bind-ing group onto the receptor backbone to yield some of their metal complexes, has also resulted in significant enhancement in the anion binding affinity particularly towards fluoride and cyanide. Contribu-tion in this field was first made by Ses-sler and coworkers, who demonstrated the fluoride recognition properties of ruthenium (II) and cobalt (III) complex-es of a phenanthroline fused dipyrrolyl quinoxaline derivative, 4 (Figure 2a). In complexes 4-Ru (II) and 4-Co(III). the electron-withdrawing effects that would render the pyrrole –NH protons more acidic, take place efficiently through the quinoxaline backbone and lead to enhanced anion binding affinities.[9] In

94
Transient 2017/ ISSN - 2250-0650
UV-vis spectroscopy, the addition of flu-oride to a DMSO solution the 4-Co(III)resulted in the emergence of a new peak at 652 nm with a concomitant change in color from pink to purple, while the ab-sorbance of the original peaks at 323 and 525 nm decreased.
The proposal of adding cationic charges to a DPQ system can indeed be employed to increase the anion affinities as evidenced by the evaluated binding constants of 4, 4-Ru(II) and 4-Co(III) with F−, Cl−, and H2PO4
−, based on their absorption spectral changes (Table 1). The 4-Co(III) complex with its incre-mentally greater charge, displayed a much higher affinity for fluoride anion as compared to 4 and 4-Ru(II). The free receptor 4 displayed a rather low affini-ty for fluoride, presumably as a result of the additional electron density donated to the DPQ functionality from the nitro-gen–rich phenanthroline system. In the differential pulse voltammetry (DPV) studies, the addition of fluoride to a DMSO solution of 4-Co(III) resulted in a complete disappearance of the sharp Co(III)→Co(II) reduction signal, sug-gestive of the redox inactive nature of the complex formed. Furthermore, the fact that the Co (III)→Co(II) signal can be restored upon the addition of small amount of water indicates that the com-plexation between 4-Co(III) and fluo-
ride is reversible.
Based on the above concept, Anzen-bacher and coworkers have reported a Ru(II) metal complex of phenanthro-line fused dipyrrolylpyrazine, 5-Ru(II) which acts as a luminescence life-time-based anion sensor (Figure 2b). Preliminary investigations revealed that the addition of fluoride, cyanide, and phosphate to the DCM/MeCN (98:2 v/v) solutions of 5 and 5-Ru (II) caused significant changes in their absorption and emission properties.[10] The emis-sion spectrum of 5-Ru(II) get signifi-cantly quenched and red-shifts from 594 to 610 nm (λex =493 nm) with increasing cyanide concentration, indicating a low-ering in energy of the excited state and enhancement of non–radiative decay. In all cases, the emission-data derived binding constants are substantially high-er in 5-Ru (II) relative to 5, due to the electron-withdrawing effects caused by the Ru(II) center (Table 1). In absence of anion, 5-Ru (II) exhibited a single-ex-ponential lifetime of τ= 377 ± 20 ns, and with increasing cyanide concentration the intensity decay exhibited complex kinetics that adequately fit a sum of two exponentials (long τ= 320-370 ns and short τ= 13-17 ns). These emission-life-time data suggest that there are at least two distinct luminescent species, con-sisting of anion–bound 5-Ru (II) (short
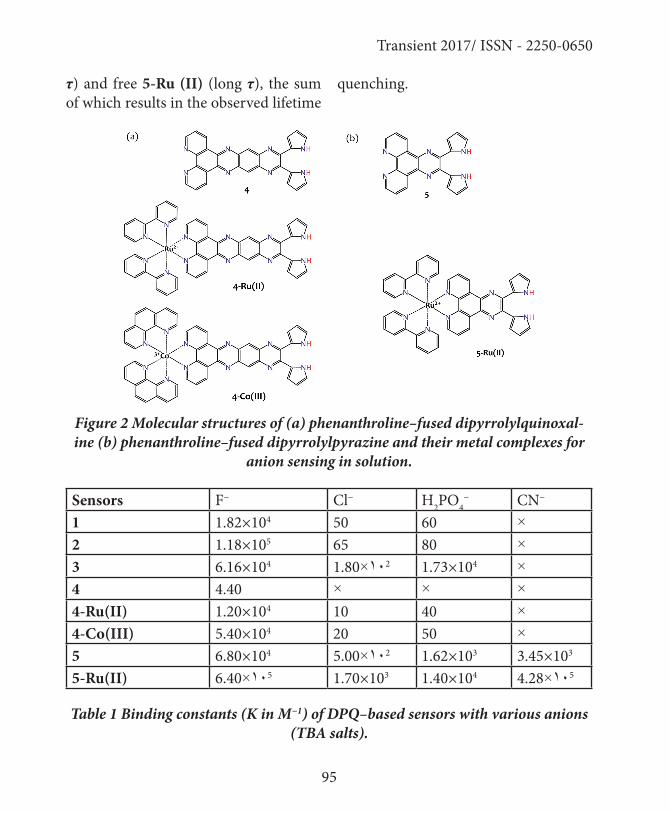
95
Transient 2017/ ISSN - 2250-0650
τ) and free 5-Ru (II) (long τ), the sum of which results in the observed lifetime
quenching.
Figure 2 Molecular structures of (a) phenanthroline–fused dipyrrolylquinoxal-ine (b) phenanthroline–fused dipyrrolylpyrazine and their metal complexes for
anion sensing in solution.
Sensors F− Cl− H2PO4− CN−
1 1.82×10⁴ 50 60 ×2 1.18×10⁵ 65 80 ×3 6.16×10⁴ 1.80×10² 1.73×104 ×4 4.40 × × ×4-Ru(II) 1.20×10⁴ 10 40 ×4-Co(III) 5.40×10⁴ 20 50 ×5 6.80×10⁴ 5.00×10² 1.62×10³ 3.45×10³
5-Ru(II) 6.40×10⁵ 1.70×10³ 1.40×10⁴ 4.28×10⁵
Table 1 Binding constants (K in M−1) of DPQ–based sensors with various anions (TBA salts).
96
Transient 2017/ ISSN - 2250-0650
Conclusion
In this research note, a brief account of the anion sensing properties of dipyr-rolyl quinoxaline and metal complexes of dipyrrolyl quinoxaline based ligands have been emphasized. Due to the elec-tron deficient nature and π–conjugation in quinoxaline ring, dipyrrolyl quinox-aline and its derivatives can act as both chromogenic and fluorogenic chemo-sensors for inorganic anions. The exam-ples discussed here illustrate how the in-tegration of metal coordination groups with the dipyrrolyl quinoxaline system could result in highly sensitive anion responsive chemosensors. The concept of anion coordination chemistry cou-pled with optical signal generation by hydrogen–bond induced changes in the electronic properties is the primary approach employed in the synthesis of these probe molecules/complexes. Inno-vative design and synthesis of quinox-aline-based molecules and materials by considering their stabilities, geometries for hydrogen bonding interactions, and optoelectronic properties should make it possible to obtain attractive sensory systems and will contribute greatly to the academic foundation of the anion recognition chemistry.
References
[1] Steed J W and Atwood J L 2009. Su-pramolecular Chemistry, 2nd Edition, Wiley VCH
[2] Moragues M E, Martínez-Máñez R and Sancenón F 2011. Chromo-genic and fluorogenic chemo-sensors and reagents for anions: A comprehensive review of the year 2009. Chem. Soc. Rev., 40, 2593–2643
[3] Amendola V, Esteban-Goamez D, Fabbrizzi L and Licchelli M 2006. What anions do to N–H containing receptors. Acc. Chem. Res., 39, 343−353
[4] Schottel B L, Chifotides H T and Dunbar KR 2008. Anion−π in-teractions. Chem. Soc. Rev., 37, 68–83
[5] Martínez-Máñez R and Sancenón F 2003. Fluorogenic and chro-mogenic chemosensors and re-agents for anions. Chem. Rev., 103, 4419−4476
[6] Steed J W 2009. Coordination and organometallic compounds as anion receptors and sensors. Chem. Soc. Rev., 38, 506–519
97
Transient 2017/ ISSN - 2250-0650
[7] Black C B, Andrioletti B, Try A C, Ruiperez C and Sessler J L 1999. Dipyrrolylquinoxalines: Effi-cient Sensors for Fluoride An-ion in Organic Solution. J. Am. Chem. Soc., 121, 10438−10439
[8] Anzenbacher Jr P, Try A C, Miyaji H, Jursíková K, Lynch V M, Mar-quez M and Sessler J L 2000. Fluorinated calix[4]pyrrole and dipyrrolylquinoxaline: Neutral anion receptors with augment-ed affinities and enhanced se-lectivities. J. Am. Chem. Soc., 122, 10268−10272
[9] Mizuno T, Wei W H, Eller L R and Sessler J L 2002. Phenanthro-line complexes bearing fused dipyrrolylquinoxaline anion recognition sites: Efficient flu-oride anion receptors. J. Am. Chem. Soc., 124, 1134−1135
[10] Anzenbacher Jr. P, Tyson D S, Jursíková K and Castellano F N 2002. Luminescence life-time-based sensor for cya-nide and related anions. J. Am. Chem. Soc., 124, 6232−6233.

Transient 2017/ ISSN - 2250-0650
SHORT COMMUNICATION

Transient 2017/ ISSN - 2250-0650
100
Transient 2017/ ISSN - 2250-0650
Fermented Food and Beverage of the Ethnic Tribes of West Garo Hills, Meghalaya
Nalanda Bala Murugan* and Birendra Kumar MishraDepartment of Rural Development and Agricultural Production, North Eastern Hill University, Tura Campus, Tura, Meghalaya, IndiaEmail: [email protected]
Fermentation is an antiquated artist-ry. Fermented foods and beverages are an essential constituent of the dietary culture of every community worldwide. The process of fermentation is the most frugal method of preserving of food. Wine was believed to be made in the Caucasus and Mesopotamia as early as 6000 BC, and the colonization by Ro-mans spread winemaking all over the Mediterranean. The antiquity of Chi-nese foods and cuisines has been docu-mented by several historians as far back as 4000 BC based on historical evidence. The ancient monuments of Nepal indi-cate that Himalayan ethnic foods have been consumed in the region for more than 2500years (Chiang et al. 2006; Deka and Sarma 2010) Fermented foods and beverages are nursed by diverse microorganisms from the environment which include mycelial moulds, yeasts, and bacteria mostly lactic acid bacteria,
bacilli, and micrococci. Microorganisms transform the chemical constituents of raw materials during fermentation and enhance the nutritive value of the prod-ucts, enrich diets with improved flavour and texture preserve, perishable foods, fortify, products with essential amino acids health-promoting bioactive com-pounds, vitamins, and minerals, de-grade undesirable compounds and an-tinutritive factors, impart antioxidant and antimicrobial properties, improve digestibility and stimulate probiotic functions. Diversity within the species or strains of several functional genera of dominant microorganisms has created ethnic foods with different sensory char-acteristics (Dung 2004; Kim et al. 2014; Palaniveloo and Vairappan 2013).
The West Garo Hills of Meghalaya is primarily populated by the Garo tribes followed by the Hajong, Bodo and Rabha. The tribal folk possess an interesting
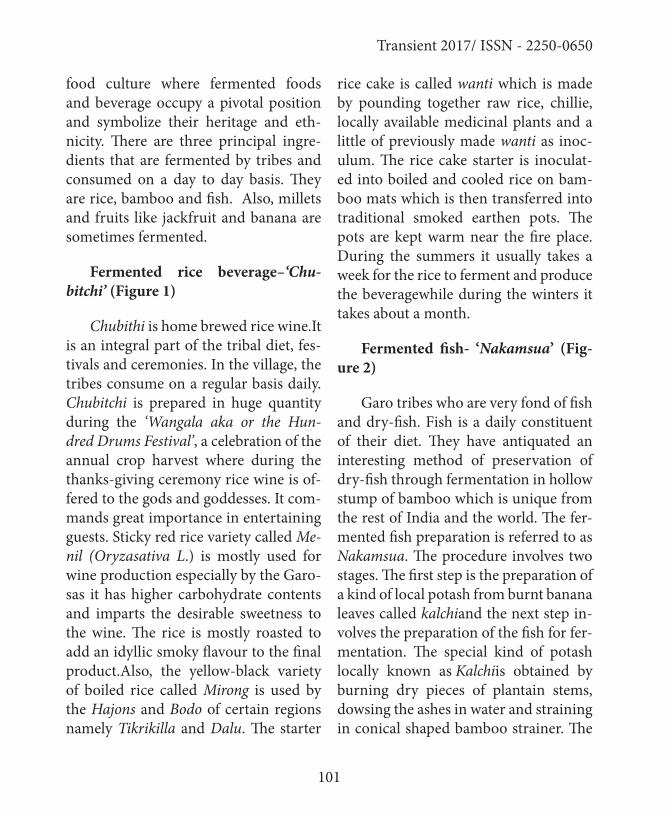
101
Transient 2017/ ISSN - 2250-0650
food culture where fermented foods and beverage occupy a pivotal position and symbolize their heritage and eth-nicity. There are three principal ingre-dients that are fermented by tribes and consumed on a day to day basis. They are rice, bamboo and fish. Also, millets and fruits like jackfruit and banana are sometimes fermented.
Fermented rice beverage–‘Chu-bitchi’ (Figure 1)
Chubithi is home brewed rice wine.It is an integral part of the tribal diet, fes-tivals and ceremonies. In the village, the tribes consume on a regular basis daily. Chubitchi is prepared in huge quantity during the ‘Wangala aka or the Hun-dred Drums Festival’, a celebration of the annual crop harvest where during the thanks-giving ceremony rice wine is of-fered to the gods and goddesses. It com-mands great importance in entertaining guests. Sticky red rice variety called Me-nil (Oryzasativa L.) is mostly used for wine production especially by the Garo-sas it has higher carbohydrate contents and imparts the desirable sweetness to the wine. The rice is mostly roasted to add an idyllic smoky flavour to the final product.Also, the yellow-black variety of boiled rice called Mirong is used by the Hajons and Bodo of certain regions namely Tikrikilla and Dalu. The starter
rice cake is called wanti which is made by pounding together raw rice, chillie, locally available medicinal plants and a little of previously made wanti as inoc-ulum. The rice cake starter is inoculat-ed into boiled and cooled rice on bam-boo mats which is then transferred into traditional smoked earthen pots. The pots are kept warm near the fire place. During the summers it usually takes a week for the rice to ferment and produce the beveragewhile during the winters it takes about a month.
Fermented fish- ‘Nakamsua’ (Fig-ure 2)
Garo tribes who are very fond of fish and dry-fish. Fish is a daily constituent of their diet. They have antiquated an interesting method of preservation of dry-fish through fermentation in hollow stump of bamboo which is unique from the rest of India and the world. The fer-mented fish preparation is referred to as Nakamsua. The procedure involves two stages. The first step is the preparation of a kind of local potash from burnt banana leaves called kalchiand the next step in-volves the preparation of the fish for fer-mentation. The special kind of potash locally known as Kalchiis obtained by burning dry pieces of plantain stems, dowsing the ashes in water and straining in conical shaped bamboo strainer. The
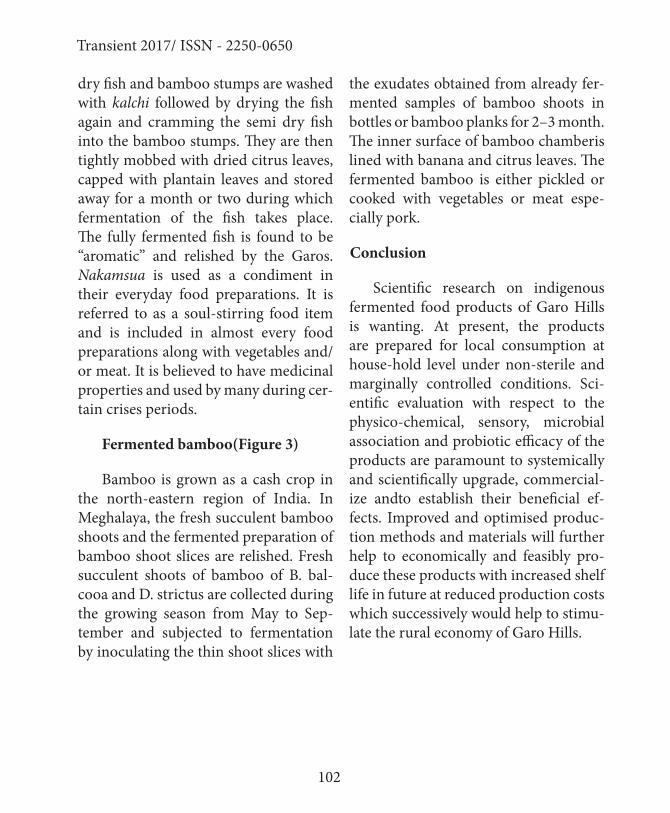
102
Transient 2017/ ISSN - 2250-0650
dry fish and bamboo stumps are washed with kalchi followed by drying the fish again and cramming the semi dry fish into the bamboo stumps. They are then tightly mobbed with dried citrus leaves, capped with plantain leaves and stored away for a month or two during which fermentation of the fish takes place. The fully fermented fish is found to be “aromatic” and relished by the Garos. Nakamsua is used as a condiment in their everyday food preparations. It is referred to as a soul-stirring food item and is included in almost every food preparations along with vegetables and/or meat. It is believed to have medicinal properties and used by many during cer-tain crises periods.
Fermented bamboo(Figure 3)
Bamboo is grown as a cash crop in the north-eastern region of India. In Meghalaya, the fresh succulent bamboo shoots and the fermented preparation of bamboo shoot slices are relished. Fresh succulent shoots of bamboo of B. bal-cooa and D. strictus are collected during the growing season from May to Sep-tember and subjected to fermentation by inoculating the thin shoot slices with
the exudates obtained from already fer-mented samples of bamboo shoots in bottles or bamboo planks for 2–3 month. The inner surface of bamboo chamberis lined with banana and citrus leaves. The fermented bamboo is either pickled or cooked with vegetables or meat espe-cially pork.
Conclusion
Scientific research on indigenous fermented food products of Garo Hills is wanting. At present, the products are prepared for local consumption at house-hold level under non-sterile and marginally controlled conditions. Sci-entific evaluation with respect to the physico-chemical, sensory, microbial association and probiotic efficacy of the products are paramount to systemically and scientifically upgrade, commercial-ize andto establish their beneficial ef-fects. Improved and optimised produc-tion methods and materials will further help to economically and feasibly pro-duce these products with increased shelf life in future at reduced production costs which successively would help to stimu-late the rural economy of Garo Hills.
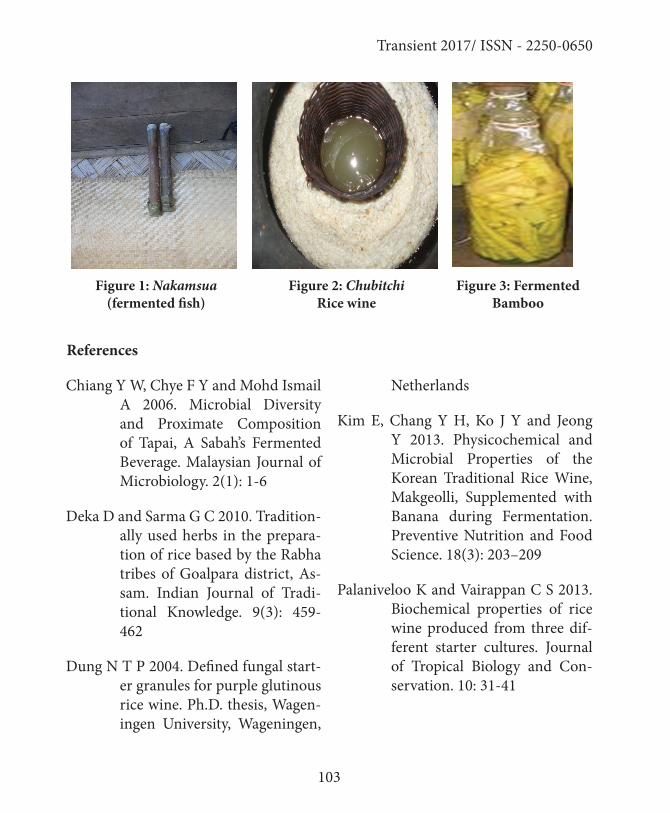
103
Transient 2017/ ISSN - 2250-0650
Figure 1: Nakamsua(fermented fish)
Figure 2: ChubitchiRice wine
Figure 3: Fermented Bamboo
References
Chiang Y W, Chye F Y and Mohd Ismail A 2006. Microbial Diversity and Proximate Composition of Tapai, A Sabah’s Fermented Beverage. Malaysian Journal of Microbiology. 2(1): 1-6
Deka D and Sarma G C 2010. Tradition-ally used herbs in the prepara-tion of rice based by the Rabha tribes of Goalpara district, As-sam. Indian Journal of Tradi-tional Knowledge. 9(3): 459-462
Dung N T P 2004. Defined fungal start-er granules for purple glutinous rice wine. Ph.D. thesis, Wagen-ingen University, Wageningen,
Netherlands
Kim E, Chang Y H, Ko J Y and Jeong Y 2013. Physicochemical and Microbial Properties of the Korean Traditional Rice Wine, Makgeolli, Supplemented with Banana during Fermentation. Preventive Nutrition and Food Science. 18(3): 203–209
Palaniveloo K and Vairappan C S 2013. Biochemical properties of rice wine produced from three dif-ferent starter cultures. Journal of Tropical Biology and Con-servation. 10: 31-41

104
Transient 2017/ ISSN - 2250-0650
• Dr (Mrs) Ajanta Deb
• Dr Arindam Ghosh
• Dr Biplab Mitra
• Dr Biswajit Paul
• Dr D C Kalita
• Dr (Mrs) Joyoshree Mahanta
• Dr (Mrs) Mautushi Das
• Dr (Mrs) Srimoyee Ghosh
• Dr Samrat Dey
• Dr Ngangom Aomoa
ESTEEMED REFEREES OF THE JOURNAL


106
Transient 2017/ ISSN - 2250-0650