Transforming Oerlikon for success – From an … Oerlikon for success – From an industrial...
25
Transforming Oerlikon for success – From an industrial conglomerate to a global leader in surface solutions Jefferies 2016 Industrials Conference Andreas Schwarzwälder, Head of IR New York, August 10, 2016
-
Upload
trankhuong -
Category
Documents
-
view
213 -
download
0
Transcript of Transforming Oerlikon for success – From an … Oerlikon for success – From an industrial...

Transforming Oerlikon for success – From an industrial conglomerate to a global leader in surface solutions
Jefferies 2016 Industrials Conference Andreas Schwarzwälder, Head of IR New York, August 10, 2016

Key facts Oerlikon Group FY 2015
20160810_Oerlikon presentation_Jefferies 2016 Industrials Conference Page 2
>13 500 employees
2.7 CHF billion sales
>170 locations
37 countries
3 segments

Creating a global surface solutions and advanced materials powerhouse
Initial major step with acquisition of Metco
String of pearls: Acquisition of Laser Cladding Services
Clear priorities defined for each Segment in line with Group strategy
20160810_Oerlikon presentation_Jefferies 2016 Industrials Conference Page 3
Surface Solutions
Manmade Fibers
Drive Systems Vacuum
Signed an agreement on Nov. 20, 2015,
to divest Vacuum Segment to Atlas Copco
(closing expected for Aug. 31, 2016)
Reorganization to allow for value- creating options
Structural adaptation to successfully
manage artificial market cycle

Surface Solutions
(Reporting unit)
Surface Solutions
Transformation of organizational structure in line with Group strategy
20160810_Oerlikon presentation_Jefferies 2016 Industrials Conference Page 4
Manmade Fibers
Drive Systems
Tooling
Automotive
Materials & Technology
Additive Manufacturing
Integration
The Oerlikon Group’s headquarters and the Surface Solutions Segment will be integrated into one single organization (new structure effective January 2017)
Dr. Roland Fisher takes on the added role of CEO of the Surface Solutions Segment; Dr. Roland Herb appointed Chief Commercial Officer of the surface solutions business
Reporting structure unchanged (3 Segments) Manmade Fibers and Drive Systems Segments not affected
by organizational changes
(Oerlikon Headquarters)

Surface Solutions Segment
20160810_Oerlikon presentation_Jefferies 2016 Industrials Conference Page 5

What we do – Surface Solutions Segment
20160810_Oerlikon presentation_Jefferies 2016 Industrials Conference Page 6
Starting point
Thin-film (job) coating
Investing in technology
expansion & growth
Thermal spray services, equipment & materials
Global surface solutions & advanced materials powerhouse
i.e. additive manufacturing
Oerlikon Balzers as Oerlikon’s primary surface solutions business
Oerlikon Balzers is a global leader in thin-film coatings for reduction of wear and friction mainly for tools and automotive industry
Global footprint with more than 140 coating centers
Acquisition of Sulzer Metco in 2014 to expand technology portfolio
Metco is a global leader in Thermal Spray, a thicker layer coating technology mainly for thermal protection of e.g. aero and gas turbine blades
Foundation of a new business unit “Additive manufacturing” in 2015 to address the promising 3D printing market
Oerlikon already today providing metal based powders; Leverage global footprint for production incl. post treatment (coatings)

Oerlikon covers a broad range of complementary surface technologies
20160810_Oerlikon presentation_Jefferies 2016 Industrials Conference Page 7
Surface treatment
THIN-FILM COATING PVD PECVD (PACVD)
THICK-FILM COATING Thermal spray
NITRIDING Plasma nitriding
Bulk treatment
HARDENING

20160810_Oerlikon presentation_Jefferies 2016 Industrials Conference Page 8
1 ePD = embedded PVD (thin-film coating on plastic substrate).
Surface technologies add a broad range of surface properties to a substrate
Wear resistance E.g. PVD coatings for cutting and forming tools
1 Thermal resistance E.g. thermal spray coatings for turbine blades
2 Friction reduction E.g. DLC coatings (Diamond-like-coatings) for engine parts
3
Electrical properties E.g. oxide coatings for fuel cells
4 Corrosion / erosion resistance E.g. coatings for pump impellers
5 Decorative enhancement E.g. DLC coatings for watches; ePD1 for decorative parts in cars
6

Reconditioning = regrinding and recoating
Reconditioning Conventional coat vs. BALINIT coat
Customer example – Coatings on cutting tools significantly increase productivity & tool life
20160810_Oerlikon presentation_Jefferies 2016 Industrials Conference Page 9
BALINIT Pertura coat from Oerlikon Balzers …increases drilling speed by factor of
2.5 from 80 m/min to 210 m/min and therefore increases productivity by 85%
…extends tool life time by ~67% (1 000 holes instead of 600 holes)
+ + + + + +
4 new tools 100%
total costs
1 new tool reconditioned 3×
50% cost savings
A used tool can be reconditioned up to three times (some tools up to eight times) and has the same performance as a virgin tool but at 50% of the costs
37
20
0
10
20
30
40
BALINIT® PERTURA
+85%
Conventional coat
Holes/minute
1,000
750
250
0
500
BALINIT® PERTURA
Conventional coat
+67%
600
1,000
Tool life time (# of drilled holes)

Grow additive manufacturing business (powders & post-treatment)
Complement technology portfolio
Develop new products / applications / end markets / regions
Grow service business Grow equipment & materials business Business development
Continue expansion of thin-film and thermal spray service business
Increase number of thermal spray powders
Continue expansion of thermal spray equipment
We will grow the Segment along three strategic directions – organic and inorganic
Page 10 20160810_Oerlikon presentation_Jefferies 2016 Industrials Conference
Leverage combined strength and interdependencies between coating services, equipment & materials
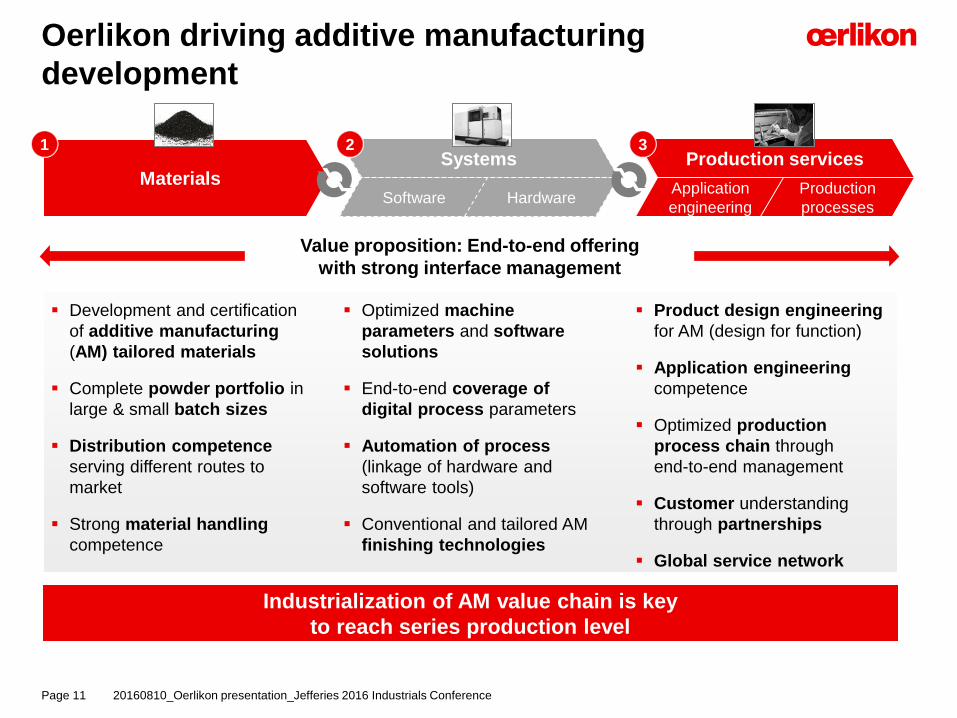
Oerlikon driving additive manufacturing development
Production services Application engineering
Production processes
Development and certification of additive manufacturing (AM) tailored materials
Complete powder portfolio in large & small batch sizes
Distribution competence serving different routes to market
Strong material handling competence
Product design engineering for AM (design for function)
Application engineering competence
Optimized production process chain through end-to-end management
Customer understanding through partnerships
Global service network
Optimized machine parameters and software solutions
End-to-end coverage of digital process parameters
Automation of process (linkage of hardware and software tools)
Conventional and tailored AM finishing technologies
Materials
1 3
Value proposition: End-to-end offering with strong interface management
Industrialization of AM value chain is key to reach series production level
Systems
Software Hardware
2
Page 11 20160810_Oerlikon presentation_Jefferies 2016 Industrials Conference

Only scratching the surface so far … Big growth potential in all areas
20160810_Oerlikon presentation_Jefferies 2016 Industrials Conference Page 12
Market development New
customers New regions New
industries
Market penetration
Diversification New applications Multilayer coatings Etc.
Product development New coatings / technologies New materials More efficient equipment
New products
Exis
ting
mar
kets
Existing products
New
mar
kets
Increasing number of coated parts in existing applications
New applications / end markets providing substantial growth potential
E.g. the number of thin-film coated parts in a car increased from ~15 parts to up to 100 parts ─ 1990s: first applications of thin-film
coatings in diesel injector systems ─ Since 2008: coatings also applied on
piston pins (starting with a small number; in 2015 more than 22 million coated piston pins)
─ 2015: whole piston group, oil actuation, ESP / brake systems and engine peripheral parts are coated
─ Future serial applications include transmission parts, differential gears, cooling systems, turbochargers etc.
Also an increasing number of thermal spray coated components in a car

Surface Solutions Segment – Back to top-line growth and strong profitability in Q2
RoW 5%
Asia / Pacific
28%
North America
19%
Europe 48%
Power Generation
8%
24% General Industry
Aviation 12%
Automotive
24%
Tooling 32%
Sales Q2 16
Sales Q2 16
20160810_Oerlikon presentation_Jefferies 2016 Industrials Conference Page 13
Market development: Tooling in Europe/Asia stable,
strong in India and softer in the US – major tool manufacturers with negative growth Automotive market overall
stable with some weakness in Europe, slight growth in the US and positive momentum in Asia Aviation picking up slightly
(new engine generations) - MRO3 activity remains low Power Generation with positive
signals in IGT4 from new generation turbine programs Oil & Gas remains on low level
Operational performance: Order intake and sales with
slight growth, despite low to negative growth in industrial production (IP)
Lower commodity prices in materials business still impacting top-line
Good growth in TF1 service business, lower equipment sales volume and strict cost management strong profitability
AM2 with good growth albeit at a low base & development of strategic partnerships
1 TF = Thin-film; 2 AM = Additive Manufacturing (3D printing); 3 MRO = Maintenance, Repair & Overhaul; 4 IGT = Industrial Gas Turbines
in CHF million Q2 16 Q2 15 y-o-y y-o-y ex FX H1 16 y-o-y y-o-y
ex FX Order intake 311 299 4.0% 1.2% 617 0.2% -1.8% Sales (3rd parties) 315 309 1.9% -0.7% 609 0.0% -2.1% EBITDA 71 69 2.9% – 133 2.3% – In % of sales 22.4% 22.2% 0.2 pp – 21.7% 0.4 pp – EBIT 43 42 2.4% – 76 0.0% – In % of sales 13.4% 13.6% -0.2 pp – 12.4% -0.1 pp –

Manmade Fibers Segment
20160810_Oerlikon presentation_Jefferies 2016 Industrials Conference Page 14

What we do – Manmade Fibers Segment
20160810_Oerlikon presentation_Jefferies 2016 Industrials Conference Page 15
Main business
Filament spinning equipment
Value chain expansion
Polycondensation
Reducing filament equipment exposure
i.e. staple fiber equipment
Global market and technology leader in filament spinning equipment
Project business with average order size of CHF 20-50 million (up to CHF 200 million)
Key markets are China, India, US and Turkey
“From melt to yarn” strategy Joint venture with Huitong
Chemical to provide polycondensation plants for either direct spinning process or PET production
Acquisition of Trützschler’s staple fiber technology portfolio to strengthen areas outside Chinese filament business
Business opportunities in nonwovens area
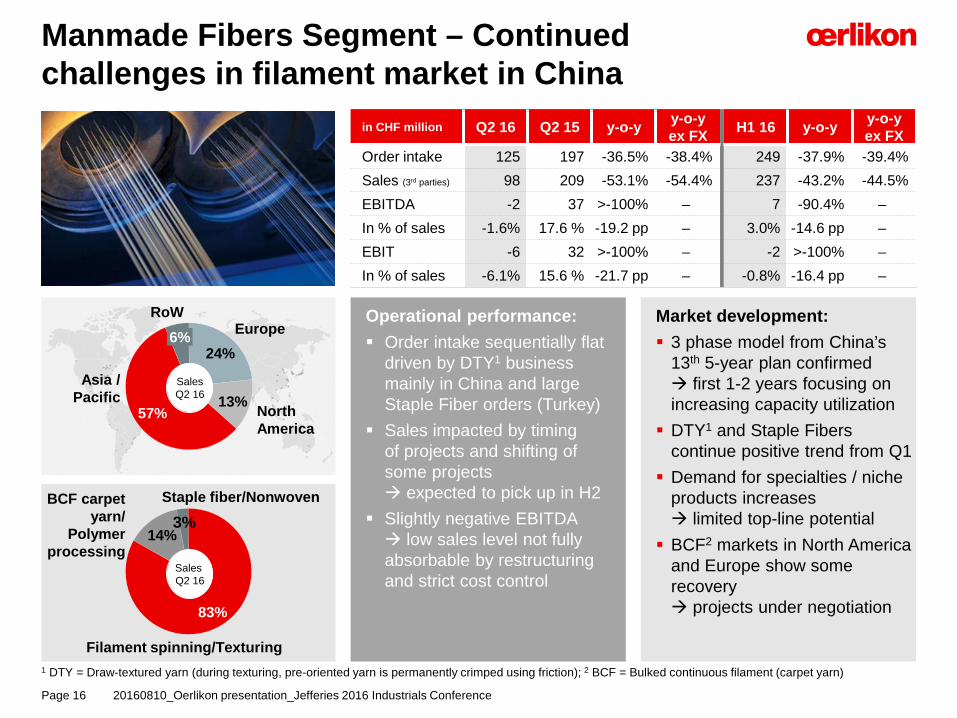
Operational performance: Order intake sequentially flat
driven by DTY1 business mainly in China and large Staple Fiber orders (Turkey)
Sales impacted by timing of projects and shifting of some projects expected to pick up in H2
Slightly negative EBITDA low sales level not fully absorbable by restructuring and strict cost control
Manmade Fibers Segment – Continued challenges in filament market in China
RoW
57%
Asia / Pacific
Europe
North America
24%
13%
6%
14%
Filament spinning/Texturing
83%
20160810_Oerlikon presentation_Jefferies 2016 Industrials Conference Page 16
BCF carpet yarn/
Polymer processing
Staple fiber/Nonwoven
Market development: 3 phase model from China’s
13th 5-year plan confirmed first 1-2 years focusing on increasing capacity utilization DTY1 and Staple Fibers
continue positive trend from Q1 Demand for specialties / niche
products increases limited top-line potential BCF2 markets in North America
and Europe show some recovery projects under negotiation
Sales Q2 16
Sales Q2 16
in CHF million Q2 16 Q2 15 y-o-y y-o-y ex FX H1 16 y-o-y y-o-y
ex FX Order intake 125 197 -36.5% -38.4% 249 -37.9% -39.4% Sales (3rd parties) 98 209 -53.1% -54.4% 237 -43.2% -44.5% EBITDA -2 37 >-100% – 7 -90.4% – In % of sales -1.6% 17.6 % -19.2 pp – 3.0% -14.6 pp – EBIT -6 32 >-100% – -2 >-100% – In % of sales -6.1% 15.6 % -21.7 pp – -0.8% -16.4 pp –
3%
1 DTY = Draw-textured yarn (during texturing, pre-oriented yarn is permanently crimped using friction); 2 BCF = Bulked continuous filament (carpet yarn)
20160810_Oerlikon presentation_Jefferies 2016 Industrials Conference Page 17
Drive Systems Segment

What we do – Drive Systems Segment
20160810_Oerlikon presentation_Jefferies 2016 Industrials Conference Page 18
Drive Systems Segment
«Broad and complex technology portfolio»
Streamlined product portfolio
Gears, shifting solutions & planetary drives
Business opportunities
i.e. e-drives/hybrids
Very broad and complex product portfolio with several product lines and more than 15 000 part numbers
Suboptimal geographical footprint and organizational structure
Diverse end markets with sometimes high cyclicality
Streamlining of product portfolio with main focus on product lines gears, shifting solutions and planetary drives
The Segment’s latest innovations for electric and hybrid vehicles are targeted at reducing emissions and environmental pollution

Drive Systems Segment – Order intake gaining momentum and profitability sequentially up
North America
RoW
49% Europe
33%
Asia/Pacific
14%
34% Agriculture
26%
15%
17%
Transportation
8% Performance
Automobile Energy/Mining
Construction
20160810_Oerlikon presentation_Jefferies 2016 Industrials Conference Page 19
4%
Operational performance: Good recovery of order intake
due to incremental new business wins despite negative end market development
Slight sequential improvement of sales and operational excellence/restructuring profitability sequentially improved (year-on-year impacted by product mix)
Voluntary retrenchment programs 110 FTE contracts signed in Italy
Market development: Continued low demand for
agricultural equipment (larger tractors & combines); Turkey however with strong growth & India showing signs of recovery Construction in Europe at
reduced levels, China remains weak and US mixed, India showing signs of recovery Transportation in US and
China with significant decline in heavy freight rail Oil and mining equipment
markets remain depressed
Sales Q2 16
Sales Q2 16
in CHF million Q2 16 Q2 15 y-o-y y-o-y ex FX H1 16 y-o-y y-o-y
ex FX Order intake 158 143 10.5% 7.2% 315 0.0% -2.4% Sales (3rd parties) 164 171 -4.1% -6.5% 323 -8.8% -11.1% EBITDA 12 17 -29.4% – 21 -40.0% – In % of sales 7.1% 10.0 % -2.9 pp – 6.4% -3.6 pp – EBIT 1 7 -85.7% – -1 >-100% – In % of sales 0.6% 4.0 % -3.4 pp – -0.2% -4.4 pp –

20160810_Oerlikon presentation_Jefferies 2016 Industrials Conference Page 20
Outlook Oerlikon Group

2016 outlook confirmed – Focus to protect profitability in challenging environment
20160810_Oerlikon presentation_Jefferies 2016 Industrials Conference Page 21
Short term: Continued competitive market environment / no improvement in world economic growth anticipated
Mid/long-term: Attractive growth markets with confirmed underlying drivers Continued organic growth in Surface Solutions Segment supported by market growth,
increasing number of applications and market penetration New market reality in manmade fibers industry impacting Segment and Group top-line Demand slowly recovering from trough levels in Drive Systems Segment U
nder
lyin
g as
sum
ptio
ns
and
mar
ket c
ondi
tions
:
Oerlikon expectations for financial year 2016: Order intake and sales within the range of CHF 2.3 billion to CHF 2.5 billion EBITDA margin around mid-teens
Gro
up
Gui
danc
e

Summary – 3 key messages of today’s presentation
20160810_Oerlikon presentation_Jefferies 2016 Industrials Conference Page 22
1 Positive results from the Surface Solutions Segment endorse the strategic direction and course of the Group
2 Organizational structure transformed in line with Group strategy
3 Full-year guidance for 2016 confirmed

Thank you.
20160810_Oerlikon presentation_Jefferies 2016 Industrials Conference Page 23

Investor Relations Contact
20160810_Oerlikon presentation_Jefferies 2016 Industrials Conference Page 24
OC Oerlikon Management AG, Pfäffikon Churerstrasse 120 CH – 8808 Pfäffikon SZ Switzerland Andreas Schwarzwälder Head of Investor Relations Phone: +41-58-360-9622 Mobile: +41-79-810-8211 E-mail: [email protected]

OC Oerlikon Corporation AG, Pfäffikon, (together with its affiliates hereinafter referred to as “Oerlikon”) has made great efforts to include accurate and up-to-date information in this document. However, Oerlikon makes no representation or warranties, expressed or implied, as to the truth, accuracy or completeness of the information provided in this document, Neither Oerlikon nor any of its directors, officers, employees or advisors, nor any other person connected or otherwise associated with Oerlikon, shall have any liability whatsoever for loss howsoever arising, directly or indirectly, from any use of this document. The contents of this document, including all statements made therein, is based on estimates, assumptions and other information currently available to the management of Oerlikon. This document contains certain statements related to the future business and financial performance or future events involving Oerlikon that may constitute forward-looking statements. The forward-looking statements contained herein could be substantially impacted by risks, influences and other factors, many of which are not foreseeable at present and/or are beyond Oerlikon’s control, so that the actual results, including Oerlikon’s financial results and operational results, may vary materially from and differ than those, expressly or implicitly, provided in the forward-looking statements, be they anticipated, expected or projected. Oerlikon does not give any assurance, representation or warranty, expressed or implied, that such forward-looking statements will be realized. Oerlikon is under no obligation to, and explicitly disclaims any obligation to, update or otherwise review its forward-looking statements, whether as a result of new information, future events or otherwise. This document, including any and all information contained therein, is not intended as, and may not be construed as, an offer or solicitation by Oerlikon for the purchase or disposal of, trading or any transaction in any Oerlikon securities. Investors must not rely on this information for investment decisions and are solely responsible for forming their own investment decisions.
Disclaimer
20160810_Oerlikon presentation_Jefferies 2016 Industrials Conference Page 25