TRANSFORMER CONDITION ASSESSMENT EXPERIENCES USING ... · PDF fileTRANSFORMER CONDITION...
8
* [email protected] - 1 - TRANSFORMER CONDITION ASSESSMENT EXPERIENCES USING AUTOMATED ON-LINE DISSOLVED GAS ANALYSIS S.R. LINDGREN* Serveron® Corporation (United States) SUMMARY Automated on-line monitoring of individual dissolved gases is now a reality. Although it has been a long time coming, 24 x 7 Green-Yellow-Red condition assessment’s time has come, logically starting at power plants where “non-redundant” GSU transformers are vital in delivering the power plant’s product. Critical system-tie autotransformers and phase-angle-regulators are close behind. The 50 years experience with laboratory dissolved gas analysis (DGA) tends to be considered a baseline, however the dynamic behavior of dissolved gases requires continuity & trending unlikely to be captured through periodic manual sampling. Automated on-line DGA brings opportunities for new experiences, learning, & knowledge vital to take full advantage of the information the gases can provide to understand what is happening inside a transformer. Examples are presented showing dynamic loading and other effects. Special attention is given to on-line DGA data from an operating GSU transformer that failed 3 weeks after the application of recent & recently-proposed diagnostic methods would have provided three confirming indicators of a serious problem, whereas existing industry DGA guidelines would not. KEYWORDS Power transformer – Dissolved gas analysis – On-line DGA – Cellulose degradation – AC voltage breakdown – Failure prediction – Condition assessment - Reliability 1. 500 kV Single-Phase FOA Autotransformer (Sealed Conservator) “Hot-metal” gases have accumulated since last de-gassing. Ethylene, methane, along with traces of acetylene, appear to increase during loading above 50% of nameplate and diminish as loading drops off (Stable & Green) as shown on the “3 Months” chart in figure 1. (LoadGuide® charts data from a current transformer; magnitude varies for individual installations depending upon the transformer’s CT ratio plus loading.) The “hot-metal” gassing is believed to be associated with circulating currents in the core support structure. In this example, top-oil passes through the analyzer and returns at the bottom of the transformer. 21, rue d'Artois, F-75008 Paris http://www.cigre.org © CIGRÉ Session 2004 A2-202
Transcript of TRANSFORMER CONDITION ASSESSMENT EXPERIENCES USING ... · PDF fileTRANSFORMER CONDITION...
* [email protected] - 1 -
TRANSFORMER CONDITION ASSESSMENT EXPERIENCES USING AUTOMATED ON-LINE DISSOLVED GAS ANALYSIS
S.R. LINDGREN*
Serveron® Corporation
(United States)
SUMMARY
Automated on-line monitoring of individual dissolved gases is now a reality. Although it has been a long time coming, 24 x 7 Green-Yellow-Red condition assessment’s time has come, logically starting at power plants where “non-redundant” GSU transformers are vital in delivering the power plant’s product. Critical system-tie autotransformers and phase-angle-regulators are close behind. The 50 years experience with laboratory dissolved gas analysis (DGA) tends to be considered a baseline, however the dynamic behavior of dissolved gases requires continuity & trending unlikely to be captured through periodic manual sampling. Automated on-line DGA brings opportunities for new experiences, learning, & knowledge vital to take full advantage of the information the gases can provide to understand what is happening inside a transformer. Examples are presented showing dynamic loading and other effects. Special attention is given to on-line DGA data from an operating GSU transformer that failed 3 weeks after the application of recent & recently-proposed diagnostic methods would have provided three confirming indicators of a serious problem, whereas existing industry DGA guidelines would not. KEYWORDS
Power transformer – Dissolved gas analysis – On-line DGA – Cellulose degradation – AC voltage breakdown – Failure prediction – Condition assessment - Reliability 1. 500 kV Single-Phase FOA Autotransformer (Sealed Conservator)
“Hot-metal” gases have accumulated since last de-gassing. Ethylene, methane, along with traces of acetylene, appear to increase during loading above 50% of nameplate and diminish as loading drops off (Stable & Green) as shown on the “3 Months” chart in figure 1. (LoadGuide® charts data from a current transformer; magnitude varies for individual installations depending upon the transformer’s CT ratio plus loading.) The “hot-metal” gassing is believed to be associated with circulating currents in the core support structure. In this example, top-oil passes through the analyzer and returns at the bottom of the transformer.
21, rue d'Artois, F-75008 Parishttp://www.cigre.org © CIGRÉ
Session 2004A2-202
- 2 -
LoadGuide
Ambient Temp
Acetylene
Ethylene
Methane
Ethane
Figure 1: 500 kV Autotransformer individual gas ppm on log scale 3-month chart (selectable)
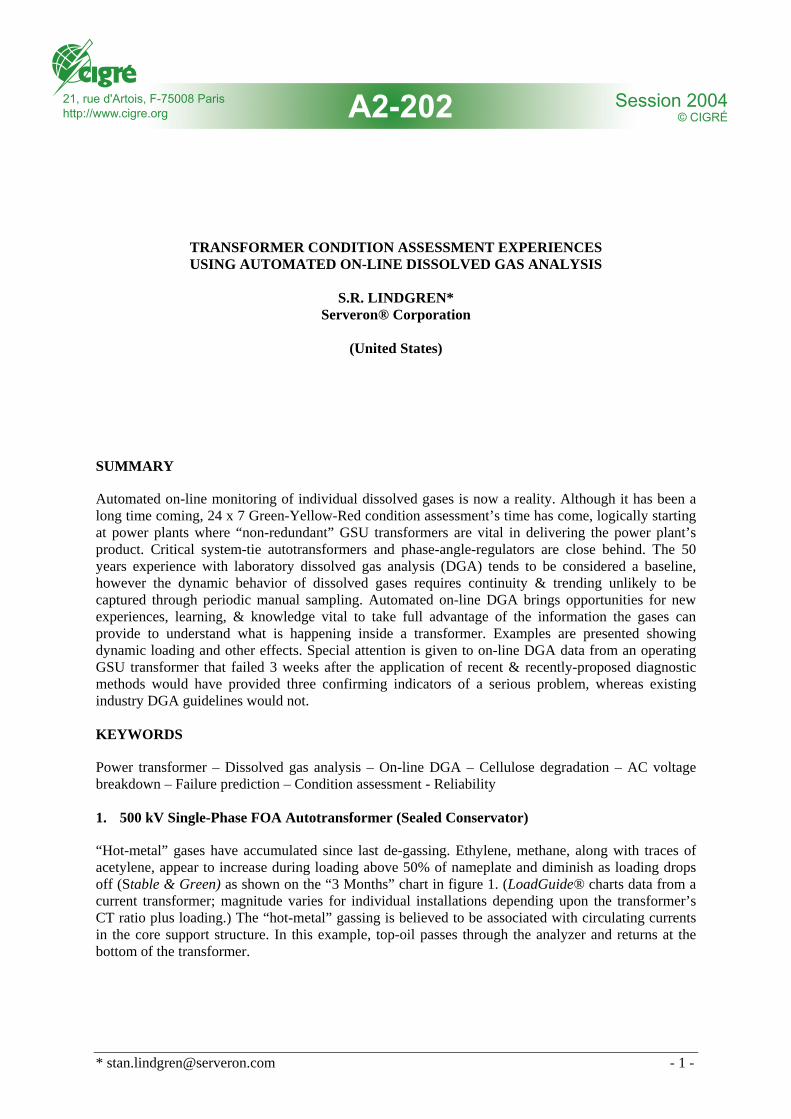
Higher resolution of the individual gases can be seen from the % Caution (or % Alarm) “1 Week” chart shown in figure 2. Caution for acetylene is set at 2 ppm (Alarm at 5 ppm), so ppm shown varies from 0.4 to 1.4 ppm. Caution & Alarm limits can be set at ppm increments, such as 25/50 ppm ethylene above an accumulated level such as 1300 ppm shown here, to react to new events. Events generate “ppm increases”, not “% increases”.
LoadGuide
Acetylene
Methane
Ethylene
Figure 2: 500 kV Autotransformer gases shown as % of Caution limits (individually selectable)
It appears small ppm increases in ethylene, methane, ethane & hydrogen drop back as gases distribute throughout the oil volume. However with time, gases including acetylene seem to disappear. Where do they go? Are some absorbed into the paper insulation as some people believe? Close watching after degassing could provide some clues. Acetylene peaked August 9th at 1.4 ppm (hydrogen, methane & ethane also peaked) and then gradually diminished to 0.4 ppm in November/December.
- 3 -
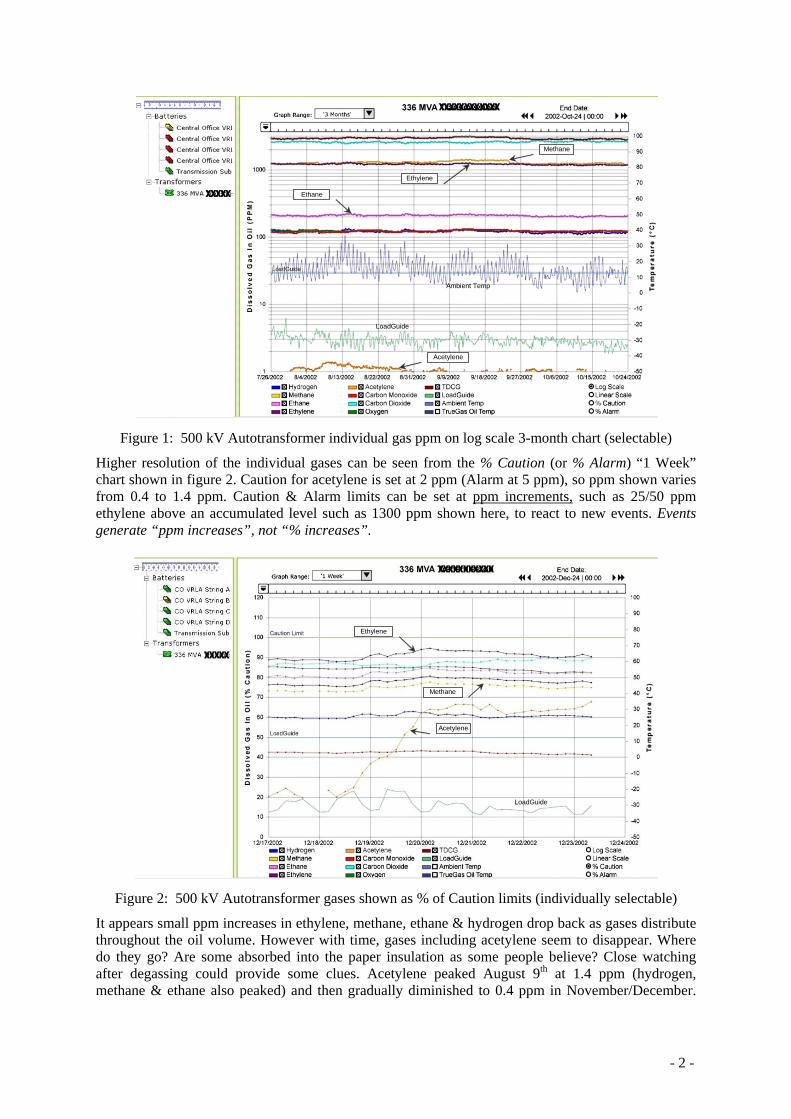
Ethylene peaked at 1298 ppm August 14th and dropped back to about 1160 ppm 4 months later (as shown in the tabulated data in figure 3).
Sample Time H2 CH4 C2H6 C2H4 C2H2 CO CO2 O2 T(amb) T(tgo) TDCG
2002-Aug-14 20:00 130 1305 224 1288 1.3 120 2515 122 22 40 3068
2002-Aug-14 16:00 136 1297 221 1280 1.3 120 2454 122 32 49 3055
2002-Aug-14 12:00 130 1303 219 1260 1.3 119 2494 122 29 46 3033
2002-Aug-14 08:00 129 1308 224 1286 1.3 120 2521 123 23 39 3069
2002-Aug-14 04:00 130 1304 226 1298 1.3 119 2504 122 17 40 3078
2002-Aug-14 00:00 130 1304 224 1289 1.3 119 2470 123 21 42 3068
2002-Aug-09 20:00 126 1259 217 1241 1.4 116 2523 123 23 40 2961
2002-Aug-09 16:00 126 1255 215 1236 1.4 118 2529 123 30 45 2951
2002-Aug-09 12:00 125 1256 213 1226 1.4 118 2533 124 24 39 2939
2002-Aug-09 08:00 123 1265 215 1238 1.4 118 2565 124 17 33 2961
2002-Aug-09 04:00 125 1271 215 1244 1.4 119 2535 125 11 35 2975
2002-Aug-09 00:00 126 1266 215 1240 1.4 118 2533 125 15 39 2967 Sample Time H2 CH4 C2H6 C2H4 C2H2 CO CO2 O2 T(amb) T(tgo) TDCG
2002-Dec-06 20:00 112 1127 209 1175 0.4 125 2578 121 -0.8 27 2748
2002-Dec-06 16:00 113 1125 206 1165 0.4 125 2590 121 5.2 30 2735
2002-Dec-06 12:00 112 1119 205 1154 0.4 125 2598 121 6.8 29 2716
2002-Dec-06 08:00 111 1125 206 1161 0.5 125 2611 121 -1.4 25 2728
2002-Dec-06 04:00 112 1128 210 1174 0.4 125 2587 122 -2.2 24 2749
2002-Dec-06 00:00 113 1130 210 1180 0.5 126 2566 122 -2.4 26 2759
2002-Dec-05 20:00 114 1131 210 1175 0.4 126 2562 122 -0.6 29 2757
2002-Dec-05 16:00 113 1120 206 1155 0.5 126 2557 122 4.2 30 2721
2002-Dec-05 12:00 112 1117 205 1153 0.4 125 2562 121 7.6 30 2714
2002-Dec-05 08:00 112 1116 203 1148 0.5 125 2572 121 2.8 29 2706
2002-Dec-05 04:00 112 1115 205 1152 0.4 125 2589 121 2.8 28 2709
2002-Dec-05 00:00 112 1108 204 1149 0.5 124 2591 121 1.9 27 2698 Figure 3: 500 kV Autotransformer gas and temperature data at 4-hour intervals
2. 230 kV Three-Phase FOW GSU Transformer (sealed conservator)
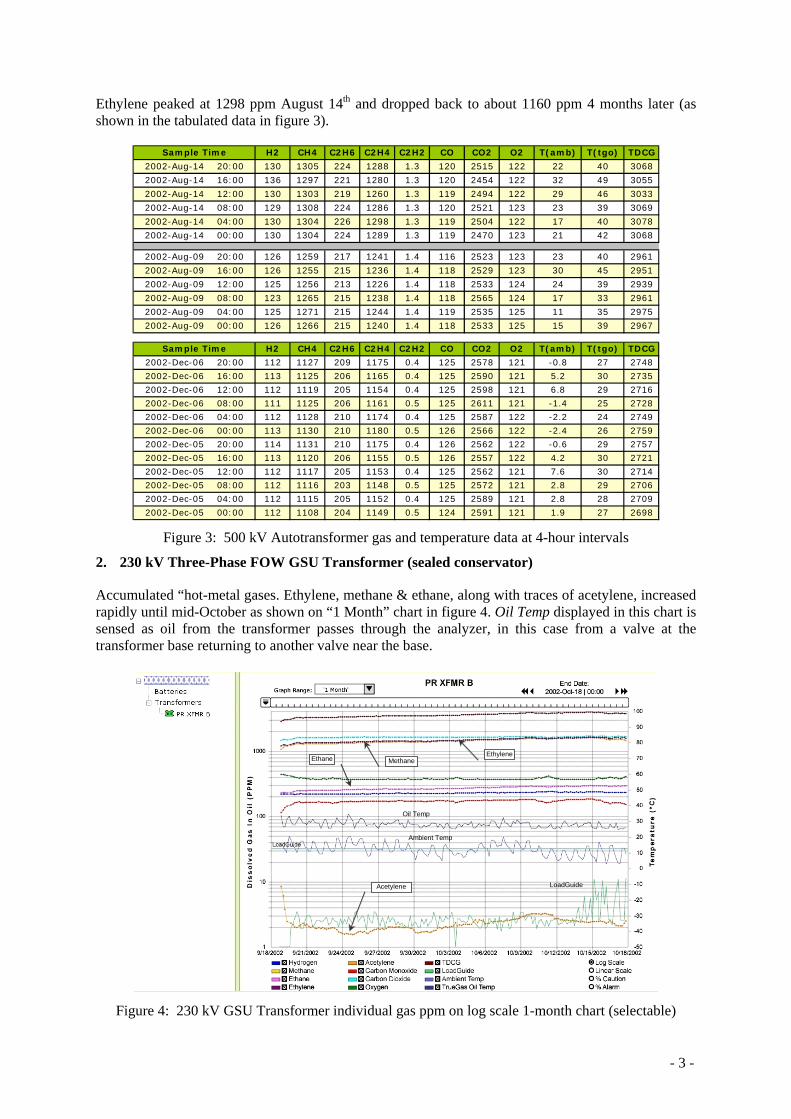
Accumulated “hot-metal gases. Ethylene, methane & ethane, along with traces of acetylene, increased rapidly until mid-October as shown on “1 Month” chart in figure 4. Oil Temp displayed in this chart is sensed as oil from the transformer passes through the analyzer, in this case from a valve at the transformer base returning to another valve near the base.
LoadGuide Acetylene
Ethylene Methane Ethane
Ambient Temp
Oil Temp
Figure 4: 230 kV GSU Transformer individual gas ppm on log scale 1-month chart (selectable)

- 4 -
The transformer is loaded from 2 generators connected to 2 LV windings. Only one was loaded until mid-October. Daily loading varies very widely. Gassing appears somewhat more severe when a single LV winding is loaded as can be seen more clearly from TDCG on the Linear chart in figure 5.
LoadGuide
Ethylene
Methane
TDCG
Figure 5: 230 kV GSU Transformer individual gas ppm on linear scale 1-month chart (selectable)
Sample Time H2 CH4 C2H6 C2H4 C2H2 CO CO2 O2 T(amb) T(tgo) TDCG
2002-Oct-09 20:00 236 1592 295 1624 3.3 182 1702 372 11 26 3932
2002-Oct-09 16:00 236 1582 293 1620 3.2 183 1694 372 18 29 3917
2002-Oct-09 12:00 237 1578 293 1619 3.1 183 1690 372 18 30 3913
2002-Oct-09 08:00 236 1568 292 1610 3 183 1692 372 14 29 3892
2002-Oct-09 04:00 237 1567 291 1594 3 183 1694 372 12 30 3875
2002-Oct-09 00:00 236 1559 291 1588 2.9 183 1693 372 14 28 3859 Figure 6: 230 kV GSU Transformer gas and temperature data at 4-hour intervals
As can be seen from the chart in figure 6, ethylene & methane increased 36 & 33 ppm respectively in 20 hours October 9th while only one LV winding was loaded (Unstable & Red) at that time. The “hot-metal” gassing appears similar to the first example (same manufacturer), and may be caused by circulating current in the core clamping structure. Gassing started dropping with loading on both LV windings, (Stable & Green) as shown in figure 5.
- 5 -
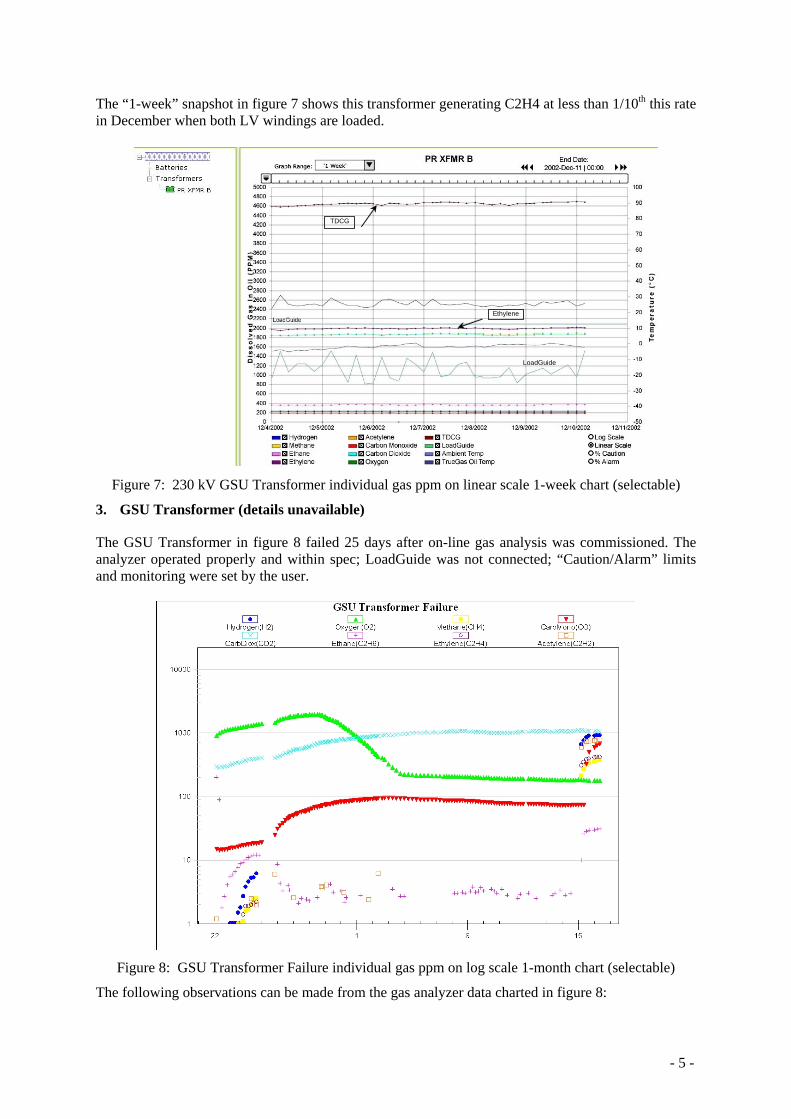
The “1-week” snapshot in figure 7 shows this transformer generating C2H4 at less than 1/10th this rate in December when both LV windings are loaded.
LoadGuide
Ethylene
TDCG
Figure 7: 230 kV GSU Transformer individual gas ppm on linear scale 1-week chart (selectable)
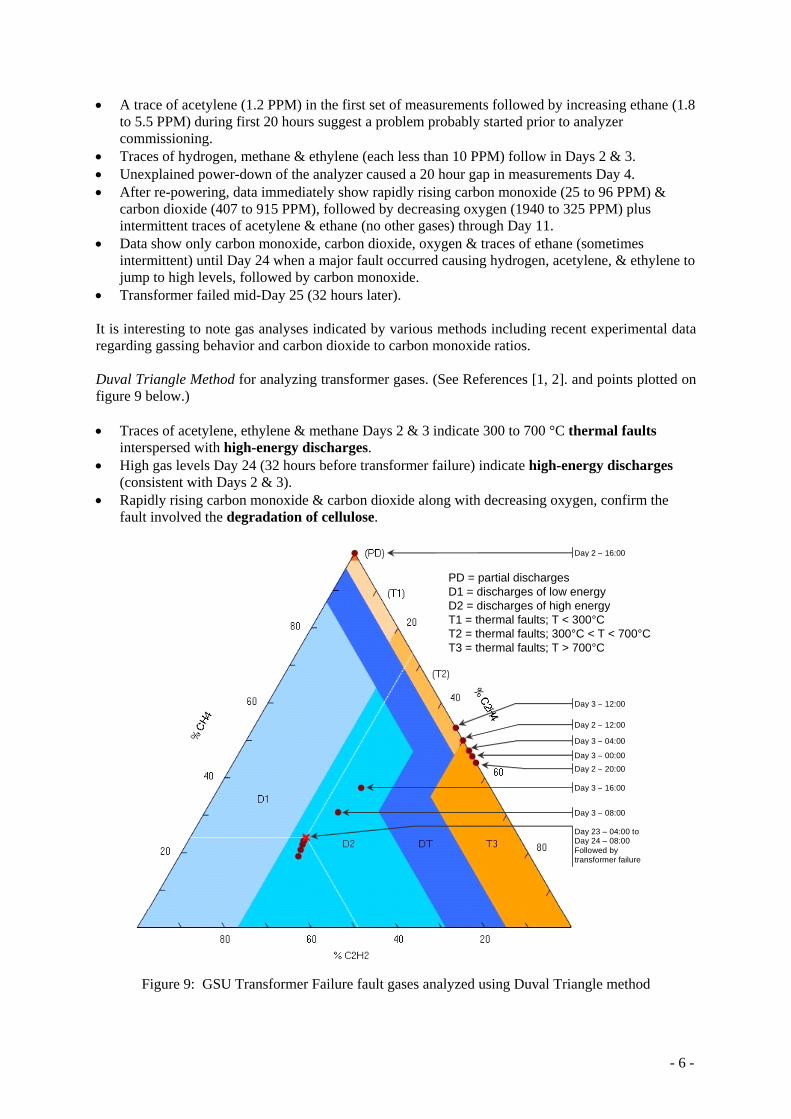
3. GSU Transformer (details unavailable)
The GSU Transformer in figure 8 failed 25 days after on-line gas analysis was commissioned. The analyzer operated properly and within spec; LoadGuide was not connected; “Caution/Alarm” limits and monitoring were set by the user.
Figure 8: GSU Transformer Failure individual gas ppm on log scale 1-month chart (selectable)
The following observations can be made from the gas analyzer data charted in figure 8:
- 6 -
• A trace of acetylene (1.2 PPM) in the first set of measurements followed by increasing ethane (1.8 to 5.5 PPM) during first 20 hours suggest a problem probably started prior to analyzer commissioning.
• Traces of hydrogen, methane & ethylene (each less than 10 PPM) follow in Days 2 & 3. • Unexplained power-down of the analyzer caused a 20 hour gap in measurements Day 4. • After re-powering, data immediately show rapidly rising carbon monoxide (25 to 96 PPM) &
carbon dioxide (407 to 915 PPM), followed by decreasing oxygen (1940 to 325 PPM) plus intermittent traces of acetylene & ethane (no other gases) through Day 11.
• Data show only carbon monoxide, carbon dioxide, oxygen & traces of ethane (sometimes intermittent) until Day 24 when a major fault occurred causing hydrogen, acetylene, & ethylene to jump to high levels, followed by carbon monoxide.
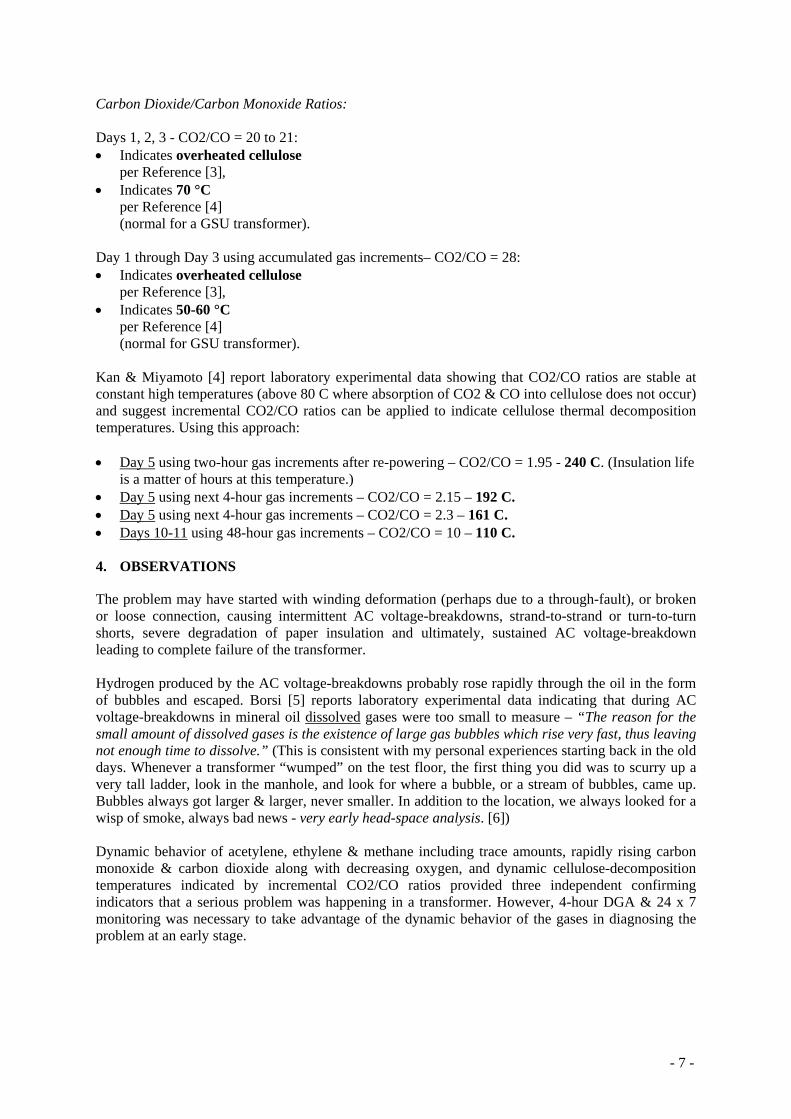
• Transformer failed mid-Day 25 (32 hours later). It is interesting to note gas analyses indicated by various methods including recent experimental data regarding gassing behavior and carbon dioxide to carbon monoxide ratios. Duval Triangle Method for analyzing transformer gases. (See References [1, 2]. and points plotted on figure 9 below.) • Traces of acetylene, ethylene & methane Days 2 & 3 indicate 300 to 700 °C thermal faults
interspersed with high-energy discharges. • High gas levels Day 24 (32 hours before transformer failure) indicate high-energy discharges
(consistent with Days 2 & 3). • Rapidly rising carbon monoxide & carbon dioxide along with decreasing oxygen, confirm the
fault involved the degradation of cellulose.
Day 2 – 16:00
Day 2 – 20:00
Day 3 – 00:00
Day 3 – 04:00
Day 2 – 12:00
Day 3 – 12:00
Day 3 – 16:00
Day 3 – 08:00
Day 23 – 04:00 to Day 24 – 08:00 Followed by transformer failure
PD = partial dischargesD1 = discharges of low energyD2 = discharges of high energyT1 = thermal faults; T < 300°CT2 = thermal faults; 300°C < T < 700°CT3 = thermal faults; T > 700°C
Figure 9: GSU Transformer Failure fault gases analyzed using Duval Triangle method
- 7 -
Carbon Dioxide/Carbon Monoxide Ratios: Days 1, 2, 3 - CO2/CO = 20 to 21: • Indicates overheated cellulose
per Reference [3], • Indicates 70 °C
per Reference [4] (normal for a GSU transformer).
Day 1 through Day 3 using accumulated gas increments– CO2/CO = 28: • Indicates overheated cellulose
per Reference [3], • Indicates 50-60 °C
per Reference [4] (normal for GSU transformer).
Kan & Miyamoto [4] report laboratory experimental data showing that CO2/CO ratios are stable at constant high temperatures (above 80 C where absorption of CO2 & CO into cellulose does not occur) and suggest incremental CO2/CO ratios can be applied to indicate cellulose thermal decomposition temperatures. Using this approach: • Day 5 using two-hour gas increments after re-powering – CO2/CO = 1.95 - 240 C. (Insulation life
is a matter of hours at this temperature.) • Day 5 using next 4-hour gas increments – CO2/CO = 2.15 – 192 C. • Day 5 using next 4-hour gas increments – CO2/CO = 2.3 – 161 C. • Days 10-11 using 48-hour gas increments – CO2/CO = 10 – 110 C. 4. OBSERVATIONS
The problem may have started with winding deformation (perhaps due to a through-fault), or broken or loose connection, causing intermittent AC voltage-breakdowns, strand-to-strand or turn-to-turn shorts, severe degradation of paper insulation and ultimately, sustained AC voltage-breakdown leading to complete failure of the transformer. Hydrogen produced by the AC voltage-breakdowns probably rose rapidly through the oil in the form of bubbles and escaped. Borsi [5] reports laboratory experimental data indicating that during AC voltage-breakdowns in mineral oil dissolved gases were too small to measure – “The reason for the small amount of dissolved gases is the existence of large gas bubbles which rise very fast, thus leaving not enough time to dissolve.” (This is consistent with my personal experiences starting back in the old days. Whenever a transformer “wumped” on the test floor, the first thing you did was to scurry up a very tall ladder, look in the manhole, and look for where a bubble, or a stream of bubbles, came up. Bubbles always got larger & larger, never smaller. In addition to the location, we always looked for a wisp of smoke, always bad news - very early head-space analysis. [6]) Dynamic behavior of acetylene, ethylene & methane including trace amounts, rapidly rising carbon monoxide & carbon dioxide along with decreasing oxygen, and dynamic cellulose-decomposition temperatures indicated by incremental CO2/CO ratios provided three independent confirming indicators that a serious problem was happening in a transformer. However, 4-hour DGA & 24 x 7 monitoring was necessary to take advantage of the dynamic behavior of the gases in diagnosing the problem at an early stage.
- 8 -
5. CONCLUSIONS
• On-line monitoring of all 8 gases can provide insight regarding loading and other conditions associated with the generation of gases in oil-filled transformers.
• Gassing behavior of individual transformers tends to be unique due to specific operating conditions as well as internal characteristics. On-line monitoring can provide a history that identifies a transformer’s “personality” including capability under unusual conditions.
• Trending of individual gases on-line makes it possible to see gas-generation events as they happen, despite high levels of accumulated gases, not possible through laboratory DGA (due to variables in sampling, testing and specific transformer conditions at time of sampling).
• On-line monitoring of oxygen can reveal air-leaks that provide a warning of potentially hazardous entrance of water (whereas oxygen content per DGA often contains a variable amount of air).
• 24 x 7 on-line monitoring of all 8 gases makes Green-Yellow-Red condition assessment feasible for managing transformer asset populations large & small while developing new knowledge and understanding from the dynamic behavior of gases. This presents the opportunity to move transformer DGA interpretation from “an art” to “engineering” – The New Ballgame.
REFERENCES
1. Michel Duval, A Review of Faults Detectable by Gas-in-Oil Analysis in Transformers, IEEE Electrical Insulation Magazine, May/June 2002 – Vol. 18, No. 3.
2. Guide to the interpretation of dissolved and free gases analysis, IEC 60599, Second edition, 1999-03.
3. A. Mollmann, B. Pahlavanpour (Cigre WG 15.01 TF 01), New Guidelines for Interpretation of Dissolved Gas Analysis in Oil-Filled transformers, ELECTRA No. 186 October 1999.
4. Hisao Kan, Teruo Miyamoto, Proposals for an Improvement in Transformer Diagnosis Using Dissolved Gas Analysis (DGA), IEEE Electrical Insulation Magazine, November/December 1995 – Vol. 11 No. 6.
5. H. Borsi, Cigre Working Group 15.01, Gassing Behavior of Different Insulating Liquids for Transformers, ELECTRA No. 188 February 2000.
6. Stan Lindgren, Method for On-Line Assessment and Indication of Transformer Conditions, US Patent 6,289,716, Sep. 18, 2001.