Transformative Planning, Forecasting and Reporting for ...
35
Transformative Planning, Forecasting and Reporting for Banks and Credit Unions
Transcript of Transformative Planning, Forecasting and Reporting for ...
Transformative Planning, Forecasting and Reporting for Banks and Credit Unions
Agenda
• Our Presenters
• Introducing OneStream
• Performance Management with PERFORMFI
• OneStream Demonstration
• Implementing PERFORMFI
• Win a free pass to Splash!
• Questions? – use the live chat
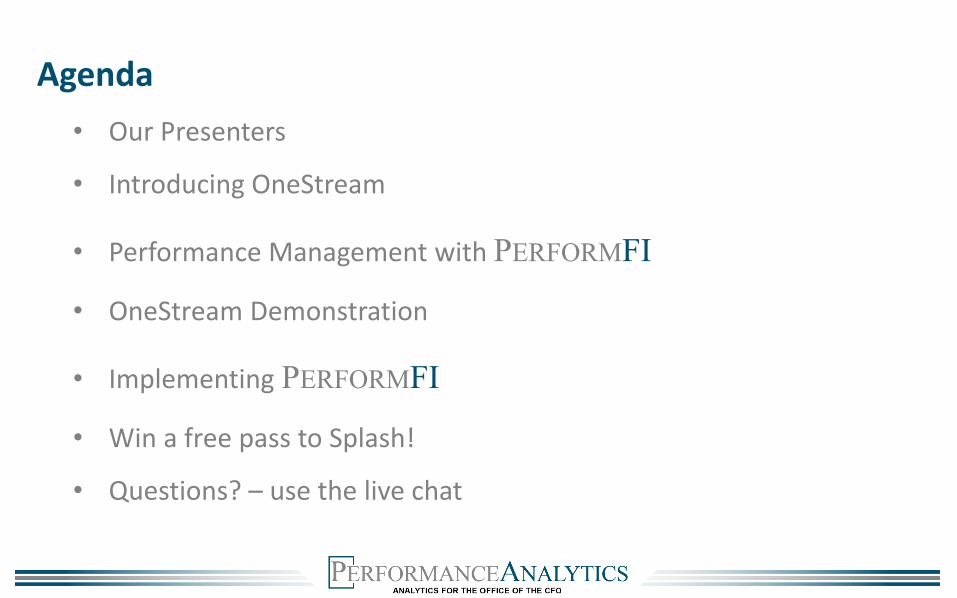
Our Expert Presenters
Tom McCarthy• Senior Solutions Consultant at
OneStream Software
• 25+ yrs. Financial Services
• 20+ yrs. CPM/EPM
• Fiserv / SAP / Axiom Software
Bob Markus• Practice Director – Performance
Management for FI, Performance
Analytics
• 34+ yrs. Financial Services
• 20+ yrs. CPM/EPM
• Axiom Software / SAP
Dave Collins• Director of Solutions
Consulting, Global Alliances at
OneStream Software
• 25 yrs. CPM
• Hyperion, IBM, Adaptive
Peter Digby• President, Performance
Analytics
• 24 yrs. Performance
Management
• Hyperion, SAP/BPC
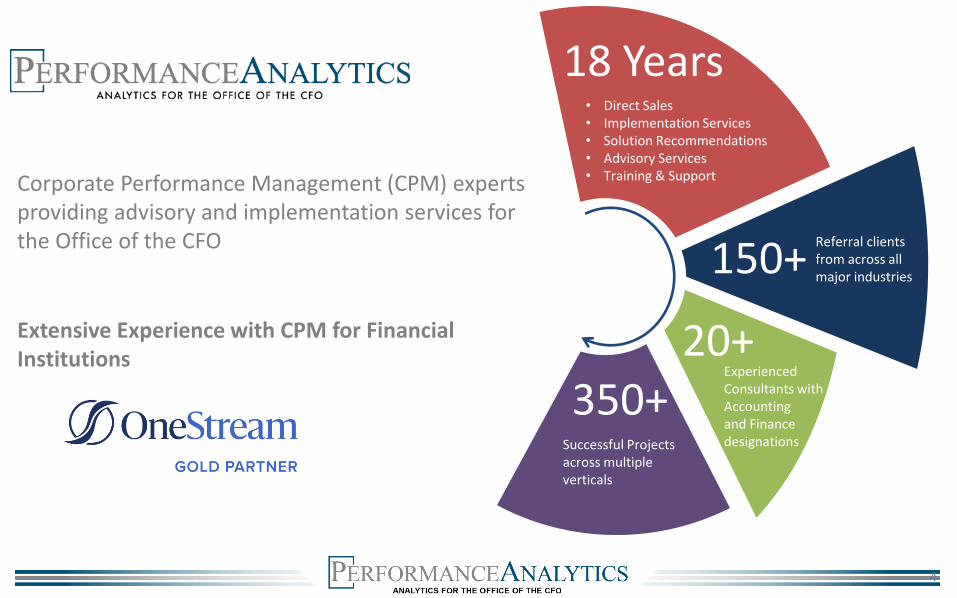
Corporate Performance Management (CPM) experts providing advisory and implementation services for the Office of the CFO
Extensive Experience with CPM for Financial Institutions
• Direct Sales• Implementation Services• Solution Recommendations• Advisory Services• Training & Support
18 Years
Referral clients from across all major industries
150+
20+Experienced Consultants with Accounting and Finance designations
350+Successful Projects across multiple verticals
4
Key OneStream Benefits for Financial Institutions
Ease of Data Integration
Audit Trail of All Changes
Flexible Deployment Options

Financial Close(Actuals)
Budget and Forecast(FP&A)
Profitability(FTP)
Scenario Modeling
InterestRate Risk
Management (ALM)
Financial Close(Actuals)
Key FI Analytical and Performance Metrics Challenges
Financial Close
Budget and Forecast
Profitability Reporting
Scenario Modeling
PERFORMFI will handle all the above on one platform

7OneStream Software | All Rights Reserved.
OneStream Overview
8OneStream Software | All Rights Reserved.
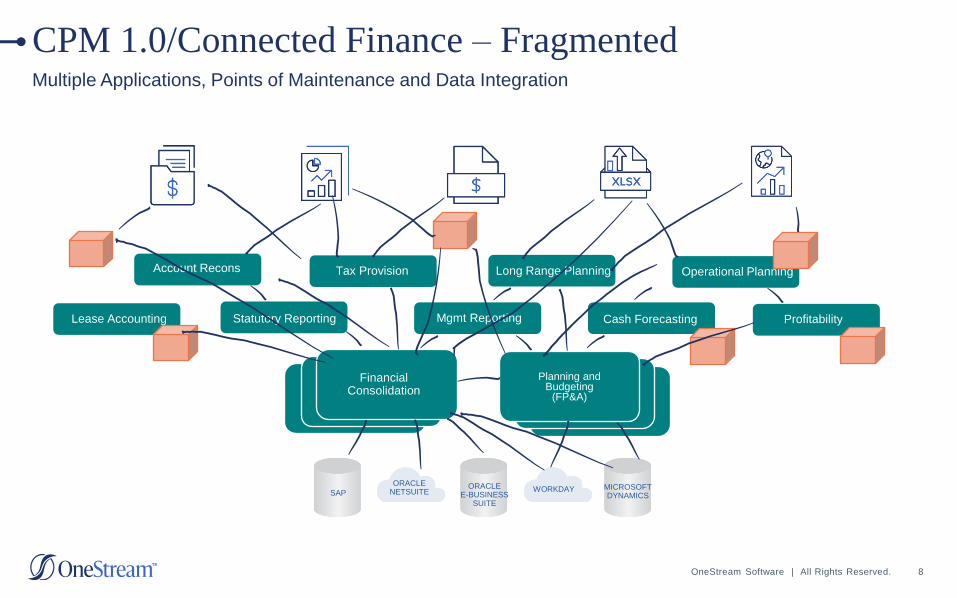
CPM 1.0/Connected Finance – FragmentedMultiple Applications, Points of Maintenance and Data Integration
SAP
ORACLENETSUITE
ORACLEE-BUSINESS
SUITE
WORKDAY MICROSOFTDYNAMICS
Financial Consolidation
Planning and Budgeting
(FP&A)
Statutory Reporting
Account Recons
Mgmt Reporting
Tax Provision Long Range Planning
Cash Forecasting
Operational Planning
ProfitabilityLease Accounting

9OneStream Software | All Rights Reserved.
CPM 1.0/Connected Finance – FragmentedMultiple Applications, Points of Maintenance and Data Integration
SAP
ORACLENETSUITE
ORACLEE-BUSINESS
SUITE
WORKDAY MICROSOFTDYNAMICS
Financial Consolidation
Planning and Budgeting
(FP&A)
Statutory Reporting
Account Recons
Mgmt Reporting
Tax Provision Long Range Planning
Cash Forecasting
Operational Planning
ProfitabilityLease Accounting
Planning and
BudgetingFinancial
Consolidation
Profitability
Narrative
Reporting
Long Range
PlanningTaxAccount Recs

10OneStream Software | All Rights Reserved.
OneStream Evolution
100% Customer Success
World Class Support100% SLA Compliance
Embedded Diagnostics/One Solution
Direct Link to Development
90% First Response Under 40 Minutes
Visionary Leadership
Domain Experts • Inventors Bob Powers
HFM Inventor
Hyperion VP R&D
Tom Shea
FDM Inventor
Founded UpStream
Domain Experience
Sales • Services • Support
Over 700 Employees
10+ Years Avg. CPM Experience
200+ Partners Globally
Industry Accolades

11OneStream Software | All Rights Reserved.
100% 750+
70% 50+
Customer Success Customers
Converted from multi-
product deployments
of Oracle Hyperion,
SAP or IBM
Solutions in the
OneStream
MarketPlace
By the Numbers
OneStream

12OneStream Software | All Rights Reserved.
Real World SuccessBest Cloud Solutions FP&A and Financial Close
13OneStream Software | All Rights Reserved.
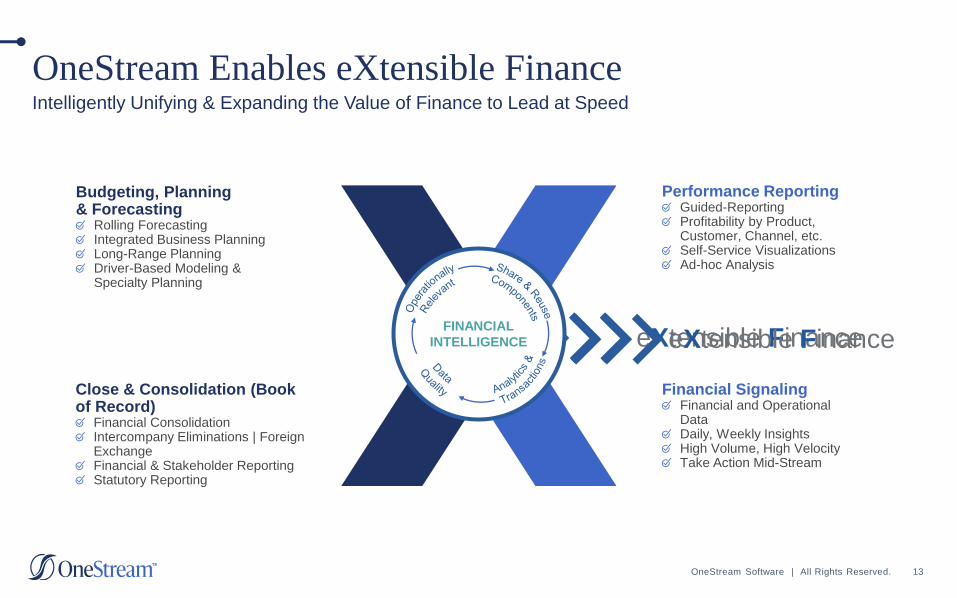
OneStream Enables eXtensible FinanceIntelligently Unifying & Expanding the Value of Finance to Lead at Speed
Close & Consolidation (Book of Record)
Financial ConsolidationIntercompany Eliminations | Foreign ExchangeFinancial & Stakeholder ReportingStatutory Reporting
Performance ReportingGuided-ReportingProfitability by Product, Customer, Channel, etc.Self-Service VisualizationsAd-hoc Analysis
Financial SignalingFinancial and Operational DataDaily, Weekly InsightsHigh Volume, High VelocityTake Action Mid-Stream
eXtensible FinanceFINANCIAL
INTELLIGENCE eXtensible Finance
Budgeting, Planning & Forecasting
Rolling ForecastingIntegrated Business PlanningLong-Range Planning Driver-Based Modeling & Specialty Planning

14OneStream Software | All Rights Reserved.
Intelligent Finance… Unified Unique Advantage One Application… Multiple Solutions
Integrated Master Data, Financial Data Quality, & Workflow
Advanced, Global Financial Consolidation & Reporting
Extensible Solution for Planning at Corporate & BU Levels
Flexible Reporting, Dashboards, & Microsoft Office Integration
Access to Transaction & Operational Details

15OneStream Software | All Rights Reserved.
Scalable & Secure Cloud PlatformUnique Advantage On-Premises or Cloud... Deploy YOUR Way
Unified Platform
Supporting Multiple CPM Processes
Single Tenant SaaS
64-Bit In-memory, RPA, AI, and ML
Integrated Analytics
Supports CORP & BU Needs
Fast & Simple Upgrades
Intelligent Scalability
Supporting Peak Demands
Low TCO
Total Cost of Ownership

16OneStream Software | All Rights Reserved.
Accelerate Insights with 50+ Pre-Built SolutionsUnique Advantage OneStream MarketPlace
Productivity Tools
Guided
Reporting
Parcel
Service
Task
Manager
Data Entry
123
Diagnostics
123
Planning & Analysis
People
Planning
Capital
Planning
Cash
Planning
Predictive
Analytics 123
Sales
Planning
Financial Close & Reporting
Account
Reconciliations
Transaction
Matching
Compliance
Solutions
Tax
Provision
Apps Control
Manager
17OneStream Software | All Rights Reserved.
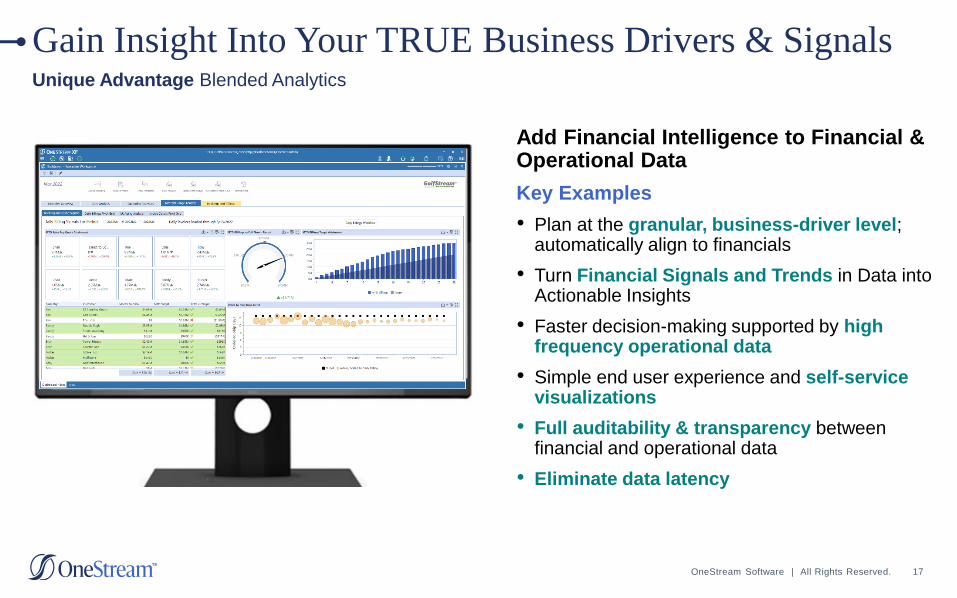
Gain Insight Into Your TRUE Business Drivers & SignalsUnique Advantage Blended Analytics
Add Financial Intelligence to Financial & Operational Data
Key Examples
• Plan at the granular, business-driver level; automatically align to financials
• Turn Financial Signals and Trends in Data into Actionable Insights
• Faster decision-making supported by high frequency operational data
• Simple end user experience and self-service visualizations
• Full auditability & transparency between financial and operational data
• Eliminate data latency

Financial Close and Portfolio Analytics
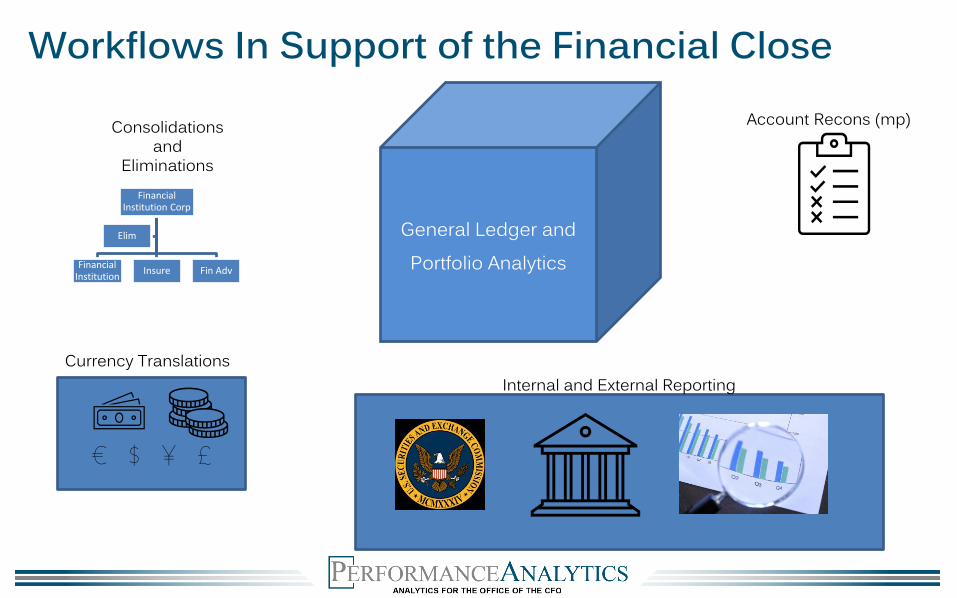
Workflows In Support of the Financial Close
General Ledger and Portfolio Analytics
Financial Institution Corp
Financial Institution
Insure Fin Adv
Elim
Consolidations and
Eliminations
Account Recons (mp)
Currency TranslationsInternal and External Reporting

Sub Ledger Account DetailLoan/Leases/Lines
•Balances, Interest, Fees
•Rates
•Payment/Pricing Terms
•Draws/Paydowns
•Asset Quality
•Open/Close/Renewal
•FTP rates
•GL mapping
•Industry, Location, Officer Demographic
Savings and Checking
•Balances, Interest, Fees
•Rates
•Open/Close
•Transaction Balances (DR/CR)
•Transaction Volumes
•FTP Rates
•GL Mapping
•Industry, Location, Officer
Time Deposits
•Balances, Interest Fees
•Rates
•Maturity Date
•Open/Close/Renewal
•FTP Rates
•GL Mapping
•Industry, Location, Officer
Sub Ledger Account Detail
Load Core System Data
Import Loan and Deposit Customer Account Detail

In Financial Institutions, the balance sheet is the primary driver of profitability.
But looking at the balance alone lacks context of performance.Even adding interest, funds transfer pricing and spread only begin to tell the story.
By calculating yields and rates we learn whether profitability is improving….but there’s more to understand…
Augmented by aggregations of data from the sub ledger account details, we now have a rich view of the portfolio not available from general ledger data.
Portfolio Analytics
Jan Feb Mar Apr May Jun Jul Aug Sep Oct Nov Dec
Balances 3,910,597 3,903,209 3,914,476 3,933,231 3,968,698 3,994,450 3,985,930 3,992,554 4,031,312 3,992,266 4,028,767 4,070,228
Interest 18,117 16,465 18,121 17,770 18,511 17,853 18,752 18,594 18,049 18,407 18,018 18,778
FTP 12,159 10,970 12,172 12,000 12,545 12,226 12,623 12,638 12,265 12,563 12,276 12,815
Spread Income 5,958 5,495 5,949 5,770 5,966 5,627 6,129 5,956 5,785 5,844 5,742 5,963
Yield 5.45% 5.50% 5.45% 5.50% 5.49% 5.44% 5.54% 5.48% 5.45% 5.43% 5.44% 5.43%
FTP Rate 3.66% 3.66% 3.66% 3.71% 3.72% 3.72% 3.73% 3.73% 3.70% 3.71% 3.71% 3.71%
Spread Rate 1.79% 1.84% 1.79% 1.78% 1.77% 1.71% 1.81% 1.76% 1.75% 1.72% 1.73% 1.72%
New Volume 31,285 31,226 31,316 31,466 46,750 31,956 31,887 31,940 42,250 31,938 42,230 47,562
Paydowns (16,773) (38,614) (20,049) (12,711) (11,283) (6,204) (40,407) (25,316) (3,492) (70,984) (5,729) (6,101)
Net Change 14,512 (7,388) 11,267 18,755 35,467 25,752 (8,520) 6,624 38,758 (39,046) 36,501 41,461
Asset Quality Stats
Non Accrual 23,590 23,446 22,459 21,065 19,116 18,609 21,883 20,850 23,069 22,410 21,920 21,620
% of Balance 0.603% 0.601% 0.574% 0.536% 0.482% 0.466% 0.549% 0.522% 0.572% 0.561% 0.544% 0.531%
Renegotiated 3,483 3,483 3,449 2,086 2,092 2,093 1,597 1,138 1,433 331 263 261
% of Balance 0.089% 0.089% 0.088% 0.053% 0.053% 0.052% 0.040% 0.029% 0.036% 0.008% 0.007% 0.006%
OREO 10,264 11,328 10,837 9,529 9,375 8,905 7,925 7,964 8,242 7,001 7,474 7,703
% of Balance 0.262% 0.290% 0.277% 0.242% 0.236% 0.223% 0.199% 0.199% 0.204% 0.175% 0.186% 0.189%
Past Due 90 1,160 1,443 1,599 632 2,331 1,829 2,299 2,534 1,008 1,008 958 1,058
% of Balance 0.030% 0.037% 0.041% 0.016% 0.059% 0.046% 0.058% 0.063% 0.025% 0.025% 0.024% 0.026%
Total 38,497 39,700 38,344 33,312 32,914 31,436 33,704 32,486 33,752 30,750 30,615 30,642
% of Balance 0.984% 1.017% 0.980% 0.847% 0.829% 0.787% 0.846% 0.814% 0.837% 0.770% 0.760% 0.753%
Charge-Off 687 249 441 431 1,864 400 373 382 4,012 694 596 696
Recoveries 280 296 410 517 488 576 483 405 225 220 295 195
Net C/O 407 (47) 31 (86) 1,376 (176) (110) (23) 3,787 474 301 501
% of Balance 0.010% -0.001% 0.001% -0.002% 0.035% -0.004% -0.003% -0.001% 0.094% 0.012% 0.007% 0.012%
Provision 828 828 829 487 733 733 702 702 712 712 712 (434)
1.50%
2.00%
2.50%
3.00%
3.50%
4.00%
4.50%
5.00%
5.50%
6.00%
3,800,000
3,850,000
3,900,000
3,950,000
4,000,000
4,050,000
4,100,000
Jan Feb Mar Apr May Jun Jul Aug Sep Oct Nov Dec
Commercial Loans
Balances Yield FTP Rate Spread Rate
Jan Feb Mar Apr May Jun Jul Aug Sep Oct Nov Dec
Balances 3,910,597 3,903,209 3,914,476 3,933,231 3,968,698 3,994,450 3,985,930 3,992,554 4,031,312 3,992,266 4,028,767 4,070,228
Interest 18,117 16,465 18,121 17,770 18,511 17,853 18,752 18,594 18,049 18,407 18,018 18,778
FTP 12,159 10,970 12,172 12,000 12,545 12,226 12,623 12,638 12,265 12,563 12,276 12,815
Spread Income 5,958 5,495 5,949 5,770 5,966 5,627 6,129 5,956 5,785 5,844 5,742 5,963
Yield 5.45% 5.50% 5.45% 5.50% 5.49% 5.44% 5.54% 5.48% 5.45% 5.43% 5.44% 5.43%
FTP Rate 3.66% 3.66% 3.66% 3.71% 3.72% 3.72% 3.73% 3.73% 3.70% 3.71% 3.71% 3.71%
Spread Rate 1.79% 1.84% 1.79% 1.78% 1.77% 1.71% 1.81% 1.76% 1.75% 1.72% 1.73% 1.72%
1.50%
2.00%
2.50%
3.00%
3.50%
4.00%
4.50%
5.00%
5.50%
6.00%
3,800,000
3,850,000
3,900,000
3,950,000
4,000,000
4,050,000
4,100,000
Jan Feb Mar Apr May Jun Jul Aug Sep Oct Nov Dec
Commercial Loans
Balances Yield FTP Rate Spread Rate

Portfolio Rollforward Analysis

Portfolio Rollforward Analysis

Budgeting and Forecasts
Pro
jecte
d N
et
Inte
rest
Inco
me
T i m e
Net Interest Margin Planning
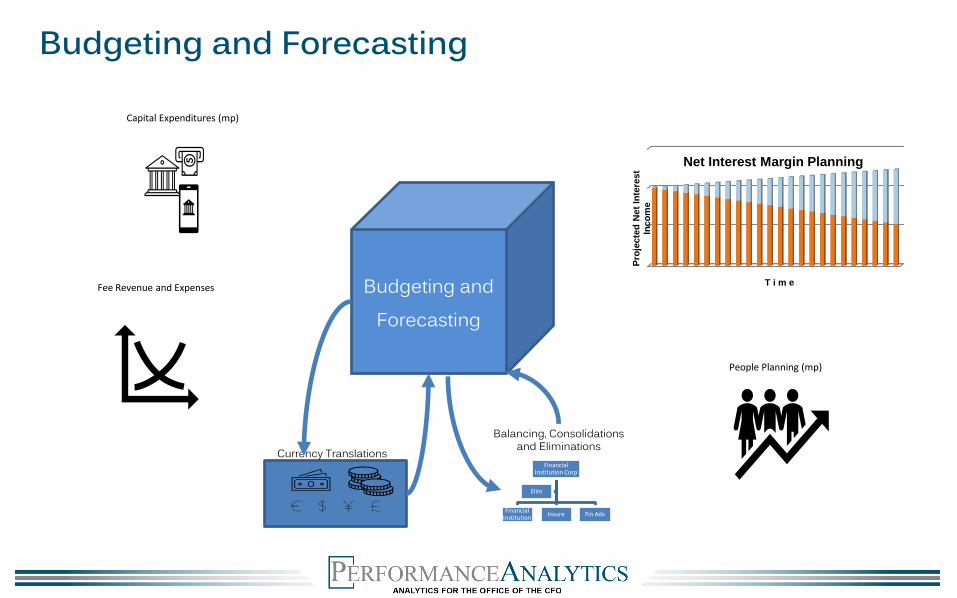
Budgeting and Forecasting
Capital Expenditures (mp)
Fee Revenue and Expenses
People Planning (mp)
Budgeting and Forecasting
Financial Institution Corp
Financial Institution
Insure Fin Adv
Elim
Balancing, Consolidations and EliminationsCurrency Translations

Pro
jec
ted
Ne
t In
tere
st
Inc
om
e
T i m e
Net Interest Margin Planning
Margin Planning
New Business Projections• May be entered as new volume
production or growth rates• New business also matures and
reprices
Existing Portfolio• Projections based on sub ledger
account detail calculations of projected balances, interest and FTP

Funding charge
New Volume Rate Modeling
New Volume FTP
New Volume Modeling
Existing Position
Combined Results
All Supported by Loan Detail
5.50%1.25%
Scenario Modeling
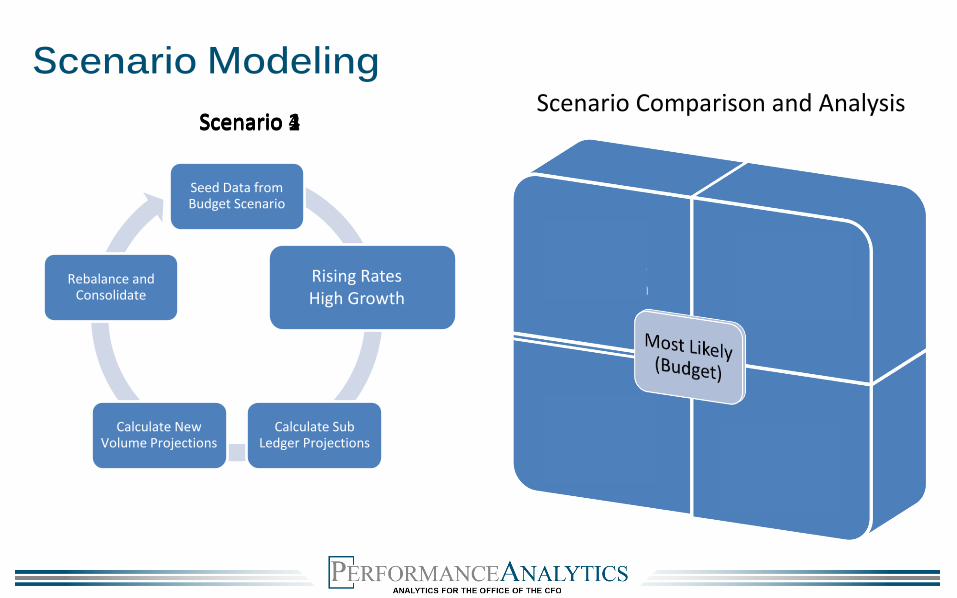
Scenario 2Scenario 3Scenario 4Scenario 1
Scenario Modeling
Seed Data from Budget Scenario
Low RateLow Growth
Calculate Sub Ledger Projections
Calculate New Volume Projections
Rebalance and Consolidate
Lower RateLow Growth
Rising RatesLow GrowthLower RatesHigh GrowthRising RatesHigh Growth
Scenario Comparison and Analysis

Scenario Comparative Analytics
12.00%
14.00%
16.00%
18.00%
20.00%
22.00%
24.00%
26.00%
Jan Feb Mar Apr May Jun Jul Aug Sep Oct Nov Dec Total
Return on Equity
Baseline Lower Rate/Low Growth Lower Rate/High Growth Rising Rate/Low Growth Rising Rate/High Growth
1.00%
1.20%
1.40%
1.60%
1.80%
2.00%
2.20%
2.40%
2.60%
Jan Feb Mar Apr May Jun Jul Aug Sep Oct Nov Dec Total
Return on Assets Scenario Analysis
Baseline Lower Rate/Low Growth Lower Rate/High Growth Rising Rate/Low Growth Rising Rate/High Growth
4.00%
4.10%
4.20%
4.30%
4.40%
4.50%
4.60%
4.70%
4.80%
4.90%
Jan Feb Mar Apr May Jun Jul Aug Sep Oct Nov Dec Total
Net Interest Margin Scenario Analysis
Baseline Lower Rate/Low Growth Lower Rate/High Growth Rising Rate/Low Growth Rising Rate/High Growth
45.00%
50.00%
55.00%
60.00%
65.00%
Jan Feb Mar Apr May Jun Jul Aug Sep Oct Nov Dec Total
Efficiency Ratio Scenario Analysis
Baseline Lower Rate/Low Growth Lower Rate/High Growth Rising Rate/Low Growth Rising Rate/High Growth
0
0
0
0
0
0
0
0
0
Jan Feb Mar Apr May Jun Jul Aug Sep Oct Nov Dec Total
Mil
lio
ns
Loan Growth Scenario Analysis
Baseline Lower Rate/Low Growth Lower Rate/High Growth Rising Rate/Low Growth Rising Rate/High Growth
0
0
0
0
0
0
0
Jan Feb Mar Apr May Jun Jul Aug Sep Oct Nov Dec Total
Mill
ions
Deposit Growth Scenario Analysis
Baseline Lower Rate/Low Growth Lower Rate/High Growth Rising Rate/Low Growth Rising Rate/High Growth

Profitability

OneBank Bancorp, Inc.
Organizational Profitability by Lines of BusinessResults from General Ledger
Commercial Banking Branch Deposit and Loans Consumer Credit Servicesamounts in thousands Balances Contribution Spread Balances Contribution Spread Balances Contribution Spread
Loans 6,888,372 636,181 9.24% 1,779,672 180,005 10.11% 6,369,247 559,783 8.79%
Allowance for Credit Losses 0.00% 0.00% 0.00%
Net Loans 6,888,372 636,181 9.24% 1,779,672 180,005 10.11% 6,369,247 559,783 8.79%
Other Assets 660,610 0.00% 760,441 0.00% 66,660 0.00%
Total Assets 7,548,982 636,181 8.43% 2,540,113 180,005 7.09% 6,435,907 559,783 8.70%
Deposits 2,060,859 (35,376) -1.72% 15,631,692 (618,001) -3.95% 54,766 - 0.00%
Other Liabilities 12,892 0.00% 142,753 0.00% 20,829 - 0.00%
Total Liabilities 2,073,751 (35,376) -1.71% 15,774,445 (618,001) -3.92% 75,595 - 0.00%
Capital - 0.00% - 0.00% - 0.00%
Total Liabilities and Capital 2,073,751 (35,376) -1.71% 15,774,445 (618,001) -3.92% 75,595 - 0.00%
Net Interest Income 600,805 (437,996) 559,783
Provision
Net Interest Income after Provision 600,805 (437,996) 559,783
Fee Revenue 53,473 126,592 115,454
Direct Expenses 74,802 287,532 41,265
Allocated Expenses
Total Non-Interest Expenses 74,802 287,532 41,265
Contribution before Tax 579,476 (598,936) 633,972
Allocated Income Tax
Net Contribution 579,476 (598,936) 633,972
OneBank Bancorp, Inc.
Organizational Profitability by Lines of BusinessAllocate Support and Operations Costs
Commercial Banking Branch Deposit and Loans Consumer Credit Servicesamounts in thousands Balances Contribution Spread Balances Contribution Spread Balances Contribution Spread
Loans 6,888,372 202,707 2.94% 1,779,672 70,607 3.97% 6,369,247 142,647 2.24%
Allowance for Credit Losses (127,326) 8,020 -6.30% (17,792) 1,132 -6.36% (109,698) 6,909 -6.30%
Net Loans 6,761,046 210,727 3.12% 1,761,880 71,739 4.07% 6,259,549 149,556 2.39%
Other Assets 660,610 (41,462) -6.28% 760,441 (47,871) -6.30% 66,660 (2,420) -3.63%
Total Assets 7,294,330 177,285 2.43% 2,504,529 25,000 1.00% 6,216,511 154,045 2.48%
Deposits 2,060,859 93,225 4.52% 15,631,692 362,966 2.32% 54,766 3,456 6.31%
Other Liabilities 12,892 813 6.31% 142,753 8,662 6.07% 20,829 1,314 6.31%
Total Liabilities 2,073,751 94,038 4.53% 15,774,445 371,628 2.36% 75,595 4,770 6.31%
Capital 0.00% 0.00% 0.00%
Total Liabilities and Capital 2,073,751 94,038 4.53% 15,774,445 371,628 2.36% 75,595 4,770 6.31%
Net Interest Income 271,323 396,628 158,815
Provision 15,300 11,016 64,944
Net Interest Income after Provision 256,023 385,612 93,871
Fee Revenue 53,473 126,592 115,454
Direct Expenses 74,802 287,532 41,265
Allocated Expenses 65,113 91,276 86,760
Total Non-Interest Expenses 139,915 378,808 128,025
Contribution before Tax 169,581 133,396 81,300
Allocated Income Tax
Net Contribution 169,581 133,396 81,300
OneBank Bancorp, Inc.
Organizational Profitability by Lines of BusinessCapital Allocation with Capital Charge after tax
Commercial Banking Branch Deposit and Loans Consumer Credit Servicesamounts in thousands Balances Contribution Spread Balances Contribution Spread Balances Contribution Spread
Loans 6,888,372 202,707 2.94% 1,779,672 70,607 3.97% 6,369,247 142,647 2.24%
Allowance for Credit Losses (127,326) 8,020 -6.30% (17,792) 1,132 -6.36% (109,698) 6,909 -6.30%
Net Loans 6,761,046 210,727 3.12% 1,761,880 71,739 4.07% 6,259,549 149,556 2.39%
Other Assets 660,610 (41,462) -6.28% 760,441 (47,871) -6.30% 66,660 (2,420) -3.63%
Total Assets 7,294,330 177,285 2.43% 2,504,529 25,000 1.00% 6,216,511 154,045 2.48%
Deposits 2,060,859 93,225 4.52% 15,631,692 362,966 2.32% 54,766 3,456 6.31%
Other Liabilities 12,892 813 6.31% 142,753 8,662 6.07% 20,829 1,314 6.31%
Total Liabilities 2,073,751 94,038 4.53% 15,774,445 371,628 2.36% 75,595 4,770 6.31%
Capital 588,312 37,050 6.30% 518,289 32,647 6.30% 445,468 28,071 6.30%
Total Liabilities and Capital 2,662,063 131,088 4.92% 16,292,734 404,275 2.48% 521,063 32,841 6.30%
Net Interest Income 308,373 429,275 186,886
Provision 15,300 11,016 64,944
Net Interest Income after Provision 293,073 418,259 121,942
Fee Revenue 53,473 126,592 115,454
Direct Expenses 74,802 287,532 41,265
Allocated Expenses 65,113 91,276 86,760
Total Non-Interest Expenses 139,915 378,808 128,025
Contribution before Tax 206,631 166,043 109,371
Allocated Income Tax 75,440 62,654 38,925
Net Contribution 131,191 103,389 70,446
Return on Capital
Capital Hurdle Rate Charge 76,481 67,378 57,911
Contribution net of Capital Charge 54,710 36,011 12,535
Return on Capital 22.30% 19.95% 15.81%

Implementation Overview
• Customized to Each Customer
• Scope
• Our Approach
• What you get
• Commitment

Win a Free Pass to Splash

For more information, please contact
Peter Digby
416-986-1999
Bob Markus
Mobile: 419-345-7504
Thank you!