Transformational Quality
120
©2013 THE ADVISORY BOARD COMPANY • ADVISORY.COM • 26143 Transformational Quality Leading the Organisation to Clinical Excellence International Clinical Operations Board
-
Upload
juan-ponce-de-leon -
Category
Documents
-
view
243 -
download
2
Transcript of Transformational Quality

©2013 THE ADVISORY BOARD COMPANY • ADVISORY.COM • 26143
Transformational Quality Leading the Organisation to Clinical Excellence
International Clinical Operations Board

©2013 THE ADVISORY BOARD COMPANY • ADVISORY.COM • 26143 2

©2013 THE ADVISORY BOARD COMPANY • ADVISORY.COM • 26143 3
Our Firm in Brief
3,100+ Serving an unparalleled membership of 3,100+ hospitals and health care organisations
RESEARCH AND INSIGHTS
• Dedicated to the most pressing issues and concerns in health care
• 300+ industry experts on call
• 200+ customisable forecasting and decision-support tools
Memberships Offering Strategic Guidance and Actionable Insights
PERFORMANCE TECHNOLOGIES
Global Peer Collaboratives Powered by Web-Based Analytic Platforms
• Millions of admissions flow through our technology platforms
• 1.1 million user sessions annually
• Key challenges addressed: surgical efficiency, supply costs, and emergency department efficiency
CONSULTING AND MANAGEMENT
Seasoned, Hands-On Support and Practice Management Services
• 1,800+ years of “operator” experience in hospital and doctor surgeries
• Principal practice areas: hospital-doctor alignment, care transformation, surgery department optimisation
• Range of engagements from strategy/diagnostic to best practice installation to interim management
TALENT DEVELOPMENT
Partnering to Drive Workforce Impact and Engagement
• Impacted the achievement of 69,000+ executives, doctors, clinical leaders, and managers
• 16,000+ outcomes-driven workshops tailored to partners’ specific needs
Survey Solutions
• Customised strategies for improving employee and doctor engagement
140,000+ health care leaders served
1,750+ Employing 1,750+ health care professionals
1,200+ Leading provider of performance technologies, now in 1,200+ hospitals
$500+ million in realised value per year
1,150+ engagements completed
5,000+ employee-led improvement projects

©2013 THE ADVISORY BOARD COMPANY • ADVISORY.COM • 26143
LEGAL CAVEAT
The Advisory Board Company has made efforts to verify the accuracy of the information it provides to members. This report relies on data obtained from many sources, however, and The Advisory Board Company cannot guarantee the accuracy of the information provided or any analysis based thereon. In addition, The Advisory Board Company is not in the business of giving legal, medical, accounting, or other professional advice, and its reports should not be construed as professional advice. In particular, members should not rely on any legal commentary in this report as a basis for action, or assume that any tactics described herein would be permitted by applicable law or appropriate for a given member’s situation. Members are advised to consult with appropriate professionals concerning legal, medical, tax, or accounting issues, before implementing any of these tactics. Neither The Advisory Board Company nor its officers, directors, trustees, employees and agents shall be liable for any claims, liabilities, or expenses relating to (a) any errors or omissions in this report, whether caused by The Advisory Board Company or any of its employees or agents, or sources or other third parties, (b) any recommendation or graded ranking by The Advisory Board Company, or (c) failure of member and its employees and agents to abide by the terms set forth herein.
The Advisory Board is a registered trademark of The Advisory Board Company in the United States and other countries. Members are not permitted to use this trademark, or any other Advisory Board trademark, product name, service name, trade name, and logo, without the prior written consent of The Advisory Board Company. All other trademarks, product names, service names, trade names, and logos used within these pages are the property of their respective holders. Use of other company trademarks, product names, service names, trade names and logos or images of the same does not necessarily constitute (a) an endorsement by such company of The Advisory Board Company and its products and services, or (b) an endorsement of the company or its products or services by The Advisory Board Company. The Advisory Board Company is not affiliated with any such company.
IMPORTANT: Please read the following.
The Advisory Board Company has prepared this report for the exclusive use of its members. Each member acknowledges and agrees that this report and the information contained herein (collectively, the “Report”) are confidential and proprietary to The Advisory Board Company. By accepting delivery of this Report, each member agrees to abide by the terms as stated herein, including the following:
1. The Advisory Board Company owns all right, title and interest in and to this Report. Except as stated herein, no right, license, permission or interest of any kind in this Report is intended to be given, transferred to or acquired by a member. Each member is authorized to use this Report only to the extent expressly authorized herein.
2. Each member shall not sell, license, or republish this Report. Each member shall not disseminate or permit the use of, and shall take reasonable precautions to prevent such dissemination or use of, this Report by (a) any of its employees and agents (except as stated below), or (b) any third party.
3. Each member may make this Report available solely to those of its employees and agents who (a) are registered for the workshop or membership program of which this Report is a part, (b) require access to this Report in order to learn from the information described herein, and (c) agree not to disclose this Report to other employees or agents or any third party. Each member shall use, and shall ensure that its employees and agents use, this Report for its internal use only. Each member may make a limited number of copies, solely as adequate for use by its employees and agents in accordance with the terms herein.
4. Each member shall not remove from this Report any confidential markings, copyright notices, and other similar indicia herein. 5. Each member is responsible for any breach of its obligations as stated herein by any of its employees or agents. 6. If a member is unwilling to abide by any of the foregoing obligations, then such member shall promptly return this Report and
all copies thereof to The Advisory Board Company.
4
Project Director
Keren Johnson
Contributing Consultants
Sam Barrett
Vidal Seegobin
William Tell
Hannah Winant
Joyce Yao
Design Consultant
Hillary Tisdale
Managing Director
Andrew Rosen
Clinical Operations Board

©2013 THE ADVISORY BOARD COMPANY • ADVISORY.COM • 26143
Table of Contents
Executive Summary . . . . . . . . . . . . . . . . . . . . . . . . . . . . . . . . . . . . . . . . . . . . . . . . . . . . . . . . . . .
Special Feature: Case Study Videos . . . . . . . . . . . . . . . . . . . . . . . . . . . . . . . . . . . . . . . . . . . . . .
Essay: The New Quality Mandate . . . . . . . . . . . . . . . . . . . . . . . . . . . . . . . . . . . . . . . . . . . . . . . .
I. Commit to Quality Transformation . . . . . . . . . . . . . . . . . . . . . . . . . . . . . . . . . . . . . . . . . . . Lesson 1: Articulate Specific, Aspirational Vision . . . . . . . . . . . . . . . . . . . . . . . . . . . . . . . . .
Lesson 2: Demonstrate Commitment to the Front Line . . . . . . . . . . . . . . . . . . . . . . . . . . . . .
Lesson 3: Enforce and Reinforce New Norms . . . . . . . . . . . . . . . . . . . . . . . . . . . . . . . . . . . .
II. Support Frontline Leadership . . . . . . . . . . . . . . . . . . . . . . . . . . . . . . . . . . . . . . . . . . . . . . . Lesson 4: Empower Front Lines to Improve Quality Systems . . . . . . . . . . . . . . . . . . . . . . . .
Lesson 5: Explicitly Define Doctor Champion Role . . . . . . . . . . . . . . . . . . . . . . . . . . . . . . . .
III. Embed a Culture of Measurement . . . . . . . . . . . . . . . . . . . . . . . . . . . . . . . . . . . . . . . . . . . . Lesson 6: Set Data Expectations . . . . . . . . . . . . . . . . . . . . . . . . . . . . . . . . . . . . . . . . . . . . . .
Lesson 7: Establish Comprehensive Clinical Data Infrastructure . . . . . . . . . . . . . . . . . . . . .
Lesson 8: Enable Principled Clinician Autonomy . . . . . . . . . . . . . . . . . . . . . . . . . . . . . . . . .
Lesson 9: Educate Clinicians in Data-Driven Quality Improvement . . . . . . . . . . . . . . . . . . .
Coda: Future Prospects—Expanding the Ambition . . . . . . . . . . . . . . . . . . . . . . . . . . . . . . . . .
Appendix . . . . . . . . . . . . . . . . . . . . . . . . . . . . . . . . . . . . . . . . . . . . . . . . . . . . . . . . . . . . . . . . . . . .
13
15
17
39
46
49
51
57
64
72
79
86
89
91
92
97
111

©2013 THE ADVISORY BOARD COMPANY • ADVISORY.COM • 26143 6
Strategies and Best Practices to Improve Care Quality Over the past several years, the Clinical Operations Board has developed numerous resources to assist members in improving quality. The most relevant of these resources are outlined on the right. All of these resources are available in unlimited quantities through the Clinical Operations Board membership.
Available Within Your Clinical Operations Board Membership
Building a Best-in-Class Quality Infrastructure Streamlining the Quality Function to Maximise QI Effectiveness • Evaluating organisation-level quality
architecture
• Minimising low-value quality department tasks
• Delivering excellence in high-value quality activities
The New Quality Compact Partnering with Physicians to Advance a New Performance Standard • Equipping medical staff leaders to support
individual physician performance improvement
• Ensuring a strong foundation for evidence-based practice
• Extending physician performance improvement across the care continuum
The Journey to Zero Innovative Strategies for Minimising Hospital-Acquired Infections • Assessing and elevating hygiene standards
• Adhering to safe and sterile medical techniques
• Minimising pathogen opportunity
• Automating and integrating hospital IT systems
Delivering on the Promise of Patient-Centered Care Designing Cancer Services to Support the Whole Patient • Surfacing psychosocial needs of cancer
patients and empowering them to act
• Improving cancer care team coordination
• Enhancing communication between clinicians and cancer patients
Improving Provider Communication and Patient Transitions Hospital-Based Best Practices • Ensuring interdisciplinary care
• Establishing handover infrastructure
• Reinvigorating case management processes
• Instilling patient and provider accountability
Mastering the Cardiovascular Care Continuum Strategies for Bridging Divides Among Providers and Across Time • Building the collaborative care infrastructure
• Deploying cooperative patient care
• Executing successful patient transitions
• Enhancing longitudinal patient care

©2013 THE ADVISORY BOARD COMPANY • ADVISORY.COM • 26143 7
Further Resources
HEALTH CARE EXECUTIVE BOARD
• Strategy and planning amid disruptive change
• Maximising value from clinical innovations
• Strengthening financial management
• Marketing to doctors and patients
• Increasing staff productivity and engagement
• Providing leadership for organisational performance
Strategy and Business Leadership for Enduring Success
Research and insights for chief executive officers and other senior executives to support their efforts to guide their organisations to sustainable excellence and prosperity.
Serving Chief Executives, Strategy and Business Leaders
GLOBAL eHEALTH EXECUTIVE COUNCIL
• Improving governance and management of IT
• Leveraging IT to improve care quality
• Achieving return on IT investments
• Engaging doctors in IT adoption
• Analysing vendors, applications, and industry trends
• Optimising business intelligence and executive data strategy
IT Strategy and Planning
Research and analysis to help hospital information technology (IT) departments effectively plan and implement key initiatives and achieve organisational strategic IT goals.
Serving Chief Executives and Chief Information Officers
CLINICAL OPERATIONS BOARD
• Improving clinical quality and patient safety
• Maximising capacity utilisation
• Partnering with clinicians • Ensuring efficient use of
resources • Cultivating clinical
leadership • Managing patients with
chronic disease
Transforming Care Quality and Efficiency
Best practice research to support senior clinical and operational leaders who work tirelessly to provide safe, effective, and efficient care for their communities.
Serving Senior Clinical and Operational Leaders
GLOBAL CENTRE FOR NURSING EXECUTIVES
• Achieving excellence in care quality and safety
• Improving the patient experience
• Recruiting and retaining high quality nurses
• Managing nursing diversity and culture
• Developing next-generation nursing leaders
• Enhancing nursing staff efficiency and productivity
Building the World Class Nursing Organisation
Research for an international network of nursing executives charged with leading the largest and most critical element of the health care workforce in a time of great challenges.
Serving Chief Nursing Executives and Their Senior Teams
CLINICAL INVESTMENT INSIGHTS
• Identifying strategic investment opportunities
• Optimising investment decisions
• Aligning clinician and executive priorities
• Minimising risk of capital investments
• Increasing efficiency in investment evaluation processes
• Creating insights into future disruptive innovations
Service Line Strategic Planning and Investment Guidance
On-demand service-line strategic guidance and customised technology investment advice to help leadership make sound investment decisions around challenging and complex clinical investment choices.
Serving Chief Executives and Senior Planning Leaders
Advisory Board International Membership Programs

©2013 THE ADVISORY BOARD COMPANY • ADVISORY.COM • 26143 8
With Special Thanks The Clinical Operations Board would like to express its deep gratitude to the individuals and organisations that shared their insights, analysis, and time with us. The research team would especially like to recognise the following individuals for being particularly generous with their time and expertise.
Advisors to Our Work
INTERMOUNTAIN HEALTHCARE Todd Allen Jay Bishoff Bob Dyer Brent James Don Lappe Christian Neff Colleen Roberts Matt Weed Chris Wood
JOHNS HOPKINS MEDICINE Renee Demski Paula Kent Redonda Miller Lori Paine Peter Pronovost ROTTERDAM EYE HOSPITAL Fred Bleeker Onne Creten Frans Hiddema Dirk de Korne Tristan Lambert Jeroen van Rooij Desiree Vester
SENTARA HEALTHCARE Gene Burke Paul Chidester Sarah Darwin Terri Edwards Genemarie McGee Scott Miller Deborah Roberson Carol Sale

©2013 THE ADVISORY BOARD COMPANY • ADVISORY.COM • 26143 9
Advisors to Our Work With Sincere Appreciation
AUSTRALIA Alfred Hospital Mark Fitzgerald Austin Health John Ferguson Cabrini Health Sue O'Neill Michael Walsh Simon Woods Cairns and Hinterland Health Service District Julie Hartley-Jones Canberra Hospital and Health Services Lee Martin Centre for Healthcare Improvement Jan Phillips Clinical Excellence Commission Peter Kennedy Epworth HealthCare Vincent Borg Alan Kinkade Maureen Wilson
Gold Coast Health Service District Naomi Dwyer Adrian Nowitzke Logan Hospital Gail Gordon Mater Misericordiae Health Services Julie Hudson Melbourne Health Peter Bradford Felicity Topp Mercy Health Stephen Cornelissen Metro North Health Services District Keith McNeil NSW Health Gavin Meredith Prince Charles Hospital Stephen Ayre Queensland Health Jason Currie
Royal Adelaide Hospital Philip Hoyle Royal Prince Alfred Hospital Ken Cahill Phillip Harris South Australia Health Paddy Phillips David Swan Southern Health Shelly Park St John of God Health Care Kate Birrell Lachlan Henderson St Vincent's & Mater Health Jonathan Anderson Brett Gardiner Sydney Adventist Hospital Leon Clark Western Health Kathryn Cook Western NSW Local Health District Ron Dunham
BELGIUM Algemeen Ziekenhuis Turnhout Jo Leyson Centre Hospitalier Inter-Regional Edith Cavell Jacques de Toeuf Cliniques Universitaires de Mont-Godinne Patrick de Coster Federaal Kenniscentrum voor de Gezondheidszorg Raf Mertens Grand Hopital de Charleroi Manfredi Ventura Jessa Hospital Frank Weekers Universitair Ziekenhuis Antwerpen Nicole Delmotte Universitair Ziekenhuis Gent Francis Colardyn Renaat Peleman

©2013 THE ADVISORY BOARD COMPANY • ADVISORY.COM • 26143 10
Advisors to Our Work
CANADA Trillium Health Centre Patti Cochrane Vancouver Costal Health David Ostrow COLOMBIA University Hospital of San Ignacio Julio Cesar Castellanos Ramírez DENMARK Region Midtjylland Steen Frieberg Nielsen World Health Organization Valentina Hafner FINLAND Hospital District of Helsinki and Uusimaa Lasse Lehtonen GERMANY Universitaetsklinikum Tuebingen Jens Maschmann
MALAYSIA Sime Darby Medical Centre Vasuhi Murugiah MEXICO The American British Cowdray Medical Center Yadira Hernández Chible Reyna Yacaman NETHERLANDS Atrium Medisch Centrum Hans Kerkkamp Maasstad Ziekenhuis Marc van Aart Sint Antonius Ziekenhuis Dirk Schraven StreekZiekenhuis Konigin Beatrix Bert Bartelink Nelleke van der Weerd Universitair Medisch Centrum Utrecht Jan Kimpen Jos Kuilboer
NEW ZEALAND Auckland District Health Board Greg Balla Ian Olan Canterbury District Hospital Board Nigel Millar Counties Manukau District Health Board Geraint Martin Otago District Health Board Vivian Blake Southern District Health Board Sonja Dillon Lexie O'Shea NORWAY Sykehuset Asker og Baerum Ole Tjomsland SINGAPORE Agency for Integrated Care Huey Pang Ling
SPAIN Clinica Universidad de Navarra Nicolas Garcia Gonzalez Cristina Gordo Luis Hospital Clinic de Barcelona Juan Bigorra Josep Pique Josep Roca Santa Creu I Sant Pau Josep Manel Picas Vidal SWEDEN Joenkoeping County Council and Qulturum Goran Henriks Linkoeping University Hospital Hans Rutberg

©2013 THE ADVISORY BOARD COMPANY • ADVISORY.COM • 26143 11
Advisors to Our Work
SWITZERLAND Centre Hospitalier Universitaire Vaudois Anne-Claude Griesser GZO Spital Wetzikon Andreas Gattiker Hopitaux Universitaire de Geneve Marie-Jose Roulin Universitaetsspital Basel Werner Kuebler Zuger Kantonsspital Matthias Winistoerfer UNITED KINGDOM Chelsea and Westminster NHS Trust Mike Anderson City Hospitals Sunderland NHS Trust Les Boobis Mark Smith Guy’s and St. Thomas' NHS Foundation Trust Ian Abbs
Hull and East Yorkshire NHS Trust Yvette Oade Imperial College London Charles Vincent The King's Fund Dennis Kodner Liverpool Heart and Chest NHS Mark Jackson Luton & Dunstable Hospital Elaine Hide John Pickles Stephen Ramsden Northumbria Healthcare NHS Trust Ann Farrar NHS Institute for Innovation Sarbjit Purewal NHS Tayside Carol Goodman Karen Gray Maureen Lafferty Carrie Marr Gerry Marr Eileen McKenna Angie Millar Pat O’Connor Gordon Thomson Vicky Tully Tracey Williams
Ramsay Health Sheila Peskett Scottish Health Executive Department Harriet Hunter Susan Bishop University of Leicester Mary Dixon-Woods University Hospital of South Manchester NHS Foundation Trust Michael Connolly UNITED STATES Baylor Health Care System David Ballard Donald Kennerly Beth Israel Deaconess Medical Center Julius Yang RAND Corporation Peter Mendel Yale University Leslie Curry

©2013 THE ADVISORY BOARD COMPANY • ADVISORY.COM • 26143 12

©2013 THE ADVISORY BOARD COMPANY • ADVISORY.COM • 26143
Executive Summary
13
The New Quality Mandate Hospitals today are pressed to demonstrate their quality of care as never before, amid increasing transparency, focus on achieving and maintaining accreditation, and public and payer pressure to deliver on the highest quality standards. At the same time, an increasingly complex patient population makes it more and more difficult to provide safe care and superior outcomes.
The quality mandate is clear, yet the complexity of health care prevents most organisations from making meaningful, long-term improvements. A tactical approach to improving quality by using protocols, training, technologies, and measurement is no guarantee of sustained high performance.
The Path to Exceptional Performance However, some hospitals have achieved and sustained outsized gains in quality by instilling a culture of quality improvement in their organisations. These successful organisations followed a similar path to exceptional performance. In Transformational Quality, the Clinical Operations Board has outlined the steps taken by select case study organisations to achieve and sustain quality excellence.
Key Lessons for Leading the Organisation to Clinical Excellence Hospital Leaders Must Commit to Quality Transformation Although all hospital leaders view quality as important, few centre every strategic and operational effort of their organisation around quality. Leaders at the most successful hospitals articulate a measurable and aspirational vision for quality, visibly commit substantial time and resources to quality improvement, and steadfastly confront resistance and reinforce the organisation’s quality commitment.
The Front Line Must Be Supported to Lead Quality Improvement Efforts The complexity of health care makes it impossible for hospital leaders to manage improvement alone. Instead, frontline staff must be empowered to lead quality improvement. While the details of the support will vary for different professional groups, all engagement strategies must ensure that staff have the time, the training, and a clear mandate to lead improvements.
Measurement Must Underpin the Quality Improvement Culture Sustainable quality improvement is inseparable from data and measurement. Given many clinicians’ long-standing resistance to data on quality performance, hospital leaders must set the expectation that quality improvement will be data-driven. That expectation must be reinforced by investment in a data infrastructure that can support quality improvement, as well as clinician education.
Questions? To obtain more information about this research, or for any other questions regarding the
Clinical Operations Board, please do not hesitate to contact us at any time at [email protected].

©2013 THE ADVISORY BOARD COMPANY • ADVISORY.COM • 26143 14

©2013 THE ADVISORY BOARD COMPANY • ADVISORY.COM • 26143 15
Special Feature: Case Study Videos
How to Access the Videos
As part of this study, the Clinical Operations Board research team conducted a number of visits to organisations with exceptional quality performance. The team, accompanied by a video crew, completed hours of in-depth interviews with staff at every level of each organisation to understand what was behind their quality success. These video interviews provide insight into the organisational culture, leadership mind-sets, and front line attitudes that have driven the success of these organisations, as executives and staff tell the story of their transformational quality journeys in their own words.
Throughout this publication, graphics like the box here indicate when a related video interview is available on advisory.com. To access the embedded video, you may type the attached link into a web browser or scan the QR code using a smartphone or tablet.
About the Case Study Videos
Access the complete archive of case study videos here: advisory.com/ cob/Transformational-Quality

©2013 THE ADVISORY BOARD COMPANY • ADVISORY.COM • 26143 16

©2013 THE ADVISORY BOARD COMPANY • ADVISORY.COM • 26143 17
The New Quality Mandate
Essay

©2013 THE ADVISORY BOARD COMPANY • ADVISORY.COM • 26143
354
35 4
IHI Global Trigger Tool AHRQ Patient Safety Indicators
Hospital Voluntary Reporting System
18
Hospital Adverse Events Even More Frequent Than Previously Reported
Prevalence of Adverse Events1
Quality is more important to hospitals’ strategic agenda than ever before.
Consensus is growing globally that there are both significant quality issues in all hospitals and real potential to improve quality. As evidence for what constitutes best practice care proliferates, hospital leaders must ensure that these practices are consistently applied.
At the same time, the ability to measure poor adherence to evidence is also improving. It is now possible to prove that quality failings are more severe than previously documented.
For example, the IHI Global Trigger Tool, which uses triggers or clues in patient records to estimate the frequency of adverse events, suggests that the real incidence of adverse events may be as much as 100 times greater than that detected by a well-established voluntary incident reporting system.
For hospital leaders, the lesson is clear: as transparency increases and measurement techniques continue to improve, hospital performance will appear worse, even if delivery of care does not change.
Imperative to Improve
Increasing Understanding of Quality Performance
Source: Classen D, Resar R, et al., “’Global Trigger Tool’ Shows That Adverse Events In Hospitals May Be Ten Times Greater Than Previously Measured,” Health Affairs, 2011 30(4): 581-589; Special Eurobarometer 327, “Patient Safety and Quality of Healthcare,” 2010; Advisory Board interviews and analysis.
1) Researchers reviewed 795 patient records across 3 hospitals using 3 different event detection methodologies.
Quality Worse Than Expected
“Our study detected far more adverse events in hospitalised patients than have been found in prior studies… Our detection levels were also higher than those of comparative studies of adverse events with other methods in hospitalised patients from England, Australia, and Canada.”
Classen, et al. Health Affairs
Global Trigger Tool detected significantly higher incidence of adverse events than commonly used systems

©2013 THE ADVISORY BOARD COMPANY • ADVISORY.COM • 26143 19
Media Relentlessly Covers High-Profile Incidents Beyond the clinical and moral concerns with poor quality, hospital leaders should also anticipate media attention as a consequence of increasing transparency around quality failings.
Headlines around the world increasingly proclaim hospital errors and wrongdoing. Although these incidents account for a tiny proportion of total care episodes, they serve to focus public attention on hospital failings. In the public eye, these events impact the reputation of all hospitals.
Transparency Increasing
Incessant Negative Publicity Around Quality
Source: Advisory Board interviews and analysis.
“Technician charged in fatal injection with cleaning solution”
Seattle Times
“Routine operation ends with death of mother of four”
ABC News
“Nearly 2,000 Carrying H.I.V. in Chile Were Not Notified”
New York Times
“Hospital mistakes killed 28 people in Victoria this year”
The Telegraph
“Mother left paralysed from waist down after injection with powerful skin antiseptic instead of saline solution during epidural”
Sydney Morning Herald
“Man has unnecessary cancer surgery after misdiagnosis”
New Zealand Herald
“Hospital left patient sobbing and humiliated”
BBC
“Hospital boss tried to cover up details of patient’s death”
The Daily Mail
“NHS patients discharged from hospital alone in the middle of night”
Huffington Post UK
“Bacteria kills newborns in German hospital”
Euronews
“Boston hospital admits drug overdose caused death of Globe columnist, damage to second woman”
Boston Globe
©2013 THE ADVISORY BOARD COMPANY • ADVISORY.COM • 26143 20
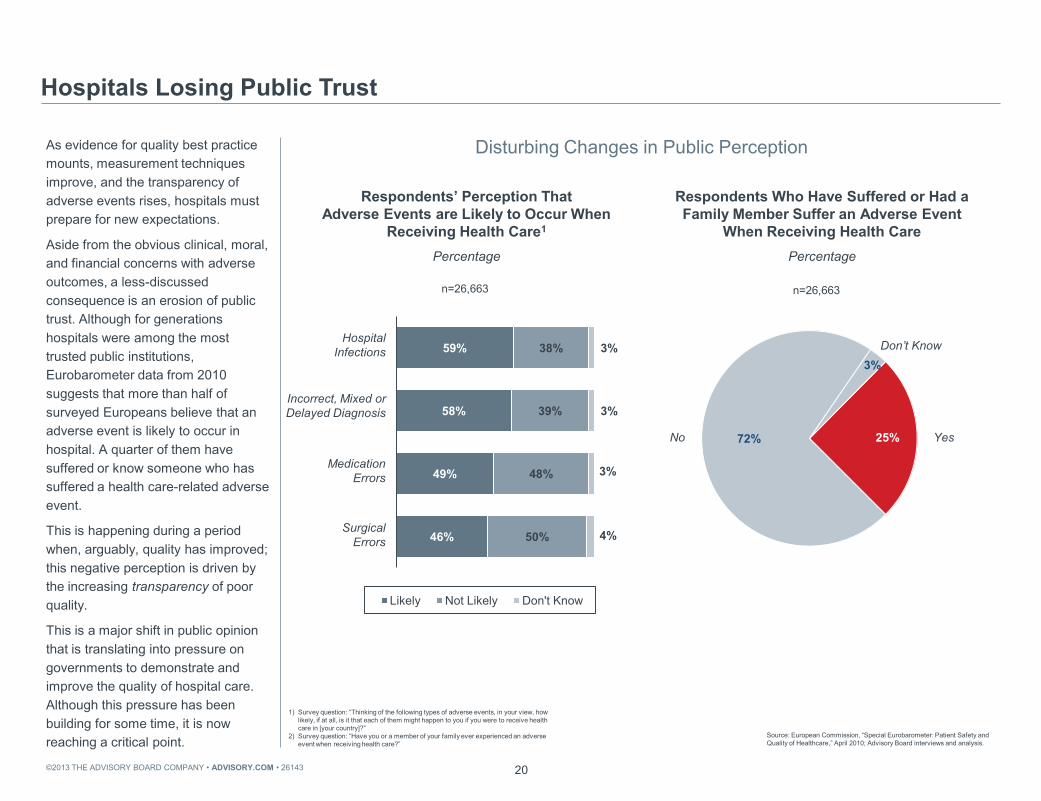
Disturbing Changes in Public Perception
Respondents’ Perception That Adverse Events are Likely to Occur When
Receiving Health Care1 Percentage
As evidence for quality best practice mounts, measurement techniques improve, and the transparency of adverse events rises, hospitals must prepare for new expectations.
Aside from the obvious clinical, moral, and financial concerns with adverse outcomes, a less-discussed consequence is an erosion of public trust. Although for generations hospitals were among the most trusted public institutions, Eurobarometer data from 2010 suggests that more than half of surveyed Europeans believe that an adverse event is likely to occur in hospital. A quarter of them have suffered or know someone who has suffered a health care-related adverse event.
This is happening during a period when, arguably, quality has improved; this negative perception is driven by the increasing transparency of poor quality.
This is a major shift in public opinion that is translating into pressure on governments to demonstrate and improve the quality of hospital care. Although this pressure has been building for some time, it is now reaching a critical point.
Hospitals Losing Public Trust
Source: European Commission, “Special Eurobarometer: Patient Safety and Quality of Healthcare,” April 2010; Advisory Board interviews and analysis.
1) Survey question: “Thinking of the following types of adverse events, in your view, how likely, if at all, is it that each of them might happen to you if you were to receive health care in [your country]?”
2) Survey question: “Have you or a member of your family ever experienced an adverse event when receiving health care?”
Respondents Who Have Suffered or Had a Family Member Suffer an Adverse Event
When Receiving Health Care Percentage
46%
49%
58%
59%
50%
48%
39%
38%
4%
3%
3%
3%
Likely Not Likely Don't Know
Medication Errors
Surgical Errors
Hospital Infections
n=26,663
Incorrect, Mixed or Delayed Diagnosis
25% 72%
3%
No Yes
Don’t Know
n=26,663

©2013 THE ADVISORY BOARD COMPANY • ADVISORY.COM • 26143 21
Limited Consensus on Quality Definition in the Literature Despite the increasing focus on hospital quality performance, there is no global consensus on a definition for “quality.” The literature contains a multitude of different definitions, a small selection of which are shown here. Some definitions focus on the attributes of care, others on the impact of care on quality of life, and still others on the patient experience.
Yet this lack of consensus is not preventing attempts to measure hospital quality performance.
What Is “Quality”?
Source: Institute of Medicine of the National Academies, “Crossing the Quality Chasm: The IOM Health Care Quality Initiative,” 2011; American Medical Association, 1986; World Health Organisation, 2000; Donabedien A, 1980; American College of Medical Quality, 2011; NHS, “High Quality Care for All: NHS Next Stage Review Final Report,” 2011; Australian Institute of Health and Welfare, "Definitions of Safety and Quality of Health Care,"; Gemeinsamer Bundesausschuss, “Was ist Qualität und wie wird sie gemessen?"; Advisory Board interviews and analysis.
“The degree to which health services increase the likelihood of desired health outcomes and are consistent with current professional knowledge.”
Institute of Medicine
“At a broad level, quality reflects the extent to which a health care service or product produces a desired outcome. At a more detailed level…quality [is] a guiding principle in assessing how well the health system is performing in its mission to improve the health of Australians.”
Australian Institute of Health and Welfare
“Clinically effective, personal and safe.”
High Quality Care for All: NHS Next Stage Review Final Report
“[That] which consistently contributes to improvement or maintenance of the quality and/or duration of life.”
American Medical Association
“Quality of care is the level of attainment of health systems' intrinsic goals for health improvement and responsiveness to legitimate expectations of the population.”
World Health Organisation
“Health care should be safe, effective, patient-centered, timely, efficient and equitable.”
Quality Chasm Report, Institute of Medicine
“That kind of care which is expected to maximize an inclusive measure of patient welfare, after one has taken account of the balance of expected gains and losses that attend the process of care in all its parts.“
Avedis Donabedien
“When there is an almost perfect overlap between expectations and results…the three dimensions of quality are structure, process and outcomes.”
German Federal Joint Committee

©2013 THE ADVISORY BOARD COMPANY • ADVISORY.COM • 26143
Sweden: 134 National
Healthcare Quality Registries
Denmark: 40 National Indicator
Project
Switzerland: 30
Federal Office of Public Health
22
As a result of mounting public pressure and academic evidence, governments and health care payers around the world are increasingly attempting to define quality and measure hospital performance against these indicators.
This graphic presents a selection of the numerous quality indicator projects under way around the world at time of writing. Each project aims to determine exactly how quality can be defined and measured.
Whether or not there is agreement as to the efficacy of these measures, hospitals will still be held to account for their performance against these metrics and so must take action to improve.
Result: Quality Rising Up National Agendas
Worldwide Attempts to Measure, Manage Quality
Source: Copnell B, et al., “Measuring the Quality of Hospital Care: An Inventory of Indicators,” Centre of Research Excellence in Patient Safety, Department of Epidemiology and Preventive Medicine, Monash University; EUNetpas, “Patient Safety Culture Report Focusing on Indicators,” 2010; EUPHORIC Project, “Disease Areas and Indicators,” 2010; Sektorenübergreifende Qualität im Gesundheitswesen, “Dokumentationsbögen und Ausfüllhinweise 2011,”; Schweizerische Eidgenossenschaft Bundesamt für Gesundheit, “Qualitätsindikatoren in Schweizer Akutspitälern wurden erneut erhoben,“ 20 Aug 2010; Swedish National Healthcare Quality Registries, “Öppna jämförelserav hälso- och sjukvårdenskvalitet och effektivitet,” 2010; Advisory Board interviews and analysis.
For common quality indicators and examples by country, please see appendix p. 112-113
Canada: 16 Institute of Health
Performance
US: 44 Centers for
Medicaid and Medicare Services
Safety Improvement for Patients in
Europe: 26
EUPHORIC Project: 54
Germany: 34 Cross-Sector
Quality in Health Care
EUNetpas: 343
Selected Quality Metrics Measured by National and International Bodies
Australia: 17 National Health Performance
Authority Hospital Indicators
Netherlands: 26Performance
Indicators on Patient Safety and
Effectiveness
UK: 150
National Institute for Health and
Clinical Excellence (NICE) Standards
World Health Organisation: 25
Performance Assessment Tool for
QI in Hospitals

©2013 THE ADVISORY BOARD COMPANY • ADVISORY.COM • 26143 23
League Table Prevalence Increasing
Sample Hospital Comparison Chart
Public comparisons of hospital performance are already widespread in some countries, and hospitals globally must anticipate this trend. Comparison charts, like the one shown here, will likely be a part of every organisation’s future.
But why are governments focusing on definition and measurement? The experience in some countries suggests that reporting of outcomes is only a milestone along the road to financial incentives for quality performance. In a number of countries, public reporting has been quickly followed by financial penalties and rewards for hospitals—and there is a strong possibility that these incentives will spread globally. Recent evidence that suggests a positive effect on mortality from pay-for-performance programs may hasten their implementation.
Ultimately, it is likely that hospitals will increasingly be penalised for poor quality, financially and through the shortened careers of their leadership.
Transparency New Way of Life
Source: Advisory Board interviews and analysis.
1) Pseudonyms.
Below Average Performance
Hospital Name1 Mortality Rate Average A&E Wait Time
Emergency Readmission Rate C.difficile Rate
Boshier Hospital
Drexler Health Care
Lindner Clinic
Strider Hospital
Thiebaud Medical Centre
Exceptional Performance
Satisfactory Performance
Unacceptable Performance

©2013 THE ADVISORY BOARD COMPANY • ADVISORY.COM • 26143 24
Hospital Performance Trails Best Demonstrated Practice
Already Struggling to Make the Grade
If full-scale measurement of quality performance started tomorrow, hospitals should expect to perform poorly on key indicators.
This graph illustrates data from a range of guideline compliance studies from various countries. Despite the differences in geography and guidelines measured, these studies show a remarkable similarity in compliance rates; around 60%. Although performance in individual hospitals can vary significantly from that figure, the data seem to suggest that this is the typical level of adherence to evidence-based practice. Yet these are exactly the kinds of metrics that payers and regulators are asking hospitals to improve.
Quality is a complex issue, and the definition of quality is constantly changing. However, increasing transparency means that, even if patients are actually safer, perceptions of hospital quality may still deteriorate.
Source: Masud D, et al., “Current Practice on Preoperative Correct Site Surgical Marking,” Journal of Perioperative Practice, June 2010; Jebrak G, “COPD Routine Management in France: Are Guidelines Used in Clinical Practice?” Revue des Maladies Respiratoires, 2010; Hakonsen GD, et al., “Adherence to Medication Guideline Criteria in Cancer Pain Management,” Journal of Pain Symptom Management, June 2009; Pestana D, et al., “Compliance with a Sepsis Bundle and Its Effect on Intensive Care Unit Mortality in Surgical Septic Shock Patients,” Journal of Trauma, Nov 2010; Alak A, et al., “Variations in the Management of Pneumonia in Pediatric Emergency Departments: Compliance with the Guidelines,” Canadian Journal of Emergency Medicine, Nov 2010; Chopard P, et al., “Swiss Results from a Global Observational Study of Venous Thromboembolism Risk and Prophylaxis Use in the Acute Care Hospital Setting: Analysis from the ENDORSE Study,” Swiss Medical Weekly, 2009; The Patient Safety Company, “One in Twenty Deaths in Dutch Hospitals Could Be Prevented”; “Surveillance of Healthcare Associated Infections,” Australian Commission on Safety and Quality in Healthcare; Roberts S, “Implementing and Sustaining a Hand Hygiene Culture Change Programme at Auckland District Health Board,” NZMJ, May 2012; Advisory Board interviews and analysis.
Selected Recent Studies of Guideline Compliance at Hospitals
1) Chronic obstructive pulmonary disease. 2) Venous Thromboembolism.
61%
50%
65% 61% 60% 59% 59%
Hand Hygiene COPD Cancer Pain VTE Prophylaxis
Sepsis Pneumonia Correct Site Surgical Marking
New Zealand
France
Norway Switzerland Spain Canada England
1 2

©2013 THE ADVISORY BOARD COMPANY • ADVISORY.COM • 26143 25
More Complex Patient Population Increasing Risk
Global Population Age 60 Years or Over
Future Threat: Demand
Patients Older, Sicker
Heart Failure Prevalence in Europe
Transparency is not the only trend forcing hospitals to redouble their focus on quality.
Although the ageing population and rising prevalence of chronic disease is widely known, the impact of this demographic shift cannot be underestimated: it is likely that it will make the delivery of high-quality, safe care more complex.
Source: UN Department of Economic and Social Affairs, “World Population Ageing 2009”; Ekinci O, “Getting to the Heart of Things,” 20 August 2010, European Hospital; Advisory Board interviews and analysis.
200M
2,000M
1950 2011 2050
14M
30M
2011 2020 (e)

©2013 THE ADVISORY BOARD COMPANY • ADVISORY.COM • 26143 26
Proportion of Clinical Operational Board Members Regarding Publication of Quality Metrics as Key Marketing/Public Relations Strategy1
Not All Bad News
Quality a Means of Competitive Differentiation
n=210 hospital clinicians and managers
Recognising the Competitive Landscape “It’s no longer sufficient in hospital management just to get the financials right, it’s just as important to take care of the quality and safety issues. In terms of customer satisfaction, we have an increasingly discerning patient group, who don’t just see it as a privilege for them to be allowed to come to us. We also have competitors, and our commitment is thus very much to put that patient experience into the foreground and into the front of mind… The whole world is moving towards more discerning and higher expectations from patients and their relatives.”
The pursuit of high-quality care is an end in its own right, but also offers other benefits.
In the course of this research, many hospitals in competitive environments indicated that quality was an important part of their marketing and public relations strategy. Demonstrably high-quality care is not only a compelling strategy to attract more (and more profitable) patients; high performance on publicly available quality metrics is also increasingly expected by patients.
Even for hospitals not operating in competitive markets, a reputation for high quality can offer a measure of protection in a highly charged policy environment.
Source: 2012 Clinical Operations Board Survey on Quality in United Kingdom, Australia, and New Zealand; Advisory Board interviews and analysis.
1) Survey question: “Is publicising the quality of care of your organisation among your top three marketing/public relations strategies?”
74%
”
Chief Medical Officer Australian Private Hospital

©2013 THE ADVISORY BOARD COMPANY • ADVISORY.COM • 26143 27
New Joint Commission International Accreditations Worldwide
Accreditation One Avenue to Prove Quality
The competitive advantage of proving high-quality care is also reflected in the growing number of organisations striving for accreditation through Joint Commission International (JCI) and other bodies.
Organisations pursuing such accreditations feel that they offer a competitive advantage and provide assurance to potential patients and stakeholders.
Source: Joint Commission International; Advisory Board interviews and analysis.
3 4
18
4 5
26
42
57
68 68
80
92
101
0
60
120
2000 2001 2002 2003 2004 2005 2006 2007 2008 2009 2010 2011 2012

©2013 THE ADVISORY BOARD COMPANY • ADVISORY.COM • 26143
Improving quality offers internal operational and strategic advantages. The Advisory Board’s survey division recently polled doctors from a variety of organisations to uncover factors driving engagement. Regression analyses suggested that three of the five strongest factors correlating to medical staff engagement are directly related to the quality of care that the organisation delivers.
These data suggest that working on quality is a critical factor in achieving the medical staff engagement that will be vital to overcoming the efficiency, cost reduction, quality, and care coordination challenges that hospitals face.
Summary
Hospitals are facing increasing public and payer pressure to demonstrate good quality performance. At the same time, consistent, high-quality performance is becoming harder to deliver for a more challenging patient population. And there are substantial gains to be made by improving quality: a competitive advantage, as well as greater engagement from doctors.
28
Doctor Engagement Essential for Multiple Hospital Initiatives
Top Five Drivers of Doctor Engagement
Pursuit of Quality Engages Medical Staff
n=3,610, r2=0.699
Source: The Advisory Board Company Survey Solutions, Physician Engagement Initiative, 2011; Advisory Board interviews and analysis.
Driver Beta
I would recommend this organisation to a friend or relative to receive care
0.209
The actions of this organisation’s executive team reflect the goals and priorities of participating clinicians
0.192
I am interested in doctor leadership opportunities at this organisation 0.174
The organisation supports the economic growth and success of my individual practice
0.147
The organisation provides excellent clinical care to patients 0.110
Three of top five engagement drivers have quality component

©2013 THE ADVISORY BOARD COMPANY • ADVISORY.COM • 26143 29
Hospitals Can’t Buy Quality Care
Confronting the Quality Challenge
No Magic Bullet
Case in Brief: Cedars Sinai Hospital • 746-bed tertiary hospital in Los Angeles, California
• Launched $34 million2 CPOE system in autumn 2002
• Doctor opposition prompted return to paper system three months later
Two critical questions remain: Why, despite long-standing efforts to improve quality, have most hospitals not seen sufficient improvement? And what is the path forward for hospitals?
The remainder of this study will address these questions, beginning with three stories that exemplify the critical obstacles to improvement uncovered during the research. The first: quality cannot simply be improved by investing additional resources.
Cedars Sinai, a large academic medical centre in Los Angeles, implemented a system-wide computerised physician order entry (CPOE) system to improve safety and quality. In what has become a classic cautionary tale in health care IT, their US$34 million investment was scrapped after three months when doctors rebelled and refused to use the system. Doctors claimed that it added hours to their workload, flooded them with unnecessary alerts, and further that they had not been consulted in the development nor properly trained.
Investing in quality improvement is not sufficient: buy-in and leadership from clinicians are essential.
Source; Connolly C, "Cedars-Sinai Doctors Cling to Pen and Paper," Washington Post, 21 March 2005; Smelcer J, Miller-Jacobs H, Kantrovich L, "Usability of Electronic Medical Records," Journal of Usability Studies, February 2009 vol. 4 (2): 70-84; Advisory Board interviews and analysis.
1) Computerised physician order entry. 2) USD.
Limited Efforts to Engage Doctors
Erosion of Medical Staff Trust Doctors Revolt
• CEO and board rely exclusively on CMO to choosing CPOE1 system
• Medical staff already alienated over cost control targets
• Hospital leaders slow to respond to complaints about system
• Doctors revolt and take opposition to the press
• CPOE1 rollout with two-month implementation time frame, limited support
• System requires additional doctor time, does not allow for deviation from protocols

©2013 THE ADVISORY BOARD COMPANY • ADVISORY.COM • 26143 30
Heroic Efforts on Hand Hygiene Compliance
Hand Hygiene Australia: Five Moments Campaign
Individual Interventions Successful…
Hand Hygiene Compliance New South Wales, Australia
The second obstacle to overcome is a campaign mentality. Quality improvement requires continuous investment of effort.
Many hospitals approach quality and safety improvements through large campaigns. In Australia, as in many countries, there has been a significant focus on hand hygiene.
To take one example, the state of New South Wales has initiated numerous state-wide campaigns. Both the NSW Department of Health and individual hospitals have invested considerable resources in monitoring compliance and educating staff.
The results of this investment have been impressive: state-wide hand hygiene compliance has increased by nearly 30% in the last few years.
Source: McLaws M, et al., “Improvements in Hand Hygiene Across New South Wales Public Hospitals: Clean Hands Save Lives, Part III,” Medical Journal of Australia, 2009, Hand Hygiene Australia, “5 Moments for Hand Hygiene”; NSW Health, “Media Release: Clean Hands Saves Lives,” 28 April 2011; Advisory Board interviews and analysis.
Elements
• Sustained leadership attention
• Repeated education initiatives
• Compliance monitoring and enforcement
58% 61%
69%
75%
2008 2009 2010 Q1 2011
IMA
GE
CR
ED
IT: H
AN
D H
YGIE
NE
AU
STR
ALI
A.
*Based on the “My 5 moments for hand hygiene, URL: http://www.who.int/gpsc/5may/background/ 5moments/en/index.html © World Health Organisation 2009. All rights reserved.”

©2013 THE ADVISORY BOARD COMPANY • ADVISORY.COM • 26143
3.77
2.38 2.42 2.16
2.29
1.00
0.68 0.83
2008 2009 2010 2011
MRSA1 infections per 1,000 ICU bed days
ICU associated CLABSI2 per 1,000 central line days
31
Hand Hygiene Critical but Not Alone Sufficient to Avoid Infections
Selected Infection Rates New South Wales, Australia
…Not Enough to Achieve High Quality
Despite this excellent progress, the problem of infection control still remains.
This graph shows MRSA and central line–associated bloodstream infection rates in the ICU over the same time period. Some improvements are evident, but the gap to best practice is still substantial. A number of Australian CEOs have suggested that despite better hand-washing compliance they not have seen improvements in outcomes.
A campaign around one single challenge is not enough to defeat a complex issue such as infection control. Improvements made through campaigns are also at risk of being lost when attention moves elsewhere. While an excellent strategy to launch an improvement, campaigns are ineffective for sustaining long-term success.
Source: NSW Health, “NSW Healthcare Associated Infections Data Collection,” 2011; 191(8 Suppl): S18-S25; Clinical Excellence Commission, “Safety and Quality of Healthcare in NSW: Chartbook 2009,” December 2010; Australian Commission on Safety and Quality in Healthcare, “Windows into Safety and Quality in Health Care 2010”; Advisory Board interviews and analysis.
1) Methicillin-resistant Staphylococcus aureus. 2) Central line-associated blood stream infection.
Gap to best practice for CLABSIs
MRSA1 infections per 1,000 ICU bed days
ICU associated CLABSI2 per 1,000 central line days

©2013 THE ADVISORY BOARD COMPANY • ADVISORY.COM • 26143 32
Failing to Execute on Knowledge
Percentage of Clinicians Agreeing
Difficult to Change Long-Held Mind-Sets
Study in Brief: Changes in Safety Attitude Following Checklist Implementation • Survey of 281 surgeons, nurses, anaesthesia personnel, and technicians at seven hospitals worldwide
• Organisations had implemented the World Health Organisation Surgical Safety Checklist
• Personnel responded to survey anonymously following two weeks of using checklist
The third challenge is dealing with the human factor. Clinician buy-in and a compelling case for change are not always sufficient to drive improvements.
A story from Atul Gawande, a surgeon and writer, illustrates this problem. Gawande is particularly known for his championing of the World Health Organisation’s surgical safety checklist. During initial trials of the checklist at seven organsiations worldwide, about 20% of surgeons who had tried it were still reluctant to use it consistently. The surgeons argued that it was difficult to use and that it wasted time. However, when those same reluctant doctors were asked if they would want the checklist used if they were having an operation, 94% of them did.
This suggests the answer does not wholly lie in engagement and persuasion. Although these surgeons were to some extent persuaded of the value of the checklist, there were still barriers to behavioural change.
Source: Staines, R, “WHO Safe Surgery Checklists Are Not Being Followed by NHS Trusts,” Nursing Times, 17 February 2009; Haynes, AB, et al., “Changes in Safety Attitude and Relationship to Decreased Postoperative Morbidity and Mortality Following Implementation of a Checklist-Based Surgical Safety Intervention,” British Medical Journal, 2009, 20: 102-107; Fitzpatrick L, “Atul Gawande: How to Make Doctors Better,” Time, 4 January 2010; Advisory Board interviews and analysis.
A Waste of Time…Until You Are the Patient “A lot of the reaction is, 'My God, another piece of paperwork? It's just a waste of time.' 20% [of doctors] in our surveys still felt it was a pain, a waste of time; they didn't want to use it. Of course, we asked them a follow-up question: If they were having an operation, would they want the checklist? And 94% of them did.”
Atul Gawande, Surgeon Brigham and Women's Hospital
”
79% 80%
94%
Checklist Prevents Errors in Surgery
Checklist is Easy to Use
Would Want Checklist Used If I
Were a Patient

©2013 THE ADVISORY BOARD COMPANY • ADVISORY.COM • 26143 33
Quality Impossible to Manage Through Central Control
The Core Problem: Complexity
The inherent complexity of health care is at the root of these obstacles; it underpins the quality improvement challenges confronted by every organisation.
For example, this graphic displays a partial root cause analysis for avoidable Clostridium difficile infections in an organisation. Each of these factors has its own root causes, and addressing each of these requires a different intervention. Yet a C. difficile infection is just one of thousands of potential quality and safety problems faced by a hospital.
The number of potential problems is so vast that no management team could personally manage and motivate improvement on each, let alone monitor each one to ensure that improvement is sustained.
Personal management of every quality improvement challenge is clearly not a realistic approach to pursue, yet this complexity must be addressed if hospitals are to be successful in improving care.
Source: Advisory Board interviews and analysis.
1) USD. 2) Length of stay.
Influenza and Pneumococcal Vaccinations
Technique Past
Antibiotic Treatments
Stool Culture Equipment and Supplies Environment
Isolation Isolation Precautions
Personal Protection Equipment
and Supplies
Potential for Drug-
Resistant Organism
C. Difficile Screen (False
negation)
Clostridium Difficile Assay
Hand Hygiene Cost Appropriate
Cleaning
Cleaning Products
Inappropriate Treatment
Inappropriate Antibiotic Treatment
Infection Treated
with Antibiotic
Clostridium Difficile Volume: 907 cases
Cost variance per case: $6,5581 LOS2 opportunity for reduction: 8 days
Potential for Drug-Resistant Organism
Not Vaccin-ated
Vaccin-ated
©2013 THE ADVISORY BOARD COMPANY • ADVISORY.COM • 26143 34
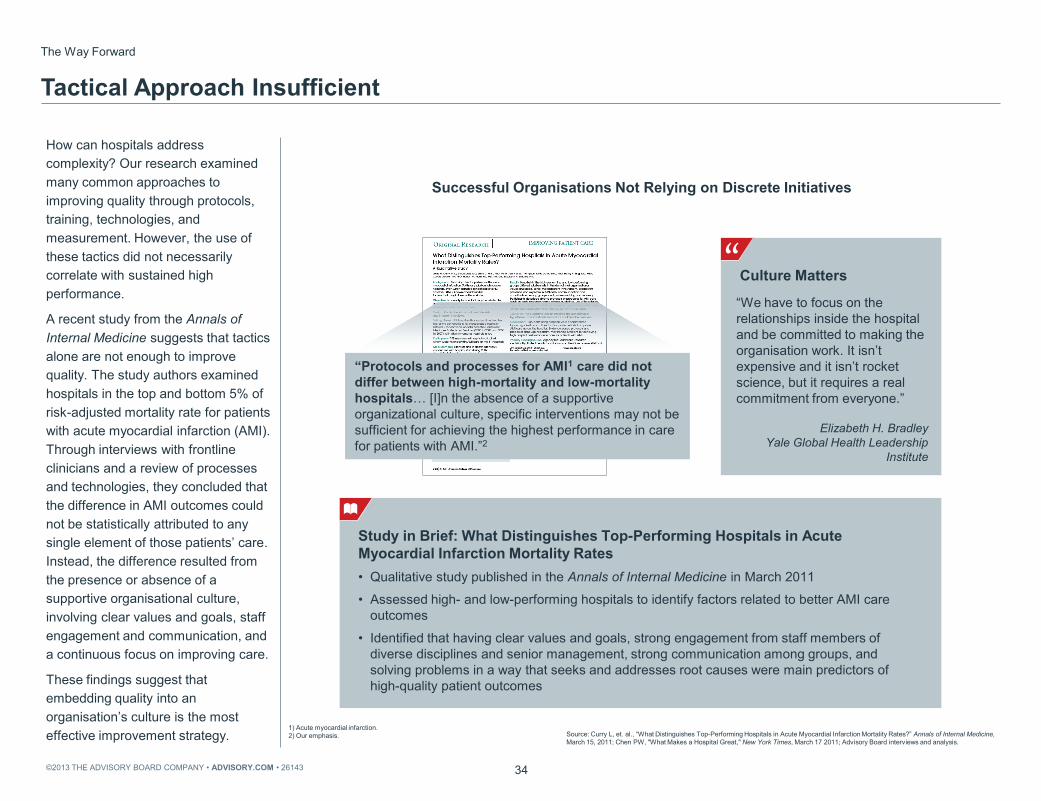
Successful Organisations Not Relying on Discrete Initiatives
How can hospitals address complexity? Our research examined many common approaches to improving quality through protocols, training, technologies, and measurement. However, the use of these tactics did not necessarily correlate with sustained high performance.
A recent study from the Annals of Internal Medicine suggests that tactics alone are not enough to improve quality. The study authors examined hospitals in the top and bottom 5% of risk-adjusted mortality rate for patients with acute myocardial infarction (AMI). Through interviews with frontline clinicians and a review of processes and technologies, they concluded that the difference in AMI outcomes could not be statistically attributed to any single element of those patients’ care. Instead, the difference resulted from the presence or absence of a supportive organisational culture, involving clear values and goals, staff engagement and communication, and a continuous focus on improving care.
These findings suggest that embedding quality into an organisation’s culture is the most effective improvement strategy.
The Way Forward
Tactical Approach Insufficient
Source: Curry L, et. al., “What Distinguishes Top-Performing Hospitals in Acute Myocardial Infarction Mortality Rates?” Annals of Internal Medicine, March 15, 2011; Chen PW, "What Makes a Hospital Great," New York Times, March 17 2011; Advisory Board interviews and analysis.
1) Acute myocardial infarction.2) Our emphasis.
Culture Matters
“We have to focus on the relationships inside the hospital and be committed to making the organisation work. It isn’t expensive and it isn’t rocket science, but it requires a real commitment from everyone.”
Elizabeth H. Bradley Yale Global Health Leadership
Institute
” Study in Brief: What Distinguishes Top-Performing Hospitals in Acute Myocardial Infarction Mortality Rates • Qualitative study published in the Annals of Internal Medicine in March 2011
• Assessed high- and low-performing hospitals to identify factors related to better AMI care outcomes
• Identified that having clear values and goals, strong engagement from staff members of diverse disciplines and senior management, strong communication among groups, and solving problems in a way that seeks and addresses root causes were main predictors of high-quality patient outcomes
“Protocols and processes for AMI1 care did not differ between high-mortality and low-mortality hospitals… [I]n the absence of a supportive organizational culture, specific interventions may not be sufficient for achieving the highest performance in care for patients with AMI.”2

©2013 THE ADVISORY BOARD COMPANY • ADVISORY.COM • 26143 35
Looking for a Common Thread Among Exemplars
Our Approach
Viewing Quality Through a Different Lens
What creates a quality culture? Instead of looking at organisations that have been successful in discrete quality improvement areas, this study examines health care organisations that have achieved extraordinary institution-wide success in quality improvement and have sustained that success over time.
Three broad criteria were used to select organisations, shown here. As no universal measure of quality exists, organisations were judged based on performance relative to their peers on local quality metrics and how they had improved and sustained improvement over time. Factors the group had in common, that were absent in hospitals that had been less successful, were identified.
All studied organisations had differences in employment models, financial status, teaching status, and geographic location.
Source: Advisory Board interviews and analysis.
1) Selected organisations included both academic and general hospitals, from various financial contexts, and where doctors were employed, not employed, unionised and not unionised.
Selecting Best Practice Case Study Institutions1
Consistent national or international recognition for quality performance
Achieved quality improvement across the organisation; not confined to single departments or initiatives
Continuous, consistent quality improvement journey
1
2
3

©2013 THE ADVISORY BOARD COMPANY • ADVISORY.COM • 26143
Ascension Health Rotterdam Eye Hospital Johns Hopkins Medicine Sentara Healthcare Mayo Clinic Health System Eau Claire Baylor Health System Cedars Sinai Medical Center Beth
Israel Deaconess Medical Center Rankin Medical Center St. Mary's Health Care System Intermountain Healthcare Jönköping County Council
36
Each of these best practice case study institutions shared one overarching attribute: they achieved an organisation-wide commitment to collective quality improvement.
In each organisation, quality improvement work was not isolated to a single department or clinical microsystem, but spread throughout the institution.
Staff were not focused on compliance with checklists or protocols for their own sake, but were committed to providing the best possible care to every patient.
Finally, the commitment to improvement was collective: about doing one’s best as an individual to care for patients, but also about working with others to develop quality systems to keep patients safe.
This is how these organisations overcame the problem of complexity: the hundreds of thousands of risky interactions that take place daily in the modern acute care environment. Every member of these organisations was engaged and empowered to improve quality for all patients, and became personally invested in leading and sustaining the improvement.
“All Hands On Deck” Required to Overcome Complexity
Source: Advisory Board interviews and analysis.
The Common Factor Organisation-wide commitment
to collective quality improvement Israel

©2013 THE ADVISORY BOARD COMPANY • ADVISORY.COM • 26143
Access the complete archive of case study videos here: advisory.com/ cob/Transformational-Quality
37
Sustained Success Built on Three Pillars of Improvement Because success in quality improvement is driven by organisational culture, this research takes a case study approach, examining several organisations in depth to understand the practical underpinnings of a collective commitment to quality improvement.
The Clinical Operations Board selected four organisations to profile. Over a 12-month period the research team visited organisations together with a video crew, conducting hours of in-depth interviews to understand the practical steps taken to drive culture change. Interviews were conducted with staff at every level of the organisation to ensure the consistency of the quality culture.
Sustained Success Built on Three Pillars of Improvement
Diverse Case Study Organisations
Source: Advisory Board interviews and analysis.
• Ten-hospital not-for-profit system based in Virginia with 20,000 employees and 3,400 medical staff members
• Set ambitious executive vision for quality improvement; established performance standards, reinforced behaviours, and trained staff to overcome patient safety risks
• 23-hospital system headquartered in Salt Lake City, Utah, with over 32,000 employees
• System-wide focus on leveraging data systems and metrics to reduce clinical variation and improve outcomes
• Specialty eye hospital located in Rotterdam, Netherlands, with 30 independent ophthalmologists, 21 residents, 400 staff members
• Focus on improving care delivery through innovation resulted in dramatic decrease in wrong-site surgeries and steady rise in patient satisfaction scores
• The Johns Hopkins Hospital, a 994-bed hospital in Baltimore, Maryland, part of Johns Hopkins Medicine
• Established the Armstrong Institute and the Comprehensive Unit-Based Safety Program (CUSP) to provide staff with training on teamwork and evidence-based interventions

©2013 THE ADVISORY BOARD COMPANY • ADVISORY.COM • 26143 38
Lessons for Leading the Organisation to Clinical Excellence
A close examination of these high-performing organisations found that all followed an extremely similar process to achieve their success.
Each of these organisations took nine steps, which can be categorised into three groups.
First, the quality transformation journey at each organisation started with a leadership commitment, and the leaders proved their commitment to staff across the organisation. Next, these organisations provided the resources, training, and support required to engage the front line to take over leadership of quality improvement efforts. Finally, each organisation embedded a culture of continuous measurement and feedback. This series of lessons offers an executive road map to transforming quality.
In the remainder of this publication we use one of our case study organisations to illustrate each part of the journey.
Transformational Quality
III Embed a Culture of Measurement
6. Set Data Expectations
7. Establish Comprehensive Clinical Data Infrastructure
8. Enable Principled Clinician Autonomy
9. Educate Clinicians in Data-Driven Quality Improvement
Case Study:
Intermountain Healthcare
II Support Frontline
Leadership
4. Empower Front Lines to Improve Quality Systems
5. Explicitly Define Doctor Champion Role
Case Study: The Johns
Hopkins Hospital
I Commit to Quality
Transformation
1. Articulate Specific, Aspirational Vision
2. Demonstrate Commitment to the Front Line
3. Enforce and Reinforce New Norms
Case Study: Sentara
Healthcare

©2013 THE ADVISORY BOARD COMPANY • ADVISORY.COM • 26143 39
Lesson 1: Articulate Specific, Aspirational Vision
Lesson 2: Demonstrate Commitment to the Front Line
Lesson 3: Enforce and Reinforce New Norms
Commit to Quality Transformation
Column I

©2013 THE ADVISORY BOARD COMPANY • ADVISORY.COM • 26143 40
Who Is Not Aiming for High Quality?
All hospitals and health care leaders are committed to providing high-quality care for patients. The commitment to quality is often expressed through the hospital’s mission statement.
The goals expressed in a typical mission statement, like that of pseudonymed Gibson Hospital, are certainly laudable. However, organisations that have been most successful in improving quality have established a quality commitment that is more ambitious and specific than typical generic mission statements. In fact, these organisations centre their entire enterprises around quality.
Commit to Quality Transformation: Standard Approach
Always Part of the Mission
Source: Advisory Board interviews and analysis.
1) Pseudonym.
Gibson Hospital1 Mission Statement
The multidisciplinary team at Gibson Hospital will provide efficient
and effective treatment options in a caring and professional
environment. Our highly experienced staff will deliver care in
comfortable surroundings with fully resourced facilities. We
continually aim to improve our performance by implementing
quality management principles.
©2013 THE ADVISORY BOARD COMPANY • ADVISORY.COM • 26143 41
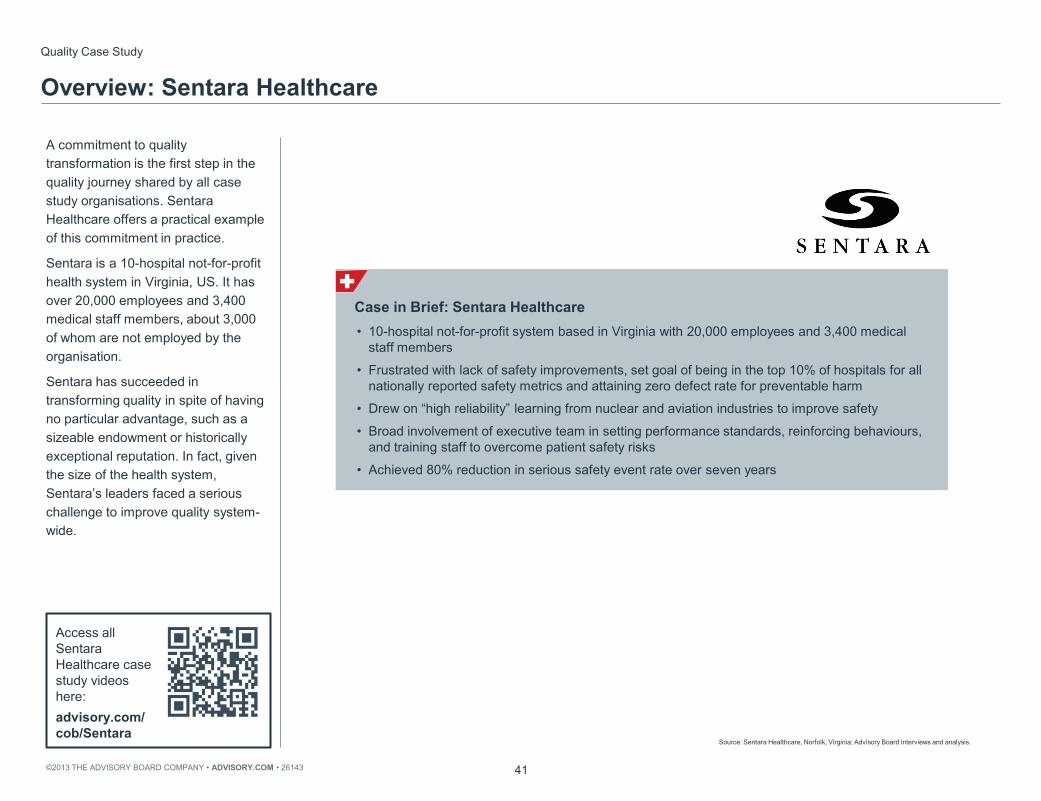
Quality Case Study
Overview: Sentara Healthcare
Case in Brief: Sentara Healthcare • 10-hospital not-for-profit system based in Virginia with 20,000 employees and 3,400 medical
staff members
• Frustrated with lack of safety improvements, set goal of being in the top 10% of hospitals for all nationally reported safety metrics and attaining zero defect rate for preventable harm
• Drew on “high reliability” learning from nuclear and aviation industries to improve safety
• Broad involvement of executive team in setting performance standards, reinforcing behaviours, and training staff to overcome patient safety risks
• Achieved 80% reduction in serious safety event rate over seven years
A commitment to quality transformation is the first step in the quality journey shared by all case study organisations. Sentara Healthcare offers a practical example of this commitment in practice.
Sentara is a 10-hospital not-for-profit health system in Virginia, US. It has over 20,000 employees and 3,400 medical staff members, about 3,000 of whom are not employed by the organisation.
Sentara has succeeded in transforming quality in spite of having no particular advantage, such as a sizeable endowment or historically exceptional reputation. In fact, given the size of the health system, Sentara’s leaders faced a serious challenge to improve quality system-wide.
Source: Sentara Healthcare, Norfolk, Virginia; Advisory Board interviews and analysis.
Access all Sentara Healthcare case study videos here: advisory.com/ cob/Sentara

©2013 THE ADVISORY BOARD COMPANY • ADVISORY.COM • 26143 42
Timeline of Quality Improvement at Sentara Healthcare
The quality transformation journey at Sentara began in 1999 and has continued to evolve for more than a decade.
Timeline
Success Through Leadership Vision
Source: McCarthy D, Klein S, “Sentara Healthcare: Making Patient Safety an Enduring Organizational Value,” The Commonwealth Fund, March 2011, 8; Advisory Board interviews and analysis.
2001 First version of quality improvement program launched
2002 • Executives frustrated by
lack of progress, hire consulting firm to conduct safety review
• Whole-hospital safety initiative launched at Norfolk General
2003 Began expansion of safety initiative system-wide
1999 “To Err Is Human” published by the Institute of Medicine
2006 Set goal of reaching top 10% in all national quality metrics
2008 Executive rounding and safety check-ins launched system-wide
2009 Serious safety events decreased by 80% from 2003
2005 Launched safety coach program

©2013 THE ADVISORY BOARD COMPANY • ADVISORY.COM • 26143 43
National Focus on Quality Improvement Galvanises Sentara
Sentara’s work was inspired initially by the Institute of Medicine’s seminal report “To Err Is Human,” published in 1999. The organisation’s leadership had always worked to provide quality care, but the publication’s strong indictment of avoidable harm in hospitals helped them realise that accidental harm to patients was not an inevitable side effect of hospital care.
This initial catalyst was an important moment for the organisation as a whole, but did not produce overnight transformation.
Catalyst for Change
A Wake-Up Call
Source: Linda T, Kohn J, Corrigan, Donaldson M, Editors, To Err Is Human, Committee on Quality of Health Care in America, Institute of Medicine (1999): 17-19; Sentara Healthcare, Norfolk, Virginia; Advisory Board interviews and analysis. 1) USD.
• “Preventable adverse events are a leading
cause of death in the United States.”
• “Sizable numbers of Americans are harmed as a result of medical errors.”
• “Total national costs (lost income, lost household production, disability, health care costs) are estimated to be between $37.6 billion and $50 billion1 for adverse events and between $17 billion and $29 billion1 for preventable adverse events.”
• “Medication-related errors occur frequently in hospitals; not all result in actual harm, but those that do are costly.”
To Err Is Human (1999)
“Health Care Is Not as Safe as It Should Be”
To Err Is Human: Building a Safer
Healthcare System

©2013 THE ADVISORY BOARD COMPANY • ADVISORY.COM • 26143 44
Unfocused Message and Isolated Interventions Slow Early Quality Efforts
Initial Efforts Fall Short
The Big Picture“We were frustrated. The sense at the time was that if we continued to work on discrete things without a larger framework, we’d make progress, but we really wouldn’t make the impact that we thought we needed.”
Sentara’s first efforts at improving quality were similar to those of many organisations. They focused on fixing a few specific quality problems, such as medication safety and ventilator-associated pneumonia. They also revised their quality mission statement to reflect these new goals.
Sentara had some success: their medication safety system was nationally recognised, and ventilator-associated pneumonia rates decreased. Their results, however, fell far short of the vision laid out by “To Err Is Human,” of care with zero harm, and the leadership team was left dissatisfied. A drive to continue to improve is a notable characteristic of leaders in all of the case profiles.
Sentara’s leadership team came to the conclusion that multiple isolated campaigns would not be sufficient to achieve their goals. Yet a review of solutions in place at other health care organisations found no tactics that differed significantly from their own efforts to date.
Source: Sentara.com, August 2000, accessed through web.archive.org 10 April 2012; Sentara Healthcare, Norfolk, Virginia; Advisory Board interviews and analysis.
Mission Statement, August 2000
We will focus, plan and act on our commitments to our community mission, to our customers and to the highest quality standards of healthcare to achieve our vision for the future.
Selected Quality Improvement Interventions 1999-2001
Medication Safety IT system to streamline and reduce errors in medication dispensing
Ventilator-Associated Pneumonia Education program to reduce VAP in all system sites
Dr Gary Yates, CMO Sentara Healthcare
”

©2013 THE ADVISORY BOARD COMPANY • ADVISORY.COM • 26143 45
External Expertise Pushes Senior Team to Reprioritise
Genesis of Quality Improvement Program at Sentara Healthcare
Many organisations finding themselves on par with their peers might decide that their efforts were good enough. Instead, Sentara’s leadership tried something different. They hired a consulting firm that did not typically work with health care organisations, but had expertise in two other high-risk industries: nuclear power and airlines. This firm analysed the hospitals’ adverse events, safety culture, and approach to errors.
The consulting firm’s analysis found several key factors leading to error: inconsistent compliance with quality policy, poor communication during handoffs and between disciplines, and failures to recognise high-risk situations. These behavioural factors were a root cause of the vast majority of adverse events in the organisation.
Sentara’s senior leaders described this moment as an epiphany: without their personal involvement, staff would not be motivated to change their behaviour and develop habits that would result in safer care. Leadership involvement would also be essential to invest in systems across the hospital that would reduce the chance of human errors occurring.
Executive Leadership Required to Move Forward
Source: Sentara Healthcare, Norfolk, Virginia; Advisory Board interviews and analysis.
Focus on Culture Leadership Prioritisation Out-of-Industry Assessment
External safety experts with experience in risk reduction in nuclear power and airline industries conduct baseline assessment of safety processes
Assessment results and executive discussions turn focus from individual quality improvement processes to inculcating a system-wide culture of safety
Leadership team recognises senior executive prioritisation of quality improvement will be critical to sustained culture change
Four Principles of Quality Improvement at Sentara
Elevate safety to core organisational value
Communicate behaviours for error prevention
Create systems that reduce the chance of human error
Use root cause analysis to understand safety events
Watch Sentara’s leaders discuss their decision moment here: advisory.com/ cob/Sentara-Commitment

©2013 THE ADVISORY BOARD COMPANY • ADVISORY.COM • 26143 46
Quality Mission Statement Signals Clear Change to Staff
Lesson #1: Articulate Specific, Aspirational Vision
Setting a New Standard
Over the next decade, Sentara took three crucial steps to put their commitment to quality improvement into practice.
First, they changed their mission statement, shown here. The final sentence is most important: “Our goal is to lead the industry, to achieve top 10% performance wherever national benchmarks exist.” Comparing this to the typical mission statement, three points stand out:
It is highly aspirational: not just to provide high-quality care, but to do so organisation-wide on all nationally benchmarked metrics.
It is clear what “success” means to the organisation. Their goal (top 10%) is measurable and clearly defined.
It is specific to the organisation: the focus on safety reflects the same preoccupation by Sentara’s leadership team.
None of the institutions profiled in this study committed to improving quality in the abstract; each hospital’s mission was specifically tailored to their own culture and goals. This is the first step towards quality transformation: articulate a specific, aspirational vision tailored to the organisation.
Source: Sentara Healthcare, Norfolk, Virginia; Advisory Board interviews and analysis.
Characteristics of Quality Definition at Top-Performing Hospitals
Aspirational goal set
Success clearly defined
Vision specific and tailored to the organisation
Providing the highest quality of care and exceptional patient safety
standards are imperative strategies throughout Sentara Healthcare.
Our goal is to lead the industry to achieve top 10% performance
wherever national benchmarks exist.

©2013 THE ADVISORY BOARD COMPANY • ADVISORY.COM • 26143 47
Executive Commitment Often Not Translating
Executives Reporting High Quality Care as Top Priority1
Vision Alone Not Enough
n=111 senior hospital executives
Doctors Reporting High Quality Care as Top Priority for Executive Team2
n=35 doctors
No vision, goal or target is enough to change culture. These statements are, by their nature, too abstract for a frontline clinician to apply to his or her daily work.
In fact, at most organisations the commitment of senior executives to quality is not always felt throughout the organisation. Data from the Clinical Operations Board global survey of quality practice suggest just that. Of senior executives surveyed, 85% reported that providing high-quality care was their top priority. But only 26% of doctors felt that quality was the top priority for the executive team at their hospital. This divide indicates that hospital leaders seeking to convince their staff that quality is their top priority face a serious challenge.
Sentara faced the same challenge when they began their quality improvement journey.
Source: 2012 Clinical Operations Board Survey on Quality; Advisory Board interviews and analysis.
1) Survey question: “How important is ensuring high quality care for patients to you personally?” “No” displayed in chart as survey answers of high, medium, or low priority.
2) Survey question: “How important do you feel ensuring high quality care for patients is to the executive leadership of your organisation as a whole?” “No” displayed in chart as survey answers of high, medium, or low priority.
Yes No Yes No 26% 74% 15% 85%

©2013 THE ADVISORY BOARD COMPANY • ADVISORY.COM • 26143 48
Sentara Finds Typical Approaches Inadequate for Culture Change
Open-Door Policy
Managers commonly use three methods to engage with staff on any issue: an open-door policy, executive “walkrounds” at random, and scheduled senior executive walkrounds. Yet each method has limitations that prevent true engagement with staff.
Active Management Methods Falling Short
Source: Advisory Board interviews and analysis.
Walkrounds at Random
Scheduled Senior Walkrounds
Common Active Management Concepts
Theory Anticipate staff needs and ensure compliance with quality goals through unplanned drop-ins
Theory Signal that leaders are always available and receptive to staff challenges and concerns
Theory Demonstrate executive commitment to quality through scheduled ward visits by most senior leadership
Practice • Non-clinical executives
intimidated by frontline atmosphere; fail to ask pertinent questions
• Staff feel check-in indicates lack of trust, not convinced of executive’s interest in quality
Practice
• Staff unwilling to admit inability to perform tasks
• Staff fear not meeting manager expectations
• Staff want to avoid appearing weak or needy
Practice • Predictable nature of visits
results in extensive staff preparation for interaction
• Walkrounds too infrequent to create ongoing dialogue between management and staff

©2013 THE ADVISORY BOARD COMPANY • ADVISORY.COM • 26143 49
Consistency, Constant Visibility, Preparation, and Purpose Are Key
Executive Resources to Support Informed Walkrounds
One Sentara hospital tested a new method to overcome some of the limitations of traditional executive walkrounds. The method was so successful in demonstrating leadership commitment to quality that it was spread system-wide.
Sentara system executives, hospital leadership teams, and managers at all levels conduct rounds every morning. Leaders visit two or three wards each, alone or in pairs, for no more than 20 minutes per day. However, their presence is frequent enough on each ward that executives know staff by name, and staff report that they do not feel “monitored” but rather that they are working together with leaders to improve care. On the rounds, leaders observe practice and speak informally with staff. Executives always ask the same three quality-related questions, to ensure that the rounds remain focused on quality. The questions help staff proactively anticipate potential issues. More importantly, they clearly demonstrate to staff that quality is the top priority for the executive team.
The daily rounds ensure that this message is reinforced continuously across the hospital.
Lesson #2: Demonstrate Commitment to the Front Line
Making Executive Rounds Work
Source: Sentara Healthcare, Norfolk, Virginia; Advisory Board interviews and analysis.
Three Key Questions: Asking Staff to Think Ahead
1. “What in the last 24 hours has threatened our ability to provide safe care?”
2. “What might we expect to arise in the next 24 hours that would threaten the safety of our care?”
3. “How would we respond to what we think might happen?”
Crib Sheet for Clinical Rounds “Can you demonstrate how to use the care bundle to prevent urinary catheter infections?”
Note Any Issues Raised by Staff
Create Action Plans with Staff to Address Issues
Executives Round with Relevant Questions
Sentara “Rounding with Intention” Process
A Constant and Consistent Message “The idea that we’re going to be out there each day and teaching and actively engaging folks…has been important in sending a constant message about safety to our staff.”
Dr Gary Yates, CMO, Sentara Healthcare
”

©2013 THE ADVISORY BOARD COMPANY • ADVISORY.COM • 26143 50
Sentara Daily Check-Ins Anticipate Potential Problems, Prove Priority
In addition to daily walkrounds, each Sentara hospital conducts a daily safety check-in. These meetings are limited to 20 minutes, and are conducted standing up to ensure efficiency. The senior executive team, operational managers, clinical heads, and nurse managers each deliver a report in under a minute.
Each manager covers a structured agenda: progress against hospital and ward goals, sharing of positive or negative feedback, and answering the same three questions covered in executive walkrounds. This process ensures that issues on each ward are addressed daily.
The effect is twofold: First, it effectively surfaces and resolves safety problems. Second, together with the walkrounds, executive presence during this process proves to staff that leaders are spending their most valuable resource—time—on improving quality, indicating a genuine and permanent commitment.
Demonstrating commitment to staff is the second critical step taken by leaders at all case study organisations in their transformational quality journey.
Constantly Reinforcing Executive Commitment
Source: Sentara Healthcare, Norfolk, Virginia; Advisory Board interviews and analysis.
Sample Agenda Items 1. Update on progress against hospital
and ward goals
2. Share positive or negative patient feedback
3. Address safety issues within last 24 hours
4. Discuss potential safety issues within next 24 hours and mitigating strategies
• Hospital executives, medical staff leaders and nurse managers meet every morning to review safety or quality concerns
• Meeting conducted while standing, lasts 20 minutes or less
Daily Check-In Procedure
Sentara Leadership Method for Performance Excellence
1. Safety Walkrounds: to identify problems and reinforce safety as a priority
2. Daily Safety Check-In: to share and maintain situational awareness
3. Action Plans: to manage and ensure accountability for improvement work
Learn more about Sentara’s walkrounds and check–ins here: advisory.com/ cob/Sentara-Walkrounds

©2013 THE ADVISORY BOARD COMPANY • ADVISORY.COM • 26143 51
Positive Reinforcement and “Just Culture” Foster Accountability
Example of Positive Reinforcement at Sentara
Sentara attributes part of their success in reducing errors to their practice of rewarding clinicians at all levels who make what they call “great saves”—going outside the ordinary bounds of their role to prevent an error. These stories are sent to all managers so that they can discuss them with staff, and are also published online in the organisation’s blog.
Though it is easy to respond to positive situations, every organisation will also encounter situations where something goes wrong. Many organisations have put in place a “no-blame” policy to encourage more reporting of safety events.
However, Sentara found that a no-blame culture avoided assigning accountability. Instead, they have instituted a “just culture,” because they feel that deliberate violations of safety policy should have consequences. They use a decision guide to ensure that no staff member or doctor is ever unfairly penalised.
By consistently applying this practice, Sentara executives have proven to clinicians that this principle is always fairly applied, reducing fear around reporting an event.
Lesson #3: Enforce and Reinforce New Norms
Creating a Sense of Quality Ownership
Source: Sentara Healthcare, Norfolk, Virginia; Advisory Board interviews and analysis.
Environmental Services worker in Critical Care Unit corridor hears beeping from patient room
Enters room to find patient struggling to breathe; runs to find nearest nurse who resuscitates patient
Sentara leadership team gives environmental services worker public recognition
Hospital system blog regularly profiles “Patient Safety Success Stories”: http://sentarainfo.com/today
Collaborative Improvement
• No punishment for honest mistakes; all
system and human factors taken into account
• “Substitution test” decreases likelihood of attribution problem
• Enables unbiased analysis, individual and system improvement following safety mistakes
Just Culture
For a complete version of Sentara’s Performance Management Decision Guide, please see appendix p. 114
Listen to Sentara leaders discussing the effect of “great save” stories: advisory.com/ cob/Sentara-Recognition

©2013 THE ADVISORY BOARD COMPANY • ADVISORY.COM • 26143 52
Standing Up for a Strong Institutional Vision
For many organistions, the final step in proving executive commitment is the response when individuals or groups flout new expectations. A commitment to quality will seem insubstantial if leaders take no action against persistent resistance.
For example, the Mayo Clinic Health System in Eau Claire developed a vision for quality founded on care delivered by a clinical team of doctors, nurses, and allied health working seamlessly together.
Initially, several highly autonomous doctors who generated substantial revenue for the hospital refused to change their independent method of practice. After these doctors repeatedly refused to adopt the team-based, multidisciplinary approach that the organisation had embraced, they were asked to leave.
Fifteen years later, frontline staff at the hospital still proudly cited this incident as an example of the organisation’s unwavering commitment to quality. The executives’ willingness to tackle resistance sent a clear message to the organisation that the commitment to quality was genuine and permanent.
Walking the Talk
Source: Paul Bate and Peter Mendel and Glenn Robert, “Organizing for Quality: The improvement journeys of leading hospitals in Europe and the United States,” Radcliffe Publishing: Oxford, 2008; Advisory Board interviews and analysis.
Case in Brief: Mayo Clinic Health System in Eau Claire
• 305-bed hospital located in Eau Claire, Wisconsin; part of the Mayo Clinic Health System
• Following merger in 1992 between Luther Hospital and Midelfort Clinic, and affiliation with Mayo Clinic Health System, embarked on institution-wide transformation based around vision of multidisciplinary, integrated care
• Strong leadership and continued commitment to quality improvement resulted in sustained quality improvement over nearly two decades
• Organisation scores in top 1% of US hospitals on composite measure of 22 publicly reported metrics of standards in heart attack, heart failure, pneumonia, and surgical care
Quality Takes Precedence Over Clinical Autonomy
“The expectation on the part of the [doctors] is that autonomy will not trump quality. That’s a real big issue and it is one that the organisation is currently working on…there’s no room for cowboys. Quality comes first.”
Senior Executive
Mayo Clinic Health System in Eau Claire
”
Source: Bate P, Mendel P, Robert G, “Organizing for Quality: The Improvement Journeys of Leading Hospitals in Europe and the United States,” Radcliffe Publishing: Oxford, 2008; Advisory Board interviews and analysis.

©2013 THE ADVISORY BOARD COMPANY • ADVISORY.COM • 26143 53
Array of Enforcement, Reinforcement Mechanisms Required To encourage cultural and behavioural change at an organisation, three methods are essential for leaders: positive reinforcement, a just culture, and disciplinary action. Most organisations will choose a combination of these methods to develop a culture of quality, with positive reinforcement used most frequently and disciplinary action reserved for situations when it is absolutely necessary.
Enforce and Reinforce New Norms: Summary
No Single Method Sufficient
Source: Advisory Board interviews and analysis.
Frequency of Use
Leadership Response Techniques
Positive Reinforcement
“Just Culture”
Disciplinary Action
Celebration of notable successes spreads enthusiasm and knowledge of expected behaviours
Principled system required to manage quality errors, focusing on root causes and learning from mistakes
For persistent resisters, firmer action required; coaching out of the organisation as needed in extreme cases

©2013 THE ADVISORY BOARD COMPANY • ADVISORY.COM • 26143 54
In-Hospital Mortality Ratio (Actual Deaths/Expected Deaths)
Sentara Hospitals, 2003–2008
Selected Results
Attaining Consistent Improvement
Serious Safety Event Rate per 10,000 Adjusted Patient Days1
Sentara Hospitals, 2003-2010
Sentara’s quality efforts have led to consistent improvements in the mortality ratio and frequency of serious safety events across the health care organisation. While quality metrics such as mortality ratio cannot be compared internationally, Sentara has remained significantly ahead of peer hospitals in the United States.
Source: Sentara Healthcare, Norfolk, Virginia; McCarthy D, Klein S, “Sentara Healthcare: Making Patient Safety an Enduring Organizational Value,” The Commonwealth Fund, March 2011; Advisory Board interviews and analysis.
1) Deviation from standard of care resulting in moderate to severe harm to the patient. 2) Modern Healthcare Magazine. 3) Awarded by the Joint Commission on Accreditation of Healthcare Organizations
(JCAHO) and the National Quality Forum. Sentara received the award for "Innovation in Patient Safety and Quality at a Local or Organizational Level."
4) Awarded by the American Hospital Association.
Sentara Quality Awards 2012 Top 10 Integrated US Hospital System2
2010 Leapfrog Group of Top Hospitals
2005 John M. Eisenberg Award for Patient Safety3
2004 Quest for Quality Prize4
0.5
0.2
2003 2004 2005 2006 2007 2008 2009 2010
0.73 0.66 0.64
0.60 0.58 0.56
2003 2004 2005 2006 2007 2008
Hear Sentara staff describe the culture change at their organisation: advisory.com/ cob/Sentara-CultureChange

©2013 THE ADVISORY BOARD COMPANY • ADVISORY.COM • 26143 55
Executives Must Take First Steps on Quality Improvement Journey
Elements of Transformational Commitment
The first vital step to transform quality at any organisation is a serious executive decision to make transforming quality not just a project, but the hospital's long-term top priority. Although almost every hospital executive would say that quality care is their top priority, convincing staff throughout the institution of that commitment is critical, by making that commitment highly visible, and responding in an even-handed, unwaveringly consistent manner to resistance. These imperatives are ones that leaders must execute largely on their own.
The idea that quality initiatives spring from frontline, grassroots effort is common. Yet this compelling argument does not match the reality at the best-in-class quality organisations that we studied. The decision to start the quality journey is a leadership moment. While frontline leadership is also essential, surprisingly it is not the first step nor a necessary prerequisite.
Commit to Quality Transformation
Critical Leadership Actions
Source: Advisory Board interviews and analysis.
Demonstrate Informed Dedication to the Front Lines
Articulate Specific, Aspirational Vision
Vision includes specific, measurable definition of success; goal is aspirational but achievable and tailored to organisation’s culture
Enforce and Reinforce New Norms
Leadership publicly celebrates staff achievements related to quality vision and responds to noncompliance in a fair and consistent manner
Executives visibly dedicate substantial time and attention to quality improvement goals at every level of the organisation

©2013 THE ADVISORY BOARD COMPANY • ADVISORY.COM • 26143 56
The questions presented here are designed to allow leaders to assess their organisation’s current quality commitment, as well as to set priorities for future action. A majority of “no” answers in any area indicates an opportunity for improvement. These action items aim to enable members to quickly act on the lessons covered in this chapter.
Action Items to Commit to Quality Transformation
Source: Advisory Board interviews and analysis.
Self-Test Questions
Review Organisation’s Mission Statement
• Is it clear that quality of care is central to the mission?
• Are quality goals specific to the organisation, measurable, and ambitious?
Evaluate Executive Communication Around Quality
• Are frontline staff convinced of senior clinical and non-clinical executives’ quality commitment?
• Is executive time spent on quality visible to staff?
• Do executives have a mechanism to surface honest commentary on potential problem areas from staff?
Evaluate Quality Enforcement and Reinforcement Practices
• Are quality successes celebrated organisation-wide, in a way that is meaningful to staff?
• Are adverse events consistently and fairly evaluated?
• Do medical staff governance procedures allow for quality compliance enforcement if necessary?
©2013 THE ADVISORY BOARD COMPANY • ADVISORY.COM • 26143 57
Lesson 4: Empower Front Lines to Improve Quality Systems
Lesson 5: Explicitly Define Doctor Champion Role
Support Frontline Leadership
Column II

©2013 THE ADVISORY BOARD COMPANY • ADVISORY.COM • 26143 58
Success Impossible Without Effort from Whole Organisation
After committing the organisation to transforming quality, the primary role of senior leadership is to enfranchise and support quality improvement efforts by the front line. Returning to the key problem of complexity discussed earlier: if solving just one quality problem, Clostridium difficile, is so complex, even the most committed leader will be unable to improve quality alone.
Returning to Core Problem
Complexity Requires Frontline Engagement
Source: Advisory Board interviews and analysis.
1) USD.
Influenza and Pneumococcal Vaccinations
Technique Past
Antibiotic Treatments
Stool Culture Equipment and Supplies Environment
Isolation Isolation Precautions
Personal Protection Equipment
and Supplies
Potential for Drug-
Resistant Organism
C. Difficile Screen (False
negation)
Clostridium Difficile Assay
Hand Hygiene Cost Appropriate
Cleaning
Cleaning Products
Inappropriate Treatment
Inappropriate Antibiotic Treatment
Infection Treated
with Antibiotic
Clostridium Difficile Volume: 907 cases
Cost variance per case: $6,5581
LOS opportunity for reduction: 8 days
Potential for Drug-Resistant Organism
Not Vaccin-ated
Vaccin-ated

©2013 THE ADVISORY BOARD COMPANY • ADVISORY.COM • 26143 59
Three Barriers to Clinician Involvement in Quality Improvement
Barriers to Staff Engagement
The Advisory Board’s Talent Development division has developed a framework to analyse the challenge of staff engagement. In order to engage staff in any issue, it is essential to overcome three obstacles: Hill, Skill, and Will. “Hill” refers to barriers or practical obstacles that staff might face in solving a particular issue. “Skill” is more obvious; staff may not have the appropriate skill or knowledge to work on a project. Finally, the “will” or desire to work on something may also be lacking. All three of these barriers must be addressed to engage staff in any endeavour.
This framework holds true for the challenge of engagement in quality improvement. The most important “hill” to overcome in this case is limited time and resources to devote to quality improvement. The “skill” staff lack is training in quality improvement. The barrier of “will” is the lack of ownership of whole system quality improvement—that is, quality work beyond individual care interactions with patients.
Common Factors Lead to Disengagement
Source: Advisory Board interviews and analysis.
Skill Will Hill
Barriers to Clinician Engagement in Quality Improvement
Time
• Clinicians have little time available to devote to systemic quality improvement
• Time spent on quality improvement may result in reduced income from treating fewer patients
Training
• Clinical training seldom includes quality improvement component
• Lack necessary knowledge of systemic quality improvement, statistical analysis, project management
Ownership
• Limited sense of accountability for systemic quality improvement beyond treatment of individual patients
• Skeptical of management attempts to alter care-giving processes

©2013 THE ADVISORY BOARD COMPANY • ADVISORY.COM • 26143 60
Leaders Often Leave Leading to the Quality Department
The question of “will” is challenging to address because the vast majority of frontline clinicians are already personally invested in providing the best possible care to the patient in front of them.
Yet the problem of transferring quality ownership is endemic in health care. Busy senior executives, who work at a level removed from the front line, typically delegate oversight of quality to doctors and the quality department. Doctors, in turn, despite their commitment to patient care, often do not see improving quality systems in the organisation as part of their role. They, too, are likely to delegate this task to the quality department. As a result, a mind-set develops across the organisation that quality is the quality department’s job alone.
This is not the approach at our case study organisations. There, quality is the full responsibility of all staff and management. To achieve this sense of accountability, each organisation addressed the three engagement barriers. Leaders took different approaches depending on their hospitals’ situation; this section examines several representative examples.
Typical Approach
Passing the Buck
Source: Advisory Board interviews and analysis.
Hospital Leadership • Executives
preoccupied with strategy, planning, and financial issues
• Lack time to focus on quality improvement
Quality Department • Quality manager
responsible for overseeing hospital-wide quality improvement initiatives
• Quality department lacks power to enact real change
Doctors • Provision of high
quality care to individual patients occupies all of doctors’ time
• Do not view system-wide quality improvement as part of their purview
©2013 THE ADVISORY BOARD COMPANY • ADVISORY.COM • 26143 61
Quality Case Study
Overview: The Johns Hopkins Hospital
Case in Brief: The Johns Hopkins Hospital • 994-bed hospital in Baltimore, Maryland, part of Johns Hopkins Medicine
• Following two tragic and highly publicised lapses in patient safety, embarked on organisation-wide quality mission
• Created the Center for Innovation in Quality Patient Care with the goal of making the Johns Hopkins Hospital “the safest healthcare institution in the world”
• Implemented the Comprehensive Unit-Based Safety Program (CUSP), providing frontline staff with training on the science of safety, teamwork, and evidence-based interventions
• Significant reduction in adverse events hospital-wide
The Johns Hopkins Hospital is a 994-bed teaching hospital in Baltimore, Maryland. The flagship hospital of Johns Hopkins Medicine, it has a long-standing global reputation for academic excellence and innovation in quality and safety.
Johns Hopkins was selected as a case profile for this section as a result of the high level of engagement and empowerment of frontline staff felt in regard to quality improvement.
Source: The Johns Hopkins Hospital, Baltimore, Maryland; Advisory Board interviews and analysis.
Access all Johns Hopkins Hospital case study videos here: advisory.com/ cob/JohnsHopkins

©2013 THE ADVISORY BOARD COMPANY • ADVISORY.COM • 26143 62
Timeline of Quality Improvement at The Johns Hopkins Hospital
The most important quality improvement milestones at the Johns Hopkins Hospital since 2001 are shown here.
Timeline
Developing an Organisation-Wide Support Infrastructure
Source: Klein S, McCarthy D, “Johns Hopkins Medicine: Embedding Patient Safety in a University-Affiliated Integrated Health Care Delivery System,” The Commonwealth Fund, March 2011, 6; The Johns Hopkins Hospital, Baltimore, Maryland; Advisory Board interviews and analysis.
2002 • Executive team sets goal to
be the “safest hospital in the world”
• Center for Innovation in Quality Patient Care established
2001 • Two patient deaths spur new
quality goals
• CUSP Program pilot launched in two ICUs
2006 • Safety attitude questionnaire
conducted for all clinical staff
• CUSP program available hospital-wide
2010 Central line infections decreased by nearly 100% in ICUs since 2001 program launch
2011 Armstrong Institute established, combining Centre for Innovation in Quality Patient Care and Johns Hopkins Quality and Safety Research Group

©2013 THE ADVISORY BOARD COMPANY • ADVISORY.COM • 26143 63
Quality Approach Lacking Systemic Focus, Accountability
Catalyst for Change
Sentinel Event Sparks Action
Early Approach to Quality at The Johns Hopkins Hospital
The catalyst of change at Johns Hopkins was a highly publicised sentinel event involving a baby in 2001.
According to Johns Hopkins, prior to the event the executive leadership had trusted that the high calibre of their medical staff would ensure that care was of the highest quality. An analysis of the sentinel event revealed that although their independent, highly trained doctors were focused on providing high-quality care for the patient in front of them, they felt that quality at a system level was the responsibility of the hospital management. Ultimately, each group was passing off responsibility for organisation-level quality to the other.
As in all of our case studies, the hospital leadership made the initial decision to dedicate the organisation to quality improvement. The leadership recognised two things. First, they would not be able to personally ensure quality improvement across the organisation, but would have to rely on their staff. Second, their staff lacked the time, training, and sense of quality ownership necessary for them to take on leadership of quality improvement. Source: “How Medical Errors Took a Little Girl’s Life,” The Baltimore
Sun, December 14, 2003; Advisory Board interviews and analysis.
Doctors
Hospital Leadership
Focused on quality of care for individual patients
Relying on medical staff to ensure high quality
A Tragic Beginning “Our quality journey began ignobly. A little girl, Josie King, died here of preventable mistakes, and it shocked the institution. And fortunately the institution had the courage to say: ‘We have to do better—our patients deserve better than they’re getting.’ And that led to a very public discussion about the quality of care we were providing and what we needed to do to make it better.”
Dr Peter Pronovost, Director, Armstrong Institute, Johns Hopkins Medicine
” Tragedy: After being scalded in a bathtub accident, 18-month-old Josie King was recovering at Johns Hopkins. Then something went terribly wrong.
How medical errors took a little girl’s life
Learn more about Johns Hopkins’ catalyst for quality change: advisory.com/ cob/Hopkins-Commitment

©2013 THE ADVISORY BOARD COMPANY • ADVISORY.COM • 26143 64
CUSP: The Comprehensive Unit-based Safety Program
CUSP1 Process Directed by Center for Innovation in Quality and Patient Care
Since 2001, Hopkins has successfully transformed their quality improvement culture. Although numerous strategies are involved, the centrepiece of their program is the Comprehensive Unit-Based Safety Program, or CUSP.
CUSP is designed around the principle that frontline staff know best where safety risks exist; the organisation’s role is to unlock their ability to fix these problems.
For each unit, becoming a “CUSP unit” is an ongoing process. First, the unit must independently decide to pursue CUSP; this is not an external priority imposed on them. Second, safety culture on the unit is assessed. Third, a multidisciplinary improvement team is selected. Notably, each team is required to include an executive sponsor and a doctor champion. Finally, the team uses the framework known as the “Five Steps for CUSP” to identify and solve quality problems.
The CUSP program began in 2001 on one unit in the ICU. At the time of writing, 40 units at Johns Hopkins Hospital have adopted it, followed by hundreds of units at hospitals around the world.
Lesson #4: Empower Front Lines to Improve Quality Systems
A Tool to Empower the Front Lines
Source: Center for Innovation in Quality Patient Care, "The Comprehensive Unit-based Safety Program (CUSP)," Johns Hopkins Medicine; Pronovost P, Vohr E, “Safe Patients, Smart Hospitals: How One Doctor’s Checklist Can Help Us Change Health Care from the Inside Out,” New York: Hudson Street Press, 2010; The Johns Hopkins Hospital, Baltimore, Maryland; Advisory Board interviews and analysis.
Core Principles
• Changing culture is vital to change practice
• Frontline staff are best positioned to know what can be improved and how to improve it
• Safety practice must be integrated into daily work
• Continuous, cyclical process drives constant improvement, avoids complacency
• Measurement is key to accountability and focus
Multidisciplinary team formed: must include doctor champion, executive sponsor, and representative of each unit stakeholder
Unit decides to participate in CUSP1
Safety Attitudes Questionnaire administered
Unit team follows Five Steps for CUSP
Progress assessed quantitatively; CUSP
process repeated
For Johns Hopkins’ Five Steps for CUSP, please see appendix p. 115
1) Comprehensive Unit-based Safety Program.

©2013 THE ADVISORY BOARD COMPANY • ADVISORY.COM • 26143 65
Focus on Learning from Mistakes Encourages Local Accountability
Analysing Errors, Developing Solutions
Finding Local Solutions “CUSP changes culture on these units. The staff identify problems in their own units and come up with ways to solve them. The underlying philosophy of this program is respecting local wisdom, and we are there to help them solve the problems they identify.”
Lori Paine, Director The Johns Hopkins Hospital and The Armstrong Institute for Patient Safety and Quality
The fundamental process of Hopkins’ Five Steps for CUSP is simple–it focuses relentlessly on identifying, and overcoming defects in care. Unit staff work to identify the highest priority problems, and to design, implement, and monitor solutions. They are assisted by a doctor champion, executive sponsor, and the quality department at the hospital.
The program is straightforward. Its outsized success is attributable to its focus on overcoming barriers to staff engagement with quality. First, it overcomes the “hill” barrier—time. Staff working on CUSP teams have dedicated time to work on improvement projects. Second, they address the “skill” barrier of training. Recognising that clinical skills alone are not enough to drive solutions, participants are provided with an academic overview of quality systems improvement. They are also trained in the Five Steps for CUSP, which provides a framework for thinking systematically about solving problems. Finally, Hopkins overcomes the “will” barrier by transferring quality leadership to the front lines rather than asking staff to comply with initiatives designed by hospital management.
Source: The Johns Hopkins Hospital, Baltimore, Maryland; Advisory Board interviews and analysis.
1) Comprehensive Unit-based Safety Program.
” Identify Defects
Each staff member is asked: How is the next patient going to be harmed on this unit? How can we prevent this harm from occurring?
Learn from Mistakes
For each defect, ask: What happened? Why did it happen? What did you do to reduce risk? How do you know that risks were reduced?
CUSP1 Process for Identifying and Learning from Defects

©2013 THE ADVISORY BOARD COMPANY • ADVISORY.COM • 26143
56%
80%
60% 64% 70% 66%
50% 58%
80% 90%
82% 84%
Teamwork Climate Safety Climate Perceptions of Unit Management
Morale
2006 2007 2008
66
Percentage of Weinberg 4C Unit Staff Reporting Positive Score on Selected Safety Attitude Questionnaire (SAQ) Areas
Rapid Culture Improvement on CUSP1 Units
A program like CUSP can galvanise a unit’s quality culture, as indicated by internal data from Johns Hopkins.
The general acute medical unit profiled here began the CUSP program in 2006. Units that begin working with CUSP already have some level of engagement with quality improvement since CUSP is a voluntary program. Despite this, over the course of two years the unit realised dramatic improvements in staff perceptions of teamwork, safety culture, management, and morale.
In every element of CUSP, Hopkins has empowered frontline staff to improve quality at a system level by putting real resources behind a stated commitment to quality improvement led by the front line.
Source: Trimmel J, et al, “Impact of the Comprehensive Unit-Based Safety Program (CUSP) on Safety Culture in a Surgical Inpatient Unit,” The Joint Commission Journal on Quality and Patient Safety, vol. 26, no. 6 (June 2010): 252-260; The Johns Hopkins Hospital, Baltimore, Maryland; Advisory Board interviews and analysis.
1) Comprehensive Unit-based Safety Program.
CUSP Program began on unit in 2006
Safety Attitude Question 2006 2008
Nurse input is well received in this clinical area 68% 80%
I have the support I need from other personnel to care for patients 52% 90%
I would feel safe being treated here as a patient 58% 80%
Medical errors are handled appropriately in this clinical area 64% 80%
Changes in Positive Scores on Safety Attitudes Questionnaire from Staff on Weinberg 4C
Learn how CUSP develops frontline capacity for improvement: advisory.com/ cob/Hopkins-cusp

©2013 THE ADVISORY BOARD COMPANY • ADVISORY.COM • 26143 67
System-Level Support Enables Broad Perspective
Committing to Analysing Every Safety Event
Finding Improvement Opportunities “We’re looking at this data from a couple of different angles. Sometimes there’s something about an event that’s concerning that might not even be quantifiable. But we’re also looking at and monitoring trends throughout the organisation to look for patterns and areas for improvement…This is a crucial aspect of our work.”
Lori Paine, Director The Johns Hopkins Hospital and
The Armstrong Institute for Patient Safety and Quality
Despite CUSP’s effectiveness, it has two potential pitfalls: CUSP units may choose to work on problems that are not strategic priorities of the hospital, and some units may choose not to participate in CUSP at all.
Johns Hopkins Hospital avoids these pitfalls through a highly effective quality department. In addition to providing support to CUSP teams, this department manages a comprehensive incident and near-miss reporting system; they receive and analyse 12,000 reports per year. This volume of incident reports is not an indication of poor quality, but rather a consequence of the level of trust and openness about quality and safety that the organisation has achieved. Coupled with extensive tracking of organisation-wide safety data, this system enables Hopkins leadership to have confidence that they are not missing quality problems.
The quality department also supports other groups of clinical champions to run strategically important, whole-organisation quality improvement projects when issues arise that have implications beyond a single unit.
Source: The Johns Hopkins Hospital, Baltimore, Maryland; Advisory Board interviews and analysis
”
Patient Safety Data Analyst
Job Duties:
• Review every safety event regardless of severity
• Tag events requiring attention in centrally accessible database
• Trend and analyse hospital-wide reported patient safety events
Aggregating Every Safety Event—Regardless of Severity 1 Events per bed per month
200 Events analysed per week
12,000 Events analysed per year
Hear about the evolution of Johns Hopkins’ quality department: advisory.com/ cob/Hopkins-QualityDept

©2013 THE ADVISORY BOARD COMPANY • ADVISORY.COM • 26143
6.1
0.7
68
Rates of Central-Line Associated Bloodstream Infections in Surgical Intensive
Care Units at Johns Hopkins Hospital Rate per 1,000 Central Line Days
Selected Results
Systematically Improving Safety
“Never Events” at the Johns Hopkins Hospital Before and After Quality
Improvement Intervention
2.7
9.3
2.1
3.6
Patient Falls Rate (per 1,000 patients)
Hospital Acquired Pressure Ulcers
(percentage of patients)
Before Intervention After Intervention
As a result of their investment in supporting the front line to lead quality improvement, Johns Hopkins has improved quality over the past decade. A few examples of their quality improvement results: their rate of central line infections in ICUs over the last ten years is now a fraction of the rate in 2001. This rate is exceptionally low given the acuity of patients that Hopkins treats. In addition, they have seen gradually decreasing rates of patient falls and hospital-acquired decubitus ulcers, successes for which they have received significant national recognition.
Source: Klein S, McCarthy D, “Johns Hopkins Medicine: Embedding Patient Safety in a University-Affiliated Integrated Health Care Delivery System,” The Commonwealth Fund, March 2011, 6; The Johns Hopkins Hospital, Baltimore, Maryland; Advisory Board interviews and analysis.
1) US News and World Report. 2) American Nurses Credentialing Center. 3) American Hospital Association.
Johns Hopkins Quality Awards
1990-2011 USNWR1 Hospital Honor Roll
2003+2008 ANCC2 Magnet Recognition
2007 US System Pharmacists Award
2004 AHA3 Award for Quality
Hear Johns Hopkins staff discuss the past decade’s culture change: advisory.com/ cob/Hopkins-CultureChange

©2013 THE ADVISORY BOARD COMPANY • ADVISORY.COM • 26143 69
Percentage of Respondents Reporting Each Individual as Actively or Very Actively
Involved in Quality Improvement
Common Barrier
Doctor Engagement Critical Yet Hard to Achieve
n=470
86% 77%
64% 64%
47%
Managers Senior Managers
CEO Nurses Doctors
The approach at Johns Hopkins focuses on engaging all frontline clinicians, with nurses taking a lead role.
For many institutions, however, engaging doctors is a more challenging problem. One study, shown here, suggests that medical staff are often the least involved in quality improvement efforts. In the course of this research, one health care leader from Sweden described the situation as follows: “for many decades, the culture in health care is that it’s an individual sport.”
Source: Cohen AB, et al., “A Survey of Hospital Quality Improvement Activities,” Medical Care Research and Review, May 2008; Advisory Board interviews and analysis.
No Accountability
“We try to engage clinicians and involve them in decisions, but virtually no doctor will ever come to a situation where they have to explain why they’re over budget or not hitting quality marks… And as a result there’s no accountability except for really gross clinical negligence.”
Chief Operating Officer Australian Public Hospital
” Lacking Team Spirit “The culture in health care is that it’s an individual sport.”
Göran Henriks Jönköping County Council
” Failing to Think Beyond the Individual Role “Doctors have gotten into a habit of thinking that they’re part of the team that’s in some sense detached from the rest of what’s going on, that they just need to do their bit well and others will pick up the pieces.”
Professor UK University
”

©2013 THE ADVISORY BOARD COMPANY • ADVISORY.COM • 26143 70
Quality Case Study
Overview: Baylor Health Care System
Case in Brief: Baylor Health Care System • 26-hospital not for-profit integrated health care delivery system in North Texas
• 125,000 inpatient admissions per year, US$5 billion annual net operating revenue
• In 2002, board refocused on ambitious quality and safety vision based on three goals: seeking no preventable deaths, injuries, or risk
• Goals achieved through three strategies: culture, processes, and technology
• Since 2002 BHCS has achieved significant improvements in quality metrics such as standardised mortality
The next case study focuses on an organisation that has successfully engaged doctors in improving quality by overcoming the same barriers to engagement: Baylor Healthcare.
The Baylor system is a 26-hospital system centred around Dallas, Texas. As with the other case study organsations, Baylor implemented all the steps in the quality framework: proving quality commitment and using data to drive improvement alongside its work to engage frontline clinicians.
Source: Advisory Board interviews and analysis.

©2013 THE ADVISORY BOARD COMPANY • ADVISORY.COM • 26143
Baylor Health Care System Board of Trustees Resolution
71
Baylor Health Care System Quality Aims
Catalyst for Change
Specific, Measurable Aims
“The Board of Trustees of Baylor Health Care System hereby challenges itself and everyone involved in providing health care throughout the system to give patient safety and continuous improvement in the quality of patient care the highest priority in the planning, budgeting, and execution of all activities in order to achieve significant, demonstrable and measurable positive improvement in the quality of patient care.”
Baylor’s transformational quality improvement began in 1999, when Baylor’s board hired its first chief quality officer. The chief quality officer worked with the board to develop a new quality plan for the organisation, including the resolution and goals shown here.
Baylor’s board decided that the system’s ultimate aim should be to create error-free care standards that avoid all preventable harm. This ambitious, measurable goal reiterates the first step for quality improvement discussed in column I: making a leadership decision to transform the organisation through quality and articulating an aspirational vision at the leadership level.
Source: Kennerly D, et al., “Journey to No Preventable Risk: The Baylor Health Care System Patient Safety Experience,” American Journal of Medical Quality, October 2010, 26(1) 43-52; Advisory Board interviews and analysis.
Aim Metric
No preventable deaths Hospital-standardised mortality ratio (HSMR)
No preventable injuries Rate of hospital-acquired adverse events, determined by random chart audit with Global Trigger Tool
No preventable risk

©2013 THE ADVISORY BOARD COMPANY • ADVISORY.COM • 26143 72
Acknowledging and Supporting Medical Leader Efforts
Baylor’s doctor champions are critical to the success of the system’s quality efforts.
These champions are informally identified by the leadership; they are typically clinicians held in high esteem by their peers and usually those who already have a relationship with the executive team.
Champions are asked to commit between four and sixteen hours per week to support Best Care Committee initiatives. Baylor has also made a commitment to pay for their time, an indication of the importance of this work to the health system.
The doctor champions must graduate from ABC Baylor, an in-house, intensive quality improvement education program.
The primary job of doctor champions at Baylor is to create care standards. This includes developing standardised order sets, as well as defining outcome measurements. Most importantly, though, champions influence peers to adopt these order sets. Baylor considers doctor champions and their clearly defined role to be instrumental in the system’s quality improvement success.
Lesson #5: Explicitly Define Doctor Champion Role
Making Quality Part of the Contract
Source: Emswiler T, Nichols L, “Baylor Health Care System: High-Performance Integrated Health Care,” The Commonwealth Fund, March 2009; Emswiler T, “Good News: How the Baylor Health Care System Disseminates Quality Improvement (Part II),” The New Health Dialogue Blog, 31 March 2009; Advisory Board interviews and analysis
1) USD. 2) Computerised physician order entry.
HealthTexas Provider Network (HTPN) Doctor Leader Formula
Number of doctor leaders needed = √(number of doctors)
Case in Brief: Baylor Health Care System’s Doctor Champions • Contractually agree to
commit 4-16 hours per week to support Best Care initiatives
• Hourly wage paid (below typical clinical rate) and set duties and expectations
• BCHS budgets $3 million1 annually for Doctor Champions
• Influence peers to adopt Best Care Committee initiatives, including use of electronic health records and CPOE2
“Alignment with doctors is nationally recognised by hospitals as a critical success factor in health care delivery and quality improvement.”
Dr Carl Couch
Director and Chairman of the Board of HTPN and Co-Chair of the Best Care Committee
”

©2013 THE ADVISORY BOARD COMPANY • ADVISORY.COM • 26143 73
Committee Gives Opportunities for Doctors to Take the Lead in Quality
To ensure that clinicians uniformly change practice in line with new order sets, Baylor supports its doctor champions with a complete quality infrastructure. At the heart of that infrastructure are the Best Care Committee and the Best Care Executive Committee.
The Best Care Committee has no authority to mandate clinical practice, yet their influence is such that once they pass an initiative it is expected that it will be adopted throughout all Baylor facilities.
To engage doctors in leading quality improvement, Baylor has tackled three obstacles. First, the lack of time: doctors are formally hired and paid to spend time on quality improvement. Second, the lack of training: the ABC Baylor program ensures that doctors are educated in quality improvement methodologies and other relevant skills. Finally, lack of ownership of quality improvement: by building their quality infrastructure around doctor champions, Baylor’s leadership makes it clear that they see system-level quality improvement as a core role for their doctors.
Creating a Forum for Collaboration
Source: Emswiler T, Nichols L, “Baylor Health Care System: High-Performance Integrated Health Care,” The Commonwealth Fund, March 2009; Advisory Board interviews and analysis.
1) Care that is safe, timely, effective, efficient, equitable, and patient-centred.
Best Care Executive Committee
• Reviews measurements of patient safety
• Ensures that other elements of STEEEP™1 commonly overseen by other bodies in the BHCS are achieved
• Works on improvement and implementation at the BHCS system and individual hospital levels
• Sets agendas for BCC meetings
Best Care Committee (BCC)
• Defines and develops implementation strategies for care improvement initiatives
• “Once the BCC passes an initiative, it is to be adopted across all facilities; BCC members will promote the adoption; adoption and impact will be monitored and used to promote continuous improvement of the care we deliver.”
Case in Brief: Baylor Health Care System Best Care Committee • Committee consists of a legislature-like body with over 100 voting
members, formed in 2001 in response to the board’s resolution on quality
• Co-chaired by the chief medical officer and chief nursing officer; all system quality officers, hospital presidents, clinical leaders, and doctor champions also members
• Passed more than two dozen major quality initiatives since March 2005; each BCC member responsible for implementing in home hospital

©2013 THE ADVISORY BOARD COMPANY • ADVISORY.COM • 26143
Risk-Adjusted Hospital Mortality Ratio (Actual Deaths/Expected Deaths)
74
Doctor Leadership Drives Baylor Improvement
Baylor Health Care System, 2004-2008
Care Quality Improvement Success
0.0
0.5
1.0
2004 2005 2006 2007 2008
Delivery of Evidence-Based Preventative Services
0%
50%
100%
Care Recommended or Delivered Care Delivered
Baylor has achieved steady reductions in the hospital’s risk-adjusted mortality rate, as well as a steady increase in the delivery of evidence-based preventative services to adults. These results reflect across-the-board efforts to improve adherence to evidence-based care through the leadership of their medical staff.
Source: Emswiler T, Nichols L, “Baylor Health Care System: High-Performance Integrated Health Care,” The Commonwealth Fund, March 2009; Advisory Board interviews and analysis.
Baylor Health Care System, 2000-2008

©2013 THE ADVISORY BOARD COMPANY • ADVISORY.COM • 26143 75
Sentara’s Process Persuades Unwilling Doctor Participants
Safety Champion Selection Process at Sentara
For some organisations, too few influential senior doctors are willing to begin quality improvement work of this type.
Sentara Healthcare, our first case study, initially faced this challenge. Their effective but somewhat risky answer was simply to select 65 of their most influential doctors as safety champions. Those selected were not necessarily safety enthusiasts.
Leaders persuaded doctors to participate by pointing to the broader benefits of improved safety, including greater efficiency and the prestige that comes with being associated with a hospital renowned for high safety standards. Perhaps most effectively, they published a list of safety champions on their website. One hospital even placed a large poster in its lobby with the names of all its safety champions. In some cases, patients looked for their doctors on the list, and as a result, other doctors asked to be part of the program.
Over time, the doctor safety champion position has changed from an extra task to a sought-after status symbol. Sentara has nearly doubled its number of champions.
Formalising Clinician Leadership
Giving a Public “Push”
Source: Sentara Healthcare, Norfolk, Virginia; Advisory Board interviews and analysis.
Selection 65 safety champions formally selected based on influence over peers
Training Safety champions trained in error-prevention techniques and leadership skills
Demonstration Safety champions model safety habits for peers
Four Approaches to Encourage Participation
1) Safety efforts improve efficiency by avoiding costly errors
2) Position earns respect of other clinicians
3) Champions receive public recognition; safety champion icon appears next to name on hospital website
4) Hospital safety improvement lifts personal reputation by association
1 2 3

©2013 THE ADVISORY BOARD COMPANY • ADVISORY.COM • 26143 76
Vital to Reframe Quality Department Function to Support Doctor Leadership
Johns Hopkins and Baylor take very different approaches to overcoming the three barriers of time, training, and ownership, yet their approach shares one common element: in each case they changed the way their quality department worked. Instead of “running quality,” the department’s primary job was to support the front line in solving problems.
This type of quality department exists in every case study organisation. It provides support, expertise, training, and even strategic planning and oversight for resource allocation. But ownership of quality improvement work is always left firmly with medical staff champions and clinicians at the front lines; quality staff fill the role of a support team for all frontline staff.
Build Support Infrastructure
Crafting New Role for Quality Department
Source: Advisory Board interviews and analysis.
Traditional Quality Department
Front Line-Focused Quality Support Team
• Monitors and improves care quality in the hospital
• Prioritises and selects quality initiatives that the institution pursues
• Conducts root cause analyses, draws process map
• Oversees implementation of quality improvement
• Selects and tracks metrics to measure outcomes; reports on results
• Doctor leaders and other clinicians accountable for care quality in their departments
• Quality team provides assistance with data analysis, project planning
• Supports frontline design, testing, and implementation of solutions
• Trains doctor leaders and frontline clinicians in quality improvement and project management methodologies

©2013 THE ADVISORY BOARD COMPANY • ADVISORY.COM • 26143 77
Empowerment Breeds Culture of Involvement
To successfully transform quality, all case study organisations examined in this research worked to address the three barriers to frontline leadership of quality: lack of time, training, and perceived of ownership of system quality improvement. In each case, overcoming these barriers led to a virtuous cycle.
As more clinicians feel empowered to lead quality improvement, that empowerment leads them to become involved. The more clinicians are involved, the more pressure develops within the organisation to lower barriers to action, which in turn increases empowerment.
While quality is a never-ending effort, as the frontline staff feel enfranchised to lead quality improvement efforts, this endeavour takes root in an organisation and becomes stronger over time.
By empowering the front line to improve quality systems, and explicitly defining the doctor champion role, organisations can ensure that they have the absolutely critical support of frontline and medical staff that is necessary to overcome the problem of complexity.
Support Frontline Leadership
Reaching Critical Mass
Source: Advisory Board interviews and analysis.
Involvement Greater staff involvement in quality improvement is visible and celebrated aspect of hospital culture; champions increasingly communicate importance to other clinicians
Empowerment Understood throughout organisation that staff members have time, resources, and executive encouragement to develop quality improvement projects
Increased number of staff involved creates organisational pressure that lowers barriers to action
Responsibility to define quality improvement projects motivates increased staff involvement

©2013 THE ADVISORY BOARD COMPANY • ADVISORY.COM • 26143 78
Action Items to Support Frontline Leadership
Self-Test Questions
Evaluate Quality Department Function
• Is the role of the organisation’s quality department to support frontline clinicians to improve quality?
• Are quality department staff appropriately equipped to provide resources and analytics to frontline improvement projects?
• Do clinicians engaged in quality improvement spend the majority of their time working on tasks that require their specific expertise?
Consider In-House Quality Training for Clinicians
• Do clinicians working on quality improvement understand basic quality improvement principles, data analysis, and project management skills?
• Are staff actively encouraged and supported to extend quality improvement skills alongside clinical skills?
Assess Barriers to Frontline Participation
• Are interested staff able to apply for dedicated time to focus on quality work?
• Is it easy for staff to begin to participate in quality initiatives?
The following questions are intended to assist members in prioritising areas for improvement in supporting front line leadership of quality. A majority of “no” answers in any area indicates an opportunity for improvement.
Source: Advisory Board interviews and analysis.

©2013 THE ADVISORY BOARD COMPANY • ADVISORY.COM • 26143 79
Lesson 6: Set Data Expectations
Lesson 7: Establish Comprehensive Clinical Data Infrastructure
Lesson 8: Enable Principled Clinician Autonomy
Lesson 9: Educate Clinicians in Data-Driven Quality Improvement
Embed a Culture of Measurement
Column III

©2013 THE ADVISORY BOARD COMPANY • ADVISORY.COM • 26143 80
Embed Culture of Measurement
Data-Driven Culture Fosters Constant Improvement
13.2% 13.3%
19.5% 19.3%
2006 2007
High Performing Low Performing
After leaders have made a commitment to transformational quality and enfranchised frontline staff to lead quality efforts, the final critical step is to develop a culture of measurement. Each of the case study institutions profiled in this study measured current circumstances to understand where and how they could improve, and to prove the effectiveness of their changes.
The research suggests that once clinicians begin to examine accurate quality data, their natural competitiveness and professional ethics drive improvement. In one study, researchers at Yale University found that a data-focused approach to quality was one of the hallmarks of hospitals that achieved the best outcomes in acute myocardial infarction care.
.
Source: Curry, et al., "What Distinguishes Top-Performing Hospitals in Acute Myocardial Infarction Mortality Rates? A Qualitative Study," Annals of Internal Medicine, 2011 (154):384-390; Advisory Board interviews and analysis.
1) Percentage of risk-standardised deaths in-hospital. 2) Acute myocardial infarction.
Distinguishing High- and Low-Performing Hospitals
“Doctors in low-performing hospitals were in particular not looking at data in a proactive or constructive way, there was resistance. I can remember one QI director at a local hospital talking about it being impossible to get doctors to look at quarterly reports. Doctors in high-performing hospitals have their noses in the data constantly.”
Professor, Health Policy
Yale University
”
Risk-Standardised Mortality Rates1 for AMI2 of High- and Low-Performing Hospitals
Evoking a Sense of Competition “Doctors are sportsmen, they hate to lose and they hate to do badly or not be the best. The improvement work always has to touch their hearts in clinical performance, so if you can show them their clinical performance isn’t good enough, I haven’t met a doctor yet that doesn’t want to participate.”
Göran Henriks Quality Development Director, Swedish County Council
”
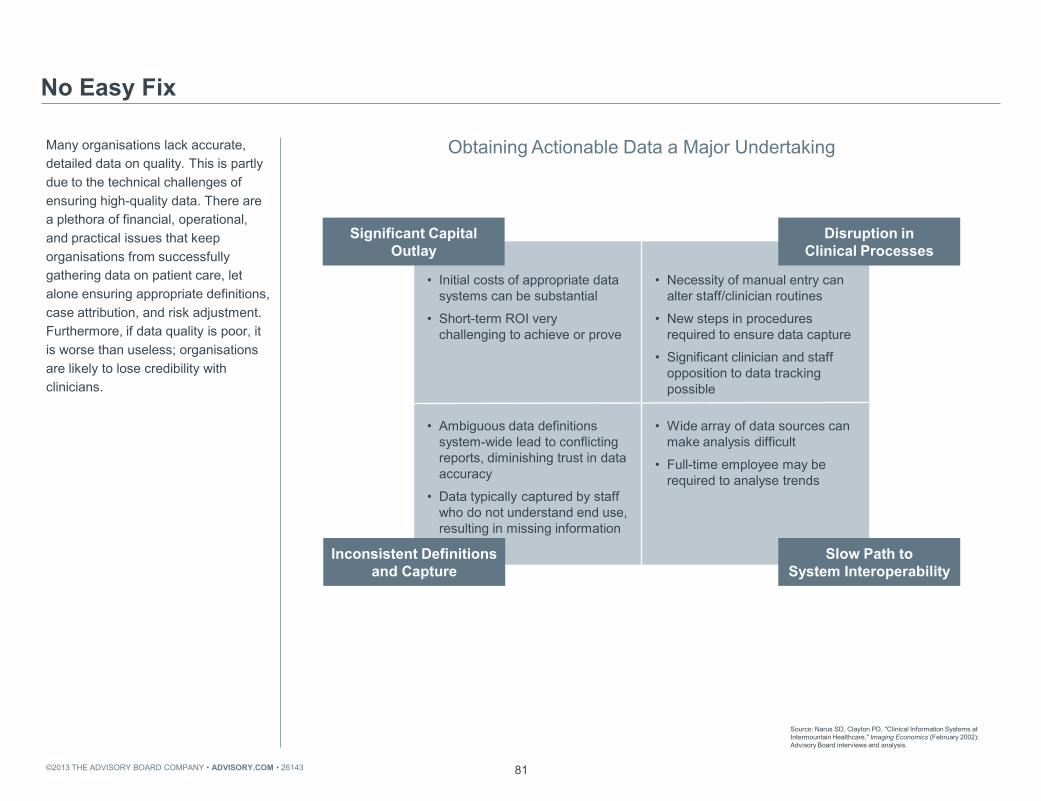
©2013 THE ADVISORY BOARD COMPANY • ADVISORY.COM • 26143 81
Obtaining Actionable Data a Major Undertaking
Many organisations lack accurate, detailed data on quality. This is partly due to the technical challenges of ensuring high-quality data. There are a plethora of financial, operational, and practical issues that keep organisations from successfully gathering data on patient care, let alone ensuring appropriate definitions, case attribution, and risk adjustment. Furthermore, if data quality is poor, it is worse than useless; organisations are likely to lose credibility with clinicians.
No Easy Fix
Source: Narus SD, Clayton PD, "Clinical Information Systems at Intermountain Healthcare," Imaging Economics (February 2002); Advisory Board interviews and analysis.
Significant Capital Outlay
Inconsistent Definitions and Capture
Disruption in Clinical Processes
Slow Path to System Interoperability
• Ambiguous data definitions system-wide lead to conflicting reports, diminishing trust in data accuracy
• Data typically captured by staff who do not understand end use, resulting in missing information
• Initial costs of appropriate data systems can be substantial
• Short-term ROI very challenging to achieve or prove
• Wide array of data sources can make analysis difficult
• Full-time employee may be required to analyse trends
• Necessity of manual entry can alter staff/clinician routines
• New steps in procedures required to ensure data capture
• Significant clinician and staff opposition to data tracking possible

©2013 THE ADVISORY BOARD COMPANY • ADVISORY.COM • 26143 82
Doctors Who Believe Their Quality Data Is Accurate
Clinicians Often Wary of Measurement
n=556
Making Doctors Believe “There’s absolutely no question that clinician change will be driven by good data. But a huge problem is making doctors believe it. If we have people arguing about the data rather than the quality initiative itself, then we’re dead in the water before we start.”
Chief Executive, Australian Health District
A cultural obstacle exacerbates the data challenge. Doctors’ resistance to measurement of their performance is often deeply entrenched, even when there are no objections to data quality. Providing data-driven performance feedback is also a challenge; many medical staff leaders may lack the opportunity or the skills to deliver this feedback effectively. Despite facing scepticism initially, however, these case study organisations found that high-quality data was ultimately an essential tool to motivate quality improvement among clinicians.
Source: Casalino LP, et al., “General Internists’ Views on Pay for Performance and Public Reporting of Quality Scores: A National Survey,” Health Affairs, 2007, 26: 492–499; Advisory Board interviews and analysis.
Common Doctor Pushback
• “Doctor performance can’t be
accurately measured”
• “A colleague or nurse caused these outcomes”
• “This isn’t my case”
• “This data does not give the full story of what happened”
” 30%
Agree Disagree
70%
©2013 THE ADVISORY BOARD COMPANY • ADVISORY.COM • 26143 83
Quality Case Study
Overview: Intermountain Healthcare
Case in Brief: Intermountain Healthcare • 23-hospital not-for-profit system headquartered in Salt Lake City, Utah
• Over 32,000 employees and 3,000 affiliated doctors system-wide
• Created Institute for Health Care Delivery Research in 1990 to improve clinical quality by providing support, education for clinical research and delivery management
• Implemented quality and safety metric targets based on extensive consultations with doctors and other staff members
• Substantial increase in adherence to evidence-based practice, cost savings realised
• Ranked number one integrated health system in the United States 5 out of last 12 years1
To examine the practical steps for embedding a culture of measurement into an organisation, this study will examine Intermountain Healthcare. Intermountain is a 23-hospital system based in Utah, with over 32,000 employees and 3,000 affiliated doctors. It is nationally recognised for its pioneering efforts with information systems and quality.
Source: Intermountain Healthcare, Salt Lake City, Utah; Advisory Board interviews and analysis. 1) By Modern Healthcare 2000-2011.
Access all Intermountain Healthcare case study videos here: advisory.com/ cob/Intermountain
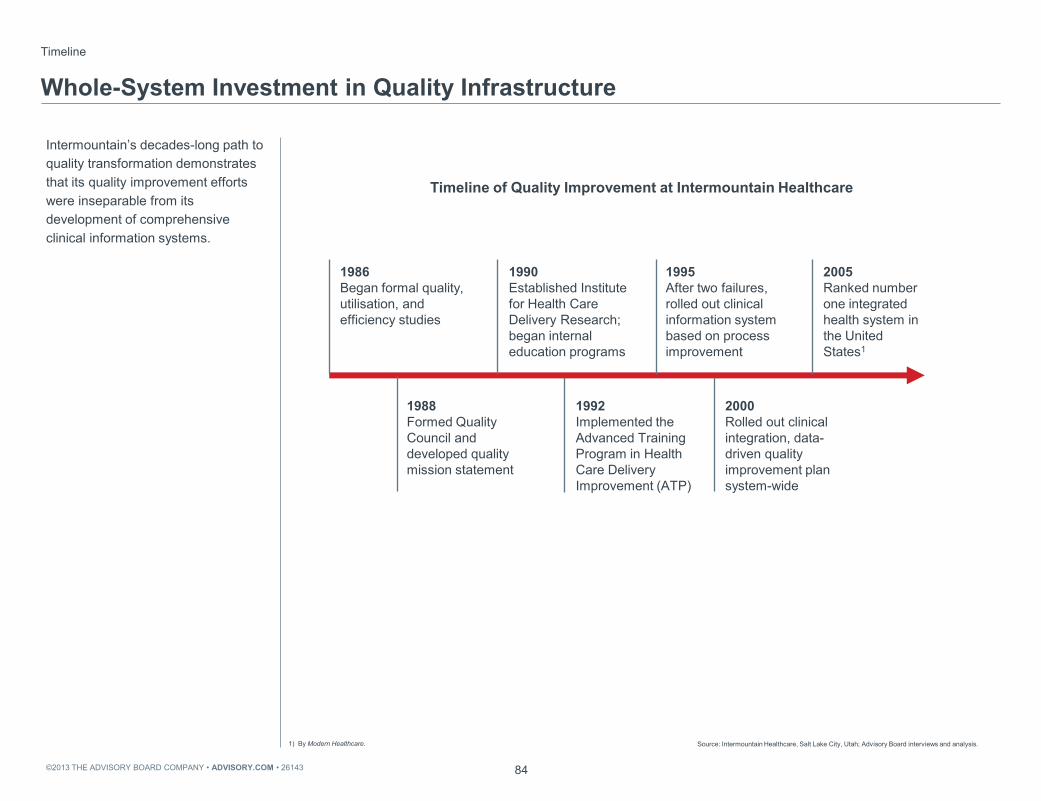
©2013 THE ADVISORY BOARD COMPANY • ADVISORY.COM • 26143 84
Timeline of Quality Improvement at Intermountain Healthcare
Timeline
Whole-System Investment in Quality Infrastructure
Intermountain’s decades-long path to quality transformation demonstrates that its quality improvement efforts were inseparable from its development of comprehensive clinical information systems.
Source: Intermountain Healthcare, Salt Lake City, Utah; Advisory Board interviews and analysis.
1) By Modern Healthcare.
1988 Formed Quality Council and developed quality mission statement
1990 Established Institute for Health Care Delivery Research; began internal education programs
1986 Began formal quality, utilisation, and efficiency studies
1995 After two failures, rolled out clinical information system based on process improvement
1992 Implemented the Advanced Training Program in Health Care Delivery Improvement (ATP)
2000 Rolled out clinical integration, data-driven quality improvement plan system-wide
2005 Ranked number one integrated health system in the United States1

©2013 THE ADVISORY BOARD COMPANY • ADVISORY.COM • 26143 85
Estimating the Financial Impact of System-Wide Rollout
Catalyst for Change
Small Studies Suggest Promising Future Direction
Compelling Numbers
In the late 1980s and early 1990s, researchers at Intermountain implemented a number of successful projects to reduce variation, for example in hip replacement surgeries. In 1995, Intermountain’s board asked the quality research groups to assess the system’s progress. The researchers found that reductions in variation from 65 projects had saved approximately US$30 million since these projects had started.
This impressive achievement was a catalyst for the organisation to expand their ambitions. The executive team realised that if those 65 projects had been successfully implemented across the entire system they could have saved an additional US$100 million to US$150 million per year, 10% of total annual operating costs at the time.
Armed with the information that improving quality could also reduce costs, Intermountain’s board developed a new strategic plan for the system. The plan inaugurated the organisation’s relentless focus on reducing clinical variation, which has become the system’s defining characteristic and is central to its successful quality improvement.
Source: James B, Savitz LA, “How Intermountain Trimmed Health Care Costs Through Robust Quality Improvement Efforts,” Health Affairs, 30(6), May 2011; Intermountain Healthcare, Salt Lake City, Utah; Advisory Board interviews and analysis.
“Faced with such compelling numbers, Intermountain’s leaders demanded a strategic plan that would make clinical quality the system’s core business strategy.”
Brent James, Chief Quality Officer and Executive Director Intermountain Healthcare
” Early Approaches to Quality
• From 1991 to 1995, 65 different safety interventions implemented at various Intermountain hospitals
• Estimated $30 million in documented savings from these projects
Savings from System-Wide Integration
$100M-$150M
Potential savings from system-wide integration of quality improvement
6%-10% Total annual system operating costs represented by these savings

©2013 THE ADVISORY BOARD COMPANY • ADVISORY.COM • 26143 86
Data-Based Quality Becomes Core Business Strategy
Intermountain’s Process to Reduce Variation
“Reducing variation” sounds simple, but it essentially means “asking doctors to change practice,” an exceptionally difficult challenge. For this reason, unless hospital leadership sets the expectation that the institution will focus on data-driven quality improvement, a culture of measurement will not take root.
On the surface, Intermountain’s process for reducing variation follows a similar pattern to that at many organisations. First, the system prioritises where to focus. Reducing variation is a resource-intensive process, so Intermountain’s leaders find it essential to identify the most leveraged areas across the system. Second, they define best known clinical practice, using a highly collaborative process. Third, they measure compliance with best known clinical practice and the care outcomes achieved. Finally, they employ multiple strategies to convince clinicians to change practice. The remainder of this section explores in greater depth how they achieve this.
This process is iterative: each clinical area constantly reviews and revises processes and metrics to adopt new evidence and technologies.
Lesson #6: Set Data Expectations
A Relentless Focus on Reducing Variation
Source: James B, Savitz LA, “How Intermountain Trimmed Health Care Costs Through Robust Quality Improvement Efforts,” Health Affairs, 30(6), May 2011; Intermountain Healthcare, Salt Lake City, Utah; Advisory Board interviews and analysis.
1) Clinical programs at Intermountain include: behavioral health, cardiovascular, intensive medicine, Intermountain homecare, oncology, quality & patient safety, pediatric specialties, primary care, primary children's medical center, rural facilities, surgical services, women and newborns.
1
Prioritise Key Processes
2
Determine Best Known Practice
3
Measure Compliance and Outcomes
4
Change Clinical Practice
Identify clinical procedures for improvement based on volume, cost, and risk
Develop internal structures to define best known care for key processes
Install data systems capable of measuring clinical processes and clinical outcomes
Use data and education to change clinician behaviours
7% of all clinical processes found to account for 95% of all care delivery costs—104 processes in total targeted in initial efforts
12 doctor-led clinical programs1 developed to ensure organisation-wide clinician and academic input on processes
Integrated clinical and administrative data systems to enable measurement; hired data analysts to ensure effective use of data
12 doctor-led clinical programs1 developed to ensure organisation-wide clinician and academic input on processes

©2013 THE ADVISORY BOARD COMPANY • ADVISORY.COM • 26143 87
Standards Development Infrastructure Permits Whole-Organisation Collaboration
To create a clinical guideline, Intermountain begins by convening a small development team of clinicians and academic experts.
After creating a first draft of the guideline, the development team solicits feedback from clinicians who did not participate in the initial development process. To do this, Intermountain has established a hierarchy of committees at the system, regional, and hospital level, one for each clinical area. Each of these hierarchies, called “clinical programs,” operates independently of the administrative structure to design processes that reduce variation across the entire system, not just within each hospital. This independent, organisation-wide structure is essential, as it allows clinicians on the development teams to proactively gain buy-in from all of their peers for new clinical standards.
The clinical program leadership teams have no formal power, but rather operate by influence alone to ensure adoption of standardised clinical processes. Their broad reach enables them to build consensus for new process standards throughout the system.
Governance Model Assembled Around Measurement
Source: GR Baker, "Intermountain Healthcare," High Performing Healthcare Systems: Delivering Quality by Design (Toronto: Longwoods Publishing, 2007), 151-178; Intermountain Healthcare, Salt Lake City, Utah; Advisory Board interviews and analysis.
1) Clinical programs at Intermountain include: behavioral health, cardiovascular, intensive medicine, Intermountain homecare, oncology, quality & patient safety, pediatric specialties, primary care, primary children's medical center, rural facilities, surgical services, women and newborns.
Clinical Program Governance Structure
Executive Team
Clinical Program Guidance Council
• Clinical program doctor leader • Nurse administrator • Regional administrators
• Information systems • Finance • Support structures
Urban North Region
Urban Central Region
Urban South Region
Hospitals Hospitals Hospitals
Clinical Program Management Team
• Senior VP of Hospitals, Clinics and Doctors
• Clinical Program Leaders: doctor lead (1/4 FTE), nurse lead, data analytics lead
• Senior administrative executives • Finance • Support staff (statisticians, data
analysts)
12 Organisation-wide clinical programs1

©2013 THE ADVISORY BOARD COMPANY • ADVISORY.COM • 26143 88
Critical Elements of Successful Variation Reduction at Intermountain
Many organisations have tried similar approaches to improve quality by reducing variation. What sets Intermountain’s process apart, and explains its success, are three underpinning elements.
First, recognising the critical role that good data plays in persuading clinicians to standardise practice, Intermountain has invested heavily in developing an IT system capable of accurately and concretely measuring adherence to clinical pathways, as well as the outcomes resulting from them, in a way that does not add to clinicians’ workload.
Second, Intermountain has recognised that zero clinical variation is often a foolish goal, since few protocols will be appropriate for every patient. For this reason, they ask doctors to use their professional judgement to determine when protocols are not right for a particular patient, instead of mandating compliance.
Finally, the system has developed a wide-ranging education program for clinicians to help them understand the work of reducing variation and to make their participation in the process more valuable.
Underlying Factors for Success
Source: Advisory Board interviews and analysis.
Intensive Quality Improvement Education
Widespread in-house quality education program provides shared understanding of variation reduction goals and methods
Comprehensive Clinical Data Infrastructure
Homegrown IT system supported by data analysts and statisticians enables access to exhaustive clinical process and outcomes data
Principled Clinician Autonomy
Clinicians authorised to treat patients based on best clinical judgement when this deviates from defined care standard
Case in Brief: Institute for Health Care Delivery Research
• Works with Intermountain board of directors to improve the quality of care throughout the system
• Provides analytical and data support for specific projects within clinical integration rollout • Educates Intermountain staff in quality improvement methodology

©2013 THE ADVISORY BOARD COMPANY • ADVISORY.COM • 26143 89
Simplified Model of Intermountain Healthcare Data System
When Intermountain began working to reduce variation, its data systems were not yet capable of analysing clinical practice variation across the system.
An outline of the data infrastructure at Intermountain at the time of writing is shown here. The system has proven successful for three main reasons, detailed below.
The data system is extremely integrated, consolidating information from a patient’s administrative record, clinical treatment record, and financial record to enable a complete picture of clinical practice.
Intermountain has embedded risk adjustments and activity-based costing into the system to enable comparison of the clinical and financial outcomes of patients treated by different clinicians.
The system operates on the principle that electronic systems should enable clinicians to be more efficient and provide higher quality care. It is designed to be as simple to use as possible, as well as to support clinicians in making good clinical decisions.
Lesson #7: Establish Comprehensive Clinical Data Infrastructure
Building a Clinical Data System to Reduce Variation
Source: Narus S, Clayton P, “Clinical Information Systems at Intermountain Health Care,” Imaging Economics, 2002; Advisory Board interviews and analysis.
Key Data System
Elements
• Single unique identifiers for each patient
• Built-in case mix risk adjustment
• Rigorous focus on smooth workflow integration and increased efficiency compared with paper-based system
• Decision support to enable improved decision making and fewer errors
Enterprise data
warehouse
Billing and financial data
Clinical data repository
HELP 2 (Electronic Patient Record)
Interface engine
Health data dictionary
Ancillary services
(laboratory, radiology, pharmacy)

©2013 THE ADVISORY BOARD COMPANY • ADVISORY.COM • 26143 90
Shifting from External Metrics to Clinically Driven Process Measurement
The type of data that Intermountain collects and analyses is significant. In previous attempts to develop clinical data systems, Intermountain had focused on what it termed “measurement for selection”; that is, the types of quality metrics required by external bodies to assess performance. However, two attempts to implement clinical standardisation had failed when using these cost and outcome-focused metrics generated through the administrative and financial data systems.
This experience suggested to Intermountain’s leaders that in order to reduce variation, they needed to focus on evidence-based clinical processes, not clinical outcomes. This data enables them to prove that certain processes lead to better outcomes, giving them a concrete way to communicate the need for standardisation to doctors. They call this “measurement for improvement,” and it is the backbone of a data system that can support reducing variation.
Redirecting Data Focus
Source: James B, Savitz LA, “How Intermountain Trimmed Health Care Costs Through Robust Quality Improvement Efforts,” Health Affairs, 30(6); Intermountain Healthcare; Salt Lake City, Utah; Advisory Board interviews and analysis.
Measurement for Selection
Measurement for Improvement
• Quality measurement focused on defining and measuring evidence-based clinical processes
• Generates data for frontline care improvement
• Still generates relevant data for external measurement
• Quality metrics determined externally, often by several different institutions; focus on outcomes metrics
• Ranks performance of care providers
• Used by consumers and other relevant parties to chose hospitals
Building Data Around the Front Lines Inefficient Data Capture
30%-50% Percentage of necessary clinical data missed by early quality management systems
“I think if we had just taken administrative data out to the physicians…well, reading the riot act is too strong, but I don’t think they would’ve responded favourably. What they’re interested in is quality data built around what they do every day.”
Matt Weed, Director of Urban Strategic Planning, Intermountain Healthcare
”
For sample Intermountain Metrics for Tracking Labour and Delivery, please see appendix p. 116

©2013 THE ADVISORY BOARD COMPANY • ADVISORY.COM • 26143 91
Allowing Process Refinement, Doctor Feedback
No order set or protocol will cover every situation, and Intermountain does not expect complete compliance with all protocols. When clinicians disagree with the standardised guideline, they are invited to practice in accordance with their clinical judgement and record the reason for the exception.
Over time, Intermountain tracks outcomes for patients who receive care in accordance with the guidelines and patients who receive different care.
Where outcomes are better due to deviations from the standard guideline, Intermountain’s data system recognises this fact and the guidelines are revised to incorporate improvements. However, when patient outcomes are worse, that feedback is provided to doctors and they are required to change practice to adhere to the evidence-based guideline.
Lesson #8: Enable Principled Clinician Autonomy
Leaving Room for Professional Judgement
Source: Intermountain Healthcare, Salt Lake City, Utah; Advisory Board interviews and analysis.
Doctor feels standardised process not viable for patient subset
Treats patients based on clinical judgment; records reason for patient exception
Outcome of variation measured by Intermountain data team
Favourable outcome: Data, lessons incorporated into new order set for procedure
Unfavourable outcome: Feedback, recommendations provided to doctor for similar future procedures
Method in Brief: Principled Variation
• Allows Intermountain staff to deviate from standardised order sets based on clinical experience, case evidence
• Doctors treat patients based on individual needs, resources; clinical data used to determine whether practice variation leads to better outcome
• Data incorporated into future order set refinements
Process for Principled Variation at Intermountain
Learn more about principled clinician autonomy at Intermountain: advisory.com/ cob/Intermountain-Variation
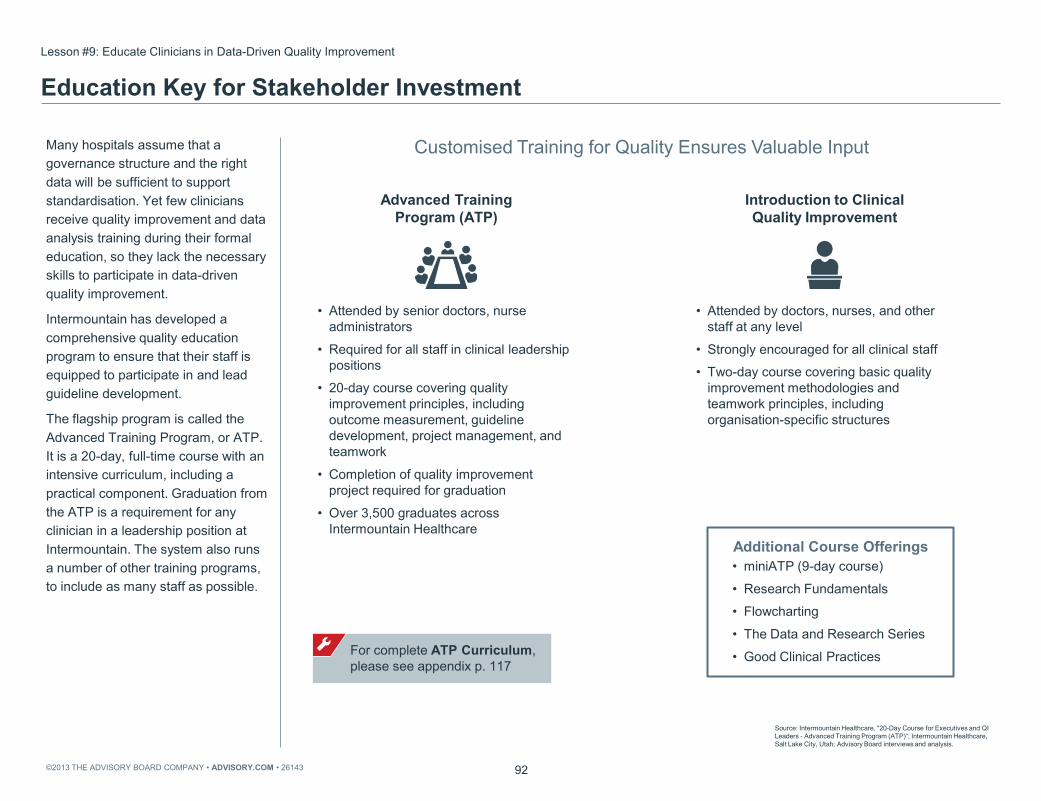
©2013 THE ADVISORY BOARD COMPANY • ADVISORY.COM • 26143 92
Customised Training for Quality Ensures Valuable Input
Advanced Training Program (ATP)
Many hospitals assume that a governance structure and the right data will be sufficient to support standardisation. Yet few clinicians receive quality improvement and data analysis training during their formal education, so they lack the necessary skills to participate in data-driven quality improvement.
Intermountain has developed a comprehensive quality education program to ensure that their staff is equipped to participate in and lead guideline development.
The flagship program is called the Advanced Training Program, or ATP. It is a 20-day, full-time course with an intensive curriculum, including a practical component. Graduation from the ATP is a requirement for any clinician in a leadership position at Intermountain. The system also runs a number of other training programs, to include as many staff as possible.
Lesson #9: Educate Clinicians in Data-Driven Quality Improvement
Education Key for Stakeholder Investment
Source: Intermountain Healthcare, "20-Day Course for Executives and QI Leaders - Advanced Training Program (ATP)“; Intermountain Healthcare, Salt Lake City, Utah; Advisory Board interviews and analysis.
Introduction to Clinical Quality Improvement
• Attended by senior doctors, nurse administrators
• Required for all staff in clinical leadership positions
• 20-day course covering quality improvement principles, including outcome measurement, guideline development, project management, and teamwork
• Completion of quality improvement project required for graduation
• Over 3,500 graduates across Intermountain Healthcare
• Attended by doctors, nurses, and other staff at any level
• Strongly encouraged for all clinical staff
• Two-day course covering basic quality improvement methodologies and teamwork principles, including organisation-specific structures
Additional Course Offerings
• miniATP (9-day course)
• Research Fundamentals
• Flowcharting
• The Data and Research Series
• Good Clinical Practices For complete ATP Curriculum, please see appendix p. 117

©2013 THE ADVISORY BOARD COMPANY • ADVISORY.COM • 26143 93
Training Program Yields Quantifiable Return on Investment
Proportion of Intermountain ATP1 and miniATP Project Presentations Demonstrating Statistically
Significant Movement Towards Project Aims
The intense training offered by the Advanced Training Program course may seem like a big investment. However, data points shown here indicate that the ATP course has proved a valuable investment for Intermountain in its own right.
All ATP attendees complete a quality improvement project during the course, and an increasing proportion of these projects have demonstrated a statistically significant improvement. Quality leaders at Intermountain have estimated that they achieve a four- to six-fold financial return on their investment in the ATP course simply from these improvement projects, including the cost of running the course and the opportunity cost of staff taking time to attend.
Achieving Results Beyond Skill Development
Source: Gomez J, "Setting New Standard in Reducing Deaths from Life-Threatening Blood Infections," LDS Hospital, 5 June 2010; James B, Savitz LA, "How Intermountain Trimmed Health Care Costs Through Robust Quality Improvement Efforts," Health Affairs, 30(6), 2011; Intermountain Healthcare, Salt Lake City, Utah; Advisory Board interviews and analysis.
1) Advanced Training Program. 2) Including the cost of the time that health professional attending the course spent away
from their work.
400%-600% Estimated return on investment of quality improvement training course from savings realised by improvement projects2
0.15
0.72
1 3 5 7 9 11 13 15 17 19 21 23 25 27 29 31 33 35
Program Number
Watch one ATP attendee discuss how the course changed his practice: advisory.com/ cob/Intermountain-atp

©2013 THE ADVISORY BOARD COMPANY • ADVISORY.COM • 26143 94
Adverse Drug Events with Injury at Intermountain
Per 1,000 Patient Days
Selected Results
Data-Driven Improvement
3.2
1.4
2007 2008 2009 2010 2011
Results of Selected Intermountain Quality Improvement Interventions
27.0%
13.0%
4.5%
22.7%
9.3%
3.2% 3.5%
17.8%
Sepsis mortality rate
VAP cases per 1,000
ventilator days
IHD 1-year mortality rate
CHF 1-year mortality rate
Before Intervention After Intervention
A selection of data shown here indicates the size of the quality improvements that Intermountain has realised by focusing on reducing variation. Among other achievements, there has been a decrease in mortality from sepsis by almost two-thirds, and for the last 12 years Intermountain has been listed among the top integrated health care systems in the United States by Modern Healthcare’s rankings.
Source: Intermountain Healthcare, Salt Lake City, Utah; Advisory Board interviews and analysis
1) Ventilator acquired pneumonia. 2) Ischaemic heart disease. 3) Chronic heart failure. 4) College of Healthcare Information Management Executives.
Intermountain Quality Awards 2001-2012 Listed among the top Integrated HC Systems in the US (Modern Healthcare)
2011: CHIME4 recognition for IT leadership in health care delivery
2011: Eight Intermountain hospitals recognised in US News and World Report’s “Best Hospitals” list
2000-2011: Ranked by Hospitals and Health Networks as one of the most “wired” hospitals
Hear one leader discuss how data and quality are connected at Intermountain: advisory.com/ cob/Intermountain-CultureChange
1 2 3

©2013 THE ADVISORY BOARD COMPANY • ADVISORY.COM • 26143 95
Leadership Steps to Embed a Culture of Measurement
Four steps—setting data expectations, establishing a comprehensive clinical data infrastructure, enabling principled autonomy, and educating clinicians in quality improvement—have built a culture of measurement at Intermountain.
Clinicians practicing at Intermountain trust that the data system produces accurate information about their patients and do not feel compelled to practice against their judgement. They are aligned with the main goal of the organisation: reducing variation.
These leadership steps proved essential to developing an organisation-wide culture of measurement at each case study institution.
Embed a Culture of Measurement
Data Success Impossible Without Culture Shift
Source: Advisory Board interviews and analysis.
Establish comprehensive clinical data infrastructure
Set data expectations
Enable principled clinician autonomy
Educate clinicians in data-driven quality improvement

©2013 THE ADVISORY BOARD COMPANY • ADVISORY.COM • 26143 96
These questions are designed to help members evaluate their organisation’s progress towards embedding a culture of measurement, and to identify the most leveraged areas of effort. A majority of “no” answers in any area indicates an opportunity for improvement.
Action Items to Embed Culture of Measurement
Source: Advisory Board interviews and analysis.
Self-Test Questions
Assess Data Quality
• Is quality data as accurate as possible?
• Is quality data appropriately risk adjusted?
• Are consistent methods of case attribution used?
Evaluate Current Data Culture
• Do all quality improvement projects use valid quality metrics to measure baseline and improvement?
• Do clinicians and non-clinical leaders base internal reports and presentations on clear clinical quality data?
Educate and Involve Clinicians in Metric Selection and Use
• Are all clinical staff affected by performance data given the opportunity for involvement in metric selection?
• Are staff educated to understand quality improvement data?
• Are clinician leaders equipped to overcome doctor objections to data?

©2013 THE ADVISORY BOARD COMPANY • ADVISORY.COM • 26143 97
Future Prospects Expanding the Ambition
Coda

©2013 THE ADVISORY BOARD COMPANY • ADVISORY.COM • 26143 98
Quality Case Study
Overview: Rotterdam Eye Hospital
Case in Brief: Rotterdam Eye Hospital • Independent specialty eye hospital located in Rotterdam, Netherlands, conducting
14,000 surgeries and managing 14,000 outpatient visits per year
• 30 independent ophthalmologists, 21 residents, 400 staff members
• Threat of takeover by academic hospital in early 1990s drove hospital leadership to focus on improving care delivery
• Focused on learning from other industries, in particular aviation, to improve care safety and efficiency; created patient-centred care models and design aimed at reducing fear during treatment
• Achieved dramatic decrease in wrong-site surgeries and steady rise in patient satisfaction scores
This final section examines a case study of Rotterdam Eye Hospital. Rotterdam is the only specialty eye hospital in the Netherlands. It is a major referral centre and teaching hospital, performing approximately 14,000 surgeries annually as well as managing 14,000 outpatient visits. There are approximately 30 independent ophthalmologists on the medical staff.
Although engendering clinician leadership of quality is the ultimate path to success, the Rotterdam case study demonstrates the progress that can be made in quality with executive leadership alone, in a situation where it is too challenging to engage clinical staff in the short term.
Rotterdam Eye Hospital is a highly innovative organisation, and this case study highlights several themes that are important at all of our case study organisations and suggests a future
direction of quality improvement.
Source: Rotterdam Eye Hospital, Rotterdam, Netherlands; Advisory Board interviews and analysis.
Access all Rotterdam Eye Hospital case study videos here:
advisory.com/cob/Rotterdam

©2013 THE ADVISORY BOARD COMPANY • ADVISORY.COM • 26143 99
Timeline of Quality Improvement at Rotterdam Eye Hospital
The catalyst for Rotterdam’s quality journey was an external threat. In the 1990s, the Dutch government began an initiative to close all specialty hospitals and merge them with local university hospitals to ensure adequate case volumes for specialty services.
The leadership of the eye hospital felt that their patients and staff would fare better if the hospital remained open and independent, rather than becoming marginalised in a larger institution. However, the hospital was in dire financial straits and had experienced a number of adverse events. Hospital leaders decided that, in order to make the case for remaining independent, they would need to dramatically improve productivity and safety and also redesign care around the patient. In short, they would not only have to solve their existing problems, they would also have to become extraordinary.
Timeline
Drawing Lessons from Out of Industry
Source: Rotterdam Eye Hospital, Rotterdam, Netherlands; Advisory Board interviews and analysis.
1992 New patient booking system based on airline industry implemented; wait times reduced from 12 weeks to 4 weeks
2003 Critical check point system introduced based on extensive doctor consultations
1990 Government proposal to merge Rotterdam Eye Hospital with academic medical centre sharpens leadership focus on quality
2005 Hospital renovated to improve patient experience and comfort
2004 Surgical time out procedure implemented, resulting in dramatic decrease in wrong-site surgeries
2007 Clinicians trained in crew resource management to improve operating theatre communication
2008 Black box program introduced to record and understand staff errors; valet parking program rolled out

©2013 THE ADVISORY BOARD COMPANY • ADVISORY.COM • 26143 100
Best Practices from Health Care, Other Industries Drive Innovation
Learning from Other Industries
Rotterdam’s strategy focused on innovation and becoming a center of excellence. One hallmark of their approach is a dedication to looking for answers outside themselves: they have learnt risk management techniques from insurance companies, just-in-time operations from supermarkets, process reliability from computer chip manufacturers, and safety from the nuclear power, oil, and airline industries.
They have also invested in developing an international network of eye hospitals, and have founded both the European and international eye hospital associations. This has enabled them to benchmark practice against other organisations, as well as to send their staff to high-performing hospitals internationally to identify and bring back best practices.
Looking Outside for Answers
Source: Rotterdam Eye Hospital, Rotterdam, Netherlands; Advisory Board interviews and analysis.
Learning from Other Eye Hospitals

©2013 THE ADVISORY BOARD COMPANY • ADVISORY.COM • 26143 101
Best Practices Suggested by Aviation Tactics
Rotterdam Eye Hospital Innovations
Many of Rotterdam’s most innovative lessons have been drawn from the airline industry; a sample of their initiatives based on commercial aviation models are laid out here.
Before the organisation could focus on quality, it had to address the immediate problem of too-long waiting times. With the assistance of KLM, the Dutch national airline, Rotterdam developed a centralised system that took control of scheduling away from the independent doctors and almost eliminated waiting times.
The success of this initiative encouraged further learning from the airline industry.
Getting Inspiration from Airlines
Source: de Korne D, “Diffusing Aviation Innovations in a Hospital in the Netherlands,” Joint Commission Journal on Quality and Safety, August 2010; Advisory Board interviews and analysis.
Appropriate location for surgical equipment clearly marked
Floor Marking
New scheduling system implemented to maximise capacity
Central Scheduling
Surgery teams trained in communication skills, teamwork
Crew Resource Management Designed to reduce patient
anxiety, and improve the patient experience
Fear Reduction
Surgical time out implemented, safety checklist used
Time Out Surgeries videotaped for later review of teamwork, errors
Black Box

©2013 THE ADVISORY BOARD COMPANY • ADVISORY.COM • 26143 102
Treatment Processes Designed Around Patient
Reducing Fear to Improve Quality
The next major concept that Rotterdam learnt from airlines was fear reduction.
Over recent decades, airlines have engineered the experience of flying to feel relatively simple and routine, in part to reduce fear of flying. Airports are big and light, with a lot of security, and processes are transparent. It is possible to track a flight’s destination and point of departure, and to see passengers from the previous flight deplane safety before boarding.
Many patients have a visceral fear of becoming blind, so this concept of fear reduction resonated at the eye hospital; it has implications beyond improving the patient experience. First, much eye surgery is conducted under local anaesthetic, and some evidence suggests that outcomes are better when the patient is relaxed. In addition, if the patient is at ease they are much better able to participate in their own care, and to speak up if something appears unusual or wrong.
Source: Rotterdam Eye Hospital, Rotterdam, Netherlands ; Advisory Board interviews and analysis.
Information Doctors clearly communicate procedure details and prognosis to patients
Companion Patients encouraged to bring a relative or friend along to ensure comfort/understanding
Valet Parking Parking programme for all patients ensures stress-free entry and exit to hospital
Building Design Extensive renovation completed; redesign focused on improving comfort for patients
Sound Art Art throughout building encourages relaxation and patient comfort
Transparency Simple procedures viewable in real time via a live camera feed in waiting area
IMA
GE
CR
ED
IT: R
OTT
ER
DA
M E
YE H
OS
PIT
AL

©2013 THE ADVISORY BOARD COMPANY • ADVISORY.COM • 26143 103
Operating Theatres, Waiting Rooms Designed to Reduce Fear
Nothing to Hide
In practice, a few elements are central to the fear reduction concept.
The patient journey begins with valet parking, which has removed anxiety about where to park in downtown Rotterdam and also improved on-time patient arrivals. The hospital also requires patients to bring a companion to hospital, to reduce fear as well as to improve information retention during diagnosis and discharge. They have worked with art museum architects to redesign their 1940s-era building, making the space more open, calming, and patient-friendly.
The final element of fear reduction is transparency. Rotterdam’s cataract surgery waiting room is designed so that patients waiting for surgery sit in the same room as patients recovering from surgery. In addition, two screens in the waiting room broadcast a live view through the surgeon’s microscope. This transparency aims to show patients that there is nothing to hide or to fear about the surgery. Although this idea may not be applicable in a major trauma theatre, for simple cataract surgeries they have had no complaints in over 90,000 cases.
Source: Rotterdam Eye Hospital, Rotterdam, Netherlands; Advisory Board interviews and analysis.
Reception Recovery/ Waiting area
Prep Area
Procedure Monitors
Operating Theatres
IMA
GE
CR
ED
IT: R
OTT
ER
DA
M E
YE
HO
SP
ITA
L
Hear how fear reduction improves quality at Rotterdam: advisory.com/ cob/Rotterdam-FearReduction

©2013 THE ADVISORY BOARD COMPANY • ADVISORY.COM • 26143 104
Safety of Hospitals Compared with Other Hazardous Industries
Safety of Hospitals Compared with Other Hazardous Industries
Trailing Other Industries
Rotterdam chose airlines as a model for safety for two reasons.
First, the airline industry’s safety record provides a valuable model for health care. Airlines’ impressive safety is primarily a result of improved teamwork rather than improved technology and techniques. Airlines have identified teamwork, reduced hierarchy, check points, and situational awareness as the most important elements for improving safety.
Rotterdam also found airlines to be a good model for a less obvious reason: the industry is an appealing example for doctors, in a way that oil, nuclear power, or other high-risk industries are not. Pilots can serve as role models for safety habits.
In 2003, Rotterdam attempted to use Six Sigma risk management training to improve safety. Despite staff interest, wrong surgery incidents did not decrease, until the hospital implemented an aviation-inspired surgical time out procedure. After this initiation of protocol, wrong site surgeries decreased from five to six per year to zero or one annually.
Source: Rotterdam Eye Hospital, Rotterdam, Netherlands; Advisory Board interviews and analysis.
Total Lives Lost Per Year
Number of Encounters per Fatality
Dangerous (>1/1000)
Regulated Safe (<1/100,000)
100,000
10,000
1,000
100
10
1
1 1,000 100,000 10,000,000
US Hospitals
Mountain Climbing
Bungee Jumping
Driving
Chartered Flights
Scheduled Airlines
European Railroads
Nuclear Power
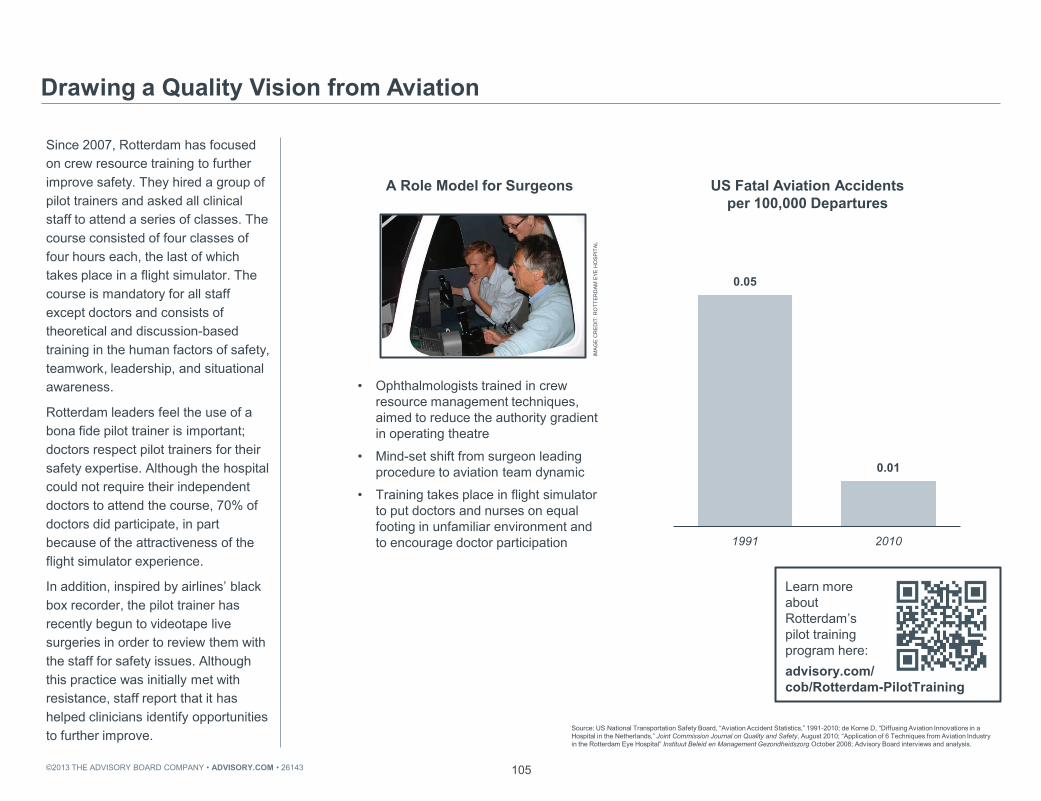
©2013 THE ADVISORY BOARD COMPANY • ADVISORY.COM • 26143 105
Since 2007, Rotterdam has focused on crew resource training to further improve safety. They hired a group of pilot trainers and asked all clinical staff to attend a series of classes. The course consisted of four classes of four hours each, the last of which takes place in a flight simulator. The course is mandatory for all staff except doctors and consists of theoretical and discussion-based training in the human factors of safety, teamwork, leadership, and situational awareness.
Rotterdam leaders feel the use of a bona fide pilot trainer is important; doctors respect pilot trainers for their safety expertise. Although the hospital could not require their independent doctors to attend the course, 70% of doctors did participate, in part because of the attractiveness of the flight simulator experience.
In addition, inspired by airlines’ black box recorder, the pilot trainer has recently begun to videotape live surgeries in order to review them with the staff for safety issues. Although this practice was initially met with resistance, staff report that it has helped clinicians identify opportunities to further improve.
Drawing a Quality Vision from Aviation
Source: US National Transportation Safety Board, “Aviation Accident Statistics,” 1991-2010; de Korne D, “Diffusing Aviation Innovations in a Hospital in the Netherlands,” Joint Commission Journal on Quality and Safety, August 2010; “Application of 6 Techniques from Aviation Industry in the Rotterdam Eye Hospital” Instituut Beleid en Management Gezondheidszorg October 2008; Advisory Board interviews and analysis.
A Role Model for Surgeons
• Ophthalmologists trained in crew resource management techniques, aimed to reduce the authority gradient in operating theatre
• Mind-set shift from surgeon leading procedure to aviation team dynamic
• Training takes place in flight simulator to put doctors and nurses on equal footing in unfamiliar environment and to encourage doctor participation
US Fatal Aviation Accidents per 100,000 Departures
0.05
0.01
1991 2010
IMA
GE
CR
ED
IT: R
OTT
ER
DA
M E
YE H
OS
PIT
AL
Learn more about Rotterdam’s pilot training program here: advisory.com/ cob/Rotterdam-PilotTraining

©2013 THE ADVISORY BOARD COMPANY • ADVISORY.COM • 26143 106
Innovation Underpins Rotterdam’s Leadership Approach
Innovation underpins all of Rotterdam’s improvements. It has allowed the hospital’s leadership to keep driving towards quality goals without doctors being engaged in leading the efforts themselves. While not an ideal option, this path is open to a strong executive team if clinicians cannot be convinced to participate.
Three themes are most important to Rotterdam’s innovation, and represent a future direction for quality improvement. The first is learning from others; Rotterdam stands out for the breadth of where they have looked for best practices.
The second is situation engineering; persuading doctors and staff to collaborate for systematic quality reform.
The final theme is patient-centred care. Care quality is increasingly defined to include the patient’s perspective, and the importance of engaging patients as active partners in their own care is growing.
Keys to Their Success
Source: Advisory Board interviews and analysis.
Learning from Others
Situation Engineering
Patient-Centred Care
Innovation
Rotterdam’s Chief Executive discusses the benefits of innovation here: advisory.com/ cob/Rotterdam-Innovation
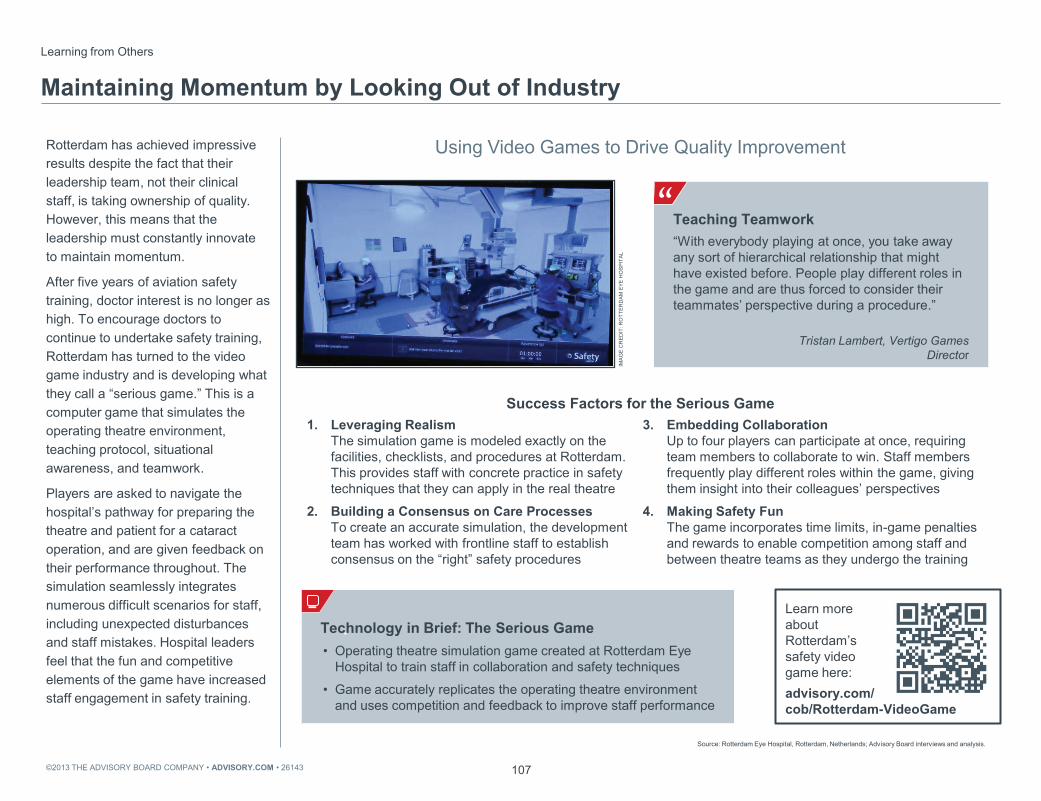
©2013 THE ADVISORY BOARD COMPANY • ADVISORY.COM • 26143 107
Using Video Games to Drive Quality Improvement
Success Factors for the Serious Game
Rotterdam has achieved impressive results despite the fact that their leadership team, not their clinical staff, is taking ownership of quality. However, this means that the leadership must constantly innovate to maintain momentum.
After five years of aviation safety training, doctor interest is no longer as high. To encourage doctors to continue to undertake safety training, Rotterdam has turned to the video game industry and is developing what they call a “serious game.” This is a computer game that simulates the operating theatre environment, teaching protocol, situational awareness, and teamwork.
Players are asked to navigate the hospital’s pathway for preparing the theatre and patient for a cataract operation, and are given feedback on their performance throughout. The simulation seamlessly integrates numerous difficult scenarios for staff, including unexpected disturbances and staff mistakes. Hospital leaders feel that the fun and competitive elements of the game have increased staff engagement in safety training.
Learning from Others
Maintaining Momentum by Looking Out of Industry
Source: Rotterdam Eye Hospital, Rotterdam, Netherlands; Advisory Board interviews and analysis.
1. Leveraging Realism The simulation game is modeled exactly on the facilities, checklists, and procedures at Rotterdam. This provides staff with concrete practice in safety techniques that they can apply in the real theatre
2. Building a Consensus on Care Processes To create an accurate simulation, the development team has worked with frontline staff to establish consensus on the “right” safety procedures
3. Embedding Collaboration Up to four players can participate at once, requiring team members to collaborate to win. Staff members frequently play different roles within the game, giving them insight into their colleagues’ perspectives
4. Making Safety Fun The game incorporates time limits, in-game penalties and rewards to enable competition among staff and between theatre teams as they undergo the training
Teaching Teamwork “With everybody playing at once, you take away any sort of hierarchical relationship that might have existed before. People play different roles in the game and are thus forced to consider their teammates’ perspective during a procedure.”
Tristan Lambert, Vertigo Games Director
” Technology in Brief: The Serious Game • Operating theatre simulation game created at Rotterdam Eye
Hospital to train staff in collaboration and safety techniques
• Game accurately replicates the operating theatre environment and uses competition and feedback to improve staff performance
IMA
GE
CR
ED
IT: R
OTT
ER
DA
M E
YE H
OS
PIT
AL
Learn more about Rotterdam’s safety video game here: advisory.com/ cob/Rotterdam-VideoGame

©2013 THE ADVISORY BOARD COMPANY • ADVISORY.COM • 26143 108
Airline Floor Marking
Situation Engineering
Quality by Design: Floor Marking
Operating Theatre Floor Marking
Within the theme of situation engineering, Rotterdam is exploring ways to improve quality and safety through better design. They hope to make gains on some elements of safety without the time- and resource-intensive process of convincing staff to change behaviour.
For example, Rotterdam noticed that in their operating theatres, the table, patient, and open instruments were often not correctly placed under the laminar airflow, thus increasing the chances of surgical site infections. Once again, they turned to airlines to solve the problem. They mimicked airline tarmac markings on their operating theatre floor to indicate where the table and instruments should be. Despite the fact that no training was conducted and staff were not informed of the change, the hospital’s measurements indicated that the table was placed in the right place significantly more often.
This example indicates that in some situations, using situational engineering may prove a much simpler method of changing behaviour and improving safety than training and persuading staff to consciously implement a change. Source: Rotterdam Eye Hospital, Rotterdam, Netherlands; Advisory
Board interviews and analysis.
IMA
GE
CR
ED
IT: R
OTT
ER
DA
M E
YE H
OS
PIT
AL
IMA
GE
CR
ED
IT: R
OTT
ER
DA
M E
YE H
OS
PIT
AL
Join a virtual tour of Rotterdam’s operating theatre: advisory.com/ cob/Rotterdam-FloorMarking

©2013 THE ADVISORY BOARD COMPANY • ADVISORY.COM • 26143 109
Electronic Checklist for Patients to Verify Care Quality
Within the final theme, patient-centred care, Rotterdam is increasingly using the patient to help complete some of the safety checks and procedures.
Shown here is an English translation of one of Rotterdam’s pre-discharge educational checklists. During the pilot project, nurses initially felt that this checklist impugned their clinical practice, but over time began to realise that their patients were not reliably receiving the necessary information. Project leaders report that as a result, staff are increasingly supportive of the project.
In addition, the hospital is experimenting with displaying patient information on the wall outside the theatre, and, prior to surgery, asking the patient to check their own details such as name, date of birth, and site and type of surgery.
These projects are still in the pilot phase, but indicate an important future direction for quality. Quality will be increasingly defined by the patient, not just the clinicians, and patients will be ever more active participants in their own care.
Patient-Centred Care
Empowering Patients to Ensure Their Own Safety
Source: Rotterdam Eye Hospital, Rotterdam, Netherlands; Advisory Board interviews and analysis.
As a patient, you have a role to play in your eye treatment. Use this checklist to note whether or not you have received sufficient information before leaving the hospital. I have received the following information and understood it: Y N
How to care for and protect my eyes What I can and can’t do How to use my eyedrops Medication instructions Information on possible complications What to do in an emergency Confirmation that my operation has been
completed successfully Information on the Retina Forum Patient
Group Contact information of the Retina Telephone
Hotline Follow-up appointment with my surgeon
Remaining questions for me to ask before I leave the hospital: …………………………………………………………........…….……………………………………………….………………...........................................................
Hear one way clinicians develop empathy with patients here: advisory.com/ cob/Rotterdam-Empathy

©2013 THE ADVISORY BOARD COMPANY • ADVISORY.COM • 26143 110
Wrong-Site and Reported Near Wrong-Site Sentinel Events at Rotterdam Eye
Hospital Over Time
As shown here, Rotterdam’s efforts have enabled the hospital to improve safety and productivity simultaneously. In particular, they have almost eliminated wrong-site surgery, the primary sentinel event at an eye hospital, and have also seen an increase in reporting of near misses. On the productivity front, they have doubled the number of surgeries they conduct and have reduced wait times by 70% without increasing capacity. These successes have allowed them to become the only specialist hospital in the Netherlands to remain independent.
Selected Results
Reversing Their Record
Source: Rotterdam Eye Hospital, Rotterdam, Netherlands; Advisory Board interviews and analysis
Rotterdam Eye Hospital Quality Achievements
2004 Dutch Golden Helix Award recipient for patient safety
Ranked as a Center of Excellence by the American Association of Eye and Ear Hospitals
Founding member of the World Association of Eye Hospitals
Highest percentage of eye surgery referrals of any eye hospital in the Netherlands
6
1 1
9
2000 2001 2002 2003 2004 2005 2006 2007 2008 2009
Wrong-Site Sentinel Events Reported Near Wrong-Site Incidents
6,734
13,242
1992 2009
Waiting times reduced by 70%
Surgeries per Year

©2013 THE ADVISORY BOARD COMPANY • ADVISORY.COM • 26143
Appendix
Common Quality Indicators by Country . . . . . . . . . . . . . . . . . . . . . . . . . . .
Examples of Common Quality Indicators in Selected Countries . . . . . . . .
Sentara Performance Management Decision Guide . . . . . . . . . . . . . . . . .
Johns Hopkins Medicine’s Five Steps for CUSP . . . . . . . . . . . . . . . . . . . .
Intermountain Metrics for Tracking Labour and Delivery . . . . . . . . . . . . . .
Intermountain Advanced Training Program (ATP) Curriculum . . . . . . . . .
112
113
114
115
116
117
111

©2013 THE ADVISORY BOARD COMPANY • ADVISORY.COM • 26143 112
Common Quality Indicators by Country
Most Common Types of Outcomes and Process Indicators, by Country
Source: Centers for Medicare and Medicaid Services, 2011; National Institute for Health and Clinical Excellence, 2011; NHS England Department of Health; Sektorenuebergreifende Qualitaet im Gesundheitswesen, 2011; Inspectie voor de Gezondheidszorg, 2011; Schweizerische Eidgenossenschaft Bundesamt fuer Gesundheit; Det Nationale Indikatorprojekt, 2011; “Quality and Efficiency in Swedish Health Care: Regional Comparisons 2009,” 2010, 99–147; Canadian Institute for Health Information, 2011, accessed April 17, 2011; Advisory Board interviews and analysis.
1) Acute myocardial infarction, heart failure. 2) Pneumonia, sepsis, Clostridium difficile. 3) Knee/hip replacement. 4) Lung, liver, heart. 5) Childbirth, pregnancy, neonatal care.
Mortality (< 28 -
30 days)
Readmissions (28 - 30 days)
Injuries or Complications
Acquired During Hospital
Stay
Timeliness or Access
to Appropriate
Care
Patient Experience
Cardio-
vascular1 Oncology Infectious Diseases2 Orthopaedics3 Transplants4 Obstetrics5 Stroke
US x x x x x x x x
UK x x x x x x x x
Germany x x x x x x x x x x x
Switzerland x x x x x x x x x x
Sweden x x x x x x x x x x x x
Denmark x x x x x x x x x
Netherlands x x x x x x x x x x x x
Canada x x x x x x x x x x

©2013 THE ADVISORY BOARD COMPANY • ADVISORY.COM • 26143 113
Examples of Common Quality Indicators in Selected Countries
Source: Centers for Medicare and Medicaid Services, available at: http://www.cms.gov/HospitalQualityInits/08_HospitalRHQDAPU.asp#TopOfPage; National Institute for Health and Clinical Excellence, available at: http://www.nice.org.uk/aboutnice/qualitystandards/qualitystandards.jsp; NHS England Department of Health, available at: http://www.dh.gov.uk/en/Publicationsandstatistics/Publications/PublicationsPolicyAndGuidance/DH_122738; Sektorenübergreifende Qualität im Gesundheitswesen, available at: http://www.sqg.de/datenservice/downloads/2011/boegen-14-0.html; Inspectie voor de Gezondheidszorg, available at http://igz.nl/onderwerpen/handhavingsinstrumenten/gefaseerd-toezicht/kwaliteitsindicatoren/basissets/; Schweizerische Eidgenossenschaft, available at: http://www.bag.admin.ch/themen/krankenversicherung/01156/01157/index.html?lang=de; Det Nationale Indikatorprojekt, available at: http://www.nip.dk/about+the+danish+national+indicator+project/indicator+sets; “Quality and Efficiency in Swedish Health Care: Regional Comparisons 2009,” 2010, 99–147; Canadian Institute for Health Information, available at: http://www.cihi.ca/CIHI-ext-portal/internet/en/applicationfull/health+system+performance/indicators/health/cihi011641, accessed April 17, 2011; Advisory Board interviews and analysis.
Risk-Adjusted Mortality (28-30 days, unless otherwise stated) • Acute myocardial infarction
• Heart failure
• Pneumonia
• Hip fracture
Readmission (28-30 days, unless otherwise stated) • Acute myocardial infarction
• Heart failure
• Pneumonia
• Hip fracture
• Reoperations
Injuries/Complications Acquired During Hospital Stay • Pressure ulcers
• Falls and trauma
• Infections
• Malnutrition
• Pain after treatment
Timeliness/Accessibility to Appropriate Care • Proportion of patients who are admitted to a stroke unit no later than the second
day of hospitalisation
• Patients with heart failure are provided an echocardiogram to receive timely and accurate diagnosis
• Patients with hip fractures are operated on within the same day or next day
Patient Experience • Satisfaction with waiting times
• Satisfaction with communication with doctors
• Satisfaction with communication with nurses
• Satisfaction with hospital care received
Guideline Compliance • Heart failure patients discharged home with written instructions or educational
material given to patient or caregiver at discharge or during the hospital stay addressing all of the following: activity level, diet, discharge medications, follow-up appointment, weight monitoring, and what to do if symptoms worsen
• Use of angiography after acute myocardial infarction
• Patients with heart failure are provided beta blockers for treatment

©2013 THE ADVISORY BOARD COMPANY • ADVISORY.COM • 26143 114
Sentara Performance Management Decision Guide
Source: Sentara Healthcare, Norfolk, Virginia.

©2013 THE ADVISORY BOARD COMPANY • ADVISORY.COM • 26143 115
Johns Hopkins Medicine’s Five Steps for CUSP
Source: Center for Innovation in Quality Patient Care, "The Comprehensive Unit-based Safety Program (CUSP)," Johns Hopkins Medicine; Pronovost P, Vohr E, “Safe Patients, Smart Hospitals: How One Doctor’s Checklist Can Help Us Change Health Care from the Inside Out,” New York: Hudson Street Press, 2010; Advisory Board interviews and analysis.
Five Steps for CUSP
1. Train staff in the science of safety Training provided to all unit members; focus on safe system and team design, teamwork.
2. Engage staff to identify defects Each staff member is asked: How is the next patient going to be harmed on this unit? How can we prevent this harm from occurring? Review incident reports and sentinel events.
3. Senior executive partnership/safety rounds Sponsoring executive rounds monthly, interacting with staff on the unit and discussing safety issues.
4. Continue to learn from defects For each defect, ask: What happened? Why did it happen? What did you do to reduce risk? How do you know that risks were reduced?
5. Implement tools for improvement Tools focus on communication, teamwork, collaboration and efficiency. Measure compliance with tools.

©2013 THE ADVISORY BOARD COMPANY • ADVISORY.COM • 26143 116
Intermountain Metrics for Tracking Labour and Delivery
Source: Intermountain Health Care, “Advanced Training Program Fall 2011,” accessed 25 August 2011; Advisory Board interviews and analysis.
1) Vaginal Birth After Caesarean.
Caesarean and VBAC1 delivery rates Clinical process failures Satisfaction outcomes Cost outcomes - relative resource utilisation (RRU)
• Overall caesarean delivery rate • Primary caesarean delivery rate • "Planned" caesarean delivery rate • VBAC delivery rate • Caesarean delivery rate among planned
vaginal births • Caesarean delivery rate for dystocia • Caesarean delivery rate for foetal
distress • Summary Caesarean rates across all
sections • Overall unplanned Caesarean delivery
rate by doctor • Caesarean delivery rate for dystocia by
doctor • Caesarean delivery rate for foetal
distress by doctor
• Proportion of vaginal deliveries with stage-4 complications
• Average number of stage-2/3 complications per vaginal delivery
• Proportion of Caesarean deliveries with stage-4 complications
• Average number of stage-2/3 complications per Caesarean delivery
• Proportion of NICU admissions
• Proportion of patients rating practitioner excellent
• Proportion of patients rating practitioner poor/fair
• Proportion of patients rating labour and delivery nurses excellent
• Proportion of patients rating labour and delivery nurses poor/fair
• Proportion of patients rating floor nurses excellent
• Proportion of patients rating floor nurses poor/fair
• Proportion of patients rating overall care excellent
• Proportion of patients rating overall care poor/fair
• Average RRUs per normal vaginal deliveries without VBAC or secondary surgical outcomes
• Average RRUs per VBAC delivery
• Average RRUs per vaginal delivery
• Average RRUs per vaginal delivery with secondary surgical procedure
• Average RRUs per Caesarean delivery
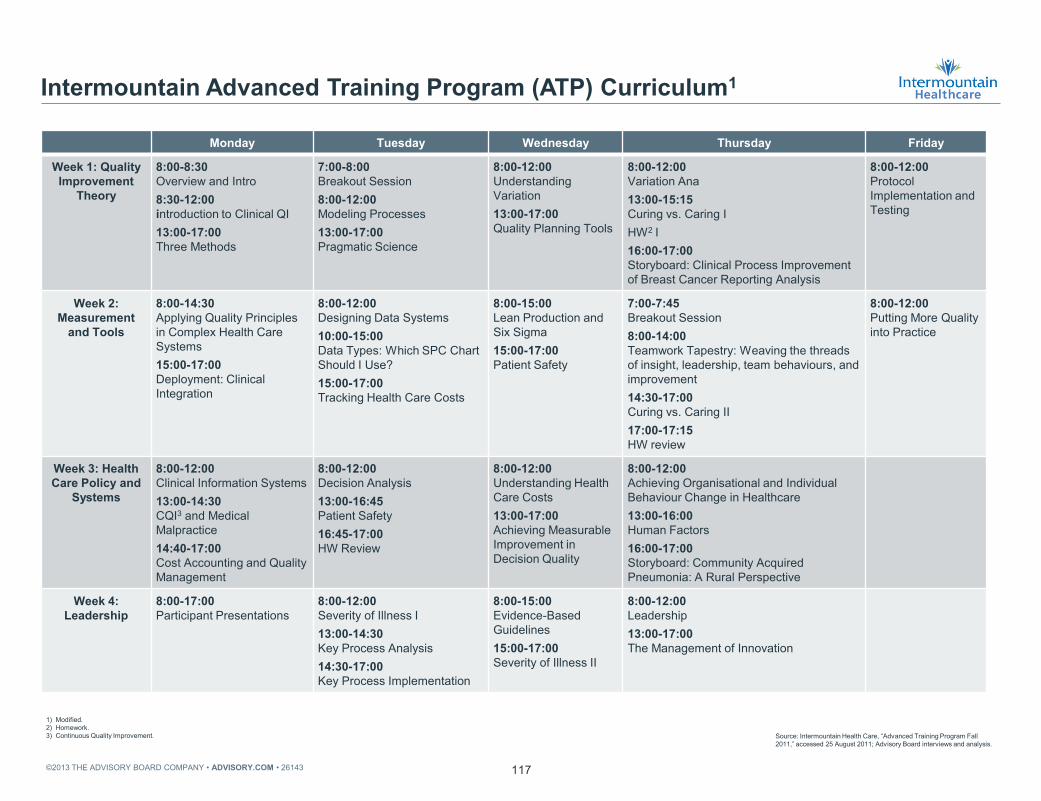
©2013 THE ADVISORY BOARD COMPANY • ADVISORY.COM • 26143 117
Intermountain Advanced Training Program (ATP) Curriculum1
Source: Intermountain Health Care, “Advanced Training Program Fall 2011,” accessed 25 August 2011; Advisory Board interviews and analysis.
1) Modified. 2) Homework. 3) Continuous Quality Improvement.
Monday Tuesday Wednesday Thursday Friday
Week 1: Quality Improvement
Theory
8:00-8:30 Overview and Intro 8:30-12:00 introduction to Clinical QI 13:00-17:00 Three Methods
7:00-8:00 Breakout Session 8:00-12:00 Modeling Processes 13:00-17:00 Pragmatic Science
8:00-12:00 Understanding Variation 13:00-17:00 Quality Planning Tools
8:00-12:00 Variation Ana 13:00-15:15 Curing vs. Caring I HW2 I 16:00-17:00 Storyboard: Clinical Process Improvement of Breast Cancer Reporting Analysis
8:00-12:00 Protocol Implementation and Testing
Week 2: Measurement
and Tools
8:00-14:30 Applying Quality Principles in Complex Health Care Systems 15:00-17:00 Deployment: Clinical Integration
8:00-12:00 Designing Data Systems 10:00-15:00 Data Types: Which SPC Chart Should I Use? 15:00-17:00 Tracking Health Care Costs
8:00-15:00 Lean Production and Six Sigma 15:00-17:00 Patient Safety
7:00-7:45 Breakout Session 8:00-14:00 Teamwork Tapestry: Weaving the threads of insight, leadership, team behaviours, and improvement 14:30-17:00 Curing vs. Caring II 17:00-17:15 HW review
8:00-12:00 Putting More Quality into Practice
Week 3: Health Care Policy and
Systems
8:00-12:00 Clinical Information Systems 13:00-14:30 CQI3 and Medical Malpractice 14:40-17:00 Cost Accounting and Quality Management
8:00-12:00 Decision Analysis 13:00-16:45 Patient Safety 16:45-17:00 HW Review
8:00-12:00 Understanding Health Care Costs 13:00-17:00 Achieving Measurable Improvement in Decision Quality
8:00-12:00 Achieving Organisational and Individual Behaviour Change in Healthcare 13:00-16:00 Human Factors 16:00-17:00 Storyboard: Community Acquired Pneumonia: A Rural Perspective
Week 4: Leadership
8:00-17:00 Participant Presentations
8:00-12:00 Severity of Illness I 13:00-14:30 Key Process Analysis 14:30-17:00 Key Process Implementation
8:00-15:00 Evidence-Based Guidelines 15:00-17:00 Severity of Illness II
8:00-12:00 Leadership 13:00-17:00 The Management of Innovation

©2013 THE ADVISORY BOARD COMPANY • ADVISORY.COM • 26143 118

©2013 THE ADVISORY BOARD COMPANY • ADVISORY.COM • 26143 119

©2013 THE ADVISORY BOARD COMPANY • ADVISORY.COM • 26143