
TRANSFORMATION OF TOBACCO (Nicotiana tabaccum) WITH ...
128
TRANSFORMATION OF TOBACCO (Nicotiana tabaccum) WITH ANTIMICROBIAL pflp GENE AND ANALYSIS OF TRANSGENIC PLANTS A THESIS SUBMITTED TO THE GRADUATE SCHOOL OF NATURAL AND APPLIED SCIENCES OF MIDDLE EAST TECHNICAL UNIVERSITY BY TANER TUNCER IN PARTIAL FULFILLMENT OF THE REQUIREMENTS FOR THE DEGREE OF MASTER OF SCIENCE IN BIOTECHNOLOGY JANUARY 2006
Transcript of TRANSFORMATION OF TOBACCO (Nicotiana tabaccum) WITH ...

TRANSFORMATION OF TOBACCO (Nicotiana tabaccum) WITH ANTIMICROBIAL pflp GENE
AND ANALYSIS OF TRANSGENIC PLANTS
A THESIS SUBMITTED TO THE GRADUATE SCHOOL OF NATURAL AND APPLIED SCIENCES
OF MIDDLE EAST TECHNICAL UNIVERSITY
BY
TANER TUNCER
IN PARTIAL FULFILLMENT OF THE REQUIREMENTS FOR
THE DEGREE OF MASTER OF SCIENCE IN
BIOTECHNOLOGY
JANUARY 2006
Approval of the Graduate School of Natural and Applied Sciences
Prof. Dr. Canan ÖZGEN Director
I certify that this thesis satisfies all the requirements as a thesis for the degree of Master of Science.
Assoc. Prof. Dr. Candan GÜRAKAN Head of Department
This is to certify that we have read this thesis and that in our opinion it is fully adequate, in scope and quality, as a thesis for the degree of Master of Science.
Assoc. Prof. Dr. Fikrettin ŞAHİN Prof. Dr. Hüseyin Avni ÖKTEM Co-Supervisor Supervisor
Examining Committee Members Prof. Dr. Meral YÜCEL (METU, BIOL) Prof. Dr. Hüseyin Avni ÖKTEM (METU, BIOL) Prof. Dr. Gülay ÖZCENGİZ (METU, BIOL) Assoc. Prof. Dr. Sertaç ÖNDE (METU, BIOL)
Assist. Prof. Dr. Füsun EYİDOĞAN (Başkent Univ., EDU)

iii
I hereby declare that all information in this document has been obtained and
presented in accordance with academic rules and ethical conduct. I also declare
that, as required by these rules and conduct, I have fully cited and referenced all
material and results that are not original to this work.
Name, Last name : Taner Tuncer
Signature :
iv
ABSTRACT
TRANSFORMATION OF TOBACCO (Nicotiana tabaccum)
WITH ANTIMICROBIAL pflp GENE
AND ANALYSIS OF TRANSGENIC PLANTS
Tuncer, Taner
M.Sc., Department of Biotechnology
Supervisor: Prof. Dr. Hüseyin Avni Öktem
Co-supervisor: Assoc Prof. Dr. Fikrettin Şahin
January 2006, 110 pages
The objective of this study was to transform sweet pepper ferredoxin-like
protein (PFLP) gene, which has antimicrobial properties, to tobacco and
investigate the disease resistance abilities of transgenic tobacco. This protein
interacts with another protein, harpin that is produced by the bacteria which is
invading the plant tissues, and stimulates hypersensitivity response in plants, thus
the spreading of disease is limited.
Gene transfer was achieved to tobacco by Agrobacterium- mediated method
and with indirect organogenesis; the explants were grown on selective media and

v
then transferred to jars and pots respectively. Molecular and genetic analyses such
as PCR, RT-PCR, Sequence Analysis and Northern Blot, were performed with
plants which their seeds survived and grew on selective medium and also gave
positive reactions for GUS histochemical assay.
Finally, with putative transgenic plants, some hypersensitive response assays
were carried out with Pseudomonas syringae and it was observed that the
recovered plants showed hypersensitive response (HR) in the preliminary tests.
These results indicated that putative transgenic tobacco plants which carry pflp
transgene, can be used in disease resistance studies.
Keywords: ferredoxin-like protein, hypersensitive response (HR), Transgenic,
Agrobacterium tumefaciens

vi
ÖZ
ANTİMİKROBİYAL pflp GENİNİN TÜTÜNE AKTARILMASI VE
TRANSGENİK BİTKİLERİN GELİŞTİRİLMESİ
Tuncer, Taner
Yüksek Lisans, Biyoteknoloji Bölümü
Tez yöneticisi: Prof. Dr. Hüseyin Avni Öktem
Ortak tez yöneticisi: Doç. Dr. Fikrettin Şahin
Ocak 2006, 110 sayfa
Bu çalışmanın amacı antimikrobiyal özelliği olan tatlı biber ferredoksin-
benzeri protein (PFLP) geninin tütüne aktarılması ve transgenik tütünlerin çeşitli
bakteriyel hastalıklara dirençlerinin incelenmesidir. Bu protein, bakterilerin
bitkiyi istila sırasında ürettiği harpin adlı proteinle etkileşerek bitkide
hiperduyarlılık tepkisi başlatmaktadır, böylece hastalığın yayılması
engellenmektedir.
Agrobacterium yöntemiyle tütünlere gen transferi yapılmış olup indirekt
organogenesisle tütünler seçici ortamda büyütüldükten sonra sırasıyla kavanozlara
ve saksılara konulmuşlardır. Tohumları higromisinli ortamda büyüyen ve GUS

vii
boyamasıyla olumlu renk veren bitkiler ile PCR, RT-PCR, Sekans Analizi ve
Northern Blot gibi moleküler ve genetik analizler yapılmıştır.
Çalışmanın bu kısmından sonra transgenik adayı bitkiler üzerinde çeşitli
patoloji deneyleri yapılmıştır. Öncül deneylerde, Pseudomonas syringae
bakterisine karşı yapraklarda hiperduyarlılık tepkisi gözlenmiştir. Bu sonuçlar
göstermektedir ki pflp genini taşıyan tütün bitkileri hastalık direnci çalışmalarında
kulanılabilirler.
Anahtar kelimeler: ferredoksin-benzeri protein, hiperduyarlılık tepkisi,
Transgenik, Agrobacterium tumefaciens

viii
To the spirit of my ancestors

ix
ACKNOWLEDGMENTS
I would like to express my greatest thanks to my supervisor Prof. Dr.
Hüseyin Avni Öktem for his guidance, valuable advices, and insight throughout
the research. I would also like to thank Prof. Dr. Meral Yücel for her insight,
helps and kindness. I have always been grateful to them for giving me a chance to
be a member of their research group.
I would like to express my gratitude to my co-supervisor Assoc. Prof. Dr.
Fikrettin Şahin for his advices, comments. I should also mention his kind attitude
towards me when I was in Erzurum
I would like to thank to Prof. Dr. Ming-Tsair Chan for the gene and plasmid
constructs which I used for gene transfer experiments during the study.
I would also like to thank the members of thesis examining committee; Prof.
Dr. Gülay Özcengiz, Assist. Prof. Dr. Füsun Eyidoğan, and especially Assoc.
Prof. Dr. Sertaç Önde for their suggestions and comments.
I can not express my gratitude to all the members of METU Plant
Biotechnology group just with words, but if I have to I would like to thank
Dr. Feyza Selçuk for her guidance and patience to my endless questions, İrem
Karamollaoğlu, Ebru Özgür, Ufuk Çelikkol and Didem Demirbaş for their
support, help and kindness during my study, Betül Deçani Yol and Simin Tansı
Binzet for their help and suggestions during transformation experiments, Ceyhun
Kayıhan and especially to Beray Gençsoy for their outstanding help during RNA
isolation and Northern Blot Analyses, Özgür Çakıcı and Özgür Önal for their
friendship and help in computer related issues, Hamdi Kamçı, Musa Kavas,
Cengiz Baloğlu, Abdullah Tahir Bayraç, Işın Nur Çiçerali, , Gülsüm Kalemtaş,
Özge Şenyurt, and Nilüfer Afşar for their friendship and support to my study. I

x
am always proud of being a member of this research group. Also, I want to thank
my angels Tuğçe and Damla for their help and support through-out my labor-
intensive experiments. Finally but not leastly, I am greatly indebted to Tufan Öz
for his great help, support, patience, kindness, friendship, presence and
everything, he is such a great person and I am very lucky to be near him.
I would like to thank to METU Central Lab. Members for their help and
guidance, especially to Dr. Remziye Yılmaz for RT-PCR and to Evren Koban for
DNA sequencing studies, without their support those studies could not been
carried out.
I am really indebted to my mum and bro for their support during my
education and to Mr. and Mrs. Akman and to Berk who made me feel I am home.
Ultimately, my greatest and deepest thanks goes to my dear Begüm for her
tremendous and unbelievable help and patience to me and my life, without her I
would not have the courage to carry on.
This work is supported by the research fund: BAP-08-11-
DPT2002K120510.

xi
TABLE OF CONTENTS
PLAGIARISM……………………………………………………………………iii
ABSTRACT………………………………………………………………………iv
ÖZ…………………………………………………………………………...........vi
DEDICATION…………………………………………………………………..viii
ACKNOWLEDGEMENTS………………………………………………………ix
TABLE OF CONTENTS………………………………………………………....xi
LIST OF TABLES……………………………………………………………….xv
LIST OF FIGURES……………………………………………………………..xvi
LIST OF ABBREVIATIONS……………………………………………..…....xvii
CHAPTERS
1. INTRODUCTION ...............................................................................................1
1.1. Transgenic Plants and their Application in Agriculture..................................1
1.1.1. Improvement of Crops and Genetic Modifications............................ 1
1.1.2. Gene Transfer Techniques for Plants................................................. 2
1.1.3. Agricultural Practices of GM crops ................................................... 4
1.1.4. Disease Resistance and Transgenic Plants......................................... 6
1.2. Plant Defense Mechanisms .............................................................................7
1.2.1. Plant-pathogen interactions................................................................ 7
1.2.2. Signaling Pathways .......................................................................... 10
1.3. Transgenic Strategies against Diseases.........................................................11
1.3.1. Strategies against viral diseases ....................................................... 11
1.3.1.1. Studies regarding Pathogen-derived Resistance ............... 12
1.3.1.2. Host resistance gene mediated studies .............................. 13
1.3.2. Strategies against bacterial and fungal diseases............................... 15
1.3.2.1. Transformation of antimicrobial genes ............................. 15
1.3.2.2. Over-expression of plant defense related genes................ 16
1.3.2.3. Transfer of resistance genes .............................................. 17

xii
1.3.2.4. Defense Signaling related studies ..................................... 18
1.3.2.5. RNA interference and Plantibodies................................... 19
1.4. Hypersensitive Response ..............................................................................20
1.4.1. Genetic Control of HR ..................................................................... 20
1.4.2. Elicitors involved in HR .................................................................. 22
1.4.3. Signal Transduction pathways leading to HR.................................. 23
1.4.4. Reactions of HR process .................................................................. 25
1.5. Plant ferredoxin-like protein (PFLP) ............................................................26
1.5.1. Structure of PFLP............................................................................. 26
1.5.2. Function of PFLP in HR .................................................................. 28
1.5.3. Transformation studies with PFLP................................................... 28
1.6. Aim of the study............................................................................................29
2. MATERIALS AND METHODS.......................................................................30
2.1. Materials........................................................................................................30
2.1.1. Bacterial strains and plasmid ........................................................... 30
2.1.2. Bacterial Culture Media and Culture Conditions............................. 30
2.1.3. Plant Material and Tissue Culture Media......................................... 31
2.1.4. Plant Tissue Culture Conditions ...................................................... 32
2.1.5. Other Chemicals and Materials........................................................ 32
2.2. Methods ........................................................................................................33
2.2.1. Verification of pflp within the plasmids .......................................... 33
2.2.1.1. Plasmid Isolation............................................................... 33
2.2.1.2. PCR Analysis .................................................................... 34
2.2.2. Maintenance of Plant Material ......................................................... 36
2.2.2.1. Surface Sterilization of Tobacco Seeds............................. 36
2.2.2.2. Micropropagation of Tobacco Plants ................................ 36
2.2.2.3. Determination of Lethal Hygromycin Concentration ....... 36
2.2.3. Leaf Disc Transformation of Nicotiana tabacum ............................ 37
2.2.4. Analysis of T1 Transgenic Tobacco Plants ...................................... 38
2.2.4.1. Mendelian Inheritance Pattern .......................................... 38
2.2.4.2. GUS Histochemical Assay................................................ 39

xiii
2.2.4.3. Molecular Analysis of T1 via PCR.................................... 39
2.2.4.3.1.DNA isolation from T1 leaves..................................... 39
2.2.4.3.2.PCR with pflp and hph specific primers ..................... 40
2.2.4.3.3.Sequence Analysis of PCR products........................... 41
2.2.4.3.4.Real Time-PCR Analysis ............................................ 43
2.2.4.4. Expression Analysis of pflp .............................................. 43
2.2.4.4.1.Total RNA Isolation.................................................... 43
2.2.4.4.2.Determination of RNA quantity and quality............... 45
2.2.4.4.3.Northern Blotting ........................................................ 45
2.2.4.4.4.Probe Labeling, Hybridization and Detection............. 46
2.2.5. Plant Hypersensitivity Response Assays ......................................... 48
3. RESULTS AND DISCUSSION ........................................................................49
3.1. Verification of pflp within the plasmids .......................................................49
3.2. Determination of Lethal Hygromycin Concentration ...................................49
3.3. Generation of Transgenic Tobacco Lines .....................................................52
3.3.1. Callus Induction ............................................................................... 52
3.3.2. Shoot and Root Development .......................................................... 54
3.3.3. Development in Soil......................................................................... 54
3.4. Analysis of T1 progeny .................................................................................58
3.4.1. Mendelian Inheritance Pattern ......................................................... 58
3.4.2. GUS Histochemical Assay............................................................... 59
3.4.3. Molecular Analysis of T1 via PCR .................................................. 60
3.4.3.1. PCR with pflp and hph specific primers ........................... 60
3.4.3.2. Sequence Analysis of PCR products................................. 62
3.4.3.3. Real Time-PCR Analysis .................................................. 63
3.4.4. Expression Analysis of pflp in T1 Transgenic Plants ....................... 70
3.4.5. Overall Evaluation of T1 Transgenic lines ....................................... 72
3.5. Plant Hypersensitivity Response Assays ......................................................72
4. CONCLUSION..................................................................................................74
REFERENCES.......................................................................................................76
xiv
APPENDICES
A: Plasmid Map .....................................................................................................93
B: Bacterial Culture Medium.................................................................................94
C: Plant Tissue Culture Media ...............................................................................95
D: Plasmid Isolation Solutions and TE Buffer.......................................................97
E: Primers, TAE and TBE buffers .........................................................................98
F: GUS Substrate and Fixative Solutions ..............................................................99
G: CTAB Buffer...................................................................................................100
H: Sequence Analysis Conditions and Results ....................................................101
I: TRI reagent and Northern Blot Solutions.........................................................108

xv
LIST OF TABLES
Table 2.1 The composition and the purpose of plant tissue culture media....
Table 2.2 PCR cycling conditions to amplify pflp gene................................
Table 2.3 Optimized conditions of PCR to amplify pflp...............................
Table 2.4. PCR cycling conditions to amplify pflp and hph for plant DNA
Table 2.5. Optimized conditions of PCR to amplify pflp and hph ………….
Table 3.1 Mendelian Inheritance Analysis of T1 progeny...........................
Table 3.2 Sequence Analysis Results of PCR products given as sequence
identity compared with previously characterized genes.................................
Table 3.3 An overall look to the RT-PCR analysis results............................
Table 3.4 The summary of GUS and molecular analysis results...................
Table C.1 Compositions of Plant Tissue Culture Media...............................
32
35
35
41
41
59
63
70
72
95

xvi
LIST OF FIGURES
Figure 1.1 An overall representation of the events taking place during HR process
Figure 1.2 Nucleotide and deduced amino acid sequence of pflp cDNA from
sweet pepper...............................................................................................................
Figure 3.1 PCR result of pflp amplification of plasmids after isolation...................
Figure 3.2 Results of Lethal Hygromycin Concentration Determination.................
Figure 3.3 A photograph showing positive and negative control and
Agrobacterium treated explants after 6 weeks...........................................................
Figure 3.4 Root formation in putative transgenic plantlets in MSC medium..
Figure 3.5 The growth of putative transgenic line 6 in soil......................................
Figure 3.6 The growth of putative transgenic plants in growth chamber................
Figure 3.7 The growth of putative transgenic plants in greenhouse conditions.......
Figure 3.8 The growth of T1 seeds in selective media.............................................
Figure 3.9 Expression of GUS in leaves of transgenic lines....................................
Figure 3.10 The gel photographs of PCR analysis for pflp and hph gene…............
Figure 3.11 Log amplification curves for reference values......................................
Figure 3.12 Log amplification curves for CaMV 35S promoter target values.........
Figure 3.13 Log amplification curves for NOS terminator target values.................
Figure 3.14 Log amplification curve for reference (R) and 35S target (T) values
Figure 3.15 Log amplification curve for reference and NOS target values..............
Figure 3.16 Total RNA isolated from wild-type and the selected transgenic lines..
Figure 3.17 Northern Blot analysis of wild-type and transgenic lines T6 and T10..
Figure 3.18 Hypersensitive Response given to P. syringae by the transgenic lines
1 and 6........................................................................................................................
Figure A.1 Complete map of pCAMBIA 1304/35S-SAPI and T-DNA region of
pSPFLP......................................................................................................................
24
27
50
51
53
55
56
57
57
59
60
61
65
66
67
68
69
71
71
73
93

xvii
LIST OF ABBREVIATIONS
Avr Gene coding for Avirulence Proteins in pathogens
BA Benzylaminopurine
Bt Bacillus thrungiensis
Cf Cefotaxime
Cry Gene coding for Crystal Protein in Bacillus thrungiensis
cv Cultivated Variety
DEPC Diethyl pyrocarbonate
EDTA Ethylenediamine Tetra Acetic Acid
GM Genetically Modified
GMO Genetically Modified Organisms
GUS β-D-glucuronidase
H Hygromycin
HR Hypersensitive Reaction
IBA Indole Butyric Acid
JA Jasmonic acid
K Kanamycin
MS Murashige and Skoog Basal Medium
OD Optical Density
PCR Polymerase Chain Reaction
pflp Gene coding for Plant Ferrodoxin-like Protein
PFLP Plant Ferrodoxin-like Protein
PR Pathogenesis-Related
PRSV Papaya ring spot virus
R Genes coding for Resistance Proteins in plants
ROS reactive oxygen species
rpm Revolution per Minute
SA Salicylic acid
SAR Systemic Acquired Resistance

xviii
SEM Standard Error of Mean
TAE Tris-Acetate-EDTA
T-DNA Transferred DNA
TMV Tobacco mosaic virus
uidA (gusA) Gene coding for β-D-glucuronidase
vir Virulence genes
X-GlcA 5-Bromo-4-chloro-3-indolyl-β-D-glucuronic Acid
XR Rapid flux of ions across the plasma membrane
YEB Yeast Extract Broth

1
CHAPTER I
INTRODUCTION
1.1. Transgenic Plants and their Application in Agriculture
1.1.1. Improvement of Crops and Genetic Modifications
For centuries, genetic manipulation of plants has been carried out by
applying conventional plant breeding methods. Most of these studies were not
involved with a single gene; rather they have dealt with a large chromosome piece
which contains the desired gene. As a result, the transferred chromosome
contained many other genes which, generally, might not be desired (Murray,
1993).
Plant breeding principles usually consist of identifying and selecting
desirable traits and combining these into one individual plant. For generations, the
superior traits are selected as well as the undesired traits are discarded. By this
way, breeders have been able to create new varieties that have desirable traits,
such as color, shape and flavor. But plant breeding needs very long time to obtain
a satisfactory product. Today, there exists a branch of biology which consists of
multiple methodologies for developing superior plants: plant biotechnology.
A sub-branch of plant biotechnology, Transgenic Plant Technology, aims to
transfer genes from one species to another either related or not. The process of
introducing a gene into an organism via recombinant DNA technology is known

2
as transformation and recovered plant species are called as transgenic plants or
genetically modified (GM) plants.
Gene transformation studies for plants have started during the early 1980s
(Lamb and Beachy, 1989). During that time, the main aim was to analyze the
structure and function of genes. But after a while, the purpose of these studies
became; improved product yield and quality, increased resistance to diseases,
increased resistance to biotic stress factors such as nematodes, insects and fungus,
and increased resistance to various abiotic stresses factors such as drought, high
contents of salt and heavy metals in soils.
1.1.2. Gene Transfer Techniques for Plants
Today, there exist many plant transformation techniques which can be
classified into two groups as direct and indirect gene transfer Direct
transformation techniques consist of microprojectile bombardment, protoplast
fusion, electroporation, and microinjection where as indirect transformation
techniques includes viral vector mediated and Agrobacterium-mediated gene
transfer techniques. Frequently used techniques are Agrobacterium mediated
delivery and microprojectile bombardment.
The indirect gene transfer techniques includes the plant viruses and
Agrobacterium-mediated gene transfer. Transformation with the former one, plant
viruses, is much easier than Agrobacterium-mediated transformation, much
simpler than protoplast transformation, and much cheaper than particle
bombardment since they naturally infect intact plant cells and they multiply to
high copy numbers in the plant cell which results in high expression. But plant
viruses do not integrate into the genome and therefore have little value as
integrative transformation vectors. They also do not pass through the gametes, so
their effects are not heritable through meiosis (Twyman et al., 2002)

3
Nowadays, the soil bacterium Agrobacterium tumefaciens is the most
commonly used tool in gene transformation studies for majority of dicotyledonous
plants. It is based on the transfer of foreign DNA by using natural gene transfer
capacity of Agrobacterium species (Horsch et al., 1985). Agrobacteria are gram-
negative rod-shaped bacteria that are abundant in soil and classified in genus
Rhizobium and in family Rhizobiaceae. With these bacteria, transgenic plants
have been obtained nearly for all cultured species. The satisfactory results for
monocotyledonous species could not been achieved at the beginning however
with the development of binary vectors, gene transformation by Agrobacterium
gave efficient results for maize (Ishida et al., 1996) , rice (Hiei et al., 1997),
barley (Tingay et al., 1997) and wheat (Cheng et al., 1997).
Direct gene transfer techniques do not rely on biological vectors like
plasmids and viruses, and naked DNA is directly used. One example to direct
gene transfer is protoplast fusion. Protoplasts are plant cells from which the cell
walls have been removed enzymaticaly or chemically which make it easier to
transfer foreign DNA into cells either by treatment with particular chemicals, or
by the use of high voltage electric shocks. The chemicals polyethylene glycol
(PEG) and polyvinyl alcohol, together with divalent cations such as Ca+2
and high
pH, induce protoplasts to take up naked DNA (Paszkowski et al., 1984).
Electroporation is another direct gene transfer technique, which has been
developed for mammalian cell transformation, and now adapted to both monocot
and dicot species. The application of strong electrical field and high voltage
electrical pulses to solution, containing cells and DNA creates reversible pores in
the cell membrane that allows the entry of the genes (Fromm et al., 1985).
Microinjection which is commonly used for animal cells is another method
and based on the transfer of naked DNA molecules to intact plants or protoplasts
by mechanical ways (Crossway et al., 1986). It employs the use of fine micro-
capillaries to transfer a specified number of genes into cytoplasm or directly into
4
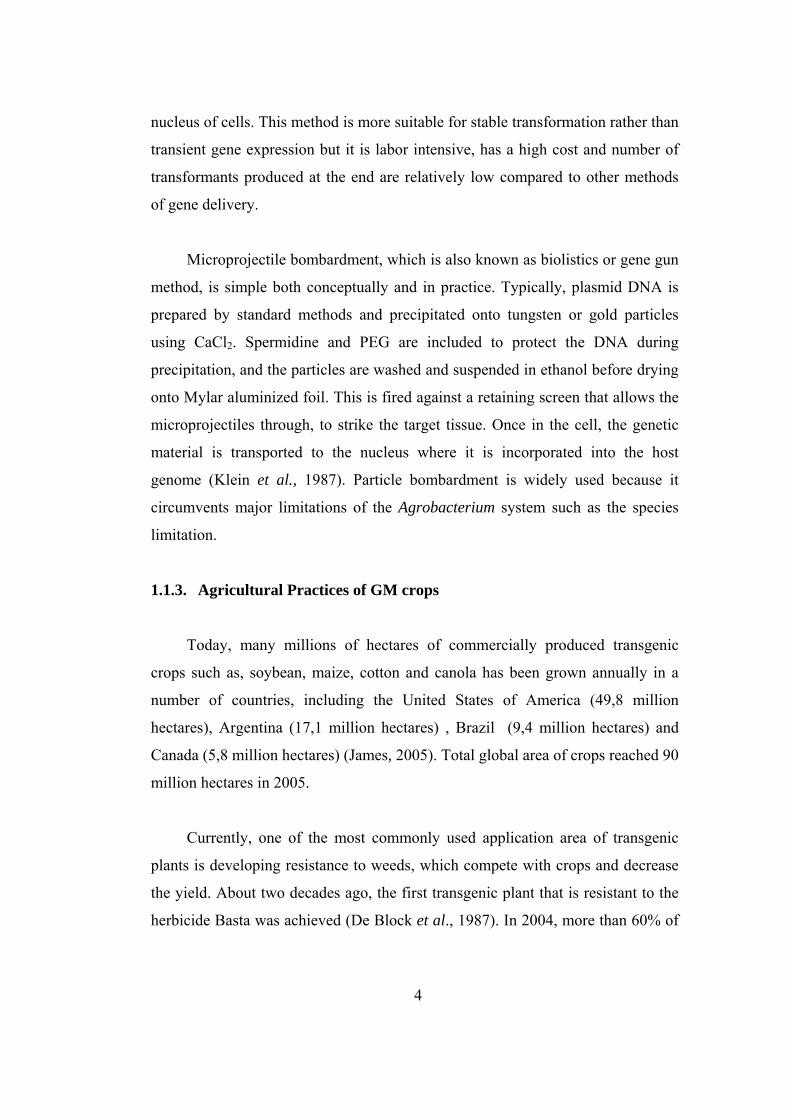
nucleus of cells. This method is more suitable for stable transformation rather than
transient gene expression but it is labor intensive, has a high cost and number of
transformants produced at the end are relatively low compared to other methods
of gene delivery.
Microprojectile bombardment, which is also known as biolistics or gene gun
method, is simple both conceptually and in practice. Typically, plasmid DNA is
prepared by standard methods and precipitated onto tungsten or gold particles
using CaCl2. Spermidine and PEG are included to protect the DNA during
precipitation, and the particles are washed and suspended in ethanol before drying
onto Mylar aluminized foil. This is fired against a retaining screen that allows the
microprojectiles through, to strike the target tissue. Once in the cell, the genetic
material is transported to the nucleus where it is incorporated into the host
genome (Klein et al., 1987). Particle bombardment is widely used because it
circumvents major limitations of the Agrobacterium system such as the species
limitation.
1.1.3. Agricultural Practices of GM crops
Today, many millions of hectares of commercially produced transgenic
crops such as, soybean, maize, cotton and canola has been grown annually in a
number of countries, including the United States of America (49,8 million
hectares), Argentina (17,1 million hectares) , Brazil (9,4 million hectares) and
Canada (5,8 million hectares) (James, 2005). Total global area of crops reached 90
million hectares in 2005.
Currently, one of the most commonly used application area of transgenic
plants is developing resistance to weeds, which compete with crops and decrease
the yield. About two decades ago, the first transgenic plant that is resistant to the
herbicide Basta was achieved (De Block et al., 1987). In 2004, more than 60% of
5
produced soybean around the world is transgenic which are known as Roundup
Ready and Liberty Link varieties (James, 2004).
Another area is generation of transgenic plants that are resistant to insects
(Dulmage et al., 1981). Bacillus thrungiensis (Bt) forms spores carrying crystal
proteins that are toxic to various group insects. Insect resistance was achieved in
transgenic plants by transforming Cry genes of Bacillus thrungiensis and
expressing high-levels of this toxic protein (Mazier et al., 1997). In 1995, the first
insect resistant transgenic crops; corn, cotton and potato; expressing Cry proteins
were approved for market release in the US. Also, trypsin proteinase inhibitors
(Alfonso-Rubi et al., 2003) and biotin-binding proteins (avidin and streptavidin)
(Markwick et al., 2003) are used to generate insect resistant transgenic plants.
Besides insects, conferring resistance against nematodes, that cause an estimated
10% to 25% annual reduction in crop yield, is another agricultural application.
R-genes targeted against nematodes from potato have been shown to confer
nematode resistance when susceptible varieties have been transformed with these
genes (Paal et al., 2004).
Abiotic stresses such as; drought, salt, heat, cold, chilling and heavy metals
also affect crop productivity. Genetic modifications have been carried out and
transgenic plants with enhanced tolerance to environmental stress have been
developed even at gene regulation level. Constitutive expression of the stress-
response transcriptional coactivator multiprotein bridging factor 1c (MBF1c) in
Arabidopsis thaliana enhances the tolerance of transgenic plants to heat and
osmotic stress (Suzuki et al., 2005)
Improving the nutritional quality of plants is another purpose of generating
GMOs. Golden Rice is the most popular product of this strategy. With the
introduction of new genes to rice, transgenic rice exhibits an increased production
of beta-carotene so may help to overcome vitamin A deficiency in children (Ye et
al., 2000).
6
1.1.4. Disease Resistance and Transgenic Plants
Attacks by plant pathogens always have been a threat to agricultural
production. Plant diseases have had historical implications, where one of the most
well known examples is the potato famine in Ireland of 1845-1847 caused by
Phytophthora infestans, which spurred a huge wave of emigration to North
America. In 1880s, the coffee industry in Ceylon was completely destroyed due to
Hemileia vastatrix and a century later the same fungus hit many countries in
South and Central America.
Agriculture worldwide suffers from production losses due to pathogens and
pests. The crop losses in 1988-1990 of eight principal food and cash crops, which
are grown on about 50% of the global cultivated land, was estimated to 29% of
the attainable production, corresponding to 167 billion US$. It is estimated that
without the application of various crop protection measures, crop losses due to
pathogens and pests globally would have reached 40% of the attainable
production (Oerke et al., 1999).
Agrochemicals are commonly used to control many plant pests and diseases.
In 1990, about 19 billion US$ were spent globally on insecticides and fungicides
(Oerke et al., 1999). Other alternatives, or complements, to protect plants include
phytosanitary measures such as healthy seed, appropriate crop rotation and tillage
methods.
Another very important factor in controlling plant pathogens is the use of
resistant cultivars. Classical plant breeding is continuously aiming at improving
plant resistance to diseases and pest attacks by introgression of resistance from the
same or closely related species. However, in many instances there are no sources
of resistance available or the resistance is tightly genetically linked with
undesirable traits.
7
The development of gene technology has drastically increased the
availability of genes conferring resistance, since they can now be derived from
non-related plant species as well as non-plant sources. Additionally, the problem
with co-transfer of linked undesirable characters from the gene source, as is often
the case in traditional cross-breeding, can be avoided. Gene technology in
combination with the increasing knowledge of various plant defense mechanisms
contributes with new possible strategies that might be used for improvement of
resistance.
Genes that provide resistance against plant diseases such as viruses, bacterial
and fungal pathogens have been successfully introduced into crop plants. A recent
example is transgenic papaya, which is resistant to Papaya ring spot virus (PRSV),
and it is widely planted in Hawaii. It has helped to save the papaya industry from
devastation by PRSV in 1999 (Gonsalves, 2004). No such commercial transgenic
plant against bacterial or fungal pathogens is present now but research is still
going on.
1.2. Plant Defense Mechanisms
Frequently, plants are exposed to impending pathogens. Although, most
encounters result in resistance by the plant and uncommonly the result is disease.
Most pathogens are much specialized and only influence a limited range of host
plants, often only a single species. This uniqueness is due to the need for certain
host factors for host recognition and to the plant’s defense system.
1.2.1. Plant-pathogen interactions
The first line of defense includes constitutive barriers such as wax layers
like cuticle, cell walls and chemical defense compounds. These barriers are
present in the plant prior to any attack by pathogens and confer a broad resistance
to a wide variety of parasites (Takken & Joosten 2000). If the first line of defense

8
is overcome a second line of induced responses may stop the invader. Further
parasite attack on plants can cause either a compatible response with a successful
infection of the plant or an incompatible response where the plant becomes
resistant to the parasite. In compatible interactions, the parasite is often
recognized too late and the outcome will be a diseased plant. In the case of an
incompatible interaction, the plant rapidly recognizes the parasite and induces
resistance mechanisms, which act very effectively against the invader (Métraux,
2001).
Induced responses to viruses, fungi, bacteria and certain insects generally
require a specific interaction between plant and pathogen, which is described by
the ‘gene-for-gene’ hypothesis (Flor, 1971). For a plant to be resistant to a
specific pathogen race the plant must carry a resistance (R) gene that corresponds
to an avirulence (Avr) gene of the pathogen. Briefly, the R-genes encode receptors
for Avr-specified ligands, and by a direct or indirect interaction between R-gene
and Avr-gene products the induced defense response is triggered.
The induced resistance response to pathogens can be divided into a local
response at the site of infection and a systemic response in remotely located, yet
unaffected plant parts. This induced systemic response is referred to as systemic
acquired resistance (SAR) (Métraux et al., 2002).
The local response includes modifications of the cell wall composition in
surrounding cells as well as synthesis of antimicrobial compounds such as
phytoalexins and pathogenesis-related (PR) proteins. Another feature of the
primary, local response is the activation of a controlled process of cell death,
which is called the hypersensitive reaction (HR) and will be considered in detail
later on (Heil & Bostock, 2002).
The initial local defense response is followed by a signal spreading
throughout the plant that induces changes in gene expression in uninfected distant

9
parts of the plant. This systemic response involves the onset of PR protein
production and sometimes also phytoalexin synthesis (Heil & Bostock, 2002). The
systemic signal can also alert the remote tissue to a faster defense response after
challenging the infection, for example faster induction of cell wall lignification
(Métraux et al., 2002). SAR is regarded to be active against the major pathogen
groups; viruses, fungi and bacteria, and is conferring resistance not only to the
pathogen initiating the response but also to other pathogens. This resistance is
rather non-specific and long lasting (Heil & Bostock, 2002). SAR has been
demonstrated in over 30 plant species belonging to both mono- and
dicotyledonous plant families (Métraux et al., 2002).
PR proteins induced by SAR can be divided into many different families
(Christensen et al., 2002), where the function still is unknown for most of them.
Some families contain proteins with chitinase or β-1,3-glucanase activity. These
proteins hydrolyze chitin and β-1,3-glucan, respectively, which are important
components of many fungal cell walls. Chitinases and β-1,3-glucanases have also
been shown to possess antifungal activity in vitro (Mauch et al., 1988; Sela-
Buurlage et al., 1993).
In contrast to these, plants must have the following properties to protect
themselves from pathogen attacks:
1. A plant must not give the opportunity of being recognized by pathogens as
a host.
2. A plant must have protections against the pathogens infiltration
3. A plant must have proper systems to prevent the reproduction of infiltrated
pathogens and, even if it is affected by pathogens, minimize the probability of
being killed by them.
10
1.2.2. Signaling Pathways
During plant-pathogen interaction, the recognition of an invading pathogen
activates a signal transduction pathway that results in rapid induction of many
plant defense mechanisms.
Salicylic acid (SA) is a key component of the signal transduction pathway
leading to SAR. The levels of SA increase both locally and systemically after an
infection event and the SAR induction is preceded by an increase of SA in the
phloem. The SAR signaling pathway is not a linear chain of events but rather a
complex network. Several pathways cooperate and then cause defense responses
to target at various pathogens (Métraux et al., 2002). One distinct branching point
occurs downstream of SA with one branch related to PR protein production
involved in resistance to fungal and bacterial pathogens and another branch
conferring resistance to viruses. Depending on virus, virus-specific branch
includes different mechanisms for virus resistance such as inhibition of
replication, inhibition of cell-to-cell movement and inhibition of long-distance
movement (Murphy et al., 2001).
While SA-dependent SAR is generally induced by and active against various
pathogens, a wound response is active mainly against herbivores. This response is
induced by insect feeding and wounding, and results in a local defense reaction at
the wound site as well as systemic responses that are transmitted throughout the
plant. The defense response can be divided into direct and indirect responses. The
direct responses include the production of anti-nutritive and toxic compounds
such as proteinase inhibitors, polyphenol oxidases, alkaloids, terpenoids and
phenolics as well as the formation of physical barriers. The indirect responses are
constituted by the production of volatile compounds that attract predators and
parasitoids of the attacking insects and repel herbivorous insects (Kessler &
Baldwin, 2002).

11
Jasmonic acid (JA) is a central signaling molecule of induced plant
responses to herbivores. Insect feeding or mechanical wounding is triggering the
induced response where both oligosaccharides and oligogalacturonides released
from damaged cell walls. The second step of the cascade is the release of linolenic
acid from membrane lipids, which is then enzymatically converted to JA. Genes
encoding proteinase inhibitors and enzymes involved in production of volatile
compounds or secondary compounds, such as nicotine and numerous phenolics, as
well as other defense-related compounds are transcriptionally activated by JA
(Heil & Bostock, 2002).
1.3. Transgenic Strategies against Diseases
Although plants develop defense measures against pathogens, including both
constitutive and induced defenses, they are still not always able to combat the
invader. Even though new plant defense responses have evolved, like new R-
genes, there is also a constant evolution of the parasites so that defense
mechanisms may be overcome. One advantage of gene technology is that new
defense factors which the parasites have not encountered before and thus not
started to adapt yet, can be introduced into plants.
1.3.1. Strategies against viral diseases
The strategies for conferring virus resistance in plants by genetic
engineering can be divided into two groups. The first group includes various
strategies in which a plant is transformed with a gene, or part of a gene, from the
virus against which resistance is desired. This strategy is named pathogen-derived
resistance and can normally be explained by the virus-derived transgene
interfering with essential steps in the life cycle of the infecting virus. The second
group includes various strategies such as host resistance genes and other genes
involved in defense responses that do not include viral genes

12
1.3.1.1. Studies regarding Pathogen-derived Resistance
Pathogen-derived resistance can be subdivided into different groups
depending on which viral gene is involved. The most commonly used genes are
coat protein genes, replicase genes and movement protein genes.
The first example of virus resistant transgenic plants was published by
Powell-Abel et al. (1986) describing tobacco plants transformed with the coat
protein gene of Tobacco mosaic virus (TMV) displaying improved resistance
against TMV. Seedlings of transgenic plants that expressed the coat protein
demonstrated significant delay in symptom development when inoculated with
TMV.
Since this first demonstration, coat protein strategy has been extensively
used for resistance against numerous viruses belonging to different groups in
many crop plants as well as ornamentals (Liao et al., 2004; Yang et al., 2004).
The approach of coat protein-mediated resistance has also been shown to be
commercially applicable and a famous example of this, transgenic papaya, which
is resistant to Papaya ring spot virus (Gonsalves, 2004).
Another type of gene used for conferring pathogen derived resistance is
genes encoding viral replicase proteins. This technique is firstly developed against
TMV (Golemboski et al., 1990). Resistance mediated by replicase genes often
confers a high level of protection but is generally only effective against viruses
closely related to the source of the transgene. The efficiency of this strategy has
also been confirmed in field trials and a commercial product combining resistance
to the Polerovirus Potato leaf roll virus with resistance to Colorado potato beetle
in transgenic Russet Burbank potatoes has been developed (Lawson et al., 2001).
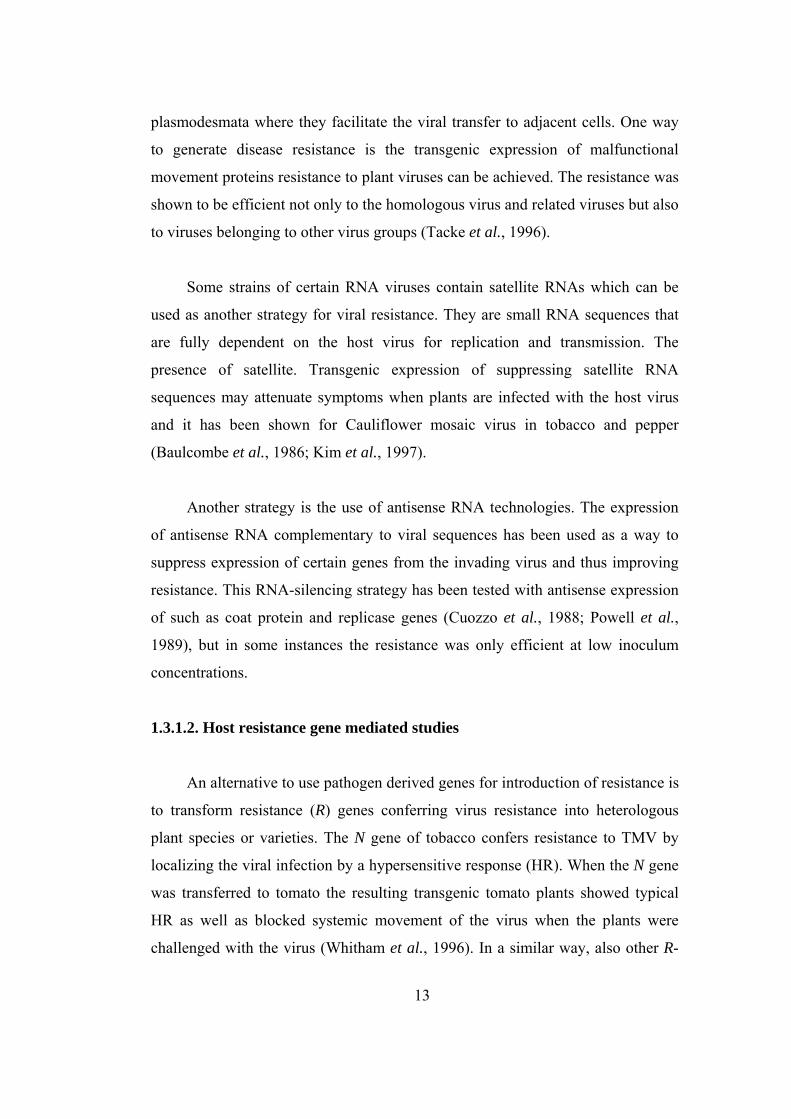
Plant viruses encode movement proteins that are required for viral cell-to-
cell transport. These proteins contain nucleic acid binding domains and localize to
13
plasmodesmata where they facilitate the viral transfer to adjacent cells. One way
to generate disease resistance is the transgenic expression of malfunctional
movement proteins resistance to plant viruses can be achieved. The resistance was
shown to be efficient not only to the homologous virus and related viruses but also
to viruses belonging to other virus groups (Tacke et al., 1996).
Some strains of certain RNA viruses contain satellite RNAs which can be
used as another strategy for viral resistance. They are small RNA sequences that
are fully dependent on the host virus for replication and transmission. The
presence of satellite. Transgenic expression of suppressing satellite RNA
sequences may attenuate symptoms when plants are infected with the host virus
and it has been shown for Cauliflower mosaic virus in tobacco and pepper
(Baulcombe et al., 1986; Kim et al., 1997).
Another strategy is the use of antisense RNA technologies. The expression
of antisense RNA complementary to viral sequences has been used as a way to
suppress expression of certain genes from the invading virus and thus improving
resistance. This RNA-silencing strategy has been tested with antisense expression
of such as coat protein and replicase genes (Cuozzo et al., 1988; Powell et al.,
1989), but in some instances the resistance was only efficient at low inoculum
concentrations.
1.3.1.2. Host resistance gene mediated studies
An alternative to use pathogen derived genes for introduction of resistance is
to transform resistance (R) genes conferring virus resistance into heterologous
plant species or varieties. The N gene of tobacco confers resistance to TMV by
localizing the viral infection by a hypersensitive response (HR). When the N gene
was transferred to tomato the resulting transgenic tomato plants showed typical
HR as well as blocked systemic movement of the virus when the plants were
challenged with the virus (Whitham et al., 1996). In a similar way, also other R-

14
genes, such as the potato Rx gene conferring resistance to Potato virus X, have
been shown to be functional when transferred to tobacco (Bendahmane et al.,
1999)
Another strategy about host resistance is ribosome-inactivating proteins,
which have antiviral properties. A protein of this type from pokeweed (Phytolacca
americana) was expressed in tobacco and potato, and was shown to confer broad-
spectrum virus resistance both when inoculated mechanically and by aphids
(Lodge et al., 1993). However these proteins may also be toxic to the transgenic
host plant. Therefore, less toxic forms of ribosome inactivating proteins have been
used that still confers virus resistance but without affecting the host ribosome’s
(Zoubenko et al., 2000).
Production of particular protein inhibitors also result in disease resistance.
By expression of cysteine proteinase inhibitors in transgenic plants, virus
replication and propagation can be blocked. In transgenic tobacco plants
expressing oryzacystatin, a cysteine proteinase inhibitor from rice, there was a
clear positive correlation between resistance to potyviruses and expression of
oryzacystatin (Gutierrez-Campos et al., 1999).
The expression of antibodies, so called plantibodies, which recognize plant
viruses, is another approach for conferring virus resistance in transgenic plants.
Single chain variable regions of monoclonal antibodies raised against a virus have
been expressed in transgenic plants, which upon challenge with the corresponding
virus demonstrated delayed symptom development and reduced incidence of
infection (Tavladoraki et al., 1993).
Interferons are mammalian proteins inducing various defense mechanisms
that ultimately inhibit viral replication. One of these defense reactions is the 2-5A
system, where 2’-5’ oligoadenylate synthetase (2-5 Aase) makes 2’-5’
oligoadenylates (2-5A) in response to double stranded viral RNA. The formed

15
2-5A then activates ribonuclease L (RNAseL), which degrade RNAs. Transgenic
potato plants constitutively expressing 2-5 Aase have been shown to be protected
against Potato virus X infection, also under field conditions (Truve et al., 1993).
1.3.2. Strategies against bacterial and fungal diseases
While there are many successful examples of transgenic resistance to
viruses, transgenic resistance to fungi and bacteria has generally been more
difficult to accomplish and so far there are no commercial applications. The first
efforts included the expression of single proteins, such as pathogenesis related
proteins and other proteins and peptides with antimicrobial effects. More recently,
due to the increasing knowledge about genes involved in plant defense pathways,
the utilization of more complex defense responses has become possible.
1.3.2.1. Transformation of antimicrobial genes
As a general strategy, peptides and proteins with antimicrobial activities
have been evaluated as transgenic resistance factors. Some plant-derived
antimicrobial peptides, for example puroindolines from wheat and a novel peptide
from Macadamia integrifolia nuts, have demonstrated antifungal effects in
transgenic plants (Kazan et al., 2002). Antimicrobial peptides of animal origin
have also been assayed in transgenic plants. When the sarcotoxin gene from flesh
fly was expressed in transgenic tobacco enhanced resistance against both bacterial
and fungal pathogens were obtained (Mitsuhara et al., 2000). In addition to
naturally occurring antimicrobial peptides, also synthetic peptides have been
designed and expressed in transgenic plants conferring improved resistance to
bacterial and fungal pathogens (Cary et al., 2000).
An example of proteins with antimicrobial activities are the ribosome
inactivating proteins, that have been shown to confer resistance to fungal infection
by inactivating foreign ribosomes (Logemann et al., 1992). Other examples of

16
antimicrobial proteins are the antifungal proteins derived from a virus infecting
Ustilago maydis (Clausen et al., 2000) and from Aspergillus giganteus (Coca et
al., 2004) that have shown potential as transgenic resistance factors against fungal
infection. Also antimicrobial proteins of animal origin, such as human lysozyme,
have been demonstrated to improve bacterial and fungal resistance when
expressed in transgenic plants (Nakajima et al., 1997).
Another possible target for transgenic resistance against fungal pathogens is
the inactivation of pathogen produced enzymes and toxins which are needed for
infection. During infection, fungal pathogens often produce plant cell wall
degrading enzymes, such as polygalacturonase, as well as various toxins, such as
oxalic acid and mycotoxins. The expression of a polygalacturonase inhibitor
protein in tomato was able to reduce Gray-mold rot disease which is caused by
Botrytis cinerea (Powell et al., 2000).
1.3.2.2. Over-expression of plant defense related genes
Two pathogenesis related proteins, chitinase and β-1,3-glucanase have been
extensively studied in transgenic plants. Firstly, it was demonstrated that
heterologous expression of a bean chitinase in oilseed rape and tobacco could
reduce the susceptibility to Rhizoctonia solani (Broglie et al., 1991). Since then
chitinases of various classes from different plant species and other sources, have
been expressed in a large number of crops with effects against various fungal
pathogens (Pappinen et al., 2002). The effects demonstrated have mainly been a
reduction of fungal development and reduced number and size of lesions. Also,
partial resistance to fungal infection has been demonstrated in field trials (Grison
et al., 1996). When chitinase and β-1,3-glucanase enzymes are combined, they
can act synergistically with improved suppressive effects on fungal infection.
Transgenic tobacco has shown improved disease resistance when barley chitinase
and β-1,3-glucanase were simultaneously expressed in tobacco while the
resistance was stronger than their individual expressions (Jach et al., 1995).
17
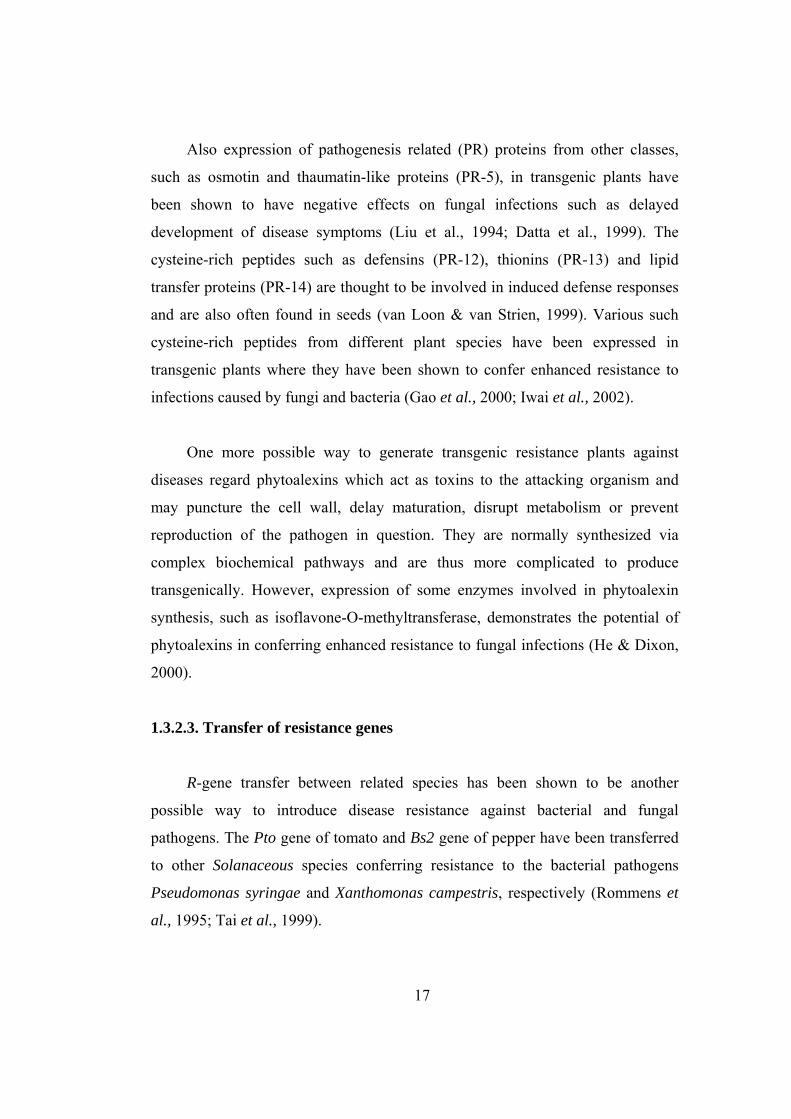
Also expression of pathogenesis related (PR) proteins from other classes,
such as osmotin and thaumatin-like proteins (PR-5), in transgenic plants have
been shown to have negative effects on fungal infections such as delayed
development of disease symptoms (Liu et al., 1994; Datta et al., 1999). The
cysteine-rich peptides such as defensins (PR-12), thionins (PR-13) and lipid
transfer proteins (PR-14) are thought to be involved in induced defense responses
and are also often found in seeds (van Loon & van Strien, 1999). Various such
cysteine-rich peptides from different plant species have been expressed in
transgenic plants where they have been shown to confer enhanced resistance to
infections caused by fungi and bacteria (Gao et al., 2000; Iwai et al., 2002).
One more possible way to generate transgenic resistance plants against
diseases regard phytoalexins which act as toxins to the attacking organism and
may puncture the cell wall, delay maturation, disrupt metabolism or prevent
reproduction of the pathogen in question. They are normally synthesized via
complex biochemical pathways and are thus more complicated to produce
transgenically. However, expression of some enzymes involved in phytoalexin
synthesis, such as isoflavone-O-methyltransferase, demonstrates the potential of
phytoalexins in conferring enhanced resistance to fungal infections (He & Dixon,
2000).
1.3.2.3. Transfer of resistance genes
R-gene transfer between related species has been shown to be another
possible way to introduce disease resistance against bacterial and fungal
pathogens. The Pto gene of tomato and Bs2 gene of pepper have been transferred
to other Solanaceous species conferring resistance to the bacterial pathogens
Pseudomonas syringae and Xanthomonas campestris, respectively (Rommens et
al., 1995; Tai et al., 1999).

18
Correspondingly, resistance to the fungus causing apple scab was introduced
into a susceptible apple cultivar by transformation with the HcrVf2 gene from the
wild species Malus floribunda 821 (Belfanti et al., 2004). Successful examples of
transfer of R-genes have normally taken place between related species. However,
for the RPW8 genes of Arabidopsis thaliana, it has been shown that these are
functional against powdery mildew also when transferred to tobacco (Xiao et al.,
2003).
A possibly more broad-spectrum approach to make use of R-genes and the
SAR-pathway has also been described. According to this approach transgenic
plants are transformed with pathogen Avr-genes under control of a heterologous
infection-inducible promoter. If the generated transgenic plant carries the
corresponding R-gene, a defense response will be initiated upon infection. One
example in this direction is the pathogen-inducible expression in tobacco of the
elicitor named cryptogein from Phytophthora cryptogea, a likely avirulence factor
of Phytophthora spp. (Keller et al., 1999).
1.3.2.4. Defense Signaling related studies
Different steps in plant defense pathways have been evaluated to get a better
understanding of defense responses and potentially produce transgenic plants with
improved defense systems. One step in the defense-signaling cascade that has
been evaluated is the NPR1 gene from Arabidopsis, which regulates salicylic acid
signaling (Chern et al., 2001). When NPR1 was overexpressed in Arabidopsis as
well as in rice, plants with stronger PR protein induction and enhanced bacterial
and fungal resistance were generated. When bacterial SA-generating enzymes
were expressed in transgenic tobacco, SA accumulation was substantially
increased and PR proteins were constitutively expressed conferring enhanced
resistance to fungal, as well as viral, infections (Verberne et al., 2000).

19
Also expression of a transcriptional regulatory protein gene, Tsi1 from
tobacco, induced constitutive expression of PR proteins and conferred broad-
spectrum resistance to both bacterial and viral diseases (Shin et al., 2002). When
the Prf gene which is involved in resistance to Pseudomonas syringae in tomato,
was overexpressed in tomato, the transgenic plants displayed constitutively
activated SAR with enhanced SA accumulation, constitutive PR protein synthesis
and broad-spectrum resistance to bacterial and viral pathogens (Oldroyd &
Staskawicz, 1998).
Another defense pathway step that has been modified is the expression of
enzymes that generates reactive oxygen species. ROS play role in defense
signaling and stimulate the plant resistance systems. Plants transformed with
glucose oxidase genes that generate hydrogen peroxide, displayed enhanced
tolerance to a broad spectrum of bacteria and fungi but also distorted plant growth
(Wu et al., 1995). Careful regulation of the glucose oxidase expression by
pathogen-inducible promoters may overcome these negative effects (Kachroo et
al., 2003).
1.3.2.5. RNA interference and Plantibodies
Gene silencing by RNA interference has been applied as a method to confer
improved tolerance against the crown gall-causing bacterium Agrobacterium
tumefaciens. Transformation of Arabidopsis and tomato by inverted repeats of the
bacterial oncogenes resulted in plants that could still be infected by A. tumefaciens
but where the formation of crown galls was completely prevented (Escobar et al.,
2001).
As for virus resistance, expression of antibodies which can bind to pathogen
or pathogen products has been proposed as a strategy for conferring resistance to
fungi and bacteria. However, so far the examples are very limited. Peschen et al.
(2004) have expressed fusion proteins comprising chicken-derived single-chain
20
antibody fragments against Fusarium graminearum linked to antifungal peptides
in Arabidopsis thaliana. When the transgenic plants were challenged with
Fusarium oxysporum a high level of protection was obtained, whereas expression
of either antibody or antifungal peptides alone resulted in moderate levels of
protection only.
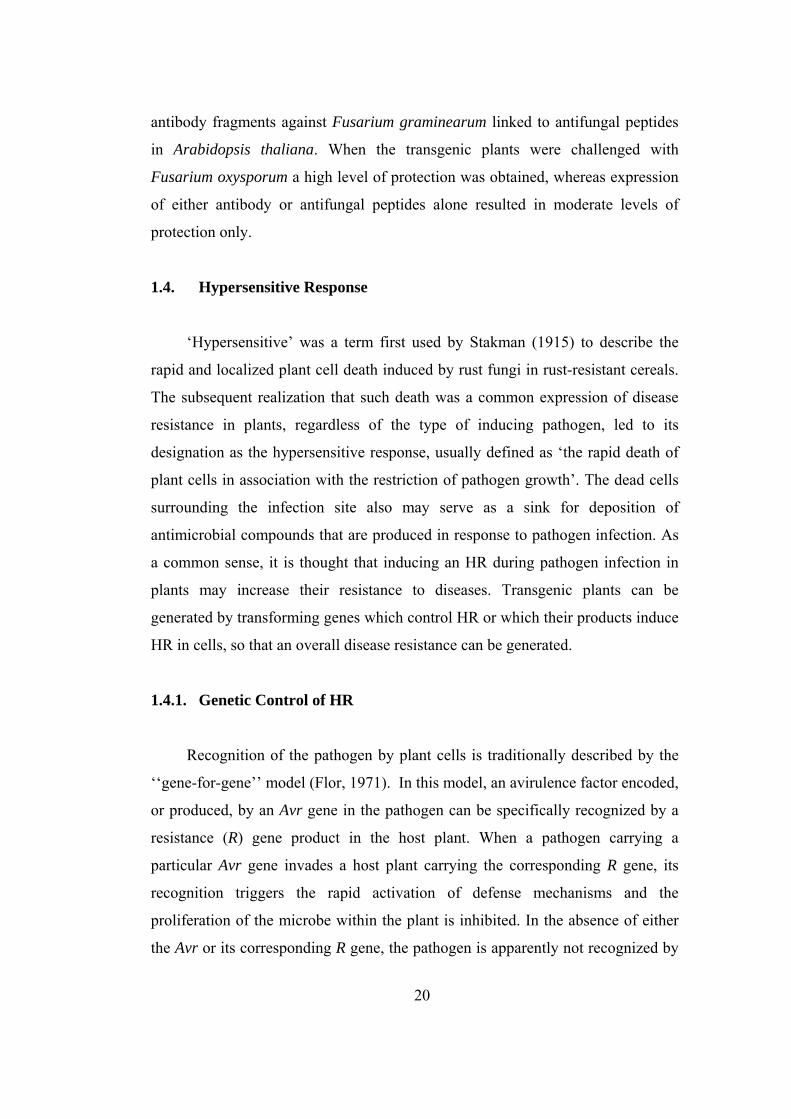
1.4. Hypersensitive Response
‘Hypersensitive’ was a term first used by Stakman (1915) to describe the
rapid and localized plant cell death induced by rust fungi in rust-resistant cereals.
The subsequent realization that such death was a common expression of disease
resistance in plants, regardless of the type of inducing pathogen, led to its
designation as the hypersensitive response, usually defined as ‘the rapid death of
plant cells in association with the restriction of pathogen growth’. The dead cells
surrounding the infection site also may serve as a sink for deposition of
antimicrobial compounds that are produced in response to pathogen infection. As
a common sense, it is thought that inducing an HR during pathogen infection in
plants may increase their resistance to diseases. Transgenic plants can be
generated by transforming genes which control HR or which their products induce
HR in cells, so that an overall disease resistance can be generated.
1.4.1. Genetic Control of HR
Recognition of the pathogen by plant cells is traditionally described by the
‘‘gene-for-gene’’ model (Flor, 1971). In this model, an avirulence factor encoded,
or produced, by an Avr gene in the pathogen can be specifically recognized by a
resistance (R) gene product in the host plant. When a pathogen carrying a
particular Avr gene invades a host plant carrying the corresponding R gene, its
recognition triggers the rapid activation of defense mechanisms and the
proliferation of the microbe within the plant is inhibited. In the absence of either
the Avr or its corresponding R gene, the pathogen is apparently not recognized by
21
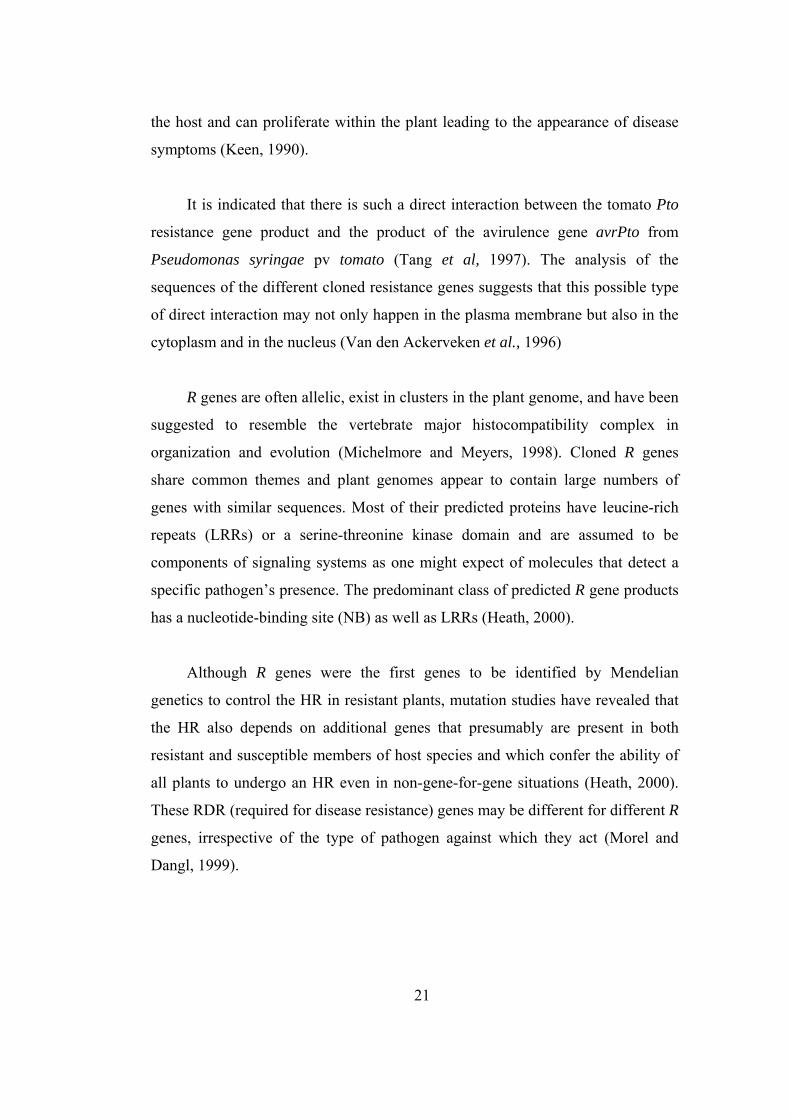
the host and can proliferate within the plant leading to the appearance of disease
symptoms (Keen, 1990).
It is indicated that there is such a direct interaction between the tomato Pto
resistance gene product and the product of the avirulence gene avrPto from
Pseudomonas syringae pv tomato (Tang et al, 1997). The analysis of the
sequences of the different cloned resistance genes suggests that this possible type
of direct interaction may not only happen in the plasma membrane but also in the
cytoplasm and in the nucleus (Van den Ackerveken et al., 1996)
R genes are often allelic, exist in clusters in the plant genome, and have been
suggested to resemble the vertebrate major histocompatibility complex in
organization and evolution (Michelmore and Meyers, 1998). Cloned R genes
share common themes and plant genomes appear to contain large numbers of
genes with similar sequences. Most of their predicted proteins have leucine-rich
repeats (LRRs) or a serine-threonine kinase domain and are assumed to be
components of signaling systems as one might expect of molecules that detect a
specific pathogen’s presence. The predominant class of predicted R gene products
has a nucleotide-binding site (NB) as well as LRRs (Heath, 2000).
Although R genes were the first genes to be identified by Mendelian
genetics to control the HR in resistant plants, mutation studies have revealed that
the HR also depends on additional genes that presumably are present in both
resistant and susceptible members of host species and which confer the ability of
all plants to undergo an HR even in non-gene-for-gene situations (Heath, 2000).
These RDR (required for disease resistance) genes may be different for different R
genes, irrespective of the type of pathogen against which they act (Morel and
Dangl, 1999).

22
1.4.2. Elicitors involved in HR
In addition to Avr gene products, pathogens have a variety of components or
secretory products, such as arachidonic acid, cell wall carbohydrates,
glycoproteins and proteins, that can elicit plant defense responses and, in some
cases, cell death (Chen and Heath, 1994). There is no requirement for the presence
of a living pathogen to trigger the HR and certain purified elicitors can induce
many of the physiological changes occurring during disease resistance and lesions
resembling the HR (He et al, 1993)
One of these elicitors, harpin, induces HR in non-host plants of bacteria.
They are glycine-rich, protease-sensitive, heat-stable, acidic proteins produced by
Gram-negative pathogenic bacteria and are governed by the hrp (HR and
pathogenicity) gene cluster (Bonas, 1994). Application of harpin to various plant
species enhances plant growth, and induces resistance to pathogens and insects
(Kim and Beer, 2000). These effects were found first in plants treated with harpin
from Erwinia amylovora, the first reported bacterial cell-free HR elicitor (Wei et
al., 1992).
Three genera of plant bacterial pathogens, Erwinia, Pseudomonas, and
Ralstonia export harpins via the type III protein secretion system. It has been
suggested, but not yet proven, that harpins perform various functions by activating
distinct signaling pathways. Genetic evidence indicates that harpins may play a
minor role in bacterial elicitation of the HR, but it may assist the delivery of other
pathogenesis proteins across the plant cell wall (Galan and Collmer, 1999). HR
induced by harpin from Erwinia amylovora or Pseudomonas syringae pv.
syringae was prevented by inhibition of calcium influx and ATPase activity in
tobacco cell suspensions (He et al., 1993). Harpin has a pronounced effect on the
plasmalemma, affecting H+-ATPase, ion channels or membrane carriers. These
results indicate that the site of harpin action is the plant cell membrane and cell
wall (Pike et al., 1998)

23
1.4.3. Signal Transduction pathways leading to HR
Some of the early events associated with the HR involve rapid generation of
reactive oxygen species (ROS), the so-called oxidative burst (Tenhaken et al.,
1995), and a rapid flux of ions across the plasma membrane, the so-called XR
(Nurnberger et al., 1994). Although the role of the XR in inducing the HR is not
clear, ROS have direct antimicrobial activities and can therefore reduce pathogen
viability. They have also been implicated in the destruction of the challenged
plant cells, either through lipid peroxidation or function as a key factor mediating
programmed cell death (Bethke and Jones,2001).
H2O2, the most stable ROS, functions as a local trigger for the programmed
death of challenged cells and as a diffusible signal to induce resistance genes in
surrounding cells (Levine et al., 1994). Furthermore, H2O2 plays a role in the
phenomenon of cross-tolerance, in which exposure to one stress can induce
tolerance to other stresses (Bowler and Fluhr, 2000). Several possible sources of
ROS in plants and a number of biotic and abiotic stresses can stimulate oxidative
burst. In order to summarize, overall representation of the events taking place
during HR process is given in figure 1.1
The signal transduction pathway that leads to the activation of the HR was
also suggested to involve increases in Ca2+
flux and protein phosphorylation
(Levine et al., 1994). Plants commonly respond to external stimuli, including
microbial elicitors of cell death and defense responses, by calcium influx into the
cell. An increase in cytosolic calcium precedes, and seems necessary for,
hypersensitive cell death triggered by rust fungi (Xu and Heath, 1998) and the
calcium channel blocker La3+
prevents bacterial-induced HR in soybean leaves
(Levine et al., 1994).

24
Figure 1.1 An overall representation of the events taking place during HR
process. The defense responses are composed of defense gene activation
(structural proteins, phytoalexins biosynthesis genes, anti-fungal proteins) and
productions of endonucleases and proteases(Morel and Dang, 1999; Heath, 2000).
Elicitor
Recognition of pathogen signals
Receptor (membrane bound or cytoplasmic)
Ion fluxes (XR) Ca2+, H+, K+
Extracellular ROS production
ROS perception Intracellular signalling
Lipid peroxidation (membrane damage)
Transcriptional activation
H2O2
CELL DEATH
Release of endogenous elicitors and competency
factors
Generation and movement of long-
distance signals
Induction of defense responses and
elicitation competency in adjacent cells
Induction of Systemic Acquired Resistance
in whole plant
25
Although the signal transduction events that lead to the activation of HR and
defense mechanisms during the HR are controlled by a single gene-for-gene
interaction (R in the plant and Avr in the pathogen), it appears as if two distinct
pathways may be set into motion by this recognition event. One pathway controls
the activation of HR whereas the other controls the induction of PR proteins and
perhaps other defense mechanisms.
1.4.4. Reactions of HR process
Unlike mammalian apoptosis, the reactions during plant programmed cell
death and HR can not be generalized yet. The first observable sign of the HR
occurs a few hours after the pathogen enters the cell although the induction of
hypersensitive cell death depends on changes in cytosolic calcium levels (Mould
et al., 1999). Cell death becomes irreversible at the point where microtubules
disappear and cytoplasmic streaming ceases, then the cell undergoes a prolonged
disassembling of the protoplast which may take several hours and consecutively
involves the appearance of particles showing Brownian motion in the plant
vacuole, cleavage of nuclear DNA and the intracellular generation of hydrogen
peroxide (Heath et al., 1997). Finally, the plasma membrane loses its semi-
permeability and the protoplast shrinks in a manner suggestive of contraction
rather than loss of turgor. The cell then becomes brown, most probably due to the
accumulation and oxidation of phenolic compounds secreted by surrounding cells
and granules of nucleic acid appear in the plant nucleus (Škalamera et al., 1998).
During the death process in some forms of mammalian apoptosis, the release
of cytochrome c from mitochondria causes the cascading activation of a family of
cysteine proteases known as caspases that results in the degradation of a number
of cell components including poly (ADP-ribose) polymerase (Green and Reed,
1998). Plant cells contain similar proteases. Data from D’Silva et al., (1998) and
del Pozo and Lam (1998) suggest that the dismantling of the cell during the HR
involves the activation of cysteine proteases as it does during mammalian

26
apoptosis. However, plants can produce a variety of proteolytic enzymes and in a
virus system at least, it seems likely that other proteases are involved as they are
in developmental forms of programmed cell death in plants and some forms of
elicitor-induced cell death (Groover and Jones, 1999).
Another hallmark of apoptosis is the cleavage of nuclear DNA into
oligonucleosomal fragments, producing a ‘ladder’ of DNA when run on agarose
gels. Plant DNA cleavage has been reported for fungus-, bacteria-and virus-
induced HR (Levine et al., 1996) but its timing during the death process varies
and it results in a DNA ladder only during the fungus-induced response (Mittler et
al., 1997)
1.5. Plant ferredoxin-like protein (PFLP)
Recently, a plant ferredoxin-like protein was reported to increase the
generation of harpin mediated ROS production and HR in tobacco suspension
cells by Lin et al. (1997). It is thought that generating transgenic tobacco with
pflp gene can confer resistance to various harpin producing pathogenic bacteria.
1.5.1. Structure of PFLP
A 662 bp full-length cDNA clone (Figure 1.2) encoding native PFLP protein
was isolated from sweet pepper and characterized by Drakkar et al. in 2003. When
pflp was sub-cloned to an E.coli vector and recombinant proteins was expressed, it
had been understood that the recPFLP was same as native PFLP by SDS-PAGE
analysis with Anti-PFLP polyclonal antibodies. The actual molecular weight of
the native PFLP protein and recombinant PFLP protein in mass
spectrophotometric analysis and based on amino acid sequence analysis was
evaluated as 12.58 kDa.

27
Figure 1.2 Nucleotide and deduced amino acid sequence of pflp cDNA from
sweet pepper. The 144 deduced amino acid sequence indicates the 432 bp open
reading frame. The shaded region shows the putative 2Fe-2S domain. The box
area indicates the casein kinase II phosphorylation site. Underlined area indicates
the N-myristoylation site. The stop codon is indicated by ∗. “ ” indicates a
putative signal peptide region (Dayakar et al., 2003).
Sequence comparison in database searches suggested that the PFLP protein
is a ferredoxin-I containing a Ser- and Thr-rich N-terminal signal peptide of 47
amino acids targeting to chloroplast and putative 2Fe-2S domain. The PFLP
protein sequence showed identity to Lycopersicon esculentum ferredoxin-I (72%),
pea ferredoxin-I (52%), Arabidopsis thaliana ferredoxin A (54%), Spinacia
oleracea ferredoxin-I (52%), Oryza sativa ferredoxin (56%) and maize ferredoxin

28
(48%). These ferredoxins are thought to be electron carriers in photosynthetic
tissues. Among these sequence comparisons, it showed maximum positional
identity with L. esculentum ferredoxin-I. Sequence comparison showed the
highest amino acid homology with ferredoxin-I of L. esculentum, sharing an
identity of 72% and a similarity of 81% (Dayakar et al., 2003).
1.5.2. Function of PFLP in HR
The function of PFLP in HR is not yet clear but it is suggested that PFLP
may interfere with the interaction between harpin and a putative receptor, and also
with the Avr gene/R-gene mediated HR induction (Keen, 1990). In one study,
inhibition of the harpin-mediated HR by PFLP was shown to be dosage-dependent
and revealed a competitive pattern. PFLP may interact with harpin as a putative
receptor so as to prevent the binding between receptor and the active fragment of
harpin. In this way, harpin may retain its ability to activate an HR via the signal
transduction system (Lin et al., 1997).
The production of reactive oxygen species (ROS) is one of the earliest
events during HR and considered as a characteristic of plant defense responses
(Levine et al., 1994) Moreover, PFLP protein is a ferredoxin that is involved in
many redox reactions leading to the production of ROS and it is found that PFLP
enhances ROS production, so as a result intensifies the harpin-mediated HR
(Dayakar et al., 2003).
1.5.3. Transformation studies with PFLP
Several transformation studies were conducted with pflp in different plant
species. Initially, transgenic rice expressing PFLP was produced by Tang et al.
(2001). It is thought to raise resistance against one of the most devastating
diseases of rice in Africa and Asia, bacterial leaf blight, which is caused by the
Gram-negative bacterium, Xanthomonas oryzae pv. oryzae (Xoo). Indeed,

29
transgenes show resistance to Xoo race 6 but not to all races. Likewise in another
study, transgenic plants over-expressing a rice resistance gene Xa21, show
enhanced resistance to bacterial blight caused by most Xoo races but not all
(Wang et al., 1996). There is always the danger that susceptible pathogens will
evolve resistance to the transgenes used against them. So the resistance genes and
defense stimulating genes can be used in combination and their effect would be
cumulative.
Another study shows that pflp confers resistance against soft rot disease
which is caused by Erwinia carotovora in Oncidium orchid even when the entire
plant was challenged with the pathogen (Liau et al., 2003). There has been an
enormous effort to improve ornamental plant traits such as disease resistance and
this study is one of the first to introduce resistance to diseases. One more
importance of this study was being the first successful production of transgenic
orchids using Agrobacterium –mediated transformation. A different study reveals
that pflp can be used as a novel selection marker in genetic transformation of
Oncidium orchid (You et al., 2003). E. carotovora was used as a selection
reagent to screen transformants without the use of an antibiotic agent as pflp
confers resistance to this pathogen. However, using other crop plants which are
not natural hosts of E. carotovora as transformation materials might be the
limitation of this selection system.
1.6. Aim of the study
The objective of the present study was to assess the influence of pflp gene
expression in transgenic tobacco (Nicotiana tabacum cv. Samsun) plants and
develop PFLP mediated hypersensitive response for various harpin producing
pathogens.

30
CHAPTER II
MATERIALS AND METHODS
2.1. Materials
2.1.1. Bacterial strains and plasmid
The supervirulent Agrobacterium tumefaciens strain EHA105 (Hood, 1993)
containing pSPFLP was used in plant transformation studies. A DNA fragment,
containing a cauliflower mosaic virus (CaMV) 35S promoter, a pflp coding
sequence (including the signal peptide) and a nopaline synthase (nos) poly(A),
was excised from pBIAP1 by digestion with EcoRI and HindIII (Tang et al. 2001)
and cloned into the EcoRI and HindIII site of pCAMBIA 1304 to form pSPFLP
(Appendix A). The bacteria were donated kindly by Dr. Ming-Tsair Chan, from
Institute of BioAgricultural Sciences, Academica Sinica, Taipei, Taiwan,
Republic of China.
Pseudomonas syringae pv. syringae and Pseudomonas syringae pv. pisi
were used for Hypersensitivity Response (HR) assays and was kindly donated by
Dr. Fikrettin Şahin, Atatürk Üniversitesi, Erzurum, Turkey.
2.1.2. Bacterial Culture Media and Culture Conditions
Nutrient broth, yeast extract, sucrose and magnesium sulphate containing
Yeast Extract Broth (YEB) was used to grow A. tumefaciens EHA105 strain. Also

31
the medium was supplemented with 20 mg/L Rifampicin and 50 mg/L Kanamycin
for bacterial selection.
Also, for Pseudomonas syringae strains, Yeast Extract Broth (YEB) medium
was preferred. The composition of bacterial culture medium is provided in
Appendix B.
All the bacterial cultures were grown with a 180-200 rpm (revolution per
minute) in a Sanyo Gallenkamp shaker at 28°C. When needed 1.5% agar was
added to solidify the media. A liquid aliquot of each bacterial strain was kept at –
800C in 20% glycerol and at -20°C in 50% glycerol for longer storage.
2.1.3. Plant Material and Tissue Culture Media
Throughout the tissue culture and transformation studies of this work, seeds
and leaves of Nicotiana tabacum L. cultivar Samsun were used as the explant
source.
MS (Murashige and Skoog, 1962) based media containing MS micro-macro
elements and vitamins with additions of sucrose and agar were used for all plant
tissue culture media. The composition of the media is presented in Appendix C.
The entire medium was dissolved in distilled water, and then pH of the
medium was adjusted to 5.7-5.8 with NaOH. Finally the medium was sterilized by
autoclaving at 1210C for 15 minutes. Filter sterilized plant growth regulators and
antibiotics (naphtalenaceticacid [NAA], benzylaminopurine [BA], cefotaxime,
rifampicin, and kanamycin) were added freshly to the sterile medium. The
composition and the purpose of the media are given in Table 2.1.

32
Table 2.1 The composition and the purpose of plant tissue culture media
2.1.4. Plant Tissue Culture Conditions
All plant tissue cultures were incubated at 24±2ºC under fluorescent light at
100 µmol m-2s-1 with a 16/8 hour (light/dark) photoperiod.
2.1.5. Other Chemicals and Materials
The chemicals used in this study were purchased from Sigma Chemical
Company (N.Y., USA), Merck Chemical Company (Deisenhofen, Deutschland),
Applichem (Darmstadt, Germany), and Duchefa (Haarlem, The Netherlands).
Other chemicals and enzymes used in molecular biology studies were from MBI
Fermentas (Ontario, Canada) and Amersham Biosciences (NJ, USA). All of the
media and solutions were prepared by using distilled water.
Media Composition Purpose of Use
Liquid MS M5519 + 30 g/L sucrose Diluting Agrobacterium culture
before transformation
MSA
M5519 + 30 g/L sucrose +
0.8% plant agar + 1 mg/L BA +
0.1 mg/L NAA
Callus and shoot formation for
control leaf discs, co-cultivation
for Agrobacterium treated leaf
discs
MSB MSA + 25 mg/L Hygromycin +
500 mg/L Cefotaxime
Selection of transformed leaf
discs and their regeneration
MSC
MSA (for [+]control shoots) or
MSB (for [-] control and
transgenic shoots) : without
plant growth regulators
Induction of root formation on
regenerated shoots, sub-culturing
and germination of the surface
sterilized seeds

33
Glassware (autoclavable capped tissue culture jars) was from Sigma and
Vitro Vent Containers (VVC) was from Duchefa. 0.2 µm minipore filters were
from Sartorius.
2.2. Methods
2.2.1. Verification of pflp within the plasmids
In order to prove that pflp is present in the plasmids of A. tumefaciens cells,
plasmid isolation and PCR studies were performed
2.2.1.1. Plasmid Isolation
With the purpose of using in further studies, the plasmid pSPFLP was
isolated in pure form. For isolation a modified Mini Scale Plasmid Isolation
protocol (Maniatis et al., 1989) was used.
A single colony of A. tumefaciens EHA105 pSPFLP was taken from the
selective agar plate by loop. It was transferred to 3 mL of YEB medium
containing 50 mg/L Kanamycin and 20 mg/L Rifampicin. The cultures were
grown with vigorous shaking at 120 rpm and 28°C. Overnight grown bacterial
cells were divided into eppendorf tubes with 1, 5 ml aliquots and centrifuged at
12000 g for 30 seconds in microcentrifuge.
The supernatant was discarded and the pellet was suspended in 1 ml of STE
buffer (Appendix D). Again they were centrifuged at 12000 g for 1min. The
supernatant was discarded and this time the pellet was suspended 100 µL of SOL I
(Appendix D) with vigorous vortexing. Then they were incubated for 5 minutes at
room temperature and 200 µL of SOL II (Appendix D) was added into each
eppendorf tube. Slowly the tubes were mixed 4-5 times by inverting them upside

34
down and incubated 5 minutes at 60°C. 150 µL of cold SOL III (Appendix D) was
added into the tubes gently, and the tubes were incubated in ice for 10 minutes.
Equal volume (450 µl) of chloroform:isoamylalcohol (24:1) was added to
separate cell debris and chromosomal DNA in different phases and mixed by
vortexing. The tubes were centrifuged at 12000 g for 5 minutes and upper DNA
phase was collected into a clean eppendorf tube. Plasmid DNA was precipitated
with addition of 2 volumes of cold 96% ethanol and incubation at least for 30
minutes at -20°C. Overnight incubation may be preferable. The plasmid DNA was
obtained in the pellet after centrifugation at 12000 g for 5 minutes. Pellet was
washed with 1ml of 70% ethanol, centrifuged at 12000 g for 2 minutes and
ethanol was removed. The pellet was dried completely at 37°C and dissolved in
50 µL of TE buffer (Appendix D) containing 20 µg/mL RNase.
After the incubation for 30 minutes at 37°C for RNase activity, plasmid
DNA was stored at –20°C until usage. Purity and integrity of DNA was confirmed
by spectrophotometric measurement (OD260 and OD280) and agarose gel
electrophoresis, respectively.
2.2.1.2. PCR Analysis
The Polymerase Chain Reaction (PCR) was performed in order to verify the
presence of pflp gene within the plasmids. For this purpose, the gene was
amplified with specific primers (Appendix E).
PCR was carried out in a total volume of 30 µL. Cycling program of PCR
amplification and optimized conditions of PCR are given in Table 2.2 and Table
2.3 respectively.

35
Table 2.2 PCR cycling conditions to amplify pflp gene for plasmid DNA
Initial denaturation 94°C 3min
Denaturation 94°C 45 s
Annealing 62°C 30 s 35 cycles
Extension 72°C 45 s
Final extension 72°C 7min
Table 2.3 Optimized conditions of PCR to amplify pflp for plasmid DNA
DNA molecules obtained throughout this study were visualized on agarose
gels. Depending on the size of DNA to be detected 0.6 %, 0.8 % or 1 % agarose
gels were used. For this purpose 0.3 g, 0.4 g or 0.5 g of agarose was dissolved in
50 mL of 0.5X TBE or 1X TAE buffer (Appendix E) in microwave oven,
respectively. Without boiling, when it completely dissolved it was cooled down to
approximately 50°C and 3 µL of ethidium bromide (so the final concentration will
be 6 mg/mL) was added to gel solution. The comb was placed for well formation
and without making bubbles the solution was poured into the electrophoresis tray.
When the gel completely solidified, electrophoresis buffer was poured to the tank
till it covers the gel for 5 mm and the comb was removed carefully.
The sample solution to be loaded was prepared by mixing samples with 6X
loading buffer to a final concentration of 1X and loaded into the wells. A
Reagent Volume 10 X Rxn Buffer with (NH4)2SO4 3 µl
25 mM MgCl2 1.5 µl 2.5 mM dNTP 2 µl
10 µM Primer F 2 µl 10 µM Primer R 2 µl
dH2O 18 µl Taq 0,5 µl
Template DNA 1 µl Total volume 30 µl
36
molecular size marker, DNA ladder, was also loaded into a separate well. Then
the tank was connected to a power supply and electrophoresis was performed
under constant voltage of 6 V/cm for 1,5 - 2 hours. The gel was observed under
UV light and photographed.
2.2.2. Maintenance of Plant Material
2.2.2.1. Surface Sterilization of Tobacco Seeds
The tobacco seeds were taken into an eppendorf tube and surface sterilized
with 30% (v/v) sodium hypo chloride for 20 minutes and rinsed 3 times with
sterile distilled water. The seeds were kept in sufficient amount of distilled water
and placed on culture medium with the help of a cut micropipette.
2.2.2.2. Micropropagation of Tobacco Plants
The surface sterilized tobacco seeds were germinated on MSC in a growth
chamber at 25±2oC with 16 hours light and 8 hours dark photo- cycle for a month.
The meristematic part of the emerging shoots were cut and placed into new jars
containing the same medium called sub-culturing and used in further studies.
2.2.2.3. Determination of Lethal Hygromycin Concentration
pSPFLP contained hph (hygromycin phoshotransferase gene) in T-DNA
region, which enables the putative transgenic plants to withstand the toxic effects
of hygromycin where as wild type (control) ones can not.
First of all, in order to use negative controls in the experiments, the lethal
hygromycin concentration for tobacco plants was determined. Leaf discs which
were from 90-days old healthy upper leaves of wild type tobacco plants, were
prepared and placed on M9274 medium (Appendix C) containing 0.1 mg/L NAA,

37
1 mg/L BA and varying concentrations of hygromycin which were 5 mg/L ,10
mg/L, 25mg/L ,50 mg/L and 100 mg/L . After 3-4 weeks they were photographed.
2.2.3. Leaf Disc Transformation of Nicotiana tabacum
A modified transformation method of Öktem et al. (1994) which was first
described by Horsch et al. (1985) was used in the transformation studies of
tobacco leaves.
Young leaves from 20-30 days old tobacco plants were used. Either sterile
plant were used or non-sterile plants were first surface sterilized in 1.5% (v/v)
Sodium Hypochloride and rinsed 3 times with distilled water then used in plant
transformation studies.
Edges, midribs and petioles of the tobacco leaves were removed and the
remaining parts were cut into 1-2 cm2 pieces, which will be referred as “leaf disc”
in the text. A. tumefaciens cells were grown overnight (OD600 = 0.6-0.8) in YEB
medium containing appropriate antibiotics at 28oC and they were diluted 1:10
times with liquid MS medium. Leaf discs were incubated in liquid MS and
Agrobacterium cell mixture for 10 minutes. As a control, some discs were
incubated in liquid MS only.
At the end of incubation period, the leaf discs were removed and the excess
Agrobacterium solution remaining on the leaf discs were blotted on sterile filter
paper. Then, the explants were transferred on MSA media and kept at dark for co-
cultivation for 3 days. After the co-cultivation period, the explants were washed
with liquid MS containing 750 mg/L cefotaxime for 3 hours with vigorous
shaking at 120 rpm. The leaf discs were blot dried on sterile filter paper and
transferred onto MSB media and kept at normal growth conditions. Plates were
refreshed at every two weeks.

38
Callus formation was observed 3-4 weeks after the experiment. Regenerated
shoots were cut from the attachment points to callus and transferred to jars
containing MSC media to induce root formation and further development. When
roots become stronger, regenerated plants were removed from jars and transferred
to soil and transferred to growth chamber and then 4 weeks later to greenhouse.
When flowers developed they were covered with nylon bags to prevent cross-
pollination. When dried completely, about 3,5-4 months later, seeds of putative
transgenic plants were collected.
2.2.4. Analysis of T1 Transgenic Tobacco Plants
All assays and molecular tests were carried out with T1 plants in order to
prove that the transferred T-DNA is expressed in the plant genome. For this
purpose, 5 lines were randomly selected from 15 different putative transgenic
lines (T0)
2.2.4.1. Mendelian Inheritance Pattern
Both putative transgenic tobacco seeds (T1) and wild type tobacco seeds
were used (as negative control) to confirm Mendelian inheritance pattern for T1
seeds. They were surface sterilized as explained before and then they were placed
on MSC medium (without Cefotaxime). For each line, nearly 100 seeds were
used. They were incubated as stated before. At the end of six weeks the plates
were photographed. These randomly selected hygromycin resistant lines, used for
further studies, where as hygromycin sensitive lines were named as escape lines.
The number of surviving plantlets on hygromycin containing medium was
counted after 6 weeks and then Chi-Square Analysis were performed to test the
Mendelian Inheritance Pattern.

39
2.2.4.2. GUS Histochemical Assay
Histochemical GUS staining was performed according to the method of
Jefferson (1987) in order to monitor the transient gene expression in T1 leaves.
Explants were assayed by incubating them inside 1 mM chromogenic substrate X-
GlcA(5-bromo-4-chloro-3-indolyl-β-D-glucuronic acid) containing GUS substrate
solution for overnight at 37°C. Then the explants were transferred to fixative
solution in which they can be preserved for several months.
After a minimum of 4 hours in fixative, the solution was replaced with 50 %
ethyl alcohol for decolorization of explants. After 15 minutes in 50 % ethyl
alcohol, explants were transferred to 100 % ethyl alcohol for further
decolorization overnight. Then the explants were transferred to GUS fixative
solution for preservation for several months. Finally GUS expressing regions on
explants were examined under microscope and photographed.
Preparation of GUS substrate solution and fixative solution were given in
Appendix F.
2.2.4.3. Molecular Analysis of T1 via PCR
2.2.4.3.1. DNA isolation from T1 leaves
The genomic DNA was isolated from plants with CTAB DNA extraction
method of Saghai-Maroof et al. (1984) with some modifications. According to
this method, 2 grams of plant material was ground to a fine powder with a pestle
and mortar in liquid nitrogen and transferred to centrifuge tubes. 2X CTAB buffer
(Appendix G) was heated to 65oC and 20 mL of 2X CTAB buffer ,containing
0.2% β-mercaptoethanol , was added onto the powder in a centrifuge tube and
mixed by vortex. Then the 40 ml Sigma centrifuge tubes were incubated at 65oC
for at least 45 minutes with occasional shaking.

40
After incubation period, 20 mL of chloroform: isoamylalcohol (24:1) was
added and the mixture was mixed vigorously by vortex. They were centrifuged at
3000 rpm for 10 minutes. The upper phase was taken to a new centrifuge tube and
8 mL of preheated 0.2% β-mercaptoethanol containing 5X CTAB buffer was
added. Again the tubes were mixed by vortex and incubated at 65oC for 10-15
minutes. Then 20 mL of chloroform was added to each tube and they were mixed
by vortex. The tubes were centrifuged at 3000 rpm for 10 minutes.
Upper phase was taken to a new centrifuge tube and 20 mL of cold
isopropanol was added into the tubes and the tubes were inverted gently to
precipitate DNA. The tubes were kept overnight at –20oC and, DNA was collected
by centrifugation at 9000 rpm for 15 minutes. The upper phase was discarded and
the pellet was dried with filter paper. The pellet was washed with 70% ethanol to
get rid of the remaining impurities, centrifuged at 9000 rpm for 5 to 10 minutes
and dried at 37oC. Finally, the pellet was dissolved in 500 µL of TE buffer
(Appendix D) containing 10 µg/mL RNAse. The tubes were incubated at 37oC for
30 minutes for RNAse activity. The purity and concentration of DNA was
checked by spectrophotometric measurement and agarose gel electrophoresis. The
prepared DNA was stored at –200C for further usage.
2.2.4.3.2. PCR with pflp and hph specific primers
The isolated DNA from T1 transgenic plants and control plant were analyzed
with PCR for the presence of pflp and hph gene. The primers used in both
reactions were given in Appendix E. Cycling program of PCR amplification and
optimized conditions of PCR for pflp and hph from isolated DNA samples are
given in Table 2.4 and Table 2.5, respectively. According to the DNA
concentration of T1 transgenic plants, the volume of 1 µg of DNA was
determined.

41
Table 2.4. PCR cycling conditions to amplify pflp and hph for plant DNA
Table 2.5. Optimized conditions of PCR to amplify pflp and hph for plant DNA
At the end of PCR, the products were run on 0.8% agarose gel and they were
photographed under UV as described before.
2.2.4.3.3. Sequence Analysis of PCR products
The verification of the amplicons was also done with sequence analysis. For
this purpose, the service of Sequence Analysis Unit of Central Laboratory, METU
was used.
pflp hph
Initial denaturation 95°C 4min 95°C 4min
Denaturation 94°C 1min 94°C 50 s
Annealing 62°C 1min 61°C 50 s
Extension 72°C 1min 72°C 50 s
Final extension 72°C 10min 72°C 7min
Reagent pflp hph
dH2O 20-X µL 20-X µL
10X Rxn Buffer with (NH4)2SO4 3 µL 3 µL
25 mM MgCl2 1.5 µL 1.5 µL
2 mM dNTP 2 µL 2 µL
10 µM Primer Forward 1,5 µL 1,5 µL
10 µM Primer Reverse 1,5 µL 1,5 µL
Taq Polymerase (5 u/µL) 0.5 µL 0.5 µL
DNA (1 µg) X µL X µL
Total Volume 30 µL 30 µL
30
Cycles

42
For this analysis, only line 6, which gave positive results for GUS
histochemical staining and positive reactions for both PCRs with pflp and hph
primers, was selected. 3 individual PCRs were carried out with primers of pflp,
NOS terminator and CaMV 35S promoter genes (The primers, PCR and cycling
conditions were given in Appendix H). About 100 µL from each PCR mixture
were given directly to the Sequence Analysis Unit and according to the Unit the
following procedure had been applied.
First, using Q-Biogene’s GENECLEAN® Turbo for PCR Kit, the amplicons
were purified from the PCR mixture as instructed on manual. 100 µl oil-free PCR
reaction from each sample was transfered to a 1.5 ml microcentrifuge tube and 5
volumes GENECLEAN® Turbo for PCR Salt Solution was added. The tubes very
gently mixed and transfered to a GENECLEAN® Turbo for PCR Cartridge. After
centrifugation for 5 seconds, 500 µl prepared GENECLEAN® Turbo for PCR
Wash was added to the filter. After another centrifugation for 5 seconds, catch
tubes were emptied. The GENECLEAN® Turbo for PCR Cartridge were
centrifuged for an additional 4 minutes to remove residual wash solution. Caps
were removed from catch tube, and inserted to GENECLEAN® Turbo for PCR
Cartridge containing bound DNA. Then, 30 µl GENECLEAN® Turbo for PCR
Elution Solution was added directly onto GLASSMILK®-embedded membrane
and incubated at room temperature for 5 minutes. Finally, centrifuge for 30
seconds was applied to transfer eluted DNA to GENECLEAN® Turbo for PCR
Catch Tube. GENECLEAN® Turbo for PCR Cartridges were discarded and catch
tubes were capped.
Then sequencing PCR was carried out by Applied Biosystems’ BigDye®
Terminator v3.1 Cycle Sequencing Kit according to the kit’s manual and finally
sequencing analysis was done with ABI 310 DNA Analyzer.

43
The results of sequencing analysis were investigated using Chromas (v2.23)
software program. “BLAST search” option, which was built in the software, was
used to compare the sequences with previously characterized genes.
2.2.4.3.4. Real Time-PCR Analysis
In addition to these, Real Time (RT) - PCR was carried out by the service of
RT-PCR Unit of Central Lab., METU. According to the Unit, the following
procedure had been applied.
First, Roche Applied Science’s High Pure GMO Sample Preparation Kit was
used. The kit was designed for the isolation of DNA from raw material and food
products of plant origin for PCR analysis. So it was used to isolate DNA from
wild type control and T1 lines of 1,3,6,9 and 10 as instructed on the kit’s manual.
After DNA isolation, RT-PCR was carried out by Roche Applied Science’s
LightCycler ® GMO Screening Kit. The instrument used for RT-PCR was Roche
Applied Science’s LightCycler ® 1.5. Finally, the results were evaluated by the
instrument’s software.
2.2.4.4. Expression Analysis of pflp
Northern Blot Hybridization was used to show the pflp expression in T1
transgenic tobacco plants using leaf samples of selected lines.
2.2.4.4.1. Total RNA Isolation
Prior to RNA isolation, distilled water, mortars, pestles, eppendorf tubes,
tips and other equipments were washed with DEPC-treated water and placed
under hood for overnight to evaporate the excess DEPC. All the solutions used in

44
the RNA isolation were prepared with DEPC-treated water and autoclaved before
use. For 1 L of water 800 µL of DEPC was used.
Grinding step was crucial. Mortar, pestle and eppendorf tubes should be
chilled with liquid nitrogen before usage. Quickly, 0.1 gram of leaf sample was
ground in liquid nitrogen to obtain a fine powder. Eppendorf tubes were one-third
filled (till 0, 5 ml line) with powder and transferred into liquid nitrogen and they
were never let to be warmed up. 1 mL TRI reagent (Appendix I) was added and
the eppendorf tubes were mixed by vortex at least 10 minutes. Then they were
centrifuged for 5 min at room temperature with at least 10 000 g.
After centrifugation, 900µL of the supernatants were transferred to a new
tube without disturbing the pellet. To these, 200 µL of chloroform was added and
the contents were mixed for 15 seconds with vigorous shaking and incubated at
room temperature for 3 min. Then again, the tubes were centrifuged for 15
minutes at 4 °C with at least 10 000 g. Carefully 400 µL from the upper phase was
taken into a new 1.5 ml Eppendorf tube and 200 µL of chloroform treatment is
repeated. The tubes were shaken vigorously for 15 seconds, incubated at room
temperature for 3 minutes, centrifuged for 5 min at room temperature with at least
10 000 g. Carefully 400 µL from the upper phase was taken into a new 1.5 ml
Eppendorf tube without contacting the interphase and 1 volume isopropanol was
added to each tube. They were all mixed by inverting several times and incubated
for 10 minutes at room temperature.
Afterwards, RNA was obtained in the pellet by centrifugation for 10 minutes
at room temperature with at least 10 000 g. The supernatants were discarded and
pellets were washed with 1 ml of 70% ethanol with 3 minutes incubation at room
temperature. After a centrifugation for 5 minutes at room temperature and max
speed, supernatants were discarded again. An additional 15 second spin was made
by centrifugation to collect the pellet at the bottom of the tube and remove any

45
visible liquid. The pellets were air dried for 10 minutes in the sterile hood
avoiding overdry.
Finally, 40-50 µL DEPC-water was added to each one and the tubes were
incubated for 15 minutes at 65ºC to dissolve pellet, and vortex occasionally until
it dissolves. RNA can be immediately used after determination of its quantity and
quality or kept at -80 C for further use.
2.2.4.4.2. Determination of RNA quantity and quality
The RNA concentration is determined by measuring absorbance at 260 nm
on a spectrophotometer in 10 mM Tris/HCl pH 8.0 (one absorbance unit =
40 µg/mL RNA). The A260/A280 ratio should be approximately 2.0, but figures
between 1.8 and 2.1 are considered acceptable. The RNA concentration should be
greater than 1.1 µg/µl to accept it as appropriate isolation. After measuring the
optical densities the concentration of RNA can be calculated as follows:
[RNA] (µg/mL)= 40 x Dilution Factor x OD260
The integrity of the RNA is tested by agarose electrophoresis. For this
RNase-free 1% agarose gels in TAE are prepared with DEPC - water. If the
equipment was used without DEPC-water before, the tank, tray and comb was
treated with 3% hydrogen peroxide for 15 minutes. Approximately 2 µg RNA was
loaded from each sample in RNase-free DNA loading buffer and run for 30-60
min at 80-100 V. The rRNA bands should be clear without any obvious smearing
patterns.
2.2.4.4.3. Northern Blotting
Vacuum-dried 30 µg of RNA samples were dissolved in 20 µL of freshly
prepared sample buffer (Appendix I). For denaturation, the eppendorf tubes were

46
incubated at 650C for 10 minutes. The samples were loaded to 1% agarose gel
containing, 6 mg/ml ethidium bromide, 1X MOPS (Appendix I) and 6%
formaldehyde. Electrophoresis was run with 1X MOPS as buffer and 5 V/cm for
2-3 hours.
A Hybond-N+ nylon membrane, 3 pieces of 3 MM paper and paper towels
(at least 5 cm) having same sizes with the gel were cut. A plastic tray was half
filled with transfer buffer (Appendix I) and a platform was established and
covered with a wick made from two long sheets of 3 MM paper. The papers were
saturated with transfer buffer and the gel was placed on the wick platform. The
circumferences of the gel were covered with parafilm to prevent the absorption of
transfer buffer by paper towels directly.
A Hybond-N+ nylon membrane was placed on the gel and wetted with
transfer buffer. Seven sheets of 3 MM paper was placed on the membrane one by
one and each of them was wetted with transfer buffer after placement. After each
step rolling a glass pipette prevented the formation of air bubbles. Absorbent
paper towels were placed on 3 MM papers. Finally a glass plate and a 1 kg weight
were placed on the towels and the capillary transfer was allowed to proceed
overnight. Next day the transfer apparatus was dismantled and the nucleic acids
were fixed to the membrane by illuminating the membrane with UV light for 45
seconds.
2.2.4.4.4. Probe Labeling, Hybridization and Detection
After the blotting, Amersham Biosciences’ Gene Images AlkPhos Direct
Labeling and Detection System with CDP-Star was used.
The membrane was placed in hybridization tube and pre-hybridized with the
hybridization buffer (which was preheated to 50°C) (Appendix I) for at least 1
hour at 550C in a rolling tube hybridization oven. For 1 cm2 membrane, 0,25 ml
hybridization buffer was used.

47
During pre-hybridization the probe that will be used for hybridization was
prepared. Labeling of the probe was done according to Amersham Direct DNA
Labeling System. From stock solution, DNA to be the probe was prepared as 10
ng/µL concentration. For 1 ml hybridization buffer, 5-10 ng probe was needed. 10
µL of cross linker solution was diluted with 40 µL of water supplied with kit to
obtain the working concentration. 10 µL of diluted DNA was placed into an
eppendorf tube and denatured by heating for 5 minutes in a vigorously boiling
water bath.
Eppendorf tubes were immediately cooled on ice for 5 minutes and
centrifuged to collect the contents at the bottom of the tube. 10 µL of reaction
buffer was added to the cooled DNA and the contents were mixed thoroughly but
gently. 2 µL of labeling reagent was added to the eppendorf tube and the contents
were mixed thoroughly but gently. Finally, 10 µL of cross linker working solution
was added and the contents were mixed thoroughly. The labeling reaction can be
scaled up by increasing the volume of all components of the labeling reaction pro
rata; DNA, reaction buffer, labeling reagent and cross linker working solution.
The contents were collected at the bottom of the tube by micro centrifugation.
Eppendorf tube was incubated at 370C for 30 minutes. The prepared probe can be
used immediately or kept on ice for up to 2 hours.
The labeled probe was then added to the pre-hybridized membrane and left
for hybridization at 550C overnight in rolling tube hybridization oven. The
following day, membrane was first washed with primary wash buffer and then
secondary wash buffer. The blots were transferred to preheated primary wash
buffer and washed two times at 550C for 10 minutes with gentle agitation. The
blot was transferred to a clean container and washed twice with excess secondary
wash buffer working solution at room temperature for 5 minutes. Secondary wash
buffer working solution should be used immediately after preparation.
48
The excess secondary wash buffer working solution was drained from the
blot by touching the corner of the blot against a clean surface and the blot was
transferred on a glass surface sample side up. 30-40 µL/cm2 of detection reagent
was pipetted on to the blot and the blot was leaved for 2-5 minutes. Excess
reagent was drained off the membrane. The blot was wrapped in a stretch film and
put into a film cassette in DNA side up position. A sheet of film was placed on the
blot in dark room while red lights are on. Finally, the cassette was incubated at
room temperature for 3 hours, and then the film was taken and developed.
2.2.5. Plant Hypersensitivity Response Assays
The HR assay was performed according to Huang et al. (1995). Fully
expanded tobacco leaves were wounded to form tiny holes on the lower surface of
the leaves with a 25-gauge needle 100µl of overnight grown bacteria were
infiltrated with a 1 ml blunt-end syringe through the hole. The infiltrated plant
was incubated at greenhouse conditions and photographed.

49
CHAPTER III
RESULTS AND DISCUSSION
3.1. Verification of pflp within the plasmids
In order to prove that pflp gene is present in the plasmids of A. tumefaciens
cells, plasmid isolation and PCR studies were performed. Plasmid isolation from
Agrobacterium cells was rather a simple task and a well-set protocol in our
laboratory and they were used as positive control for further molecular studies
throughout the study whenever needed.
PCR was carried out with pflp specific primers as described before and the
amplicons were run in 0.8% agarose gel, then the gel was photographed. The
PCR result was shown in Figure 3.1.
The arrow on DNA marker in lane 1 shows 500 bp band and lane 2 was
blank (without plasmid) which was used as negative control. The remaining lanes,
from 3 to 8, were for 3 individual isolations with duplicates as the expected 431
bp fragment
3.2. Determination of Lethal Hygromycin Concentration
The antibiotic hygromycin B is commonly used as a selection agent in gene
transfer studies of plants when the hygromycin resistance gene, hph is utilized. It
is an aminoglycosidic antibiotic and kill cells by inhibiting protein synthesis. The
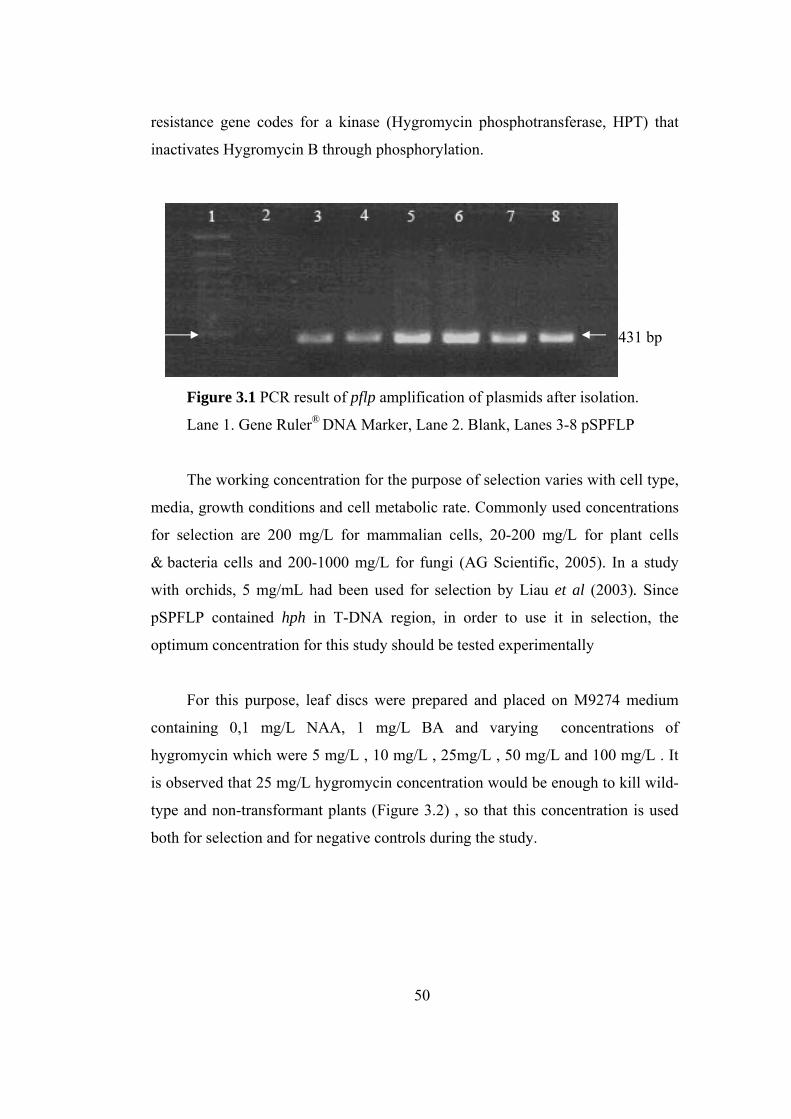
50
resistance gene codes for a kinase (Hygromycin phosphotransferase, HPT) that
inactivates Hygromycin B through phosphorylation.
Figure 3.1 PCR result of pflp amplification of plasmids after isolation.
Lane 1. Gene Ruler® DNA Marker, Lane 2. Blank, Lanes 3-8 pSPFLP
The working concentration for the purpose of selection varies with cell type,
media, growth conditions and cell metabolic rate. Commonly used concentrations
for selection are 200 mg/L for mammalian cells, 20-200 mg/L for plant cells
& bacteria cells and 200-1000 mg/L for fungi (AG Scientific, 2005). In a study
with orchids, 5 mg/mL had been used for selection by Liau et al (2003). Since
pSPFLP contained hph in T-DNA region, in order to use it in selection, the
optimum concentration for this study should be tested experimentally
For this purpose, leaf discs were prepared and placed on M9274 medium
containing 0,1 mg/L NAA, 1 mg/L BA and varying concentrations of
hygromycin which were 5 mg/L , 10 mg/L , 25mg/L , 50 mg/L and 100 mg/L . It
is observed that 25 mg/L hygromycin concentration would be enough to kill wild-
type and non-transformant plants (Figure 3.2) , so that this concentration is used
both for selection and for negative controls during the study.
431 bp

51
Figure 3.2 Results of Lethal Hygromycin Concentration Determination.
A=control, no hygromycin B= 5 mg/L C= 10 mg/L D= 25 mg/L E= 50 mg/L
F= 100 mg/L
A B
C D
E F
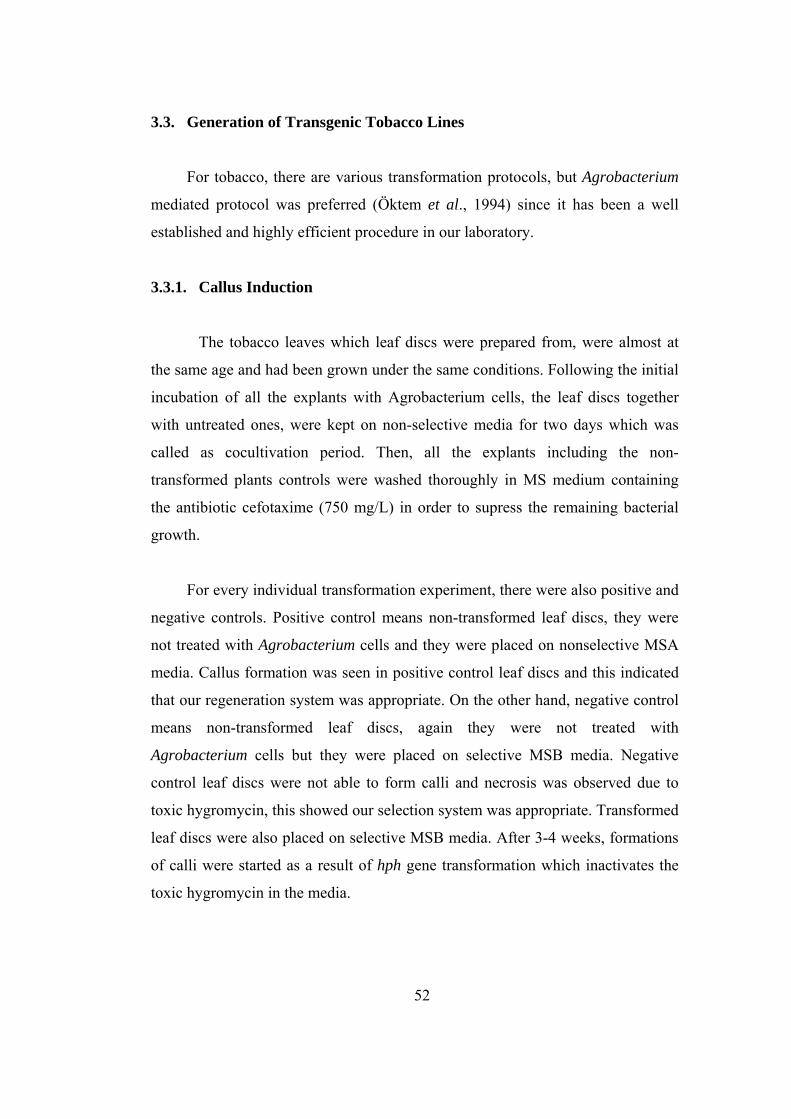
52
3.3. Generation of Transgenic Tobacco Lines
For tobacco, there are various transformation protocols, but Agrobacterium
mediated protocol was preferred (Öktem et al., 1994) since it has been a well
established and highly efficient procedure in our laboratory.
3.3.1. Callus Induction
The tobacco leaves which leaf discs were prepared from, were almost at
the same age and had been grown under the same conditions. Following the initial
incubation of all the explants with Agrobacterium cells, the leaf discs together
with untreated ones, were kept on non-selective media for two days which was
called as cocultivation period. Then, all the explants including the non-
transformed plants controls were washed thoroughly in MS medium containing
the antibiotic cefotaxime (750 mg/L) in order to supress the remaining bacterial
growth.
For every individual transformation experiment, there were also positive and
negative controls. Positive control means non-transformed leaf discs, they were
not treated with Agrobacterium cells and they were placed on nonselective MSA
media. Callus formation was seen in positive control leaf discs and this indicated
that our regeneration system was appropriate. On the other hand, negative control
means non-transformed leaf discs, again they were not treated with
Agrobacterium cells but they were placed on selective MSB media. Negative
control leaf discs were not able to form calli and necrosis was observed due to
toxic hygromycin, this showed our selection system was appropriate. Transformed
leaf discs were also placed on selective MSB media. After 3-4 weeks, formations
of calli were started as a result of hph gene transformation which inactivates the
toxic hygromycin in the media.
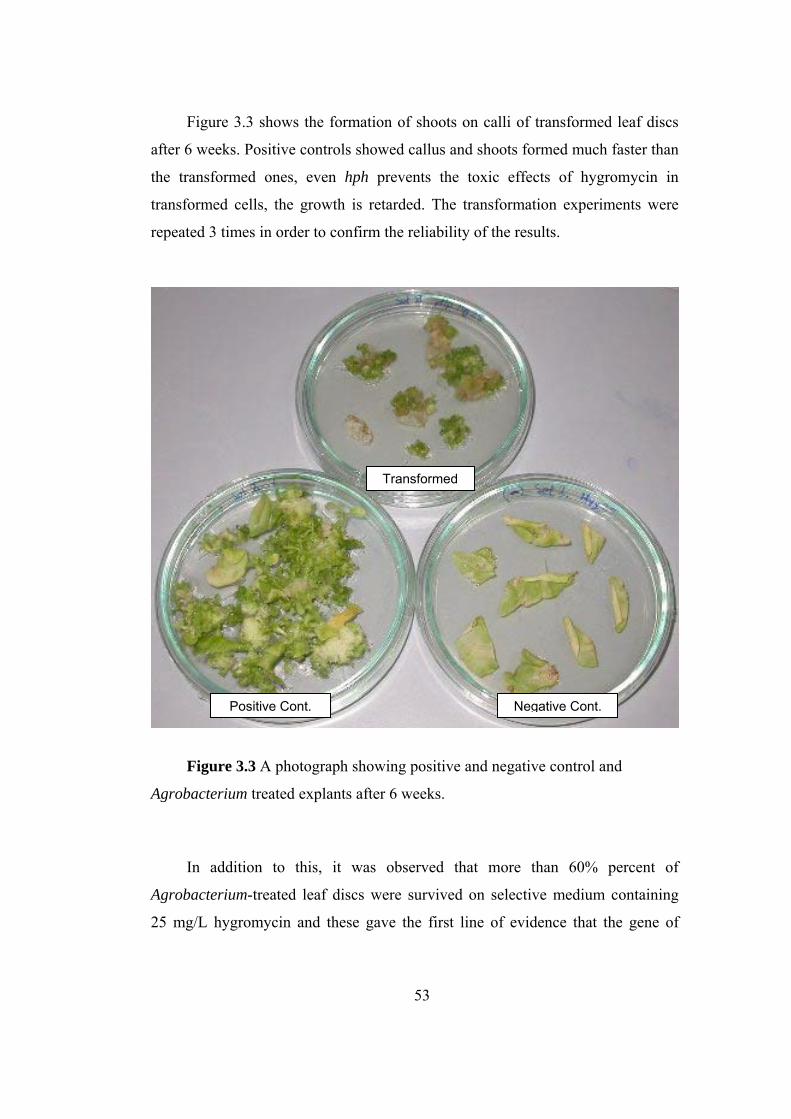
53
Figure 3.3 shows the formation of shoots on calli of transformed leaf discs
after 6 weeks. Positive controls showed callus and shoots formed much faster than
the transformed ones, even hph prevents the toxic effects of hygromycin in
transformed cells, the growth is retarded. The transformation experiments were
repeated 3 times in order to confirm the reliability of the results.
Figure 3.3 A photograph showing positive and negative control and
Agrobacterium treated explants after 6 weeks.
In addition to this, it was observed that more than 60% percent of
Agrobacterium-treated leaf discs were survived on selective medium containing
25 mg/L hygromycin and these gave the first line of evidence that the gene of
Transformed
Positive Cont. Negative Cont.

54
interest has been transferred to the plant. Under same conditions most of the
untreated explants were died and support the success of transformation.
3.3.2. Shoot and Root Development
After 5-6 weeks from transformation, shoots started to emerge from the calli
and they became ready to be handled in the following 3-4 weeks. The shoots were
cut at the base and transferred to MSC Medium for root induction. Figure 3.4
shows the development of a putative transgenic shoot in MSC Medium with both
negative and positive controls. Hygromycin concentration of the medium has not
been changed and the ability of root formation in transformed shoots can be
considered as another line of evidence that hph is present within the cells. Root
formation has been observed in most of the jars within 2 weeks. After several sets
of transformation experiments, the number of transgenic lines has reached 23.
3.3.3. Development in Soil
An essential part of the regeneration cycle is development of the plantlets
in soil. It is necessary to obtain successive generations in order to assess the
stability of the gene of interest within the plant genome. In order to accomplish
this task, nearly one month later, the regenerated plantlets have been transferred
from jars to soil. At this point, the number of lines was decreased to 15 depending
on their growth and health.
The plantlets in jars were very sensitive and fragile. Thus, before taken to
the greenhouse, the plantlets in pots were kept in an environmental growth
chamber at 25°C with 70% humidity at a photoperiod of 16 hours for 1 month. In
order to acclimatize the plantlets, the pots were covered with stretch film to avoid
excessive evaporation and drying of the plantlets first 5 days

55
Figure 3.4 Root formation in putative transgenic plantlets in MSC medium.
Negative control which was a shoot from positive control grown calli, could not
develop root and died in hygromycin containing medium, whereas positive
controls developed roots rapidly in medium without hygromycin.
Transformed Negative Cont.Positive Cont.
Negative Cont. Positive Cont. Transformed
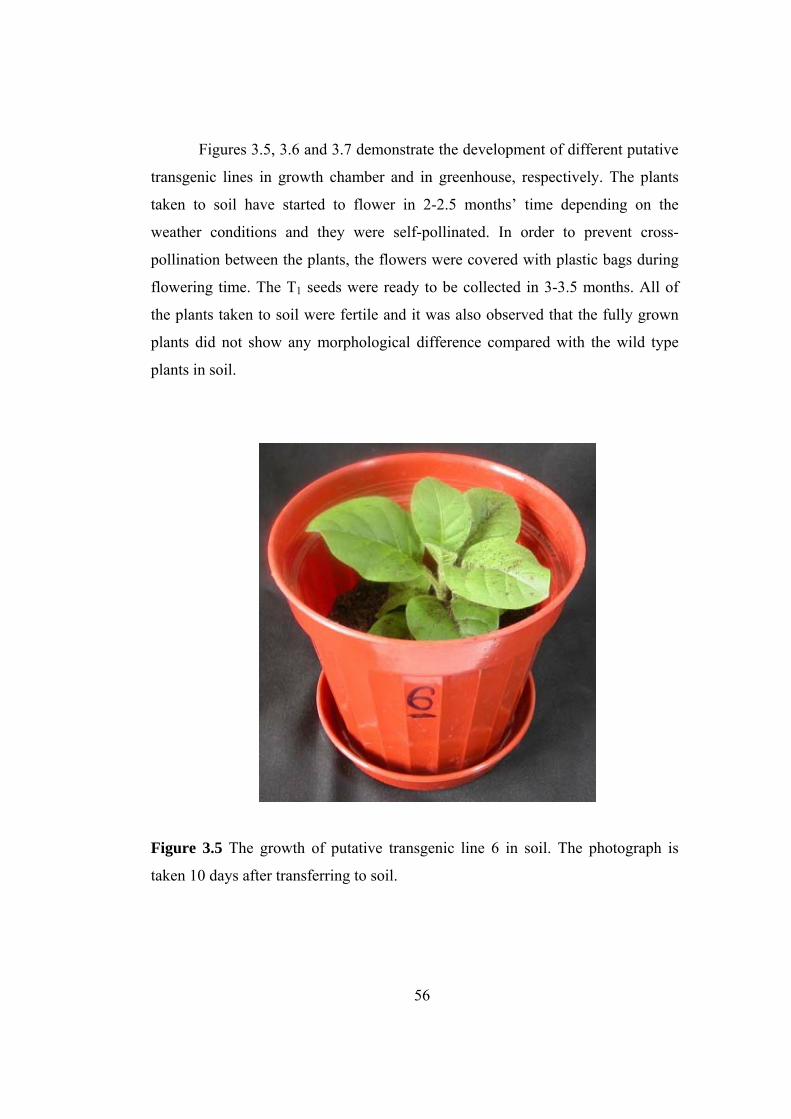
56
Figures 3.5, 3.6 and 3.7 demonstrate the development of different putative
transgenic lines in growth chamber and in greenhouse, respectively. The plants
taken to soil have started to flower in 2-2.5 months’ time depending on the
weather conditions and they were self-pollinated. In order to prevent cross-
pollination between the plants, the flowers were covered with plastic bags during
flowering time. The T1 seeds were ready to be collected in 3-3.5 months. All of
the plants taken to soil were fertile and it was also observed that the fully grown
plants did not show any morphological difference compared with the wild type
plants in soil.
Figure 3.5 The growth of putative transgenic line 6 in soil. The photograph is
taken 10 days after transferring to soil.

57
Figure 3.6 The growth of putative transgenic plants in growth chamber. The photograph
demonstrates one group of independent lines 4 weeks after transferring to soil.
Figure 3.7 The growth of putative transgenic plants in greenhouse conditions. The photograph
demonstrates one group of independent lines 9 weeks after transferring into soil.

58
3.4. Analysis of T1 progeny
From 15 independent transgenic lines which gave seeds in greenhouse, 5
lines were randomly selected within the best grown and healthiest ones and the
following analysis were applied to these 5 lines: T1, T3, T6, T9 and T10. Besides
analyzing the Mendelian inheritance pattern of T1 seeds and GUS histochemical
assays, molecular studies at DNA and RNA level were carried out.
3.4.1. Mendelian Inheritance Pattern
With the intention of determining the segregation pattern of transferred gene
in T1
transgenic tobacco plants, the seeds from randomly selected 5 lines were
germinated in selective media containing 25 mg/L hygromycin. For each line
approximately 100 seeds were used and the numbers of survivors in selective
media were counted. The results are given in Table 3.1. The expected ratio for
Mendelian inheritance is 3:1 and the data was analyzed by Chi-Square Analysis
with p (χ2
1≤ 2,706) = 0.9. The appearances of transgenic seed in selective media
are shown in Figure 3.8. As can be seen from the photographs, T6 seeds grew
faster than the other lines in selective medium.

59
Figure 3.8 The growth of T1 seeds in selective media. Wild type seeds used as
negative control in selective medium. The photographs were taken after 6 weeks.
Table 3.1 Mendelian Inheriatance Analysis of T1 progeny, p(χ2
0.90,1) ≤ 2,706
Lines Total # of Seeds
# of Germinated
Seeds χ² Decision
T1 99 68 2,64983165 Fail to Reject T3 97 76 0,580756014 Fail to Reject T6 98 77 0,666666667 Fail to Reject T9 98 74 0,013605442 Fail to Reject
T10 99 71 0,569023569 Fail to Reject
3.4.2. GUS Histochemical Assay
T-DNA region of pPFLP contains gus A gene which enables the transgenic
tissues to form blue color following their incubation in X-gluc chromogenic
substrate. So, in order to monitor the gene expression in T1 leaves histochemical
T10
Negative Cont.
T3 T6T1
T9
60
GUS staining was performed. Besides T3 line, other randomly selected lines gave
GUS positive results (Figure 3.9)
Figure 3.9 Expression of GUS in leaves of transgenic lines. Negative control is
wild type tobacco.
GUS expressions in T10 and T6 were intensive; in fact the whole leaf
explant was colored for T10. At a lesser amount, T1 and T9 expressed GUS with
local colorings whereas T3 did not show any coloring pattern even under
microscopic observation meaning that GUS expression is absent.
3.4.3. Molecular Analysis of T1 via PCR
3.4.3.1. PCR with pflp and hph specific primers
PCR analysis was used to obtain an idea about the verification of gene
transfer to the T1 transgenic lines. For this purpose from each putative transgenic
T9 T10 Negative Cont.
T3T1 T6
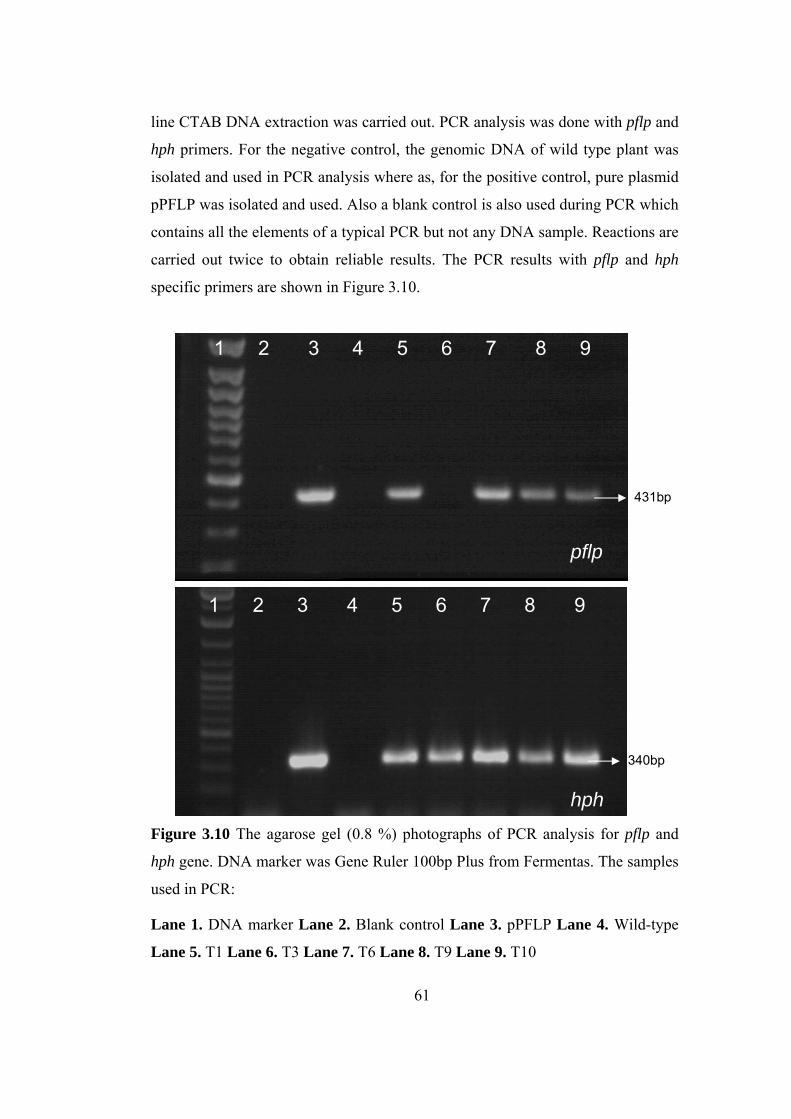
61
line CTAB DNA extraction was carried out. PCR analysis was done with pflp and
hph primers. For the negative control, the genomic DNA of wild type plant was
isolated and used in PCR analysis where as, for the positive control, pure plasmid
pPFLP was isolated and used. Also a blank control is also used during PCR which
contains all the elements of a typical PCR but not any DNA sample. Reactions are
carried out twice to obtain reliable results. The PCR results with pflp and hph
specific primers are shown in Figure 3.10.
Figure 3.10 The agarose gel (0.8 %) photographs of PCR analysis for pflp and
hph gene. DNA marker was Gene Ruler 100bp Plus from Fermentas. The samples
used in PCR:
Lane 1. DNA marker Lane 2. Blank control Lane 3. pPFLP Lane 4. Wild-type
Lane 5. T1 Lane 6. T3 Lane 7. T6 Lane 8. T9 Lane 9. T10
1 2 3 4 5 6 7 8 9
340bp
1 2 3 4 5 6 7 8 9
431bp
pflp
hph

62
It can be seen that in selected transgenic lines, 431 bp for pflp and 340 bp for
hph fragments were amplified as expected and PCR results reveal that pflp and
hph genes have been successfully integrated and inherited into the genome of
selected T1 lines except T3. This line gave negative result for pflp gene specific
PCR, where as it gave positive result for hph gene. This result is interesting
because when T3 seeds had been grown on selective medium, they could
withstand the toxic effects of hygromycin and survived, however T3 also gave
negative GUS reaction. Considering all these, it can be assumed that T3 contains
the part of T-DNA which hph is present but does not contain the remaining pflp
and GUS-GFP fusion (Appendix A).
3.4.3.2. Sequence Analysis of PCR products
For the purpose of ensuring the amplicons, sequence analysis was carried
out. Only line 6, which gave positive results for GUS histochemical staining and
positive reactions for both PCRs with pflp and hph primers, was selected for this
analysis.
The analysis was done with the products of PCRs which were carried out
with pflp gene, CaMV 35S promoter and NOS terminator specific primers, then
the products were given to Sequence Analysis Unit, Central Lab., METU with
amounts requested by the unit. According to the unit, a second PCR, sequencing
PCR was performed with either forward or reverse primers for each three gene, so
there were two results obtained for each gene. The results were examined with
Chromas v2.23 software program. With the “BLAST search” option that was built
in the software, sequences were compared with previously characterized genes
from the internet data base of NCBI and the results for each gene and primer were
given in Table 3.2.

63
Table 3.2 Sequence Analysis Results of PCR products given as sequence
identity compared with previously characterized genes.
Forward ReverseCaMV 35S P 96% 99%
NOS T 97% 95% pflp 99% 99%
The results show very high identity when comparison is made with the
genes that are previously characterized and available in the internet. Sequence
analysis of CaMV 35S promoter and NOS terminator gene results were found in
pCAMBIA 1304 and pCAMBIA 1305.2 complete sequences, respectively, which
our plasmid, pPFLP was derived from, where as pflp gene results were found in
Capsicum annuum ferredoxin-like protein mRNA, complete sequence, which is
the sequence that PFLP was first characterized. From the results, the averages of
the identity values were calculated from three values for CaMV 35S promoter and
two for NOS terminator genes, and this is consistent since the T-DNA region
contains three and two copies of CaMV 35S promoter and NOS terminator genes,
respectively. The reference number and values, scores, expects and query-subject
matching for each analysis was given in Appendix H.
3.4.3.3. Real Time-PCR Analysis
Another performed analysis was Real Time (RT) - PCR which was carried
out by the service of RT-PCR Unit of Central Lab., METU. According to the unit,
Roche Applied Science’s High Pure GMO Sample Preparation and LightCycler ®
GMO Screening Kits were used. The former kit is specially designed for the
isolation of DNA from raw material and food products of plant origin for PCR
analysis, where as the latter one is a PCR kit for the qualitative detection of
genetically modified plants using the LightCycler ® System.
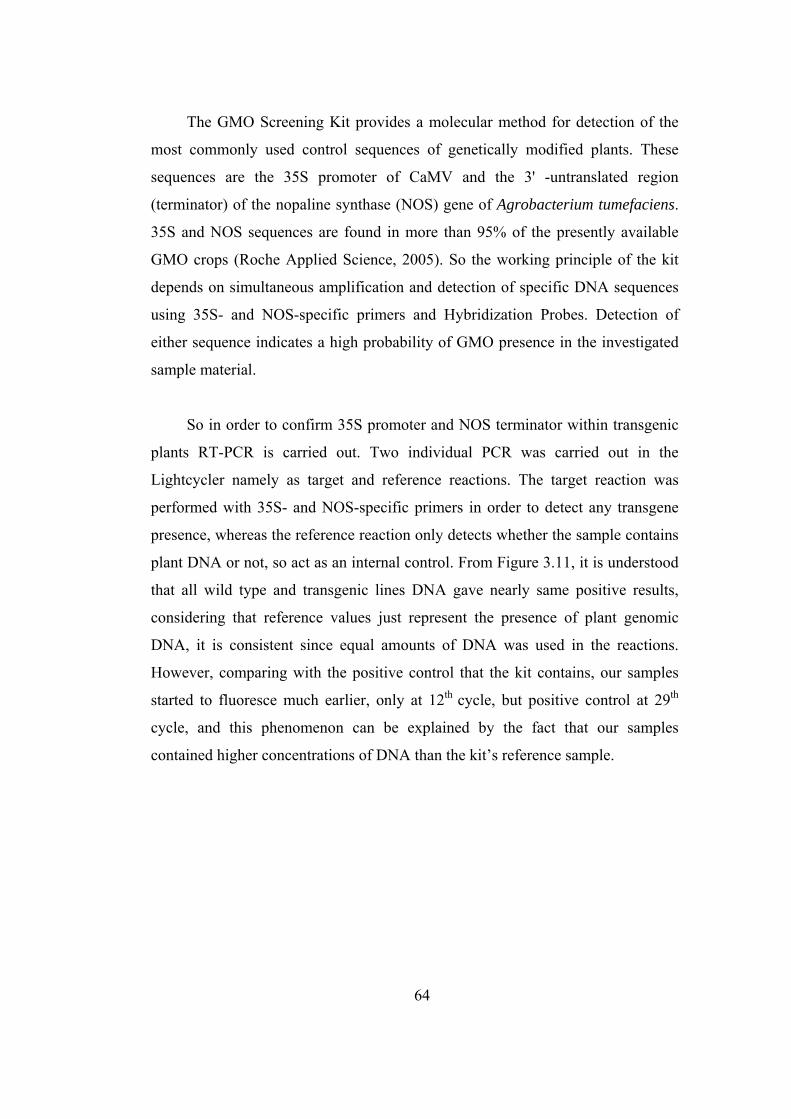
64
The GMO Screening Kit provides a molecular method for detection of the
most commonly used control sequences of genetically modified plants. These
sequences are the 35S promoter of CaMV and the 3' -untranslated region
(terminator) of the nopaline synthase (NOS) gene of Agrobacterium tumefaciens.
35S and NOS sequences are found in more than 95% of the presently available
GMO crops (Roche Applied Science, 2005). So the working principle of the kit
depends on simultaneous amplification and detection of specific DNA sequences
using 35S- and NOS-specific primers and Hybridization Probes. Detection of
either sequence indicates a high probability of GMO presence in the investigated
sample material.
So in order to confirm 35S promoter and NOS terminator within transgenic
plants RT-PCR is carried out. Two individual PCR was carried out in the
Lightcycler namely as target and reference reactions. The target reaction was
performed with 35S- and NOS-specific primers in order to detect any transgene
presence, whereas the reference reaction only detects whether the sample contains
plant DNA or not, so act as an internal control. From Figure 3.11, it is understood
that all wild type and transgenic lines DNA gave nearly same positive results,
considering that reference values just represent the presence of plant genomic
DNA, it is consistent since equal amounts of DNA was used in the reactions.
However, comparing with the positive control that the kit contains, our samples
started to fluoresce much earlier, only at 12th cycle, but positive control at 29th
cycle, and this phenomenon can be explained by the fact that our samples
contained higher concentrations of DNA than the kit’s reference sample.

65
Figure 3.11 Log amplification curves for reference values. The Fluorescence vs
PCR cycle number graph shows wild type (WT), transgenic lines (TR) and positive
control (PC). The straight line shows the noise band value.
The results of CaMV 35S promoter and NOS terminator RT-PCR analysis
were obtained separately and given in Figure 3.12 and 3.13 respectively. They
both indicate the presence of 35S and NOS transgenes within the transgenic lines..
The data for target reactions show that all the transgenic lines started to fluoresce
at the same cycle number, around 21st and 22nd cycle, whereas the positive control
again started its peak at 31st cycle. This difference can be explained as above, due
to the differences in DNA concentration. However, the sample from wild type
which was the negative control of the analysis, also gave a positive value. A
typical negative control should give no fluorescence but in our analysis, it started
to fluoresce at 35th cycle even though the fluorescence started very late in the
reaction process.
WT+TR
PC

66
Figure 3.12 Log amplification curves for CaMV 35S promoter target
values. The Fluorescence vs PCR cycle number graph shows wild type (WT),
transgenic lines (TR) and positive control (PC). The straight line shows the noise
band value.
TR WT PC
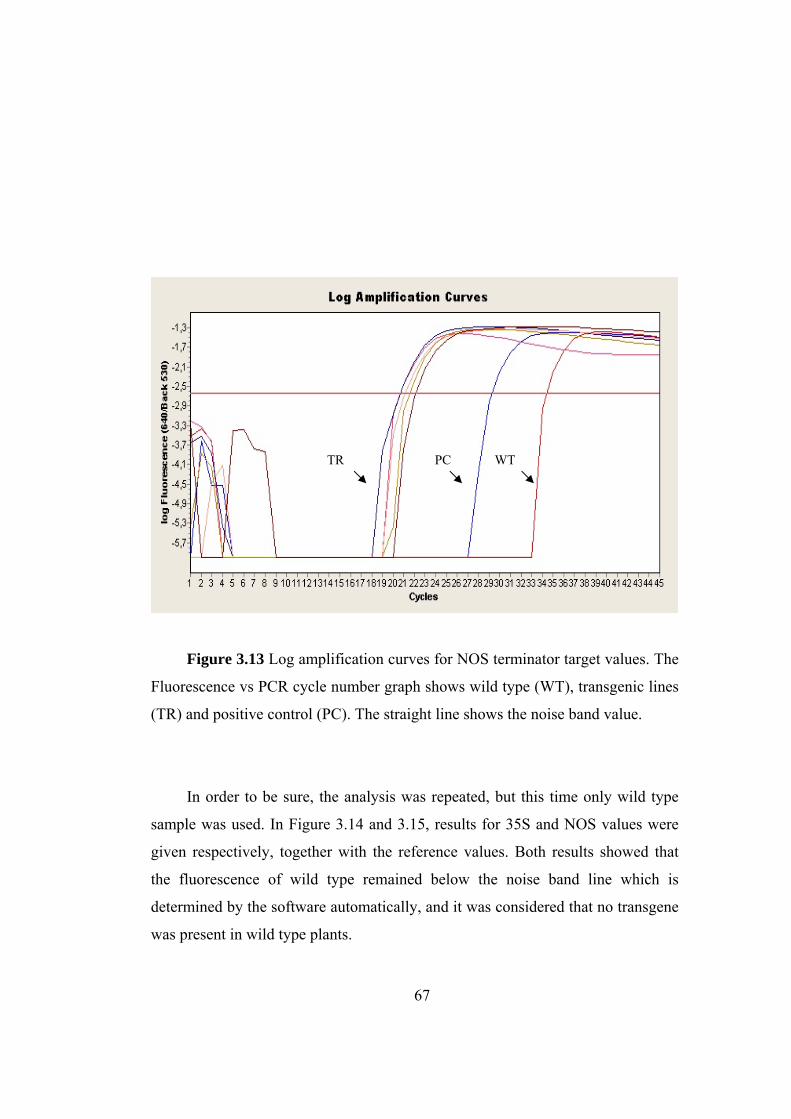
67
Figure 3.13 Log amplification curves for NOS terminator target values. The
Fluorescence vs PCR cycle number graph shows wild type (WT), transgenic lines
(TR) and positive control (PC). The straight line shows the noise band value.
In order to be sure, the analysis was repeated, but this time only wild type
sample was used. In Figure 3.14 and 3.15, results for 35S and NOS values were
given respectively, together with the reference values. Both results showed that
the fluorescence of wild type remained below the noise band line which is
determined by the software automatically, and it was considered that no transgene
was present in wild type plants.
TR PC WT

68
Figure 3.14 Log amplification curve for reference (R) and 35S target (T) values.
The Fluorescence vs PCR cycle number graph shows wild type (WT), transgenic
lines (TR), positive control (PC) and negative control (NC). The straight line
shows the noise band value.
WT R
PC R+T WT
T
NC R+T

69
Figure 3.15 Log amplification curve for reference and NOS target values. The
Fluorescence vs PCR cycle number graph shows wild type (WT), transgenic lines
(TR), positive control (PC) and negative control (NC). The straight line shows the
noise band value.
WT R
PC R+T WT
T
NC R+T

70
Ultimately, RT-PCR analysis results can be summarized as in Table 3.3
below.
Table 3.3 An overall look to the RT-PCR analysis results
Sample Plant DNA CaMV 35S promoter NOS terminator
T1 + + +
T3 + + +
T6 + + +
T9 + + +
T10 + + +
Wild type + - -
3.4.4. Expression Analysis of pflp in T1 Transgenic Plants
In order to evaluate the transgene expression of pflp in transgenic lines,
Northern Blot analysis was also performed. For this purpose, total RNAs were
isolated from wild-type plant which is used as control and from each selected
transgenic line. According to the spectrophotometric analysis, the volume for 2 µg
of total RNA from each line and wild-type was calculated and electrophoresed
(Figure 3.16). rRNA patterns for all samples were clear without any obvious
smearing patterns and equal loading was verified with ethidium bromide staining
as an internal control for blotting.
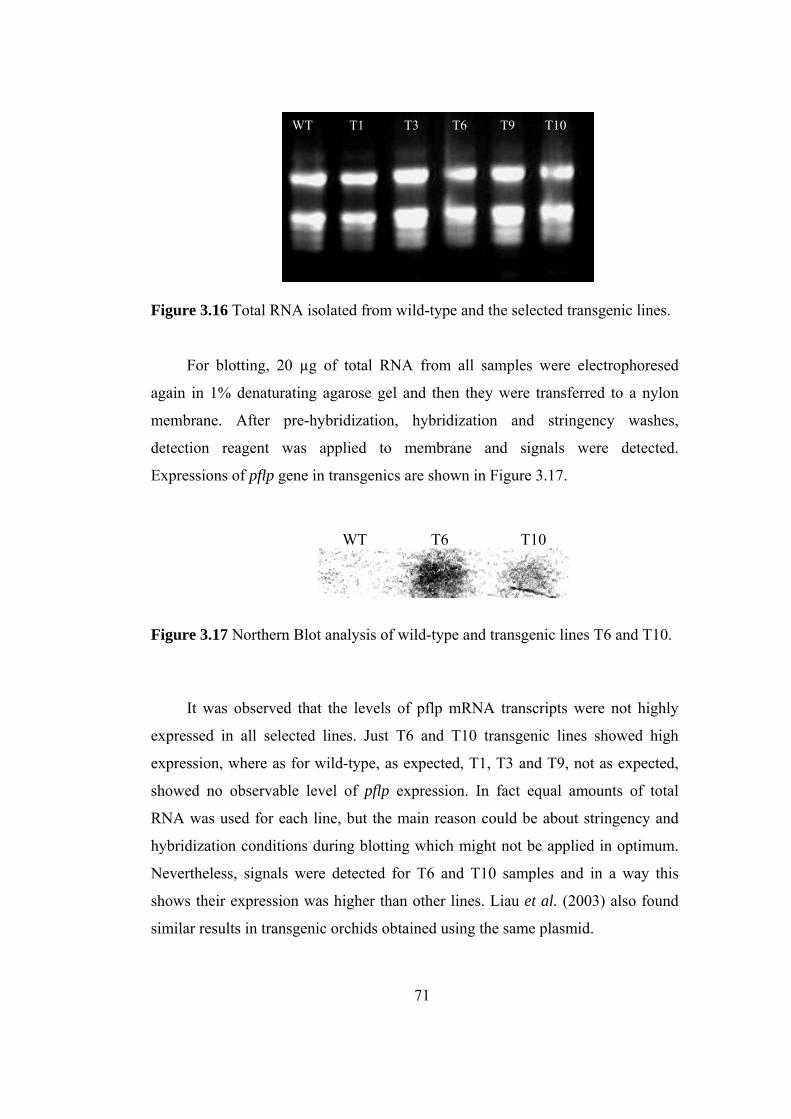
71
Figure 3.16 Total RNA isolated from wild-type and the selected transgenic lines.
For blotting, 20 µg of total RNA from all samples were electrophoresed
again in 1% denaturating agarose gel and then they were transferred to a nylon
membrane. After pre-hybridization, hybridization and stringency washes,
detection reagent was applied to membrane and signals were detected.
Expressions of pflp gene in transgenics are shown in Figure 3.17.
WT T6 T10
Figure 3.17 Northern Blot analysis of wild-type and transgenic lines T6 and T10.
It was observed that the levels of pflp mRNA transcripts were not highly
expressed in all selected lines. Just T6 and T10 transgenic lines showed high
expression, where as for wild-type, as expected, T1, T3 and T9, not as expected,
showed no observable level of pflp expression. In fact equal amounts of total
RNA was used for each line, but the main reason could be about stringency and
hybridization conditions during blotting which might not be applied in optimum.
Nevertheless, signals were detected for T6 and T10 samples and in a way this
shows their expression was higher than other lines. Liau et al. (2003) also found
similar results in transgenic orchids obtained using the same plasmid.
WT T1 T3 T6 T9 T10

72
3.4.5. Overall Evaluation of T1 Transgenic lines
In addition to previously discussed GUS histochemical and molecular
analysis, which showed the presence of uid A, pflp and hph genes, Northern Blot
analysis showed that pflp was highly expressed in lines T6 and T10. However,
lines T1 and T9 showed the presence of pflp and hph genes by PCR analysis, but
their GUS histochemical coloration was not intense as T6 and T10. This result is
not unexpected since the T-DNA integration occurs randomly and in our case,for
lines 6 and 10, the T-DNA must be inserted to an actively expressed site in the
plant genome. On the other hand, T3 just gave positive PCR result for hph gene,
but not for pflp, and no color formation was observed when GUS histochemical
assay was performed, so this line can be categorized as escape. All these data was
summed up in Table 3.4.
Table 3.4 The summary of GUS and molecular analysis results. (+++) in GUS
staining indicates the intensive coloring. WT= Wild-type
3.5. Plant Hypersensitivity Response Assays
In this part of the study, the aim was to observe the increase in harpin-
mediated HR with the interaction of PFLP. For this, plant material was the
putative T0 transgenic lines 1 and 6, they were chosen when their seeds, T1
transgenics were randomly selected and before any molecular analyses were
performed. Also for inoculations, two different pathovars of Pseudomonas
Line #
PCR of pflp
PCR of hph
GUS staining
Northern B.
1 + + + - 3 - + - - 6 + + +++ + 9 + + + - 10 + + +++ + WT - - - -

73
syringae species which produce harpin were selected: Pseudomonas syringae pv.
syringae and Pseudomonas syringae pv. pisi . In this preliminary test, HR was
observed in transgenic lines after 6 days with bacterial injection (Figure 3.18).
Putative transgenic lines 1 and 6 showed HR with a thin, film like appearance
around the infection area. These findings are consistent with other studies
performed in rice (Tang et al., 2001), orchid (Liau et al., 2003) and tobacco
(Huang et al., 2004) where they obtained HR with harpin producing bacteria.
Figure 3.18 Hypersensitive Response given to P. syringae by the transgenic lines
1 and 6.
T1
T6
74
CHAPTER IV
CONCLUSION
The objective of the present study was to evaluate the influence of pflp gene
expression in transgenic tobacco (Nicotiana tabacum cv. Samsun) plants and
develop PFLP mediated Hypersensitive Response for various harpin producing
pathogens.
To complete this aim, first of all, pflp gene was transferred to tobacco via
Agrobacterium –mediated genetic transformation. The transformed tobacco
explants were regenerated in selective media containing hygromycin (25 mg/L).
The 23 independent putative transgenic lines were obtained after successive sets
of transformation experiments. From these 23 lines, 5 lines were randomly
selected and their seeds were grown. These lines were regenerated and
transplanted to soil to obtain T1 generation.
In order to confirm the pflp gene presence in the transgenics, several tests
were conducted. Mendelian inheritance assay showed that in all five lines the
gene was segregated according to Mendelian 3:1 ratio. With GUS histochemical
assay, lines 6 and 10 showed intensive coloration where as lines 1 and 9 result in
smaller color formation. However, line 3 had resulted in negative GUS reaction.
In addition, PCR amplifications were carried out considering the molecular
analyses. PCR reactions with pflp specific primers showed positive reaction for all
five lines except line 3, whereas with hph specific primers showed positive
reaction for all lines. Sequencing analyses of PCR products of pflp, CaMV 35S
75
promoter and NOS terminator amplifications showed high identity when
comparison is made with the genes that are previously characterized.
Northern Blot analysis was also performed in order to prove the pflp
mRNA was present in transgenic lines. Only lines 6 and 10, which showed
intensive coloration in GUS histochemical assay, gave positive results for
Northern Blot analysis. So in conclusion, the analyses altogether confirm that
tobacco plant (N. tabacum cv. Samsun) has been successfully transformed with
pflp.
Finally, bioassays have been performed with putative T0 transgenic lines.
HR response against Pseudomonas syringae pv. syringae and Pseudomonas
syringae pv. pisi was observed in the preliminary tests.
Future work would include further hypersensitive response assays with T1
and T2 with different pathogenic bacterial species in search for disease resistances
in tobacco. In addition, Northern Blot Hybridization of other transgenic plants
would be performed to find high-expression transgenic lines and Southern Blot
Hybridizations should be carried out to confirm the gene integration into the plant
genome.
76
REFERENCES
AG Scientific, Hygromycin.com, www.hygromycin.com, last accessed on
19.1.2006
Alfonso-Rubi J, Ortego F, Castanera P, Carbonero P & Diaz I. 2003. Transgenic
expression of trypsin inhibitor CMe from barley in indica and japonica rice
confers resistance to the rice weevil Sitophilus oryzae. Transgenic Research 12:
23-31.
Baulcombe DC, Saunders GR, Bevan MW, Mayo MA & Harrison BD. 1986.
Expression of biologically active viral satellite RNA from the nuclear genome of
transformed plants. Nature 321: 446-449.
Belfanti E, Silfverberg-Dilworth E, Tartarini S, Patocchi A, Barbierei M, Zhu J,
Vinatzer BA, Gianfranceschi L, Gessler C & Sansavini S. 2004. The HcrVf2 gene
from a wild apple confers scab resistance to a transgenic cultivated variety.
Proceedings of the National Academy of Sciences of the United States of America
101: 886-890.
Bendahmane A, Kanyuka K & Baulcombe DC. 1999. The Rx gene from potato
controls separate virus resistance and cell death responses. The Plant Cell 11: 781-
792.
Bent FA. 2003. Crop Diseases and Strategies for Their Control In: Chrispeels MJ,
Sadava DE (ed) Plant, Genes and Crop Biotechnology, 2003, 2nd Ed. 397, Jones
and Bartlett Pub., USA
77
Bethke, P.C. and Jones, R.L. 2001. Cell death of barley aleurone protoplasts is
mediated by reactive oxygen species. Plant J. 25: 19–29.
Bonas, U. 1994. Hrp genes of phytopathogenic bacteria. In: J.L.Dangle (Ed.)
Current Topics in Microbiology and Immunology, vol. 192: Bacterial
Pathogenesis of Plants and Animals: Molecular and Cellular Mechanisms,
Springer-Verlag, Berlin, pp. 79–98.
Boonrod K, Galetzka D, Nagy PD, Conrad U & Krczal G. 2004. Single-chain
antibodies against a plant viral RNA-dependent RNA polymerase confer virus
resistance. Nature Biotechnology 22: 856-862.
Bowler, C. and Fluhr, R. 2000. The role of calcium and activated oxygen as
signals for controlling cross-tolerance. Trends Plant Sci. 5: 241–245.
Broglie K, Chet I, Holliday M, Cressman R, Biddle P, Knowlton S, Mauvais CJ &
Broglie R. 1991. Transgenic plants with enhanced resistance to the fungal
pathogen Rhizoctonia solani. Science 254: 1194-1197.
Cary JW, Rajasekaran K, Jaynes JM & Cleveland TE. 2000. Transgenic
expression of a gene encoding a synthetic antimicrobial peptide results in
inhibition of fungal growth in vitro and in planta. Plant Science 154: 171-181.
Chen, C.-Y. and Heath, M.C. 1994. Elicitors of necrosis in rust diseases. In: K.
Kohmoto and O.C. Yoder (Eds.) Host-Specific Toxin: Biosynthesis, Receptor and
Molecular Biology, Tottori University, Japan, pp. 73–82.
Cheng M, Fry JE, Pang S, Zhou H, Hironaka CM, Cuncan DR, Conner TW, Wan
Y. 1997. Genetic transformation of wheat mediated by Agrobacterium
tumefaciens. Plant Physiol., 115: 971-980

78
Chern MS, Fitzgerald HA, Yadav RC, Canlas PE, Dong X & Ronald PC. 2001.
Evidence for a disease-resistance pathway in rice similar to the NPR1-mediated
signaling pathway in Arabidopsis. The Plant Journal 27: 101-113.
Christensen AB, Cho BH, Naesby M, Gregersen PL, Brandt J, Madriz-Ordeñana,
Collinge DB & Thordal-Christensen H. 2002. The molecular characterization of
two barley proteins establishes the novel PR-17 family of pathogenesis-related
proteins. Molecular Plant Pathology 3: 135-144.
Clausen M, Krauter R, Schachermayr G, Potrykus I & Sautter C. 2000. Antifungal
activity of a virally encoded gene in transgenic wheat. Nature Biotechnology 18:
446-449.
Coca M, Bortolotti C, Rufat M, Penas G, Eritja R, Tharreau D, Del Pozo AM,
Messeguer J & San Segundo B. 2004. Transgenic rice plants expressing the
antifungal AFP protein from Aspergillus giganteus show enhanced resistance to
the rice blast fungus Magnaporthe grisea. Plant Molecular Biology 54: 245-259.
Crossway A., Oakes J.V., Irvine J. M., Ward B., Knauf V.C., Shewmaker C.K.
1986. Integration of foreign DNA following microinjection of tobacco mesophyll
protoplasts. Molecular and General Genetics, Vol. 202, pp. 179-185
Cuozzo M, O´Connell KM, Kaniewski WK, Fang RK, Chua NH & Tumer NE.
1988. Viral protection in transgenic tobacco plants expressing the cucumber
mosaic virus coat protein or its antisense RNA. Bio/Technology 6: 549-557.
Datta K, Velazhahan R, Oliva N, Ona I, Mew T, Khush GS, Muthukrishnan S &
Datta SK. 1999. Over-expression of the cloned rice thaumatin-like protein (PR-5)
gene in transgenic rice plants enhances environmental friendly resistance to
Rhizoctonia solani causing sheath blight disease. Theoretical and Applied
Genetics 98: 1138-1145.

79
Dayakar BV, Lin HJ, Chen CH, Ger MJ, Lee BH, Pai CH, Chow D, Huang HE,
Hwang SY, Chung MC, Feng TY. 2003. Ferredoxin from sweet pepper
(Capsicum annuum L,) intensifying harpinPss-mediated hypersensitive response
shows an enhanced production of active oxygen species (AOS). Plant Mol Biol;
51:913–24.
De Block M, Botterman J, van Dewiele M, Dockx J, Thoen C, Goseele V, Movva
NR, Thompson C, Van Montagu M, Leemans J. 1987. Engineering herbicide
resistance in plants by expression of a detoxifying enzyme. The EMBO J., Vol 6,
2513-2518
del Pozo, O. and Lam, E. 1998. Caspases and programmed cell death in the
hypersensitive response of plants to pathogens. Curr. Biol. 8: 1129–1132.
Donaldson PA, Anderson T, Lane BG, Davidson AL & Simmonds DH. 2001.
Soybean plants expressing an active oligomeric oxalate oxidase from the wheat
gf-2.8 (germin) gene are resistant to the oxalate-secreting pathogen Sclerotinia
sclerotiorum. Physiological and Molecular Plant Pathology 59: 297-307
D’Silva, I., Poirier, G.G. and Heath, M.C. 1998. Activation of cysteine proteases
in cowpea plants during the hypersensitive response – a form of programmed cell
death. Exp. Cell Res. 245: 389–399.
Dulmage HT. 1981. Insecticidal activity of isolates of Bacillus thrungiensis and
their potential for pest control. In Microbial Control of Pests (Burgess HD, Ed) pp
193-222, Academic Press, NY

80
Escobar MA, Civerolo EL, Summerfelt KR & Dandekar AM. 2001. RNAi-
mediated oncogene silencing confers resistance to crown gall tumorigenesis.
Proceedings of the National Academy of Sciences of the United States of America
98: 13437-13442.
Flor HH. 1971. Current status of the gene-for-gene concept. Annual Review of
Phytopathology 9: 275-296.
Galan, J.E. and Collmer, A. 1999. Type III secretion machines: bacterial devices
for protein delivery into host cells. Science 284:1322–1328.
Gao AG, Hakimi SM, Mittanck CA, Wu Y, Woerner BM, Stark DM, Shah DM,
Liang J & Rommens CM. 2000. Fungal pathogen protection in potato by
expression of a plant defensin peptide. Nature Biotechnology 18: 1307-1310.
Golemboski DB, Lomonossoff GP & Zaitlin M. 1990. Plants transformed with a
tobacco mosaic virus non-structural gene sequence are resistant to the virus.
Proceedings of the National Academy of Sciences of the United States of America
87: 6311-6315.
Gonsalves D. 2004. Transgenic papaya in Hawaii and beyond. AgBioForum,
7(1&2), 36-40.
Green, D.R. and Reed, J.C. 1998. Mitochondria and apoptosis. Science 281:
1309–1312
Grison R, Grezes-Besset B, Schneider M, Lucante N, Olsen L, Legnay J-J &
Toppan A. 1996. Field tolerance to fungal pathogens of Brassica napus
constitutively expressing a chimeric chitinase gene. Nature Biotechnology 14:
643-646.
81
Groover, A. and Jones, A.M. 1999. Tracheary element differentiation uses a novel
mechanism coordinating programmed cell death and secondary wall synthesis.
Plant Physiol. 119: 375–384
Gutierrez-Campos R, Torres-Acosta JA, Saucedo-Arias LJ & Gomez-Lim MA.
1999. The use of cysteine proteinase inhibitors to engineer resistance against
potyviruses in transgenic tobacco plants. Nature Biotechnology 17: 1223-1226
He SY, Huang HC, Collmer A. 1993. Pseudomonas syringae pv. syringae Harpin:
a protein that is secreted via the hrp pathway and elicits the hypersensitive
response in plants. Cell 73:1255–1266.
He, S.Y. 1998. Type III protein secretion systems in plant and animal pathogenic
bacteria. Annu. Rev. Phytopath. 36: 363–392.
He XZ & Dixon RA. 2000. Genetic manipulation of isoflavone 7-O-
methyltransferase enhances biosynthesis of 4'-O-methylated isoflavonoid
phytoalexins and disease resistance in alfalfa. The Plant Cell 12: 1689-1702.
Heath, M.C. 1997. Evolution of plant resistance and susceptibility to fungal
parasites. In: G.C. Carroll and P. Tudzynski (Eds.) The Mycota Vol. V. Plant
Relationships Part B, Springer-Verlag, Berlin/Heidelberg, pp. 257–276.
Heath MC. 2000. Hypersensitive response-related death. Plant Molecular Biology
44: 321–334,
Hennin C, Hofte M & Diederichsen E. 2001. Functional expression of Cf9 and
Avr9 genes in Brassica napus induces enhanced resistance to Leptosphaeria
maculans. Molecular Plant-Microbe Interactions 14: 1075-1085.
82
Heil M & Bostock RM. 2002. Induced systemic resistance (ISR) against
pathogens in the context of induced plant defences. Annals of Botany 89: 503-
512.
Hiei Y, Komari T, Kubo T. 1997. Transformation of rice mediated by
Agrobacterium tumefaciens. Plant Mol. Bio., 35: 205-218
Horsch R.B., Fry J.E., Hoffman N.L., Eicholtz D., Rogers S.G., Fraley R.T., 1985
A simple and general method for transferring genes into plants. Science, 227:
1229-1231.
Ishida Y, Saito H, Ohto S, Hiei Y, Komari T, Kumashiro T. 1996. High efficiency
transformation of maize (Zea mays L.) mediated by Agrobacterium tumefaciens.
Nature Biotech., 14: 745-750
Iwai T, Kaku H, Honkura R, Nakamura S, Ochiai H, Sasaki T & Ohashi Y. 2002.
Enhanced resistance to seed-transmitted bacterial diseases in transgenic rice plants
overproducing an oat cell-wall-bound thionin. Molecular Plant-Microbe
Interactions 15: 515-521.
Jach G, Görnhardt B, Mundy J, Logemann J, Pinsdorf E, Leah R, Schell J & Maas
C. 1995. Enhanced quantitative resistance against fungal disease by combinatorial
expression of different barley antifungal proteins in transgenic tobacco. The Plant
Journal 8: 97-109.
James C. 2005. Global review of commercialized transgenic crops: 2005 ISAAA
Briefs 34, Ithaca, NY
Jones JDG. 2001. Putting knowledge of plant disease resistance genes to work.
Current opinion in Plant Biology 4: 281-287.
83
Kazan K, Rusu A, Marcus JP, Goulter KC & Manners JM. 2002. Enhanced
quantitative resistance to Leptosphaeria maculans conferred by expression of a
novel antimicrobial peptide in canola (Brassica napus L.). Molecular Breeding 10:
63-70.
Kazan K, Gürel E. 2003. Increasing Resistance to Diseases In: Özcan S, Gürel,
Babaoğlu M (ed), Plant Biotechnology : Genetic Engineering and Applications,
pp 262-266, S.Ü. Yayınları, Konya
Keen NT. 1990. Gene-for-gene complementarity in plant-pathogen interactions.
Annu Rev Genet 24:447–463.
Keller H, Pamboukdjian N, Ponchet M, Poupet A, Delon R, Verrier JL, Roby D &
Ricci P. 1999. Pathogen-induced elicitin production in transgenic tobacco
generates a hypersensitive response and nonspecific disease resistance. The Plant
Cell 11: 223-235.
Kessler A & Baldwin IT. 2002. Plant responses to insect herbivory: The emerging
molecular analysis. Annual Review of Plant Biology 53: 299-328.
Kim JF, Beer SV. 2000. hrp genes and harpins of Erwinia amylovora: a decade of
discovery. In: Vanneste JL, editor. Fire Blight and its Causative Agent, Erwinia
amylovora. Wallingford, UK: CAB International;. p. 141–62.
Kim SJ, Lee SJ, Kim BD & Paek KH. 1997. Satellite-RNA-mediated resistance to
cucumber mosaic virus in transgenic plants of hot pepper (Capsicum annuum cv.
Golden Tower). Plant Cell Reports 16: 825-830.
Klein T.M., Wolf E.D, Wu R., Stanford J.C. 1987. High velocity microprojectiles
delivering nucleic acids into living cells. Nature, Vol. 327, pp. 70-72
84
Lamb CJ, Beachy RN. 1989. Plant Gene Transfer In: Lamb CJ, Beachy RN (eds),
Proceedings to a UCLA Symposium, Utah, April 1-7 1989. Wiley-Liss, NY
Lawson EC, Weiss JD, Thomas PE & Kaniewski WK. 2001. NewLeaf Plus®
Russet Burbank potatoes: replicase-mediated resistance to potato leafroll virus.
Molecular Breeding 7: 1-12.
Levine A, Tenhaken R, Dixon R, Lamb C. 1994. H2O2 from the oxidative burst
orchestrates the plant hypersensitive disease resistance response. Cell 79:583–593.
Levine A, Pennell RI, Alvarez ME, Palmer R, Lamb C. 1996. Calcium-mediated
apoptosis in plant hypersensitive disease resistance response. Curr Biol 6:427–
437.
Liao LJ, Pan IC, Chan YL, Hsu YH, Chen WH & Chan MT. 2004. Transgene
silencing in Phalaenopsis expressing the coat protein of Cymbidium mosaic virus
is a manifestation of RNA-mediated resistance. Molecular Breeding 13: 229-242.
Liau CH, Lu JC, Prasad V, Hsiao HH, You SJ, Lee JT, Yang NS, Huang HE,
Feng TY, Chen WH, Chan MT. 2003. The sweet pepper ferredoxin-like protein
(PFLP) conferred resistance against soft rot disease in oncidium orchid.
Transgenic Res; 12:329–36.
Lin HJ, Cheng HY, Chen CH, Hueng HC and Feng TY. 1997. Amphipathic
proteins delay the hypersensitive response caused by harpinpss and Pseudomonas
syringae pv. syringae. Physiol. Mol. Plant. Path. 51: 367–376.
Liu D, Burton S, Glancy T, Li ZS, Hampton R, Meade T & Merlo DJ. 2003.
Insect resistance conferred by 283-kDa Photorhabdus luminescens protein TcdA
in Arabidopsis thaliana. Nature Biotechnology 21: 1222-1228.

85
Lodge JK, Kaniewski WK & Tumer NE. 1993. Broad-spectrum virus resistance in
transgenic plants expressing pokeweed antiviral protein. Proceedings of the
National Academy of Sciences of the United States of America 90: 7089-7093.
Logemann J, Jach G, Tommerup H, Mundy J & Schell J. 1992. Expression of a
barley ribosome-inactivating protein leads to increased fungal protection in
transgenic tobacco plants. Bio/Technology 10: 305-308.
Markwick NP, Docherty LC, Phung MM, Lester MT, Murray C, Yao JL, Mitra
DS, Cohen D, Beuning LL, Kutty-Amma S & Christeller JT. 2003. Transgenic
tobacco and apple plants expressing biotin-binding proteins are resistant to two
cosmopolitan insect pests, potato tuber moth and lightbrown apple moth,
respectively. Transgenic Research 12: 671-681.
Mazier M, Pannetier C, Tourneur J, Jouanin L & Giband M. 1997. The expression
of Bacillus thuringiensis toxin genes in plant cells. Biotechnology Annual Review
3: 313-347.
Mauch F, Mauch-Mani B & Boller T. 1988. Antifungal hydrolases in pea tissue II
inhibition of fungal growth by combinations of chitinase and β-1,3-glucanase.
Plant Physiology 88: 936-942.
Métraux J-P. 2001. Systemic acquired resistance and salicylic acid: current state
of knowledge. European Journal of Plant Pathology 107: 13-18.
Métraux J-P, Nawrath C & Genoud T. 2002. Systemic acquired resistance.
Euphytica 124: 237-243
Michelmore, R.W. and Meyers, B.C. 1998. Clusters of resistance genes in plants
evolve by divergent selection and a birth-and-death process. Genome Res. 8:
1113–1130.

86
Mittler R, Simon L, Lam E. 1997. Ultra structural changes and fragmentation of
nuclear and chloroplast DNA during the hypersensitive response in tobacco . J
Cell Sci 110:1333–1344.
Mitsuhara I, Matsufuru H, Ohshima M, Kaku H, Nakajima Y, Murai N, Natori S
& Ohashi Y. 2000. Induced expression of sarcotoxin IA enhanced host resistance
against both bacterial and fungal pathogens in transgenic tobacco. Molecular
Plant-Microbe Interactions 13: 860-868.
Morel, J.-B. and Dangl, J.L. 1999. Suppressors of the Arabidopsis lsd5 cell death
mutation identify genes involved in regulating disease resistance responses.
Genetics 151: 305–319.
Mould, M.J.R. and Heath, M.C. 1999. Ultrastructural evidence of differential
changes in transcription, translation, and cortical microtubules during in planta
penetration of cells resistant or susceptible to rust infection. Physiol. Mol. Plant
Path. 55: 225–236.
Murphy AM, Gilliland A, Wong CE, West J, Singh DP & Carr JP. 2001. Signal
transduction in resistance to plant viruses. European Journal of Plant Pathology
107: 121-128.
Murray DR. 1993. Breeding Plants for the twenty-first century. In: Murray DR
(ed), Advance Methods in Plant Breeding and Biotechnology. CAB International,
Midsomer Norton, Bath.
Nakajima H, Muranaka T, Ishige F, Akutsu K & Oeda K. 1997. Fungal and
bacterial disease resistance in transgenic plants expressing human lysozyme. Plant
Cell Reports 16: 674-679.

87
Nurnberger T, Nennstiel D, Jabs T, Sacks WR, Hahlbrock K, Scheel D. 1994.
High affinity binding of a fungal oligopeptide elicitor to parsley plasma
membranes triggers multiple defense responses. Cell 78:449–460.
Oerke EC, Dehne HW, Schönbeck F & Weber A. 1999. Crop production and crop
protection: estimated losses in major food and cash crops. Elsevier Science,
Amsterdam, NL. 770 pp.
Oldroyd GED & Staskawicz BJ. 1998. Genetically engineered broad-spectrum
disease resistance in tomato. Proceedings of the National Academy of Sciences of
the United States of America 95: 10300-10305.
Öktem H. A., Özkan F., Özalp V.C., Yücel M. 1994. Agrobacterium mediated
gene transfer in tobacco. Tr. J. of Botany Vol. 18 pp. 397-405
Paal J, Henselewski H, Muth J, Meksem K, Menendez CM, Salamini F, Ballvora
A & Gebhardt C. 2004. Molecular cloning of the potato Gro1-4 gene conferring
resistance to pathotype Ro1 of the root cyst nematode Globodera rostochiensis,
based on a candidate gene approach. The Plant Journal 38: 285-297.
Pappinen A, Degefu Y, Syrjälä L, Keinonen K & von Weissenberg K. 2002.
Transgenic silver birch (Betula pendula) expressing sugar beet chitinase 4 shows
enhanced resistance to Pyrenopeziza betulicola. Plant Cell Reports 20: 1046-
1051.
Paszkowski J., Shillito R.D., Saul M., Mandak V., Hohn T., Hohn B., Potrykus I.
1984. Direct gene transfer to plants. EMBO Journal, Vol. 3 No. 12, pp. 2717-2722
Peschen D, Li HP, Fischer R, Kreuzaler F & Liao YC. 2004. Fusion proteins
comprising a Fusarium-specific antibody linked to antifungal peptides protect
plants against a fungal pathogen. Nature Biotechnology 22: 732-738.
88
Pike SM, Adam AL, Pu XA, Hoyos ME, Laby R, Beer SV,Novacky A. 1998.
Effects of Erwinia amylovora harpin on tobacco leaf cell membranes are related
to leaf necrosis and electrolyte leakage and distinct from perturbations caused by
inoculated E. amylovora. Physiol Mol Plant Pathol;53:39–60.
Powell-Abel P, Nelson RS, De B, Hoffman N, Rogers SG, Fraley RT & Beachy
RN. 1986. Delay of disease development in transgenic plants that express the
tobacco mosaic virus coat protein gene. Science 232: 738-743.
Powell ALT, van Kan J, ten Have A, Visser J, Greve LC, Bennett AB &
Labavitch JM. 2000. Transgenic expression of pear PGIP in tomato limits fungal
colonization. Molecular Plant-Microbe Interactions 13: 942-950.
Powell PA, Stark DM, Sanders PR & Beachy RN. 1989. Protection against
tobacco mosaic virus in transgenic plants that express tobacco mosaic virus
antisense RNA. Proceedings of the National Academy of Sciences of the United
States of America 86: 6949-6952.
Pyung OL, Lee U, Ryu JS, Choi JK, Hovanessian A, Kim CS, Cho BH & Nam
HG. 2002. Multiple virus resistance in transgenic plants conferred by the human
dsRNA-dependent protein kinase. Molecular Breeding 10: 11-18.
Roche Applied Sciences, food-safety, http://www.roche-
appliedscience.com/fst/molecular_food_safety.htm?/molecular-food-safety-
testing/products_03.htm, Accessed on 19.1.2006
Rommens CM, Salmeron JM, Oldroyd GE & Staskawicz BJ. 1995. Intergeneric
transfer and functional expression of the tomato disease resistance gene Pto. The
Plant Cell 7: 1537-1544.
89
Sela-Buurlage MB, Ponstein AS, Bres-Vloemans SA, Melchers LS, van den Elzen
PJM & Cornelissen BJC. 1993. Only specific tobacco (Nicotiana tabacum)
chitinase and β-1,3-glucanase exhibit antifungal activity. Plant Physiology 101:
857-863.
Seppänen P, Puska R, Honkanen J, Tyulkina LG, Fedorkin O, Morozov Syu &
Atabekov JG. 1997. Movement protein derived resistance to triple gene block-
containing plant viruses. Journal of General Virology 78: 1241-1246.
Shin R, Park JM, An JM & Paek KH. 2002. Ectopic expression of Tsi1 in
transgenic hot pepper plants enhances host resistance to viral, bacterial, and
oomycete pathogens. Molecular Plant-Microbe Interactions 15:983-989.
Škalamera, D. and Heath, M.C. 1998. Changes in the cytoskeleton accompanying
infection-induced nuclear movements and the hypersensitive response in plant
cells invaded by rust fungi. Plant J. 16: 191–200.
Stakman, E.C. 1915. Relation between Puccinia graminis and plants highly
resistant to its attack. J. Agric. Res. 4: 193–200.
Stoger E, Vaquero C, Torres E, Sach M, Nocholdon L, Drossard J, Williams S,
Keen D, Perrin Y, Christou P, Fischer R. 2000. Cereal crops as viable production
and storage systems for pharmaceutical scFv antibodies. Plant Molecular Biology,
Vol 42, 583-590
Suzuki N, Rizhsky L, Liang H, Shuman J, Shulaev V, Mittler R. 2005. Enhanced
Tolerance to Environmental Stress in Transgenic Plants Expressing the
Transcriptional Coactivator Multiprotein Bridging Factor 1c. Plant Physiology,
November 2005, Vol. 139, pp. 1313-1322

90
Tacke E, Salamini F & Rohde W. 1996. Genetic engineering of potato for broad-
spectrum protection against virus infection. Nature Biotechnology 14: 1597-1601.
Tai TH, Dahlbeck D, Clark ET, Gajiwala P, Pasion R, Whalen MC, Stall RE &
Staskawicz BJ. 1999. Expression of the Bs2 pepper gene confers resistance to
bacterial spot disease in tomato. Proceedings of the National Academy of
Sciences of the United States of America 96: 14153-14158.
Takken FLW & Joosten MHAJ. 2000. Plant resistance genes: their structure,
function and evolution. European Journal of Plant Pathology 106: 699-713.
Tang KX, Sun XF, Hu QN, Wu AZ, Lin CH, Lin HJ, Twyman RM, Christou P,
Feng TY. 2001. Transgenic rice plants expressing the ferredoxin-like protein
(AP1) from sweet pepper show enhanced resistance to Xanthomonas oryzae pv.
oryzae. Plant Sci.;160:1035–42.
Tang X, Frederick RD, Zhou J, Halterman DA, Jia Y and Martin GB. 1997.
Initiation of plant disease resistance by physical interaction of AvrPto and Pto
kinase. Science 274: 2060 ± 2063
Tavladoraki P, Benvenuto E, Trinca S, De Martinis D, Cattaneo A & Galeffi P.
1993. Transgenic plants expressing a functional single-chain Fv antibody are
specifically protected from virus attack. Nature 366: 469-472.
Tenhaken R, Levine A, Brisson LF, Dixon RA, Lamb C. 1995. Function of the
oxidative burst in hypersensitive disease resistance. Proc Natl Acad Sci USA.
92:4158–63.
Tingay S, McElroy D, Kalla R, Fieg S, Wang M, Thorntın S, Brettell R. 1997.
Agrobacterium tumefaciens-mediated barley transformation. Plant J., 11: 1369-
1376
91
Truve E, Aaspollu A, Houkanen J, Puska R, Mehto M, Hassl A, Teeri TH, Kelve
M, Seppänen P & Saarma M. 1993. Transgenic potato plants expressing 2’-5’
oligoadenylate synthetase are protected from potato virus X infection under field
conditions. Bio/Technology 11: 1048-1052.
Twyman RM, Christou P, Stöger E. 2002. Plant Biotechnology and Transgenic
Plants, edited by Oksman-Caldentey and Barz W, chapter 6 : 183-189
You SJ, Liau CH, Huang HE, Feng TY, Prasad V, Hsiao H, Lu JC, Chan MT.
2003. Sweet pepper ferredoxin-like protein (pflp) gene as a novel selection marker
for orchid transformation. Planta 217:60-65
Van den Ackerveken G, Marois E and Bonas U. 1996. Recognition of the
bacterial protein AvrBs3 occurs inside the host plant cell. Cell 87: 1307 ± 1316
van Loon LC & van Strien EA. 1999. The families of pathogenesis-related
proteins, their activities, and comparative analysis of PR-1 type proteins.
Physiological and Molecular Plant Pathology 55: 85-97.
Verberne MC, Verpoorte R, Bol JF, Mercado-Blanco J & Linthorst HJ. 2000.
Overproduction of salicylic acid in plants by bacterial transgenes enhances
pathogen resistance. Nature Biotechnology 18: 779-783.
Wang G-L, Song W-Y, Ruan D-L, Sideris S, Ronald PC. 1996. The cloned gene,
Xa21, confers resistance to multiple Xanthamonas oryzae pv. oryzae isolates in
transgenic plants. Plant-Microbe interactions. 9:850-855.
Waterhouse PM, Graham MW & Wang MB. 1998. Virus resistance and gene
silencing in plants can be induced by simultaneous expression of sense and
antisense RNA. Proceedings of the National Academy of Sciences of the United
States of America. 95: 13959-13964.

92
Wei Z-M, Lacy RJ, Zumoff CH, Bauer DW, He SY, Collmer A, Beer SV. 1992.
Harpin, elicitor of the hypersensitive response produced by the plant pathogen
Erwinia amylovora. Science. 257:85–8.
Whitham S, McCormick S & Baker B. 1996. The N gene of tobacco confers
resistance to tobacco mosaic virus in transgenic tomato. Proceedings of the
National Academy of Sciences of the United States of America 93: 8776-8781.
Xiao S, Charoenwattana P, Holcombe L & Turner JG. 2003. The Arabidopsis
genes RPW8.1 and RPW8.2 confer induced resistance to powdery mildew diseases
in tobacco. Molecular Plant-Microbe Interactions 16: 289-294.
Xu, H. and Heath, M.C. 1998. Role of calcium in signal transduction during the
hypersensitive response caused by basidiospore-derived infection of the cowpea
rust fungus. Plant Cell 10: 585–597.
Yang H, Ozias-Akins P, Culbreath AK, Gorbet DW, Weeks JR, Mandal B &
Pappu HR. 2004. Field evaluation of Tomato spotted wilt virus resistance in
transgenic peanut (Arachis hypogaea). Plant Disease 88: 259-264.
Ye XD, Al-Babili S, Kloti A, Zhang J, Lucca P, Beyer P, Potrykus I. 2000.
Engineering the provitamin A (beta-carotene) biosynthetic pathway into
(carotene-free) rice endosperm. Science Vol.287, 303-305
Zoubenko O, Hudak K & Tumer NE. 2000. A non-toxic pokeweed antiviral
protein mutant inhibits pathogen infection via a novel salicylic acid-independent
pathway. Plant Molecular Biology 44: 219-229.

93
APPENDIX A: Plasmid Map
Figure A.1 (a) Complete map of pCAMBIA 1304/35S-SAPI (b) T-DNA region
of pSPFLP. Pflp: sweet pepper ferredoxin-like protein cDNA, hph : hygromycin
phosphotransferase cDNA sequence; GFP-GUS: green fluorescent protein and β-
glucuronidase gene fusion; P35S: cauliflower mosaic virus 35S promoter; nos:
nopaline synthase terminator sequence; T35S: cauliflower mosaic virus35S
terminator sequence; LB: left border; RB: right border
a
b

94
APPENDIX B: Bacterial Culture Medium
YEB Medium
For 1 liter,
Nutrient Broth 13.5 gr
Yeast Extract 1 gr
MgSO4.7H2O 2 mM
Agar 15 gr
pH: 7.2
LB
For 1 liter,
Yeast Extract 5 gr
Tryptone 10 gr
NaCl 10 gr
1N NaOH 1 ml
Agar 15 gr
pH: 7.4
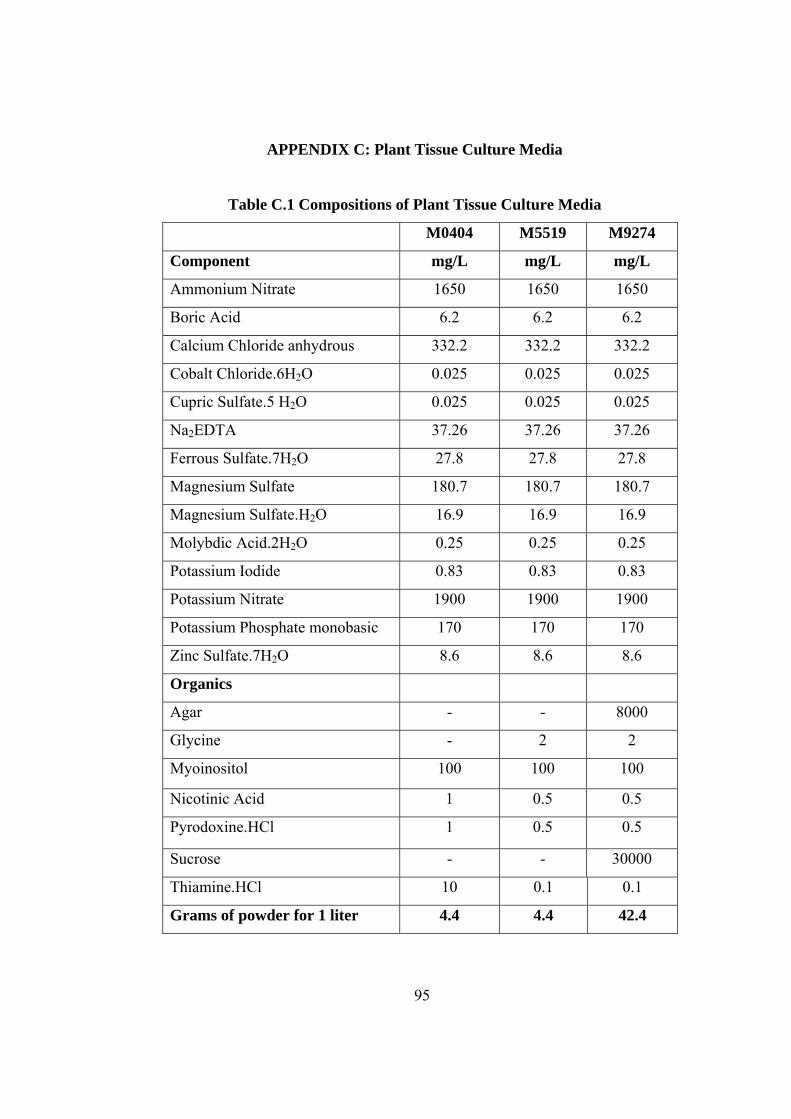
95
APPENDIX C: Plant Tissue Culture Media
Table C.1 Compositions of Plant Tissue Culture Media
M0404 M5519 M9274
Component mg/L mg/L mg/L
Ammonium Nitrate 1650 1650 1650
Boric Acid 6.2 6.2 6.2
Calcium Chloride anhydrous 332.2 332.2 332.2
Cobalt Chloride.6H2O 0.025 0.025 0.025
Cupric Sulfate.5 H2O 0.025 0.025 0.025
Na2EDTA 37.26 37.26 37.26
Ferrous Sulfate.7H2O 27.8 27.8 27.8
Magnesium Sulfate 180.7 180.7 180.7
Magnesium Sulfate.H2O 16.9 16.9 16.9
Molybdic Acid.2H2O 0.25 0.25 0.25
Potassium Iodide 0.83 0.83 0.83
Potassium Nitrate 1900 1900 1900
Potassium Phosphate monobasic 170 170 170
Zinc Sulfate.7H2O 8.6 8.6 8.6
Organics
Agar - - 8000
Glycine - 2 2
Myoinositol 100 100 100
Nicotinic Acid 1 0.5 0.5
Pyrodoxine.HCl 1 0.5 0.5
Sucrose - - 30000
Thiamine.HCl 10 0.1 0.1
Grams of powder for 1 liter 4.4 4.4 42.4

96
MSA
For 1 liter,
42.4 gr M9274
1 mg/L BA (from 1mg/L stock solution)
0.1 mg/L NAA (from 1mg/L stock solution)
pH: 5.7
MSB
MSA supplemented with appropriate concentration of selective agent (3 or 5
mg/L of hygromycin from 10 mg/L stock solution).
MSC
42.4 gr M9274 supplemented with appropriate concentration of selective agent (3
or 5 mg/L of PPT from 10 mg/L stock solution).
Liquid MS
For 1 liter,
4.4 gr/L M5519
3% sucrose
pH: 5.5
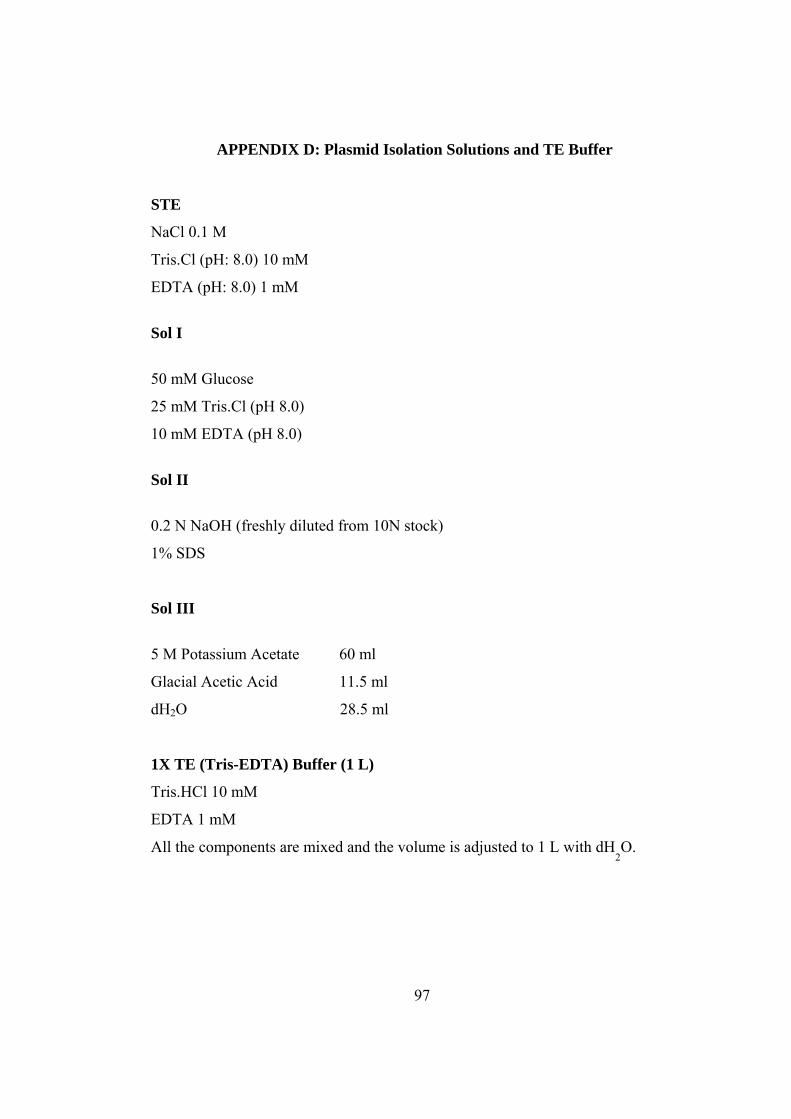
97
APPENDIX D: Plasmid Isolation Solutions and TE Buffer
STE
NaCl 0.1 M
Tris.Cl (pH: 8.0) 10 mM
EDTA (pH: 8.0) 1 mM
Sol I
50 mM Glucose
25 mM Tris.Cl (pH 8.0)
10 mM EDTA (pH 8.0)
Sol II
0.2 N NaOH (freshly diluted from 10N stock)
1% SDS
Sol III
5 M Potassium Acetate 60 ml
Glacial Acetic Acid 11.5 ml
dH2O 28.5 ml
1X TE (Tris-EDTA) Buffer (1 L)
Tris.HCl 10 mM
EDTA 1 mM
All the components are mixed and the volume is adjusted to 1 L with dH2O.
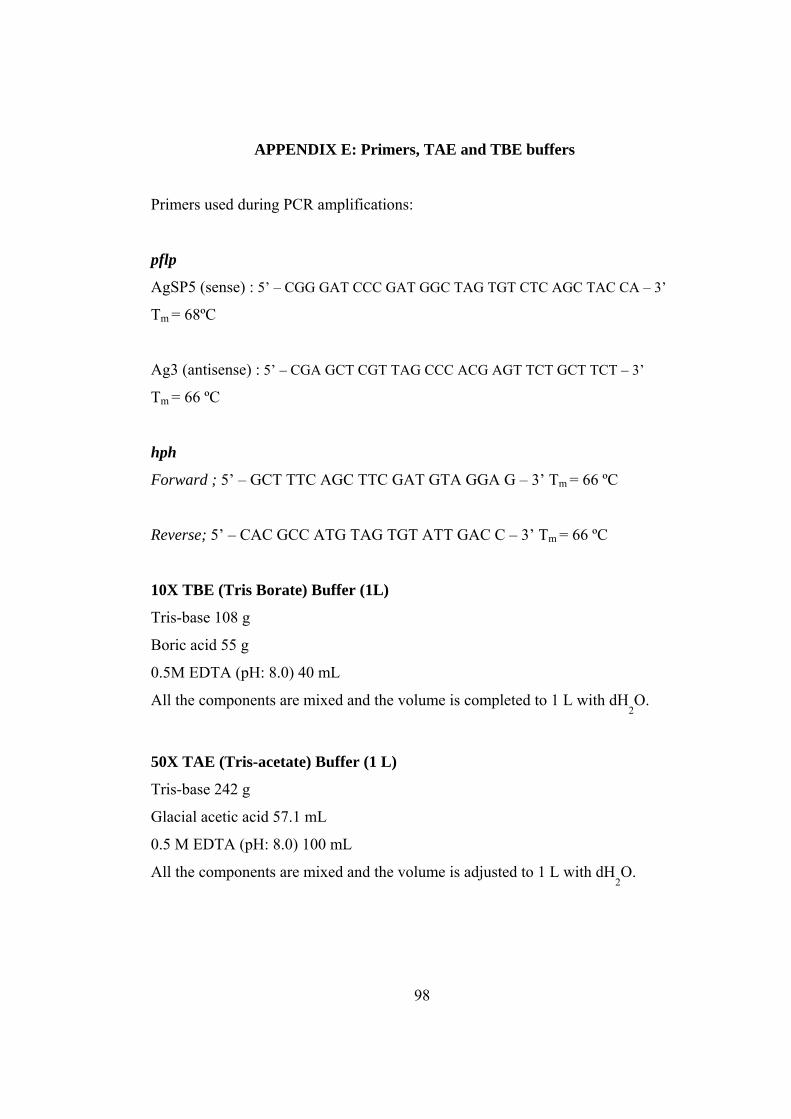
98
APPENDIX E: Primers, TAE and TBE buffers
Primers used during PCR amplifications:
pflp
AgSP5 (sense) : 5’ – CGG GAT CCC GAT GGC TAG TGT CTC AGC TAC CA – 3’
Tm = 68ºC
Ag3 (antisense) : 5’ – CGA GCT CGT TAG CCC ACG AGT TCT GCT TCT – 3’
Tm = 66 ºC
hph
Forward ; 5’ – GCT TTC AGC TTC GAT GTA GGA G – 3’ Tm = 66 ºC
Reverse; 5’ – CAC GCC ATG TAG TGT ATT GAC C – 3’ Tm = 66 ºC
10X TBE (Tris Borate) Buffer (1L)
Tris-base 108 g
Boric acid 55 g
0.5M EDTA (pH: 8.0) 40 mL
All the components are mixed and the volume is completed to 1 L with dH2O.
50X TAE (Tris-acetate) Buffer (1 L)
Tris-base 242 g
Glacial acetic acid 57.1 mL
0.5 M EDTA (pH: 8.0) 100 mL
All the components are mixed and the volume is adjusted to 1 L with dH2O.

99
APPENDIX F: GUS Substrate and Fixative Solutions
GUS Substrate Solution
0.1 M NaPO4 Buffer, pH 7.0
10 mM EDTA
0.5mM K-ferricyanide, pH 7.0
0.5 mM K-ferrocyanide, pH 7.0
1 mM X-Glucoronide (dissolved in dimethyl formamide)
10% v/v Triton X-100
GUS Fixative Solution
10% v/v Formaldehyde
20% v/v Ethanol
5% v/v Acetic Acid
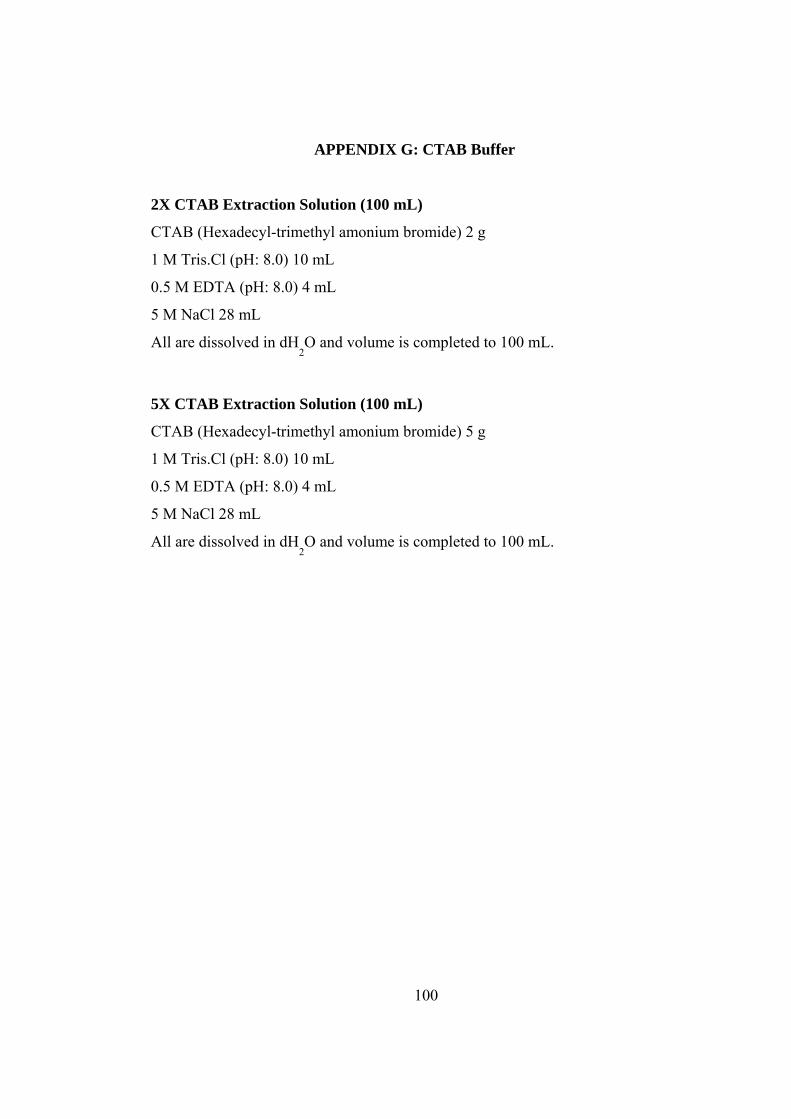
100
APPENDIX G: CTAB Buffer
2X CTAB Extraction Solution (100 mL)
CTAB (Hexadecyl-trimethyl amonium bromide) 2 g
1 M Tris.Cl (pH: 8.0) 10 mL
0.5 M EDTA (pH: 8.0) 4 mL
5 M NaCl 28 mL
All are dissolved in dH2O and volume is completed to 100 mL.
5X CTAB Extraction Solution (100 mL)
CTAB (Hexadecyl-trimethyl amonium bromide) 5 g
1 M Tris.Cl (pH: 8.0) 10 mL
0.5 M EDTA (pH: 8.0) 4 mL
5 M NaCl 28 mL
All are dissolved in dH2O and volume is completed to 100 mL.
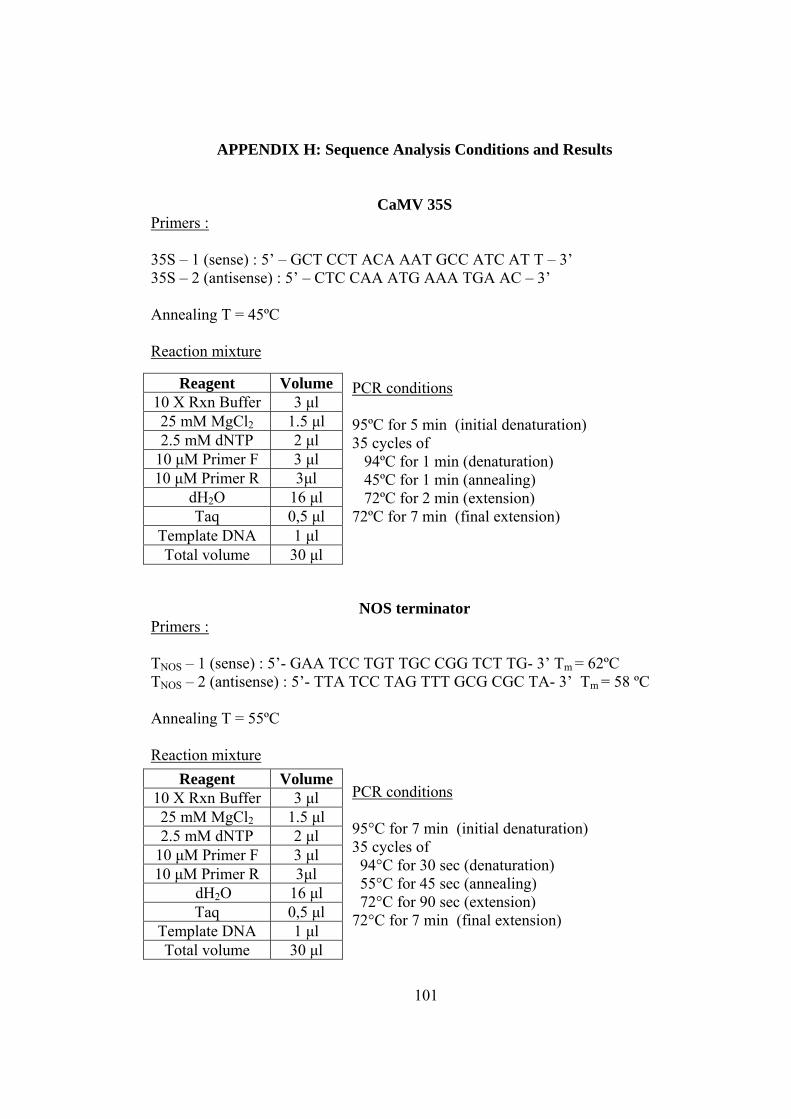
101
APPENDIX H: Sequence Analysis Conditions and Results
CaMV 35S Primers : 35S – 1 (sense) : 5’ – GCT CCT ACA AAT GCC ATC AT T – 3’ 35S – 2 (antisense) : 5’ – CTC CAA ATG AAA TGA AC – 3’ Annealing T = 45ºC Reaction mixture
PCR conditions 95ºC for 5 min (initial denaturation) 35 cycles of 94ºC for 1 min (denaturation) 45ºC for 1 min (annealing) 72ºC for 2 min (extension) 72ºC for 7 min (final extension)
NOS terminator
Primers : TNOS – 1 (sense) : 5’- GAA TCC TGT TGC CGG TCT TG- 3’ Tm = 62ºC TNOS – 2 (antisense) : 5’- TTA TCC TAG TTT GCG CGC TA- 3’ Tm = 58 ºC Annealing T = 55ºC Reaction mixture
PCR conditions 95°C for 7 min (initial denaturation) 35 cycles of 94°C for 30 sec (denaturation) 55°C for 45 sec (annealing) 72°C for 90 sec (extension) 72°C for 7 min (final extension)
Reagent Volume 10 X Rxn Buffer 3 µl 25 mM MgCl2 1.5 µl 2.5 mM dNTP 2 µl
10 µM Primer F 3 µl 10 µM Primer R 3µl
dH2O 16 µl Taq 0,5 µl
Template DNA 1 µl Total volume 30 µl
Reagent Volume 10 X Rxn Buffer 3 µl 25 mM MgCl2 1.5 µl 2.5 mM dNTP 2 µl
10 µM Primer F 3 µl 10 µM Primer R 3µl
dH2O 16 µl Taq 0,5 µl
Template DNA 1 µl Total volume 30 µl

102
Pflp
Primers : AgSP5 (sense) : 5’ – CGG GAT CCC GAT GGC TAG TGT CTC AGC TAC CA – 3’ Tm = 68ºC Ag3 (antisense) : 5’ – CGA GCT CGT TAG CCC ACG AGT TCT GCT TCT – 3’ Tm = 66 ºC Annealing T = 62° C Reaction mixture
PCR conditions 95ºC for 4 min (initial denaturation) 35 cycles of 94°C for 1 min(denaturation) 55°C for 1 min (annealing) 72°C for 2 min (extension) 72°C for 7 min (final extension) After PCR, gel electrophoresis has been carried out to estimate amplicon concentrations.
The Results of Sequence Analysis.
35S F
Binary vector pCAMBIA-1304, complete sequence, Length=12361 Score = 289 bits (146), Expect = 4e-75 Identities = 174/183 (95%), Gaps = 1/183 (0%) Strand=Plus/Plus Query 9 68 AGATGCCTCTGCCGACAGTGGTCCCAAAGATGGACCCCCACCCACGAGGAGCATCGTGGA |||||||||||||||||||||||||||||||||||||||||||||||||||||||||||| AGATGCCTCTGCCGACAGTGGTCCCAAAGATGGACCCCCACCCACGAGGAGCATCGTGGA Sbjct 12145 12204 Query 69 128 AAAAGAAGACGTTCCAACCACGTCTTCAAAGCAAGTGGATTGGATGTGANTNNCCCTGGG ||||||||||||||||||||||||||||||||||||||||| ||||||| || | AAAAGAAGACGTTCCAACCACGTCTTCAAAGCAAGTGGATT-GATGTGATATCTCCACTG Sbjct 12205 12263
Reagent Volume 10 X Rxn Buffer 3 µl 25 mM MgCl2 1.5 µl 2.5 mM dNTP 2 µl
10 µM Primer F 2 µl 10 µM Primer R 2 µl
dH2O 18 µl Taq 0,5 µl
Template DNA 1 µl Total volume 30 µl

103
Query 129 188 ACGTAAGGGATGACGCACAATCCCACTATCCTTCGCAAGACCCTTCCTCTATATAAGGAA |||||||||||||||||||||||||||||||||||||||||||||||||||||||||||| ACGTAAGGGATGACGCACAATCCCACTATCCTTCGCAAGACCCTTCCTCTATATAAGGAA Sbjct 12264 12323 Query 189 GTT 191 ||| Sbjct 12324 GTT 12326 Score = 276 bits (139), Expect = 6e-71 Identities = 181/192 (94%), Gaps = 3/192 (1%) Strand=Plus/Minus Query 1 59 TATCGTTCA-GATGCCTCTGCCGACAGTGGTCCCAAAGATGGACCCCCACCCACGAGGAG ||||||||| |||||||||||||||||||||||||||||||||||||||||||||||||| TATCGTTCAAGATGCCTCTGCCGACAGTGGTCCCAAAGATGGACCCCCACCCACGAGGAG Sbjct 10771 10712 Query 60 119 CATCGTGGAAAAAGAAGACGTTCCAACCACGTCTTCAAAGCAAGTGGATTGGATGTGANT |||||||||||||||||||||||||||||||||||||||||||||||||| ||||||| CATCGTGGAAAAAGAAGACGTTCCAACCACGTCTTCAAAGCAAGTGGATT-GATGTGATA Sbjct 10711 10653 Query 120 179 NNCCCTGGGACGTAAGGGATGACGCACAATCCCACTATCCTTCGCAAGACCCTTCCTCTA || ||||||||||||||||||||||||||||||||||||||||| |||||||||| TCTCCACTGACGTAAGGGATGACGCACAATCCCACTATCCTTCGCAAGA-CCTTCCTCTA Sbjct 10652 10594 Query 180 TATAAGGAAGTT 191 |||||||||||| Sbjct 10593 TATAAGGAAGTT 10582 Score = 204 bits (103), Expect = 2e-49 Identities = 110/111 (99%), Gaps = 1/111 (0%) Strand=Plus/Minus Query 1 59 TATCGTTCA-GATGCCTCTGCCGACAGTGGTCCCAAAGATGGACCCCCACCCACGAGGAG ||||||||| |||||||||||||||||||||||||||||||||||||||||||||||||| TATCGTTCAAGATGCCTCTGCCGACAGTGGTCCCAAAGATGGACCCCCACCCACGAGGAG Sbjct 11098 11039 Query 60 110 CATCGTGGAAAAAGAAGACGTTCCAACCACGTCTTCAAAGCAAGTGGATTG ||||||||||||||||||||||||||||||||||||||||||||||||||| CATCGTGGAAAAAGAAGACGTTCCAACCACGTCTTCAAAGCAAGTGGATTG Sbjct 11038 10988

104
35R Binary vector pCAMBIA-1304, complete sequence, Length=12361 Score = 357 bits (180), Expect = 2e-95 Identities = 180/180 (100%), Gaps = 0/180 (0%) Strand=Plus/Plus Query 34 93 TTGTGCGTCATCCCTTACGTCAGTGGAGATATCACATCAATCCACTTGCTTTGAAGACGT |||||||||||||||||||||||||||||||||||||||||||||||||||||||||||| TTGTGCGTCATCCCTTACGTCAGTGGAGATATCACATCAATCCACTTGCTTTGAAGACGT Sbjct 10624 10683 Query 94 153 GGTTGGAACGTCTTCTTTTTCCACGATGCTCCTCGTGGGTGGGGGTCCATCTTTGGGACC |||||||||||||||||||||||||||||||||||||||||||||||||||||||||||| GGTTGGAACGTCTTCTTTTTCCACGATGCTCCTCGTGGGTGGGGGTCCATCTTTGGGACC Sbjct 10684 10743 Query 154 213 ACTGTCGGCAGAGGCATCTTGAACGATAGCCTTTCCTTTATCGCAATGATGGCATTTGTA |||||||||||||||||||||||||||||||||||||||||||||||||||||||||||| ACTGTCGGCAGAGGCATCTTGAACGATAGCCTTTCCTTTATCGCAATGATGGCATTTGTA Sbjct 10744 10803 Score = 341 bits (172), Expect = 1e-90 Identities = 178/180 (98%), Gaps = 0/180 (0%) Strand=Plus/Minus Query 34 93 TTGTGCGTCATCCCTTACGTCAGTGGAGATATCACATCAATCCACTTGCTTTGAAGACGT |||||||||||||||||||||||||||||||||||||||||||||||||||||||||||| TTGTGCGTCATCCCTTACGTCAGTGGAGATATCACATCAATCCACTTGCTTTGAAGACGT Sbjct 12283 12224 Query 94 153 GGTTGGAACGTCTTCTTTTTCCACGATGCTCCTCGTGGGTGGGGGTCCATCTTTGGGACC |||||||||||||||||||||||||||||||||||||||||||||||||||||||||||| GGTTGGAACGTCTTCTTTTTCCACGATGCTCCTCGTGGGTGGGGGTCCATCTTTGGGACC Sbjct 12223 12164 Query 154 213 ACTGTCGGCAGAGGCATCTTGAACGATAGCCTTTCCTTTATCGCAATGATGGCATTTGTA |||||||||||||||||||| |||||| |||||||||||||||||||||||||||||||| ACTGTCGGCAGAGGCATCTTCAACGATGGCCTTTCCTTTATCGCAATGATGGCATTTGTA Sbjct 12163 12104 Score = 299 bits (151), Expect = 4e-78 Identities = 151/151 (100%), Gaps = 0/151 (0%) Strand=Plus/Plus

105
Query 63 122 TATCACATCAATCCACTTGCTTTGAAGACGTGGTTGGAACGTCTTCTTTTTCCACGATGC |||||||||||||||||||||||||||||||||||||||||||||||||||||||||||| TATCACATCAATCCACTTGCTTTGAAGACGTGGTTGGAACGTCTTCTTTTTCCACGATGC Sbjct 10980 11039 Query 123 182 TCCTCGTGGGTGGGGGTCCATCTTTGGGACCACTGTCGGCAGAGGCATCTTGAACGATAG |||||||||||||||||||||||||||||||||||||||||||||||||||||||||||| TCCTCGTGGGTGGGGGTCCATCTTTGGGACCACTGTCGGCAGAGGCATCTTGAACGATAG Sbjct 11040 11099 Query 183 CCTTTCCTTTATCGCAATGATGGCATTTGTA 213 ||||||||||||||||||||||||||||||| Sbjct 11100 CCTTTCCTTTATCGCAATGATGGCATTTGTA 11130
NOS F Binary vector pCAMBIA-1305.1, complete sequence, Length=11846 Score = 143 bits (72), Expect = 6e-31 Identities = 76/78 (97%), Gaps = 0/78 (0%) Strand=Plus/Plus Query 39 98 ACATGTNATNCATGACGTTATTTATGAGATGGGTTTTTATGATTAGAGTCCCGCAATTAT |||||| || |||||||||||||||||||||||||||||||||||||||||||||||||| ACATGTAATGCATGACGTTATTTATGAGATGGGTTTTTATGATTAGAGTCCCGCAATTAT Sbjct 2189 2248 Query 99 ACATTTAATACGCGATAG 116 |||||||||||||||||| Sbjct 2249 ACATTTAATACGCGATAG 2266
NOS R Binary vector pCAMBIA-1305.1, complete sequence, Length=11846 Score = 145 bits (73), Expect = 2e-31 Identities = 112/119 (94%), Gaps = 5/119 (4%) Strand=Plus/Minus Query 27 85 TGCGGGANTCTAATCATAAAA-CCCATCTCATAAATAACGTCATGGCATTACATGGTTAA ||||||| ||||||||||||| ||||||||||||||||||||||| ||||||||| |||| TGCGGGACTCTAATCATAAAAACCCATCTCATAAATAACGTCATG-CATTACATG-TTAA Sbjct 2243 2186 Query 86 144 TTATTACATGGCTTAACGTAATTCAACAGAAATTATATGATANTCATACGCAAGACCGG |||||||||| ||||||||||||||||||||||||||||||| |||| ||||||||||| TTATTACATG-CTTAACGTAATTCAACAGAAATTATATGATAATCAT-CGCAAGACCGG Sbjct 2185 2129
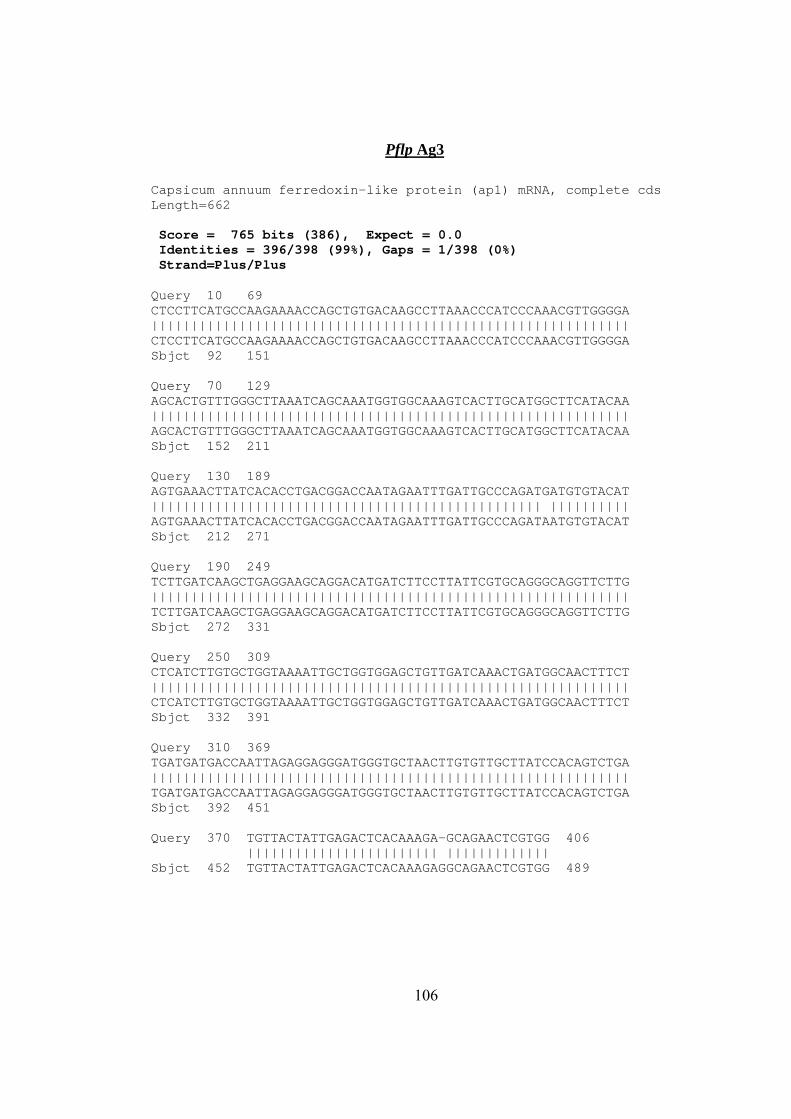
106
Pflp Ag3 Capsicum annuum ferredoxin-like protein (ap1) mRNA, complete cds Length=662 Score = 765 bits (386), Expect = 0.0 Identities = 396/398 (99%), Gaps = 1/398 (0%) Strand=Plus/Plus Query 10 69 CTCCTTCATGCCAAGAAAACCAGCTGTGACAAGCCTTAAACCCATCCCAAACGTTGGGGA |||||||||||||||||||||||||||||||||||||||||||||||||||||||||||| CTCCTTCATGCCAAGAAAACCAGCTGTGACAAGCCTTAAACCCATCCCAAACGTTGGGGA Sbjct 92 151 Query 70 129 AGCACTGTTTGGGCTTAAATCAGCAAATGGTGGCAAAGTCACTTGCATGGCTTCATACAA |||||||||||||||||||||||||||||||||||||||||||||||||||||||||||| AGCACTGTTTGGGCTTAAATCAGCAAATGGTGGCAAAGTCACTTGCATGGCTTCATACAA Sbjct 152 211 Query 130 189 AGTGAAACTTATCACACCTGACGGACCAATAGAATTTGATTGCCCAGATGATGTGTACAT ||||||||||||||||||||||||||||||||||||||||||||||||| |||||||||| AGTGAAACTTATCACACCTGACGGACCAATAGAATTTGATTGCCCAGATAATGTGTACAT Sbjct 212 271 Query 190 249 TCTTGATCAAGCTGAGGAAGCAGGACATGATCTTCCTTATTCGTGCAGGGCAGGTTCTTG |||||||||||||||||||||||||||||||||||||||||||||||||||||||||||| TCTTGATCAAGCTGAGGAAGCAGGACATGATCTTCCTTATTCGTGCAGGGCAGGTTCTTG Sbjct 272 331 Query 250 309 CTCATCTTGTGCTGGTAAAATTGCTGGTGGAGCTGTTGATCAAACTGATGGCAACTTTCT |||||||||||||||||||||||||||||||||||||||||||||||||||||||||||| CTCATCTTGTGCTGGTAAAATTGCTGGTGGAGCTGTTGATCAAACTGATGGCAACTTTCT Sbjct 332 391 Query 310 369 TGATGATGACCAATTAGAGGAGGGATGGGTGCTAACTTGTGTTGCTTATCCACAGTCTGA |||||||||||||||||||||||||||||||||||||||||||||||||||||||||||| TGATGATGACCAATTAGAGGAGGGATGGGTGCTAACTTGTGTTGCTTATCCACAGTCTGA Sbjct 392 451 Query 370 TGTTACTATTGAGACTCACAAAGA-GCAGAACTCGTGG 406 |||||||||||||||||||||||| ||||||||||||| Sbjct 452 TGTTACTATTGAGACTCACAAAGAGGCAGAACTCGTGG 489
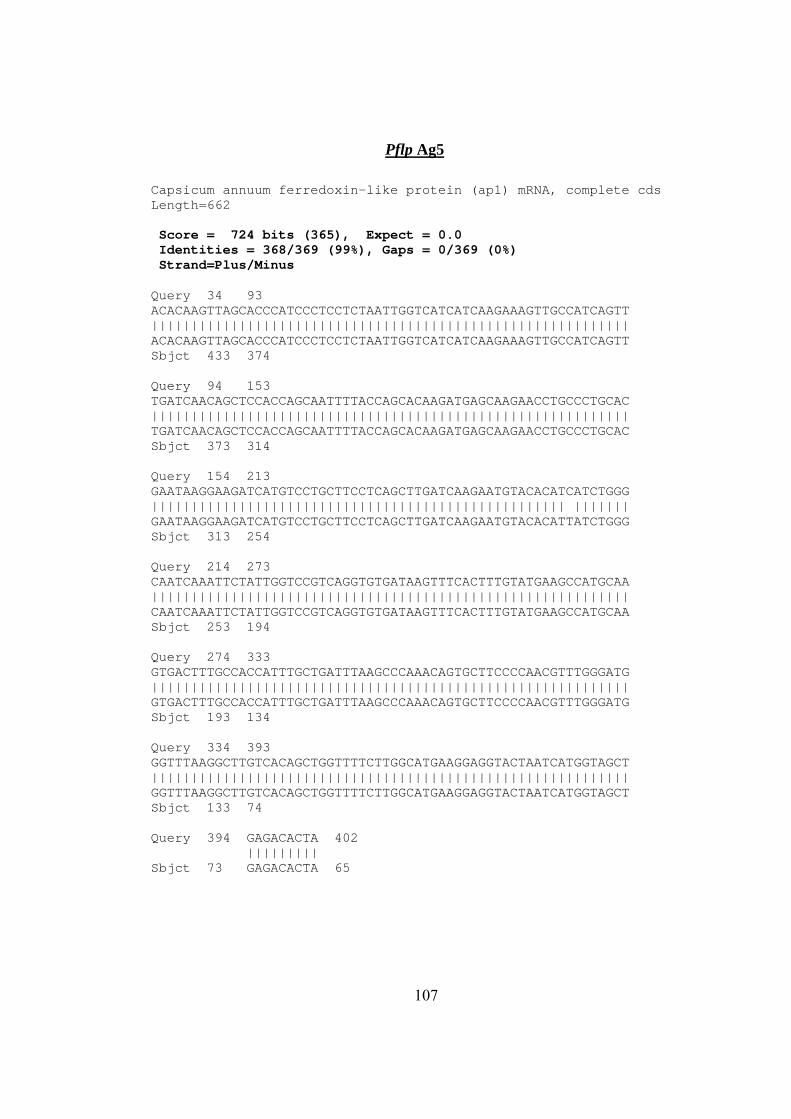
107
Pflp Ag5 Capsicum annuum ferredoxin-like protein (ap1) mRNA, complete cds Length=662 Score = 724 bits (365), Expect = 0.0 Identities = 368/369 (99%), Gaps = 0/369 (0%) Strand=Plus/Minus Query 34 93 ACACAAGTTAGCACCCATCCCTCCTCTAATTGGTCATCATCAAGAAAGTTGCCATCAGTT |||||||||||||||||||||||||||||||||||||||||||||||||||||||||||| ACACAAGTTAGCACCCATCCCTCCTCTAATTGGTCATCATCAAGAAAGTTGCCATCAGTT Sbjct 433 374 Query 94 153 TGATCAACAGCTCCACCAGCAATTTTACCAGCACAAGATGAGCAAGAACCTGCCCTGCAC |||||||||||||||||||||||||||||||||||||||||||||||||||||||||||| TGATCAACAGCTCCACCAGCAATTTTACCAGCACAAGATGAGCAAGAACCTGCCCTGCAC Sbjct 373 314 Query 154 213 GAATAAGGAAGATCATGTCCTGCTTCCTCAGCTTGATCAAGAATGTACACATCATCTGGG |||||||||||||||||||||||||||||||||||||||||||||||||||| ||||||| GAATAAGGAAGATCATGTCCTGCTTCCTCAGCTTGATCAAGAATGTACACATTATCTGGG Sbjct 313 254 Query 214 273 CAATCAAATTCTATTGGTCCGTCAGGTGTGATAAGTTTCACTTTGTATGAAGCCATGCAA |||||||||||||||||||||||||||||||||||||||||||||||||||||||||||| CAATCAAATTCTATTGGTCCGTCAGGTGTGATAAGTTTCACTTTGTATGAAGCCATGCAA Sbjct 253 194 Query 274 333 GTGACTTTGCCACCATTTGCTGATTTAAGCCCAAACAGTGCTTCCCCAACGTTTGGGATG |||||||||||||||||||||||||||||||||||||||||||||||||||||||||||| GTGACTTTGCCACCATTTGCTGATTTAAGCCCAAACAGTGCTTCCCCAACGTTTGGGATG Sbjct 193 134 Query 334 393 GGTTTAAGGCTTGTCACAGCTGGTTTTCTTGGCATGAAGGAGGTACTAATCATGGTAGCT |||||||||||||||||||||||||||||||||||||||||||||||||||||||||||| GGTTTAAGGCTTGTCACAGCTGGTTTTCTTGGCATGAAGGAGGTACTAATCATGGTAGCT Sbjct 133 74 Query 394 GAGACACTA 402 ||||||||| Sbjct 73 GAGACACTA 65
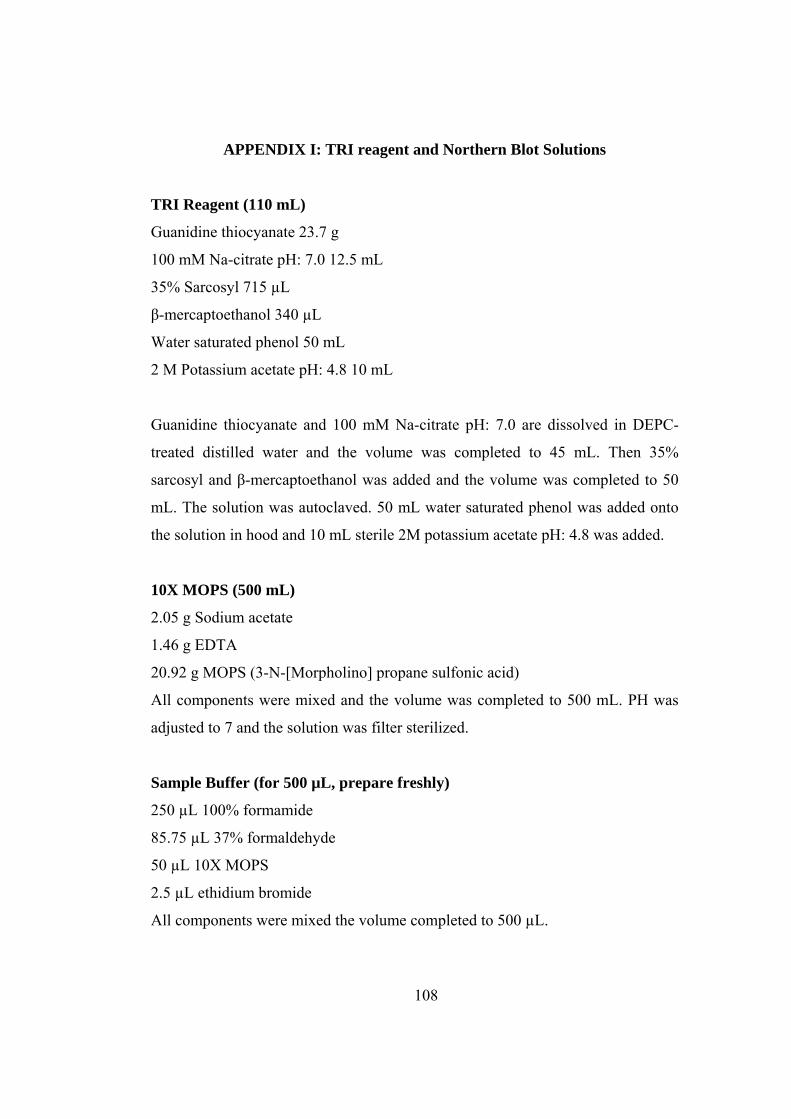
108
APPENDIX I: TRI reagent and Northern Blot Solutions
TRI Reagent (110 mL)
Guanidine thiocyanate 23.7 g
100 mM Na-citrate pH: 7.0 12.5 mL
35% Sarcosyl 715 µL
β-mercaptoethanol 340 µL
Water saturated phenol 50 mL
2 M Potassium acetate pH: 4.8 10 mL
Guanidine thiocyanate and 100 mM Na-citrate pH: 7.0 are dissolved in DEPC-
treated distilled water and the volume was completed to 45 mL. Then 35%
sarcosyl and β-mercaptoethanol was added and the volume was completed to 50
mL. The solution was autoclaved. 50 mL water saturated phenol was added onto
the solution in hood and 10 mL sterile 2M potassium acetate pH: 4.8 was added.
10X MOPS (500 mL)
2.05 g Sodium acetate
1.46 g EDTA
20.92 g MOPS (3-N-[Morpholino] propane sulfonic acid)
All components were mixed and the volume was completed to 500 mL. PH was
adjusted to 7 and the solution was filter sterilized.
Sample Buffer (for 500 µL, prepare freshly)
250 µL 100% formamide
85.75 µL 37% formaldehyde
50 µL 10X MOPS
2.5 µL ethidium bromide
All components were mixed the volume completed to 500 µL.
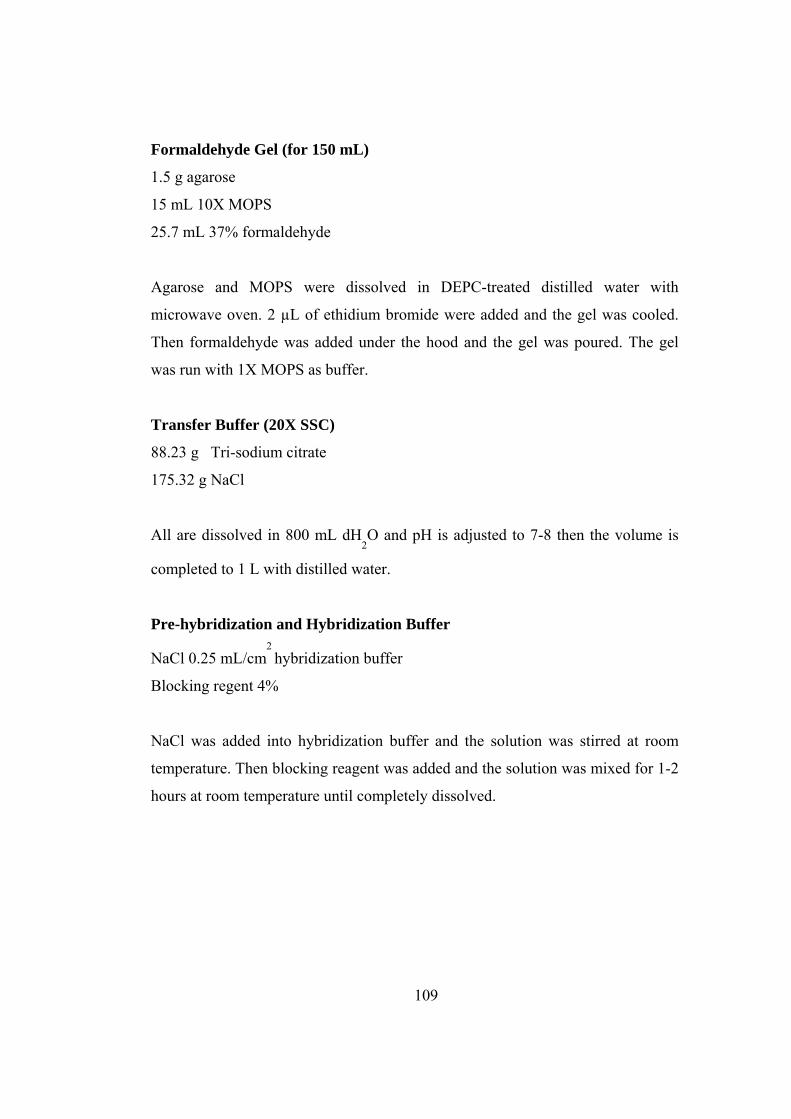
109
Formaldehyde Gel (for 150 mL)
1.5 g agarose
15 mL 10X MOPS
25.7 mL 37% formaldehyde
Agarose and MOPS were dissolved in DEPC-treated distilled water with
microwave oven. 2 µL of ethidium bromide were added and the gel was cooled.
Then formaldehyde was added under the hood and the gel was poured. The gel
was run with 1X MOPS as buffer.
Transfer Buffer (20X SSC)
88.23 g Tri-sodium citrate
175.32 g NaCl
All are dissolved in 800 mL dH2O and pH is adjusted to 7-8 then the volume is
completed to 1 L with distilled water.
Pre-hybridization and Hybridization Buffer
NaCl 0.25 mL/cm2 hybridization buffer
Blocking regent 4%
NaCl was added into hybridization buffer and the solution was stirred at room
temperature. Then blocking reagent was added and the solution was mixed for 1-2
hours at room temperature until completely dissolved.
110
Primary Wash Buffer (1L)
Final concentration
Urea 120 g 2 M
SDS 1 g 0.1%
0.5 M sodium phosphate (pH: 7.0) 100 mL 50 mM
Sodium chloride 8.7 g 150 mM
1 M magnesium chloride 1 mL 1 mM
Blocking reagent 2 g 0.2%
All the components were added and the volume was completed to 1 L with
distilled water. Primary wash buffer can be kept at 2-8 0C up to one week.
Secondary Wash Buffer (for 500 mL)
Tris-base 60.5 g
Sodium chloride 56 g
All components were dissolved in water and the volume is completed to 500 mL.
Secondary Wash Buffer Working Solution
Secondary wash buffer was diluted 1:20 and 2 mL/L of 1M magnesium chloride
was added (2 mM magnesium in solution).
Secondary wash buffer can not be stored, it should be used immediately


![Molecular Analysis of a Bifunctional Fatty Acid Conjugase ... FADX...rescence staining patterns in tobacco (Nicotiana taba-cum cv Bright-Yellow 2 [BY-2]) suspension-cultured cells](https://static.fdocuments.in/doc/165x107/6031740e5d062f421d0ff6e0/molecular-analysis-of-a-bifunctional-fatty-acid-conjugase-fadx-rescence-staining.jpg)


