TRANSFERENCE NUMBERS OF WEAK 17LECTROLYTE …€¦ · approximately true for weak electrolytes but...
186
TRANSFERENCE NUMBERS OF WEAK 1 7 LECTROLYTE SOLUTIONS A Thesis submitted for the degree of Doctor of Philosophy of the University of London by MOHAMMED SHAMIM DepartMent of Chemistry Imperial College London, S.W.7. September l 1967.
Transcript of TRANSFERENCE NUMBERS OF WEAK 17LECTROLYTE …€¦ · approximately true for weak electrolytes but...

TRANSFERENCE NUMBERS OF WEAK 17LECTROLYTE SOLUTIONS
A Thesis submitted for the degree of
Doctor of Philosophy
of the
University of London
by
MOHAMMED SHAMIM
DepartMent of Chemistry
Imperial College
London, S.W.7.
Septemberl 1967.

Abstract
The anion constituent transference
numbers in aqueous 0.005-0.02 M picric acid and 0.02-
0.10 M tartaric acid solutions at 25°C were determined
by the moving boundary method. Various types of closed
electrode were investigated for their suitability. The
transference numbers were found to deviate from the
Debye-Hiickel-Onsager theory and this was explained by
postulating triple ion formation in these solutions
in the concentration range studied. Recently published
conductance data on picric acid and literature
transference data on iodic, nitric and perchloric
acids were also analysed for the presence of complex
ions.
ii

iii
Acknowledgements
The author is greatly indebted to
Dr. Michael Spiro not only for his unfailing help
throughout the present research but also for his
genuine interest in the author's welfare.
The writer is grateful to the Govern-
ment of Pakistan for awarding a Merit Scholarship and
to Professor R.M. Barrer, FORDS., for providing facil-
ities for the research in his department.
Thanks are also due to Mr. Peter
Werner Griffin whose instant help in electronics
saved me many days of frustration and to Mr. Barry
Utting for his assistance in computer programming.
The author is also grateful to Mr.
N.A. Javed for moulding tablets of silver succinate
and lead dioxide.

iv
List of Symbols
a Distance of closest approach in an electrolyte in Angs trom units
A One Angstrom unit 10-ucm.
B Parameter of conductance ecmation, molar con-tribution to the viscosity due to the ions.
c Molar concentration
C Equivalent concentration
LZ Equivalent concentration of L in the solution LZ
D Dielectric constant of the solvent, density of solution
Dvv Density of water
E Electric field strength
f. Molar activity coefficient of species i
Mean ionic activity coefficient.
Following ion constituent, onelfaraday i.e. 96,49.1 coulombs gram-equiv.
I Current in amperes.
K. Equilibrium constant.
Ks Solubility product
Kt Stability constant of triple ions.
KHA Dissociation constant of the acid HA.
Stability constant of the triple ion PHA-. KAHA-
Specific conductance
L Leading ion constituent
in Molar concentration

NR,i EUmber of • gram. equivalents of in one gram-ion of species i
Molal concentration
Abbreviation for molar, molecular weight
ion constituent R
R
T
TR
TRo
Ion-constituent R
Time in seconds
Absolute temperaybure, transference number
Transference number of ion constituent R
Limiting transference number of ion constituent R
U Mobility of ion constituent LZ UL Mobility of ion constituent L in solution LZ
V Volume in litres swept out by the boundary per faraday of electricity
Volume of species x
Partial molal volume
Charge number of species i
Positive numerical vaJ.ue of z.
Charge number of ion constituent R
Degree of dissociation of an acid
Parameter of D.H.0 equation, degree of formation of the triple ions
Parameter of D.H.0 equation
Equivalent and,limiting eQuivalent conductance of ion i in cm`'.ohM-'
A,A o Equivalent and limiting equivalent conductance of the whole solution
Viscosity of the solution, viscosity of water
Refractive index
V
zi
Izii
a
p

vi
CONTENTS
PaEe Title 0 0 0 0 0 0 • 0 0 0 0 • • • i
Abstract .. .0 . 0 0 0 • 0 0 0 0 0 ii
Acknowledgements .. a a o 0 o a o o a o iii
List of Symbols • • .. . • 0 0 0 0 0 • iv
Contents . 0 0 • • • 0 0 0 0 0 0 0 0 V1
CHAPTER I
INTRODUCTIO
Section
1.1 Debye-Hiickel-Onsager Equation ............
Conductivity equations for higher concen- trations 0 0 0 0 0 0 0 0 0 0 c..0 0 0 0 0 C C 0 0 0 C 0 c c.
Page
1
4 Viscosity correction ... C 0 0 C 0 C 0 0 0 0 0 5 Equations for incom-i:aetely dissociated
... , 0
1.2 Variation Of Transference 'Numbers With Concentration • 0 0 0 0 • 0 • 0 0 0 0 0 a 0 0 0 0 0 C 0 0 0 C 0 C 0 0 8
1.3 Multiple Ion Association ......... ... 10
Treatment of transference results .. . . 0 0 . 0 11
Treatment of conductance results c... .0 c. 14
1 LeferenCOS00000000"000•00000000000 9 C. 0000 17
CHAPTER II
THEORTICAL
2.1 Definition of Transference Numbers ..., . 19
2.2 Method For The Determination Of Trans- ference Numbers . 0 0 0 0 0 0 0 c 0 0 C. 0 0 0 0 0 c 0 0 C c C 21
Hittorf's method .•...... 0 0 0 0 0 0 0 0 0 0 v 0 0 0 Cc • 0 21
E.m.f. method 00000000000000000000000 0
Moving boundary method . ..... 0.. 0 ... 0 ... Theory of the moving boundary method ..... Moving boundary equations ........... Conditions for boundary stability ... Equations for boundary stability ......... Stability conditions in terms of ionisation constant 0000000000000000000000
2.3 Electrodes 000000000000
2.4 Volume Correction .. egy00000•oocv0000000006
2.5 Solvent Correction .... .000000000000000004
References .......... o 0 0 0. G u... 00000000000
CHAPTER III
EXPERIMENTAL
'.1 The Cell 000000000000000000000000000000000 48 Extensions of the cathode section . ....... 43
3.2 The Thermostat And Thermoregulator 0000000 54 3.3 Constant Current Regulator ...—.......... 56 3.4 Optical Assembly ... — ........ ..... ....... 60 3.6 Electrodes 0 0 0000 00000000000000000e0000000 63
Lead dioxide ....... . 0 0000000000000000000• 65 Silver-Palladium tube ........•.........•. 67 Cleaning of the tube . ................... 70 Volume change studies •............ ....... 70 Transference runs with Silver-Palladium cathode ........ 00000•0400000000000000000 77 Lead succinate . 00000000000000000000000000 79 Silver succinate .......... . . 00000 00000000 80 Calculation of solubility in succinic acid 80 Solubility in succinic and acetic acids bye.m.f. measurements ..... ............... 83
vii
22
23 25 26 27 31
32
34 34 41 46
viii
Concentration determination within the moving boundary cell ........ .......... • • .
Cold pressed silver succinate ............
3.7 Preparation of Solutions . • 0000.4.0•Qo "oc * Picric acid .............. . CO 00000 00 ......
Tartaric acid ............ 00000000•0 • 0 0 C 0
Acetic and succinic acids . 000000000 0 0 0 0 0
3.8 Cell Filling ............................. A run . . . C .. ................ 00000000000000
3.9 Cell .qashing 0000..... ......... 0000000000
References .. 0000000000000000Goc 0000000000
CHAPTER IV
TRANSFERENCE RESULTS IN PICRIC
ACIDS SOLUTIOLL__
4.1 Intro duc t i On 000000000000000000 0 0 0 00000 000 100
4.2 Preliminary Experiments .... . ' .... .. . 000 000 105
Selection of following solutions . • . 000 000 105
Factors influencing the transference results . 0 0 0 • 0 0 0 0 0 0 0 0 •0000000000000000000 . 106
1
4.3 Moving Boundary Results 1
...•....... 0 . .. . ... 1
Results in 0.02M solutions . „. 114 0•0000 cO0oG
Results in 0.01M and 0.005M solutions . 0. . 114
4.4 Discussion 0000000000000000000000000000 0 o 118
4.5 Treatment of Conductance Data Allowing For Triple Ions ..... . .000 0 0 0 0 0 0 0 0 0 0 0 0 0 o 0 127
Viscosity correction. .. . 00000.0000 000 128 ... .
Triple ion correction.. 000•000•000 000 128 0000
References 0 0 0 0 0 0 0 0 0 0 0 0 0 000000000 000000 000 134
86
88
89
90
91 91 91
94
97
98

ix
CHAPTER V
TRANSFERENCE RESULTS TARTARIC ACID SOLUTIONS
5.1
5.2
5.3
Introduction 00000000000 0000 00 000000000"o
Moving Boundary Results 000000 00 0•00 000•••
In 0.02M solutions ...........•..,.. .... . In 0.05M and 0.10M solutions . .. • 00•0000•0
Discussion ..... .... ..... .. W0.00000000 00
Secondary dissociation and experimental transference values ....... •00000a000000 00
136
137
137
137 140
140 Stability constant of triple ions THT.... 147 References 0000000000000000000000000000000 154
CHAPTER VI
ST'ABILITY CONSTAL TS OF TRIPLE IONS PERCHLORIC AND
NITRIC. ACIDS FROM TRANSFERENCE NUMBERS
6.1 Iodic Acid ....... 000 ,000000‘0000000000 0000 155
6.2 Perchloric Acid .....•................ .... 160 6.3 Nitric Acid . • 000000000000000000000•000000 165 6.4 Summary .... 000000 00000•0000000000•0000000 169
References . 0000000000,000000000600000•000 172
Appendix 1 ... ... 0000000000000D t 000000 0000 17
Appendix 2 ... 00000000 00000000oos• 0000 175 Appendix 3 ........................... .... 177

CHAPT2R I
INTRODUCTIO N
According to the Arrhenius theory of
electrolytic dissociation, the decrease of equivalent con-
ductance with increasing concentration was attributed to
the diminution in the extent to which the solute was diss-
ociated into ions in solution. The theory thus assumed that
the speedsof the ions themselves do not vary appreciably
with concentration. This assumption has been shown to be
approximately true for weak electrolytes but not for strong
ones; in particular, the variation of transference numbers
with concentration demonstratesa concentration dependence
of ionic speed. This dependence is discussed in more detail
below.
1.1 DEBYE-HUCKEL-ONSAGER EQUATION (1,2,3)
The modern view, based on the results
obtained by different methods,is that strong electrolytes are
completely ionised at all reasonable concentrations. The - -
,degree ionisation is thus unity at all concentrations.
The falling off of the equivalent conductance, therefore,
must be due to a decrease in the ionic velocity with
increasing concentration. This is the fact which the inter-
ionic attraction theory explained. The simple picture Of
the theory is that with increasing concentration, the ions
come closer together and the attraction between ions of

2
opposite charge results in a decrease of their speed and
hence in the equivalent conductance of the solution.
The quantitative treatment of the
interionic theory is due mainly to Debyc, ifLickel and
Onsager ( 2 9 3) . The fundamental argument is that due to the
electrical attraction, every ion, on the average, has
more ions of oppOsite sign in its vicinity than ions of its
own hind. Each ion may, therefore, be pictured as being
surrounded by a centrally symmetrical ionic atmosphere
with a charge opposite in sign to that of ion itself.
a current is passed through the solution the ions are
caused to move in one direction and the oppositely charged
ionic atmosphere in the other. This disturbs the symmetry
of the ionic atmosphere which consequently attracts the ion
back and thus slows down its speed. The ion remains under
this dragging effect for that length of time which the
atmosphere takes to readjust itself. The effect is termed
the asymmetry or the time of relaxation effect.
Another effect which causes a retardation
of the ionic motion is the electithore tic effect. The
applied e.m.f. moves the ionic atmosphere, with its
associated molecules of solvents, in a direction opposite
to that in which the central ion is moving. This retarding
influence, in effect, forces the ion to 'swim upstream'.
When the magnitudes of these effects are

3
expressed in terms of the properties of the ions and the
solvent, the following equation(4) results for the
equivalent conductanee of en ion
N o zi
o / 2. x 01 106 z+ _q_ z xi . . X. . 41.25 )
' .1. --
(DT) 3/2 =4. (1+(r) 1(DTY
(1-1-1)
where
q = Z + X
o (1-1-2)
( z + z )( Z + + Z+ - X ° )
and
I = + z_ ) E (1-1-3)
Here Xi is the equivalent conductance of the ion concerned,
X • its value at zero concentration, z . its charge number;
D is the dielectric constant and PI the viscosity of the
solvent, T is the absolute temperature, z+ and z are the
charge numbers of the cation and anion and Xo and Xo their
limiting equivalent conductance.
Par a univlent ion, equation (1-1-1)
takes the form
? 1_
xi . = x — ( QO + 4P (c)27 (1-1-4) 1 ,F )
where (4 and p are parameters.
Addition of two such terms, for cation and anion respecti-
4
vely, gives the equivalent conductance of a completely
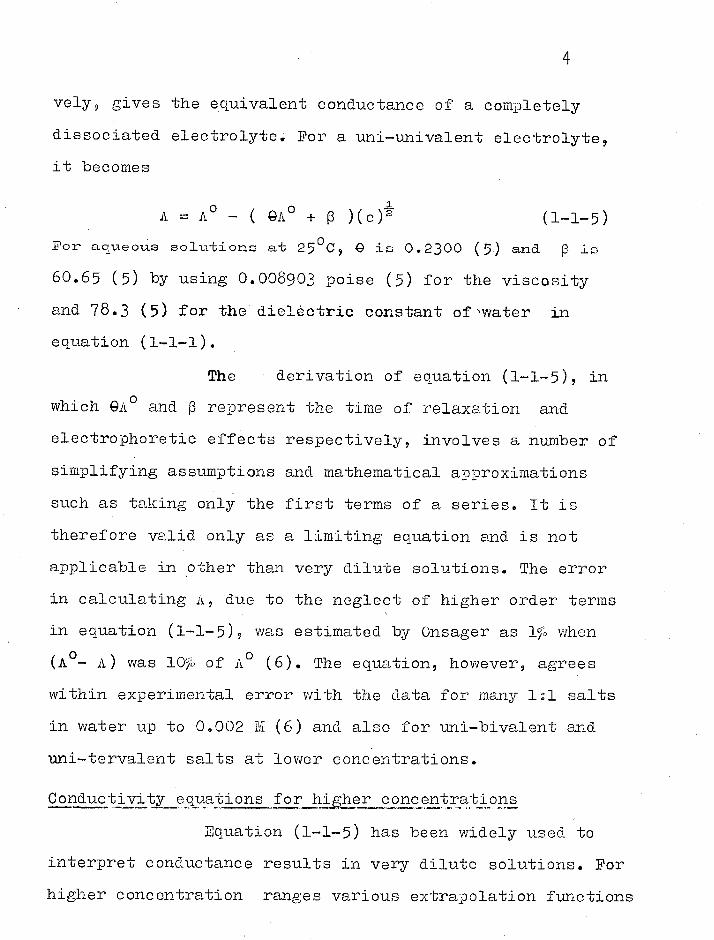
dissociated electrolyte. For a uni-univalent electrolyte,
it becomes
A AO ( GAO p )(c)2 (1-1-5)
For aqueous solutions at 25°0, 0 is 0.2300 (5) and (3 is
60.65 (5) by using 0.008903 poise (5) for the viscosity
and 78.3 (5) for the dielectric constant of,water in
equation (1-1-1).
The - derivation of equation (1-1-5), in
which GA° and 1 represeht the time of relaxation and
electrophoretic effects respectively, involves a number of
simplifying assumptions and mathematical approximations
such as taking only the first terms of a series. It is
therefore valid only as a limiting equation and is not
applicable in other than very dilute solutions. The error
in calculating A, due to the neglect of higher order terms
in equation (1-1-5), was estimated by Onsager as lye when
(A°- A) was 100 of A° (6). The equation, however, agrees
within experimental error with the data for many 1:1 salts
in water up to 0.002 M (6) and also for uni-bivalent and
uni-tervalent salts at lower concentrations.
Conductivity equations for higher concentrations
Equation (1-1-5) has been widely used to
interpret conductance results in very dilute solutions. For
higher concentration ranges various extrapolation functions

have been proposed, for example the empirical extension of
Shedlovsky(7).
Robinson and StokeS(7) have proposed an
equation of the form
= A-
(1-1-6)
1 + Ba(c)2
This equation neglects the cross-product of the relaxation
and electrophoretic terms but takes into account the finite
distance of closest approach, a . Rearranged in the form
A = A + ( GA + 2) (C)2 (1-1-7)
1 ( Ba-49_)(c)1.
the equation gives a very good account of conductances up
to 0.1 M for aqueous solutions of strong 1:1 electrolytes
and yields reasonable values of the parameter a. It is not
so good, however, for non-aqueous solvents (8). a.
There isAnumber of other equations described
in the literature. Fernandez-Ptrini and Prue(9) have
recently reviewed the Fuoss-Onsager and Pitts equations
which contain additional terms beyond the first in the
series expansion.
Viscosity correction
Theory also requires a correction for the
change of viscosity (10) of the medium with concentration.
According to the '4alden rule, the conductivity of the

6
solutions is inver4y proportional to the viscosity of the
medium and therefore to correct for this effect, conductance
values shOuld be multiplied by an appropriate viscosity
factor.
The general equation for the viscosity of an
electrolyte solution(11) is
9 = 1 + Ac' + Dc (1-1-8)
The parameters A and B can be determined by plotting
- 1)/c2 against c2. The interionic forces represented
by the term Act in (1-1-8) are already taken care of in the
D.H.O. conductance equation, and the experimental equivalent
conductances, therefore, need to be multiplied only by the
factor (- 1+Bc ) (see ref.10)
Equations of incompletely dissociated electrolytes
In solutions in which a fraction a of the
electrolyte is present as ions, the conductance equation
corresponding to (1-1-5) is (12)
A/a = A0- (44A°4- P )
(1-1-9)
where ac represents the mean ionic concentration. This
equation gives the degree of dissociation a, by successive
approximations, when written as
a = A (1-1-10)
A 0 1-( 9/10+p )(a02/A-)

1 a = A/A° ( GA° p )A (ac)2
(A0)2 (1-1-13)
7
which in the limit 0-4 0 becomes
a = A/A° (1-1-11)
as defined by Arrhenius.
Shedlovsky has used (13) the equation
/ 0 ( 0 k/ (1-1-12) A aA
o A/A + p ) ac)-
i.e.
The cubic equation (1-1-10)and the quadratic (1-1-13)
have been used by Fuoss and Kraus and by Shedlovsky resp-
ectively, in conjunction with the equilibrium law
c a2 2 (1-1-14)
1 - a
to obtain simultaneously the dissociation constant K and
Ao by a graphical method (12)
In the present work, the Robinson and Stokes
equation applied to weak electrolytes
A/a = A° - ( GA° + p ) (ac)1 (1-1-15)
1 + Ba(ac
was used to re-examine E. values and to explain literature
conductance results for aqueous picric acid solutions. This
equation was employed in preference to (1-1-9) and (1-1-12)
because it is an extended version of these incorporating,

as an additional parameter, the distance a. Equation (1-1-15)
was chosen in preference to the more elaborate Pitts'and
Fuoss-Onsager treatment because the accuracy of the
experimental results did not really warrant their use. It
might be added that since hydrogen ions move through aqueous
solutions by a mechanism different from that of other(normal)
ions, the applicability of any of these equations to acids
is open to question (14) and is justified partly by the
fact that the equations have been shown to fit the data
both for strong acids(HC1) and for weak ones(CH3COOH). The
Fuoss equation, however, does not describe the behaviour
of aqueous acid solutions quite as wellt4
It should also be noted that the theoreti-
cal work of Fuoss has so far been applied only to the
variation with concentration of conductances and not of
transference numbers. In the present work both types of
data are employed, and it was important, therefore, to use a.,
theoretical scheme which could be applied to both.
1.2 VARIATION OF TRAN5FERENCE NULBERS WITH CONCENTRATION
Experimental observations have shown that
transference numbers of both strong and weak electrolytes
vary with Concentration: This fact clearly shOwed that the
mobility of ions change with concentration. Transference
numbers, therefore, in principle should provide a very
sensitive test of the interionic theory.

9
The relationship between the 'transference
number of any ion constituent and the concentration can be
obtained by using (1-1-. 4), For a strong binary electrolyte
0 0 x - (ox + *p )(c)-, T
X+ + X Xo + ( n(,0 x°) +
(1-2-1)
where T+ is the transference number of the cation ion
constituent. In this equation the viscosity correction
applies to both numerator and denominator, and so cancels
out. On differentiating (1-2-1)
X
dT
dc2
( - 0.5 )13 A°
(1-2-2)
where
Xe
To
Xo + Xo
Thus when To is close to 0.5, T+ will not vary with
concentration, but it will do so the more it differs from
0.5. Most literature results bear this out (15).
Various empirical equations due to
Shedlovsky, Owen, Gorin and Jones and Dole have been
described by Harned and Owen (16). Robinson and Stokes
have derived the equation (17)

T+
Ao - P(C)2/(1 + Bac2)
X. outc r'/(1 + Bac') + -r
10
(1-2-3)
for 1:1 electrolytes, and this gives a good quantitative
account of the observed transference numbers, with 'a'
values in fair agreement with those derived from the cond-
uctance data of the same electrolyte.
1.3 LULTIPLE ASSOCIATIOK
In a number, of cases the transference
numbers have shown a concentration dependence different to
theory, and this has boon attributed to the presence of
other species. Thus the tranference number measurements
of Selvaratnam and Spiro (18) on phosphoric acid and the
e.m.f. work of Pethybridge and Prue (19) on iodic acid
have shown the formation of triple ions. In these cases
it seems likely that the stability of the triple ions is
caused by hydrogen bonding. The pr6sent research on the
measurement of anion transference numbers in picric and
tartaric acid solutions has shown the same sort of con-
centration dependence as was observed in phosphoric acid
solutions. The literature transference numbers of nitric
(20) and perchloric acia1,22)solutions, too, show a
similar deviation with increasing concentration. It is,
therefore, 'possible that triple ions occur in all these
solutions.

11
Accordingly, the transference results of
the present work and some literature conductance data were
analysed for the presence of triple ions by the method of
Selvaratnam and Spiro(18) described below.
A. Treatment of transference results
Let the monoprotic acid be written HA and
the only triple ion AHA. The ecuilibrium in solution .can
be expressed by - the equations
HA = H + A (1-3-1)
A+ HA = AHA (1-3-2)
If a is the degree of dissociation of the acid HA and 3
the degree of formation of the triple ion AHA-, the molar
concentrations of various spebies present_in an .m molar
solution are given by
(HA) = m(1-a-13) (e) = ma
(A) = m(a-p) y (AHA-) = mp
Hence
KHA - (e) (A-) M(a-P)af
(HA) (1-.0c-p) (1-3-3)
a -= -KHA(11-P/a)“ K2(1 ÷p / fa)2
4.KHAmf(1-13ic6 )1
2mf(1-(3/a)
(1-3-4) (AHA)
KAHA = (A-) (11A) ma(1-p/a)( 1/a-(1+p/a) )
(1-3-5)

12
The transference number, TA, of the anion
constituent A (see equation 2-1-2) is given by (23)
m X + 2m - A A AHA AHA, TA
m X +m X + m X H+ H+ A- A AHA AHA-
(a-P)x - A
+ 2f1X AHA-
aX+ (a-p)X px H+ A .A.H.A.
X + ((3/a) (2X X ) A AHA A
= X X - f3/a( X - ? _)
H+ A A AHA
X A
( 1 +(P/a)/ ) X + X H+ A-
where 2X L - X AHA A
A
X - X A AHA
—) X + X 114- A
A
f3/a=
X A
( X + H+ A

13
The equivalent conductances, at appropriate
concentrations, of the various species in equation (1-3-6)
can be worked out by the Robinson and Stokes equation
(1-1-15)a,,pplied to any univalent ion i :
x. (Qx? J ff.13) (us)2 (1-3-7) 1 1 1
1 + Ba(ac)2
and the activity coefficient involved in equation (1-3-3)
can be calculated using the Debye-Huckel equation
log10 f -1.0196 (ac)2 (1-3-8)
1 + Ba(ac)2
for aqueous solutions at 25oC.
The criterion of the success of the
treatment, as mentioned by Sclvaratnam and Spiro (18), is
that the values of KAHA- resulting from equation (1-3-5),
should be independent of concentration when p/a values
obtained from equation (1-3-6) and the experimental tran-
sference numbers, are used. This requires an accurate
value of p/a which in turn depends on the value of a
needed to obtain correct ionic strength ac. The method of
calculation is outlined below:
(a) Select reasonable values of %A- and XAHA- and
calculate XA-9 XAHA-9 Xe and f* at concentration m using
equations (1-3-79 8), and
(b) assume a=1 as a first approximation and

14
(c) insert the values of XA-' XAHA- and XH+ from step(a)
along with TA in equation (1-3-6) and get p/a.
(d) Use p/a from step (c) in equation (1-3-4)and get the
second approximation for a.
(e) Using a from step (d), repeat steps (a),(b),(c) and
(d) till two successive a values from (1-3-4) are the same.
(f) Substitute p/a corresponding to the final a value in
equation (1-3-5) and so obtain KAHA
In the present work, the above calculations
for picric, tartaric, iodic, nitric and perchloric acids
were carried out on the University of London Atlas computer
with EXCHLF language. The program is given in appendix 1.
B. Treatment of conductance results
Fuoss and Kraus (24) have published
equations for treating the presence of equal numbers of
triple ions such as AHA- and HAH+ in solvents of low
dielectric constant. For the present work conductance
values were treated by the method (18) described below.
As in the previous section, we can assume
that the concentrations of various species in an m molar
solution of the monoprotic acid HA are given by
(le) = ma (A-) = m(a-P)
(AHA) = nip ; (HA) = M(1-a-p)
Using the specific conductivity of the solution k, we have
Am = 1000k = m(aXH+ + (a-p)XR- PXAHA-)

15
=ma( X + X ) -Mf3 ( X - X ) H- A A- AHA
(X, ) = A/a + Mx(x _ - x (1-3-9) H+ A A ARA-
A0 = X0 + h°_ H = (x + + x )+(GA
o+p)(ac)2 HA H+ A
. 1+Ba(ac)
Substituting
get
+ H"
(1-3-10)
+ X ) from (1-3-9) into (1-3-10), we A-
A0 = A/a + p/a(% - X )+(911°+ 13)(ac)2 HA A- AHA- 1+Ba(ac)z
(1-3-11)
If the presence of triple ions had not been allowed for,
a figure AHA would have been calculated using the incorrect
equation
0' AHA A/a' + (GA° + p) (at) (1-3-12)
1 + Ba(ab)2
in which a' represents the degree of dissociation of the
acid in the absence of triple ions.
To get the correct AHA value from (1-3-11),
a and p were calculated by successive approximations
from equations (1-3-4) and (1-3-5) assuming values for
KHA and KAHA-' and X values from the Robinson and Stokes
equation assuming a value for ? HA-. Calculations were
carried out on the Atlas computer and the program is
0 •
Now

16
given in appendix 2.
If the transference numbers are at hand,
KAHA - and XLA- can be obtained from them by the method
described earlier.

17
REFERENCES
Chapter
(1) H.S.Harned and B.B.Owen,The Physical Chemistry of Electrolyte Solutions,p.58-66,Reinhold,hew York,1958
(2) R.A.Robinson and R.H.Stokes,Electrolyte Solutions, 2nd Edn.,p.74-86,Butterworths,London,1959•
(3) D.A.MacInnes,The Principles of Electrochemistry,p.322, Dover Publications,Inc.New York,1961.
(4) C.W.Davies,Ion Association,p.9,Butterworths,London, 1962.
(5) Ref.(2),appendices 1.1 and 7.1
(6) Ref.(4),p.11
(7) Ref.(2),p.144
(8) J.E.Prue and P.J.Sherrington,Trans.Faraday Soc., 57,1795(1961).
(9) R.Fernandez-Perini and J.E.Prue,J.Phys.Chem., 288,373(1965).
(10) M.Spiro,Trans. Faraday Soc.-9 55,1746(1959).
(ILL) Ref.(1),p.235
(12) Ref.(1),p.267
(13) T.Shedlov-ky,J.Franklin Inst.,225,739(1938).
(14) Ref:(10)
(15) Ref.(3),p.332
(16) Ref,(1),p.226
(17) Ref.(2),p.156
(18) M.Selvaratnam and M.Spiro,Trans.Faraday Soc., 61,360(1965).
(19) A.D.Pethybridge and J.E.Prue,Trans.Faraday Soc., 63,2019(1967).

18
(20) K.Banerji,R.D.Sirivastava and R.Gopal,J.Indian Chem.Soc.,40,651(1963).
(21) A.K.CoVington and J.E.Prue,J.Chem.Soc.,1567(1957).,
(22.) K.Banerji and R.D.Sirivastava,Z.physik.Chem., (Frankfurt)38,234(1963).
(23) M.Spiro, J.Chem.Edn.133,464(1956),
(24) Ref.(1),p.297

19 CHAPTER II
THEORETICAL
2.1 DEFINITION OF TRANSFERENCE NUNBER
The literature contains two definitions
of transference or transport number. The one commonly
found in textbooks states:
"The transference or transport number T of
species i in a given electrolyte solution is
the fraction of the total current carried in
the solution by that species".
This definition, referred to as electrical
transport number (1), limits its applicability as it
requires full information about the composition of the
solution. Such information is not always available, and
so one cannot obtain the electrical transference number by
any experimental method except in solutions in which com-
plete dissociation occurs. To make the transference number
obtainable directly from the experiment, 3piro (1) defined
what is called the ion constituent transference number or
simply transference number. His definition runs:
"The transference number TR of a cation or anion
constituent R is the net /limber of (electrochemical)
gram equivalents of that ion constituent that
crosses an imaginary plane in the solution (the
plane being fixed with respect to the solvent)

X . m. 1 1 , -- ( T ) LI FRI x (2-1-2)
20
in the direction of the cathode or anode
respectively, when one faraday of electricity
(96493.1 coulombs) passes across that plane".
The term ion constituent (2) means the
ion-forming portion of the electrolyte without reference
to the extent to which it may actually exist in the
dissociated state. For example, in aqueous succinic acid
solution the hydrogen ion constituent is present as free
H+ ions, HSucc ions and H2Succ molecules. Thus in a
chemical analysis for Hittorf's method one determines
the change in concentration of the ion constituent and not
that of ion. Similarly in moving boundary experiments, one
measures the rate of motion of the boundary due to the
ion constituent and not that due to the ion. In any case,
the ion constituent chosen should not decompose into further
smaller species under the experimental conditions.
From the above definition of transference
number, it follows that
7- R TR = 1 (2-1-1)
The detailed analysis of the flux of ions constituent
carried by various ionic species across a plane in the
solution gives the following (1)equation

21
where zi and zR are the algebraic charge numbers of the
species i and the ion-constituent R respectively. Izil
represents the positive numerical value of zi and NR i
stands for the number of gram-equivalents of R in
one gram-ion of species i. xi is the equivalent conduc-
tance of species i, and mi is the molarity of species i.
2.2 METHODS FOR THE DETERMINATION OF TRANSPORT NUMBER
Various methods, used for the determination
of transference number, have been discussed by Spiro (3).
Only three of the chief methods will be described here.
(a) Hittorf's method (3)
In this method, named after its discoverer,
the transference number is obtained by determining the
concentration change of the electrolyte around the elec-
trodes when a known amount of electricity is passed through
a cell having physically separable anode, middle and
cathode sections.
When one faraday of electricity is passed
through the cell, T_ and T+ gram-equivalents of anion and
cation constituents migrate into the anode and cathode
compartment respectively. The middle compartment, however,
would have the same original concentration - a criterion
Cor a good Hittorf run.
Although the method is very simple it is
difficult to get accurate results because of the difficulty

22
in analysing accurately relatively small concentration
differences. As an example, when the concentration change
during such a run is 10% and the analysis is performed
with an accuracy of 0.2%, the error in the concentration
determination is 2%. The accuracy can be improved by
passing sufficient electricity to produce large changes in
the concentration. However, this would involve long runs
with the danger of diffusion of the cathode and anode solu-
tions into the middle section and even into one another.
In addition, large currents cause overheating which again
causes turbulent mixing.
(b) E.m.f. method (3,4,5)
Another theoretically sound method is the
e.m.f. one which, though it has not achieved the accuracy
of the moving boundary method, is rapid and is good for a
general survey of transference number over a wide range of
concentration or temperature. The method involves measure-
ment of the e.m.f. of a concentration cell with trans-
ference (Et) and the e.m.f. (E) of a related cell without
transference. The transference number T of the ion con-
stituent TR is related to Et and E by the equation
dEt dE
provided the electrode in the cell with transference is
not reversible to the ion-constituent R.

23
It is evident
from the above expression that the TR value is much
affected by a small change in either Et or• E. A slight
error in e.m.f. measurement in any cell causes a relatively
large error in the transference value. In the case of
HCl, an error of + 0.01 mV in one of the e.m.f:s intro-
duces an error of + 0.001 (see ref. (7)) in T
(c) Moving boundary method (3,8)
The moving boundary technique gives more
accurate transference numbers than any other method so
far developed. It has been found equally successful in
aqueous and non-aqueous solvents for both strong and weak
electrolyte solutions and was adopted for the present work.
That movement of the ions can be followed
visually was first demonstrated. by Lodge (9). The method
was subsequently developed by Whetham (10), Nernst (11),
Masson (12) and particularly by Denison and Steele (13),
which made it possible to determine transference numbers
quantitatively by observing the velocity of the moving
boundary. Work by Cady (14,15), Smith (16), MacInnes (17)
and Longsworth (18) improved the method and made it
capable of producing data of high accuracy.
In the moving boundary method, an electric
current is passed through two solutions, carefully placed
one over the other in the same tube. The current keeps

24
m
FZ
b
LZ
LZ
• -
m b
N
FZ
(b)
FIG. 2-1

25
the junction of the two solutions sharp and moves it
along the tube. The solution under investigation is
called the leading solution and the other one the following
or indicator solution, and its function is just to provide
a junction or boundary to be followed. The movement of
this boundary depends entirely on the properties of the
leading solution and is largely independent of the following
solution. Nevertheless, every solution cannot be used
to give a boundary with a given leading solution. After
careful studies (19), some criteria have been arrived at
which ensure the formation of a sharp and stable boundary
(see later).
Theory of the moving boundary method (3,8,19)
The theory of the moving boundary method
will be explained with reference to fig. 2-1 in which LZ
is the leading electrolyte solution and FZ the following
solution which has a common ion-constituent Z. Under the
effect of the applied potential the boundary m-b moves
in the direction shown - upward (a rising boundary) if
the following solution is the more dense and downward (a
falling boundary)if it is less dense (fig. 2-14D). It is
obvious from the figure that the L ion-constituents are
followed by the F ion-constituents and that this, in effect,
results in the replacement of leading solution by following
solution.

261
Moving boundary equations (8,19)
The equation describing the rate of move-
ment of the FZ/LZ boundary can be derived with reference
to the fig. 2-1. Let the initial position of the boundary
be at m-b. After passing n faradays of electricity it
has moved to another position mt -b' l sweeping out a volume
V (litre) between m-b and m'-b'. If CLLZ is the concentra-
tion of the leading ion-constituent in the solution super-
scripted, then the number of gram-equivalents of L ion-
constituent crossing an imaginary plane at P-N (at a
position in the leading solution which the boundary never L passes) will be VOLLZ . For each faraday it would be VOLZ /n
which by definition is the transference number. Hence
TL L VCIZ/n = VCLZ F/It
(2-2-1)
where I is the current in amperes, t the time in seconds,
and F is Faraday's constant. A more general expression
LZ FZ LZ FZ = V (cif - CL TL - TL (2-2-2)
(where V is the volume in litres swept out by the boundary
per faraday) has been derived (20) for the cases in which
constituent L is present on both sides of the boundary.
When it exists only in the leading solution TLZ and FZ
are both zero and (2-2-2) reduces to (2-2-1). Equation
(2-2-1) has been shown (19) to be valid irrespective of

the fact that the boundary is formed between strong-strong,
strong-weak or weak-weak electrolyte solutions.
In the above derivation of the moving
boundary equation it has been tacitly assumed that dis-
turbing effects such as diffusion, convection and the
nature or concentration of the following solution do not
influence the boundary velocity. All these effects are
normally made ineffective by the electrical restoring
effect. (8) and by the self-adjustment of the indicator
solution concentration (to the Kohlrausch concntration)
which will be described later in this section.
Condition for boundary stability (19)
(a.) Density and type of indicator solution
If the chosen indicator solution at its
appropriate concentration is lighter than the leading
solution, it should be used in falling boundary experiments
and vice versa for denser solutions. This prevents gravi-
tational instability in the experimental set-up. Moreover,
leading and following solutions should not react chemically
with each other and with the electrodes, otherwise the
new species formed may migrate across the boundary and
influence its velocity.
(b) Concentration of the indicator solution
When the boundary moves in a steady state
the leading ion-constituent (L) is followed by the ion-

26
constituent (F) moving at exactly the same rate. Since
this is possible only at one concentration of the indica-
tor solution for a particular concentration of leading
solution, the indicator solution will change its concen-
tration accordingly. This fact directly follows from the
derivation of moving boundary equation (2-2-1). Consider
again fig. 2-1, this time for the following ion constituent
(F). After n faradays of electricity have passed let
the boundary have moved from m-b to m'-b'. The intervening
volume V (litre), originally occupied by leading solution
LZ, is now replaced by following solution FZ. In the pro-
cess F VCFZ gram-equivalents of following ion-constituent
will have crossed the plane at m-b. Thus, as before,
T = VCFZ/n
(2-2-3)
which with (2-2-1), gives
TF /TL r F -L CFZ/CLZ
(2-2-4)
Equation (2-2-4) fixes the concentration to which the
indicator electrolyte adjusts itself behind the boundary.
This concentration is called the Kohlrausch concentration
after its discoverer. If the initial concentration is not
too far from that required by the above equation, it
automatically adjusts itself to the right value at the

29
boundary. Gordon and Kay (21) have studied the effect of
changing indicator solution concentration for the KC1-KI03 system and have found that the difference of -60% to
+40% in indicator concentration from the Kohlrausch con-
centration does not affect the transference values provided
the cell has been properly designed. The measured trans-
ference number is, therefore, independent of the indicator
concentration over quite a wide range.
It is the usual practice among moving
boundary workers to estimate the indicator solution con-
centration for a given leading solution using equation
(2-2-4). Transference values for the equation may be
estimated from the available conductance data of individual
ions at infinite dilution. Since transference values are
independent of the indicator solution concentration over
a wide range, the above estimate is sufficiently accurate.
The actual concentrations used are usually kept a few
per cent below than that required by (2-2-4) for falling
boundaries and above that for rising boundaries to ensure
gravitational stability, and independence of indicator
concentration is checked experimentally.
(c) Restoring effect (8)
Besides gravitational, vibrational and
chemical disturbances the two factors which most oppose

30
boundary stability are convection and diffusion. These
two phenomena, if operative, would never allow a sharp
boundary to be formed between two otherwise suitable
solutions. However, experience shows that sharp boundaries
do exist and are maintained, so that another effect - the
restoring effect - must exist to counteract diffusion.
The effective function of the restoring effect can be
explained by considering a boundary in which solution LZ
is followed by FZ, and for which the F ion-constituent
has a lower mobility than L. The passage of current will
then cause a greater potential drop in the FZ solution
than in the LZ solution, This is shown in the diagram,
where potential is plotted against the distance along the
moving boundary tube.
potential
FZ LZ
distance
Now if some of the relatively fast moving L ions are
carried by some process into the FZ region, they will
experience a greater potential gradient and will be sent
forward to the boundary. Similarly, if F ions creep into
the LZ region they will move more slowly than L ions and

will ultimately be overtaken by the boundary. If FZ is
a weak electrolyte with F possessing greater conductivity
than the leading ion, the difference in ionisation of FZ
in the two regions maintains the restoring effect (see
later).
Equations for boundary stability (19)
From what has been said above, it is
evident that to obtain a stable steady-state boundary, the
leading ion constituent L must have a greater velocity
(V) in the following solution than in the leading solution,
and the following ion-constituent F must have lower
velocity in the leading solution than in the following
solution. These conditions can be represented mathemati-
cally as
vFZ LZ VL (2-2-5)
FZ LZ VF >V_ (2-2-6)
where ,V is the velocity of the subscripted ion-constituent
in the superscripted solution. Since, by definition, the
velocity of an ion-constituent is equal to the product of
its mobility (U) and the electric field strength (E) to
which it is subjected, the above conditions become

UL UL FZ -FEZ LZ -LZ
uFZ EFZ LZ ELZ UF
When the boundary moves in a steady state
ULZ ELZ = V = u ,Z L FZ m.b. F
(2-2-7)
(2-2-8)
(2-2-9)
A more convenient set of stability conditions than (2-2-7)
and (2-2-8), which does not involve any knowledge of the
potential gradient in each solution, is obtained by sub-
stituting (2-2-9) to give
LZ LZ UL OF
UFZ F UFZ L
Equations (2-2-10) and (2-2-11) express the fact that for
a stable boundary the following ion-constituent should
have a mobility lower than that of leading ion-constituent
in both the leading and following solutions.
Stability conditions in terms of ionisation constant
The special stability conditions for weak
electrolyte solutions have been derived by Spiro (19) and
have been applied to cases in which a boundary is formed
between different kinds of electrolytes. Taking as an
example the boundary between two weak 1:1 electrolyte solu-
tions HL and HF, it can be shown (19) that the conditions

33
represented by (2 2 10) and (2-2-11) take the form
,HL HL T.;- - KH L
cH+L HL H ,
HF HF UL_ KHL
HF KHL cH+ "HL
UHL KHL F- HF HL HL 111- + KHL
UHF KHF F- HF HZ' HF
CH+ KHF
(2-2-12)
(2-2-13)
where U and c are the mobility and concentration, respec-
tively, and where K is the ionisation constant. These
conditions apply to all those electrolytes which can be
either formally moneprotid or effectively so, e.g. the
HPic/H3PO4 system in water.
If HL and HF are both such weak electrolytes
that cH.1.);>KHL and cH.I.KHF,.then (2-2-12) and (2-2-13)
simplify to
UL-
KHL UHL KHL
L- HL F- HF
UHF KHL TT tr IIE HF
'L` 'HL 'HF
(2-2-14)
(2-2-15)
which illustrates the fact that an indicator can be satis-
factory even if the following ion F is faster than the
leading ion L provided the following electrolyte HF is
sufficiently less dissociated than the leading solution.
HL. This explains, for example, why a stable boundary

34
was obtained (see Chapter IV) in water when picric acid
= 30.39(22), 0( = 0.71 ) was followed by phosphoric
acid ( 32.3 (23), = 2.15 (22)) but not when phos-
phoric acid was followed by picric acid (24).
2.3 ELECTRODES (25)
In the moving boundary method one section,
either cathode or anode, of the cell should be kept closed
to prevent movement of the bulk solutions in either direc-
tion. This also permits the calculation of the volume
correction (see later). The other, open, section makes
provision for the expansion and contraction of the whole
system during a run.
The electrodes for anode and cathode
sections must meet certain requirements:
(a) No ion, resulting from an electrode reaction, should
reach the boundary, as this slows down the bOundary
velocity.
(b) The electrode reaction and the physical state of the
products should be known so that the volume correc-
tion can be worked out.
(c) In addition.to (a) and (b), the electrode for the
closed section must be a non-gassing electrode.
2.4 'VOLUME CORRECTION
When current is passed through the moving
boundary cell, the reaction at the'electrodes causes a

Pie-" b. .1
nuoo
Pt. wire
Nit
„,2Succ
FIG. 2-2
35
change in volume. The effect was assumed to be negli-
gible (26) in the early years but subsequently Killer
(27) showed it to be appreciable. Lewis (28) first
calculated this correction and applied it to the published
moving boundary results which were then found comparable
with those obtained by Hittorf's method.
In the moving boundary method the position
of the boundary is measured with respect to the marks
on the moving boundary tube, whereas the transference
number is defined in terms of a plane fixed with respect
to the solvent. Thus the movement of the solvent (due
to the electrode reaction) with respect to the tube must
be worked out.
Consider, for ex-mple, the closed cathode
section (fig. 2-2) of the cell in
1+
which silver succinat.e is employed --X
..2 51-
as the non-gassing cathode, with
picric and succinic acids as
leading and following solutions
respectively. Let the boundary
m-b be at position on the moving
boundary tube, and let X represent
the plane, fixed with respect to
the solvent, in the leading picric
acid solution at a position which

36
the boundary never crosses. After one faraday of elec-
tricity has passed, let the boundary have moved to
position 2 on the tube. Now we have to calculate the
volume increase AV (in cm3) due to any process which
displaces the solvent and hence the plane to position
11 • Since solvent is displaced relative to the etch
mark, it follows that the corrected transference number
is given by (28)
HPic THPic (Obs.) - C LSX Tpie pic 1000 (2-,4-1)
For the present case, the events contributing to this
volume change at the electrode and in the region between
the boundary and the plane X are:
(±)
Silver ions present in succinic acid solution are
discharged and deposited on the platinum wire.
The loss and gain in volume is therefore
_ v H2Succ v Ag+ Ag
where V is the molar volume and the partial
molal volume.
The concentration of silver ion falls in the
vicinity of the platinum wire and a corresponding
amount of silver succinate goes into solution.
This results in the following volume increase
37
V H2Succ
v H2Succ
i V 2 :1
Ag2Succ Ag+ Succ--
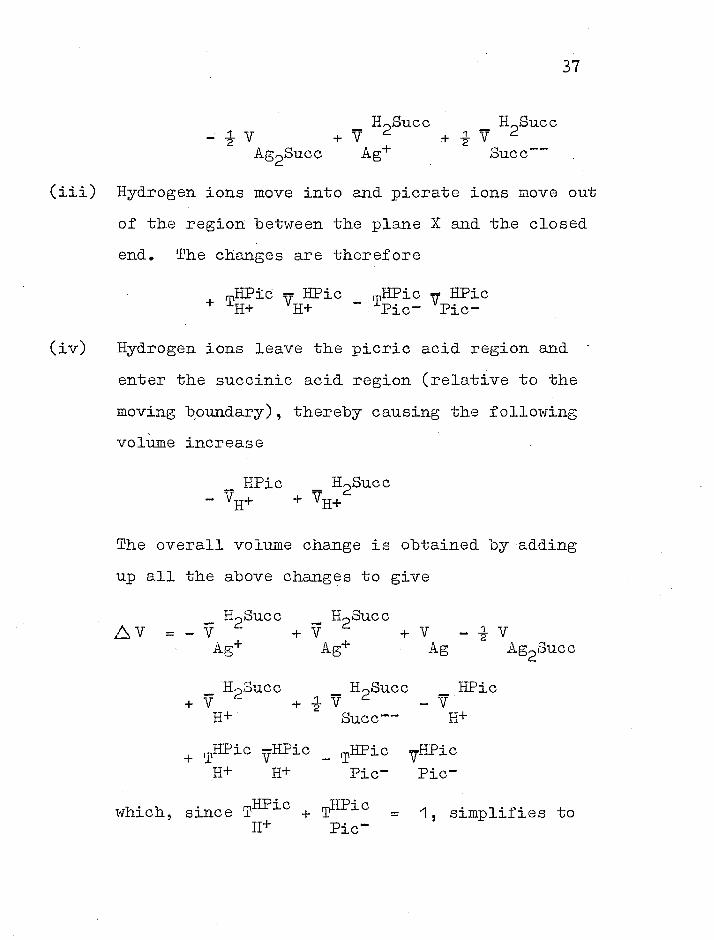
(iii) Hydrogen ions move into and picrate ions move out
of the region between the plane X and the closed
end. The changes are therefore
THPic u HPic THPic v HPic H+ "H+ Pic- Pic-
( iv) Hydrogen ions leave the picric acid region and
enter the succinic acid region (relative to the
moving boundary), thereby causing the following
volime increase
HPic H2Succ - H+ + H+
The overall volume change is obtained by adding
up all the above changes to give
- H2Succ H2Succ = - V
4. v +V -iV Ag+ Ag+ Ag Ag2Succ
H2Succ H2Succ HPic + v + i v - V
H+ Succ-- H+
+ THPic -HPic V - THPic -HPic V H+ H+ Pic- Pic-
which, since THPic THPic 1, simplifies to 11-1- Pic-

give 'per faraday,
H2Succ .6V . V - i V + VAg Ag2Succ 2 H2Succ
THPic 7 HPic Pic- HPic
38
(2-4-2)
The corresponding equation for the lead
succinate cathode is
—a H2Succ HPic
LTVLTV = V - -1- V + v - T Pb 2 PbSucc 2 H2Succ Pic V HPic
C2-43) For the runs with tartaric acid using acetic acid as
following solution and silver succinate as cathode, the
volume change is given by
AV VAg - V + .1 7 HOAc - T v 2 Ag Succ 2 H Succ HT H2T (24:4) 2 2
The numerical values VAg 10.3 cm3/mole (29), VAg2Succ 88.5 (23), , 82.5 (30) and Vu m 83 (31) were H2oucc "2' taken from the literature and PbV =18.27 and Vpbsucc = 87.9
were calculated from available densities and molecular
weights (32,33). The partial molal volume Viipic of picric
acid was calculated from the published density data (34)
of picric acid solutions and from pyknometric measurements
carried out by the writer. The equations used were (35)

39
V = • dml roi + (2-4-5) d
. / o 4. 3/2 a m, (2-4-6) '
(2-4-7). = V - Vo
m'
V
V°
=
_
=
1 $o_i_ am f2
1000 + m'M ((22::::))
(2-4-10) 1000 D w
where
V = volume of a m' molal solution containing
1000 gm of water
V° = volume of 1000 gm of pure water
▪ molecular weight of picric acid
D & Dw • densities of picric acid solution and of
pure water respectively
p o aid a = constants.
The molality m', V° and V were first cal-
culated from the density values and hence % was worked out
using equation (2-4-7) • A plot of / versus m'2(fig.
4-1) gave the values fore and a which were then substi-
tuted in equation (2-4-6) to obtain the value of the
partial molal volume Viiric.

40
119
_118
El Literature data 0 Own measurements
FIG. 4-1
0.1 0.2 0.3

41
Various stages of the above calculations
are summarized in table 2-A. The resulting mean value HPic HPic = 118.5 + 1 was employed in the calculations
which gave ZSV = -1.7 cm3/faraday for the silver succinate
electrode and .&V = -2.6 om3/faraday for lead succinate
for picric acid runs. The value for tartaric acid runs
with silver succinate worked out to be +1.2 cm3/faraday.
2.5 SOLVRNT CORRECTION
This correction, first applied to trans-
ference values by Longsworth (29), allows for the fact
that the solvent always has a conductance of its own due
to dissolved impurities. The observed conductance of any
electrolyte solution is the sum of the conductance due to,
the electrolyte mid that due to the impurities. In dilute
solutions, the conductance of the solvent is an appreciable
fraction of the total conductance. The correction, there-
fore, becomes more important when dilute solutions are
under investigation.
If k represents the specific conductivity,
the corrected transference number is given by the equation
k 4 SOLVENT T(obs) kSOLUTION) (2-5-1)
The equation cannot, however, be used as
it stands. The conductance of conductivity water used

TABLE 2-A
PARTIAL MOLAL VOLUME OF PICRIC ACID FROM
DENSITY MEASUREMENTS
Sol. No.
Molar Conc. (M)
D Molal Conc. (m')
V = 1000+m'M V°
0= V-V°
D ml
1 0.01432 0.99865 0.01439 1004.65 1002.94 119,4
2 0.02270 0.99959 0.02283 1005.65 " 118.8
3 0.03563 1.00100 0.03589 1007.21 " 119.2 117.0 12
4 0.05086 1.00266 0.05132 1009.08 " 119.7
5 0.00895 0.99807 0.00898 1003.99 " 117.8
6 0.02102 0.99943 0.02114 1005.41 " 117.2
7 0.04079 1.00162 0.04111 1007.79 " 118.0 115.0 16
8 0.05240 1.00288 0.05288 1009.21 " 118.6
* 1-4 from literature (34)
5-8 from own density measurements
42

43
in the present work is mainly due to the dissolution of
carbon dioxide. When acid solutions are prepared in
this solvent, the ionisation of carbonic acid is suppressed.
The specific conductance of water in the solution is,
therefore, different from that measured just in water.
kSOLVENT in solution was thus obtained by substracting
the conductance due to the presence of carbonic acid, in
the following way ( IS).
The pH of conductivity water was measured
and found to be 5.68. Therefore
(e) = (Hod ) = 10-5.68 = 2.1 x 10⁻⁶ N
The specific conductance due to the dissolved CO2 is thus
3
AC Rc 1000 1000 - 395 x 2.1 x 10- = x 1O-3
- 6 -1 = 0.83 x 10 ohm-1 cm
The measured specific conductance of the conductivity • - 1 water was 1.0 x 10⁻⁶ ohm-1 cm 1 and so the value of
kSOLV ENT in solution was (1.0 - 0.83)10-6 = 017 x 10-6
°1im-1 cm-1. Allowing for contaminations in the cell etc.,
0.18 x 10⁻⁶ ohm-1 cm-1 was added to the above value (a),
giving finally
kSOLVENT = 0.35 x 10⁻⁶ ohm-1 cm 1.

44
The specific conductance of the solution,
can be worked out from the known values of kSOLUTION'
the equivalent conductance at the experimental concentra-
tions. In the present case such values were not available
and we had to use Ives' and MoseleAvalues in more dilute(37)
solutions and predict conductance in more concentrated
ones using the Robinson and Stokes conductance equation
in the form
A/a ( g A° +13 cac ) 21 + ( ac
where
A . equivalent conductance
A° = 380.20 ohm-1 cm."' equiv.-1 at infinite dilution
e = 0.229 for 1:1 electrolyte at 25°C
p = 60.6 at 25°C
a = degree of dissociation
c = normality
a values for the equation were worked out
taking Klipic = 1 mol/litre which was obtained by recalcu-
lating Ives'and Moseley conductance results (see Chapter IV).
The solvent and volume corrections, applied
to the experimental transference numbers, are given in
table 2-B.

TABLE 2-B
VOLUME AND SOLVENT CORRECTIONS FOR
PICRIC AND TARTARIC ACID SOLUTIONS
USING DIFFERENT ELECTRODES
SOLUTION CONC. (M)
ELECTRODE VOLUME CORRN. ,LTV/1000
SOLVENT CORRN. - SOLVENT T(obs). vs
'SOLUTION
HPic 0.005 Ag2Succ *0.000,009 • +0.000,014
0.01 n *0.000,017 -- U 0.02 H 0.0.000,034 --
H 0.005 PbSucc *0.000,012 --
0.01 H 4.1•0.000,026 --
0.02 n *0.000,054 --
H2T 0.02 Ag2Succ 40.000,02 --
0.05 40.000,06 --
0.10 40.000,12
45

46
RKHERENCES
Chapter II
(1) M. Spiro, J.ChemXita., 2 1 464(1956).
(2) A.A. Noyes and K.G. Falk, J.Am.Chem.Soc. 1436, (1911).
(3) M. Spiro, Techniques of Organic Chemistry, Vol.1 part IV, p.3049, 3rd Edn., Interscience Publishers Inc. New York, 1960.
(4)
(5)
(6)
(7)
(8)
(9)
(10)
(11)
(12)
(13)
(14)
(15)
(16)
R.A. Robinson and R.H. Stokes, Electrolyte Solutions, p.111, 2nd Edn., Butterworths, London, 1959.
D.A. Naclnnes, The Principles of Electrochemistry, p.168, Dover Publications Inc. New York, 1961.
M. Spiro, Trans.Faraday Soc.,,.2, 1207(1959).
HFlrned. and Owen, The Physical Chemistry of Electro-lyte Solutions, p.478-482, Reinhold, New York, 1958.
D.A. MacInnes and L.G. Longsworth, Chem.Rev., 11, 171 (1932).
O. Lodge, Brit.Ass.Advancement Sci., p.389, Birmingham (1886). W.C.D. Whethnm, Phil.Trans., 184A, 337 (1893).
W. Nernst, Z.Ele(trochem., 308(1897)
H. Masson, Phil.Trans., 192A, 331(1899).
R.B. Denison and B.D. Steele, J.Chem.Soc. (1906).
E.G. Franklin and H.P. Cady, J.Am.Chem.Soc., 26, 499 (1904).
H.P. Cady and 1656(1929).
E.R. Smith and D.A. MacInnes, J.Am.Chem.Soc., 46, 1398(1924).
..q21 999
L.G. Longsworth, J.Am.Chem.Soc.,

47
('17) D.A. MacInnes and E.R. Smith, J Am.Chem.Soc., 2246(1923).
(18) L.G. Longsworth, J.Am.Chem.Soc., 2741(1932).
(19) M. Spiro, Trans.Faraday Soc., 61, 350 (1965).
(20) L.G. Longsworth, J.Am.Chem.Soc., .62, 1109(1945).
(21) A.R. Gordon and R.L. Kay, J.Chem.Phys., 211 131 (1953).
(22) Ref. (4)1 Appendices 6.1 and 12.1.
(23) M. Selvaratnam and M. Spiro, Trans.Faraday Soc., 611 360(1965).
(24) M.K. Kerkor, H.E. Bowlxin and E. Mutijvic, Tr ms. Faraday Soc., Z1 1039(1960).
(25) Ref. (3), p.3078.
(26) R.B. Denison and B.D. Steele Phil.Trans., 205, 449(1906).
(27) W.L. Miller, Z.Physik.Chem., 62, 436(1909).
(28.) G.N. Lewis, J.Am.0hem.Soc., 862 (1910).
(29) Ref. (l3) .. •
(30) M. Mason" and J.B. Culvern, J.Am.0hem.Soc., 21,23a7('1949)
(31) K.N. Marsh, M. Spiro and M. Selvaratnam, J.Phys. Chem., 62, 699(1963).
(32) Handbook of Chemistry and Physics, 45th Edn.. p.B-183.
(33) A. Seidell, Solubilities of Inorganic and Metal Organic Compounds, p.1376, D.Van Nostrand Company Inc., New York, 1940.
(34) K. Drucker, Arkiv Komi, Mineral Geology, A 22, 171(1946).
(35) Ref. (5) p.82 .
(36) M. Spiro, J.Phyp.Chom., 60.1 976(1,256).
(37) D.J.G. Ives and P.G.N. Moseley, J.Chem.Soc., 0, 757 (1966).

48
CHAPTER 111
EXPERIMENTAL
3.1 THE CELL
The falling boundary cell used in the
present work is shown in fig.3-1 and is based on the design
of Gordon and Kay (1). The moving boundary tube was 2 mm
wide with twelve marks etched all along the circumference.
The tube had preViously been aged for two years and had
been calibrated by mercury weighing by Dr.J.M.Notley(2).
The volumes between two successive marks on the tube are
given in table 3-A.
An important feature of the design was,
stopcock T. This had a hollow barrel and the same bore as
the moving boundary tube. The thermostat oil easily
circulated through the barrel thereby eliminating any
local Joule heating.
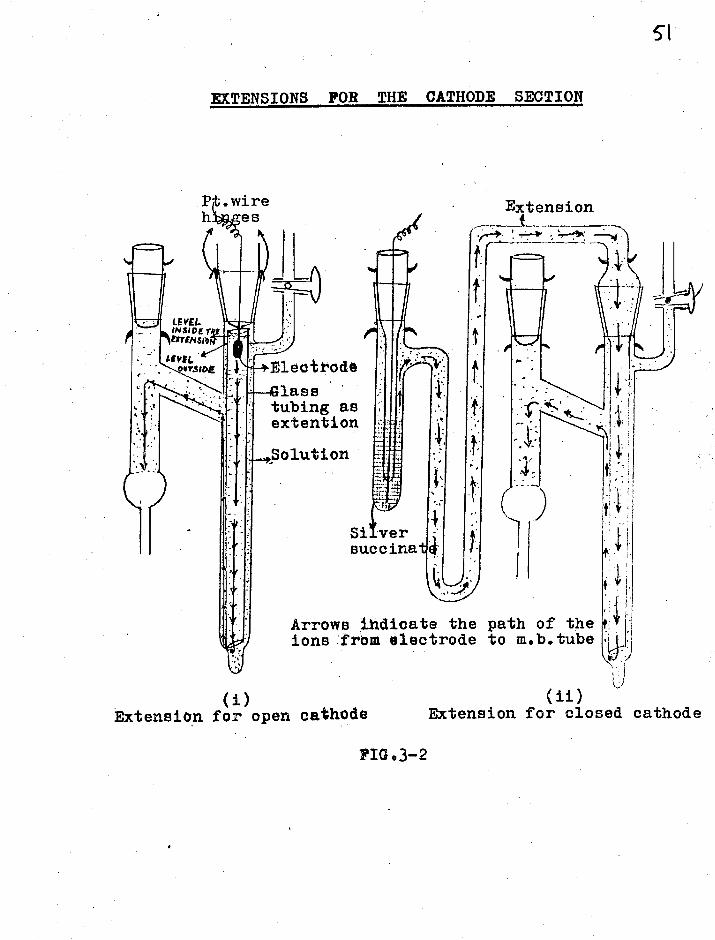
Extension of the cathode section
In some cases (see section 3.5) it was
found that ions resulting from an electrode reaction in
the cathode compartment were fast and overtook the boundary.
This caused a gradual drop in the boundary velocity and
thus in the transference values. Various devices were
therefore tried to lengthen the distance between the electr-
ode itself and the moving boundary tube. The extensions
used are shown in fig.3-2 which are self—explanatory.
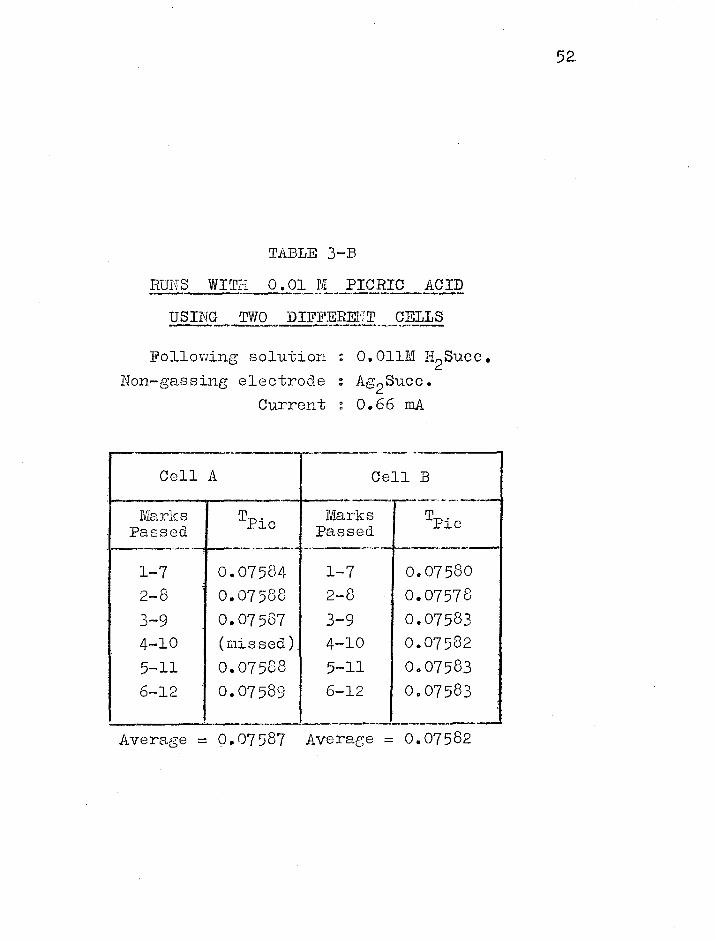
Two such .cells were used to determine

Hollow Stopcock
FALLING MOVING BOUNDARY CELL
e-14
Pt.Wire 71 Electrode
Movtnig‹.--Boundary Tube
Etch Mark
Hg—contact
Silvet succinate
Pt.Wire sealed in soda glass A/
Cathode sectionl
Anode Section
FIG.
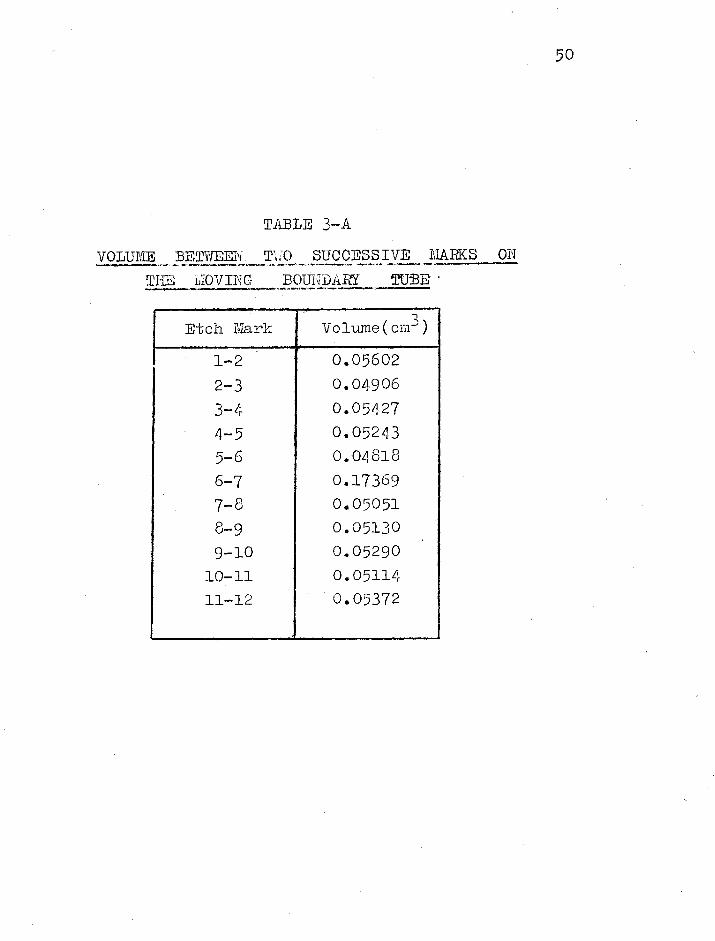
TABLE 3—A
VOLUME BETWEEI'{ MO SUCCESSIVE MARKS ON
THE MOVING:- BOUNDARY TUBE
Etch Mark ,
Volume(cm=1
1-2 0.05602 2-3 0.04906
3-4 0.05427
4-5 0.05243 5-6 0.04818 6-7 0.17369 7-8 0.05051 8-9 0.05130 9-10 0.05290 10711 0.05114 11-12 0.05372
50
51
EXTENSIONS FOR THE CATHODE SECTION
P .wire es Extension
t
t
Arrows ihdioate the path of the ions from electrode to m.b.tube
(1) Extension for open cathode
(ii) Extension for closed cathode
FIG03-2
LEVEL. INSIDE r EXTVISro
LEVI(, oftSwe ,Eleotode
lass • tubing as extention
Si ver succinat
Cell B
Marks Passed
0.07584 1-7 0.07588 2-8 0.07587 3-9 (missed) 4-10 0.07588 5-11 0.07589 6-12
Tpic
0.07580 0.07578 0.07583 0.07582 0.07583 0.07583
Plc
TABLE 3—B
RUNS WITH 0.01 M PICRIC ACID
USING TWO DIFFERENT CELLS
Following solution : 0.011M H2Succ. Non—gassing electrode : Ag2Succ.
Current : 0.66 mA
Average = 0.07587 Average = 0.07582
52

FICA. 1-3

54
transference numbers in picric acid solution. Table 3-B
shows how well the results agreed, indicating that the
transference numbers were inde-,Dendent of the cell used.
3.2 THE THED,IOSTAT 11141) THERHUREGUILhTOR
The photograph (fig. 3-3) represents the
thermostat tank with the thermoregulator and the moving
boundary cell in their proper positions. The dimensions
of the tank were;•length 60 cm, width 35 cm and height
52 cm. The two large faces were made of glass so that -+
boundary could be seen. On one end, a rectangular glass
window of 30 cm x 15 cm was provided to enable the cell
to be inspected from the side, and so lined up vertically.
The bottom of the tank and all other parts were covered
with brass sheet. The bath fluid was Shell 'Biala' BX
oil which possessed adequate fluidity and good trans-0a-
rency to light. Its colour changed slowly from .sale
yellow to dark yellow, and after prolonged use tended to
become dark.
The tank was supported on a steel frame-
work about 100 cm in height. The stirring motor was fixed
on to a separate steel frame to avoid transmission of
vibrations into the bath fluid and so to the cell itself.
The 1/6 H.P. stirring motor was a Hoover a.c. ty-Qe
7339HBQ1188 which drove two stirring rods, each holding
three large sets of paddlos, at 250 r.p.m.
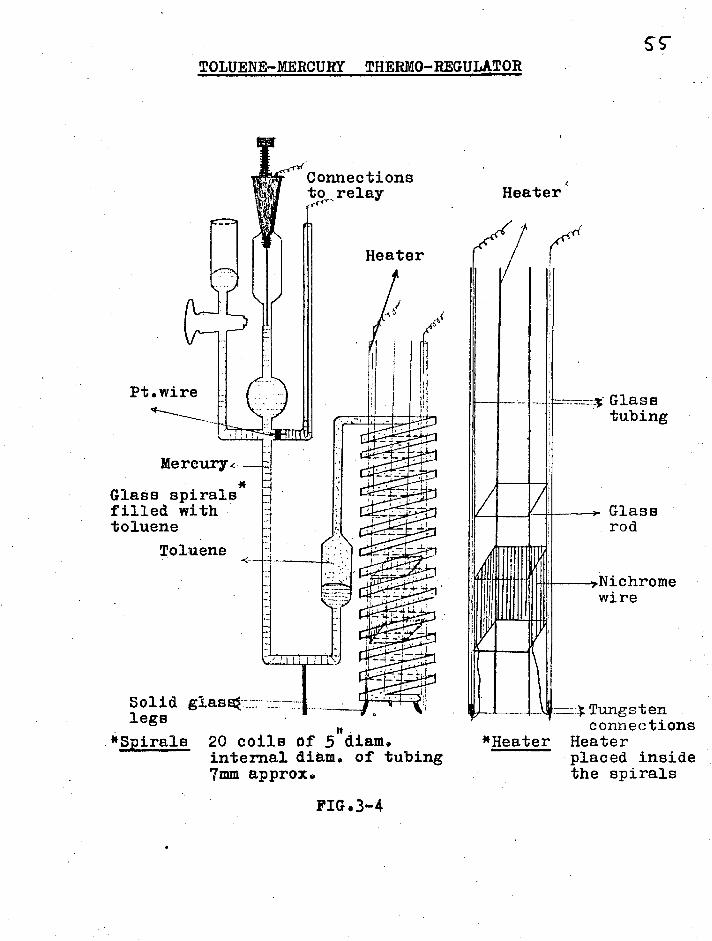
TOLUENE-MERCURY THERMO-REGULATOR
Connections to relay Heater'
Heater
SS
Glass tubing
Mercury4--
Glass spirals*
filled with toluene
Toluene
Glass rod
wire
Solid glalE41 legs
*Spirals 20 coils of 5 diam. internal diem. of tubing 7mm approx.
*Heater
---- Tungsten connections
Heater placed inside the spirals
FIG.3-4

56
The toluene-mercury thermoregulator used
is shown in fig.3-4 and in the -photograph. The essential
feature was the large spiral-shaed glass tubing filled
with toluene. The 150 watt Nichrome wire heating element
was made by winding the wire on to a glass rod frame and
this was placed inside the spirals of the thermoregulator
for greatest senstivity. The current to the h,,ating
element was controlled by a relay designed in the
department which controllee1 the te lperature to +0.002 C.
On hot days, when the laboratory temperature was 23-24°C
or more, bath temperature could not be kept at 25°C.- A
copper cooling coil with cold water circulating through
it was, therefore, provided to keep the temperature
constant. The bath temperature was set at 25.0 + 0.05°C
using calibrated thermometers and temperature fluctuations
were noted on a Leckmann thermometer.
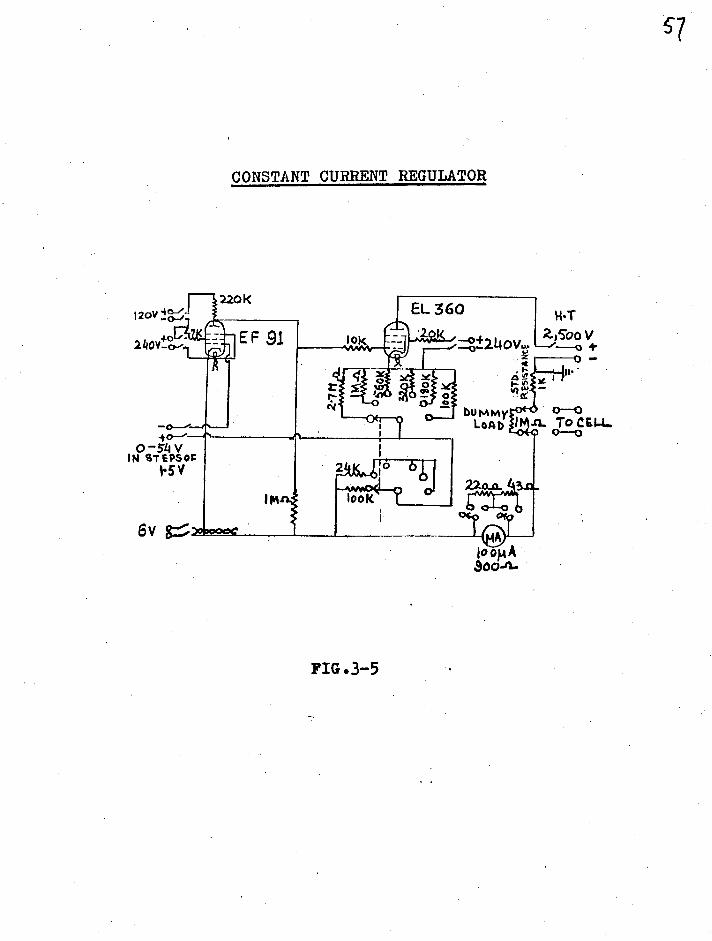
3.3 CONTAKT CLELRENT 12GULATOIL
As the boundary moves, the leading solution
is replaced by the following one which results in an
increase of resistance of the cell. Conseuuently, current
passing through the cell would gradually decrease. It is,
therefore, neccessary to use some kind of device to keep
the current constant.
Various types of electronic constant
current regulators have been described in the literature
CONSTANT CURRENT REGULATOR
IM
EL 360 Zor Z4boV 10k —°±2140V., —o 4- Z _____0 ..
;1 p 0 xe A e "
220K
EF 91
a1
• gAtj6 I W
f ,0( 0 d
look 2elnp 1
0 -54 V IN CITEPS0%
6V g >:,..cciepc.
bUMMy LOAD
0-0 4. To CE14- 0_0
FIG.3-5

58
(see ref.(3) for references) some very simple and others
very complicated. The regulator used in the present
research was that designed by Notley(4) and the circuit
diagram is shown in fig. 3-5.
In the previous work in this laboratory,
and during the early part of the present research the .
high tension (2000-2500 volt) source consisted of a set
of 120 volt dry batteries. This was found to possess
some disadvantages, particularly the occasional failure
of one of the batteries during a run. The batteries were
therefore replaced during the course of this work by a
Brandenburg high voltage generator, type 5.0530. Its
main features were :
Input Output
Maximum current
Stability when mains change ± 10%
Output ripple
200/250 volts, 50 c.p.s. 500-5000 volts
4 mA
Better than 0.25%
Less than 0.1% at full output
Output polarity Reversible
As a consequence of employing the new
source , the current regulator was slightly modified.
Either the positive or the negative line of the Brandenburg
generator output must be earthed. This condition made
it neccessary to change the circuit of the original
constant current regulator.

59
In the new circuit, the negative H.T.
lead was earthed, and so was one side of the 1000 ohm
standard resistor, the other end being connected to the
moving boundary cell. It is important to have the
standard resistor and the moving boundary cell as near
to earth ootential as possible to avoid any leakage
This is more likely to occur if large potential differences
exist between these components and earth. However, this
meant that the current regulator itself was now at a high
botential above earth, and the regulator itself was
therefore rebuilt with all its components fitted onto a
alias lined with Perspex. The interior of the box
covering the whole assembly was also lined with Perspex
to avoid leakage.
Transference values obtained with dry
batteries and the old regulator, and those obtained with
the Brandenburg source and the modified regulator, agreed
within experimental error.
The current passing through the cell
was determined by measuring the potential with a Tinsley
vernier potentiometer ( in conjunction with an unr:atu-
rated Eppley standard cell from Leeds and Northrup
across a standard Sullivan 1000 ohm resistor in series
with the moving boundary cell.

60
3.4 OPTICAL ASSEnBLY (3)
There is a difference of refractive index
at the junction of the leading and following solutions
in the moving boundary tube C (fig.3-6). When viewed
through the telescope T against the light source L, the
junction appears as a sharp dark ( or light ) line and
the movement of the boundary is therefore followed in
this way.
L was a 40 watt tungsten bulb fitted into
a blackened Wooden box. The box could be moved up and down
with a pulley system operated by the observer behind the
telescopes The aperture was a horizontal rectangular slit
4mm x 6mm behind which was a ground glass slide S to
diffuse the light and uniformly illuminate the aperture.
A five inch diameter glass cylinder K, filled with water,
was interposed between the 'light source L and the glass
wall N of the thermostat tank. This acted as a lens and
greatly improved the appearance of the moving boundary tube.
It was found that the region between the
walls of the moving boundary tube -- the region in which the
boundary appears looked much wider when the refractive
indices of the bath fluid and the liquid inside the tube
were the same. On the other hand when the refractive
indices are different ( as in the present case 1. - .478 oil-1 7
)64' ater 1.333 ), the walls of the tube appeared as broad
black regions. This left a very narrow space in which the

OPTICAL ASSEMBLY
61
FIG .3-6

62
boundary appeared. The introduction of the water filled
cylinder reduced this effect' and made the boundary-41=h.
easier to see*
3.5 GREASES
Vaseline and Apiezon Z greases were
purified twice by stirring with hot conductivity water
between 50 and 7000 to remove water-soluble impurities.
The greases were dried over silica gel in a vacuum
desiccator at 50-60°C. Vaseline grease was found to be
too soft to hold the stopcock tightly while Apiezon
gave much higher transference values which indicated that
it adsorbs picric acid (see chapter 1V). Inert silicone
stopcock grease was therefore employed and this gave
consistent values within the run and from one run to
another. Triethylamine(5) was found to be a very good
solvent for this grease, and the cell was always rinsed
with this liouid after a- run (see section 3.9).
During the work, it was at one time
suspected that the silicone grease had, crept into the
moving boundary tube and affected its calibration. To
make sure that the tube volume was all right, a run with
0.05M aqueous potassium chloride was carried out.
Potassium acetate was used as the following solution (6)
and silver as the closed non-gassing anode. A platinum
cathode was initially employed but the hydroxyl ions

63
generated at it were found to cross the boundary
OH -198.3 (7) qAc= 40.9 (7) ) and a.silver chloride
cathode was, therefore, used instead. Since chloride ion,
too, has a greater equivalent conductance ( q1=76.35 (7) ),
it was very likely that these ions would cross the boun-
dary as well. The effective length of the cathode, section
was accordingly increased (see section 3.1) so that thiS
possibility was avoided.
The transference values of chloride ion
are given in table 3-C. Their consistency within the run
clearly showed that the tube calibration had not been
affected and that the washing method (see section 3.9)
was satisfactory.
3.6 ELECTRODES
As mentioned earlier, a non-gassing
electrode with specific characteristicsis required for
the closed section of the moving boundary cell. Accordinglyi
various electrodes were tried to suit the runs with picric
and tartaric acid solutions.
No suitable non-gassing anode could be
found for those two acids. A silver anode was tried with
picric acid but silver picrate formed was found to be
fairly soluble (9). Consequently, silver ions crossed the
boundary and were deposited as metallic silver at the
platinum cathode. The solubility of silver tarttrate(10)

TABLE 3-C
ThAN6FEltEliCE VALUES OF CHLOIcIDIC ION
64
r
Marks passed
1-7
2-8 3-9 4-10 5-11
6-12
0.5098 0.5098
0.5098
0.5092
0.5098
0.5095
AVerage = 0.5096 (0.86 mA) With solvent and
volume correction . 0.5098
-Literature value(8) = 0.5101

65
- at 25°C is 5.6 x 10³ mole / litre which is also too high
for practical use. Different cathodes were, therefore,
tried out instead. Silver chloride would have been a
very convenient non-gassing cathode but the chloride ions
resulting from the electrode reaction had greater
equivalent condUctance than both picrate and tartarate
ions ( = 30.39 (7)9 XHT- = 27.6 (11) and 76.35
(7) ) . So it was very likely that chloride ions would
cross the boundary, and although extension of the closed
cathode section might have overcome the difficulty these
-extensions Were not developed until the last stage of the
research. Silver-palladium tube, lead dioxide, lead
succinate and silver succinate were, therefore, studied.
The experimental details of these electrOdes are given
below.
Lead dioxide
Lead dioxide undergoes the following
electrode reaction when used as cathode in acid solution:
Pb02 + 4 H+ + 4 e + 2 H2O
This reaction is being extensively used in accumulators
and so suggested its use as a non-gassing cathode in
moving boundary experiment. Its most attractive feature
was the formation of solid lead and not of ions which
would have crossed the boundp,ry:7The Volumochanges
accompanying the electrode reaction can also be very

66
accurately worked out.
Different methods for electrolytic
deposition of lead dioxide have been described in the
literature (12) (13)
For the present purpose the stable
a-form (14) of lead dioxide was deposited on a platinum
wire electrode by the anodic oxidation (15) of lead
acetate solution. Firm, smooth and cylindrical deposition
was obtained when a solution of 0.5 M lead acetate and
0.25 L sodium acetate was electrolysed between- the
platinum anode and lead cathode. In the first two hours
of the electrolysis, current was maintained at 0.1 mA
after that it was increased up to 0.3 mA. To get the
deposition cylindrically smooth, the platinum electrode
was rotated at regular intervals -- roughly every fifteen
minutes. The deposition was continued until it was suff-
icint: for: a run which required roughly 20-50 coulombs,
depending on the concentration of the solution investigated.
The electrode was tested at 0.2 mA in an
auxiliary cell containing 0.02 M acetic acid solution.
It worked well for a few hours and then gassing started.
The solution and the lead dioxide surface turned brown
and the load dioxide coating came loose, perhaps because
of the slight solubility (16) of lead dioxide in acetic
acid.
An attempt was then made to mould lead

67
dioxide powder into a compact solid. Accordingly, a few
tablets were made at room temperature and at eight tons
pressure but these could not retain their compactness
and shape when put into 0.01 M acetie acid solution. The
idea was, therefore, given up and other electrodes
were tried.-
Silver-Palladium tube
Tho. peculiar behaviour of palladium
towards hydrogen was studied by Graham (17) in 1868. His
observations indicated that:
(a) When used as a cathode in electrolysis, palladium
takes up hydrogen which pervades the whole mass.
(b) On reversing the polarity so as to cause oxygen to •
be evolved on the surface of the metal, the hydrogen
is extracted as rapidly as it had previously entered.
(c) When _palladium, charged with hydrogen, is ex posed to
the atmosphere it becomes hot and loses all its gas
by spontaneous oxidation.
(d) Charging the metal above a hydrogen/palladium ratio
of 0.67 leads to an increase in volume by 100.
Recent studies in this field have shown
that dissolution of hydrogen in metal leads to an
expansion (18) of the metallic lattice which reduces the
conductivity. Besides metallic rods, palladium tubes have
been successfully used by Schuldiner (19) as non-gassing

68
electrodes He has suggested (20) their use for the closed
compartments in electrophoresis cells. Silver-alloyed
palladium (21) tubes are also being used to study
permeation of hydrogen gas through them under various
conditions.
When such rods or tubes are used as cathodes,
the electrode reaction is
H+ e
12
and the evolved gas undergoes a compound formation accoi•-•
ding to the following mechanisms '(20)
xH30+ + Pd + xe ›PdEx +'xH20 (at low pH)
xH2O + Pd + xe > PdH + x0H (at high pH)
The substance PdHx is described as an alloy rather than a
definite chemical compound such as hYdride.
A silver-palladium tube, with one end
closed, was obtained from Johnson, Matthey and Co., London.
The dimensions and composition of the tube were:
Length 15cm Weight 7.3 gm
Diameter 7mm Silver 23 %
Thickness 0.2mm Palladium 77
Three electrodes were made from this tube having lengths
1.2, 4.0 and 6.0 cm. Each electrode is shown in fig. 3-7,
(1), (ii) and (iii) .
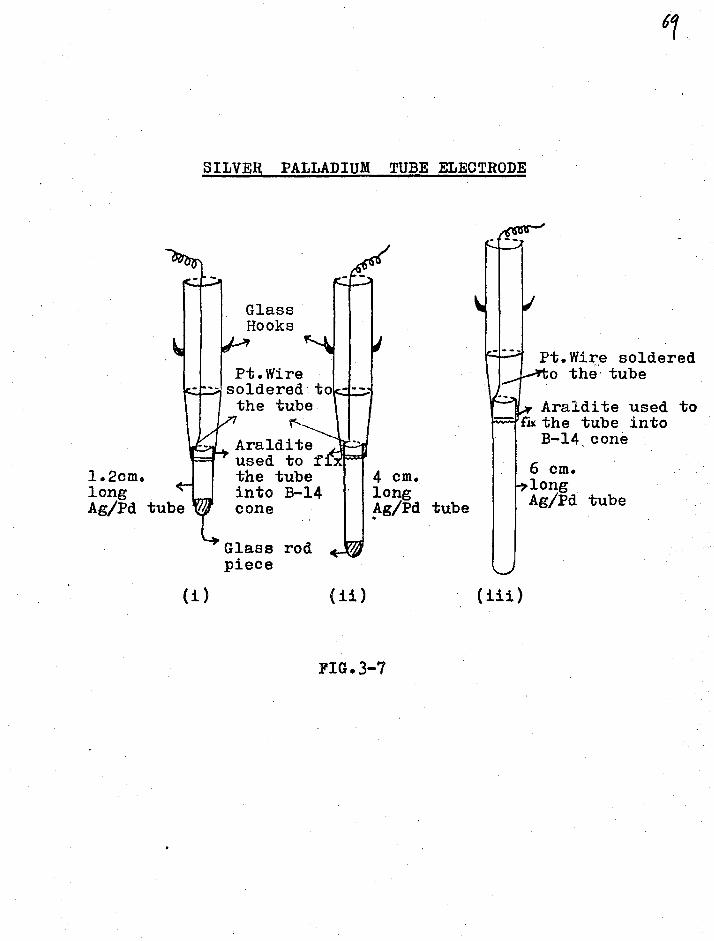
SILVER PALLADIUM TUBE ELECTRODE
Pt.Wire soldered Pt.Wire o the tube soldered, to the tube Araldite used to
&the tube into Araldite B-14_ cone used to fi 6 cm. 1.2cm. the tube 4 cm. long long into B-14 long Ag/Pd tube Ag/Pd tube cone Ag/Pd tube
Glass rod piece
(i)
(ii) (iii)
FIG.3-7
Glass Hooks

70
Cleaning of the tube
The outer surface of the tube requires
careful cleaning as slight contamination at any point
inhibits the diffusion of hydrogen and gas formation
commences. It has been found that the cleaning method (21)
greatly influences the permeation rate through such tubes.
Anodit oxidation, argon bombardment and heating have
been studied in this connection-(21) . Cleary and Greene(22)
prepared the surface by abrading and oxidizing in air at
800° C. In the present work, it was found that Silver-
palladium tubes can be simply and effectively cleaned with
warm Teepol and Ajax solution.
Volume change studies
A second important aspk)ot studied was the
volume change during the electrolysis, a factor which
directly concerns the use of such electrodes in the
closed compartment of a moving boundary experiment. It
has already been mentioned that palladium undergoes a
volume increase when it absorbs hydrogen and so it was
expected that the silver-palladium tube would show similar
behaviour. Accordingly dilatomotric experiments were
carried out with 0.02 M HCl or 0.02 M HOAc 0.1 M NaC1
solutions, a silver anode and a silver-palladium cathode.
The dilatometer cell and the arrangements within are
shown in fig. 3-8 . The cell was immersed in a thormo-
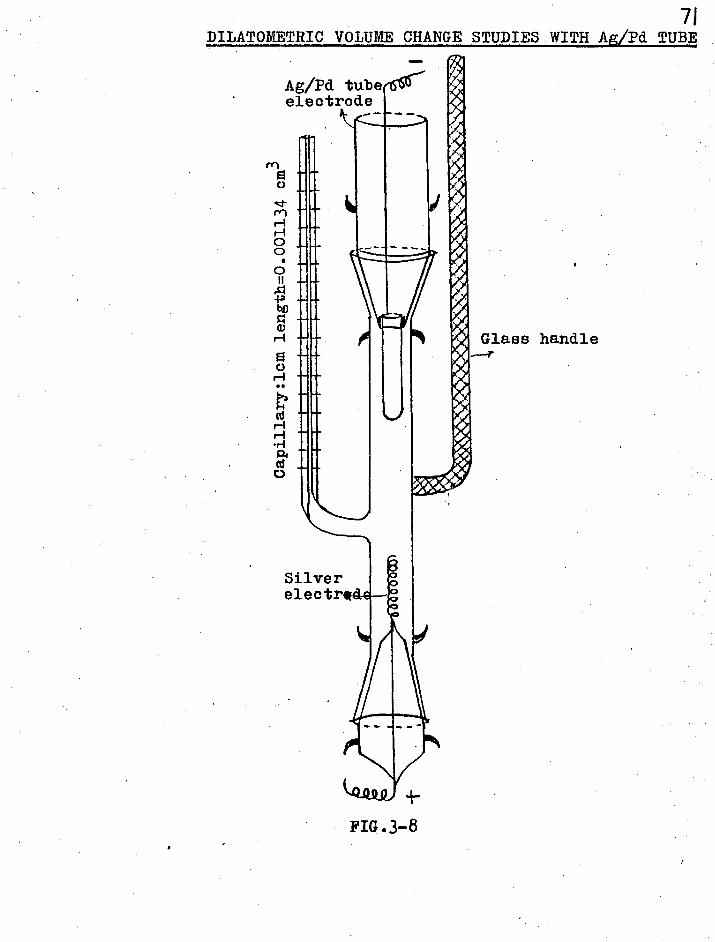
maw
1. •
.16
-r 4-
Capil
laryacm
71 DILATOMETRIC VOLUME CHANGE STUDIES WITH Ag/Pd TUBE
Ag/Pd tube,665-- electrode
imm
Glass handle .---r
Silver electr'd

72
statted bath at 25° C in such a way that the uppermost.
glass tube end of the silver-palladium electrode was
exposed to air.
On passing - the current, the electrode.
reactions are
Ag + Cl Aga + e H+. e- H(Pd)
That part of accompanying volume change that can be
unambiguously calculated is
V = VAgel VAg - 12.HC1 = 25.78 - 10.27 - 18.25
= - 2.74 cm3/faraday.
If hydrogen just diffuses through the
tube without affecting its volume, the volume change
would be only that calculated above. However, the expe-
rimental observations shown in fig. 3-9 (i)-(iv), in
which rise in level plotted against.tipc,:clearly
indicated that the silver-palladium tube undergoes an
increase in volume on dissolving hydrogen. In fig. 3-9,
(i) and (ii) AL represents the volume change with 0.02 M
HCl solution using 4 cm long. silver-palladium tube.
Similarly fig. 3-9, (iii) represents the change in
0.02 M HOAc + 0.1 21NaC1 solution. The change in ,all the
three experiments is reproducible within experimOntal
error and is independent of the method of cleaning
employed. However, observations could not be carried

2
1
0 5 6 7 8 9 Time(hours)
0.02M HC1,0.9mA Electrode(ii)teepol Vol.increaste=13a/f
aning aday
0.02M HOAci-0.1M NaC1,0.9mA Electrode(ii)teepol cleaning Vol.increase=13cm/faraday
iii) 2
1
4 I 1
9 Time(hours) 0
0.02M HC1069mA Electrode(ii)anodically cle Vol.increase=13cOVfarada
FIG.3-9,(i)
73
VOLUME CHANGE _EXPERIMENTS WITH Ag/Pd ELECTRODE
FIG.3-90(ii)and(iii)
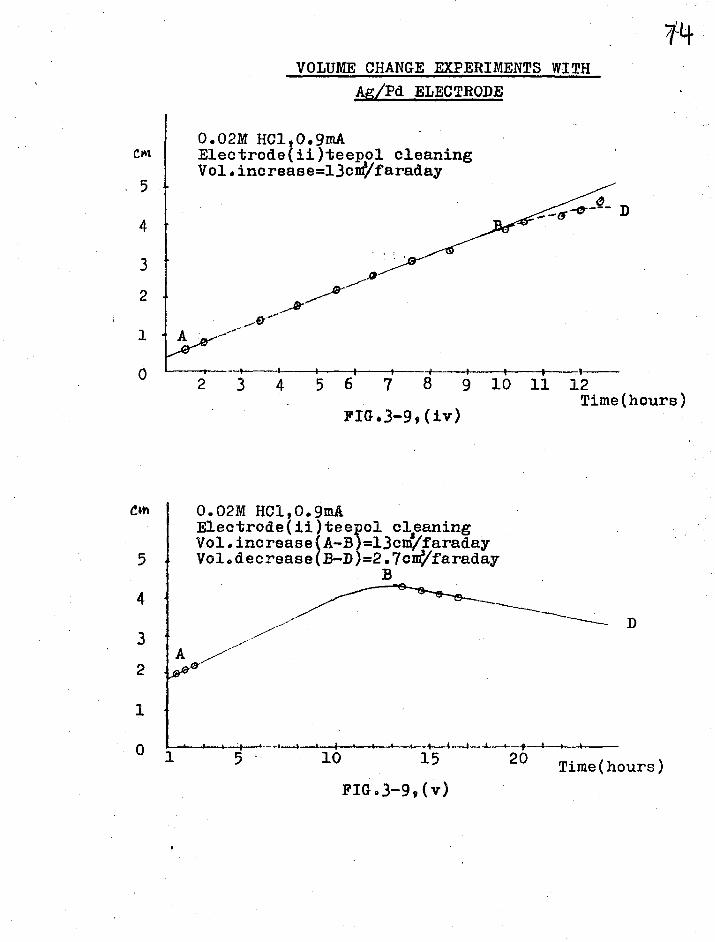
D
-1-- 6 7 8 9 10 11 12
FIG.3-99(iv) Time(hours)
71+ VOLUME CHANGE EXPERIMENTS WITH
Ag/Pd ELECTRODE
0.02M HC1,0.9mA Electrode(ii)teepol cleaning Vol.increase=13cmffaraday
Cm 0.02M H01,0.9mA
5
Electrode(ii)teerl cleaning Vol.increase(A-B =13cm/faraday Vol.decrease(B-D =2.7cMffaraday
4 D
3 A
2
1
0 ti"At 4 ° 1 5 ' 10 15 20 Time(hours)
FIG.3 -99(v)

em.
VOLUME CHANGE EXPERTMENTS WITH Ag/Pd ELECTRODE
0.02M HC1,0.87mA Electrode(i)teepol cleaning Vol.increase=13cd/faraday
2
0 1 2 3 4 5 6
7
9 10 Time(hours)
FIG.3-9,(vi)

76
out beyond five hours as the silver chloride formed
became detached from the silver wire and dispersed into
the solution. This contaminated the silver-palladium
tube surface and gassing started. For this reason the
surface area of the silver electrode was increased:by
using a long wire manipulated into a spiral shape.
Fig. 3-9 (iv) represents the observations over a period
of eleven hours which again gave the same initial volume
change as observed in the previous. three experiments.
The marked change in the slope BD indicated that the
tube had reached a steady state and was not swelling any
further. It was, therefore, inferred that after reaching
saturation point, the excess hydrogen diffuses out
without affecting the volume any further. Fig, 3-9, (v)
in which the saturation stilta ,isJ much pronounced,
support the aboVe idea. What is even more important is
that the slope BD corresponds exactlyuto.•the volume change
expected from theory. It is interesting to note (fig.3-9,
(iv) and (v) ) that the saturation state in the 4 cm
long tube was reached after passing 45 coulombs. To check
this further, another experiment was carried out with a
1.2 cm long silver-palladium tube. Fig. 3-9, (vi) depicts
the observations Over twelve hours in which saturation
occurs only after passing about 15 coulombs-- one third
of that required to saturate 4 cm long tube. However,

77
the. slope BD was found much less than that Observed in
fig. 3-97 (v). The reproducible increase in volume (slopeAB)
before reaching saturation point in all the experiments
was found to be cm3 / faraday. This suggested the
use, in a transferenCe experiment, of a tube long enough.
to require more coulombs before saturation than does the
length of the moving boundary experiment.
Transference runs with a silver-palladium cathode
Transference runs were carried out with
a 6 cm long silver-palladium tube which would require
67 coulombs for saturation. The amount of electricity
needed for the transference runs in 0.02 M tartaric acid
and 0.01 M picric acid were roughly 20 and 12 coulombs,
respectiVely. This big safety margin assured that the
tube would be in the swelling stage throughout the run.
Consequentlyl higher results were expected corresponding
to an electrode volume increase of _,15 cm3 / faraday.
The actual - ransforence: values obtained
in three such runs are given in table 3-D . They show a
rapid downward, progression in each case. The first few
values are close to the expected range but as the run
proceeded the velocity of the boundary gradually decreased.
What caused this progression is not clearly
understood, One reason postulated was that some ions
resulting from the electrode reaction at the tube crossed

78
TABLE ,3-D
TRANSFERENCE NUMBERS WITH Aa/Pd ELECTRODE
-....."
Marks '. passed
a 0.02M HDie 1.15 mA
without extension
.... 0.02M H T 0.33 la without extension
0.01M Hpic 0.78 mA with
extension
1-2 0.07620 0.07393 0.07666
2-3 0.07564 0.07357 0.07655 3-4 0.07537 0.07358 0.07633 4-5 0.07547 0.07315 0.07643 5-6 0.07556 0.07320 0.07604 6-7 0.07485 0.07326 0.07605 7-8 0.07462 0.07308 0.07606 8-9 0.07494 0.07297 0.07564
Expected 0.07620
0.07400 0.07600
* Transference values with silver succinate
corrected for volume increase of 15 cm3
per faraday in the silver-palladium electrode.

79
the boundary and so slowed down its velocity. However,
use of an extended electrode section gave the same kind
of progression.bUt higher initial values than expected.
Lead succinate
The compound was found -to be a non—gassing
cathode by Selvaratnam (23) _and was prepared (24) by
adding together filtered solutions of lead acetate and
succinic acid. The precipitate was thoroughly washed with
conductivity water on a sintered funnel and then many
times with succinic acid solution and was stored in the
same solution.
In the initial stage of the work this
electrode was used with Apiezon L grease in moving
boundary runs with picric acid solution. The values.
obtained were inconsistent and were thought to be due to
the lead succinate. This lead to a change over to silver
succinate which had been shown to work by Selvaratnam
and Spiro (25). Later, Apiezon L grease was found to be
adsorbing picric acid and was the real cause of incon—
sistency 'in the transference values. As a result, lead
succinate was tried again with silicone grease and gave
comparable values with that obtained using silver succinate
(see chapter 1V) .

80
Silver succinate
This electrode was first used by Selvaratnam
and Spiro (25) in their studies on orthophosphoric acid.
Their method of preparing this electrode was adopted and
used throughout the present work. The method involves
digesting silver oxide in warm 2M acetic acid, filtering
the solution and adding a concentrated solution of succinic
acid to the filtrate. The precipitate so obtained was
thoroughly washed with conductivity water on a' sintered
funnel and was kept in succinic acid solution in the dark.
It was aged (25) for at least two weeks before being used
in any run.
The solubility (26) of silver succinate
in water at 25° C is 6 x 10⁻⁴ mole/litre which is too
small to expect any considerable volume change when it
goes into solution, This has been experimentally confirMed
(27) by carrying out dilatometric experiments. However, its
solubility in succinic and acetic acids is greater and
was theoretically estimated and experimentally determined.
Calculation of solubility in succinic acid
(1)
4hen silver succinate is put into water, the
equilibrium in solution is,
Ag2Succ(S)
2Ag+ + Succ- (3-6-1)
Succ + H2O
ESucc + OH (3-6-2)
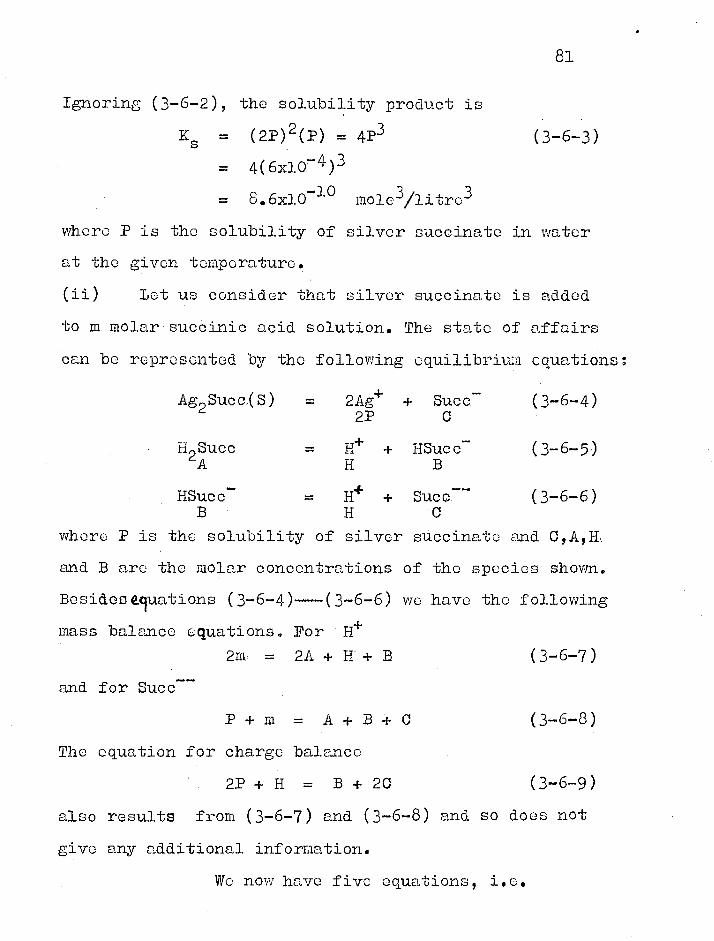
81
Ignoring (3-6-2), the solubility, product is
Ks = (2P)2(P) = 4P3 (3-6-3)
= 4(6x1074)3
= 8.6x10⁻¹⁰ mold/litre3
where P is the solubility of silver succinate in water
at the given temperature.
(ii) Let us consider that silver succinate is added
to m molar'sucCinic acid solution. The state of affairs
can be represented by the following equilibrium equations:
Ag2Succ.(S) = 2Ag+ + Succ- (3-6-4) 2P C
- + H + HSucc H2Succ = (3-6-5) A H B
HSucc- = H+ + Succ7- (3-6-6) B H C •
where P is the solubility of silver succinate and C,A,H..
and B are the molar concentrations of the species shown.
Besideceluations (3-6-4)—(3-6-6) we have the following
mass balance equations. For H+ 2m, = 2A + B (3-6-7)
and for Succ--
P + m = A + B. + C (3-6-8)
The equation for charge balance
2P + H = B + 2C (3-6-9)
also results from (3-6-7) and (3-6-8) and so does not
give any additional information.
We now have five equations, i.e.

from (3-6-15) _ in 2 + mK1K/0 = K2KJC -
• (3-6-13),we have
4K2C(Ks/C)2 + 4K20 2
82
(3-6-4)---(3-6-8), and five unknowns, Pi 0, A, H and.
B To calculate tho solubility of silver succinate
we must solve those equations simultaneously as
follows. From (3-6-4) Ko = (2P)20
(3-6-4a)
From (3-6-5) and (3-6-6), neglecting activity coefficientpi
we have
K1 = HB/ A
(3-6-5a)
K2 = HQ/ B
(3-6-6a)
From ( -6-5a) and (3-6-6a)
H
• ••• A
KlA / B = K2B / C
K2B2 / K10
( 3 - 6 - 1 0 )
( 3 - 6 - 1 1 )
From (3-6-4a) we have
i(Ks / 0)71-
Substituting A from (3-6-11)
(3-6-8)1 we get
(3-6-12)
and P from (3-6-12) in
m = K2B2/k1 B + C EKr/C)2
(3-6-13)
Putting P from (3-6-12) and H from (3-6-10) in
(3-6-9), we got
K /0)2 = B + 20 - K2B/0
(3-6-14)
0 •
• B = (Ks/C)2 - 20 /Q. - K2/0) (3-6-15)
Substituting B
m K10 - 2mK1K2
- 2K1 K,C + K1K22
K1(Ks)2(o) - IK1C(Ks/C) z + K1K2(Ks/0)(K1K2/2C)(Ks/C)2-
2K102 - K1 K2 (K s )(0)71 + 21(11(20 + K,C2 1 1
1 2 '
(3-6-16)

83
which after simplifying and rearranging gives
C7/2(1-4K2/K1) + m05/2 - C2(Ks 2 A(-4K21).C3/2(K2)(2m+K2)
d2(K2)(Ks/K1-mK2) = 0
(3-6-17)
Using K1=6.21x10⁻⁵ (28) and K2=2.31x10⁻⁶ (28),(3-6-17)
was solved by successive approximatiOns . This gave
C=0.631x10⁻⁴ for m=0.01 M and C=0.442x10⁻⁴ for m=0.02 M
Hence P was calculated from (3-6-4a) to be 1.89x10⁻³
and 2.21x10⁻³ mole/litre respectively.
Solubility in suecinic and acetic acids by e.m.f. measurement
E.m.f. measurement was found to be a very
convenient method for determining solubility. Accordingly,
saturated solutions in 0.01 M suecinic and acetic acid at
25°C were prepared by stirring excess Silver succinato
into these acid solutions. The conical flask containing
silver succinato and acid solution was kept in a thermostat
at 25°C and stirring was carried out for 24 hours.
The e.m.f. was measured by setting up
the following cell
Ag I H2Succ or HOAc KNO3 KCl I Hg2C12 I Hg + Ag2Succ satd. i
The experimental set-up was first chocked by using 0.0112M
silver nitrate solution. The concentration of silver ions
in this solution, ( neglecting activity coefficient )
corresponding to the measured e.m.f. of 0.442 volt, was

84
found to be 0.012 M
The o.m.fs of the cells at 25°C with
saturated solutions of silver succinatc in succinic and
acetic acid solutions were found to be 0.414 and CL422 volt'
respectively.
From
= E° + RT/11 In ak.; - E - Cal(satd)
the concentration of silver ions ( neglecting activity
coefficient) was found to be :
3.8x10⁻³ M in 0.01M succinic acid
5.2x10⁻³ M in 0.01M acetic acid
The silver ion concentration found in 0.01 M succinic acid
thus gives a solubility equal to 1.9x10⁻³ mole silver
succinate/ litre which agrees very well with the calculated
value of 1.89x10⁻³ mole/litre.
The calculations were further checked
up by comparing the calculated hydrogen ion concentration
with that obtained by pH measurements. Thus pH value of
silver succinato solution in 0.011M succinic was found
to be 3.72 which corresponds to a hydrogen ion concentr-
ation of 1.9x10⁻⁴ mole /litre. Calculated value was
1.4x10⁻⁴ mole/litre which agreed within same limits as
does silver_ion concentration.
Similarly, the measured concentration of
5.2x10⁻³ mole/litre in 0.01M acetic acid yields a solubility
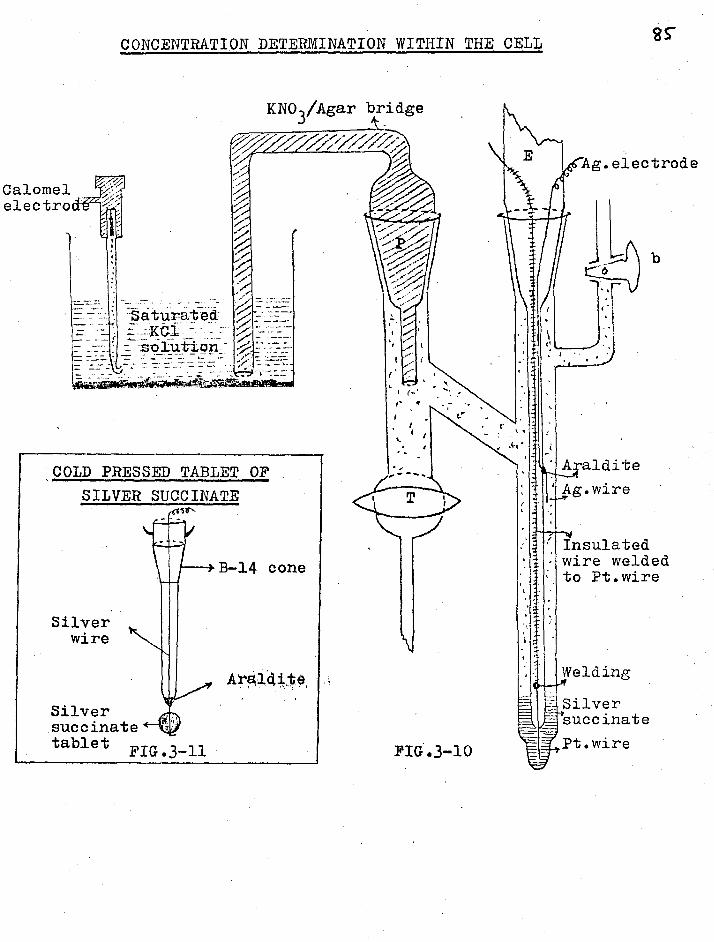
CONCENTRATION DETERMINATION WITHIN THE CELL 2S"
KNO3/Agar bridge
Ag.electrode
Calomel electro
aturate
m-olution
Ag.wire COLD PRESSED TABLET OF
SILVER SUCCINATE
Insulated wire welded to Pt.wire
FIG.3-10
-Welding
Silver succinate
Pt.wire
Silver succinate tablet FIG.3-11

86
of 2.6x10⁻³ mole/litre. The higher solubility value in
acetic acid is not unexpected as there are no common ions
to suppress the solubility of silver succinate even
though the hydrogen ion concentration is less than in
succinic acid solution.
Concentration determination within the moving boundary cell
The calculations and experimental. values
given above refer to the saturated solutions. However, in
the actual runs silver succinate was very carefully
introduced (see section 3.8 ) into the moving boundary
cell without allowing undue mixing. The concentration of
the dissolved silver succinate would therefore be far
lower than in saturated solution. It was therefore
desirable to know the extent to which it goes into the
solution during an actual transference run. Since c.m.f.
measurement indicated greater solubility in acetic acid
solution, it was decided to determine the concentration
of silver succinate when 0.02 H acetic acid was used as
the following solution. To do this, a cell was set up
within the moving boundary cell (fig. 3-10) and its c.m.f.
was measured. For this purpose, the normal cathode
(electrode E), whose platinum tip was immersed in the
silver succinate slurry, had a second electrode- a
silver wire -- sealed into its zide with araldito. •The
height of the silver wino was such':as to find the concon-

87
tration of silver ions in the middle of the closed cathode
section. It is interesting to note that during the run
platinum wire becomes plated with silver and thus two
silver electrodes wore available prefixed to measure the
c.m.f. ono inside the silver succinate itself and
another in the mid-section of the compartment
Immediately after the run tap T was closed
and b opened. The stopper in position P was replaced by
a 3% agar in 1M KNO3
bridge, the other end of which was
dipped into a saturated solution of potassium chloride.
Calomel was the reference electrOde of the coll. The same
cell as before was thus scat up without disturbing the
silver succinato which would have otherwise dissolved
much more. The observed e.m.fs,when 0.02 M acetic acid
was used as the following polutionlwere:
(i) within silver succinatc(i.e. saturata_ solution)
-E = 0.426 volt
at mid-position of the Compartment
E = 0.314 volt
The corresponding silver ion concentrations, :.ignoring
activity coefficients, were 6.1x10⁻³ and 7.9x10 5mole/litre
repectively. The lattor value gives the solubility,t0 be
3.95x10⁻⁵ mole silver succinato/litre.
The volume change per litre would
therefore be
88.5 x 0.00004 = 0.00354 cm3

88
where 88.5 is the volume of ono mole of silver succinate.
The volume of the closed section was roughly 50 ml and
thus the volume change during the run would be only
0.0002 cm3. This change is obviously too small to effect
the transference values. It is apparent that the volume
change would be still less with succinic acid following
solution. We can, therefore, safely assume that the trans—
ference numbers would not be effected due to this
dissolution.
Cold pressed silver succinate
The experimental difficulty, encountered
in using silver succinate in the powder form, led to the
idea of moulding it into a compact solid rod or tablet.
From dried powdered silver succinate some tablets were
made ( by Mr. N. A. Javed in the metallurgy department )
under eight tons pressure and at room temperature. These
tablets retained their shape and compactness even in 1M
following acid solutions.
Each tablet was lcm in diameter and about
cm thick with a fine hole drilled along its diameter. A
silver wire, having ono end sealed into a glass tubing
with araldite, was passed through the hole to suspend the
tablet in the solution. Fig.3-11 represents such an
electrode.
Before - use, the electrode was immersed

89
in the following solution and was subjected to vacuum to
remove all the air trapped in the -.)ores of the tablet.
When complete degassing was ensured, it was used in the
transference run. Values were consistent with those
obtained from the runs using silVer succinate powder with
extended cathode section. For cou iarison, transference
values in 0,02 E H2T with 0.027 HOAc as following
solution are presented below:
using silver succinato powder, THT = 0.07369 at 0.37 Zak
using silver ouccinato tablet, TIT = 0.07373 at 0.34 mA
3.7 PREPARATION OF SOLUTIONS
All solutions were prepared using
conductivity water obtained by rodistilling distilled
water with alkaline Kiln00 . Redistillation was carried
out in a pyrex class still which had boon "pickled" in
concentrated hydrochloric acid. Only the middle fraction
was collected which had a si)ecific conductance between
0.8 and 1.2x10⁻⁶ ohm-1 1 cm • .
Before filling the cell, all solutions
were degassed by subjecting them to vacuum for 10-15
socands.Thi6 stopped bubble formation in the cell due to.
the difference in the solubility of air between room and
bath temperature. •

90
Picric acid
B.D.H. A.R. grade picric acid was
transfed on to a filter paper and the water partially
removed by suction. It was then dissolved in warm, ethyl
alcohol (40-50°C) and filtered while hot. The filtrate
was cooled in an ice bath and the pale-yellow crystals
so obtained were washed with cold alcohol on a Buchner
funnel. The process was repeated twice more. The picric
acid crystals wore dried Over silica gel in a vacuum
desiccator for many days. The dried sample had a melting
IJoint of 122-123°C (literature value = 122.5°C (29) ).
It was stored in a coloured bottle and was always kept
in the dark over silica gel.
Picric acid solutions, made D at 250 up C,
were prepared by weight in large (1000 ml) calibrated
volumetric. flasks whose outer surface had been painted
black to prevent photo-decoMposition (30). solutions,
exposed to light and those older than a week, gave higher
results (coo chapter 1V). Every possible precaution was,
therefore, taken to avoid exposure to light. The light
source used to follow the boundary was switched off except
for the actual period required to time the boundary past
a calibration mark. No solution was kept for more than
a week.

91
D(+ Tartaric acid
B.D.H. A.R. grade D(+) tartaric acid
was recrystallisod twice from water and was dried for
several weeks over silica gel in a vacuum desiccator
at 50-60°C
When dried; its molting point -was found
to be 170°C .( literature value (31) = 160-170°C ) .
Every solution; made up to the mark,
contained 5m1 of 0.001M thymol per litre to prevent
bacterial decomposition (11) of the acid. As a precau-
tionary measure, solutions older than three weeks
were not used in transference runs.
Acetic and succinic acids
A.R. quality of those two acids, without
further purification, was used to prepare their solutions.
As the following solution, in a falling boundary cell,
is always above the leading one, it should be lighter.
The concentration , therefore, was always kept below
the Kohlrausch concentration to avoid gravitational
instability.
3.8 CELL FILLIKG
The cell was firmly clamped on a retort
stand and the taps, greased with silicone stopcock
grease, were inserted. The anode section was carefully
rinsed twice with degassed leading solution to allow

92
adsorption (32) of the acid on the glass surface. It was
then filled to a little above the stopcock T and the
air bubbles sticking to the grease around tap T were
removed with the help of a platinum wire introduced
through B: After this; stopcock T was closed, and some more solution was poUrcd in to bring the level up to Q. A
platinum wire anode was introduced through A and the side
tap a was kept open to allow the escape of oxygen
evolved during the run.
Excess leading solution above the stopcock
T was sucked out with a jot connected to a vacuum pump.
The cathode section was thoroughly washed with conductivity
water and then many times with the following solution to
ensure complete removal of loading solution from this
section. The cathode section was then half filled with the
following solution and the tricky procedure of introducing
silver subcinato was carried out as follows:
(i) Degassed silver succinate slurry(in the
following solution) was sucked up into a
pipette from the stock container and the outer
surface of the pipette was cleaned with the
paper tissues.
(ii) The pipette was then introduced into the cathode
section(half filled with the following solution)
and was lowered as far as possible. The pressure

93
was than slowly released.
(iii) Mien the required quantity sufficient to
keep the half-inch long platinum wire electrode
covered throughout the run hadbeen delivered,
the flow was stoq-ood and the pipette was
carefully drawn out without touching the walls.
In this way silver succinatc was neatly
placed in the closed section without allowing undue mixing
and dispersion of silver succinate•in the following
solution. Settling of the precipitate was effected by
tapping the section and allowing it to stand for 20-30
minutes. Some more following solution was run gently down
the sides of the compartment to fill the section completely
without disturbing-the silver succdnate. 'Finally a carefully
greased stoDper and the -olatinum wire electrode were firmly
placed in positions and C respectively, and fastened in
position with small springs attached to glass hooks.
The outer surface of the cell was dried 'with
paper tissues .and the outside of the moving boundary
tube cleaned with methylated spirits and carbon tetra-
chloride. The call was clamped at two positions (to avoid
vibration) on a specially-made stainless steel stand,
which was lowered into the thermostat. After thermal
equilibration for half an hour, the side tap b was closed,
stopcock T opened and the current was switched from the

94
dummy resistance into the cell.
A run
The time taken by the boundary to pass
by all the twelve calibration marks depended on the
concentration of the leading solution and on the
current. Some runs took 50-60 hours while shorter runs
were over within 5-6 hours.
As the boundary passed any etch mark,
the time was noted on a battery operated 'Secticon'
clock. Since it was difficult to see the boundary as
it passed the etch mark and simultaneously to note the
time, a metronome clicking at 60 beats a minute was
used as well. Immediately after noting the time, the
potential drop across the 1000 ohm standard resistance
was noted. Besides these two readings, the temperature
fluctuation was checked on a Beckmann thermometer
every time the boundary passed the etch mark.
Details of a typical run, which was
carried out with picric acid solution, are given on
the next page.

95
March 30, 1966
Run 26
Leading solution picric acid 0.0101CM
Following solution _succinic acid 0.0191',1
Non-gassing cathode silver succinate(closed)
Anode platinum wire (open)
Grease silicone stopcock grease
current into the cell- 0.6mA at 6.30 p.m.
Light kept on for about two minutes for each reading
Etch mark Time
t
Current (mA) I
Temp. Beckmann
1 8.03.36 0.60217 3.66
2 8.22.55 0.60212 3.66
3 8.42.51 0.60207 3.66
4 9.01.02 0.60203 3.66
5 9.20.23 0.60197 3.66
6 9.38.17 0.60191 3.66
7 10.43.45 0.60170 3.66
8 11.03.10 0.60163 3.66
9 11.22.42 0.60156 3.66
10 11.40.37 0.60151 3.66
11 12.01.19 0.60142 3.66
12 12.21.23 0.60135 3.66

96
Etch marks Volume (ml)
Ixt (coulombs)
Tfic
1-7 0.44634 5.1841 0.07576
2-8 0.44649 5.7871 0.07575
3-9 0.44551 5.7721 0.07578
4-10 0.44450 5.7619 0.07574
5-11 0.44863 5.8100 0.07580
6-12 0.45430 5.8876 0.07576
Average Tpic = 0.07576
Solvent correction = 0.000006
Volume correction = 0.000017
TPic = 0.07578 at 0.60mA •
• •

97
3‘9 CELL WASHING
After each run the cell was checked for
the-presence of gas bubbles, and the outer surface was
washed free of oil with CC14 Most of- the grease on the
taps was first wiped off with paper tissues and every
greased surface was carefully cleaned with tissues
moistened with triethylamine.The anode section was the half
filled with triethylamine which was- pushed up and down
in the moving boundary tube with a teat attached to the
open end A. This operation removed any trace of grease
in the moving boundary tube. The process was repeated.
three times, and was followed by three washings with
Sulphuric-chromic cleaning mixture. Afterwards, the cell
was thoroughly washed several times with distilled water
and finally with conductivity water. It was then clamped
in an inverted position and left overnight to dry.
Complete dryness was achieved by passing, for about
thirty minutes, commercial nitrogen dried by passing
through towers of silica gel, calcium chloride and char-
coal in that order.

9g
REVERENCES
Chapter III
(1) A.R.Gordon and R.L.Kay, J.Chem.Phys.,21,131(1953)
(2) J.E.Notley, Ph.D.Thesis,London University.,(1965)p.104
(3) M.Spiro,Techniques of Organic Chemistry,vol.1,part IV, p.3049Jnterscience Publishers Inc. New York,1960.
(4) J.I.Notley and M.Spiro, J.Phys.Chem.,70,1502(1966)
(5) G.M.Steinberg, Chemist-Analyst,48,20(1959)
(6) Ref.(3),p.3071
(7) R.A.Robinson and R.H.Stokes,Electrolyte Solutions, 2nd Edn.p.463, Dutterworths Publications Ltd., London, 1959.
(8) D.A.MacInnes and M.Dole, J.Am.Ohem.Soc.,53,1357(1931)
(9) J.C.Bird and A.Barol,J.Am.Pharm.Ass.,2,996(1934)
(10) A.Seidell,Solubilities of Inorganic and Metal Organic Compounds,p.23, D.Van Nostrand Co,Inc.New York.1940.
(11) lih.Marsh,M.Spiro and M.Selvaratnam,J.Phys.Chem., 67,699(1963)
(12) K.Sugino, Bull.Ohem.Soc.Japan.,23,115(1950)
(13) V.Umland and K.Kirchner,Z.Anal.Chem.1143,259(1954)
,(14) M.Fleischmann, Direct Current,6953 (1961)
(15) A.Fleischmann and H.Lilor,Trans.Paraday Soc.,549 137Q (1958)
(16) Handbook of Chemistry and Physics,45th.Edn.p.B-186, The Chemical Rubber Co.
(17) T.Graham,Proc.Roy.6oc.,15,223(1866)
(18) H.J.Emeleus and J.S.Anderson,'Aodern ilspect of Inorganic Chemistry,2nd Edn.p.292,Routledge and Kegan Paul Ltd, London,1952.
99
(19) S.Schuldiner1 J.1iaectrochem.30c.999,488(1952)
(20) S.Schuldiner,Nature11859 526(1960)
(21) D.N.Jewett and A.C.Makrides,Trans.Faraday Soc., 61,933(1965)
.(22) H.J.Cleary and N.D.Greene,Electrochim.Acta, 10,1107(1965)
(23) M.Selvaratnam,private communications(1965)
(24) FR.Auerbach and H.Weber,Z,Anorg.Allgen.Chem., 147,68(1925)
(25) 'N.Selvaratnam and N.Spiro,Trans.Faraday 61,360(1965)
(26) Ref.(10),p.22
(27) M.Selvaratnam,Ph.D.Thesis,London University.,(1964), p • 79
(28) Ref.(7),p.521
(29) Dictionary of Organic Compounds,vol.IV,p.79. Eyte and Spottiswoodo(Puiplishers)Ltd,London,1965.
(30) W.Jaekel,Z.Phys.Chem.(Leipzig)7207,296(1957)
(31) Ref.(16),p.C-558
(32) D.J.G.Ives and P.G.N.Moseley,J.Chem.Soc.,P,757(1966)
100
CHAPT-R IV
TRANSFERENCE RESULTS IN PICRIC ACID SOLUTIONS
4.1 INTRODUCTION
In the past, various attempts have
been made to determine the dissociation constant of
picric acid in water. The values obtained by different
methods, displayed in table 4-A, range from 0.15 to
a recently reported value of 2 mole/litre.
The spectrophotometric method has
frequently been used for this determination. Halban
and Ebert (1) in their earlier experiments reported a
K value of 0.151 using 0.116M HC1 as suppressor at
450 nap, Their later studies (2) with 0.0084 -
0.117 M HC1 at 436 my._ produced a much higher value • of 0.355. Bates and Schwarzenbach (3) used higher
HCl concentrations (0.1 - 4M) and selected 356 41
as the analytical wavelength. They obtained K=0.51.
Willi and Muni (4) indicated the
possibility of interaction of picric acid with the
HC1 used to suppress its ionisation. They employed
HC104 instead and obtained K=0.42 which was supported
by a similar determination by McDougall and Long (5)
who reported a value of 0.42 as well. The spectro-
photometric studies by Davis and Paabo (6) indicated

101
TABLE 4-A
DISSOCIATION CONSTANT OF PICRIC ACID IN ••_ THE LITERATURE
, Temp./ oc Conc. Range (M)
Method K Ref.
) 25 0.00997-0.0399 Spectrophotometric 0.151 (1) It 0.00194-0.00204 n 0.355 (2) It 0.00005 li 0.51 (3) I, - It 0.42 (4) U - It 0.42 (5) n 0.00005004-0.00502 n 0.46 (6) n - a Conductance 0.20 (10) n 0.000184-0.004347 b n 0.60 (11)
U 0.002358-0.00441 c n 0.196 (12) 11 0.0001115-0.00334 d n 2.0 (7) II 0.03-0.05 Catalysis 0.32 (15) 18 0.002079-0.03342 Distribution 0.164 (14)
Worker Equation Ao
a Neale Limiting 376 Results show a trend' b Kortum & Wilski
c Dippy, Hughes
Limiting
Fuoss.
380./1/1
and Laxton d Ives and Moseley
extrapolation Fuoss-
385.5
Shedlovsky 380.20 This value corres-p8nds exactly to _X pi-6=30.39.
gil-c -0, 13 - con-atotance otudies on salts (16)

102
K=0.46 with 0.1-1.0 M HCl at 450 my. This value
agreed well with that described above. Recently, Ives
and Moseley (7) reported a spectrophotometric obser-
vation different from that of Davis and Paabo. They
did not give their spectroDhotometric K value but sup-
ported the earlier suggestion (8) of complexity within
picric acid solution by their own conductance and light
absorption experiments in the visible and U.V regions.
This effect coupled with the photosensitivity (9) of
picric acid makes spectrophotometric values doubtful.
The dissociation constants obtained by
conductance measurements in the literature disagree
with each other and with those determined spectro-
phometrically (see table 4-A). Neale (10) obtained
K.0.2 and A°.376 while Kortum and Wilski (11) got
K=0.6 and A°=380.44. Dippy, Hughes and Laxton (12),
using A°=385.5 obtained K=0.196. The difference in
o . A is as large as 10 conductance units and indicates
some source of error that prevents reproducibility
of the results. Ives and Moseley (7) have shown that
the discrepancy in the earlier conductance measurements
is due to the absorption of picric acid on the glass
surface of the cell and some sort of complexity in
103
solution. Their conductance values show a deviation
from the D-H-0 limiting equation right from the lowest
concentration studied and this is pronounced beyond
0.00156 M, with the plot showing.a kink. The deter-
mination yielded K=2 which is higher than any previous
value.
Their conductance data and those of
Dippy, Hughes and Laxton were re-examined by the present
worker using the Robinson and Stokes equation (1-1-15),
and K was calculated by equations (1-1-14) and (1-3-8).
Every conductance result was corrected for viscosity
(see later) and successive approximations were made
to calculate a accurately. The calculations were
carried out on the Atlas computer and the program is
given in the appendix 2. The K results calculated for
different a parameters are given in table 4--B. The
figures show a trend at every a value but the mean
recalculated fibure of K is closer to the results
given by other workers than was the original one. A
mean value of K=1 with a=5A was chosen for the sub-
sequent calculations. Nevertheless, a mean spectro-
photometric value of K=0.5 was always used as well for
comparison.

104
TABLE 4-B
DISSOCIATION CONSTANT OF PICRIC ACID WITH DIFFERENT a VALUES
Conc. (M)
x 104 L
cm2ohm-1equiv-1
K, mole/litre
a= 4 a= 5 a= 6 a= 7.6
a
2.20032 377.98 2.27 1.82 1.48 1.14 2.95785 377.57 1.10 0.97 0.86 0.73 3.61594 377.33 1.83 1.44 1.25 1.00 4.89684 376.92 - 3.64 2.49 1.67 7.09948 376.16 1.99 1.58 1.32 1.05 7.41178 376.05 1.70 1.41 1.20 0.97 7.76756 376.02 3.10 2.22 1.74 1.29 10.0923 375.42 2.89 2.12 1.68 1.26 11.9719 374.92 1.96 1.58 1.32 1.04 15.6572 374.05 1.48 1.24 1.08 0.90 18.0485 373.60 1.57 1.31 1.12 0.93 19.4084 373.07 0.95 0.84 0.76 0.67 22.8707 372.35 0.88 0.80 0.72 0.63 23.1110 372.47 1.08 0.95 0.85 0.73 24.6530 372.29 1.24 1.07 0.94 0.80 30.0804 371.14 0.92 0.83 0.75 0.66 33.4074 370.52 0.86 0.77 0.71 0.63
b
23.5800 374.40 - -0.66 -0.72 -o.84 25.4800 373.90 - -0.88 -0.99 -0.22 38.9400 370.10 - 1.06 0.94 0.80 40.2400 369.80 - 0.96 0.87 0.75 44.1000 369.00 - 0.81 0.74 0.65
a Ives and Moseley conductance data.
b Dippy, Hughes and Laxton data.

105
4.2 PRELIMINARY EXPERIMENTS
Transference numbers in aqueous picric
acid solutions were determined in 1928 by T. Erdey-Cruz
(13) by the e.m.f. method using the cell
Pt(H2)/0.04HPic/0.004M HPic/Pt(H2)
The corresponding cells, reversible with respect to
picrate and without transport were obtained by using
Hg2Pic2tlig electrodes. From only one set of picric acid
solutions (indicated above) Tpic 0.089 was obtained.
Thus instead of using the relation Tpic.dEt, Tpic
dE was assumed to be constant in the concentration range and
T = dEt Pic —y— was used. The results are therefore not
accurate enough.
Since the moving boundary method was
to be used for the first time, ,ouch preliminary work,
pertaining to the selection of non-gassing electrodes and
following solutions, was needed. The electrodes have
already been described in section 3.6 and the other
necessary factors affecting the accuracy and the consis-
tency of the present determinations will be discussed in
the present section.
Selection of the following solution
To select a suitable indicator solu-
tion for picric acid, equations (2-2-11) and (2-2-12)

106
were utilized as a criterion. Although the anions
in each case had a greater equivalent conductance than
Pic, the dissociation constant was always much lower
than that of picric acid so that the necessary stability
conditions were fulfilled. Table 4-C lists all the
acids used with X° and K values.
The state of the boundary, when 0.03 N
picric acid solution was followed by these acids at
the Kohlrausch concentration, is given in table 4-D.
The sharpest boundary was obtained
with formic, acetic and propionic acids at relatively
low currents. Boundaries with succinic, phosphoric and
tartaric acid were fairly sharp but only at higher
currents. No boundary could be seen with oxalic acid
in the falling boundary cell, probably because of
gravitational instability.
Acetic and succinic acids were finally
chosen for the runs, the former for runs at lower
currents and the latter to suppress the solubility of
silver succinate (see section 3.6).
Factors influencing the transference results
After selecting acetic and succinic
acids as the indicators, runs were carried out with

ACID
TABLE 4-0
'11.0 K
107
Picric 30039 (16) 1
Formic 54.6 II 1.77 x 10⁻⁴ (18)
Acetic 40.9 11 1.76 x 10⁻⁵ "Propionic 35.8 II 1034 x '10-5 "Succinic ca. 35 ( 17) 6.89 x 10⁻⁵ "Tartaric ca. 29 II 9.2 x 10⁻⁴ "Phosphoric 32.3 II 7.52 x 10⁻³ II
Citric c a , 30 (16) 8.4 x 10⁻⁴ "Oxalic 74.2 " 5.9 x 10⁻² " JI
i
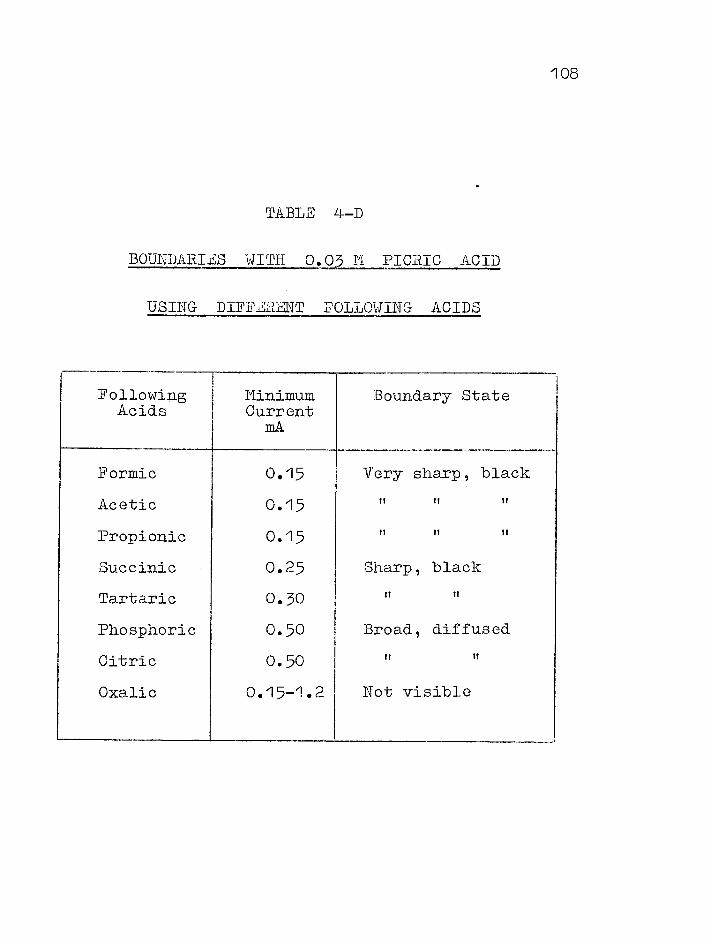
TABLE 4-D
BOUNDARIES WITH 0.03 M PICRIC ACID
USING DIFFERENT FOLLOWING ACIDS
Following Acids
Minimum Current
mA
Boundary State
Formic 0.15 Very sharp, black
Acetic 0.15 11 11 It
Propionic 0.15 11 II II
Succinic 0.25 Sharp, black
Tartaric 0.30 it II
Phosphoric 0.50 Broad, diffused
Citric 0.50 It It
Oxalic 0.15-1.2 Not visible
108
109
0.01 M picric acid solution. The results were found
inconsistent irrespective of the following solution
and the electrode used. The cause was found to be the
Apiezon L grease which was adsorbing picric acid, and
so was giving transference values both high and incon-
sistent. Inert stopcock silicone grease was then
tried and consistent values were obtained with it both
within a run and from one run to another. This suggested
the use of this grease throughout the work even with
tartaric acid solutions to avoid the possibility of
such an effect.
Since photo-decomposition (9) of picric
acid has been reported in the literature, the effect
of light on transference numbers was carefully studied.
Accordingly, runs were done with solutions prepared in
the painted flask and any photo-decomposition by the
light behind the moving boundary cell was studied.
When the solution in the cell was exposed to the light
throughout the run, the values were higher than those
when the light was switched on for just long enough
to time the boundary.
Picric acid ,soIutions:older than G week
gave higher transference numbers. The results obtained

110
TABLE 4-E
EFFECT OF LIGHT AnD AGE 01 T-1U11?;;HENCE NtliBERS I 0.0IMHPic SOLUTION*
Solution age within 7 days - Solution age 10-15 days
Light protected (a) Light protected (a) Light exposed (b)
T,. (c) x10
0.07579 (0.6LIA)
0.07580 (0.68MA)
T2,.1C
(c)
0.07593 (0.6MA)
0.07595 (0.66MA)
T,k.1C
(c)
0.07605 (0.6mA)
0.07613 (0.66MA)
Solutions were prepared in the flask whose outer
surface was painted black, and were ke-ot in the
dark.
(a) The 40 watt tungsten light source used to follow
the boundary ,:as ;:witched off except for 2-3
minutes required to time the boundary.
(b) Exposed to light source throughout the run.
(c) Transference numbers with solvent and volume
correction applied.

111
under these conditions are shown in table 4-E and in fi&
4-2.
From the above mentioned experiments
it was decided to:
(i) Use silicone stopcock grease,
(ii) prepare solutions in flasks whose outer surface
have been painted black.
(iii) h.eep the light source off except for the
period essential to time the boundary accurately,
(iv) use solutions within a week of preparation.
The transference results, to be des-
cribed in the subsequent sections, were obtained under
these conditions.
4.3 LOVING BOUNDARY RE6ULTS
Because of the low solubility of picric
acid in water (19) (0.066 mole/litre at 30°C) and the
practical difficulty encountered in dissolving it,
0.02, 0.01 and 0.005 molar concentrations were chosen
for the runs. The first two concentrations were studied
in detail covering various aspect required by the theory.
In almost every case transference values were checked by
using different indicator solutions and different
electrodes, as yell as by varying the current. The re-
sults in each case will be dealt with in order.

112
TABLE 4-F
TRANSFERENCE NUMBERS IN 0.02 M PICRIC ACID
Picric acid concentra- tion
(M)
Indi- cator
solution
Indicator concentra- tion
(M)
Elec- trode Current
(mA)
3 T Pie
0.02017 H2Succ 0.024 Ag2Succ 1.25 0.07595
0.01993 P9 0.0199 It 0.67 0.07590
0.02009 IT 0.0201 PbSucc 0.66 0.07585
0.02017 it 0.024 Ag2Succ 0.66 0.07584
0.01993 lt 0.0199 ft 0.39 0.07588
0.02017 IT 0.024 PbSucc 0.29 0.07582
0.02009 IT 0.0201 Ag2Succ 0.22 0.07584
0.02021 HOAC 0.028 tf 1.24 0.07612
0.02021 11 0.028 IT 0.79 0.07610
0.02020 I? 0.0279 !, 0.41 0.07585
0.02021 vr 0.028 li 0.20 0.07591
0.02020 II 0.0237 I? 0.21 0.07585 (-15h)
Transference numbers with solvent and volume correction
applied.

Tx104 VARIATION OF TRANFERENCE NUMBERS WITH-CURRENT
IN 0.02 M PICRIC ACID
763
762.
4) Acetic Acid As Following Solution
Succinic Acid As Following Solution (AgoSucc)
E) Succinic Acid As Following Solution(PbSucc)
0 761
760
759 -
756
757 - FIG.4-1
756±
_ 0 1 3 4 5 6 7 10 11 12. 13
I.(mA) x10

114
Results in 0.02 M Solutions
Results with 0.02 M picric acid have
been summarized in table 4-F and shown in fig. 4-1.
Transference numbers show a greater current dependence
with acetic acid as following solution then with succinic
acid because more joule heating is caused by the poor
conductance of acetic acid (20). The extrapolated values
at zero current, for acetic and for succinic acid as
indicators, agree very well showing that Tpicvalues
are independent of the following solution used.
Changes in the concentrations of the
following solution (from +20% in succinic acid to -15%
in acetic acid) had no effect on the transference
values. Likewise, use of lead succinate and silver
succinate as non-gassing cathodes gave comparable
results.
Results in 0.01 M and 0.005 M Solutions
Transference numbers in 0.01 M
ETic solutions are collected in table 4-G, and
these show a slight current dependence. As in the
case of 0.02 id solutions, change of electrode and
indicator concentration produced no effect.
Table 4-H gives the transference

VARIATION OF TRANSFERENCE NUMBERS WITH CURRENT
IN 0.01M HPic
•
Variation of Transference Tx104 Numbers in 0.005M HPic
744
,763
761 762.-
e
• AOAC imoicAToR O 142Suce. 8
0'1 15.3 cr4
I(MA)-
0
®Solution 11 days old
eSolution exposed to light
E) OLight protected
(With lead succinate
ICI
760-
759-
758
FIG. 4-2
I(mA)x10
757-

TABLE 4-G
TRANSFERENCE NUMBERS IN 0.01 M PICRIC ACID
Picric acid concentra- tion
(M)
Indica- tor solution
Indicator concent- ration
(M)
Elect- rode
Current (mA)
TPic
0.01017 H2Succ 0.011 PbSucc 0.68 '0.07580
0.01015 94 0.011 Ag2Succ 0.60 0.07579
0.01018 IT 0.019 12 0.60 0.07578
0.01018 9, 0.011 11 0.29 0.07587
0.01018 11 0.011 It 0.17 0.07578
Transference values with solvent and volume correc-
tions applied.
116

117
TABLE 4-H
TRANSFERENCE NUMBERS IN 0.005 N PICRIC ACID
Picric acidIndi- concent-
ration. (M)
cator solution
Indicator concent- ration
(M)
Elec- trode
Current (mA)
* T Pic
0.005017 HOAC 0.0069 'Ag2Succ 0.34 0.07625
0.005017 ti 0.0069 99 0.20 0.07617 ,
0.005031 ” 0.00596 ti 0.20 0.07622
0.005002 . 1-1Succ. 0.0060 H 0.39 0.07612
0.005031 u 0.00516 97 0.39 0.07639
0.005031 I, k 0.00559 ti 0.39 0.07637
0.005002 TT 0.0060 H 0.30 0.07624
* Transference values with solvent and volume corrections
applied.

113
numbers at 0.005 M. The boundary was difficult to
follow with succinic acid as indicator below 0.4 mA
and above that the boundary became skew. However,
acetic acid gave relatively better boundaries in the
range 0.2-0.4 mA. Both sets of values were extraz)olated
to zero current as shown in figure 4-2.
The results, in all three concentra-
tion ranges, extrapolated to zero current, are shown
in table 4-1.
4.4 DISCUSSIO .
The transference numbers at zero
current at the three concentrations have been plotted
against (ac)2 taking K=1 mole/litre in fig. 4-3. The
plot shows a minimum and deviates completely from the
D-H-0 limiting equation (1-2-1). The dotted line shows
a naive extraTmlation of the experimental transference
numbers which lead to TPico 0.0765. This gives
oPic=29.0 cm
2 ohm-1 equiv. which does not agree
with the previously reported value of 30.39 (16) obtained
from the limiting conductance of quaternary ammonium
salts.
The discrepancy in the conductance
measurements, discussed in section 4.1, indicated

TABLE L.-I
EXPERIMENTAL TRANSFERENCE NUMBERS OF
PICRATE ION CONSTITUENT AT ZERO CURRENT
Conc. (M)
Tpic
0.02 P.07581
0.01 0.07577
0.005 0.07615
119

Tx104,
220, DEPENDENCE OF TRANSFERENCE NUMBERS ON (ac )2
780-
760:--
740-
72o+
700— FIG. 4-3
680 0 a. o5
(ac )

121
complex formation in solution. Moreover, the success of
the explanation of such behaviour in phosphoric acid (21)
in terms of the triple ion H2P047H: H2PO4 led to the idea
of explaining this deviation, too, by postulating a
Pic7HtPic complex ion in picric acid solution.
Accordingly, the results were analysed on the lines
described in section 1.4A. This involved suitable selec-
tion of XoPic-• and Xo PHP (where PHP reT)resents the triple
ion Pic:HTPic-) values.416=30.39 was taken from the
literature (16) and Xo PHP- =25 was assumed. In the
actual calculations, however, values from 02H2-.20
to 32 (in steps of 0.5 units) were employed to get the
best fit. in additional uncertain factor in the analy-
sis was the value of the dissociation constant of the
picric acid itself, which, as mentioned earlier, ranges
from 0.15 to 2 in the literature. The a values, which
are the key points in the treatment (see equations
(1-3-4,66), and consequently the p values, entirely de-
pend upon the chosen value for the dissociation constant
so that this determines the value of the stability con-
stant K2/1i,-. To get constant K2112-, therefore, various
values of the picric acid dissociation constant were
used. The spectrophotometric value of Davis and
Paabo (6) of 0.5, the one recalculated from the

122
Ives and Moseley conductance data (7) equal to 1.0
and their original value of K=2 were all tried. ho
combination of KHPic X0Pi. c - and Xo PEP - could produce '
constant value for KPH- at all three concentrations.
A change of +0.0001 in the experimental transference
numbers (allowed by the ex)erimental error) made consider-
able changes in the 1<pH2- values in low concentrations
but did not help towards constancy. The KPHP- values
corresponding to KHpic=2 deviated most from each other.
The best groups were found to be
02Hp =25 and 30 and
-. =1.0, Xo FHP -=25 and 30 KHPic
with a distance of closest ap-oroach of 5A. The
effect of the 'a' values on. T - was studied by changtrg TTIP
it from 4 to 6.7A units.
The results of cal these calculations
are collected in tables 4-J,K,L and H. It can be seen
that the values at 0.005 and 0.01 Li are usually in suite
good agreement while the figure for 0.02 M deviates from
these, and perhaps higher complexes are beginning to
appear in the most concentrated solution.
In this situation where KHPic is not
well established, it is probably not very far from the

TABLE 4-J
STABILITY CONSTANT OF TRIPLE ION PEP
AT DIFFERENT $ a' VALUES
WITH KHPic = 0.5 AND - = 25
KpEp- CONC. (M)
a
303 0.005 4
286 0.01 4
211 0.02 4
253 0.005 5
254 0.01 5
188 0.02 5
207 0.005 6
225 0.01 6
166 0.02 6
*173 0.02 6
Transference number increased
by 0.0001
123

TABLE 4-K
STABILITY CONSTANT OF TRIPLE ION PHP
AT DIFFERENT 'a ' VALUES
WITH Ka, ic = 0.5 AND °Hip- = 30
KT pa, - CONC. {M)
a
197 0.005 4
178 0.01 4
122 0.02 4
165 0.005 5
160 0.01 5
109 0.02 5
135 0.005 6
141 0.01 6
98 0.02 6

TABLE 4-1,
STAFILITY CONSTANT OF THE TRIPLE ION Pal , I
AT DIFFERENT a VALUES
WITH KHPic = 1.0 AND X°I)Bp- = 25
Kilip- CONC. (M)
a
610 0.005 4
572 0.01 4
420 0.02 4
511 0.005 5
508 0.01 5
372 0.02 5
418 0.005 6
450 0.01 6
331 0.02 6
125

TABLE 4-M
STABILITY CONSTANT OF TRIPLE ION PHP
AT DIFFERENT 'a' VALUES
WITH KPH,- = 1.0 AND X°PIT = 30
KPH- CONC. (10 a
397 0.005 4
355 0.01 4
241 0.02 4
333 0.005 5
317 0.01 5
216 0.02 5
" 268 0.005 5
298 0.01 5
' 209 0.02 5
273 0.005 6
283 0.01 6
194 0.02 6
Transference numbers decreased
by 0.0001
126

127
truth to adopt a value between 200 and 300 litre/mole
for the stability constant, a value between 25 and 30
for the limiting equivalent conductance Xo
- and a
value between 5 and 6 for the distance of closest
approach.
A rough estimate of the concentrations
of the various species present in 0.003 M solution
(the highest concentration used in the conductance
work of Ives ./10. Loseley) was then made taking
Klipic=1.0 and Kplu =300. The result is
) (Pic— ) 17...^, 0.003 El
(Hric) 3 x 10⁻⁶ M
8 x 10⁻⁶
Thus the conductance data clearly need to be re-eva-
luated with due allowance for triple ion formation.
4.5 TREATMENT OF CNDUCTLEC Da TA Y1LLOIT:G VOR
I1 TIILE ION
Ives and lAoseley's conductance data
on picric acid solutions were re-analysed for the
)resence of triple ion PH2 using equation (1-4-16)
pi o AObs Di t A = )4- a ‘.
N '1
ic- X- .")+(4g2.4)(de)
1+Ba(ac)

128
where
(1 + Be) tr correction factor for viscosity
and
-) correction factor for triple Plc FHP ion.
(a) Viscosity correction
This correction was applied in
accordance with the theory described in Chapter I. The
numerical value for B was obtained by using Drucker's (22)
viscometric results shown in table 4-N. The plot of
(1 - 1)/012 against e4 (see fig. 4-4) produced B = 0.38 o
and giving A = 0.004 expected from the Falkenhagen
theory.
(b) Triple ion correction
The factor Va(xpic- is
very small and makes little contribution. However, a
in the first term on the right hand side plays an im-
portant role, and its calculation requires Kapic
and KpHp- values. Neither of these is known with
certainty. nor the calculations, 0.5 and 1.0 were
chosen for the dissociation constant of picric acid
and figures of 200, 250 and 300 obtained from the
transference numbers, were used for the stability
constant of the triple ion. Both 25 and 30
cm2ohm-1 equiv.:1 were employed as the limiting equiva-

PLOT OF K.DRUCKER'S VISCOSITY DATA
FIG. 4-4
t- 045

TABLE 4-N
KARL DRUCKER'S VISCOMETRIC RESULTS
0 ONC . (m)
rt c. P .
1/11,-1 c,
0.01432 0.8989 0.04864
0.02270 0.9017 0.05940
0.03563 0.9062 0.07412
0.0508 6 0.9116 0.08882
130

TABLE 4-0
AFTER VISCOSITY AND TRIPLE ION CORRECTION
WITH HPic . = 0.5 AND ,a = 5A
CO(
104', (M)
(a)', obs.
(b )A0 Kplip-.200
(b )Ao Knip-.250
(b ),,c, Knip-.300
2.20032 377.98 380.31 380.32 380.32 2.95785 377.57 380.30 380.31 380.31 3.61594 377.33 380.39 380.39 380.39 4.89684 376.92 380.51 380.52 380.53 7.09948 376.16 380.58 380.60 380.62 7.41178 376.05 380.58 380.60 380.62 7.76756 376.02 380.67 380.69 380.72 10.0923 375.42 380.83 380.87 380.90 11.9719 374.92 380.91 380.96 381.01 15.6572 374,05 381.10 381.81 381.27 18.0485 .373.60 381.31 381.42 381.53 19.4084 373.07 381.15 381.27 381.39 22,8707 372.35 381.35 381.51 381.68 23.1110 372.47 381.53 381.70 381.87 24.6530 372.29 381.75 381.95 382.14 30.0804 371.14 382.00 382.28 382.56 33.4074 370.52 382.23 382.57 382.91
(a) Ives and Moseley experimental results
(b) Given by equation (1-4-16)
1.31

TABLE 4-P
AO AFTER VISCOSITY AND TRIPLE ION CORRECTION
WITH Kipic = 1.0 AND a = 5A
CONC. 10'1 (M)
(a) 1obs.
(b) 1,9 KPHP -.200
(b ),a 0 KPH-=250
(b) 0 KPh2-.300
2.20032 377.98 380.23 380.23 380.23 2.95785 377.57 380.19 380.19 380.19 3.61594 377.33 380.25 380.25 380.25 4.89684 376.92 380.32 380.33 380.33 7.09948 376.16 380.29 380.30 380.31 7.41178 376.05 380.28 380.29 380.30 7.76756 376.02 380.36 380.37 380.38 10.0923 375.42 380.41 380.43 380.45 11.9719 374.92 380.39 380.42 380.45 15.6572 374.05 380.41 380.L5 380.49 18.0485 373.60 380.49 380.54 380.60 19.4084 373.07 380.25 380.31 380.38 22.8707 372.35 380.25 380.34 380.42 23.1110 372.L7 380.42 380.51 380.59 24.6530 372.29 380.55 380.65 380.75 30.0804 371.14 380.146 380.60 380.75 33.4074 370.52 380.47 380.64 380.82
(a) Ives and Moseley experimental results (b) Given by equation (1-4-16)
132

133
lent conductance of the triple ion. The change of X°13/42-
from 25 to 30 had practically no effect on the A° values
due to the small magnitude of p/a(7.1,10- - . ) PEP •
Results of these calculations are shown
in tables 4-0 and 4-P. It is evident from the figures
in table 4-0 that, with KHpic=0.51 A° values rapidly
increase with concentration and make a jump of 2-3 con-
ductance units at all values of K 2- insteadrof being
constant. On the other hand figures in table 4-P are
more encouraging. The comparison of A° values corres-
ponding to KPH,-=200 show that the overall difference in
A° from the mean value is not greater than +0.2 conduc-
tance units. In the present state of knowledge of
Klipic and 5.12,- values the A° figures are not very far
from constant.
To summarize, therefore, it appears from
the conductance results of Ives and Moseley and from
present transference results, for picric acid in water
at 25°C,
= 1.0 mole/litre
KPH = 200 litre/mole
There is also indirect evidence for the formation of
higher complexes at a concentration of 0.02 M.

134
REFERENCES
CHAPTER IV
(1) H. Von Halban and L. Ebert, Z.phys.chem., 112, 359 (1924)
(2) H. Von Halban and M. Seiler, Helv.ChimeActa, 21, 385 (1938)
R.G. Bates and G. Schwarzenbach Experimentia, 10, 482 (1954)
A.V. Willi and P.Mori, Helv.Chim.Acta, 47, 155 (3964)
(5) A.C. McDougall and F.A. Long, J.Phys.Chem., 66, 429 (1962)
(6) N.M.- Davis and M. Paabo, J.Res.Nat.Bur.Std., 67A, 241 (1963)
(7) D.J.G. Ives and P.G.N. Moseley, J.Chem.Soc., B, 757 (1966)
(8) J. Molnar, Comptorend., 201, 59 (1935)
(9) W. Jackel, Z.Phys.Chem. (Leipzig), 207, 296 (1957)
(10) S.M. Neale, Trans. Faraday Soc., 17, 505 (1921)
(11) G. Kortthn and H. Wilski, Z.Phys.Chem. (Frankfurt) 2, 256 (1954)
(12) J.F.J. Dippy, S.R.S. Hughes and J.W. Laxton, J.Chem.Soc., 2995 (1956)
(13) T. Erdey-Gruz, Z.phys.Chem., 131, 81 (1928)
(14) V. Rothmund and C. Drucker, Z.phys.Chem. 46, 827 (1903)
(15) E. Schreiner, Z.anorg.allgen.chem., 138, 311 (1924)
(16) H.M. Daggett, E.J. Bair and C.A. Kraus, J.Amer. Chem.Soc., 73, 799 (1951)
(17) M. Selvaratnam, Ph.D. Thesis, London University, 1964
(3)
(4)

135
(18) R.A. Robinson and R.H. Stokes, Electrolyte solutions 2nd Edn. Appendix 12.1
(19) A. Seidell and W.F. Linke, Solubilities of Inorganic and Organic Compounds. p. 647, D.Van Nostrand Co. New York (1962)
(20) K.N. Marsh, M. Spiro and M. Selvaratnam, J.Phys. Chem., 67, 699 (1963)
(21) M. Selvaratnam and M. Spiro, Trans. Faraday Soc., 61, 361 (1965)
(22) K. Drucker, Arkiv.Kemi. Mineral Geol., 21, 17 (1946)
(23) Ref. (10), Appendix 1.1

136
CHAPTER V
TRANSFERERCE RESULTS IN TARTARIC ACID SuLUTIOPS
5.1 ILTRODUCTION
Tartaric acid has already been inveLti-
gated by Marsh, Spiro and Selvaratnam (1). Their studies
indicated that:
(1)
With citric, furoic,malic, mandelic, phenoxyacetic
and succinic acids as indicator solutions, tartaric
acid gives no visible boundary.
Acetic and propionic acids are the only suitable
indicators for a falling boundary.
(iii) Transference numbers are independent of the
following solution and its concentration.
(iv) The increase in transference numbers with in-
creasing current is the result of excessive
Joule heating.
In the work summarized above, a cadium/
cadium acetate (2M) electrode was used as the non-gassing
closed cathode. Later research on the acid revealed that
the concentrated cadium acetate diffused into the follow-
ing solution causing an additional volume change. Dila-
tometric studies showed (2) different volume changes for
different cadium acetate concentrations end it was real-
ised that the correction for the diffusion could not be

137.
applied with certainty,
It was, therefore, decided to repeat
the aboVe work with silver/silver succinate electrodes
in which uncertainties due to diffusion do not occur
and which haVe been found successful in other systelds.
The results of the oreeent work using this electrode
will be desCribed in the following sections.
5.2 LOVING BOUNDARY RESULTS
(a) In 0.02 M solutions
Since transference numbers have been
found independent of the indicator solution and its
concentration, experiments were carried out to study
the current dependence only. The boundary was difficult
to see below 0.3 mA and currents higher than 0.6 mA made
it skew. In the current range 0.3-0.5 mA, transference
numbers were found current - dependent, as observed
earlier, and the extrapolated value at zero current
agreed with that obtained by Marsh, Spiro and Selvarat
nam (see table 5-C) using Cd(OAc)2 electrodes.
(b) In 0.05 and 0.10 M solutions
Runs in these concentration ranges were
found to give progression down in transference numbers,.
i.e. the initial values were higher than those obtained
near the end of the experiment. It was inferred that,
due to higher acetic acid concentrations(0.065M-0.15M)

138
and the consequent increased solubility of silver succinate,
dissolved silver succinate reached the boundary during the
long interval of time (30-50 hours) needed for a run. The
sI)ecies, Succ and HSucc 9 resulting from the dissolution
of silver succinate in the following solution, have limit-
ing equivalent conductances of about 60 (3) and 36 (2)
conductance units respectively while those of HT (where
HT represents the bitartarate ion) and. CH3000 are res-
pectively 30 (2) and 50 units. In 0.02 M tartaric acid
solution (and 0.02 M HPic solutions) the runs were shorter
and the corresponding Kohlrausch concentration less, so
that the species did not find sufficient time to cross
the long cathode section and reach the boundary. The idea
was supported her the fact that lengthening the distance
between the electrode and the moving boundary tube (see
section 3.1) eliminated the progression and gave consis-
tent values. Typical transference runs with and without
the extension are shown in table 5-A.
All experiments in this concentration
range were then carried out with the extended closed
cathode section using silver succinate powder and
tablet.
The experimental transference results,
with solvent and volume corrections a,plied (see sections

TABLE 5-A
TRANSFERENCE NUMBERS IN 0.1 M TARTARIC ACID
WITH AND .WITHOUT EXTENDED CATHODE SECTION
Etch Marks
..
THT without
extension at 1.0 mA
,
TWIT with
extension at 1.04 mA
1-7 0.07351 (missed)
2-8 0.07345 0.07331
3-9 0.07342 0.07338
4-10 0.07332 0.07337
5-11 0.07328 0.07337
6-12 0.07317 0.07333
139

140
2.4 and 245), in all the three concentrations investigated,
are shown in table 5-B and in figs. 5-1 to 5-3. Table 5-C
gives the transference numbers at zero current and compares
the values with those determined earlier.
5.3 DISCUSSION
The transference numbers at zero current
were plotted against (ac)2, taking K1=9.17 x 10⁻⁴ mole/
litre (4), and are shown in fig. 5-4. The plot shows
a complete departure from D.H.O. theory and a minimum
as observed with the picric acid results. The trans-
ference numbers, accordingly, were treated for the
presence of complex ions.
Secondary dissociation and experimental transference values(l)
It should be pointed out at this stage
that the second dissociation constant K2 of tartaric
acid is 4.3 x 10⁻⁵ mole/litre (4) which is not much
less than the first. In 0.01 and 0.1 H H,T solutions,
the percentage of HT- ions dissociating into T. ions
(where HT- and T- stand for bitartarate and tartarate
ions respectively) is 2 and 7 respectively (1). However,
Marsh, Spiro and Selvaratnam have shown that in this case
the effect of allowing for the second dissociation has
no significant effect on the transference number and
tartaric acid will therefore be treated in the follow-
ing section as a simple weak lil.electrolyte.

0.3 0.5 0.4
VARIATION OF TRANSFERENCE NU.LERS
WITH CURRENT IN 0.02M H2T
4 Silver Succinate Tablet
Tx104
C) Silver Succinate Powder
736
— 735
737
0
FiG. 5-1
0.2
Current(mA
0.1

50
20
7300 0 0.1
4
0.7 0.8 0.9 1.0 0.2 0.3 0.4 0.5 0.6
Current (mA)
VARIATION OF TRANSFERENCE NUMBERS
WITH CURRENT IN 0.05M H T
0
40 -
30
10 —
O
FIG. 5.-2

Tx104
60
VARIATION OF TRANSFERENCE NUMBERS
WITH CURRENT IN 0.1M H2T
50
C) With extension
40 0 Without extension
30
20
10
7300
FIG. 5-3
0 0.2 0.4 0.6 0.8 1.0 . 1.2 1.4 1.6 1.8 Current (mA)

144
TABLE 5-B
TRANSFERENCE NUMBERS IN TARTARIC
ACID SOLUTIONS
CONC. H2T
(N)
CONC. HOAe (N)
Electrode Age Succinate
Current
(mA)
T1.1,
0.10412 0.134 with extension 1.20 0.073W1 H PI Powder 1.04 0.07334 I? 0.142 92 ' 0.83 0.07324 0 0.134 H 0.83 0.07323 ly H ?I 0.58 0.07325
0.04997 0.068 99 1.01 0.07347 29 29 21 0.90 0.07346 92 49 42 0.73 0.07324 0 92 H 0.49 0.07324
without exten- sion
0.020164 0.0274 Powder 0.57 0.07380 99 H 0 0.48 0.07376 ,, 92 PY 0 0.37 0.07364 92 0 29 0.37 0.07369 ft 11 Tablet 0.34 0.07373 0 0 0 0.29 0.07363
Transference numbers with volume and solvent correction
applied.

TABLE 5—C
TRANSFERENCE NUMBERS 'If TARTARIC ACID
SOLUTIONS AT ZERO CURRENT
CONC. (M)
T* at zero current H
with Ag2Succ Cd(oAc)2 Cd(oAc)2 values
corrected for diffusion**
0.02 0.07344 0.0734 0.0742
0.05 0.07304 0.0733 0.0745
0.10 0.07312 0.0738 0.0755
Transference results with solvent and volume correction applied.
** Using the dilatometric results of Selvaratnam (2).
145
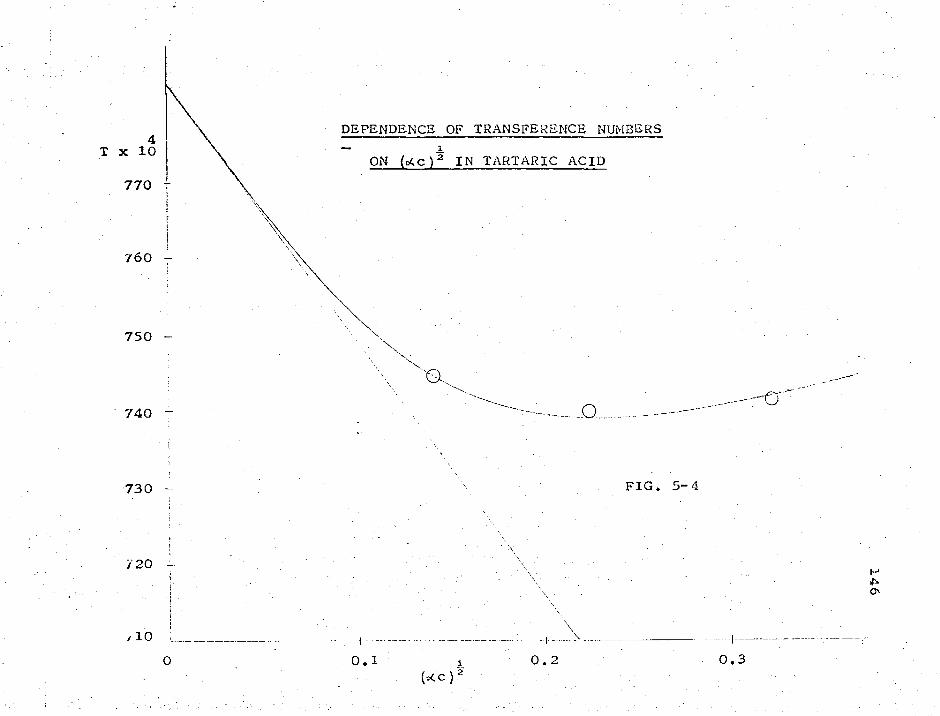
DEPENDENCE OF TRANSFERENCE NUMBERS 1
ON (c)2 IN TARTARIC ACID
4 T x 10
770
760 -
750 -
740 -
730 FIG. 5-4
720
,10
) 2 0.3

147
Stability constant of triple ions THT-
The stability constant of the complex iron
was calculated in the same way as in the case of picric
acid. For the dissociation constant of tartaric acid
a value of 9.17 x 10⁻⁴', determined by Bates and Canham
(4), was employed and for 011T- and X°THT-" values
ranging from 28-30 and 23 to 29, respectively, were
tried. In addition, the effect of experimental error
in the transference numbers and of different a parameters
on the value of I(H TT was also checked. The results
are shown in tables 5-D,E,F,G and H.
Tables 5-D,E,F record the stability
constant at oHT-=29.2,29.3 and 29.25 respectively.
Comparison of these tables indicates that with a=3A,
,o HT- = 29.25 ohm
-1cm-1equiv-1
and with XoTHT- ..-:23-25 ohm-1cm-1equiv-19 values
which are more likely than 27 or 29, we obtain
KTHT 0.6 - 0.8 litre/mole
Tables 5-G and H show KTHT- corres-
ponding to xoHT.29.1 and 29.2, respectively, with
a=5A. In table 5-H, the stability constants agree
well at all three concentrations indicating that with
-1 -1 -1 oHT- = 29.2 ohm cm equiv 9

148
TABLE 5-D
STABILITY UONST1:NT OF TRIPLE I01' IN TARTARIC ACID
K =9.17x1C4, = 29,2 * a = 3A
XoTHT stability constant at
0.1M 0.05M . 0.02M
29.0 0.424 0.458 0.508
27.0 0.504 0.540 0.595
25.0 0.622 0.658 0.717
23.0 0.810 0.841 0.903
29.0(a) 0.493 f 0.598
27.0 0.582 0.701
25.0 0.709 0.846
23.0 0.907 1.066
(a) Transference numbers increased by 0.0001
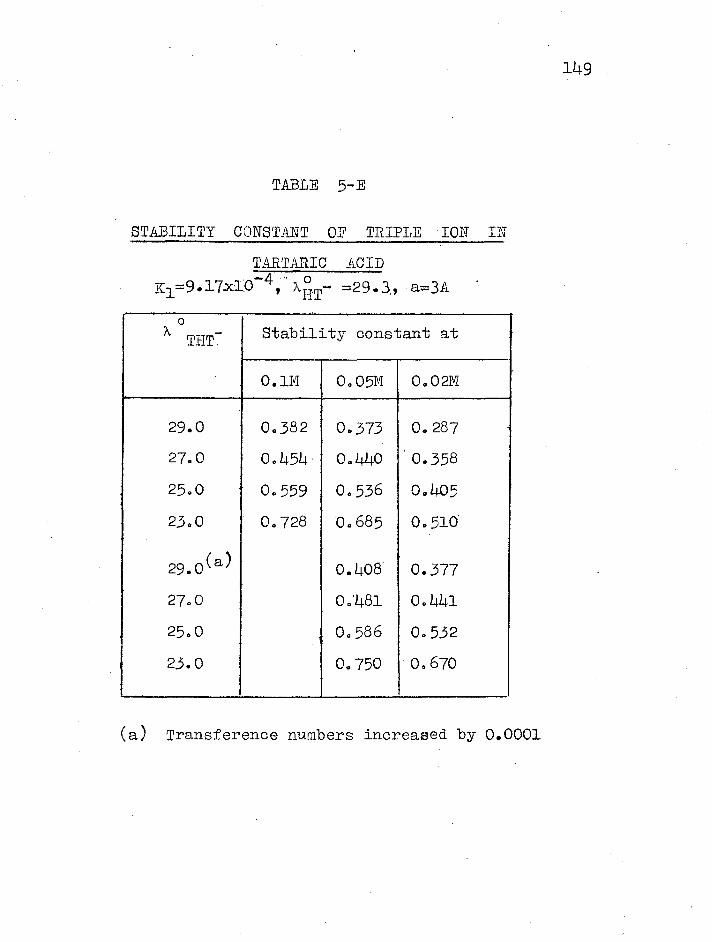
TABLE 5-E
STABILITY CONSTANT OF TRIPLE ION IN
TARTARIC ACID
K1=9.17x10⁻⁴,AT =29.3, az=3A
o % THT- Stability constant at
0.1M 0.05M 0.02M
29.0 0.382 0.373 0.287
27.0 0.454 0.440 0.358
25.0 0.559 0.536 0.405
23.0 0.728 0.685 0.510
29.0(a) 0.408 0.377
27.0 0.481 0.441
25.0 0.586 0.532
23.0 0.750 0.670
(a) Transference numbers increased by 0.0001
149

TABLE 5-F
STABILITY CONSTANT OF TRIPLE ION
IN TARTARIC ACID
K = 9.17 x 10⁻⁴ X°- = 29.259 a = 3A ' HT
X°THT- Stability constant at
0.1M 0,05M 0.02M
29.0 0.403 0.416 0.397
27.0 0.479 0.490 0.465
25.0 0.590 0.597 0.561
23,0 0.769 0,763 0,706
29.0(a) 0.451 0.487
27.0 0.532 0.571
25.0 0.648 0.689
23.0 0.828 0.868
(a) Transference numbers increased by 0.0001
150,

151
TABLE 4-G
STABILITY CONSTANT OF TRIPLE ION IN'
TARTARIC ACID
1 ° = 9 17 x 10-49 X°HT = 29.1, a= 5A
%oTHT- stability constant at
0.1K 0.05M 0.02M
29.0 0.394 0.445 0.577
27.0 0.467 0.525 0.675
25.0 0.573 0.637 0.813
23.0 0.742 0.011 1.023
29.0(a) 0.480 0.667
27.0 0.566 0.781
25.0 0.687 0.941
23.0 0.877 1.184
(a) Transference numbers increased by 0.0001
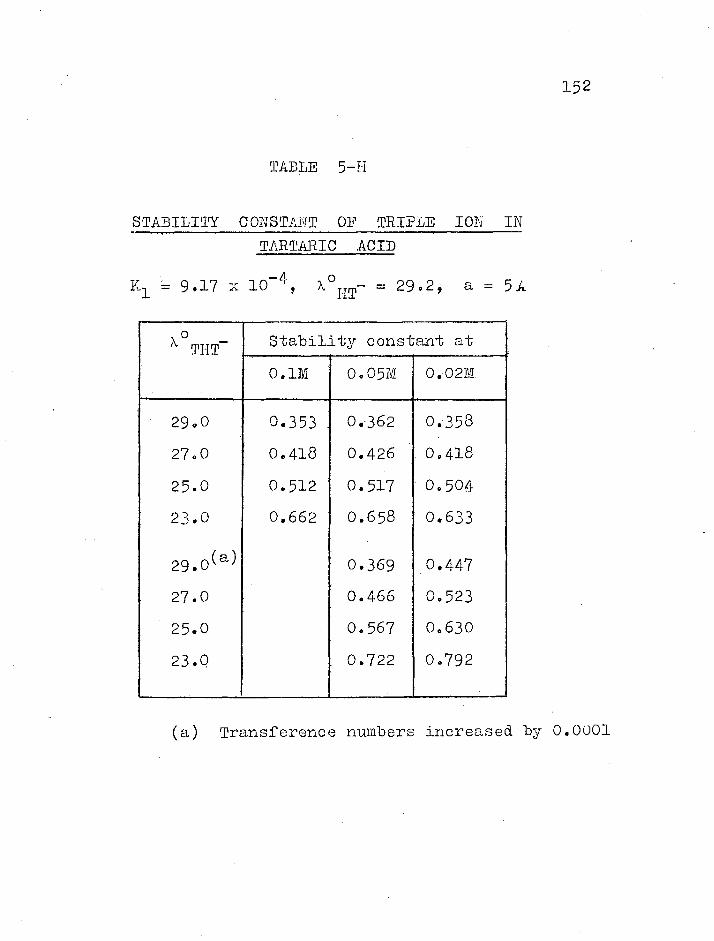
152
TABLE 5-H
STABILITY CONSTANT OF TRIFLE ION IN TARTARIC ACID
Y1 . 9.17 x 10⁻⁴'oHT- = 29.2, a =
XoTHT Stability constant at
0.1M 0.05M 0.02M
29.0 0.353. 0.-362 0.358
27.0 0.418 0.426 0.418
25.0 0.512 0.517 0.504
23.0 0.662 0.658 0.633
29.0(a) 0.369 0.447
27.0 0.466 0.523
25.0 0.567 0.630
23.0 0.722 0.792
(a) Transference numbers increased by 0.0001

153
, and with oTHT- 717 23-25 ohm lcm lequiv-1,
KTHT — 0.5-0.7 litre/mole
Thus it can be concluded that, with a=3.7.5A, X°HT-=29'2'
and if Xo HT- lies between 23 and 25, K -THT=

154
REFERENCES
Chapter V
(1) K_. N. Marsh, M. Spiro and M. Selvaratnam, J.Phy.Chem.
67, 699 (1963).
(2) M. Selvaratnam, Ph.D. Thesis, London University(1964).
(3) N.E. Topp and C.W. Davies, J.Chem.Soc., 87 (1940).
(4) R.G. Bates and R.G. Canham, J.Res.Nalt.Bur.Std.,
47, 343 (1951).

155 CHAPTER VI
STABILITY CONSTANTS OF TRIPLE IONS
IN IODIC. PERCK[ORIC AND NITRIC ACIDS
FROM TRANSFERENCE NUMBERS
6.1 IODIC ACID
Recently Pethybridge and Prue (1) have made
precise conductometric, potentiometric and kinetic measure-
ments on aqueous iodic acid solutions. They obtained
stoichiometric activity coefficients of the acid from
their own e.m.fo measurements on cells with transference
coupled with the transference numbers determined by Spiro
(2). The results from the three separate sets of measure-
ments were fitted with the values 5A for the ion-size
parameter, 0.157 mole/litre for the dissociation constant
of the acid and 4 litre/mole for the stability constant of
the triple ion 103 .e.103 , This last value was obtained
largely by examining the activity coefficients. The
existence of the triple ion was confirmed by the re-
analysis of cryscopic data of Abel, Redlich and Hersch
(3) and Lange and Herre (4). However, Pethybridge and
Prue have not directly treated either their own con-
ductance results or the transference values of Spiro (2)
for the presence of triple ions. It was, therfore,
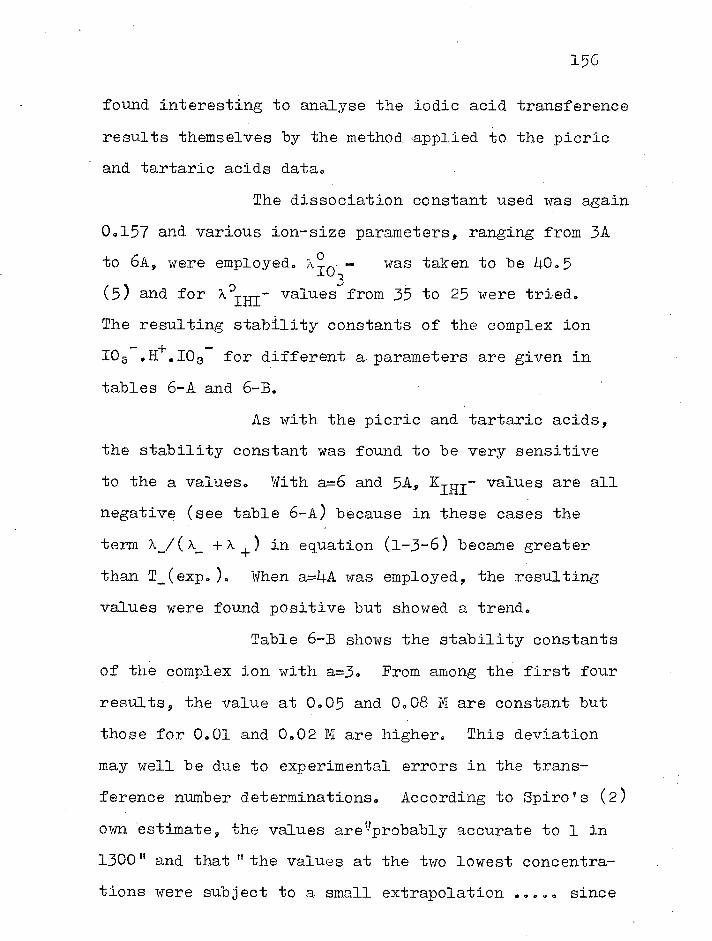
156
found interesting to analyse the iodic acid transference
results themselves by the method applied to the picric
and tartaric acids data.
The dissociation constant used was again
0.157 and various ion-size parameters, ranging from 3A
to 6A, were employed. was taken to be 40.5 103
(5) and for X'2'- values from 35 to 25 were tried.
The resulting stability constants of the complex ion
103-.1e.103- for different a, parameters are given in
tables 6-A and 6-B.
As with the picric and tartaric acids,
the stability constant was found to be very sensitive
to the a values. With a=6 and 5A,KIHI- values are all
negative (see table 6-A) because in these cases the
term X_/(X.... +X +) in equation (1-3-6) becathe greater
than T_(exp.). When a=4A was employed, the resulting
values were found positive but showed a trend.
Table 6-B shows the stability constants
of the complex ion with a=3. From among the first four
results, the value at 0.05 and 0.08 M are constant but
those for 0.01 and 0.02 M are higher. This deviation
may well be due to experimental errors in the trans-
ference number determinations. According to Spiro's (2)
own estimate, the values areprobably accurate to 1 in
1300" and that "the values at the two lowest concentra-
tions were subject to a small extrapolation ..... since
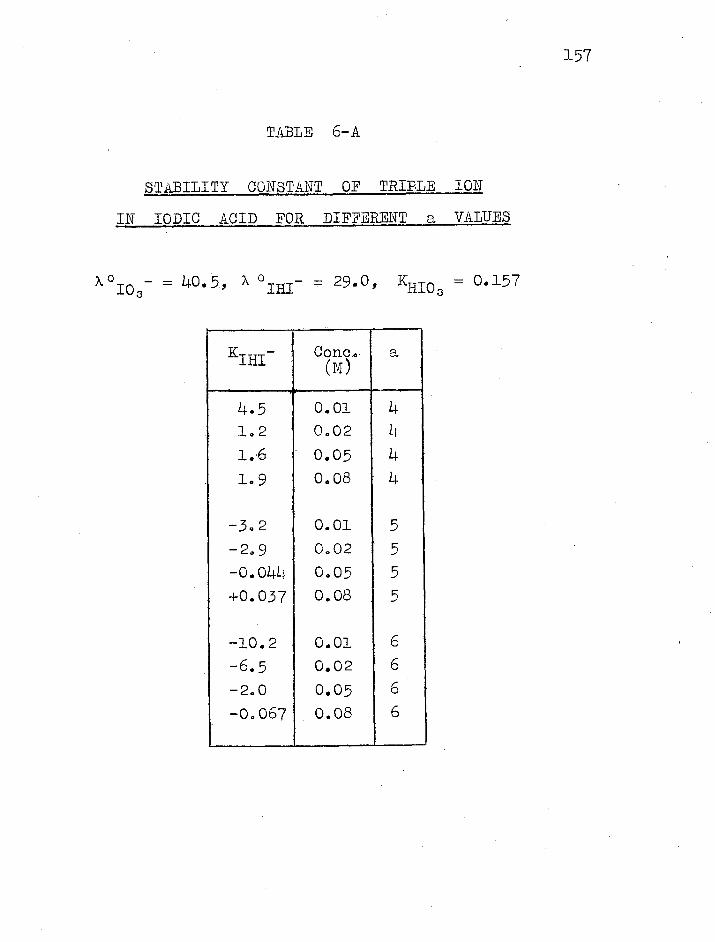
TABLE 6-A
STABILITY CONSTANT OF TRIPLE ION
IN IODIC ACID FOR DIFFERENT a VALUES
X°I03 = 40.5 X0IHI - 29.0, KHI03 = 0.157
KIHI- Conc. (M)
a
4.5 0.01 4
1.2 0.02 4
1.6 0.05 4
1.9 0.08 4
-3.2 0.01 5
-2.9 0.02 5 -0.044 0.05 5
+0.037 0.08
-10.2 0.01
-6.5 0.02
-2.0 0.05
-0.067 0.08
157

TABLE 6-3
STABILITY CONSTANT OF TRIPLE IONS
IN IODIC ACID FOR a = 3A
103- = 40.5' %°IHI = 29.0, K -H103 = 0.157
KIHI- Conc. (N)
a
12.7 0.01 3
5.8 0.02 3
4.1 0.05 3
4.1 0.08 3
** 3.0 0.01 3
* 8.6 0.01 3
* 4.2 0.02 3
** Transference number decreased by 0.0001
* Transference number decreased by 0.0002
158
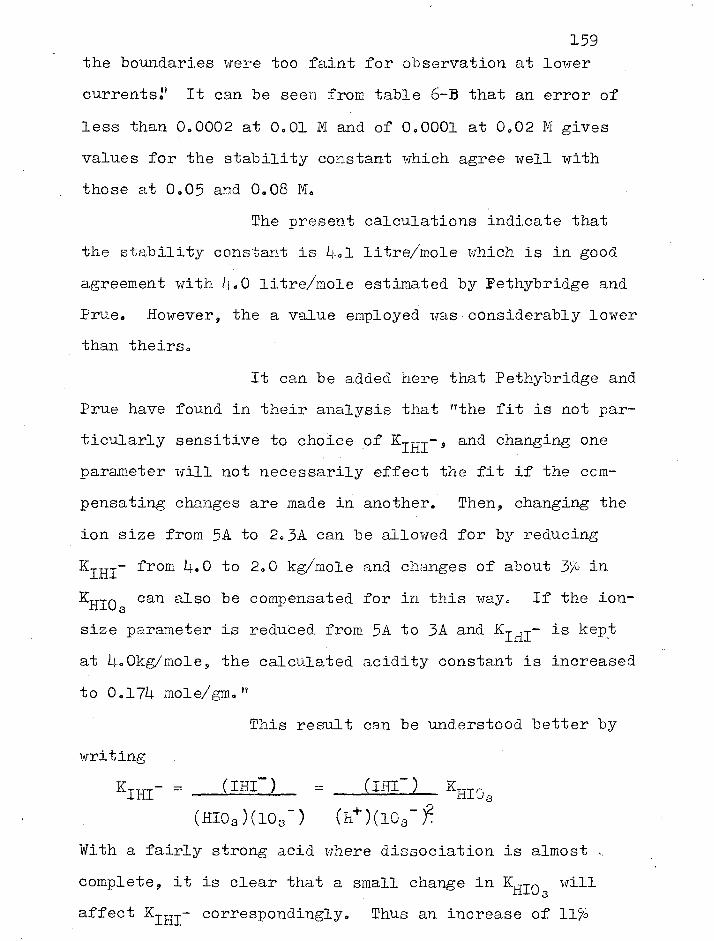
159
the boundaries were too faint for observation at lower
currents It can be seen from table 6-B that an error of
less than 0.0002 at 0.01 M and of 0.0001 at 0.02 M gives
values for the stability constant which agree well with
those at 0.05 and 0,08 M.
The present calculations indicate that
the stability constant is 4.1 litre/mole which is in good
agreement with 4.0 litre/mole estimated by Pethybridge and
Prue. However, the a value employed was considerably lower
than theirs.
It can be added here that Pethybridge and
Prue have found in their analysis that "the fit is not par-
ticularly sensitive to choice of KIHI- and changing one
parameter will not necessarily effect the fit if the com-
pensating changes are made in another. Then, changing the
ion size from 5A to 2.3A can be allowed for by reducing
KIHI from 4.0 to 2.0 kg/mole and changes of about 36 in
KHIO3 can also be compensated for in this way. If the ion-
size parameter is reduced from 5A to 3A and KIRI- is kept
at 4.0kg/mole, the calculated acidity constant is increased
to 0.174 mole/gm."
This result can be understood better by
writing
KIHI- = (IHI-) KHIO3
(HI03)(103 ) (h+)(103-)2.
With a fairly strong acid where dissociation is almost
complete, it is clear that a small change in KHIO3 will affect Kill,- correspondingly. Thus an increase of 11%

160
in KHI03 will lead to an increase of 11c/0 in K IHI P i.e. from 4.0 to 4, 44. The problem should really be
solved by successive approximations, but it seems likely
that the concentration dependence of the H103 transference
numbers is consistent with the activity coefficient results
and both of these with the triple ion hypothesis.
6.2 PERCELORIC ACID
Cation transference numbers in aqueous
perchloric acid solutions have been determined by
Longsworth (6), Covington and Prue (7) and Banerji and
Sirivastava (8). The experimental T+ values of the
latter workers differ by 0.002 in places from those
of Covington and Prue but both workers have recorded a
maximum in the T+ versus c plot beyond 0.06 M. In the
low concentration range Banerji et al. have found an
agreement with the D.H.0 limiting equation. Some of the
values of these two workers have been recorded in table
6-C.
To explain the bulge (and the corres-
ponding minimum in the T_ values), the T,,, values uio4
were treated for the presence of complex ion C104.H, .01404
in the same way as for other acids. The stability con-
stants so determined are collected in 6-D and 6-E.
It is to be noted that the calculations
require a correct value for the dissociation constant
of the acid to obtain the stability constant of the

TABLE 6-C
TRANSFERENCE NUMBERS IN AQUEOUS
PERCBIORIC ACID SOLUTIONS AT 25°0
No. CONC. (N)
TH+ T* - 0104
**1 0.0584 0.8469 0.1531 2 0.0591 0.8473 0.1527 3 0.0765 0.8468 0.1532 4 0.0993 0.8455 0.1545 5 0.1011 0.8452 0.1548
6 0.0224 0.8462 0.1538 7 0.0336 0.8478 0.1522 8 0.L448 0.8490 0.1510 9 0.0560 0.8492 0.1508
10 0.0671 0.8486 0.1514
Obtained by substracting TH+ from 1
** 1-5 by Covington and Prue 6-10 by Banerji and Sirvastava
161
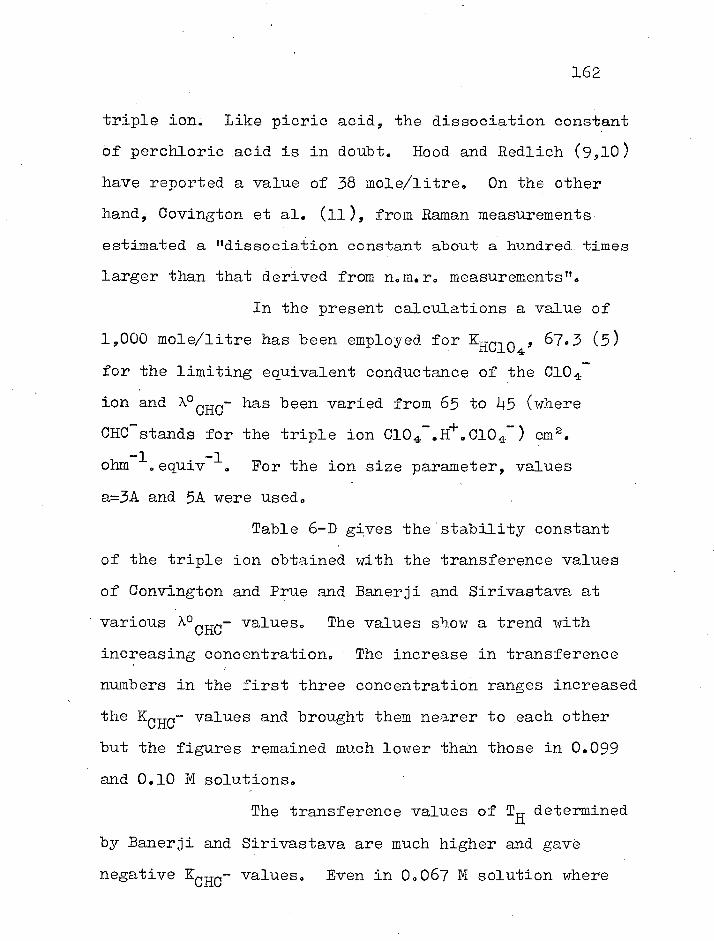
162
triple ion. Like picric acid, the dissociation constant
of perchloric acid is in doubt. Hood and Redlich (9,10)
have reported a value of 38 mole/litre. On the other
hand Covington et al. (11), from Raman measurements
estimated a "dissociation constant about a hundred times
larger than that derived from n.m.r. measurements".
In the present calculations a value of
1,000 mole/litre has been employed for Klic104, 67.3 (5)
for the limiting equivalent conductance of the 0104
ion andAPCHC- has been varied from 65 to 45 (where
CHC-stands for the triple ion C104 .11 1-.0104 ) cm2.
ohm i.equiv-1. For the ion size parameter, values
a=3A and 5A'were used.
Table 6-D gives the'stability constant
of the triple ion obtained with the transference values
of Convington and Prue and Banerji and Sirivastava at
CHC- various X° values. The values show a trend with
increasing concentration. - The increase in transference
numbers in the first three concentration ranges increased
the K0110- values and brought them nearer to each other
but the figures remained much lower than those in 0.099
and 0.10 M solutions.
The transference values of TH determined
by Banerji and Sirivastava are much higher and gave
negative K0110- values. Even in 0.067 M solution where

163
TABLE 6-D
STABILITY CONSTANT OF TRIPLE IONS IN
PERCEIORIC ACID
''90104- = 67°3, KHC104 = 1000, a = 3A
% CHC_ KCHC- x 10 4 at
0.o58411 o.o591m (1).0765m 0.o993m o.loilm
65(a) 0.69 0.56 0.73 0.89 0.93 60 0.85 0.67 0.91 1.10 1.15 55 1.06 0.85 1.15 1.44 1.51 50 1.42 1.13 1.55 1.99 2.10 45 2.07 1.65 2.35 3.36 3.57
65(b) 0.73 0.60 0.77 - - 60 0.89 0.71 0.93 - - 55 1.11 0.90 1.19 - - 50 1.49 1.21 1.60 - - 45 2.18 1.76 2.43 - _
, 0.0224 0.0.536M 0.0W18M 0.0560M 0.0671M
45(c) -3.59 -2.20 :-1.41 -0.36 +0.75
Using transference data of Covington and Prue Transference numbers in (a) increased by 0.0001 Using transference data of Banerji and Sirivastava

TABLE 6-E
STABILITY CONSTANT OF TRIPLE IONS IN
PERCHLORIC ACID'
C104- = 67.3, KHC104 X . 1000, a = 5A
o x CHC _ KCHC - x 10 4 at
0.0584M 0.0591M 0.0765M 0.0993M 0.1011M
65(a) 0.29 0.18 0.39 0.54 0.57
60 0.35 0.21 0.47 0.66 0.70
55 0.43 0.26 0.59 " 0.84 0.90
50 0.57 0.33 0.79 1.16 1.24
45 0.83 0.49 1.17 1.80 1.95
(a) Using transference data of Covington and Prue.
164

165
the value is positive, it is much lower than for the
corresponding concentration used by Covington and Prue.
Values with a=5A° show a big scatter (Table 6-E).
Considering the first three values in
the concentrations 0.0584, 0.0591 and 0.0993 M, the
stability constant can be taken as 1 x 10⁴ litre/
mole. This is a big quantity and it is difficult to
assign any physical meaning to it.
In the concentration range over which
the maximum appears, the theory is not expected to
hold too well and the treatment does not prove the
existence of such ions.
6.3 NITRIC ACID
Transference numbers in aqueous nitric
acid solutions have shown a similar concentration
dependence as noted for perchioric acid. The figures
of Covington and Prue (7) in the concentration range
0.04-0.10 M show a maximum beyond 0.05 M while the studies
of Banerji et al. (12) in the concentration range 0.004-
0.09 M, on the contrary, show agreement with the theory.
To explain the concentration dependence
in terms of the triple ion NO3 .1e.NO3 , transference
numbers in the concentration range 0.004-0.10 were
treated in the usual way.
'Different values for the dissociation

166
constant of nitric acid have been reported by Redlich
and Bigelersen and by Hood and Redlich (13,14) from
their proton magnetic resonance studies. The values
range from 21 to 27.5. Recently (15) a much larger
dissociation constant has been obtained.
For the following calculations a
value of 22 was employed and 71.46 cm2ohm 1equiv:1(5).
was used for the limiting equivalent conductance of
NO3 andfor?0„-(where NHN represents the triple ion NruN
NO;.H+.NO3 ), values from 70 to 50 was incorporated.
The results with a=3A and a=5A and with increased
transference numbers have been collected in tables
6-F and 6-G.
The tables contain only those stability
constants obtained by using the transference data of
Covington and Prue. The triple ion constant worked
out to be negative at each concentration with the trans-
ference results of Banerji et al. and so the results
are not included in the table.
The results, with a=3A show a trend in

TABLE 6-F
STABILITY CONSTANT OF TRIPLE IONS
IN NITRIC ACID
0
X NO; = 71'46, KHNO3 = 229 a= 3A
0 x NHN_ - K NHN at
0.0431 M 0.0584 M 0.0821 M 0.1002 M
70(a) -66.5 22.4 51.6 52.7
65 -77.2 26.2 60.7 62.2
60 -92.2 31.5 73.7 75.9
55 -114.3 39.5 93.6 97.3
50 -150e5 53.0 128.3 135.3
70(b) -44.5 29.1 - -
65 -51.8 34.0 - -
60 -61.9 40.9 - _
55 -76.9 51.3 - -
50 -101.4 68.8 - -
(a) Using transference numbers of Covington and Prue
(b) Transference numbers increased by 0.0001
167

TABLE 6—G
STABILITY CONSTANT OF TRIPLE IONS ,IN
NITRIC ACID
NO 3 = o Kinio 3 = 22, a = 5A
%o NEN _ KNBli— at
0.0431 M 0.0584 M 0.0821 M 7 0.1002 M
70 (a) -138.9 -45.6 -5.4 +4.2
65 -160.9 -53.0 -6.2 +4.9
60 -191.1 -63.3 -7.5 +5.8
55 -235.2 -78.4 -9.4 +7.4
50 -305.8 -103.3 -12.5 +9.9
(a) Using transference numbers of Covington and Prue
168

169
all the concentrations and the allowance of the experi-
mental errors in the transference numbers does not affect
the over-all situation. ValueS with a=5A (Table 6-G)
are negative at the first three concentrations and the
positive value at 0.1002 M is much less than that ob-
tained with a=3. It would therefore seem that the con-
centration dependence of the transference numbers of
HNO3 cannot be explained by the presence of triple ions,
and it may simply be that D.H.0 theory no longer applies
to the results at the higher concentrations. An alter-_
native, but perhaps less likely, explanation, is that
the experimental results themselves are somewhat in
error. Covington and Prue used only autogenic runs and
Banerji et al. only the Kohlrausch concentration of
indicator, neither group therefore varied the indicator
concentration nor do they seem to have tested a variation
of current or of closed electrode. It may be significant
that the transference numbers of the two groups differed
by up to 0.0025, and a re-determination using anion
boundaries might be useful.
6.4 SUMMARY
In table 6-H the results of the present
work and of triple ion constants obtained from the litera-
ture have been summarised. Selvaratnam and Spiro (16),
commenting on a much smaller number of examples, con-
cluded that the Kt values were all of a similar order

TABLE 6-H
STABILITY CONSTANT OF VARIOUS
TRIPLE IONS IN WATER AT 2§°C
Triple ion Stability constant
H131\103 ) C61120 - 200 2 2
H 6-1000 ( CHOH ) 20003 ca. 1 2
H(103) - Li- 2 H(NO3 ) - -
2 H(0104) - ca. 1 x 10'
2 H(H2PO4.) - 3
2
HF 2- 4
170

171
of magnitude, namely unity. The tartrate result hears
this out but not that for picric acid and still less
the - admittedly very doubtful - figure for perchloric
acid. However, the effect on the free energy of triple
ion formation is relatively small, for a factor of 100
in affects AG° by Ktriple
-2.303 x 1.987 x 298.2 x logic (100)
or aboat 2.7 Kcal.
As mentioned in the text, it would be
of interest to measure the anion transference numbers
of nitric and perhaps perchloric acid to check the
validity of the conclusions reached, and also to measure
the anion transference numbers of other acids such as
citric acid. Clearly further work, especially spectro-
scopic, is called for to substantiate the conclusions
and to detect other species that probably exist in the
more concentrated acid solutions.

172
REFERENCES
Chapter VT
(1) A.D. Pethybridge and J.E. Prue, Trans.Faraday Soc., 61, 2019 (1967)
(2) M. Spiro, J.Phys. Chem.1 60, 976 (1956) (3) E. Abel, 0. Redlich and P. Heroch, Z.physik.Chem.A,
122, 112 (1934) (4) J. Lange and E. Herre, Z.physik.Chem.A, 181, 329 (1938) (5) R,A. Robinson and R.H. Stokes, Electrolyte solutions
2nd edn. Appendix 6.1 Butterworths, London (1959) (6) L.G. Longsworth, J.Amer.Chem.Soc., 5.4, 2741 (1932) (7) A.K. Covington and J.E. Prue, J.Chem.Soc., 1567
(1957) (8) K. Banerji and R.D. Sirivastava, Z.physik.Chem.
(Frankfurt), 21, 234 (1963) (9) G.C. Hood and 0. Redlich, J.Chem.Phys., 22, 2067
(1954) (10) G.C. Hood and 0. Redlich, J.Chem.Phys., 12, 127
(1960) (11) A.K. Covington, M.J. Tait and W.F.K. Wynne-Jones
Proc.Roy.Soc., A 286, 235 (1965) (12) K. Banerji, R.D. Sirivastava and R. Gopal, J.Indian.
Chem. Soc., Lc!, 651 (1963) (13) 0. Redlich and J. Bigeleisen J.Amer.Chem.Soc., 5_5,
1883 (1943) (14) Ref. (9) (15) Private communication from Dr. A.K. Covington (16) M. Selvaratnam and M. Spiro, Trans.Faraday Soc.,
610 360 (1965)

tc11ENDIX
173
JOB LSCx IPQx , SPIRO RUN2o2 COMPUTING 2000 INSTRUCTIONS OUTPUT o SEVEN HOLE PUNCH 4 BLOCKS STORE 32/45 BLOCKS COMPILER EXCHLF
TITLE HYDROLYSIS EQUILIBRIA CHAPTER°
NE WL I NE CAPT ION STAR IL ITY CONSTANT OF TRIPLE ION MEWL I NE
N IODIC ACID RUN202 WITH A=3
4) RE AD( AI pL 3) RF. AD( A2) READ(A3) READ( AO A=1 • I) R=4,SQRT( A 3A) C=I-FR D=R/C E=40.5-39.64D E=349.8-11o.779D G=A4-*(o.- 23A4+30.325)D H=*EXP( -2. 348140) U=*( 2q-E )/E .V=*(E-G)/*(E+F ) W=E/*(E+F ) X=U +V . Y=A2-W Wn= XW Z=Y/wn An=1-1-7. Rn=mAn Xn=i Cn=A3H • Dn=s5QRT( BnBn-1-4ArCnxn) Yn=2CnXn En=*( -Bn+Dn)/Yn Fn= 4,MOD( *( A-E n)/En) JUMP2,0.0000000I>Fn• A=E
KR103 ,t EX/10).0714dd 44,014,11,04Aitt rua'A•LeA. 7103 r rer>1 C 1-1.10 3
A4 :01 /hr. -Path zo3-.kr: los A trA14.4.1 of
D Vria)/(14 Ba 0.4.0z) E 3 10 - = A°01 (A° .9 #13)b
/
z n P/0(
E Sten,/ valut et
cl-4..;.a- aZateni
F c 4H+
mu'
, V , W, y 6-D •Otiv4.

7
h ) aol 044 X et, dr/44 er. (1-3- r)
Caws 0.4,44
42/4 cis /O3 , H t /O,
JJMPI )C2:n=A3AXII
un=Fin-An Zn=r1111.3 n Vnz--7/7;;
INE PR INT(vn, 0,5 ) SPACE2 PRINT( Ai oo,5) SPACE 2 PRINT( A2 0,5) SPACE 2 PRINT(A3,o,5) SPACE2 PRINT( A490,5) SPACE2 PRINT( A,0,5)
SPACE 2 PRINT(R, 0,5 ) SPACE2 PRINT( Do 0,5) SPACE2 PRINT( ZtOf 5) JUNP4 3)END CLOSE
PA;44.4:ti 4:44.444

ION AND VI SCOSI TY CORRECTION RU Na
= arte. /titha = A = K gPic,
4 in.i,CIAZ vedue. 0(
C, D, E a44,1 F to .0ereic. etn, -3-Woy .
p H = 13/2(
1.1 = (mom) 74
V = I+ Ba 04c4) (4 X = A 7 8n,Cn, Dr; E 4444657 4144 3 4)
= -Sect:no( vo/44t og
.iAcat'rri
t/ n=is .= Ap;e:.+ 13)14
V" w imp- APHP- 8 +/8)W n = (14.8m) A = col-etzet;),
V41.4 ( 40,4 — 4o-) 6.14 ie-r, ta-v1.444;fts.
•
APPENDIX 2 JOB LSO' IPQI 'SPIRO RUNa 2 COMPUTING a000 INSTRUCTIONS OUTPUT o SEVEN HOLE PUNCH 4 BLOCKS STORE 12./45 BLOCKS COMPILER EXCHLF TITLE HYDROLYSIS EQUILIBRIA C HAPTE Ro A-P 4 NEWL I NE CAPTION IVES CONDUCTANCE WITH TRIPLE 4)NEWL INE FEAD(AT,L3) READ(Aa) READ(A3) RF. AD ( A4)
)B=A4AI C=i+B D=*( AA—A) E=*SQRT(CC+40BO) F=all G=*(C—E)/F H=G / A U=*SQRT( MA)
4-x .98U W /V X=vEXP( —a• 348 / 4 W)
A,v,:t+H Bn=AnA 3 Cn=r—H D 11=C sIX E ti=*SQRT( BnBn+4A 3A 'DO Fn=aAiDti
( -811+E n)/Fn Hpv--*MOD(*( A-qn) kin) anIP3 ,0•00000/>Hn A-C-1 n JU MP x 2)Urit--- 30. 39-37. 317W Vn=30.0-37 .225W Wrrz.7*(Un--\/n)H Xn=i0 ( 38A1 )A2 Yn=Xn/A+1,111 Z=3804112k-148•114A

PR INT(Y nto,$) SPACE 2 PR INT( 0, 5) SPACE 2 PRINT(11,0,5 ) SPACE 2 PRINT(A3,o,5) SPACE 2 PR INT( A4 yot 5) SPACE 2 PR INT( CI, 0 5) SPACE 2 PR INT(Crnto• 5) SPACE2 PRINT( lit 0.5) JUI1P4 3)END CLOSE
176
0;t4tAudarn-J
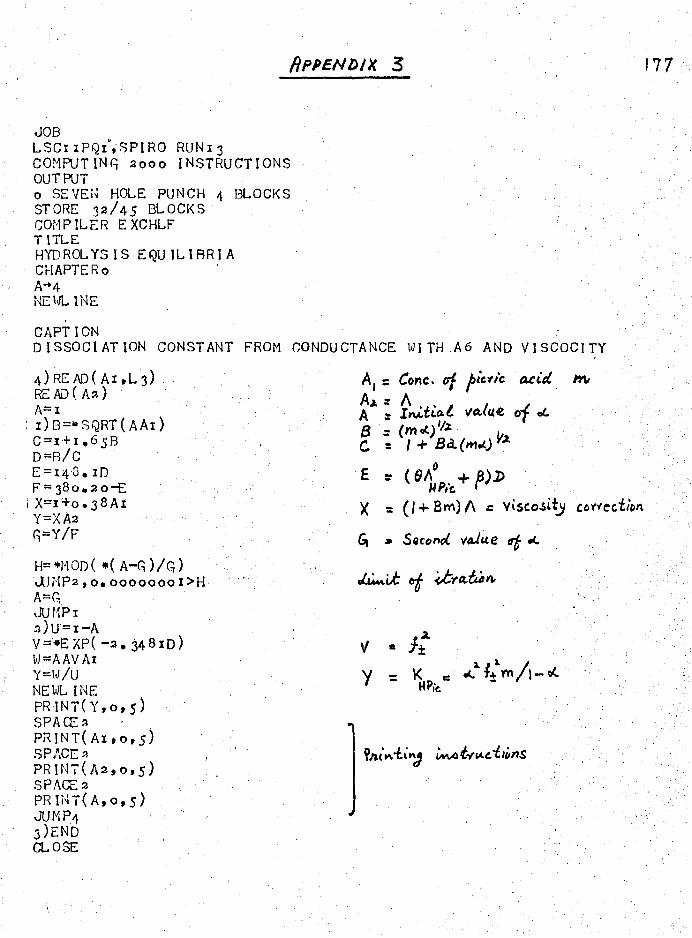
Ai Cone. Of 16iCY1C acid in,
AA .
A = in,i,tiat value el a,
C. + (r.9:a..0.4.0 7112 E OA° pi)
+ Bm) A .= viscosity
GI a Second value
4;44.i ot 42-"ratii,
= y Ktipt.e= 41_
1 P1 /1— 04
WK-Uncl L*.t...tiyitoidaes
COreCCtion
RepeNDix 3 177
JOB LSCI IPQx%;SPIRO RUN x 3 COMPUT IN(; 2000 INSTRUCTIONS OUT PUT o SE VEN HOLE PUNCH 4 BLOCKS STORE 32/45 BLOCKS COMPILER E XCHLF T ITLE HYDROLYSIS EQUILIBRIA CHAPTER° A-'4 NEWL 1NE
CAPTION DISSOCIATION CONSTANT FROM CONDUCTANCE WI TH A6 AND V I SCOCI TY
4) RE AD ( Ax ,L 3) READ( A2) A=1 I)B=*SQRT(AAx) C=x+1,65B D=R/C E=x48. ID F=380.2o—E
i X=1 +0.38Ax Y=XA2 G=Y/F
H= +MOD ( 40( ) /G juMp2,0.000000ox>H A=G JUMP' 2)U=x —A V =*E XP( —2. 34 810 ) W=AAVAx Y=W/U MEWL INE PRINT(Y,o,5) SPACE 2 PRINT( 111100,5) SPACE 2 PRINT(A2,095) SPACE 2 PR INT( A, 0, 5) JUNP4 3)END CLOSE