Transfer Pricing Practical Cases Pharmaceutical Sector · Transfer Pricing Practical Cases...
14
1 Evelyn Cooban – Head of Transfer Pricing José Galindez – Transfer Pricing Advisor IADB – MEF Transfer Pricing Practical Cases Pharmaceutical Sector Agenda 3. Case 1. Resale Price Method 2. 1. Case 2. Transactional Net Margin Methods Transfer Pricing Rules 4. Questions
Transcript of Transfer Pricing Practical Cases Pharmaceutical Sector · Transfer Pricing Practical Cases...
1
Evelyn Cooban – Head of Transfer Pricing
José Galindez – Transfer Pricing Advisor
IADB – MEF
Transfer Pricing Practical
Cases
Pharmaceutical Sector
Agenda
3.
Case 1. Resale Price Method2.
1.
Case 2. Transactional Net Margin Methods
Transfer Pricing Rules
4. Questions
2
Case 1. Resale Price Method2.
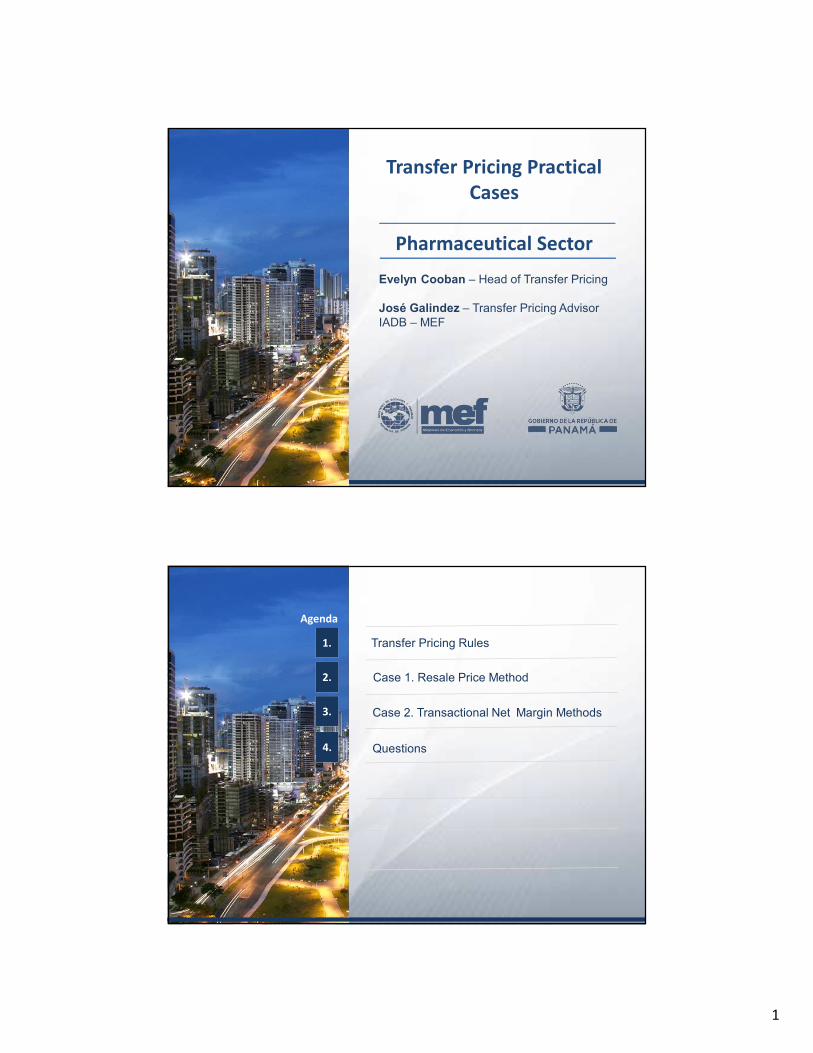
Arm’s Length
Principle
Associated
enterprise
Capital
Control
Transactions
Revenues
Cost
Expenses
Comparability
analysis
The 5
Comparability
Factors
Case 1. Resale Price Method2.
Methods
Comparable Uncontrolled
Price Method
Cost Plus Method
Resale Price Method
Profit Split Method
Transactional Net
Margin Method
3
Case 1. Resale Price Method2.
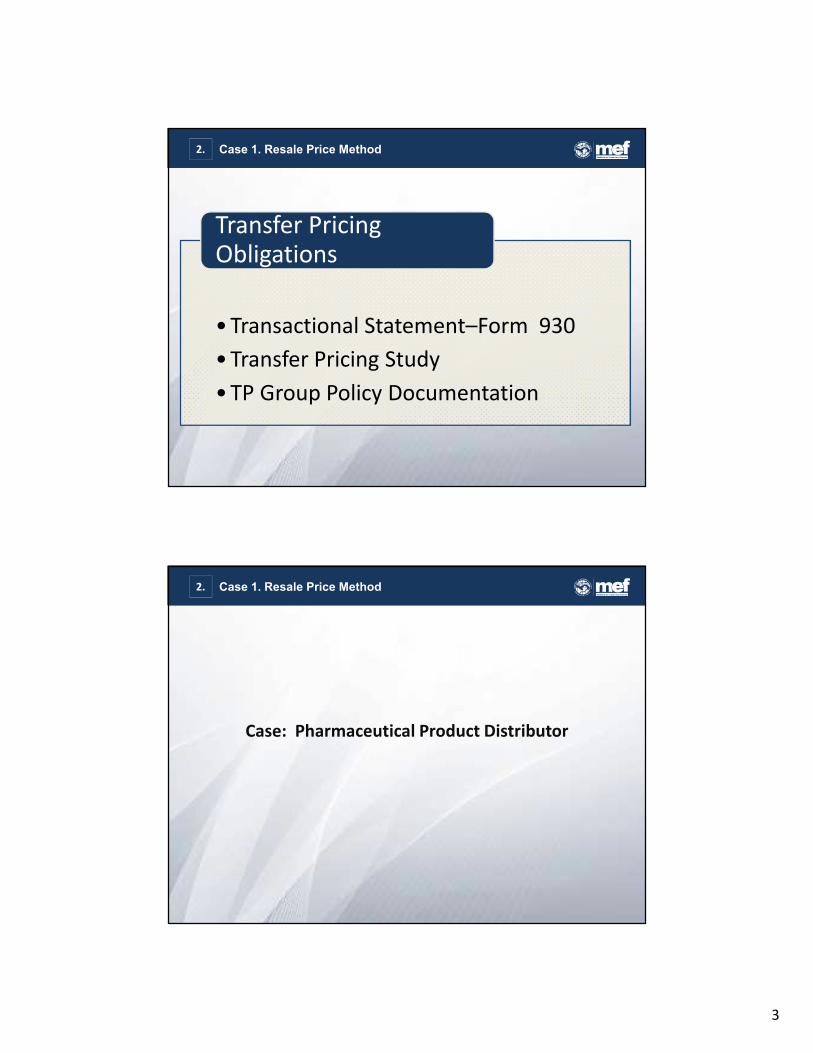
• Transactional Statement–Form 930
• Transfer Pricing Study
• TP Group Policy Documentation
Transfer Pricing
Obligations
Case 1. Resale Price Method2.
Case: Pharmaceutical Product Distributor
4
Case 1. Resale Price Method2.
Facts:
• Goods purchases to related parties.
• Goods sold to related parties.
Case 1. Resale Price Method2.
Fact:
• TNMM (used by the tax payer).
5
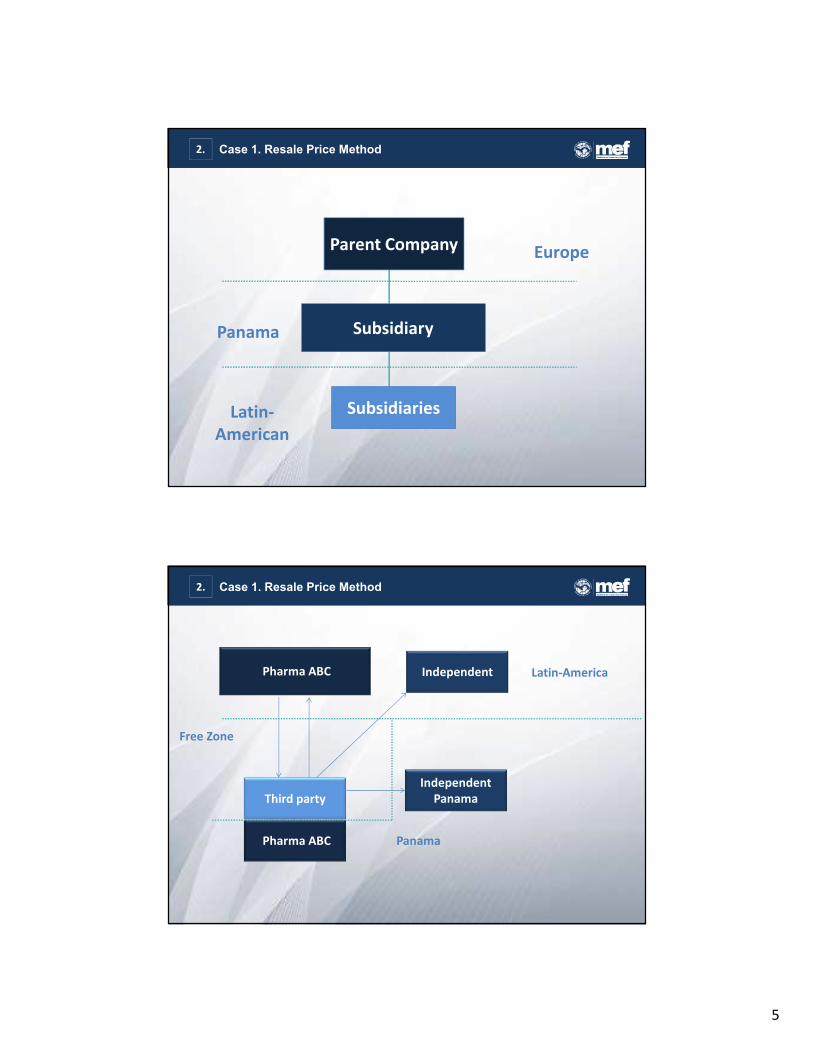
Panama
Parent Company
Subsidiary
Subsidiaries
Europe
Latin-
American
Case 1. Resale Price Method2.
Pharma ABC
Pharma ABC Panama
Free Zone
Latin-America
Third party
Independent
Independent
Panama
Case 1. Resale Price Method2.
6
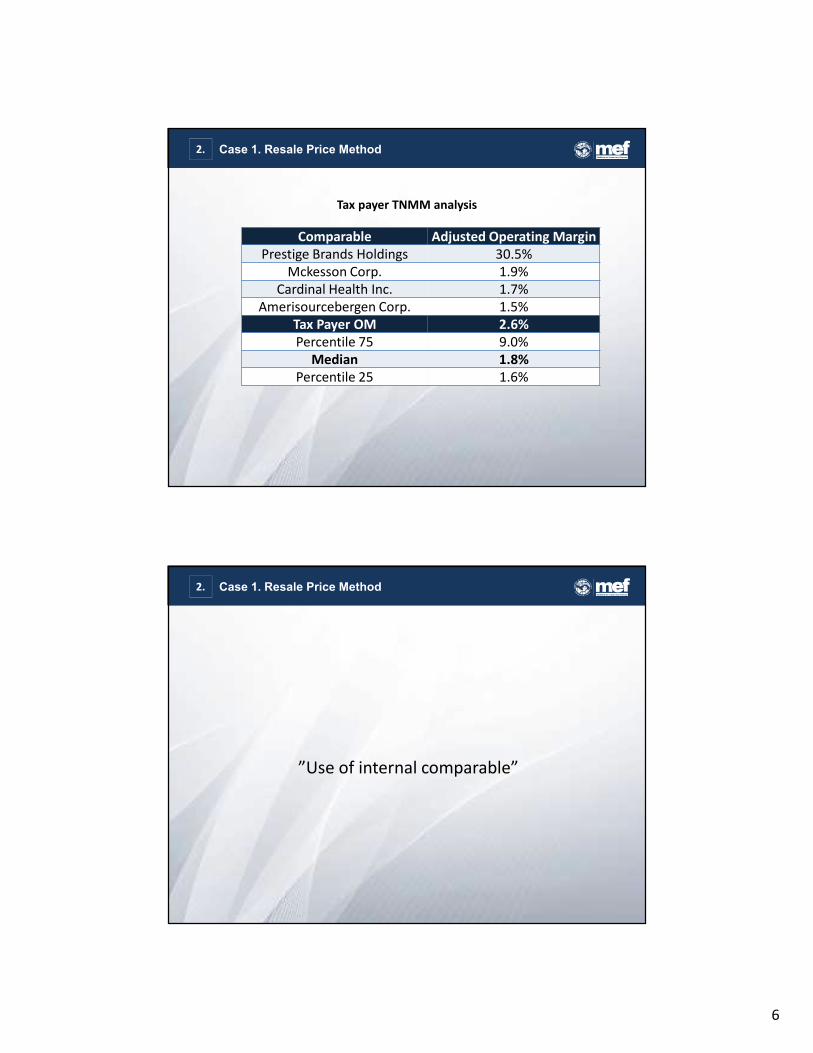
Tax payer TNMM analysis
Comparable Adjusted Operating Margin
Prestige Brands Holdings 30.5%
Mckesson Corp. 1.9%
Cardinal Health Inc. 1.7%
Amerisourcebergen Corp. 1.5%
Tax Payer OM 2.6%
Percentile 75 9.0%
Median 1.8%
Percentile 25 1.6%
Case 1. Resale Price Method2.
”Use of internal comparable”
Case 1. Resale Price Method2.
7
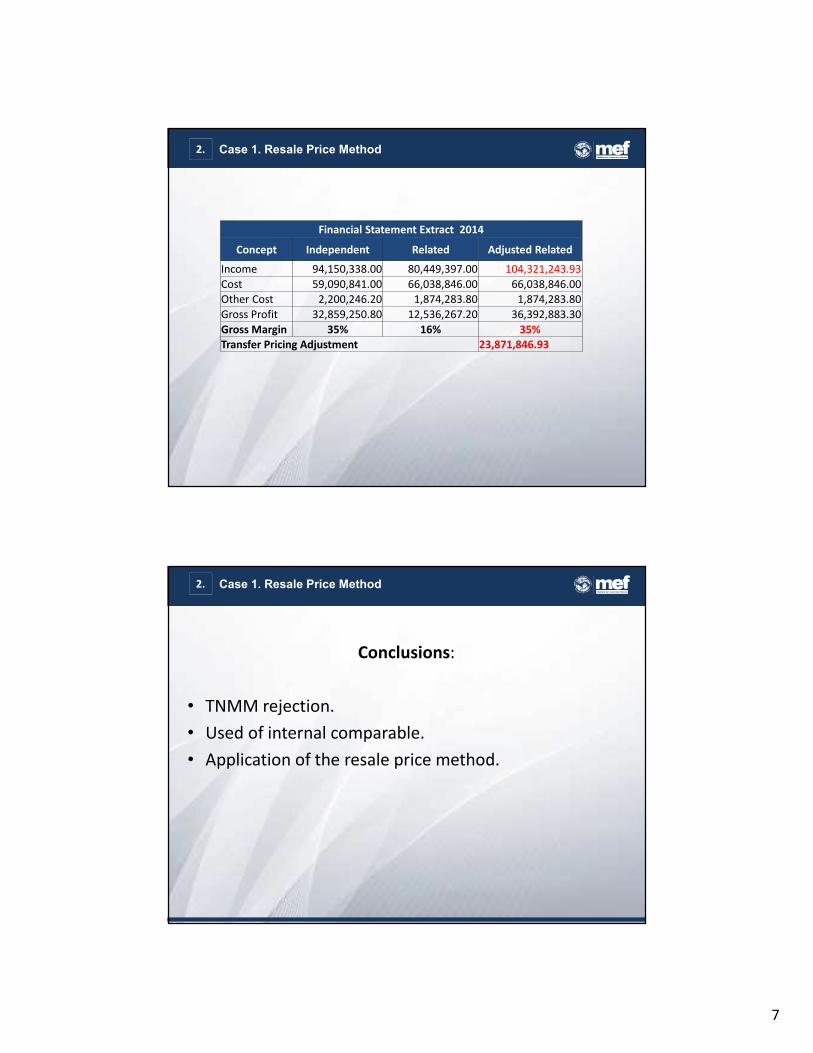
Financial Statement Extract 2014
Concept Independent Related Adjusted Related
Income 94,150,338.00 80,449,397.00 104,321,243.93
Cost 59,090,841.00 66,038,846.00 66,038,846.00
Other Cost 2,200,246.20 1,874,283.80 1,874,283.80
Gross Profit 32,859,250.80 12,536,267.20 36,392,883.30
Gross Margin 35% 16% 35%
Transfer Pricing Adjustment 23,871,846.93
Case 1. Resale Price Method2.
Case 1. Resale Price Method2.
Conclusions:
• TNMM rejection.
• Used of internal comparable.
• Application of the resale price method.
8
Case: Pharmaceutical Product Manufacturing
Case 2. Transactional Net Margin Method3.
Facts:
• Raw material purchase to a related party for
local manufacturing.
• Goods sold to related parties.
Case 2. Transactional Net Margin Method3.
9
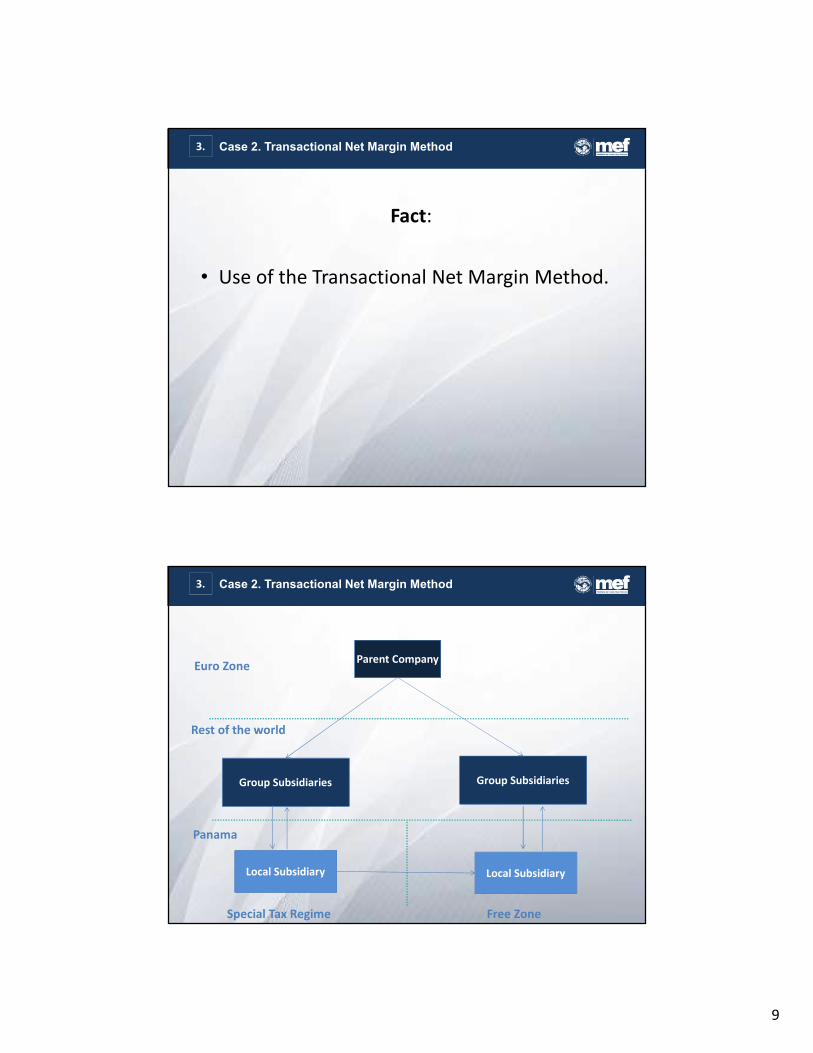
Fact:
• Use of the Transactional Net Margin Method.
Case 2. Transactional Net Margin Method3.
Parent Company
Group Subsidiaries
Local Subsidiary
Panama
Rest of the world
Free Zone
Local Subsidiary
Euro Zone
Special Tax Regime
Group Subsidiaries
Case 2. Transactional Net Margin Method3.
10
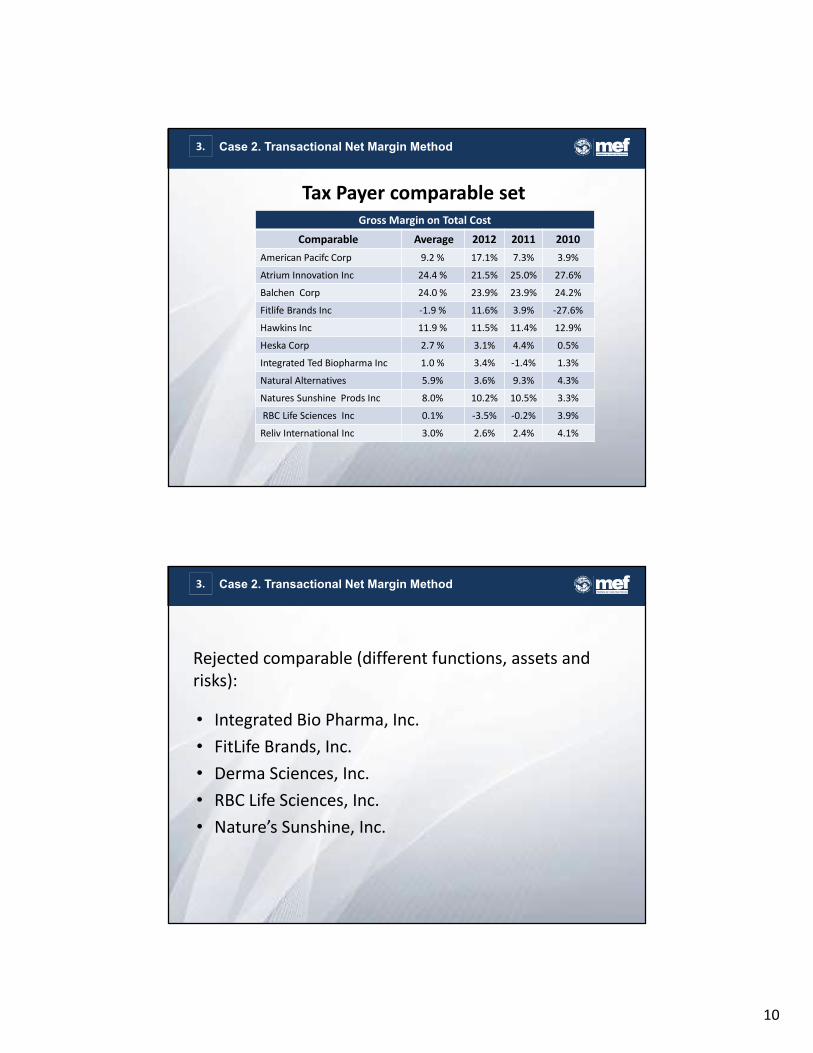
Tax Payer comparable set
Gross Margin on Total Cost
Comparable Average 2012 2011 2010
American Pacifc Corp 9.2 % 17.1% 7.3% 3.9%
Atrium Innovation Inc 24.4 % 21.5% 25.0% 27.6%
Balchen Corp 24.0 % 23.9% 23.9% 24.2%
Fitlife Brands Inc -1.9 % 11.6% 3.9% -27.6%
Hawkins Inc 11.9 % 11.5% 11.4% 12.9%
Heska Corp 2.7 % 3.1% 4.4% 0.5%
Integrated Ted Biopharma Inc 1.0 % 3.4% -1.4% 1.3%
Natural Alternatives 5.9% 3.6% 9.3% 4.3%
Natures Sunshine Prods Inc 8.0% 10.2% 10.5% 3.3%
RBC Life Sciences Inc 0.1% -3.5% -0.2% 3.9%
Reliv International Inc 3.0% 2.6% 2.4% 4.1%
Case 2. Transactional Net Margin Method3.
Rejected comparable (different functions, assets and
risks):
• Integrated Bio Pharma, Inc.
• FitLife Brands, Inc.
• Derma Sciences, Inc.
• RBC Life Sciences, Inc.
• Nature’s Sunshine, Inc.
Case 2. Transactional Net Margin Method3.
11
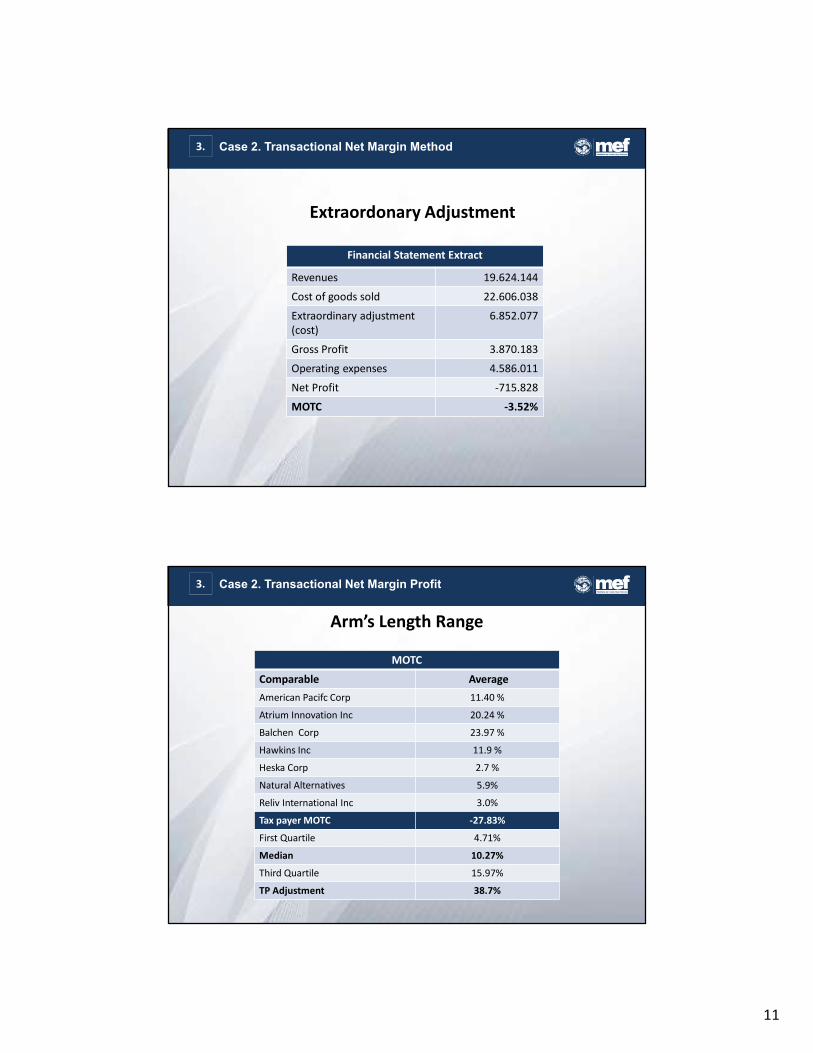
Extraordonary Adjustment
Financial Statement Extract
Revenues 19.624.144
Cost of goods sold 22.606.038
Extraordinary adjustment
(cost)
6.852.077
Gross Profit 3.870.183
Operating expenses 4.586.011
Net Profit -715.828
MOTC -3.52%
Case 2. Transactional Net Margin Method3.
Arm’s Length Range
MOTC
Comparable Average
American Pacifc Corp 11.40 %
Atrium Innovation Inc 20.24 %
Balchen Corp 23.97 %
Hawkins Inc 11.9 %
Heska Corp 2.7 %
Natural Alternatives 5.9%
Reliv International Inc 3.0%
Tax payer MOTC -27.83%
First Quartile 4.71%
Median 10.27%
Third Quartile 15.97%
TP Adjustment 38.7%
Case 2. Transactional Net Margin Profit3.
12
Conclusions
• Comparable rejection because of losses resultingfrom irregular situations.
• Comparable rejection because of different functions,assets and risks.
• Non-acceptance of the extraordinary adjustmentpropose by the tax payer.
• Turndown the use of multiple years financialinformation.
Case 2. Transactional Net Margin Method3.
Questions ?
Questions4.

13
¡THANKS FOR
THE
ATTENTION!