Transfer Pricing Methods Transactional Net Margin Method
15
Date 1 Transfer Pricing Methods Transactional Net Margin Method Presented by: Suchint Majmudar November 2009 PricewaterhouseCoopers November 2009 Slide 2 Agenda Transfer Pricing Methods • Introduction • Transactional Net Margin Method ‘TNMM’ • Comparable Profits Method ‘CPM’
Transcript of Transfer Pricing Methods Transactional Net Margin Method

Date
1
Transfer PricingMethods
Transactional
Net Margin
MethodPresented by:
Suchint Majmudar
November 2009
PricewaterhouseCoopersNovember 2009
Slide 2
Agenda
Transfer Pricing Methods
• Introduction
• Transactional Net Margin Method ‘TNMM’
• Comparable Profits Method ‘CPM’

Date
2
PricewaterhouseCoopersNovember 2009
Slide 3
Most Appropriate Method
• OECD advocates the use of Traditionaltransaction methods (CUP, RPM andCPM) over Transactional profitmethods (PSM and TNMM) [ChapterIII,3.49]
• Flexibility granted to taxpayer forselection of Most Appropriate Method
• No preference for any particularmethod under Indian transfer pricinglaw
Transfer Pricing Methods
PricewaterhouseCoopersNovember 2009
Slide 4
Selection of Most Appropriate Method [Rule 10C(2)]
• Factors determining Most Appropriate Method- nature and class of international transaction- class of associated enterprises and functions performed- availability and reliability of data- degree of comparability- extent and reliability of adjustments- nature, extent and reliability of assumptions
Transfer Pricing Methods

Date
3
PricewaterhouseCoopersNovember 2009
Slide 5
• Traditional transaction methods- Comparable Uncontrolled Price method (CUP)- Resale Price method (RPM)- Cost Plus method (CPM)
• Transaction profit methods- Profit Split Method (PSM)- Transactional Net Margin Method (TNMM)
• Any other method that may be prescribed by the CBDT
Transfer Pricing Methods
PricewaterhouseCoopersNovember 2009
Slide 6
Transactional Profit Methods – OECD Discussion Draft
• Use of more than one Method- Use of a transactional profit method in conjunction with a
traditional transaction method- Use of a sanity check to test the plausibility of the
outcome of a primary method
Transfer Pricing Methods
• Review of Transactional Profit methods- Status as method of last resort- Proposed amendments to TP Guidelines

Date
4
PricewaterhouseCoopersNovember 2009
Slide 7
TNMM
Transfer Pricing Methods
Identify net profit margin realized by the enterprise from aninternational transaction with regard to an appropriate base
Identify net profit margin from a comparable uncontrolledtransaction or a number of such transactions having regard tothe same base
Adjust for differences that could affect net profit in the openmarket
Adjusted net profit used for establishing Arm’s Length Price
PricewaterhouseCoopersNovember 2009
Slide 8
Application of TNMM
Transfer Pricing Methods
GP 40,000
B
Independent Distributor
Rs.
COGS 41,250GP 33,750
Admn.& Dist. 30,000
OP 3,750
Turnover 75,000
A
AE Distributor
TNMM(OP/Sales)
= 5%
Turnover 100,000TP 60,000
OP 5,000
Admn.& Dist. 35,000
Rs.
GP/Sales 45% GP/Sales 40%

Date
5
PricewaterhouseCoopersNovember 2009
Slide 9
Application of TNMM
Transfer Pricing Methods
Typical transactions where the TNMM may be used :- Provision of services- Distribution of finished products where RPM cannot be
adequately applied or in case of a full-fledged distributor- Transfer of semi finished goods
Inapplicability of all other methods – residuary method
PricewaterhouseCoopersNovember 2009
Slide 10
Application of TNMM
Marketing &management feesat Cost Plus + 6% -
Rs. 25 crs
Third Party
XYZ US
XYZ India
Contract value :Third party – XYZ US
Rs. 100 crs
XYZ India - XYZ US
ALP satisfied [proviso toSection 92C(2)]
TNMM(AE is tested party :
Comparables margin = 4.5%AE’s margin = 6%)
Contract value :XYZ US – XYZ
IndiaRs. 100 crs

Date
6
PricewaterhouseCoopersNovember 2009
Slide 11
Strengths and Weakness of TNMM
Transfer Pricing Methods
Strengths:- less affected by transactional differences- more tolerant to some functional differences- classification of expenses in the gross margin frequently
makes it difficult to evaluate the comparability of grossmargins; the use of net margins may avoid the problem
- Being a one-sided method, it is required to examine thefinancial indicator of the tested party alone
Weaknesses:- net margin can be influenced by some factors that either do
not have an effect, or have a less substantial or direct effect- these aspects may make accurate and reliable
determinations of arm's length net margins difficult
PricewaterhouseCoopersNovember 2009
Slide 12
Some Experiences..….
Transfer Pricing Methods
Aggregation of transactions
Loss situations
Choice of PLI
Startup companies, Business Strategies
Adjustment to net profit for calculating operating profit
Percentage of AE transaction to total revenue/costs
Preliminary/Pre-operative expenses
Pass through costs

Date
7
PricewaterhouseCoopersNovember 2009
Slide 13
Case Laws
Transfer Pricing Methods
Development Consultants Pvt Ltd – Tested Party and choice of method
Star India – Distinct and separate activities to be considered individually
Schefeneckar Motherson – Cash Profit Margin as PLI
Morgan Stanley – Use of TNMM as most appropriate method
UCB India – Inappropriate aggregation of transactions - TNMM analysis attransaction level
Honeywell Automation - Only those items of income/expenses havingnexus with profit/loss should be considered for comparability purposes
Skoda Auto – Economic adjustments to be made to results of tested partyand comparables for differences in functional profiles
PricewaterhouseCoopersNovember 2009
Slide 14
Summary of Methods
Methods ComparabilityRequirements Approach Remarks
CUP Very High Prices are benchmarkedVery difficult to apply asvery high degree ofcomparability required
RPM High Gross Profit margins arebenchmarked
Difficult to apply as highdegree of comparabilityrequired
CPM High Gross Profit margins arebenchmarked
Difficult to apply as highdegree of comparabilityrequired
PSM Medium Operating Profit marginsare benchmarked
Complex Method,sparingly used
TNMM Medium Operating Profit marginsare benchmarked
Most commonly usedmethod
Transfer Pricing Methods

Date
8
PricewaterhouseCoopersNovember 2009
Slide 15
• Each method, with the exception of the CUP method,examines a profit level indicator (PLI) relevant to the methodof analysis
• Specified financial ratio of the tested party is compared to theresults of independent, functionally comparable companies
Choice of Profit Level Indicators (PLIs)
Transfer Pricing Methods
PricewaterhouseCoopersNovember 2009
Slide 16
Profit Level Indicator (PLI) and Methods
Transfer Pricing Methods
RPMGP/Sales = GM
CPMGP/COP
TNMMOP/SalesOP/TCBerry Ratio = GP/OpexOP/VAE {Berry Ratio = 1+ (OP/VAE)}OP/CE or OP/AssetsCash Profit Margin

Date
9
PricewaterhouseCoopersNovember 2009
Slide 17
Choice of Profit Level Indicators (PLIs)Method PLI Formulae Typically used forRPM Gross margin Gross Profit/Sales Distributor
Cost Plus Gross cost plus Gross Profit/COGSManufacturer/
Service providerFull CostPlus/
TNMM
Net/Full cost plus(Return on totalcosts)
Operating profit/Total costs
(Total costs = COGS + OPEX)
Manufacturer/
Service provider
TNMM/PSM Operating margin Operating Profit/Net sales or net
turnover
Manufacturer/
Distributor/Serviceprovider
TNMM/PSM ROA Operating Profit/Operating
assets
Manufacturer/
Distributor/Serviceprovider
TNMM/PSM ROCE Operating Profit/Total assets –
Current Liabilities
Manufacturer/
Distributor/ServiceProvider
Transfer Pricing Methods
PricewaterhouseCoopersNovember 2009
Slide 18
Comparable Profits Method
• Reg. § 1.482-3 read with Reg. § 1.482-5 - Assigns an arm’slength return for the controlled transfer of tangible propertybased on profit level indicators (“PLIs”) of uncontrolled partiesperforming activities similar to those of the controlled testedparty.
• Looks at the party that is the least complex in terms offunctions, risks, and intangibles owned (“tested party”).
• The Comparable Profits Method is most commonly used withPLIs that are based on operating profit.
Tangible Property Methods

Date
10
PricewaterhouseCoopersNovember 2009
Slide 19
Comparable Profits Method
Specified PLIs• Return on assets (return on capital employed);• Operating margin;• Berry ratio (GP/OE); or
Other appropriate financial ratios where the denominator doesnot reflect controlled transactions.• Cannot use operating margin if selling to related parties
(controlled sales in denominator).• Cannot use GP/COGS or OI/TC if buying from related parties
(controlled costs in denominator).
Tangible Property Methods
PricewaterhouseCoopersNovember 2009
Slide 20
Comparable Profits Method
Adjustments required if material, identifiable differences existbetween the unrelated and related transactions.• One type of adjustment is an “asset intensity,” “balance sheet,”
or “working capital” adjustment. This adjustment is performedwhen a CPM is used, either by itself or as part of anothermethod such as a residual profit split. Adjustments are fordifferences in A/R, A/P, and inventory.
• Other adjustments include PP&E adjustments and SG&Aadjustments.
The CPM is the most commonly utilized method to test anddocument the arm’s length nature of a tangible propertyintercompany transaction.
Tangible Property Methods

Date
11
PricewaterhouseCoopersNovember 2009
Slide 21
Comparable Profits Method
• Encourages segmentation of financials.
• Discourages use of industry average.
• Discourages analyzing company-wide profitability when there isa distinct differences between lines of business.
• Proper application of CPM under U.S. regulations is consistentwith Transactional Net Margin Method (TNMM) under OECDGuidelines (assumes comparable transactions arecomparables’ only transactions).
Tangible Property Methods
PricewaterhouseCoopersNovember 2009
Slide 22
Comparable Profits Method
• The choice of tested party can reflect a choice about how toallocate risk.
• Assigning a party only a routine return implies viewing thatparty as a mere service provider; a profit split, in contrast,implies viewing that party as a risk-taking entrepreneur or jointventure partner.
• Normally, the parties’ own definition of their relationship shouldbe accepted unless it is inconsistent with their conduct and theeconomic substance of the transactions.
Tangible Property Methods
Date
12
PricewaterhouseCoopersNovember 2009
Slide 23
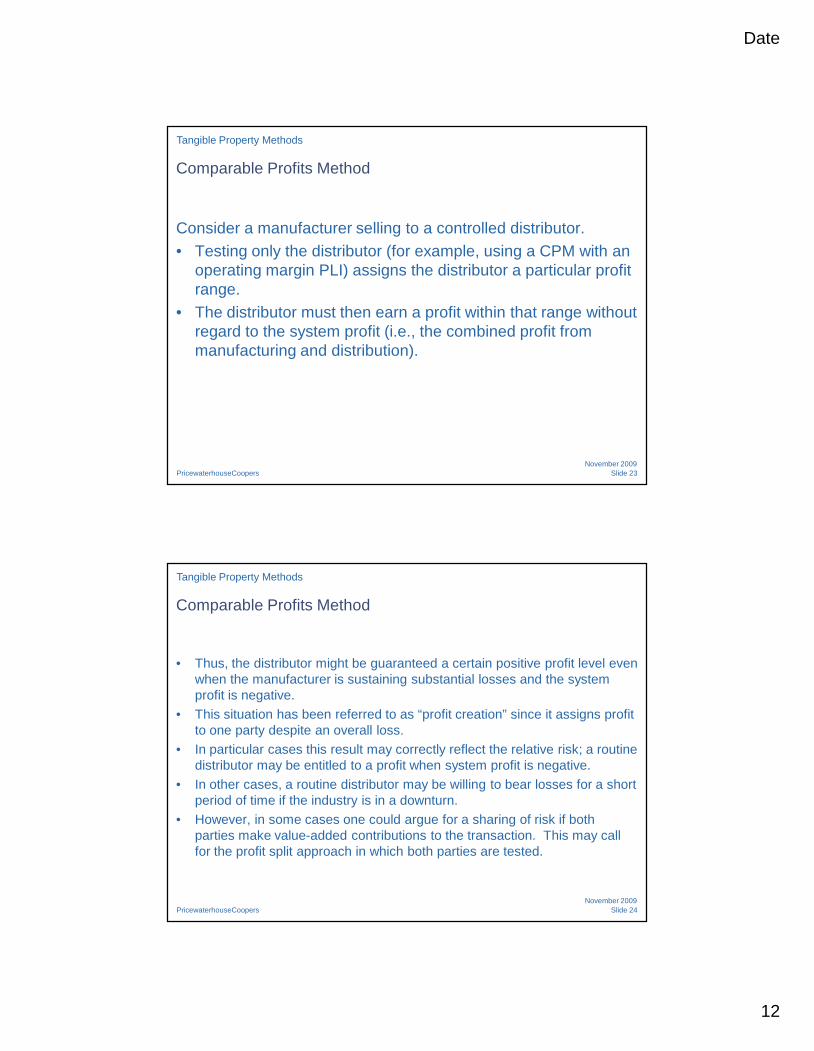
Comparable Profits Method
Consider a manufacturer selling to a controlled distributor.• Testing only the distributor (for example, using a CPM with an
operating margin PLI) assigns the distributor a particular profitrange.
• The distributor must then earn a profit within that range withoutregard to the system profit (i.e., the combined profit frommanufacturing and distribution).
Tangible Property Methods
PricewaterhouseCoopersNovember 2009
Slide 24
Comparable Profits Method
• Thus, the distributor might be guaranteed a certain positive profit level evenwhen the manufacturer is sustaining substantial losses and the systemprofit is negative.
• This situation has been referred to as “profit creation” since it assigns profitto one party despite an overall loss.
• In particular cases this result may correctly reflect the relative risk; a routinedistributor may be entitled to a profit when system profit is negative.
• In other cases, a routine distributor may be willing to bear losses for a shortperiod of time if the industry is in a downturn.
• However, in some cases one could argue for a sharing of risk if bothparties make value-added contributions to the transaction. This may callfor the profit split approach in which both parties are tested.
Tangible Property Methods

Date
13
PricewaterhouseCoopersNovember 2009
Slide 25
Comparable Profits Method
Reg. § 1.482-5 – In general, determine whether pricing is arm’slength indirectly, by seeing if a controlled taxpayer (the “testedparty”) earns profits similar to those earned by comparablecompanies that engage in similar business activities undersimilar circumstances
Comparability of functions more important than specific product
Compare profit level indicators (“PLIs”), such as operatingmargin, return on assets, etc.
Transfer Pricing Methods for Intangible Property
PricewaterhouseCoopersNovember 2009
Slide 26
Comparable Profits Method
• For intangibles, tested party would generally be licensee
• If licensee’s profits are lower (higher) than those ofcomparable companies (after adjustment for royalties paid forthe use of the intangible in question), the implication is that thelicensee is paying too high (too low) a royalty for use of theintangible.
• What if comparables own or license valuable intangibles thatincrease profitability- Adjustments?
Transfer Pricing Methods for Intangible Property

Date
14
PricewaterhouseCoopersNovember 2009
Slide 27
Comparable Profits Method
• Validate royalty rate by comparing post-royalty profit tooperating profit earned by similar companies.- Choice of comparables- Choice of Profit Level Indicators
Transfer Pricing Methods for Intangible Property
PricewaterhouseCoopersNovember 2009
Slide 28
Comments: Comparable Profits Method
• Comparable Profits Method range can be wide
• “Comparable” companies typically own intangibles, whereas“tested party” is typically the licensee.
• Implicitly assumes all other internal prices are arm’s length(purchase of components, sale of finished products, servicefees, etc.)
Transfer Pricing Methods for Intangible Property

Date
15
PricewaterhouseCoopersNovember 2009
Slide 29
Temporary Regulations: Comparable Profits Method
• Treas. Reg. §1.482-9T(f)• General principles set forth in Treas. Reg. §1.482-5 apply.• Profit level indicator of operating profit to total services costs
(markup on costs) is identified as potentially reliable basis foranalysis of controlled services transactions.
• Examples provide guidance on when it may be appropriate toadjust the financial data of comparables and/or the testedparty in order to account for stock-based compensation (undera grant date valuation).
Transfer Pricing for Services
PricewaterhouseCoopersNovember 2009
Slide 30
THANK YOU