Transcriptome and phytohormone analysis reveals …...ORIGINAL ARTICLE Transcriptome and...
15
ORIGINAL ARTICLE Transcriptome and phytohormone analysis reveals a comprehensive phytohormone and pathogen defence response in pear self-/cross-pollination Dongqing Shi 1 • Chao Tang 1 • Runze Wang 1 • Chao Gu 1 • Xiao Wu 1 • Shi Hu 1 • Jin Jiao 1 • Shaoling Zhang 1 Received: 21 April 2017 / Accepted: 5 August 2017 / Published online: 8 September 2017 Ó The Author(s) 2017. This article is an open access publication Abstract Key message Candidate genes were identified and the role of phytohormones such as JA-Me and ABA in the synthesis of S-RNase was emphasized in pear self- incompatibility. Abstract Self-incompatibility (SI) occurs widely in flow- ering plants as an intraspecific reproductive barrier. This phenomenon promotes variation within species, but for some species such as Pyrus, SI is a nuisance rather than a benefit in agricultural production. Although many studies have been conducted on SI in pears, its mechanism remains unclear. In this study, high-throughput Illumina RNA sequencing (RNA-seq) was used to identify SI-related genes in pear styles. Using transcriptome comparisons, differentially expressed genes of unpollinated (UP), cross- pollinated (CP), and self-pollinated (SP) styles were iden- tified after 48 h. A total of 1796 and 1890 genes were identified in DSC (UP vs. CP) and DSI (UP vs. SP), respectively. KEGG analysis revealed that genes involved in the ‘‘plant hormone signal transduction pathway’’ and ‘‘plant–pathogen interaction pathway’’ were significantly enriched in DSI (UP vs. SP) compared to those in DSC (UP vs. CP). The expression level of S-glycoprotein ribonu- clease (S-RNase) was dramatically reduced in cross-polli- nated (CP) styles. To better understand the relationship between the expression patterns of S-RNase and two major KEGG pathways, the concentrations of phytohormones were measured, and the expression pattern of S-RNase was analysed using qRT-PCR. Our results demonstrate that methyl jasmonate and abscisic acid may enhance the expression level of S-RNase, and pollination can affect the synthesis of methyl jasmonate and abscisic acid in pear styles. Overall, this study is a global transcriptome analysis of SI in pear. A relationship between self-rejection, plant hormones, and pathogen defence was shown in pear. Keywords Pear (Pyrus bretschneideri Rehd.) Self- incompatibility Transcriptome S-RNase Methyl jasmonate Abbreviations 24 HAP 24 Hours after pollination 48 HAP 48 Hours after pollination AMPK 5 0 -AMP-activated protein kinase NCED 9-cis-epoxycarotenoid dioxygenase Communicated by Ray J. Rose. Electronic supplementary material The online version of this article (doi:10.1007/s00299-017-2194-0) contains supplementary material, which is available to authorized users. & Shaoling Zhang [email protected] Dongqing Shi [email protected] Chao Tang [email protected] Runze Wang [email protected] Chao Gu [email protected] Xiao Wu [email protected] Shi Hu [email protected] Jin Jiao [email protected] 1 Centre of Pear Engineering Technology Research, State Key Laboratory of Crop Genetics and Germplasm Enhancement, Nanjing Agricultural University, Nanjing 210095, China 123 Plant Cell Rep (2017) 36:1785–1799 DOI 10.1007/s00299-017-2194-0
Transcript of Transcriptome and phytohormone analysis reveals …...ORIGINAL ARTICLE Transcriptome and...

ORIGINAL ARTICLE
Transcriptome and phytohormone analysis revealsa comprehensive phytohormone and pathogen defence responsein pear self-/cross-pollination
Dongqing Shi1 • Chao Tang1 • Runze Wang1 • Chao Gu1 • Xiao Wu1 •
Shi Hu1 • Jin Jiao1 • Shaoling Zhang1
Received: 21 April 2017 / Accepted: 5 August 2017 / Published online: 8 September 2017
� The Author(s) 2017. This article is an open access publication
Abstract
Key message Candidate genes were identified and the
role of phytohormones such as JA-Me and ABA in the
synthesis of S-RNase was emphasized in pear self-
incompatibility.
Abstract Self-incompatibility (SI) occurs widely in flow-
ering plants as an intraspecific reproductive barrier. This
phenomenon promotes variation within species, but for
some species such as Pyrus, SI is a nuisance rather than a
benefit in agricultural production. Although many studies
have been conducted on SI in pears, its mechanism remains
unclear. In this study, high-throughput Illumina RNA
sequencing (RNA-seq) was used to identify SI-related
genes in pear styles. Using transcriptome comparisons,
differentially expressed genes of unpollinated (UP), cross-
pollinated (CP), and self-pollinated (SP) styles were iden-
tified after 48 h. A total of 1796 and 1890 genes were
identified in DSC (UP vs. CP) and DSI (UP vs. SP),
respectively. KEGG analysis revealed that genes involved
in the ‘‘plant hormone signal transduction pathway’’ and
‘‘plant–pathogen interaction pathway’’ were significantly
enriched in DSI (UP vs. SP) compared to those in DSC (UP
vs. CP). The expression level of S-glycoprotein ribonu-
clease (S-RNase) was dramatically reduced in cross-polli-
nated (CP) styles. To better understand the relationship
between the expression patterns of S-RNase and two major
KEGG pathways, the concentrations of phytohormones
were measured, and the expression pattern of S-RNase was
analysed using qRT-PCR. Our results demonstrate that
methyl jasmonate and abscisic acid may enhance the
expression level of S-RNase, and pollination can affect the
synthesis of methyl jasmonate and abscisic acid in pear
styles. Overall, this study is a global transcriptome analysis
of SI in pear. A relationship between self-rejection, plant
hormones, and pathogen defence was shown in pear.
Keywords Pear (Pyrus bretschneideri Rehd.) � Self-incompatibility � Transcriptome � S-RNase � Methyl
jasmonate
Abbreviations
24 HAP 24 Hours after pollination
48 HAP 48 Hours after pollination
AMPK 50-AMP-activated protein kinase
NCED 9-cis-epoxycarotenoid dioxygenase
Communicated by Ray J. Rose.
Electronic supplementary material The online version of thisarticle (doi:10.1007/s00299-017-2194-0) contains supplementarymaterial, which is available to authorized users.
& Shaoling Zhang
Dongqing Shi
Chao Tang
Runze Wang
Chao Gu
Xiao Wu
Shi Hu
Jin Jiao
1 Centre of Pear Engineering Technology Research, State Key
Laboratory of Crop Genetics and Germplasm Enhancement,
Nanjing Agricultural University, Nanjing 210095, China
123
Plant Cell Rep (2017) 36:1785–1799
DOI 10.1007/s00299-017-2194-0

AOC Allene-oxide cyclase
AIPT Adenylate isopentenyltransferase
ABA Abscisic acid
BR Brassinolide
BRI Brassinosteroid insensitive
CK Cytokinin
CYCD Cyclin D
CP Cross-pollinated
DEGs Differentially expressed genes
UP vs.
CP
DSC
UP vs.
SP
DSI
FDR False discovery rate
GSI Gametophytic SI
GA3 Gibberellins
GID GA insensitive dwarf
DELLA GA sensing
AHK Histidine kinase
ATHB Homeobox-leucine zipper protein ATHB
RNA-seq High-throughput Illumina RNA sequencing
IAA Indole-3-acetic acid
MYC Jamonate associated MYC
KEGG Kyoto Encyclopedia of Genes and Genomes
FLS Leucine-rich-repeat receptor kinases flagellin
sensing
JA-Me Methyl jasmonate
PPL Pectate lyase
PCD Programmed cell death
EFR Receptor-like serine/threonine-protein kinase
GABA c-Amino butyric acid
SP Self-pollinated
CTR Serine/threonine-protein kinase
S-RNase S-glycoprotein ribonuclease
SSI Sporophytic SI
SI Self-incompatibility
WRKY Transcription factor WRKY
PCL Transcription factor PCL
TTS Transmitting tissue-specific proteins
UP Unpollinated
UBEH Ubiquitin-conjugating enzyme E2 H
UBEM Ubiquitin-conjugating enzyme E2 M
CP vs.
SP
X
ZAT Zinc finger protein
ZR Zeatin riboside
Introduction
Most flowering plants with hermaphrodite flowers have
evolved a strategy to prevent self-pollination and promote
outcrossing. A ubiquitous strategy is self-incompatibility
(SI), which inhibits the growth of self-pollen and accepts
the non-self for fertilization (de Nettancourt 1997). Dec-
ades of research in biochemistry and molecular biology
have gradually uncovered the mechanism of SI (McClure
2004; Nasrallah and Nasrallah 2014; Wilkins et al. 2015).
However, the mechanism of pollen tube growth and style
recognition remain unclear.
There are two major types of SI: sporophytic SI (SSI),
found in Brassicaceae, and gametophytic SI (GSI), found
in Rosaceae and Solanaceae. SSI is controlled by the
interaction between stigma-specific S-receptor kinase and a
pollen-specific S-locus cysteine-rich protein, which inhi-
bits self-pollen only on the surface of the stigma (Indriolo
et al. 2014). By contrast, during GSI in Rosaceae and
Solanaceae, the pollen tube penetrates into the base of the
style, and S-glycoprotein ribonuclease (S-RNase) activity
and the pollen-specific S-locus F-box protein (SLF/SFB)
determine cross-fertilization and self-inhibition of growth
(Liu et al. 2014). Furthermore, pollen–pistil recognition
begins in the stigma. This reaction continues until the
pollen tube reaches the base of the style in most GSI
systems. The GSI mechanism in Papaveraceae involves
style-specific ligands that bind to receptors on the mem-
brane of the incompatible pollen tube and trigger a Ca2?
signalling cascade, which results in programmed cell death
(PCD) of the self-pollen (Takayama and Isogai 2005).
Different SI types exhibit different biological processes in
space and time.
Pollen tube growth in the style is hyponastic growth
during which there is a continuous exchange of signals
between the pollen tube and style. RNA degradation is
triggered, and a signalling cascade results in PCD culmi-
nated by factors that determine style incompatibility (Eaves
et al. 2014; Wilkins et al. 2014). Proteins that contribute to
reinforcement and secreted proteins, including potential
signalling components, are significantly enriched during
pollination (Tung et al. 2005). Stigma/stylar cysteine-rich
adhesion proteins, chemocyanin, transmitting tissue-speci-
fic proteins (TTS), and c -amino butyric acid (GABA) have
been identified in directing pollen tube growth (Swanson
et al. 2004). Intriguingly, TTS binds to S-RNase in Nico-
tiana (Hancock et al. 2003). In GSI, the compatible pollen
tube in the style sends a signal to reduce the S-RNase level
(Liu et al. 2009), which suggests reciprocal signalling
crosstalk between the pollen tube and style cells of the
transmitting tract.
Overall, SI is a biological process that is controlled by
multiple genes and a reciprocal interaction between pollen
and the style. High-throughput Illumina RNA sequencing
(RNA-seq) is a powerful method to investigate gene reg-
ulation and the molecular basis of SI. Candidate genes
contributing to SI interaction have been successfully
identified in Leymus chinensis (Zhou et al. 2014), Citrus
1786 Plant Cell Rep (2017) 36:1785–1799
123

limon (Zhang et al. 2015), Solanum (Zhao et al. 2015), and
Camellia sinensis (Zhang et al. 2016).
Pear, a perennial and self-incompatible species in the
Rosaceae family, is an ancient fruit crop that is cultivated
worldwide (Wu et al. 2013). There are large-scale plantings
of pear in China. Owing to the lack of self-pollination,
considerable time and effort are required every year for the
collection of large amounts of pollen and the pollination of
trees using pollen consisting of different S alleles. This
results in an obvious wastage of land and is not only time-
consuming but also causes problems in managing different
cultivars. It would be beneficial to farmers if SI could be
prevented. S-RNase, is a basic protein with a PI of 9.3–10.0
and a molecular mass of 30 kDa, plays a key role in the
inhibition of self-pollen through RNA degradation activity
(Hiratsuka et al. 2001). Several studies have been con-
ducted to clarify the mechanism of S-RNase cytotoxicity in
incompatible pollen in pear. For example, S-RNase has
been reported to trigger mitochondrial alteration and to
decrease NADPH oxidase activity in the mitochondria and
cytosol (Wang et al. 2010). As a result, tip-localized ROS
were disrupted, the nuclear DNA was degraded (Wang
et al. 2009), the balance of intracellular Ca2? was altered,
and the stability of the actin cytoskeleton was broken (Liu
et al. 2007). However, a little work has been conducted on
the synthesis and regulation of S-RNase in pear styles.
S-RNase activity is necessary for the rejection of incom-
patible pollen (Huang et al. 1994), and a minimum con-
centration of S-RNase is also required in the style (Qin
et al. 2006). Thus, inhibition of S-RNase activity or a
reduction in S-RNase levels in styles may be a good
method to prevent the rejection of self-pollen.
In this study, RNA-seq was used to reveal the gene
regulation of self- and cross-pollination in pear to better
understand SI. Phytohormone analysis and phytohormone
treatment combined with RT-PCR were used to establish
the relationship between phytohormones and SI in Pyrus.
Materials and methods
Plant material
Adult pear trees were planted in the orchards of Nanjing
Agricultural University, Jangsu, China. The anthers were
detached from ‘Dangshan’ pear trees before anthesis. Then,
the styles were pollinated with self-pollen (‘Dangshan’)
and cross-pollen (‘Cuiguan’). Pollination bags were used to
ensure that the styles were not subjected to other types of
interference. After 24 and 48 h pollination, unpollinated,
self-pollinated, and cross-pollinated styles with stigma
(containing pollen or not) were collected, immediately
frozen in liquid nitrogen, and stored at -80 �C.
Anthers were detached first; then, the styles were soaked
in JA-Me (Sigma, St. Louis, MO, USA), ABA (RYON,
Shanghai, China), GA3 (Genview, IL, USA), IAA (Gen-
view, IL, USA), BR (Sigma, St. Louis, MO, USA), and ZR
(COMIN, Shanghai, China) for 3 min at the final concen-
trations of 10, 50, 50, 200, 5, and 100 lM, respectively.
Subsequently, pollination bags were used to ensure that the
styles were not subjected to other types of interference. All
hormones were added to 1% ethanol containing 0.1%
Tween 20 solution. This solution was used as the mock
control. After 0, 4, 12, 24, and 48 h exogenous treatment,
UP styles with stigma were collected, immediately frozen
in liquid nitrogen, and stored at -80 �C.
RNA isolation and Illumina sequencing
The RNAprep Pure Plant Kit (Tiangen, Beijing, China) was
used to isolate total RNA according to the manufacturer’s
protocol. RNA degradation and contamination were
detected on 1% agarose gels. The RNA concentration of
these samples was measured using a NanoDrop 2000
(Thermo Scientific, Waltham, MA, USA). The quality was
assessed using an Agilent 2100 Bioanalyzer (Agilent
Technologies, CA, USA). Only samples with RIN (RNA
integrity number) C8 and 28S:18SRNA C1.5 were used for
deep sequencing. The cDNA libraries were prepared from
different style samples after 48 h using a TruSeqTM RNA
Sample Prep Kit (Illumina, Carlsbad, CA, USA) following
the manufacturer’s protocol. Briefly, poly(A) mRNA was
enriched using poly-T oligoattached magnetic beads (In-
vitrogen, Foster City, USA) and was then fragmented into
short pieces using an RNA Fragmentation Kit (Ambion,
Austin, TX, USA). Double-stranded cDNA was reverse
transcribed and amplified. An Illumina HiSeqTM 4000
instrument was used to perform the sequencing reactions.
HiSeq data analysis
Raw reads containing by the HT-2500 were pass-filtered to
exclude reads that contain adapters, low-quality, and
unknown bases. The remaining high-quality sequences
(clean reads) were mapped to the Pyrus bretschneideri
genome data (Wu et al. 2013) (http://www.peargenome.
njau.edu.cn) using Tophat (Trapnell et al. 2012), permitting
no more than five base mismatches in the alignment. The
mapped reads were counted using HT-Seq (Anders et al.
2014).
Identification of DEGs
Quantification of transcript expression was performed
using the Reads Per kb per Million reads (RPKM) method
(Mortazavi et al. 2008). Differentially expressed genes
Plant Cell Rep (2017) 36:1785–1799 1787
123

(DEGs) analysis was performed using the method descri-
bed by Audic (Audic and Claverie 1997). False discovery
rate (FDR) was used to determine the P value thresholds in
multiple testing. In the statistical analysis, P values of
\0.05 and fold change C2 were marked significantly dif-
ferent in DSI (UP vs. SP) group, DSC (UP vs. CP) group
and X (CP vs. SP) groups.
GO analysis
The Blast2Go program (Conesa et al. 2005) was used to
obtain GO annotations for all identified genes. To gain an
understanding of the distribution of gene functions at the
macro level, the WEGO online tool (Ye et al. 2006) was
used to perform GO functional classification. The broad
molecular function of the DEGs was analysed in terms of
significantly enriched GO categories for molecular func-
tion using SEA (Du et al. 2010), in which FDR was cal-
culated to correct the P value (Pawitan et al. 2005).
P values \0.05 and FDRs \0.05 were defined as
significant.
Pathway analysis
KEGG is a highly integrated database for systematic
analysis of gene function in terms of the networks of genes
and molecules (http://www.genome.jp/kegg/). KEGG
pathway analysis was used to identify the significant
pathways associated with the DEGs. P values\0.05 and
FDRs \0.05 were defined as significant (Kanehisa et al.
2008; Yi et al. 2006).
qRT-PCR analysis
TransScript One-Step gDNA Removal and cDNA Syn-
thesis SuperMix kit (TransGen, Beijing, China) was used
to synthesize the first strand cDNA, according to the
manufacturer’s instructions. TransStart Tip Green qPCR
SuperMix (TransGen, Beijing, China) and the Roche
LightCycler 480IIPCR system (Roche Diagnostics GmbH,
USA) were used to perform the qRT-PCR. After a total
volume of 20 ll reaction mixture was prepared, amplifi-
cation was carried out with the following cycling param-
eters: 95 �C for 30 s, followed by 45 cycles of 95 �C for
5 s, and 60 �C for 30 s. Three biological replicates were
analysed and the expression values were normalized
against actin. The specificity of the products was con-
firmed via agarose gel and melting curves were analysed.
Analysis of the relative gene expression data was con-
ducted using the 2-DDCt method (Livak and Schmittgen
2001).
Quantification of hormones
Methyl jasmonate (JA), abscisic acid (ABA), gibberellin
(GA3), indole-3-acetic acid (IAA), brassinolide (BR), and
zeatin riboside (ZR) concentrations were determined using
enzyme-linked immunosorbent assay (ELISA) methods
according to Yang et al. (2001). The results are presented
as the mean ± SE of three replicates.
Results
Pear style transcriptome assembly and differential
gene expression profiles of DSI (UP vs. SP) and DSC
(UP vs. CP)
A total of 65.27, 68.42, and 58.06 M raw reads with an
average Q20 over 97% were generated from the UP, SP,
and CP samples, respectively, with Illumina Solexa
sequencing technology. After removing adaptors, and fil-
tering short and low-quality reads, clean reads of 150 nt
were mapped to the reference genome. Of these high-
quality reads, 72.2, 72.5, and 70.2% were aligned to the
pear reference database (Table 1), and a total of 26,521,
26,982, and 26,882 unigenes were obtained for the UP, SP,
and CP samples, respectively.
To quantify the expression level of UP (control), SP
(incompatible pollination), and CP (compatible pollina-
tion), RPKM values were calculated. A total of 1795 genes
were differentially expressed between UP and SP (Addi-
tional file 1), including 896 downregulated and 899
upregulated genes. Similarly, 1890 genes were differen-
tially expressed between UP and CP (Additional file 2),
including 734 down-regulated and 1156 up-regulated
genes. In addition, CP and SP were also compared: 520
genes were differentially expressed (Additional file 3),
including 427 upregulated and 93 downregulated genes.
The plots of unigenes between orange and blue revealed
unigenes with both fold change and significance (Fig. 1a).
To further narrow the candidate genes related to
incompatible and compatible reactions, DSI (UP vs. SP),
DSC (UP vs. CP), and X (CP vs. SP) were comprehensively
compared. As shown in Fig. 1b, 232 genes, including three
common genes, were continuously upregulated and down-
regulated among UP, CP, and SP. Specifically, the three
continuously downregulated genes were glycerophosphoryl
diester phosphodiesterase (Pbr002321.1), alpha-galactosi-
dase (Pbr002935.1), and epidermis-specific secreted gly-
coprotein EP1 (Pbr038211.1). Although some of these
downregulated genes are not related to the two important
KEGG pathways, they are important for research on pear SI.
1788 Plant Cell Rep (2017) 36:1785–1799
123

Gene ontology (GO) annotation and KEGG pathway
mapping of all DEGs in DSI (UP vs. SP) and DSC
(UP vs. CP)
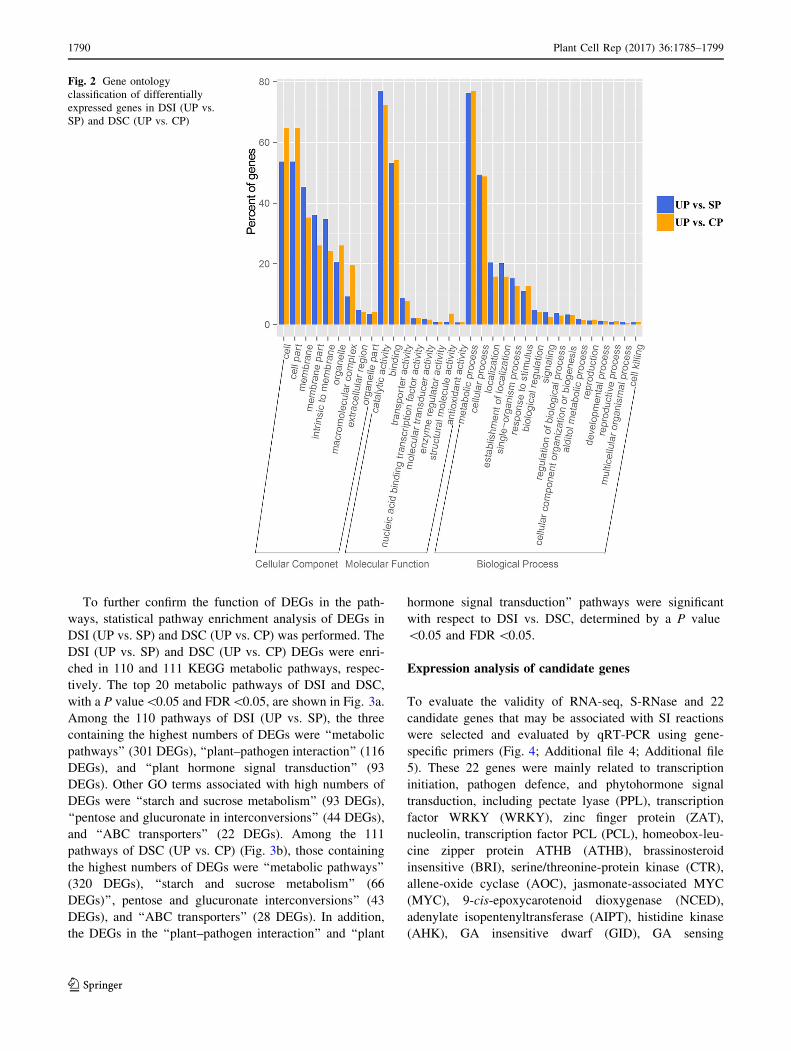
To identify the functions of DEGs in DSI and DSC, GO
analyses were performed. In total, 1890 DEGs of DSI and
1796 DEGs of DSC were assigned to GO annotations. All
genes were distributed into three categories: cellular
component, molecular function, and biological process.
The GO terms of DEGs in DSI and DSC were categorized
into the same 33 main functional groups. Cell (122 genes,
53.74% in DSI; 169 genes, 64.75% in DSC), cell part (122
genes, 53.74% in DSI; 169 genes, 64.75% in DSC), and
membrane (103 genes, 45.37% in DSI; 93 genes, 35.24% in
DSC) dominated in the cellular component category. With
respect to the molecular function, genes were associated
with catalytic activity (446 genes, 77.02% in DSI; 461
genes, 72.37% in DSC), binding (308 genes, 53.19% in
DSI; 346 genes, 54.31% in DSC), and transporter activity
(50 genes, 0.08% in DSI; 50 genes, 0.07% in DSC). Genes
associated with metabolic process (339 genes, 76.17% in
DSI; 385 genes, 77.00% in DSC), cellular process (220
genes, 49.43% in DSI; 244 genes, 48.80% in DSC), and
localization (91 genes, 10.44% in SI; 79 genes, 15.8% in
DSC) were dominant in the biological process category
(Fig. 2).
Table 1 Statistics of the reads from RNA-seq analysis and mapping results
Sample Total clean reads Single length (bp) Total length (bp) GC percentage Q20 (%) Mapping to genome rate (%)
Sample UP 64,481,698 150 9,173,193,132 46.03 97.64 72.2
Sample SP 67,636,348 150 9,640,868,615 45.92 97.81 72.5
Sample CP 57,250,730 150 8,125,868,717 45.95 97.71 70.2
Fig. 1 Differentially expressed genes (DEGs) in DSI (UP vs. SP),
DSC (UP vs. CP), and X (CP vs. SP). a Abundance of each gene was
normalized as reads per kb per Millionreads (RPKM). The differen-
tially expressed genes (DEGs) are shown in orange and blue, while
brown indicates genes that were not differentially expressed (not
DEGs). bVenn diagram showing common or uniquely regulated genes
among three samples. Upregulated genes are shown in the left, while
downregulated genes are shown in the right (colour figure online)
Plant Cell Rep (2017) 36:1785–1799 1789
123
To further confirm the function of DEGs in the path-
ways, statistical pathway enrichment analysis of DEGs in
DSI (UP vs. SP) and DSC (UP vs. CP) was performed. The
DSI (UP vs. SP) and DSC (UP vs. CP) DEGs were enri-
ched in 110 and 111 KEGG metabolic pathways, respec-
tively. The top 20 metabolic pathways of DSI and DSC,
with a P value\0.05 and FDR\0.05, are shown in Fig. 3a.
Among the 110 pathways of DSI (UP vs. SP), the three
containing the highest numbers of DEGs were ‘‘metabolic
pathways’’ (301 DEGs), ‘‘plant–pathogen interaction’’ (116
DEGs), and ‘‘plant hormone signal transduction’’ (93
DEGs). Other GO terms associated with high numbers of
DEGs were ‘‘starch and sucrose metabolism’’ (93 DEGs),
‘‘pentose and glucuronate in interconversions’’ (44 DEGs),
and ‘‘ABC transporters’’ (22 DEGs). Among the 111
pathways of DSC (UP vs. CP) (Fig. 3b), those containing
the highest numbers of DEGs were ‘‘metabolic pathways’’
(320 DEGs), ‘‘starch and sucrose metabolism’’ (66
DEGs)’’, pentose and glucuronate interconversions’’ (43
DEGs), and ‘‘ABC transporters’’ (28 DEGs). In addition,
the DEGs in the ‘‘plant–pathogen interaction’’ and ‘‘plant
hormone signal transduction’’ pathways were significant
with respect to DSI vs. DSC, determined by a P value
\0.05 and FDR\0.05.
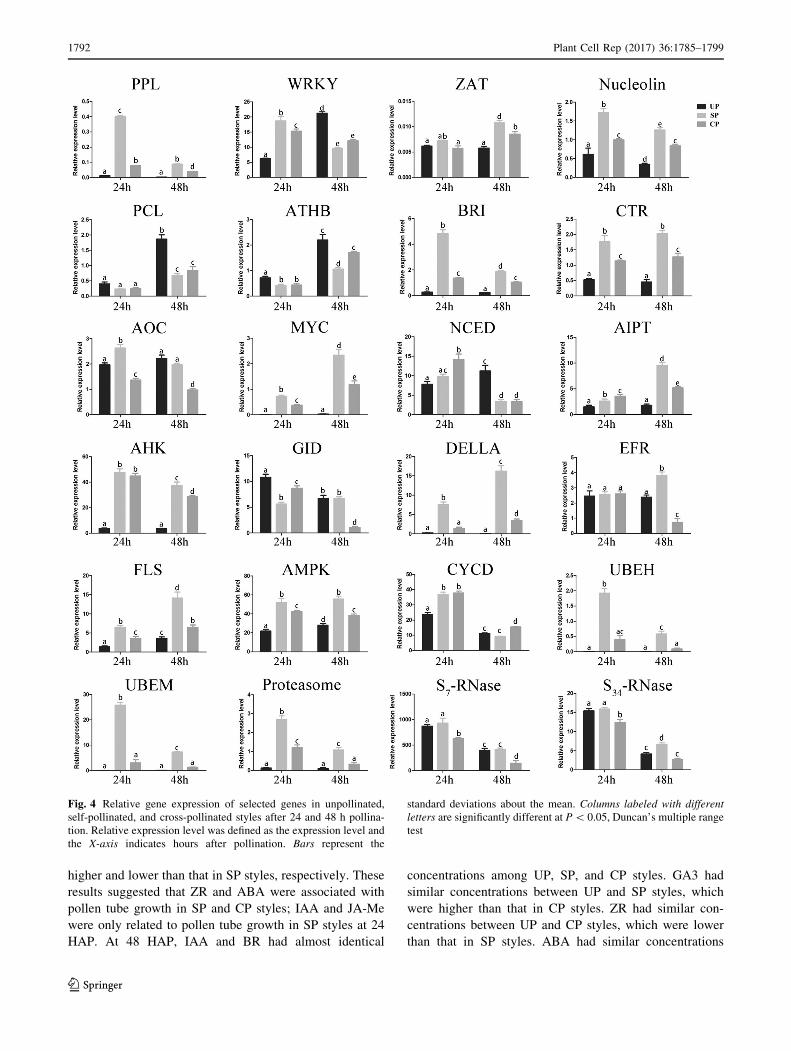
Expression analysis of candidate genes
To evaluate the validity of RNA-seq, S-RNase and 22
candidate genes that may be associated with SI reactions
were selected and evaluated by qRT-PCR using gene-
specific primers (Fig. 4; Additional file 4; Additional file
5). These 22 genes were mainly related to transcription
initiation, pathogen defence, and phytohormone signal
transduction, including pectate lyase (PPL), transcription
factor WRKY (WRKY), zinc finger protein (ZAT),
nucleolin, transcription factor PCL (PCL), homeobox-leu-
cine zipper protein ATHB (ATHB), brassinosteroid
insensitive (BRI), serine/threonine-protein kinase (CTR),
allene-oxide cyclase (AOC), jasmonate-associated MYC
(MYC), 9-cis-epoxycarotenoid dioxygenase (NCED),
adenylate isopentenyltransferase (AIPT), histidine kinase
(AHK), GA insensitive dwarf (GID), GA sensing
Fig. 2 Gene ontology
classification of differentially
expressed genes in DSI (UP vs.
SP) and DSC (UP vs. CP)
1790 Plant Cell Rep (2017) 36:1785–1799
123

(DELLA), receptor-like serine/threonine-protein kinase
(EFR), leucine-rich-repeat receptor kinases flagellin sens-
ing (FLS), 50-AMP-activated protein kinase (AMPK),
Cyclin D (CYCD), ubiquitin-conjugating enzyme E2 H
(UBEH), ubiquitin-conjugating enzyme E2 M (UBEM),
and proteasome. Clearly, the qRT-PCR results of the
selected genes showed a general agreement with the RNA-
seq results (Additional file 5). Of these genes, PPL, ZAT,
nucleolin, BRI, CTR, MYC, AIPT, AHK, DELLA, EFR,
FLS, AMPK, UBEH, UBEM, and proteasome presented
significantly higher expression levels in self-pollinated
(SP) styles than in unpollinated (UP) and cross-pollinated
(CP) styles at 48 h after pollination (HAP). Other genes
such as WRKY, PCL, ATHB, NCED, and CYCD showed
reduced levels of expression in SP styles. However, the
relative expression level of CYCD was higher in CP styles
at 24 HAP (Fig. 4). These results demonstrate that defence
and phytohormone signal transduction were involved in the
pollination reaction.
The relative expression levels of selected genes in styles
at 24 HAP were also analysed (Fig. 4) and were observed
difference between 24 and 48 HAP. For example, the rel-
ative expression level of PPL was higher in DSI at 24 HAP
but lower at 48 HAP. The relative expression level of
CYCD decreased in unpollinated, self-pollinated, and
cross-pollinated styles in a time-dependent manner. In
addition, the relative expression level of PCL was not
affected at 24 HAP, but it was significantly increased in UP
styles compared with SP/CP styles at 48 HAP.
The S-genotype of Pyrus. bretschneideri Rehd. cv.
‘Dangshansuli’, which was identified by PCR using
sequence-conservative primers, contains two S-RNase
alleles, S7-RNase and S34-RNase. Unfortunately, we failed
to collect the data of S34-RNase from the RNA-seq database
because of the unsuccessful assembly of S34-RNase in the
sequenced pear genome. Consequently, two specific primer
pairs for S34-RNase and S7-RNase were designed (Addi-
tional file 4), and qRT-PCR was performed to determine the
relative expression levels at 24 and 48 HAP in UP, SP, and
CP styles. The results showed that the relative expression
levels of both S7-RNase and S34-RNase alleles were sig-
nificantly lower in CP styles than in SP styles at 24 and 48
HAP (Fig. 4). These results indicate that compatible polli-
nation could affect the expression level of S-RNase.
Phytohormone analysis in UP, SP, and CP
KEGG analysis revealed high enrichment in the plant
hormone signal transduction pathway of DSI (UP vs. SP).
To determine whether SI could stimulate phytohormone
synthesis, UP, SP, and CP pear styles were collected at 24
and 48 HAP, and the concentrations of six endogenous
phytohormones were measured. As shown in Fig. 5, at 24
HAP, GA3 and BR had almost identical concentrations
among UP, SP, and CP styles. ZR and ABA had similar
concentrations between SP and CP styles, which were
higher than that in UP styles. IAA and JA-Me had similar
concentrations between UP and CP styles, but which were
Fig. 3 Statistical scatter diagram of KEGG pathway enrichment in DSI (UP vs. SP) and DSC (UP vs. CP). a Enriched pathways in DSI (UP vs.
SP). Blue arrow shows the significantly enriched pathway between DSI and DSC. b Enriched pathways in DSI (UP vs. CP) (colour figure online)
Plant Cell Rep (2017) 36:1785–1799 1791
123
higher and lower than that in SP styles, respectively. These
results suggested that ZR and ABA were associated with
pollen tube growth in SP and CP styles; IAA and JA-Me
were only related to pollen tube growth in SP styles at 24
HAP. At 48 HAP, IAA and BR had almost identical
concentrations among UP, SP, and CP styles. GA3 had
similar concentrations between UP and SP styles, which
were higher than that in CP styles. ZR had similar con-
centrations between UP and CP styles, which were lower
than that in SP styles. ABA had similar concentrations
Fig. 4 Relative gene expression of selected genes in unpollinated,
self-pollinated, and cross-pollinated styles after 24 and 48 h pollina-
tion. Relative expression level was defined as the expression level and
the X-axis indicates hours after pollination. Bars represent the
standard deviations about the mean. Columns labeled with different
letters are significantly different at P\ 0.05, Duncan’s multiple range
test
1792 Plant Cell Rep (2017) 36:1785–1799
123
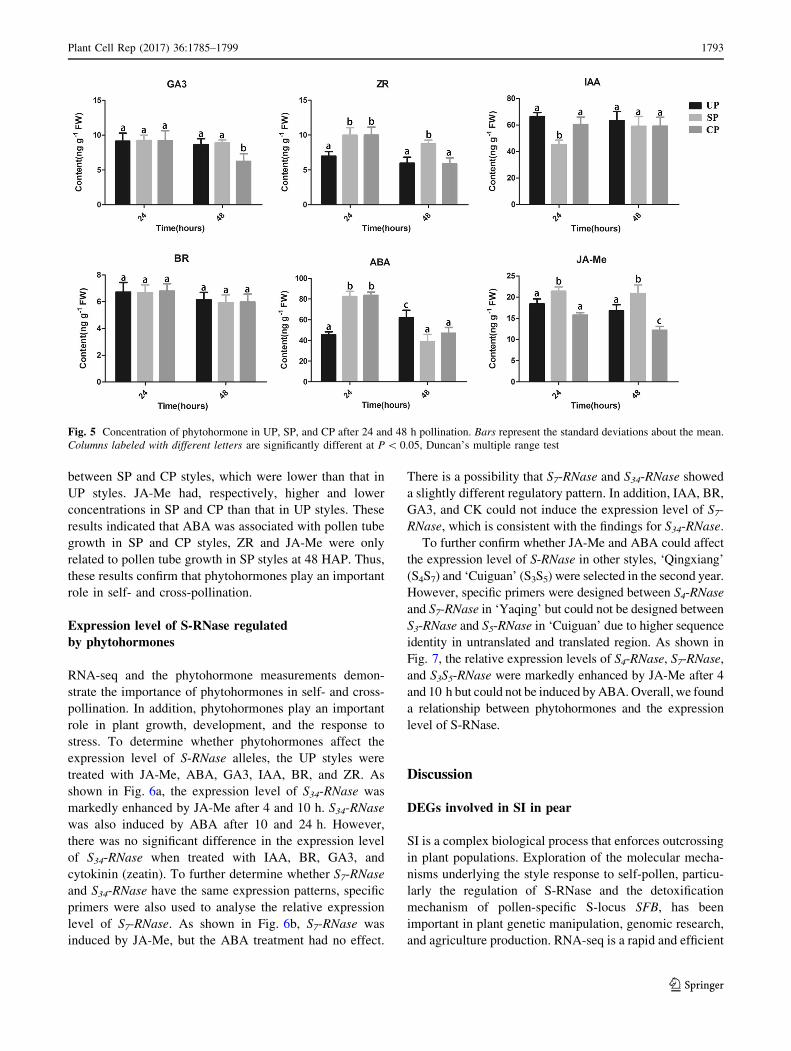
between SP and CP styles, which were lower than that in
UP styles. JA-Me had, respectively, higher and lower
concentrations in SP and CP than that in UP styles. These
results indicated that ABA was associated with pollen tube
growth in SP and CP styles, ZR and JA-Me were only
related to pollen tube growth in SP styles at 48 HAP. Thus,
these results confirm that phytohormones play an important
role in self- and cross-pollination.
Expression level of S-RNase regulated
by phytohormones
RNA-seq and the phytohormone measurements demon-
strate the importance of phytohormones in self- and cross-
pollination. In addition, phytohormones play an important
role in plant growth, development, and the response to
stress. To determine whether phytohormones affect the
expression level of S-RNase alleles, the UP styles were
treated with JA-Me, ABA, GA3, IAA, BR, and ZR. As
shown in Fig. 6a, the expression level of S34-RNase was
markedly enhanced by JA-Me after 4 and 10 h. S34-RNase
was also induced by ABA after 10 and 24 h. However,
there was no significant difference in the expression level
of S34-RNase when treated with IAA, BR, GA3, and
cytokinin (zeatin). To further determine whether S7-RNase
and S34-RNase have the same expression patterns, specific
primers were also used to analyse the relative expression
level of S7-RNase. As shown in Fig. 6b, S7-RNase was
induced by JA-Me, but the ABA treatment had no effect.
There is a possibility that S7-RNase and S34-RNase showed
a slightly different regulatory pattern. In addition, IAA, BR,
GA3, and CK could not induce the expression level of S7-
RNase, which is consistent with the findings for S34-RNase.
To further confirm whether JA-Me and ABA could affect
the expression level of S-RNase in other styles, ‘Qingxiang’
(S4S7) and ‘Cuiguan’ (S3S5) were selected in the second year.
However, specific primers were designed between S4-RNase
and S7-RNase in ‘Yaqing’ but could not be designed between
S3-RNase and S5-RNase in ‘Cuiguan’ due to higher sequence
identity in untranslated and translated region. As shown in
Fig. 7, the relative expression levels of S4-RNase, S7-RNase,
and S3S5-RNase were markedly enhanced by JA-Me after 4
and 10 h but could not be induced byABA.Overall, we found
a relationship between phytohormones and the expression
level of S-RNase.
Discussion
DEGs involved in SI in pear
SI is a complex biological process that enforces outcrossing
in plant populations. Exploration of the molecular mecha-
nisms underlying the style response to self-pollen, particu-
larly the regulation of S-RNase and the detoxification
mechanism of pollen-specific S-locus SFB, has been
important in plant genetic manipulation, genomic research,
and agriculture production. RNA-seq is a rapid and efficient
Fig. 5 Concentration of phytohormone in UP, SP, and CP after 24 and 48 h pollination. Bars represent the standard deviations about the mean.
Columns labeled with different letters are significantly different at P\ 0.05, Duncan’s multiple range test
Plant Cell Rep (2017) 36:1785–1799 1793
123

tool for obtaining a global profile of gene expression at the
transcriptome level. Combined with the whole-genome
database, it provides an improved bioinformatics pipeline to
identify candidate genes involved in SI. In this study, 1795
DEGs of DSI, 1890 DEGs of DSC, and 520 DEGs of X (CP
vs. SP) were identified in pear styles (Fig. 1); these genes
provide further support that SI is regulated by multiple
genes. This result is consistent with that observed for
tomato styles, where 804 and 1341 DEGs were reported to
be involved in incompatible and compatible pollination,
respectively (Zhao et al. 2015). Moreover, 4785 and 7677
DEGs in lemon styles were associated with incompatible
and compatible pollination, respectively (Zhang et al.
2015). In the tea SI reaction, 3182, 3575, and 3709 DEGs
were identified between SP and CP styles at 24, 48, and
72 h, respectively. The expressions of these genes changed
with pollen tube growth (Zhang et al. 2016). This finding
suggests that SI is a complex process that requires many
aspects of gene regulation. However, when comparing CP
and SP, only 520 DEGs were identified, which was
approximately threefold lower than DSI and DSC in our
study. This result suggests that the majority of DEGs may
respond to the pollination reaction, whereas fewer DEGs
respond to the selection of incompatible and compatible
reactions. Thus, these data demonstrate that SI is a complex
process regulated in time and space.
Fig. 6 Relative expression level of S-RNase in unpollinated styles
with different phytohormone treatment. a Relative expression level of
S34-RNase treated with JA-Me, ABA, IAA, GA3, BR, and CKs. Bars
represent the standard deviations about the mean. *Student’s t test
with P\ 0.05. b Relative expression level of S7-RNase treated with
JA-Me, ABA, IAA, GA3, BR, and CKs. Bars represent the standard
deviations about the mean. *Student’s t test with P\ 0.05
1794 Plant Cell Rep (2017) 36:1785–1799
123

Involvement of phytohormones in the SI reaction
Small signalling molecules such as JA-Me are essential for
plant survival in nature (Chini et al. 2007). JA-Me is a key
signal in the plant response to environmental stress, such as
wounding, pest attack, and pathogens (Lorenzo and Solano
2005). Our results unexpectedly indicated that the con-
centration of JA increased in the SP styles and decreased
significantly in the CP styles (Fig. 5). In addition, JA-Me
can induce the expression of S-RNase in styles. The so-
called octadecanoid biosynthesis pathway is a JA biosyn-
thesis pathway (Schaller 2001; Vick and Zimmerman
1984). Although there were no significant DEGs in DSI at
48 HAP, a key enzyme for JA biosynthesis, allene oxide
cyclase (AOC, Pbr013257.1) (Li et al. 2005), was signifi-
cantly downregulated in DSC but not in DSI at 48 HAP
that was upregulated in DSI at 24 HAP. MYC, a basic
helix–loop–helix leucine zipper transcription factor local-
ized in the nucleus, is induced by JA. JA can induce two
groups of genes: genes involved in defence responses
against pathogens that are repressed by MYC and genes
involved in JA-mediated systemic responses to wounding
that are activated by MYC (MYC) (Lorenzo et al. 2004).
We observed that the expression level of jasmonate-
associated MYC (MYC, Pbr029553.1) was lower in DSC
compared to that in DSI at 24 and 48 HAP, which is
consistent with the reduced concentration of JA-Me in
DSC. In addition, the expression level of MYC in DSI and
DSC was higher at 48 HAP than at 24 HAP (Fig. 4).
However, although the trend of the expression level of
MYC was not consistent with a group of genes involved in
defence response against pathogens in Arabidopsis, it was
related to another group involved in JA-mediated systemic
responses to wounding. This shows that signal transduction
of MYC in pear may be different from that in Arabidopsis.
Combined with exogenous JA treatment, we believe that
the reduced expression level of S-RNase is related to the
JA-signalling cascade.
ABA is an important regulator of several physiological
and plant defence processes such as the response to heat
and drought stresses: similar to JA, ABA can also be
induced by water stress (Jubany-Marı et al. 2010; Planchet
et al. 2011). The carotenoid biosynthesis pathway was
enriched in DSI and DSC. Endogenous ABA biosynthesis
is regulated by 9-cis-epoxycarotenoid dioxygenase (NCED,
Pbr009089.1), which was significantly downregulated in
DSI and DSC. Phytohormone analysis showed that the
ABA concentration increased at 24 HAP but decreased at
Fig. 7 Relative expression level of S-RNase in ‘Qingxiang’ and ‘Cuiguan’ styles with JA-Me and ABA treatment. ‘Qingxiang’ harbors S4-
RNase and S7-RNase; ‘Cuiguan’ harbors S3-RNase and S5-RNase
Plant Cell Rep (2017) 36:1785–1799 1795
123

48 HAP in DSI and DSC (Fig. 5). This result is consistent
with the ABA synthesis pathway in 48 HAP. PP2C phos-
phatases, i.e., negative regulators of the ABA signal, can be
induced in response to ABA, salt, and drought treatments
(Chen et al. 2015). In the current study, the expression
levels of PP2C phosphatases (Pbr033165.1, Pbr041497.1,
Pbr022745.1, Pbr013576.1, Pbr015521.1, Pbr018965.1,
Pbr032029.1, Pbr042867.1, Pbr013022.1, Pbr020818.1,
and Pbr011405.1) were enriched in self- and cross-polli-
nation. However, we could not confirm which PP2C
phosphatases were the major participant in self-pollination.
This is an interesting topic for our further research on pear
SI. Taken together, these results suggest that the ABA-
signalling cascade participates in the style response to
pollen.
Cytokinin (CK) can regulate cell division, leaf senes-
cence, nutrient mobilization, apical dominance, and seed
germination (Hwang et al. 2012). In Petunia hybrid plants,
the inhibition of pollen tube growth coincided with a five-
fold increase in the CK content in the style (Kovaleva and
Zakharova 2004). In the present study, the concentration of
ZR increased in SP/CP styles after 24 h and decreased 48 h
after cross-pollination. This result suggests that the sig-
nalling cascade of cytokinin changed when the pollen tube
reached the base of the style, and the signalling cascade of
cytokinin decreased at 48 h after cross-pollination.
Adenylate isopentenyltransferase (AIPT, Pbr038052.1) is a
key enzyme involved in zeatin biosynthesis. In addition,
histidine kinase (AHK, Pbr026909.1) is a cytokinin receptor
involved in cytokinin signal transduction. In our study,
these two genes were significantly upregulated in DSI but
not in DSC. This is consistent with the change in the con-
centration of ZR in the styles, suggesting that cytokinin
participates in pollen discrimination but not in the synthesis
of S-RNase in pear. A recent study revealed that CK is
involved in a number of plant–pathogen interactions
(Naseem et al. 2012). It was speculated that cytokinin
participated in reducing the plant–pathogen interactions in
the CP styles. Based on these findings, it can be concluded
that CK is also involved in the SI reaction in pear.
The DELLA protein acts as a plant growth repressor,
and GID1 is a GA receptor. GAs trigger the formation of a
GA–GID1–DELLA complex, which forms ubiquitinated
DELLA. Finally, DELLA is degraded by 26S protein and
the plant growth repressor is dismissed. In the present
study, the expression level of GA sensing (DELLA,
Pbr035217.1) was enhanced in SP pear styles, which is
consistent with self-pollinated lemon (Zhang et al. 2015).
This finding suggests that a universal phenomenon exists in
the function of DELLA in GSI. In addition, the expression
level of GA insensitive dwarf (GID, Pbr029089.1) was
lower in CP styles which are consistent with the reduced
concentration of GA in CP styles. Taken together, it can be
concluded that GA is also involved in the SI reaction in
pear.
Thus, the results suggest that phytohormones are
involved in the SI reaction in pear.
Plant–pathogen signal in the SI reaction
The interaction between pollen and style shares similarities
with bacterial infection in terms of biological responses
(Van Doorn and Woltering 2008) and some pathogen
defence genes, such as leucine-rich-repeat receptor kinases
flagellin sensing (FLS) and LRR receptor-like serine/thre-
onine-protein kinase (EFR) (Tintor et al. 2013). The
increased expression of FLS (Pbr037634.1) and EFR
(Pbr029003.1) in DSI suggests the activation of pathogen
defence, which is similar to the SI reaction in that defence
is initiated by styles to inhibit growth. By contrast, the
expression levels of FLS (Pbr037634.1) and EFR
(Pbr029003.1) decreased in DSC compared with DSI.
Styles can recognize self-/cross-pollen, just as plants can
discriminate between wounding and pathogen invasion. It
is possible that the change in the expression level of
S-RNase is a signal in pollen recognition. These results
suggest that some kind of signal is required to reduce the
S-RNase level (Liu et al. 2009).
The pathogen invasion response was highly enriched in
the ‘‘plant–pathogen interaction’’ KEGG pathway (P value
\0.05), which involved PAMP-triggered immunity, a
hypersensitive response, phytoalexin accumulation, and
other responses to fungus in DSI but not in DSC (Fig. 3a).
In tomato, although pollination induces the same KEGG
pathway, there was no significant difference between
compatible and incompatible pollination at 24 HAP (Zhao
et al. 2015). In addition, it was speculated that SI has
evolved from defence against pathogens (Kao and
McCubbin 1996), and the defence reaction was weak at 24
HAP because of the expression levels of FLS and EFR
mentioned above. It is possible that the pollination time
leads to a different KEGG pathway enrichment. We
assume that incompatible and compatible pollen tubes were
recognized as foreign incursions at the beginning of pol-
lination. With the continuous pollen-style communication,
the style recognizes incompatible pollen as a foreign
incursion and triggers the defence reaction; however,
compatible pollen will be accepted and the defence reac-
tion will decrease. We concluded that plant–pathogen
interactions participate in the pear SI reaction and in the
pollen discrimination in pear.
Style S-RNase biosynthesis
S-RNase is a major protein that is involved pollen recog-
nition and is expressed mainly in styles. A direct method to
1796 Plant Cell Rep (2017) 36:1785–1799
123
inhibit SI in pear is to knock out the S-RNase gene.
Because of a longer period of early development and late
flowering stage and genetic diversity (Wu et al. 2013), it is
difficult and time-consuming to produce self-compatible
transgenic breeds. Another indirect method to inhibit SI is
to regulate the S-RNase expression or translation levels in
real time. During the young bud stages, the SI reaction is
weak in some GSI species (Gradziel and Robinson 1989;
Qin et al. 2006). Although young bud pollinations are
frequently used to overcome SI in certain species (Gradziel
and Robinson 1989), they are not widely used in agricul-
ture production largely due to petal detachment. In the
present study, the reduced expression level of S-RNase in
compatible pollination was consistent with the reduced
concentration of JA-Me in the CP styles. In addition,
S-RNase in the UP styles decreased at the translation level,
and the expression level decreased in a time-dependent
manner after flowering (Fig. 6). It seems that a compatible
pollen tube can reduce S-RNase, and a mechanism exists in
the style that degrades S-RNase at the translation level,
reducing the expression level in cross-pollination at post
flowering. Therefore, further studies are required to design
methods to accelerate this process, which would help in
overcoming SI in agriculture production.
S-like RNases can be induced in response to mechanical
wounding and phytohormone treatment (Groß et al. 2004;
Rogers and Rogers 1999; Hillwig et al. 2008). In the present
study, JA-Me induced the expression of S-RNase, but the
concentration of JA-Me in self-pollinated styles was not
significantly higher than that in UP styles. In addition, the
concentration of JA-Me was lower in CP styles, which could
be a contrary evidence to prove that a relationship exists
between JA-Me and the expression of S-RNase. We suggest
that JA-Me is involved in pear SI via the induction of the
expression of S-RNase. However, more work is required to
identify the downstream factors. ABA could only induce
S34-RNase, and the effect of ABA was delayed (Fig. 6).
ABA triggered JA accumulation in Salvia miltiorrhiza hairy
roots (Yang et al. 2012), but further studies are required to
confirm whether it can trigger JA biosynthesis in pear styles.
The ABA signals appear to share different mechanisms with
JA in regulating the expression of S-RNase.
Potential interference of the DEG results
Because it is difficult to remove the pollen tube from SP to
CP styles, we selected styles containing pollen. Hence,
there is the possibility of pollen interference in the few
DEGs, or genes were not significantly expressed in the
styles. Nevertheless, the quantity of pollen in the styles was
relatively lower than the total quantity of the styles, and
research (Zhang et al. 2015, 2016; Zhao et al. 2015) on SI in
other species confirmed our finding that styles containing
pollen can be used to analyse the SI reaction in styles. In
addition, the expression level of some organ-specific genes
such as style-specific S-RNase was not affected. Thus,
although there was a potential interference of the DEG
results, this method can help in narrowing the range of
candidate genes in further research on the SI reaction.
In summary, a comprehensive transcriptome-based
characterization of the DEGs involved in self- and cross-
pollination was performed in pear styles. Candidate genes
related to incompatibility and compatibility reactions were
identified. Two major KEGG pathways, ‘‘plant hormone
signal transduction’’ and ‘‘plant–pathogen interaction’’,
were emphasized in pear SI reaction. JA-Me and ABA may
enhance the expression level of S-RNase and pollination
could affect the synthesis of JA-Me and ABA in pear
styles. It appeared that there is relationship between self-
rejection, plant hormones, and pathogen defence in pear SI.
Therefore, the question of how phytohormones affect the
synthesis of S-RNase, how pathogen defence participates
in pear SI, can be examined further.
Author contribution statement DS carried out the
experiments, data analysis, and preparation of figures, and
drafted the manuscript. CT and RW participated in the
experiments and data analysis. CG participated in the data
analysis and preparation of figures, and contributed with
consultation. XW, SH, and JJ contributed to sample col-
lection and data analysis. SZ managed and designed the
research and experiments.
Acknowledgements This work was supported by the National High-
tech R&D Program of China (863 Program, 2013AA102606-02), the
Ph.D. Programs Foundation of Ministry of Education of China
(20130097130004), Jiangsu Province, Science and Technology Sup-
port Program, China (BE2014400), China Agriculture Research
System (CARS-29), and National Natural Science Foundation of
China (31440074).
Compliance with ethical standards
Conflict of interest The authors have no conflicts of interest
declared.
Open Access This article is distributed under the terms of the
Creative Commons Attribution 4.0 International License (http://crea
tivecommons.org/licenses/by/4.0/), which permits unrestricted use,
distribution, and reproduction in any medium, provided you give
appropriate credit to the original author(s) and the source, provide a
link to the Creative Commons license, and indicate if changes were
made.
References
Anders S, Pyl PT, Huber W (2014) HTSeq–a Python framework to
work with high-throughput sequencing data. Bioinformatics
31:166–169
Plant Cell Rep (2017) 36:1785–1799 1797
123

Audic S, Claverie J-M (1997) The significance of digital gene
expression profiles. Genome Res 7:986–995
Chen J, Zhang D, Zhang C, Xia X, Yin W, Tian Q (2015) A putative
PP2C-encoding gene negatively regulates ABA signaling in
Populus euphratica. PLoS One 10:e0139466
Chini A, Fonseca S, Fernandez G, Adie B, Chico J, Lorenzo O,
Garcia-Casado G, Lopez-Vidriero I, Lozano F, Ponce M (2007)
The JAZ family of repressors is the missing link in jasmonate
signalling. Nature 448:666–671
Conesa A, Gotz S, Garcıa-Gomez JM, Terol J, Talon M, Robles M
(2005) Blast2GO: a universal tool for annotation, visualization
and analysis in functional genomics research. Bioinformatics
21:3674–3676
de Nettancourt D (1997) Incompatibility in angiosperms. Sex Plant
Reprod 10:185–199
Du Z, Zhou X, Ling Y, Zhang ZH, Su Z (2010) agriGO: a GO
analysis toolkit for the agricultural community. Nucleic Acids
Res 38:W64–W70
Eaves DJ, Flores-Ortiz C, Haque T, Lin Z, Teng N, Franklin-Tong VE
(2014) Self-incompatibility in Papaver: advances in integrating
the signalling network. Biochem Soc Trans 42:370–376
Gradziel TM, Robinson RW (1989) Breakdown of self-incompatibil-
ity during pistil development in Lycopersicon peruvianum by
modified bud pollination. Sex Plant Reprod 2:38–42
Groß N, Wasternack C, Kock M (2004) Wound-induced RNaseLE
expression is jasmonate and systemin independent and occurs
only locally in tomato (Lycopersicon esculentum cv. Lukullus).
Phytochemistry 65:1343–1350
Hancock CN, Kondo K, Beecher B, McClure B (2003) The S-locus
and unilateral incompatibility. Philos Trans R Soc Lond
358:1133–1140
Hillwig MS, Lebrasseur ND, Green PJ, Macintosh GC (2008) Impact
of transcriptional, ABA-dependent, and ABA-independent path-
ways on wounding regulation of RNS1 expression. Mol Genet
Genomics 280:249–261
Hiratsuka S, Zhang SL, Nakagawa E, Kawai Y (2001) Selective
inhibition of the growth of incompatible pollen tubes by
S-protein in the Japanese pear. Sex Plant Reprod 13:209–215
Huang S, Lee H-S, Karunanandaa B, T-h Kao (1994) Ribonuclease
activity of Petunia inflata S proteins is essential for rejection of
self-pollen. Plant Cell 6:1021–1028
Hwang I, Sheen J, Muller B (2012) Cytokinin signaling networks.
Annu Rev Plant Biol 63:353–380
Indriolo E, Safavian D, Goring DR (2014) The ARC1 E3 ligase
promotes two different self-pollen avoidance traits in Arabidop-
sis. Plant Cell 26:1525–1543
Jubany-Marı T, Prinsen E, Munne-Bosch S, Alegre L (2010) The
timing of methyl jasmonate, hydrogen peroxide and ascorbate
accumulation during water deficit and subsequent recovery in the
Mediterranean shrub Cistus albidus L. Environ Exp Bot
69:47–55
Kanehisa M, Araki M, Goto S, Hattori M, Hirakawa M, Itoh M,
Katayama T, Kawashima S, Okuda S, Tokimatsu T (2008)
KEGG for linking genomes to life and the environment. Nucleic
Acids Res 36:D480–D484
Kao T-H, McCubbin AG (1996) How flowering plants discriminate
between self and non-self pollen to prevent inbreeding. PNAS
93:12059–12065
Kovaleva LV, Zakharova EV (2004) Gametophyte–sporophyte inter-
actions in the pollen–pistil system: 4. the hormonal status and the
mechanism of self-incompatibility. Russ J Plant Physiol
51:446–451
Li CY, Schilmiller AL, Liu GH, Lee GI, Jayanty S, Sageman C,
Vrebalov J, Giovannoni JJ, Yagi K, Kobayashi Y, Howe GA
(2005) Role of b-oxidation in jasmonate biosynthesis and
systemic wound signaling in tomato. Plant Cell 17:971–986
Liu ZQ, Xu GH, Zhang SL (2007) Pyrus pyrifolia stylar S-RNase
induces alterations in the actin cytoskeleton in self-pollen and
tubes in vitro. Protoplasma 232:61–67
Liu B, Morse D, Cappadocia M (2009) Compatible pollinations in
Solanum chacoense decrease both S-RNase and S-RNase
mRNA. PLoS One 4:e5774
Liu W, Fan JB, Li JH, Song YZ, Li Q, Ye Zhang, Xue YB (2014)
SCF SLF-mediated cytosolic degradation of S-RNase is required
for cross-pollen compatibility in S-RNase-based self-incompat-
ibility in Petunia hybrida. Front Genet 5:228
Livak KJ, Schmittgen TD (2001) Analysis of relative gene expression
data using real-time quantitative PCR and the 2-DDCt method.
Methods 25:402–408
Lorenzo O, Solano R (2005) Molecular players regulating the
jasmonate signalling network. Curr Opin Plant Biol 8:532–540
Lorenzo O, Chico JM, Sanchez-Serrano JJ, Solano R (2004)
Jasmonate-insensitive1 encodes a MYC transcription factor
essential to discriminate between different jasmonate-regulated
defense responses in Arabidopsis. Plant Cell 16:1938–1950
McClure B (2004) S-RNase and SLF determine S-haplotype-specific
pollen recognition and rejection. Plant Cell 16:2840–2847
Mortazavi A, Williams BA, McCue K, Schaeffer L, Wold B (2008)
Mapping and quantifying mammalian transcriptomes by RNA-
Seq. Nat Methods 5:621–628
Naseem M, Philippi N, Hussain A, Wangorsch G, Ahmed N,
Dandekar T (2012) Integrated systems view on networking by
hormones in Arabidopsis immunity reveals multiple crosstalk for
cytokinin. Plant Cell 24:1793–1814
Nasrallah JB, Nasrallah ME (2014) Robust self-incompatibility in the
absence of a functional ARC1 gene in Arabidopsis thaliana.
Plant Cell 26:3838–3841
Pawitan Y, Michiels S, Koscielny S, Gusnanto A, Ploner A (2005)
False discovery rate, sensitivity and sample size for microarray
studies. Bioinformatics 21:3017–3024
Planchet E, Rannou O, Ricoult C, Boutet-Mercey S, Maia-Grondard
A, Limami AM (2011) Nitrogen metabolism responses to water
deficit act through both abscisic acid (ABA)-dependent and
independent pathways in Medicago truncatula during post-
germination. J Exp Bot 62:605–615
Qin X, Liu B, Soulard J, Morse D, Cappadocia M (2006) Style-by-
style analysis of two sporadic self-compatible Solanum cha-
coense lines supports a primary role for S-RNases in determining
pollen rejection thresholds. J Exp Bot 57:2001–2013
Rogers SW, Rogers JC (1999) Cloning and characterization of a
gibberellin-induced RNase expressed in barley aleurone cells.
Plant Physiol 119:1457–1464
Schaller F (2001) Enzymes of the biosynthesis of octadecanoid-
derived signalling molecules. J Exp Bot 52:11–23
Swanson R, Edlund AF, Preuss D (2004) Species specificity in
pollen–pistil interactions. Annu Rev Genet 38:793–818
Takayama S, Isogai A (2005) Self-incompatibility in plants. Annu
Rev Plant Biol 56:467–489
Tintor N, Ross A, Kanehara K, Yamada K, Fan L, Kemmerling B,
Nurnberger T, Tsuda K, Saijo Y (2013) Layered pattern receptor
signaling via ethylene and endogenous elicitor peptides during
Arabidopsis immunity to bacterial infection. PNAS110:6211–6216
Trapnell C, Roberts A, Goff L, Pertea G, Kim D, Kelley DR, Pimentel
H, Salzberg SL, Rinn JL, Pachter L (2012) Differential gene and
transcript expression analysis of RNA-seq experiments with
TopHat and Cufflinks. Nat Protoc 7:562–578
Tung C-W, Dwyer KG, Nasrallah ME, Nasrallah JB (2005) Genome-
wide identification of genes expressed in Arabidopsis pistils
specifically along the path of pollen tube growth. Plant Physiol
138:977–989
Van Doorn WG, Woltering EJ (2008) Physiology and molecular
biology of petal senescence. J Exp Bot 59:453–480
1798 Plant Cell Rep (2017) 36:1785–1799
123
Vick BA, Zimmerman DC (1984) Biosynthesis of jasmonic acid by
several plant species. Plant Physiol 75:458–461
Wang CL, Xu GH, Jiang XT, Chen G, Wu J, Wu HQ, Zhang SL
(2009) S-RNase triggers mitochondrial alteration and DNA
degradation in the incompatible pollen tube of Pyrus pyrifolia
in vitro. Plant J 57:220–229
Wang CL, Wu J, Xu GH, Gao YB, Chen G, Wu JY, Wu HQ, Zhang
SL (2010) S-RNase disrupts tip-localized reactive oxygen
species and induces nuclear DNA degradation in incompatible
pollen tubes of Pyrus pyrifolia. J Cell Sci 123:4301–4309
Wilkins KA, Poulter NS, Franklin-Tong VE (2014) Taking one for
the team: self-recognition and cell suicide in pollen. J Exp Bot
65:1331–1342
Wilkins KA, Bosch M, Haque T, Teng N, Poulter NS, Franklin-Tong
VE (2015) Self-incompatibility-induced programmed cell death
in field poppy pollen involves dramatic acidification of the
incompatible pollen tube cytosol. Plant Physiol 167:766–779
Wu J, Wang ZW, Shi ZB, Zhang S, Ming R, Zhu SL, Khan MA, Tao
ST (2013) The genome of the pear (Pyrus bretschneideri Rehd.).
Genome Res 23:396–408
Yang JC, Zhang JH, Wang ZQ, Zhu QS, Wang W (2001) Hormonal
changes in the grains of rice subjected to water stress during
grain filling. Plant Physiol 127:315–323
Yang DF, Ma PD, Liang X, Wei Z, Liang ZS, Liu Y, Liu FH (2012)
PEG and ABA trigger methyl jasmonate accumulation to induce
the MEP pathway and increase tanshinone production in Salvia
miltiorrhiza hairy roots. Physiol Plant 146:173–183
Ye J, Fang L, Zheng HK, Zhang Y, Chen J, Zhang ZJ, Wang J, Li ST,
Li RQ, Bolund L, Wang J (2006) WEGO: a web tool for plotting
GO annotations. Nucleic Acids Res 34:W293–W297
Yi M, Horton JD, Cohen JC, Hobbs HH, Stephens RM (2006)
WholePathwayScope: a comprehensive pathway-based analysis
tool for high-throughput data. BMC Bioinform 7:30
Zhang SW, Ding F, He XH, Luo C, Huang GX, Hu Y (2015)
Characterization of the ‘Xiangshui’ lemon transcriptome by de
novo assembly to discover genes associated with self-incompat-
ibility. Mol Genet Genomics 290:365–375
Zhang CC, Wang LY, Wei K, Wu LY, Li HL, Zhang F, Cheng H, Ni
DJ (2016) Transcriptome analysis reveals self-incompatibility in
the tea plant (Camellia sinensis) might be under gametophytic
control. BMC Genomics 17:359
Zhao PF, Zhang LD, Zhao LX (2015) Dissection of the style’s
response to pollination using transcriptome profiling in self-
compatible (Solanum pimpinellifolium) and self-incompatible
(Solanum chilense) tomato species. BMC Plant Biol 15:119
Zhou Q, Jia J, Huang X, Yan X, Cheng L, Chen S, Li X, Peng X, Liu
G (2014) The large-scale investigation of gene expression in
Leymus chinensis stigmas provides a valuable resource for
understanding the mechanisms of poaceae self-incompatibility.
BMC Genomics 15:1–14
Plant Cell Rep (2017) 36:1785–1799 1799
123