Transcriptome analysis of molecular mechanisms … · Summary of COG classfication of Mythimna...
19
Transcriptome analysis of molecular mechanisms responsible for light-stress response in Mythimna separata (Walker) Yun Duan, ZhongJun Gong, RenHai Wu, Jin Miao, YueLi Jiang, Tong Li, XiaoBo Wu, YuQ ing Wu * Institute of Plant Protection, Henan Academy of Agricultural Sciences, Key Laboratory of Crop Pest Control of Henan Province, Key Laboratory of Integrated Pest Management on Crops in Southern Region of North China, Zhengzhou 450002, China. * Corresponding author: Y.Q. Wu. (email: [email protected])
Transcript of Transcriptome analysis of molecular mechanisms … · Summary of COG classfication of Mythimna...
Transcriptome analysis of molecular mechanisms responsible for
light-stress response in Mythimna separata (Walker)
Yun Duan, ZhongJun Gong, RenHai Wu, Jin Miao, YueLi Jiang, Tong Li, XiaoBo Wu,
YuQing Wu*
Institute of Plant Protection, Henan Academy of Agricultural Sciences, Key Laboratory of Crop
Pest Control of Henan Province, Key Laboratory of Integrated Pest Management on Crops in
Southern Region of North China, Zhengzhou 450002, China.
*Corresponding author: Y.Q. Wu. (email: [email protected])
Supplementary information
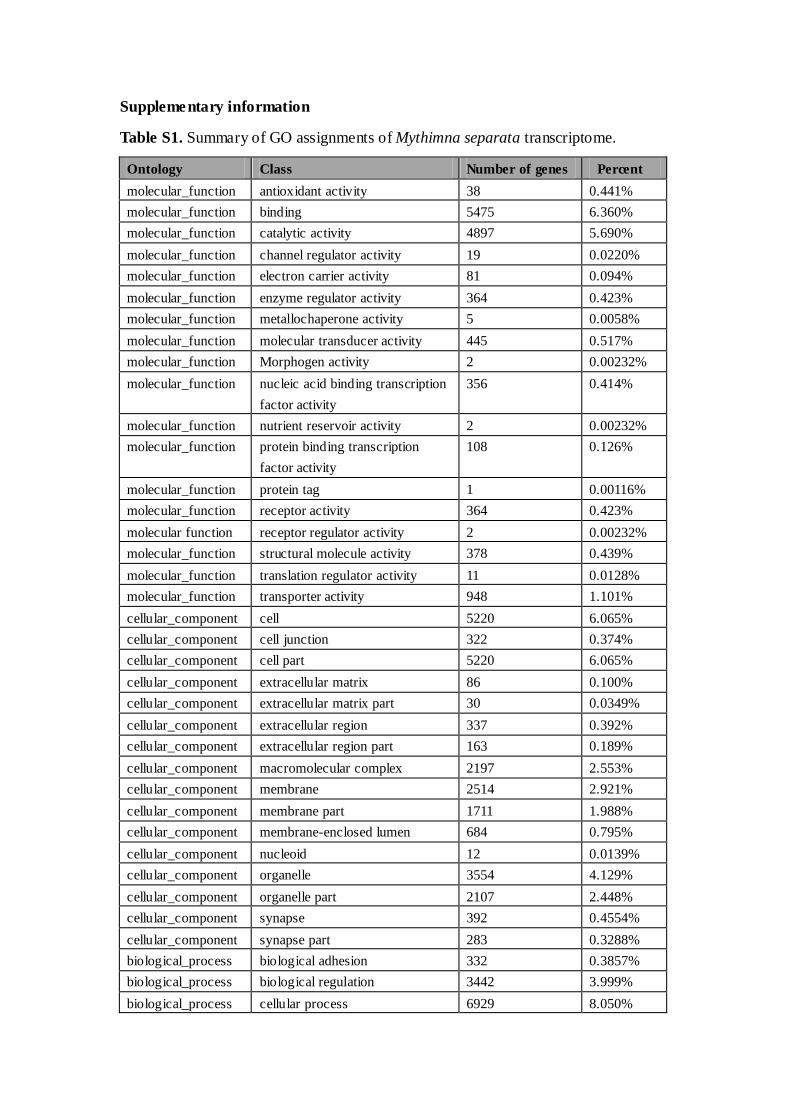
Table S1. Summary of GO assignments of Mythimna separata transcriptome.
Ontology Class Number of genes Percent
molecular_function antioxidant activity 38 0.441%
molecular_function binding 5475 6.360%
molecular_function catalytic activity 4897 5.690%
molecular_function channel regulator activity 19 0.0220%
molecular_function electron carrier activity 81 0.094%
molecular_function enzyme regulator activity 364 0.423%
molecular_function metallochaperone activity 5 0.0058%
molecular_function molecular transducer activity 445 0.517%
molecular_function Morphogen activity 2 0.00232%
molecular_function nucleic acid binding transcription
factor activity
356 0.414%
molecular_function nutrient reservoir activity 2 0.00232%
molecular_function protein binding transcription
factor activity
108 0.126%
molecular_function protein tag 1 0.00116%
molecular_function receptor activity 364 0.423%
molecular function receptor regulator activity 2 0.00232%
molecular_function structural molecule activity 378 0.439%
molecular_function translation regulator activity 11 0.0128%
molecular_function transporter activity 948 1.101%
cellular_component cell 5220 6.065%
cellular_component cell junction 322 0.374%
cellular_component cell part 5220 6.065%
cellular_component extracellular matrix 86 0.100%
cellular_component extracellular matrix part 30 0.0349%
cellular_component extracellular region 337 0.392%
cellular_component extracellular region part 163 0.189%
cellular_component macromolecular complex 2197 2.553%
cellular_component membrane 2514 2.921%
cellular_component membrane part 1711 1.988%
cellular_component membrane-enclosed lumen 684 0.795%
cellular_component nucleoid 12 0.0139%
cellular_component organelle 3554 4.129%
cellular_component organelle part 2107 2.448%
cellular_component synapse 392 0.4554%
cellular_component synapse part 283 0.3288%
biological_process biological adhesion 332 0.3857%
biological_process biological regulation 3442 3.999%
biological_process cellular process 6929 8.050%
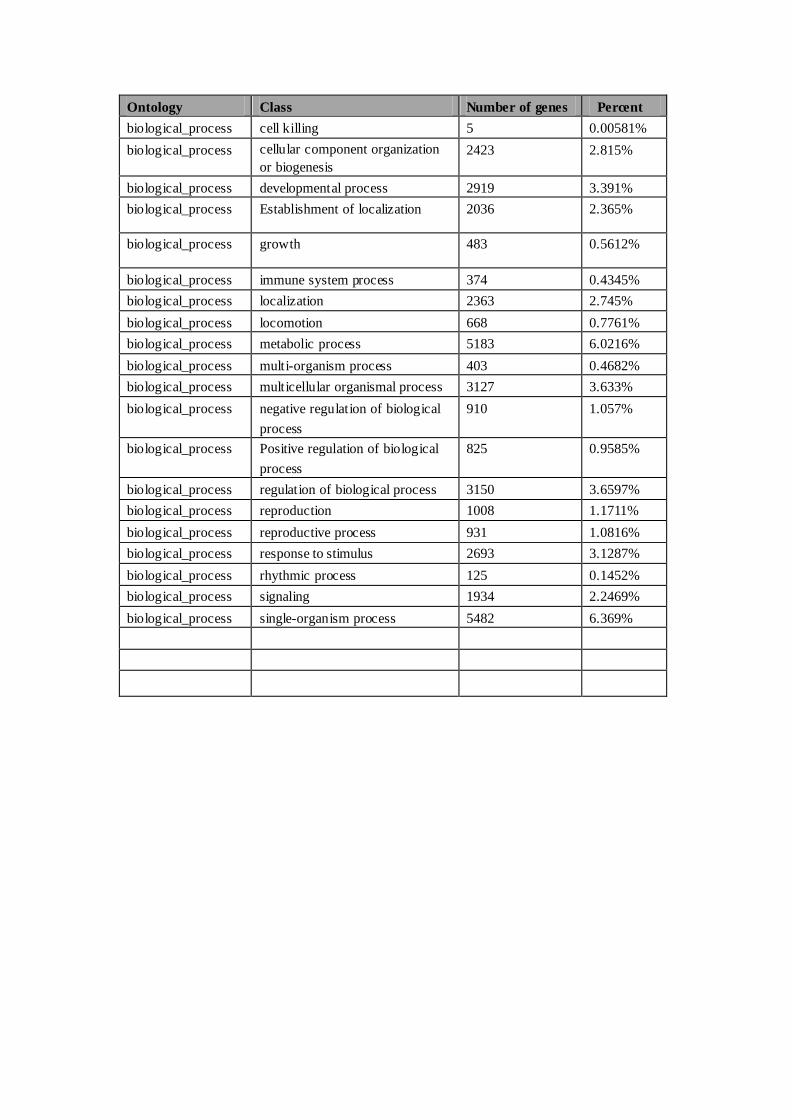
Ontology Class Number of genes Percent
biological_process cell killing 5 0.00581%
biological_process cellular component organization
or biogenesis
2423 2.815%
biological_process developmental process 2919 3.391%
biological_process Establishment of localization 2036 2.365%
biological_process growth 483 0.5612%
biological_process immune system process 374 0.4345%
biological_process localization 2363 2.745%
biological_process locomotion 668 0.7761%
biological_process metabolic process 5183 6.0216%
biological_process multi-organism process 403 0.4682%
biological_process multicellular organismal process 3127 3.633%
biological_process negative regulation of biological
process
910 1.057%
biological_process Positive regulation of biological
process
825 0.9585%
biological_process regulation of biological process 3150 3.6597%
biological_process reproduction 1008 1.1711%
biological_process reproductive process 931 1.0816%
biological_process response to stimulus 2693 3.1287%
biological_process rhythmic process 125 0.1452%
biological_process signaling 1934 2.2469%
biological_process single-organism process 5482 6.369%
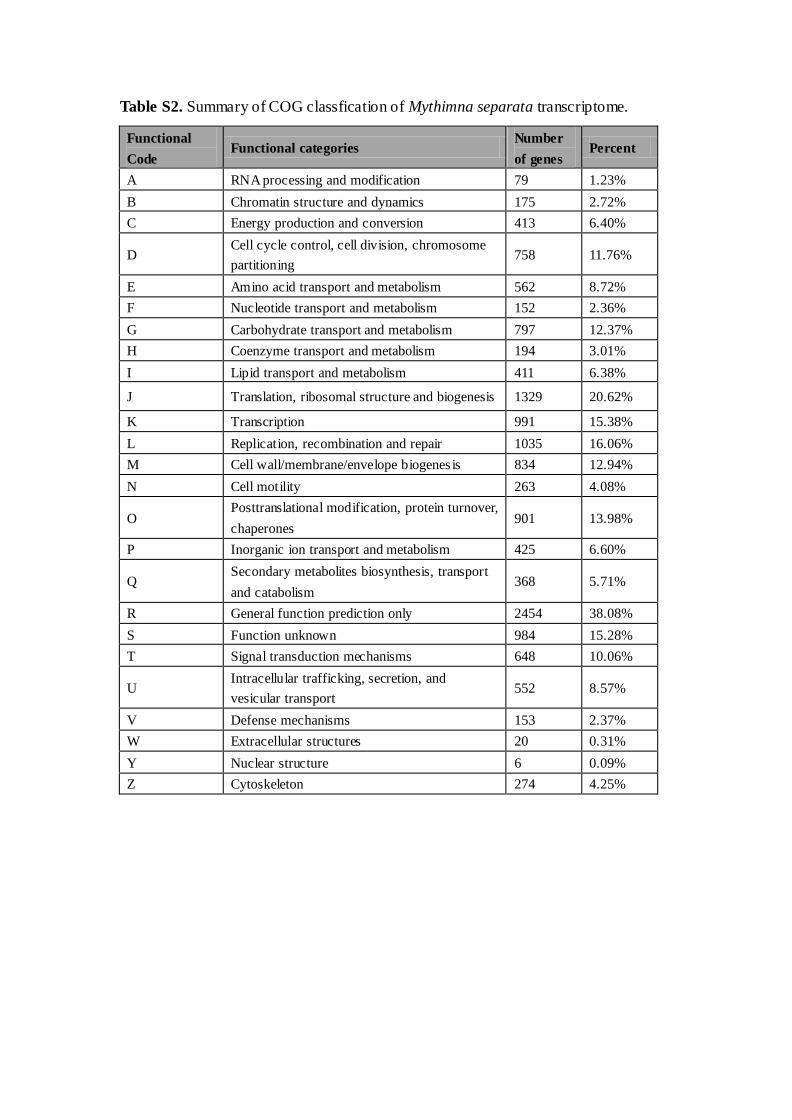
Table S2. Summary of COG classfication of Mythimna separata transcriptome.
Functional
Code Functional categories
Number
of genes Percent
A RNA processing and modification 79 1.23%
B Chromatin structure and dynamics 175 2.72%
C Energy production and conversion 413 6.40%
D Cell cycle control, cell division, chromosome
partitioning 758 11.76%
E Amino acid transport and metabolism 562 8.72%
F Nucleotide transport and metabolism 152 2.36%
G Carbohydrate transport and metabolism 797 12.37%
H Coenzyme transport and metabolism 194 3.01%
I Lipid transport and metabolism 411 6.38%
J Translation, ribosomal structure and biogenesis 1329 20.62%
K Transcription 991 15.38%
L Replication, recombination and repair 1035 16.06%
M Cell wall/membrane/envelope biogenes is 834 12.94%
N Cell motility 263 4.08%
O Posttranslational modification, protein turnover,
chaperones 901 13.98%
P Inorganic ion transport and metabolism 425 6.60%
Q Secondary metabolites biosynthesis, transport
and catabolism 368 5.71%
R General function prediction only 2454 38.08%
S Function unknown 984 15.28%
T Signal transduction mechanisms 648 10.06%
U Intracellular trafficking, secretion, and
vesicular transport 552 8.57%
V Defense mechanisms 153 2.37%
W Extracellular structures 20 0.31%
Y Nuclear structure 6 0.09%
Z Cytoskeleton 274 4.25%
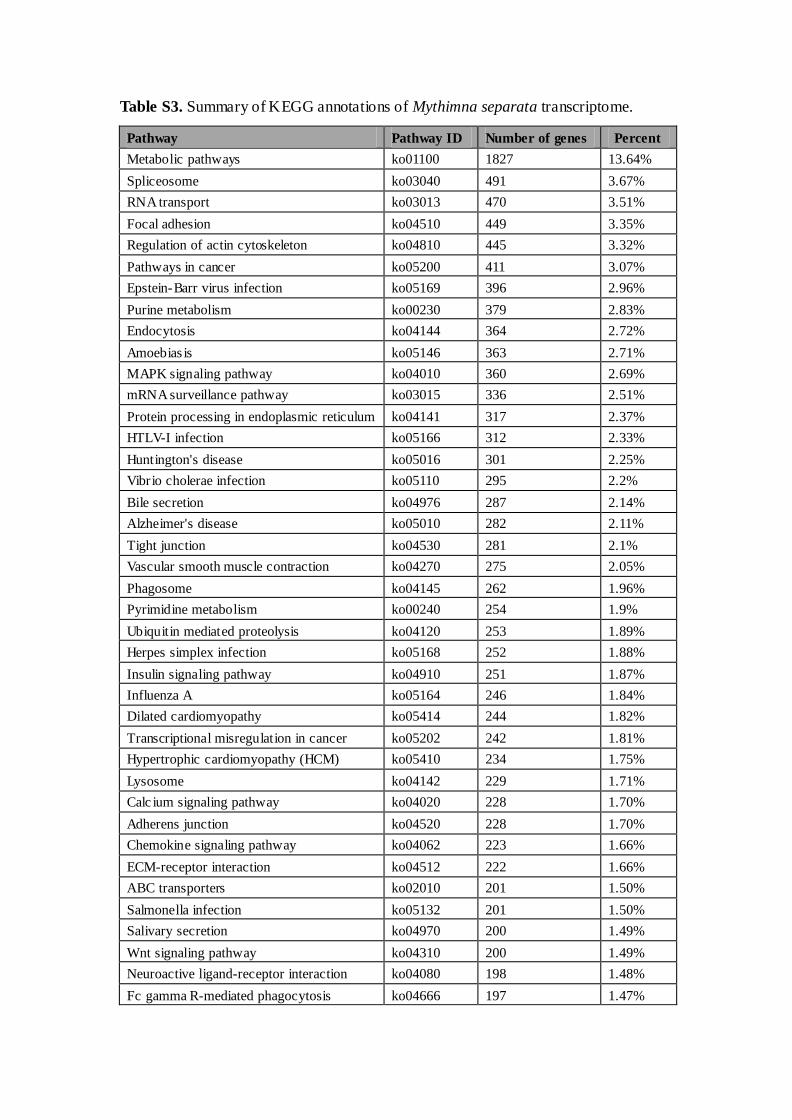
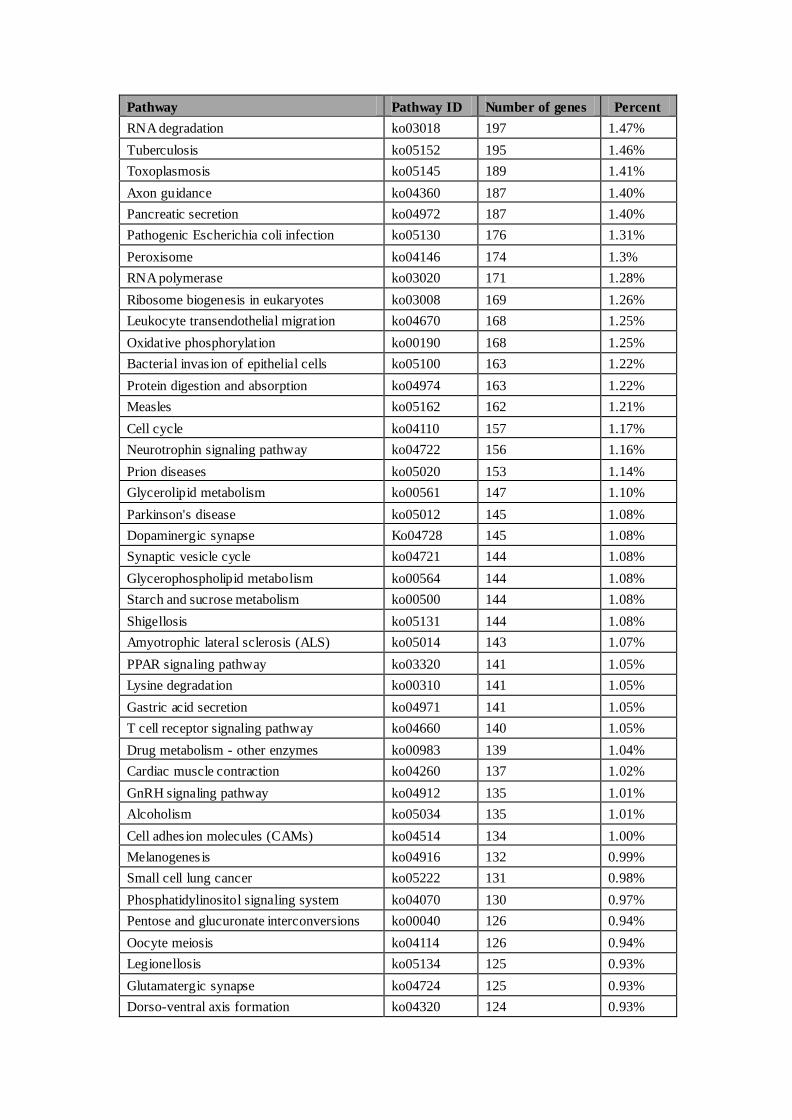
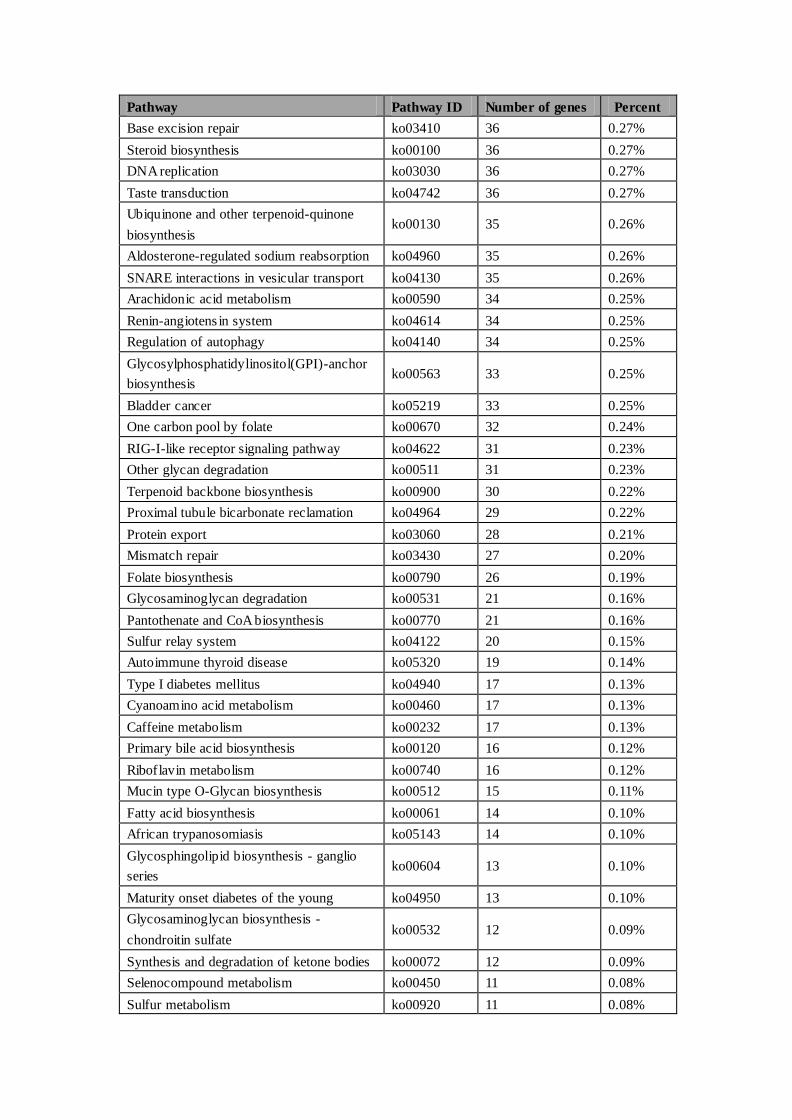
Table S3. Summary of KEGG annotations of Mythimna separata transcriptome.
Pathway Pathway ID Number of genes Percent
Metabolic pathways ko01100 1827 13.64%
Spliceosome ko03040 491 3.67%
RNA transport ko03013 470 3.51%
Focal adhesion ko04510 449 3.35%
Regulation of actin cytoskeleton ko04810 445 3.32%
Pathways in cancer ko05200 411 3.07%
Epstein-Barr virus infection ko05169 396 2.96%
Purine metabolism ko00230 379 2.83%
Endocytosis ko04144 364 2.72%
Amoebias is ko05146 363 2.71%
MAPK signaling pathway ko04010 360 2.69%
mRNA surveillance pathway ko03015 336 2.51%
Protein processing in endoplasmic reticulum ko04141 317 2.37%
HTLV-I infection ko05166 312 2.33%
Huntington's disease ko05016 301 2.25%
Vibrio cholerae infection ko05110 295 2.2%
Bile secretion ko04976 287 2.14%
Alzheimer's disease ko05010 282 2.11%
Tight junction ko04530 281 2.1%
Vascular smooth muscle contraction ko04270 275 2.05%
Phagosome ko04145 262 1.96%
Pyrimidine metabolism ko00240 254 1.9%
Ubiquitin mediated proteolysis ko04120 253 1.89%
Herpes simplex infection ko05168 252 1.88%
Insulin signaling pathway ko04910 251 1.87%
Influenza A ko05164 246 1.84%
Dilated cardiomyopathy ko05414 244 1.82%
Transcriptional misregulation in cancer ko05202 242 1.81%
Hypertrophic cardiomyopathy (HCM) ko05410 234 1.75%
Lysosome ko04142 229 1.71%
Calc ium signaling pathway ko04020 228 1.70%
Adherens junction ko04520 228 1.70%
Chemokine signaling pathway ko04062 223 1.66%
ECM-receptor interaction ko04512 222 1.66%
ABC transporters ko02010 201 1.50%
Salmonella infection ko05132 201 1.50%
Salivary secretion ko04970 200 1.49%
Wnt signaling pathway ko04310 200 1.49%
Neuroactive ligand-receptor interaction ko04080 198 1.48%
Fc gamma R-mediated phagocytosis ko04666 197 1.47%
Pathway Pathway ID Number of genes Percent
RNA degradation ko03018 197 1.47%
Tuberculosis ko05152 195 1.46%
Toxoplasmosis ko05145 189 1.41%
Axon guidance ko04360 187 1.40%
Pancreatic secretion ko04972 187 1.40%
Pathogenic Escherichia coli infection ko05130 176 1.31%
Peroxisome ko04146 174 1.3%
RNA polymerase ko03020 171 1.28%
Ribosome biogenesis in eukaryotes ko03008 169 1.26%
Leukocyte transendothelial migration ko04670 168 1.25%
Oxidative phosphorylation ko00190 168 1.25%
Bacterial invas ion of epithelial cells ko05100 163 1.22%
Protein digestion and absorption ko04974 163 1.22%
Measles ko05162 162 1.21%
Cell cycle ko04110 157 1.17%
Neurotrophin signaling pathway ko04722 156 1.16%
Prion diseases ko05020 153 1.14%
Glycerolipid metabolism ko00561 147 1.10%
Parkinson's disease ko05012 145 1.08%
Dopaminergic synapse Ko04728 145 1.08%
Synaptic vesicle cycle ko04721 144 1.08%
Glycerophospholipid metabolism ko00564 144 1.08%
Starch and sucrose metabolism ko00500 144 1.08%
Shigellosis ko05131 144 1.08%
Amyotrophic lateral sclerosis (ALS) ko05014 143 1.07%
PPAR signaling pathway ko03320 141 1.05%
Lysine degradation ko00310 141 1.05%
Gastric acid secretion ko04971 141 1.05%
T cell receptor signaling pathway ko04660 140 1.05%
Drug metabolism - other enzymes ko00983 139 1.04%
Cardiac muscle contraction ko04260 137 1.02%
GnRH signaling pathway ko04912 135 1.01%
Alcoholism ko05034 135 1.01%
Cell adhes ion molecules (CAMs) ko04514 134 1.00%
Melanogenes is ko04916 132 0.99%
Small cell lung cancer ko05222 131 0.98%
Phosphatidylinositol signaling system ko04070 130 0.97%
Pentose and glucuronate interconversions ko00040 126 0.94%
Oocyte meiosis ko04114 126 0.94%
Legionellosis ko05134 125 0.93%
Glutamatergic synapse ko04724 125 0.93%
Dorso-ventral axis formation ko04320 124 0.93%
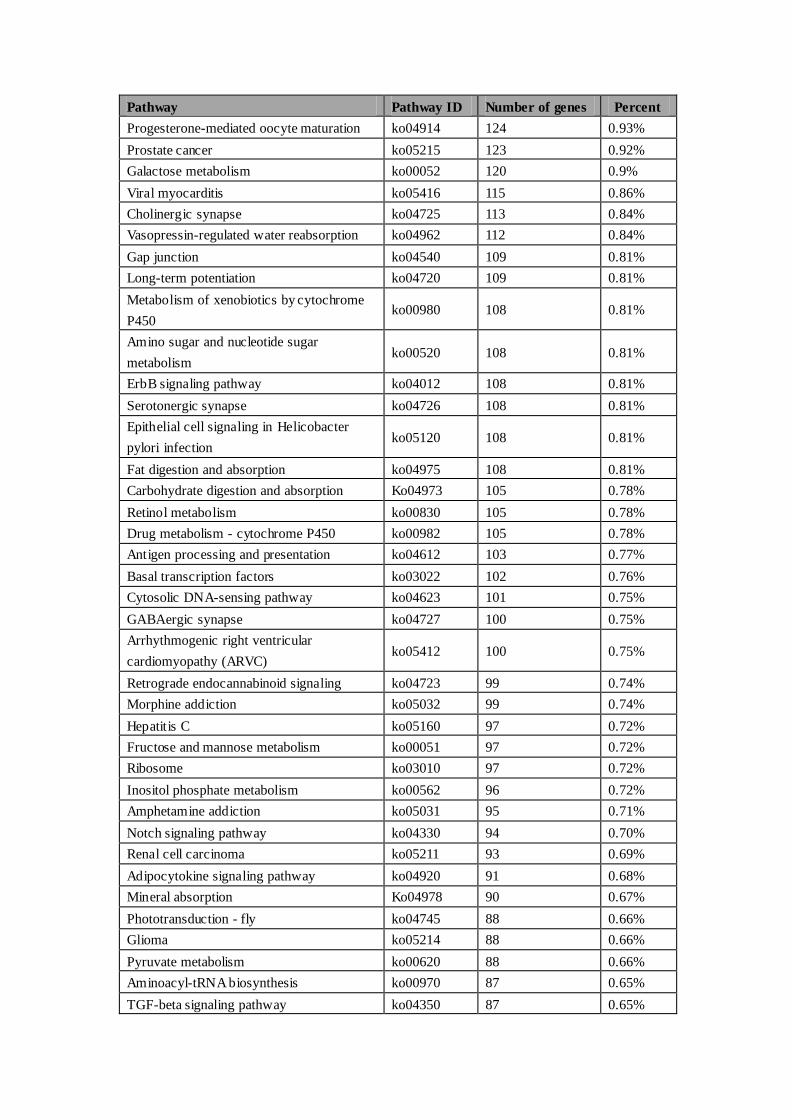
Pathway Pathway ID Number of genes Percent
Progesterone-mediated oocyte maturation ko04914 124 0.93%
Prostate cancer ko05215 123 0.92%
Galactose metabolism ko00052 120 0.9%
Viral myocarditis ko05416 115 0.86%
Cholinergic synapse ko04725 113 0.84%
Vasopressin-regulated water reabsorption ko04962 112 0.84%
Gap junction ko04540 109 0.81%
Long-term potentiation ko04720 109 0.81%
Metabolism of xenobiotics by cytochrome
P450 ko00980 108 0.81%
Amino sugar and nucleotide sugar
metabolism ko00520 108 0.81%
ErbB signaling pathway ko04012 108 0.81%
Serotonergic synapse ko04726 108 0.81%
Epithelial cell signaling in Helicobacter
pylori infection ko05120 108 0.81%
Fat digestion and absorption ko04975 108 0.81%
Carbohydrate digestion and absorption Ko04973 105 0.78%
Retinol metabolism ko00830 105 0.78%
Drug metabolism - cytochrome P450 ko00982 105 0.78%
Antigen processing and presentation ko04612 103 0.77%
Basal transcription factors ko03022 102 0.76%
Cytosolic DNA-sensing pathway ko04623 101 0.75%
GABAergic synapse ko04727 100 0.75%
Arrhythmogenic right ventricular
cardiomyopathy (ARVC) ko05412 100 0.75%
Retrograde endocannabinoid signaling ko04723 99 0.74%
Morphine addiction ko05032 99 0.74%
Hepatitis C ko05160 97 0.72%
Fructose and mannose metabolism ko00051 97 0.72%
Ribosome ko03010 97 0.72%
Inositol phosphate metabolism ko00562 96 0.72%
Amphetamine addiction ko05031 95 0.71%
Notch signaling pathway ko04330 94 0.70%
Renal cell carcinoma ko05211 93 0.69%
Adipocytokine signaling pathway ko04920 91 0.68%
Mineral absorption Ko04978 90 0.67%
Phototransduction - fly ko04745 88 0.66%
Glioma ko05214 88 0.66%
Pyruvate metabolism ko00620 88 0.66%
Aminoacyl-tRNA biosynthesis ko00970 87 0.65%
TGF-beta signaling pathway ko04350 87 0.65%
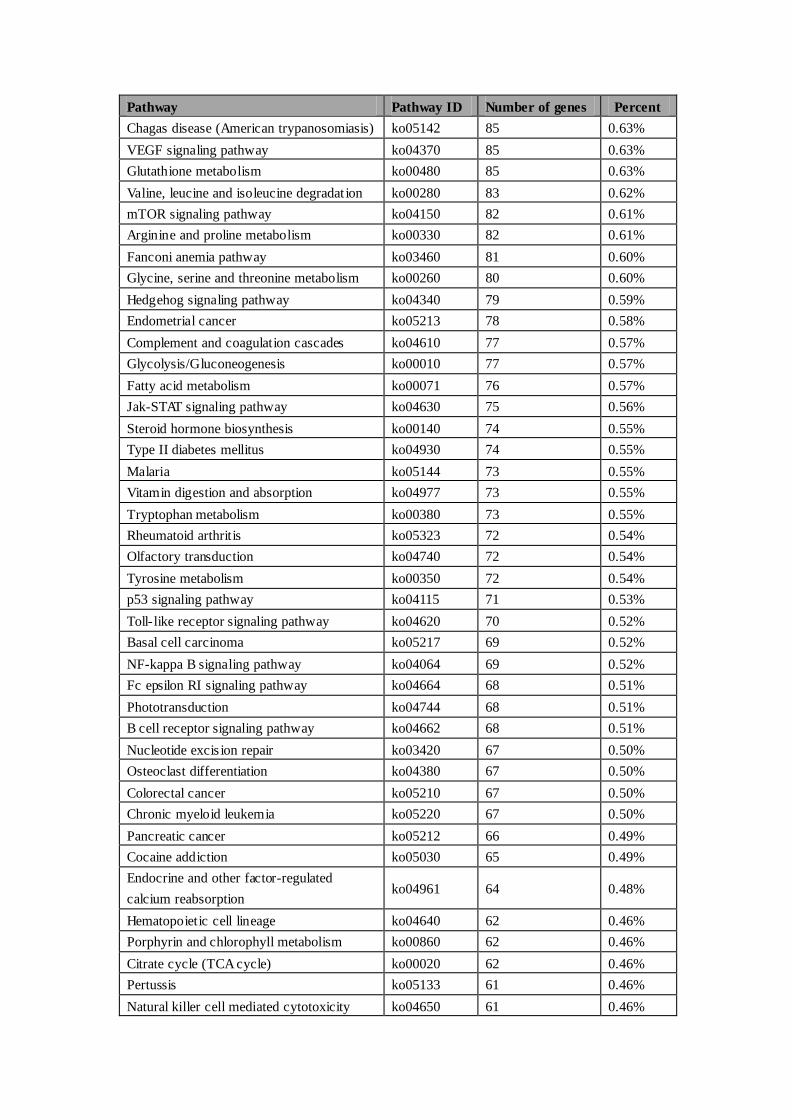
Pathway Pathway ID Number of genes Percent
Chagas disease (American trypanosomiasis) ko05142 85 0.63%
VEGF signaling pathway ko04370 85 0.63%
Glutathione metabolism ko00480 85 0.63%
Valine, leucine and isoleucine degradat ion ko00280 83 0.62%
mTOR signaling pathway ko04150 82 0.61%
Arginine and proline metabolism ko00330 82 0.61%
Fanconi anemia pathway ko03460 81 0.60%
Glycine, serine and threonine metabolism ko00260 80 0.60%
Hedgehog signaling pathway ko04340 79 0.59%
Endometrial cancer ko05213 78 0.58%
Complement and coagulation cascades ko04610 77 0.57%
Glycolysis/Gluconeogenesis ko00010 77 0.57%
Fatty acid metabolism ko00071 76 0.57%
Jak-STAT signaling pathway ko04630 75 0.56%
Steroid hormone biosynthesis ko00140 74 0.55%
Type II diabetes mellitus ko04930 74 0.55%
Malaria ko05144 73 0.55%
Vitamin digestion and absorption ko04977 73 0.55%
Tryptophan metabolism ko00380 73 0.55%
Rheumatoid arthritis ko05323 72 0.54%
Olfactory transduction ko04740 72 0.54%
Tyrosine metabolism ko00350 72 0.54%
p53 signaling pathway ko04115 71 0.53%
Toll- like receptor signaling pathway ko04620 70 0.52%
Basal cell carcinoma ko05217 69 0.52%
NF-kappa B signaling pathway ko04064 69 0.52%
Fc epsilon RI signaling pathway ko04664 68 0.51%
Phototransduction ko04744 68 0.51%
B cell receptor signaling pathway ko04662 68 0.51%
Nucleotide excis ion repair ko03420 67 0.50%
Osteoclast differentiation ko04380 67 0.50%
Colorectal cancer ko05210 67 0.50%
Chronic myeloid leukemia ko05220 67 0.50%
Pancreatic cancer ko05212 66 0.49%
Cocaine addiction ko05030 65 0.49%
Endocrine and other factor-regulated
calcium reabsorption ko04961 64 0.48%
Hematopoietic cell lineage ko04640 62 0.46%
Porphyrin and chlorophyll metabolism ko00860 62 0.46%
Citrate cycle (TCA cycle) ko00020 62 0.46%
Pertussis ko05133 61 0.46%
Natural killer cell mediated cytotoxicity ko04650 61 0.46%
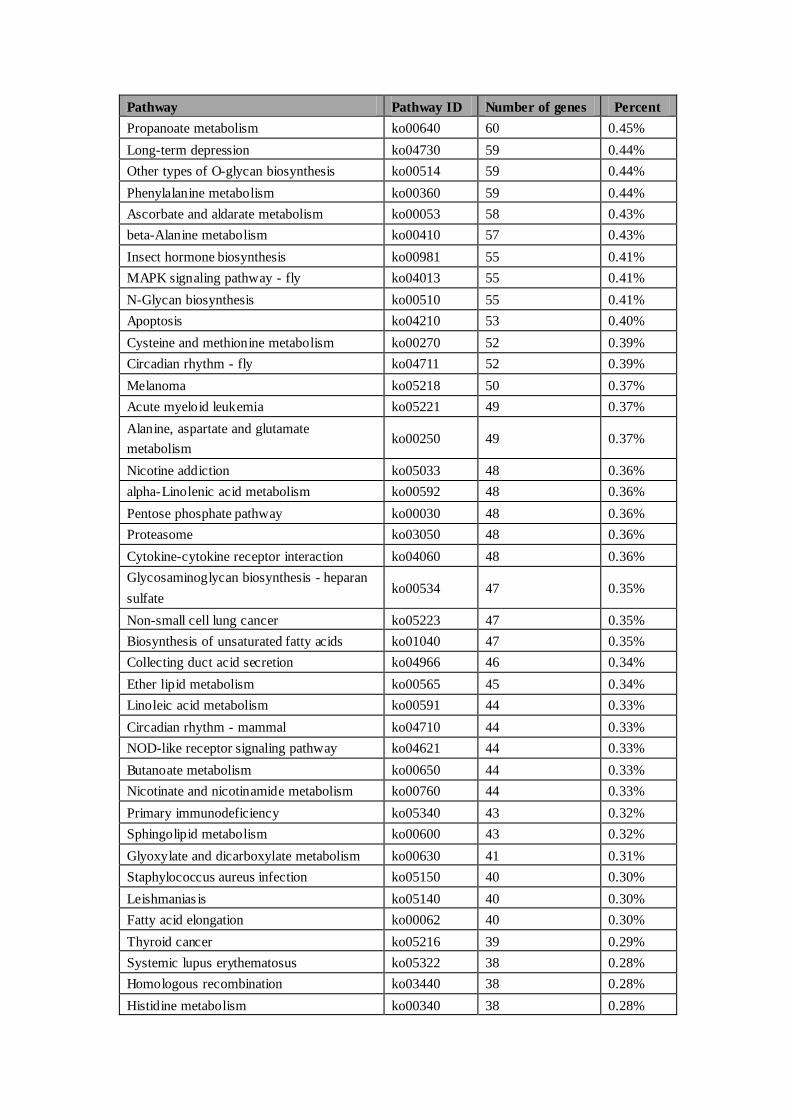
Pathway Pathway ID Number of genes Percent
Propanoate metabolism ko00640 60 0.45%
Long-term depression ko04730 59 0.44%
Other types of O-glycan biosynthesis ko00514 59 0.44%
Phenylalanine metabolism ko00360 59 0.44%
Ascorbate and aldarate metabolism ko00053 58 0.43%
beta-Alanine metabolism ko00410 57 0.43%
Insect hormone biosynthesis ko00981 55 0.41%
MAPK signaling pathway - fly ko04013 55 0.41%
N-Glycan biosynthesis ko00510 55 0.41%
Apoptosis ko04210 53 0.40%
Cysteine and methionine metabolism ko00270 52 0.39%
Circadian rhythm - fly ko04711 52 0.39%
Melanoma ko05218 50 0.37%
Acute myeloid leukemia ko05221 49 0.37%
Alanine, aspartate and glutamate
metabolism ko00250 49 0.37%
Nicotine addiction ko05033 48 0.36%
alpha-Linolenic acid metabolism ko00592 48 0.36%
Pentose phosphate pathway ko00030 48 0.36%
Proteasome ko03050 48 0.36%
Cytokine-cytokine receptor interaction ko04060 48 0.36%
Glycosaminoglycan biosynthesis - heparan
sulfate ko00534 47 0.35%
Non-small cell lung cancer ko05223 47 0.35%
Biosynthesis of unsaturated fatty acids ko01040 47 0.35%
Collecting duct acid secretion ko04966 46 0.34%
Ether lipid metabolism ko00565 45 0.34%
Linoleic acid metabolism ko00591 44 0.33%
Circadian rhythm - mammal ko04710 44 0.33%
NOD-like receptor signaling pathway ko04621 44 0.33%
Butanoate metabolism ko00650 44 0.33%
Nicotinate and nicotinamide metabolism ko00760 44 0.33%
Primary immunodeficiency ko05340 43 0.32%
Sphingolipid metabolism ko00600 43 0.32%
Glyoxylate and dicarboxylate metabolism ko00630 41 0.31%
Staphylococcus aureus infection ko05150 40 0.30%
Leishmanias is ko05140 40 0.30%
Fatty acid elongation ko00062 40 0.30%
Thyroid cancer ko05216 39 0.29%
Systemic lupus erythematosus ko05322 38 0.28%
Homologous recombination ko03440 38 0.28%
Histidine metabolism ko00340 38 0.28%
Pathway Pathway ID Number of genes Percent
Base excision repair ko03410 36 0.27%
Steroid biosynthesis ko00100 36 0.27%
DNA replication ko03030 36 0.27%
Taste transduction ko04742 36 0.27%
Ubiquinone and other terpenoid-quinone
biosynthesis ko00130 35 0.26%
Aldosterone-regulated sodium reabsorption ko04960 35 0.26%
SNARE interactions in vesicular transport ko04130 35 0.26%
Arachidonic acid metabolism ko00590 34 0.25%
Renin-angiotens in system ko04614 34 0.25%
Regulation of autophagy ko04140 34 0.25%
Glycosylphosphatidylinositol(GPI)-anchor
biosynthesis ko00563 33 0.25%
Bladder cancer ko05219 33 0.25%
One carbon pool by folate ko00670 32 0.24%
RIG-I-like receptor signaling pathway ko04622 31 0.23%
Other glycan degradation ko00511 31 0.23%
Terpenoid backbone biosynthesis ko00900 30 0.22%
Proximal tubule bicarbonate reclamation ko04964 29 0.22%
Protein export ko03060 28 0.21%
Mismatch repair ko03430 27 0.20%
Folate biosynthesis ko00790 26 0.19%
Glycosaminoglycan degradation ko00531 21 0.16%
Pantothenate and CoA biosynthesis ko00770 21 0.16%
Sulfur relay system ko04122 20 0.15%
Autoimmune thyroid disease ko05320 19 0.14%
Type I diabetes mellitus ko04940 17 0.13%
Cyanoamino acid metabolism ko00460 17 0.13%
Caffeine metabolism ko00232 17 0.13%
Primary bile acid biosynthesis ko00120 16 0.12%
Riboflavin metabolism ko00740 16 0.12%
Mucin type O-Glycan biosynthesis ko00512 15 0.11%
Fatty acid biosynthesis ko00061 14 0.10%
African trypanosomiasis ko05143 14 0.10%
Glycosphingolipid biosynthesis - ganglio
series ko00604 13 0.10%
Maturity onset diabetes of the young ko04950 13 0.10%
Glycosaminoglycan biosynthesis -
chondroitin sulfate ko00532 12 0.09%
Synthesis and degradation of ketone bodies ko00072 12 0.09%
Selenocompound metabolism ko00450 11 0.08%
Sulfur metabolism ko00920 11 0.08%
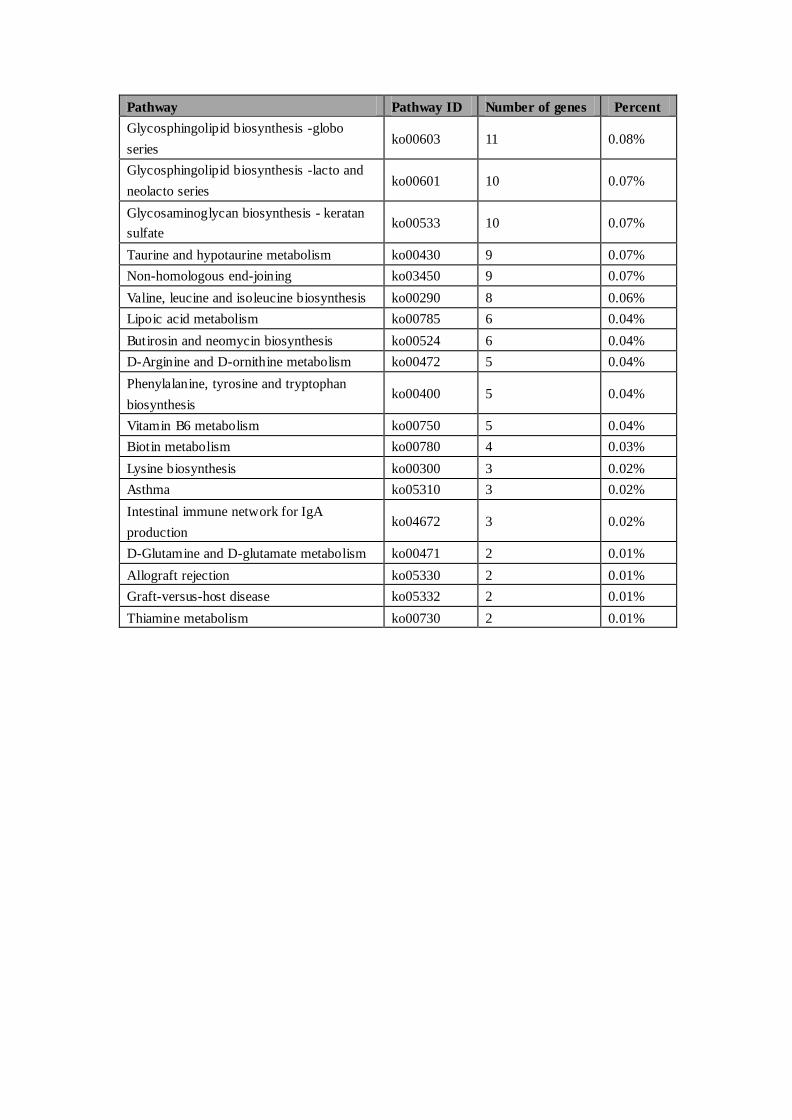
Pathway Pathway ID Number of genes Percent
Glycosphingolipid biosynthesis -globo
series ko00603 11 0.08%
Glycosphingolipid biosynthesis -lacto and
neolacto series ko00601 10 0.07%
Glycosaminoglycan biosynthesis - keratan
sulfate ko00533 10 0.07%
Taurine and hypotaurine metabolism ko00430 9 0.07%
Non-homologous end-joining ko03450 9 0.07%
Valine, leucine and isoleucine biosynthesis ko00290 8 0.06%
Lipoic acid metabolism ko00785 6 0.04%
Butirosin and neomycin biosynthesis ko00524 6 0.04%
D-Arginine and D-ornithine metabolism ko00472 5 0.04%
Phenylalanine, tyrosine and tryptophan
biosynthesis ko00400 5 0.04%
Vitamin B6 metabolism ko00750 5 0.04%
Biotin metabolism ko00780 4 0.03%
Lysine biosynthesis ko00300 3 0.02%
Asthma ko05310 3 0.02%
Intestinal immune network for IgA
production ko04672 3 0.02%
D-Glutamine and D-glutamate metabolism ko00471 2 0.01%
Allograft rejection ko05330 2 0.01%
Graft-versus-host disease ko05332 2 0.01%
Thiamine metabolism ko00730 2 0.01%
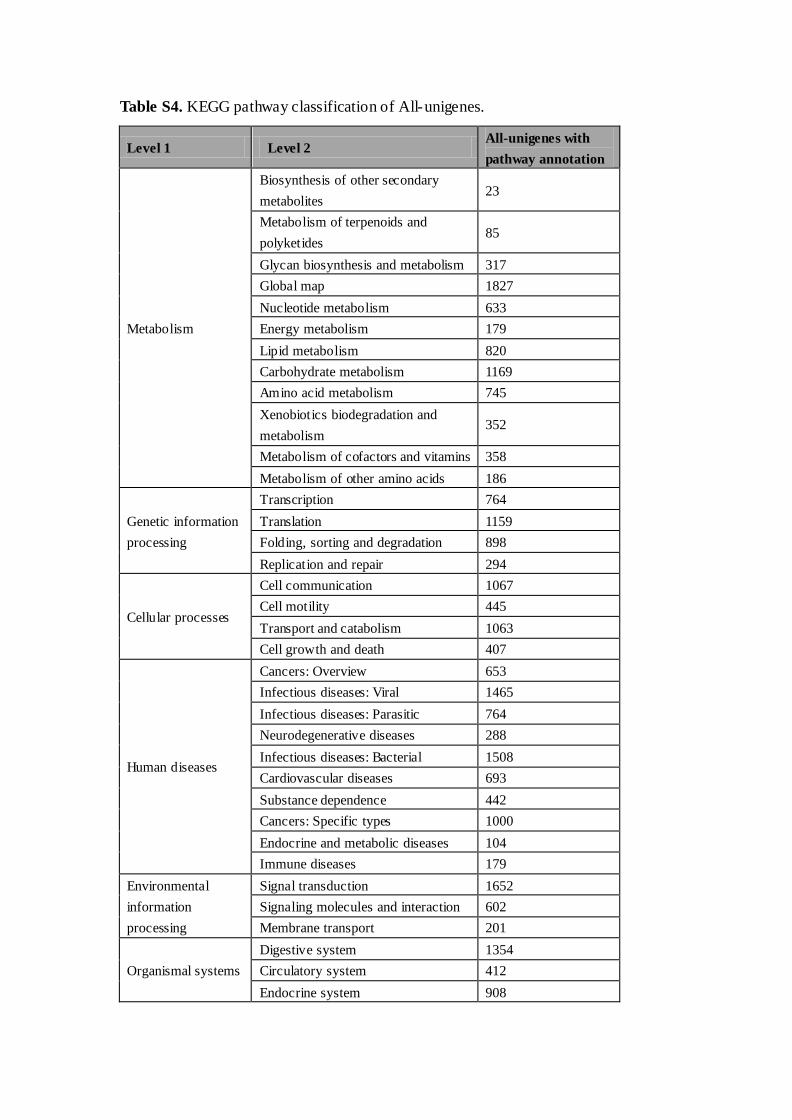
Table S4. KEGG pathway classification of All-unigenes.
Level 1 Level 2 All-unigenes with
pathway annotation
Metabolism
Biosynthesis of other secondary
metabolites 23
Metabolism of terpenoids and
polyketides 85
Glycan biosynthesis and metabolism 317
Global map 1827
Nucleotide metabolism 633
Energy metabolism 179
Lipid metabolism 820
Carbohydrate metabolism 1169
Amino acid metabolism 745
Xenobiotics biodegradation and
metabolism 352
Metabolism of cofactors and vitamins 358
Metabolism of other amino acids 186
Genetic information
processing
Transcription 764
Translation 1159
Folding, sorting and degradation 898
Replication and repair 294
Cellular processes
Cell communication 1067
Cell motility 445
Transport and catabolism 1063
Cell growth and death 407
Human diseases
Cancers: Overview 653
Infectious diseases: Viral 1465
Infectious diseases: Parasitic 764
Neurodegenerative diseases 288
Infectious diseases: Bacterial 1508
Cardiovascular diseases 693
Substance dependence 442
Cancers: Specific types 1000
Endocrine and metabolic diseases 104
Immune diseases 179
Environmental
information
processing
Signal transduction 1652
Signaling molecules and interaction 602
Membrane transport 201
Organismal systems
Digestive system 1354
Circulatory system 412
Endocrine system 908
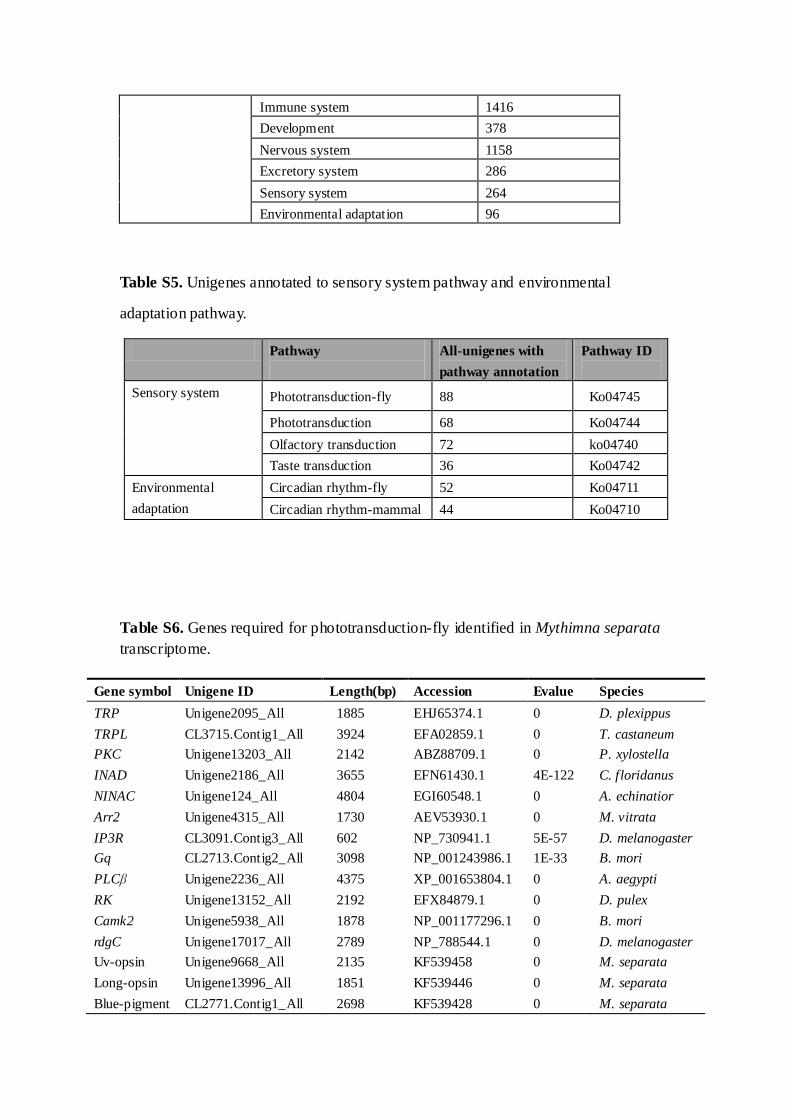
Immune system 1416
Development 378
Nervous system 1158
Excretory system 286
Sensory system 264
Environmental adaptation 96
Table S5. Unigenes annotated to sensory system pathway and environmental
adaptation pathway.
Pathway
All-unigenes with
pathway annotation
Pathway ID
Sensory system Phototransduction-fly 88 Ko04745
Phototransduction 68 Ko04744
Olfactory transduction 72 ko04740
Taste transduction 36 Ko04742
Environmental
adaptation
Circadian rhythm-fly 52 Ko04711
Circadian rhythm-mammal 44 Ko04710
Table S6. Genes required for phototransduction-fly identified in Mythimna separata
transcriptome.
Gene symbol Unigene ID Length(bp) Accession Evalue Species
TRP Unigene2095_All 1885 EHJ65374.1 0 D. plexippus
TRPL CL3715.Contig1_All 3924 EFA02859.1 0 T. castaneum
PKC Unigene13203_All 2142 ABZ88709.1 0 P. xylostella
INAD Unigene2186_All 3655 EFN61430.1 4E-122 C. floridanus
NINAC Unigene124_All 4804 EGI60548.1 0 A. echinatior
Arr2 Unigene4315_All 1730 AEV53930.1 0 M. vitrata
IP3R CL3091.Contig3_All 602 NP_730941.1 5E-57 D. melanogaster
Gq
PLCβ
CL2713.Contig2_All
Unigene2236_All
3098
4375
NP_001243986.1
XP_001653804.1
1E-33
0
B. mori
A. aegypti
RK Unigene13152_All 2192 EFX84879.1 0 D. pulex
Camk2 Unigene5938_All 1878 NP_001177296.1 0 B. mori
rdgC Unigene17017_All 2789 NP_788544.1 0 D. melanogaster
Uv-opsin Unigene9668_All 2135 KF539458 0 M. separata
Long-opsin Unigene13996_All 1851 KF539446 0 M. separata
Blue-pigment CL2771.Contig1_All 2698 KF539428 0 M. separata
TRP: transient receptor potential channel; TRPL: transient receptor potential channel pyrexia-like;
PKC: protein kinase C; INAD: inactivation-no-after-potential D protein; NINAC: inactivation nor
after potential protein C; Arr2: arrestin 2; IP3R: inositol 1,4,5-trisphosphate receptor; Gq: G
protein gamma subunit; PLCβ: phospholipase C beta; RK: G-protein-coupled receptor kinase;
rdgC: retinal degeneration B; Camk2: Ca2+/calmodulin-dependent protein kinase II; Uv-opsin:
Ultraviolet wavelength-sensitive opsin; Long-opsin: long-wavelength opsin; Blue-opsin:
blue-sensitive visual pigment.
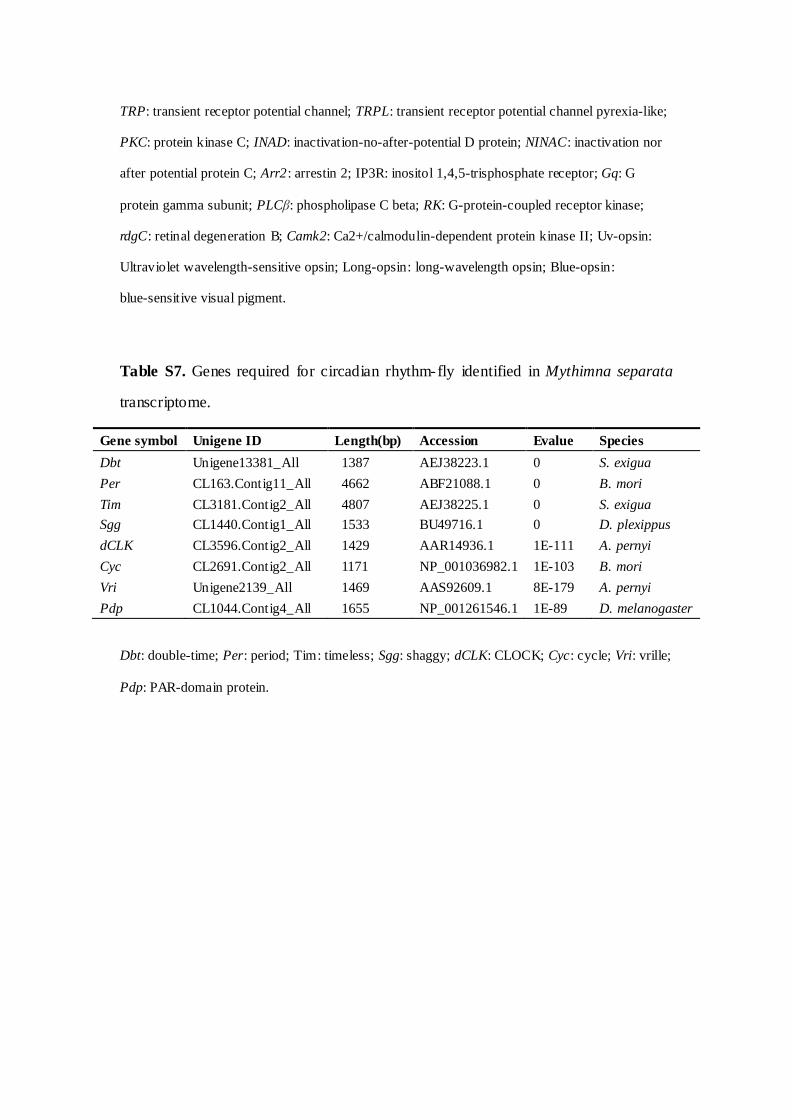
Table S7. Genes required for circadian rhythm-fly identified in Mythimna separata
transcriptome.
Gene symbol Unigene ID Length(bp) Accession Evalue Species
Dbt Unigene13381_All 1387 AEJ38223.1 0 S. exigua
Per CL163.Contig11_All 4662 ABF21088.1 0 B. mori
Tim CL3181.Contig2_All 4807 AEJ38225.1 0 S. exigua
Sgg CL1440.Contig1_All 1533 BU49716.1 0 D. plexippus
dCLK CL3596.Contig2_All 1429 AAR14936.1 1E-111 A. pernyi
Cyc CL2691.Contig2_All 1171 NP_001036982.1 1E-103 B. mori
Vri Unigene2139_All 1469 AAS92609.1 8E-179 A. pernyi
Pdp CL1044.Contig4_All 1655 NP_001261546.1 1E-89 D. melanogaster
Dbt: double-time; Per: period; Tim: timeless; Sgg: shaggy; dCLK: CLOCK; Cyc: cycle; Vri: vrille;
Pdp: PAR-domain protein.
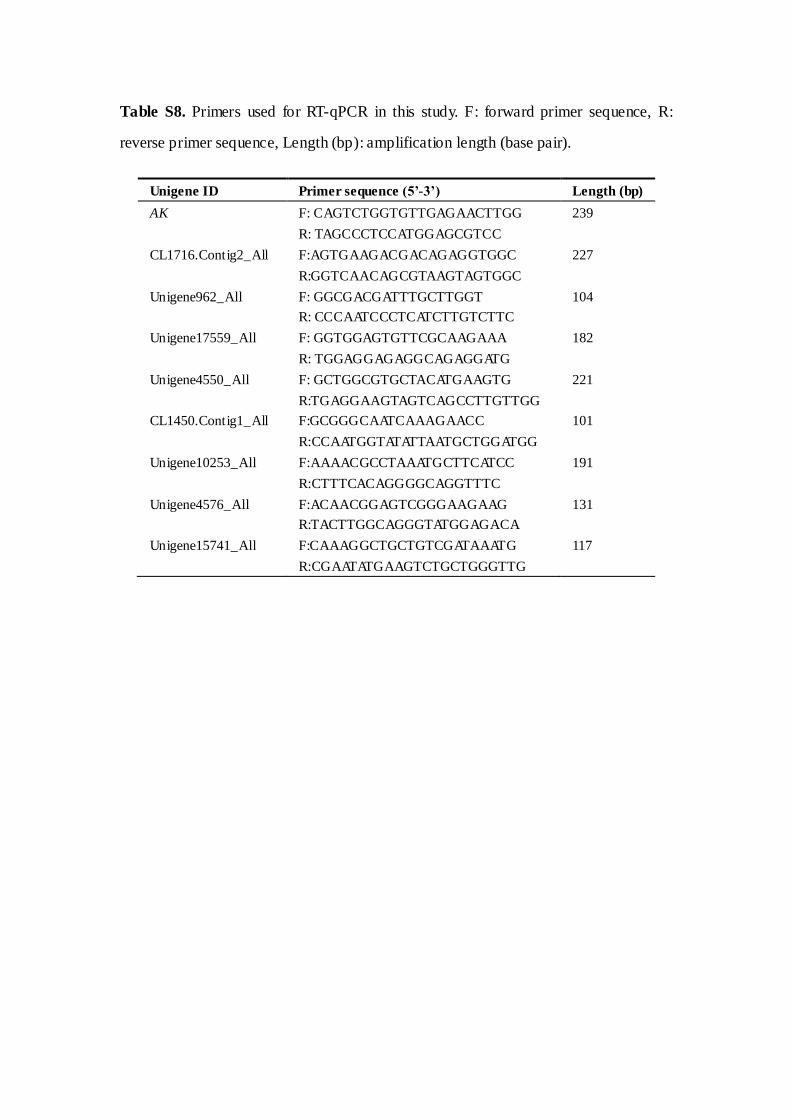
Table S8. Primers used for RT-qPCR in this study. F: forward primer sequence, R:
reverse primer sequence, Length (bp): amplification length (base pair).
Unigene ID Primer sequence (5’-3’) Length (bp)
AK
F: CAGTCTGGTGTTGAGAACTTGG
R: TAGCCCTCCATGGAGCGTCC
239
CL1716.Contig2_All
F:AGTGAAGACGACAGAGGTGGC
R:GGTCAACAGCGTAAGTAGTGGC
227
Unigene962_All
F: GGCGACGATTTGCTTGGT
R: CCCAATCCCTCATCTTGTCTTC
104
Unigene17559_All
F: GGTGGAGTGTTCGCAAGAAA
R: TGGAGGAGAGGCAGAGGATG
182
Unigene4550_All
F: GCTGGCGTGCTACATGAAGTG
R:TGAGGAAGTAGTCAGCCTTGTTGG
221
CL1450.Contig1_All
F:GCGGGCAATCAAAGAACC
R:CCAATGGTATATTAATGCTGGATGG
101
Unigene10253_All
F:AAAACGCCTAAATGCTTCATCC
R:CTTTCACAGGGGCAGGTTTC
191
Unigene4576_All
F:ACAACGGAGTCGGGAAGAAG
R:TACTTGGCAGGGTATGGAGACA
131
Unigene15741_All
F:CAAAGGCTGCTGTCGATAAATG
R:CGAATATGAAGTCTGCTGGGTTG
117
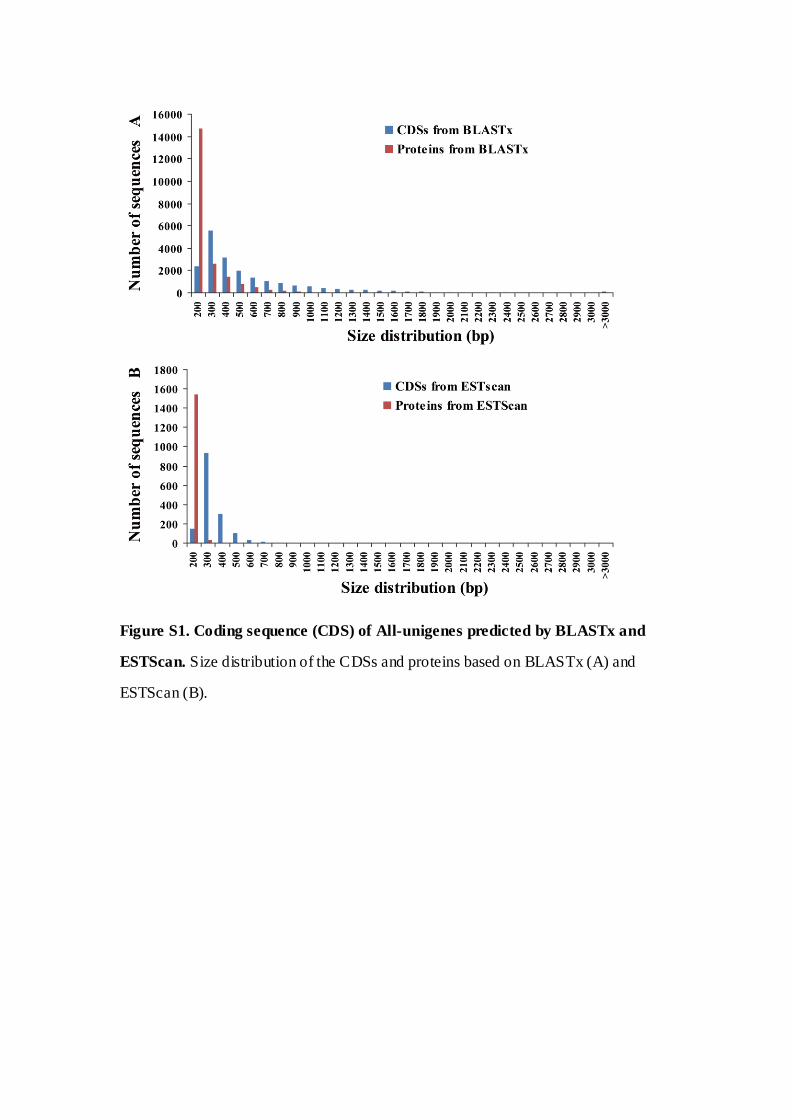
Figure S1. Coding sequence (CDS) of All-unigenes predicted by BLASTx and
ESTScan. Size distribution of the CDSs and proteins based on BLASTx (A) and
ESTScan (B).
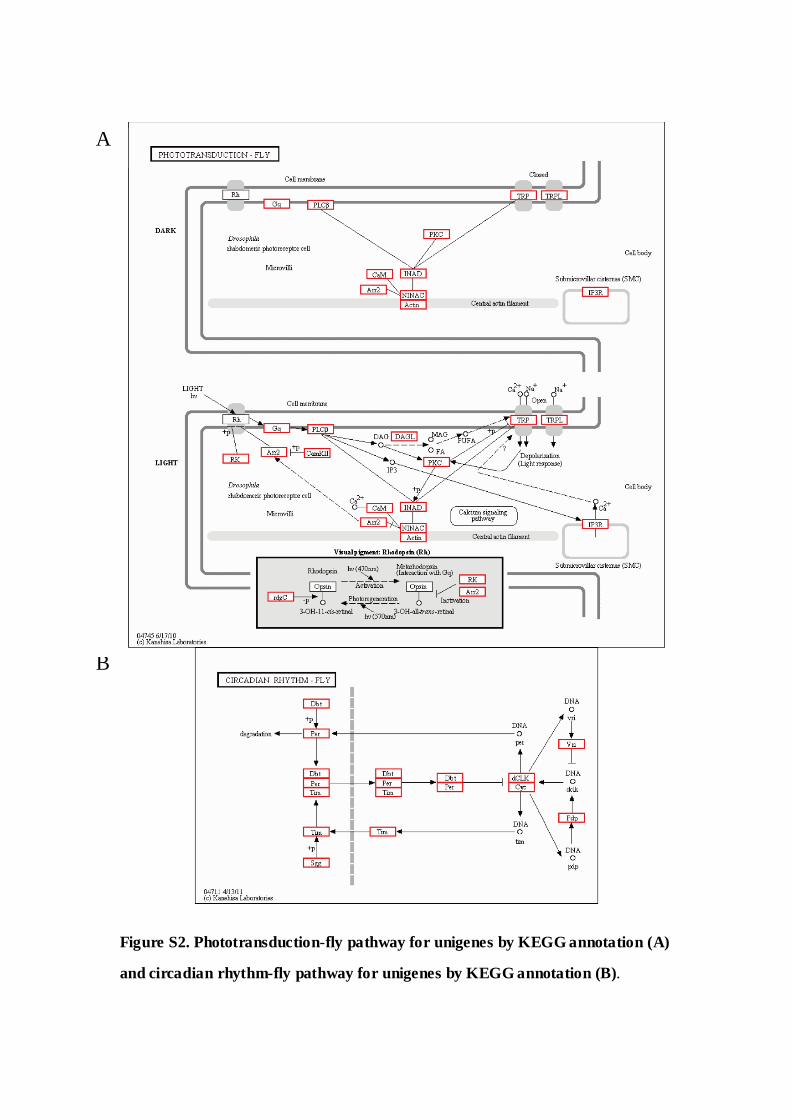
Figure S2. Phototransduction-fly pathway for unigenes by KEGG annotation (A)
and circadian rhythm-fly pathway for unigenes by KEGG annotation (B).
B
A
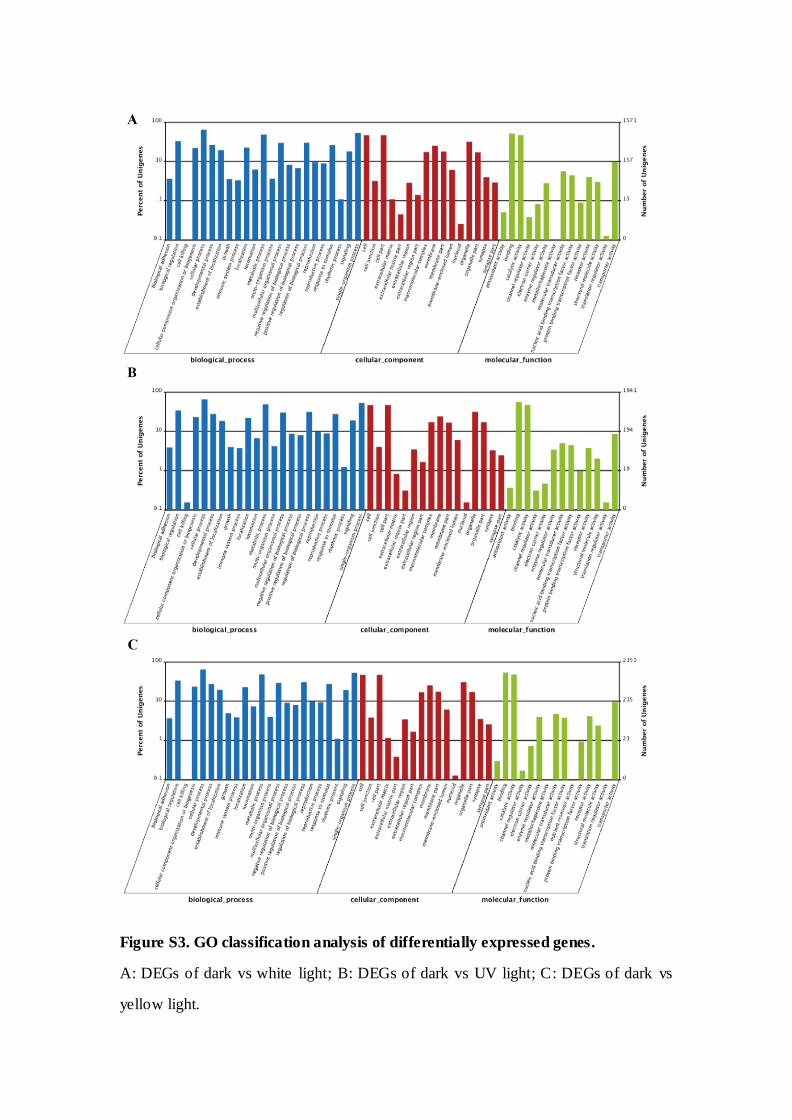
Figure S3. GO classification analysis of differentially expressed genes.
A: DEGs of dark vs white light; B: DEGs of dark vs UV light; C: DEGs of dark vs
yellow light.
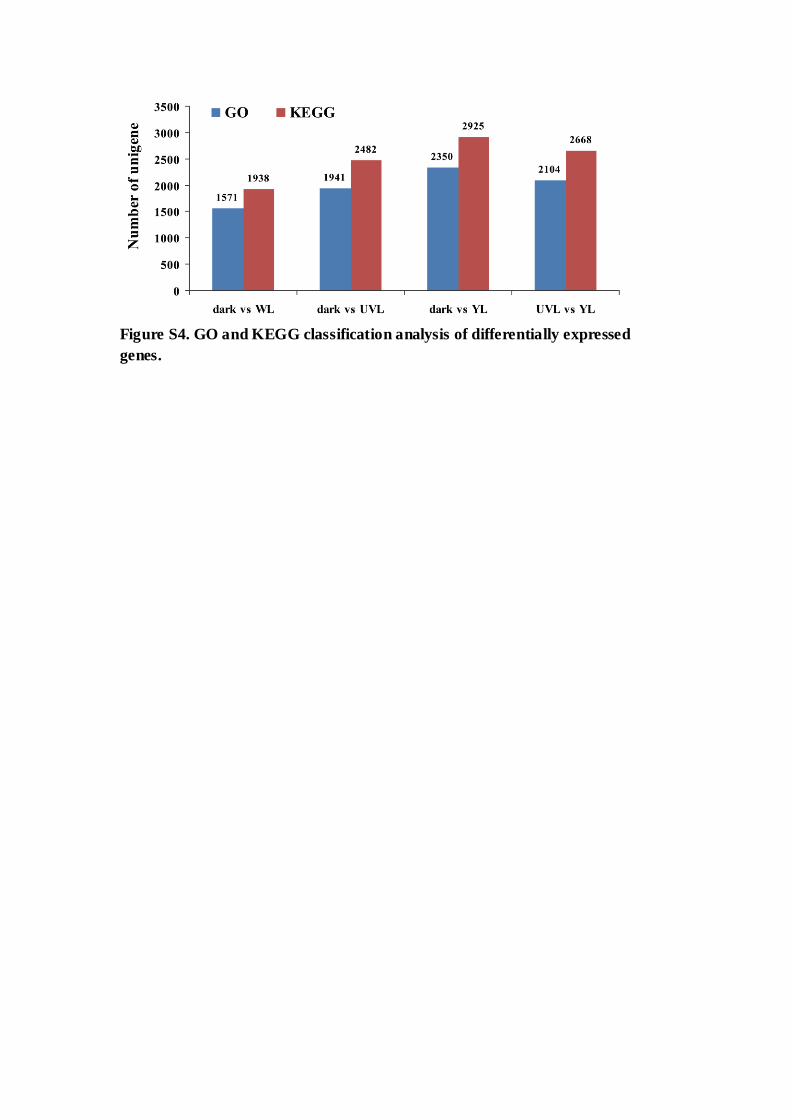
Figure S4. GO and KEGG classification analysis of differentially expressed
genes.