Transcriptome analysis and de novo annotation of the ...
13
©FUNPEC-RP www.funpecrp.com.br Genetics and Molecular Research 15 (2): gmr.15027999 Transcriptome analysis and de novo annotation of the critically endangered Amur sturgeon (Acipenser schrenckii ) X.J. Zhang 1,2,3 , H.Y. Jiang 1,2,3 , L.M. Li 1,2,3 , L.H. Yuan 1,2,3 and J.P. Chen 1,2,3 1 Guangdong Entomological Institute, Guangzhou, China 2 Guangdong Public Laboratory of Wild Animal Conservation and Utilization, Guangzhou, China 3 Guangdong Key Laboratory of Integrated Pest Management in Agriculture, Guangzhou, China Corresponding author: J.P. Chen E-mail: [email protected] Genet. Mol. Res. 15 (2): gmr.15027999 Received November 5, 2015 Accepted January 18, 2016 Published June 21, 2016 DOI http://dx.doi.org/10.4238/gmr.15027999 ABSTRACT. The aim of this study was to provide comprehensive insights into the genetic background of sturgeon by transcriptome study. We performed a de novo assembly of the Amur sturgeon Acipenser schrenckii transcriptome using Illumina Hiseq 2000 sequencing. A total of 148,817 non-redundant unigenes with base length of approximately 121,698,536 bp and ranges from 201 to 26,789 bp were obtained. All the unigenes were classified into 3368 distinct categories and 145,449 singletons by homologous transcript cluster analysis. In all, 46,865 (31.49%) unigenes showed homologous matches with Nr database and 32,214 (21.65%) unigenes were matched to Nt database. In total, 24,862 unigenes were categorized into significantly enriched 52 function groups by GO analysis, and 38,436 unigenes were classified into 25 groups by KOG prediction, as well as 128 enriched KEGG pathways were identified by 45,598 unigenes (P < 0.05). Subsequently, a total of 19,860 SSRs markers were identified with the abundant di-
Transcript of Transcriptome analysis and de novo annotation of the ...

©FUNPEC-RP www.funpecrp.com.brGenetics and Molecular Research 15 (2): gmr.15027999
Transcriptome analysis and de novo annotation of the critically endangered Amur sturgeon (Acipenser schrenckii)
X.J. Zhang1,2,3, H.Y. Jiang1,2,3, L.M. Li1,2,3, L.H. Yuan1,2,3 and J.P. Chen1,2,3
1Guangdong Entomological Institute, Guangzhou, China2Guangdong Public Laboratory of Wild Animal Conservation and Utilization, Guangzhou, China3Guangdong Key Laboratory of Integrated Pest Management in Agriculture, Guangzhou, China
Corresponding author: J.P. ChenE-mail: [email protected]
Genet. Mol. Res. 15 (2): gmr.15027999Received November 5, 2015Accepted January 18, 2016Published June 21, 2016DOI http://dx.doi.org/10.4238/gmr.15027999
ABSTRACT. The aim of this study was to provide comprehensive insights into the genetic background of sturgeon by transcriptome study. We performed a de novo assembly of the Amur sturgeon Acipenser schrenckii transcriptome using Illumina Hiseq 2000 sequencing. A total of 148,817 non-redundant unigenes with base length of approximately 121,698,536 bp and ranges from 201 to 26,789 bp were obtained. All the unigenes were classified into 3368 distinct categories and 145,449 singletons by homologous transcript cluster analysis. In all, 46,865 (31.49%) unigenes showed homologous matches with Nr database and 32,214 (21.65%) unigenes were matched to Nt database. In total, 24,862 unigenes were categorized into significantly enriched 52 function groups by GO analysis, and 38,436 unigenes were classified into 25 groups by KOG prediction, as well as 128 enriched KEGG pathways were identified by 45,598 unigenes (P < 0.05). Subsequently, a total of 19,860 SSRs markers were identified with the abundant di-

2X.J. Zhang et al.
©FUNPEC-RP www.funpecrp.com.brGenetics and Molecular Research 15 (2): gmr.15027999
nucleotide type (10,658; 53.67%) and the most AT/TA motif repeats (2689; 13.54%). A total of 1341 conserved lncRNAs were identified by a customized pipeline. Our study provides new sequence and function information for A. schrenckii, which will be the basis for further genetic studies on sturgeon species. The huge number of potential SSRs and putatively conserved lncRNAs isolated by the transcriptome also shed light on research in many fields, including the evolution, conservation management, and biological processes in sturgeon.
Key words: Amur sturgeon; Transcriptome sequencing; Simple sequence repeat; Long non coding RNA; Function annotation
INTRODUCTION
Sturgeon are polyploid chondrostean fishes originating in the Devonian period and belong to the order Acipenseriformes, which contains 27 species divided into two families, including the Acipenseridae (sturgeon, 25 species) and the Polydontidae (paddlefish, 2 species). Sturgeon are praised as precious “living fossils” and thus play a key role in phylogenetic studies of vertebrate evolutionary history (Bemis et al., 1997). In a March 2015 press release, the International Union for Conversation of Nature and Natural Resource (IUCN) Red List identified sturgeon as one of the most endangered groups of animals with 85% of species being on the verge of extinction (http://www.iucnredlist.org/search). Meanwhile, sturgeons have globally been considered as excellent candidates for aquaculture due to their high commercial value from production of meat and caviar. Therefore, conflicting issues between the severe decline in natural populations and the huge profits of commercial sturgeon farming are the main driving force promoting the development of sturgeon aquaculture. To date, more than 17 sturgeon species have been farmed and progress in artificial propagation technology has accelerated the development of sturgeon aquaculture.
Sturgeon conservation is crucial as the species plays an important role in maintaining biological diversity and ecological stability. So far, the genomic information of all sturgeon species remains incomplete. As a key first step, comprehensive understanding of genetic backgrounds of sturgeon species is required. With developments in molecular techniques, studies on genetic diversity, population structure, and genetic variation, as well as marker assisted selective breeding based on simple sequence repeat (SSR) and single nucleotide polymorphism techniques (Hu et al., 2010; Senturk Akfirat and Uncuoglu, 2013; Zhang et al., 2013) have been successfully performed. However, the available genetic information is insufficient for unannotated regions; therefore, large numbers of novel molecular markers for the sturgeon database need to be updated, which may provide more suitable messages for the identification of selection breeding in sturgeon.
Transcriptome study not only provides the genetic background for gene structure, function annotation, and discovery of novel genes, but also determines when genes are expressed and how they are regulated (Jin et al., 2013). Compared with Tiling microarray and cDNA or EST sequencing, next-generation sequencing technologies developed by Illumina/Solexa can generate over one billion bases of high-quality sequences per run at less than 1% of the cost of capillary-based methods, and is expected to dominate in future analysis of

3Transcriptome of Amur sturgeon
©FUNPEC-RP www.funpecrp.com.brGenetics and Molecular Research 15 (2): gmr.15027999
eukaryotic transcriptomes (Morozova and Marra, 2008; Ozsolak and Milos, 2011). Currently, transcriptome analysis is being widely applied to elucidate genetic markers of immune, reproduction-related, or economically significant traits and for genetic diversity management in cultured fish species (Richards et al., 2013; Vidotto et al., 2013; Che et al., 2014).
In the present study, we used Illumina Hiseq 2000 sequencing to assemble and annotate a transcriptome dataset from the critically endangered Amur sturgeon (Acipenser schrenckii), which is largely found in the Amur River basin and now is an important representative species in Chinese sturgeon aquaculture.
MATERIAL AND METHODS
Preparation of samples, construction of cDNA library and sequencing
Five major tissue types (liver, spleen, muscle, heart, and brain) were collected from a 5-month-old Amur sturgeon from the Engineering and Technology Center of Sturgeon Breeding and Cultivation, Chinese Academy of Fishery Science (Beijing, China). All the experimental animal procedures were approved by the Ethics Committee of Animal Experiments of Guangdong Entomological Institute. The sturgeon individual was anesthetized with eugenol and painlessly killed using practiced methods (Yuan et al., 2014). The total RNA were separately extracted from five tissue samples with RNAiso plus (TaKaRa, Shiga, Japan) according to the manufacturer’s instructions. Total RNA degradation and contamination were monitored on 1% agarose gels. Total RNA concentration was measured using Qubit® RNA Assay Kit in Qubit® 2.0 Flurometer (Life Technologies, CA, USA). Total RNA integrity number (RIN) was assessed using the RNA Nano 6000 Assay Kit of the Bioanalyzer 2100 system (Agilent Technologies, CA, USA) and the criteria for the RNA samples were 2100 RIN > 8.0. Qualified RNAs were used for further construction of cDNA library.
A 3 µg RNA pooled sample with equal volumes of each of the above five tissues was used as input material for the RNA sample preparations. Sequencing libraries were constructed using Illumina TruSeqTM RNA Sample Preparation Kit (Illumina, San Diego, CA, USA) following manufacturer’s instructions. In order to select cDNA fragments preferentially of 200 bp in length, the library fragments were purified with AMPure XP system (Beckman Coulter, Beverly, MA, USA). DNA fragments with ligated adaptor molecules on both ends were selectively enriched using Illumina PCR Primer Cocktail in a 10-cycle PCR. Products were purified (AMPure XP system) and quantified using the Agilent high-sensitivity DNA assay on the Agilent Bioanalyzer 2100 system. The clustering of the index-coded samples was performed on a cBot Cluster Generation System using TruSeq PE Cluster Kit v3-cBot-HS (Illumina) according to the manufacturer’s instructions. Following cluster generation, the library preparations were sequenced on an Illumina Hiseq 2000 platform and 100-bp paired-end reads were generated. All cDNA data series were submitted to NCBI Sequence Read Archive (SRA) database (accession No. SRR1131121).
Cleaning and assembly
First, raw data in FASTQ format were processed by Perl script pipelines. After removing reads containing adapter, those containing ploy-N and low-quality reads from raw
4X.J. Zhang et al.
©FUNPEC-RP www.funpecrp.com.brGenetics and Molecular Research 15 (2): gmr.15027999
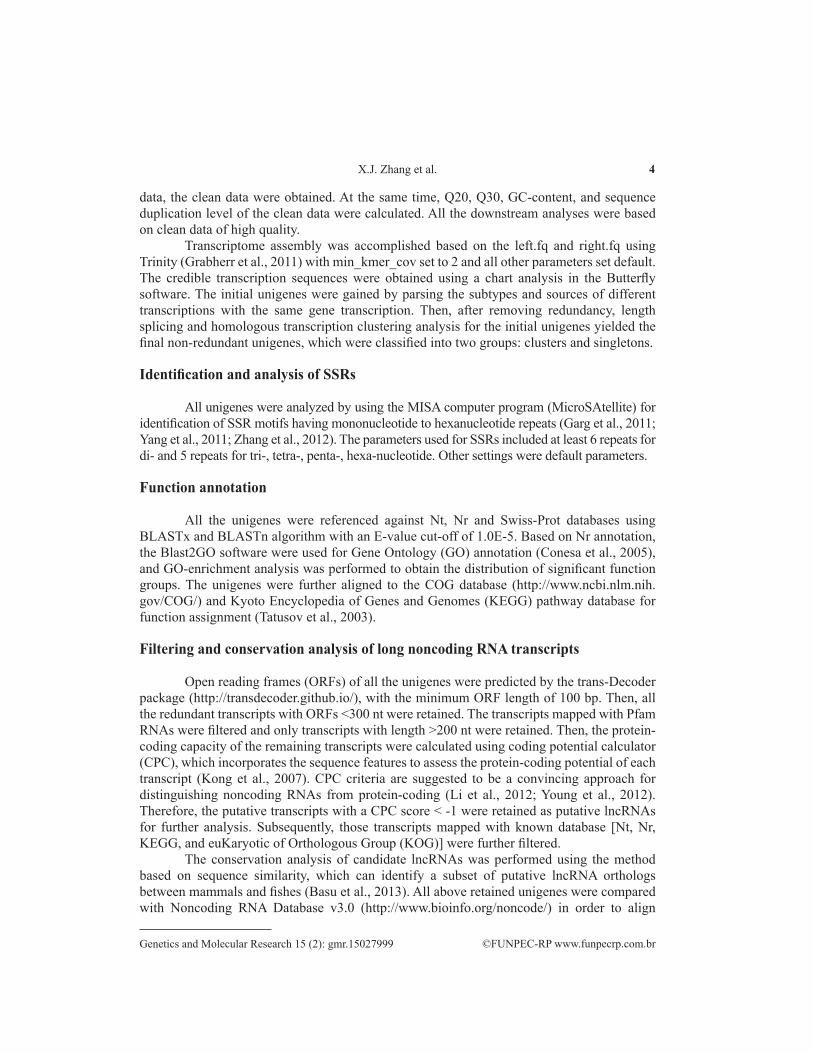
data, the clean data were obtained. At the same time, Q20, Q30, GC-content, and sequence duplication level of the clean data were calculated. All the downstream analyses were based on clean data of high quality.
Transcriptome assembly was accomplished based on the left.fq and right.fq using Trinity (Grabherr et al., 2011) with min_kmer_cov set to 2 and all other parameters set default. The credible transcription sequences were obtained using a chart analysis in the Butterfly software. The initial unigenes were gained by parsing the subtypes and sources of different transcriptions with the same gene transcription. Then, after removing redundancy, length splicing and homologous transcription clustering analysis for the initial unigenes yielded the final non-redundant unigenes, which were classified into two groups: clusters and singletons.
Identification and analysis of SSRs
All unigenes were analyzed by using the MISA computer program (MicroSAtellite) for identification of SSR motifs having mononucleotide to hexanucleotide repeats (Garg et al., 2011; Yang et al., 2011; Zhang et al., 2012). The parameters used for SSRs included at least 6 repeats for di- and 5 repeats for tri-, tetra-, penta-, hexa-nucleotide. Other settings were default parameters.
Function annotation
All the unigenes were referenced against Nt, Nr and Swiss-Prot databases using BLASTx and BLASTn algorithm with an E-value cut-off of 1.0E-5. Based on Nr annotation, the Blast2GO software were used for Gene Ontology (GO) annotation (Conesa et al., 2005), and GO-enrichment analysis was performed to obtain the distribution of significant function groups. The unigenes were further aligned to the COG database (http://www.ncbi.nlm.nih.gov/COG/) and Kyoto Encyclopedia of Genes and Genomes (KEGG) pathway database for function assignment (Tatusov et al., 2003).
Filtering and conservation analysis of long noncoding RNA transcripts
Open reading frames (ORFs) of all the unigenes were predicted by the trans-Decoder package (http://transdecoder.github.io/), with the minimum ORF length of 100 bp. Then, all the redundant transcripts with ORFs <300 nt were retained. The transcripts mapped with Pfam RNAs were filtered and only transcripts with length >200 nt were retained. Then, the protein-coding capacity of the remaining transcripts were calculated using coding potential calculator (CPC), which incorporates the sequence features to assess the protein-coding potential of each transcript (Kong et al., 2007). CPC criteria are suggested to be a convincing approach for distinguishing noncoding RNAs from protein-coding (Li et al., 2012; Young et al., 2012). Therefore, the putative transcripts with a CPC score < -1 were retained as putative lncRNAs for further analysis. Subsequently, those transcripts mapped with known database [Nt, Nr, KEGG, and euKaryotic of Orthologous Group (KOG)] were further filtered.
The conservation analysis of candidate lncRNAs was performed using the method based on sequence similarity, which can identify a subset of putative lncRNA orthologs between mammals and fishes (Basu et al., 2013). All above retained unigenes were compared with Noncoding RNA Database v3.0 (http://www.bioinfo.org/noncode/) in order to align

5Transcriptome of Amur sturgeon
©FUNPEC-RP www.funpecrp.com.brGenetics and Molecular Research 15 (2): gmr.15027999
sequence similarity with known lncRNAs in other vertebrates (BLASTn E < 1.0E-5), so putatively conserved lncRNAs from Amur sturgeon were identified.
RESULTS
Cleaning and assembly
Deep sequencing by Illumina Hiseq 2000 run generated a total of 58,940,154 and 200-bp paired-end raw reads from A. schrenckii. After eliminating adapter sequences and filtering out the low-quality reads (those with fewer than 25 bp per read) and containing N content over 10% reads, the Illumina Hiseq 2000 sequencing yielded a total of 50,142,328 high-quality reads, which comprised 85.07% of the raw data. The average GC content calculated for whole dataset was 49.56% and the cleaned reads attained Q20 was 95.56%. The main features of the reads of the Illumina Hiseq 2000 sequencing preprocessing step are summarized in Table 1. Therefore, the clean data were assembled de novo using the Trinity program resulting in a total of 148,817 unigenes with base length of 121,698,536 bp, ranging from 201 to 26,789 bp. Among these unigenes, 76,862 (51.67%) were less than 400 bp in length, 56,686 (38.09%) were in the length range of 401-2000 bp, and 15,353 (10.32%) were longer than 2001 bp (Figure 1). The GC content of total unigenes had an average of 44.1%. All non-redundant unigenes were divided into two clade categories, comprised of 3368 distinct clusters and 145,449 singletons. Detailed information on the A. schrenckii transcriptome squencing reads assembled by the Trinity program are summarized in Table 2.
Table 1. Statistics of sequencing reads preprocessing for Acipenser schrenckii library.
Index Results Number of raw reads 58,940,154 Number of cleaned reads 50,142,328 Percentage of cleaned reads 85.07% Average GC content 49.56% Percentage of cleaned reads attainted Q20 95.56%
Figure 1. Length distribution of the assembled unigenes for Acipenser schrenckii.
6X.J. Zhang et al.
©FUNPEC-RP www.funpecrp.com.brGenetics and Molecular Research 15 (2): gmr.15027999
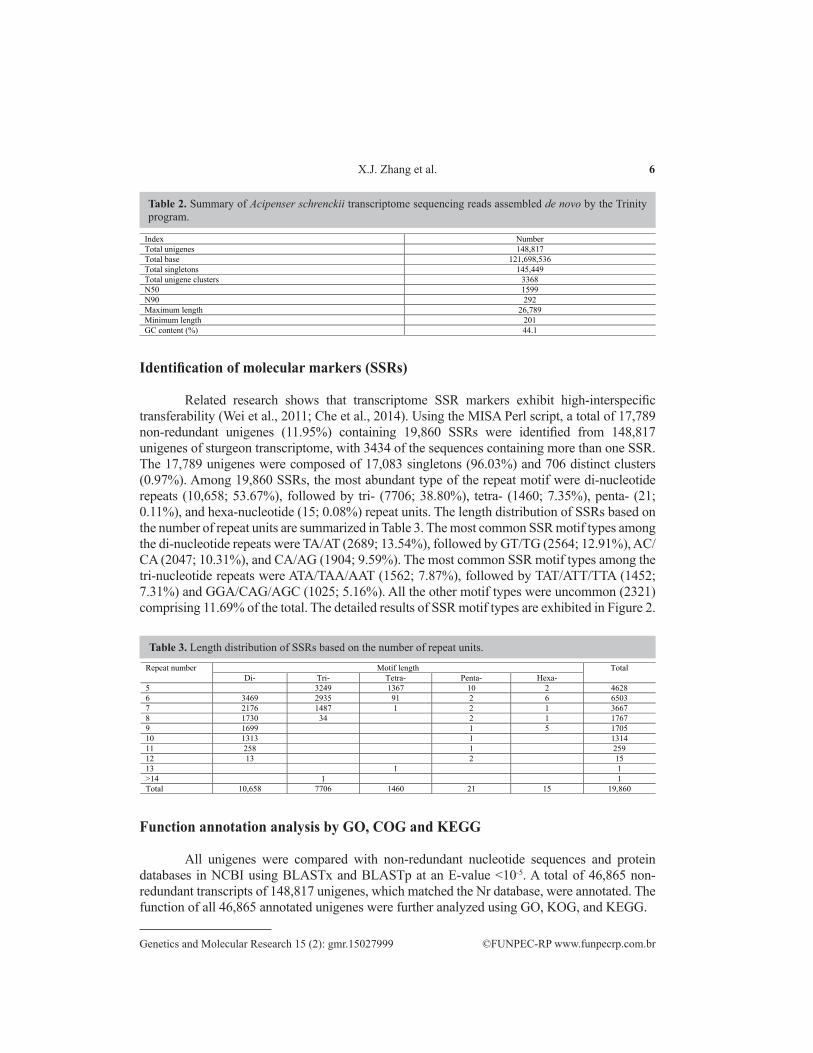
Identification of molecular markers (SSRs)
Related research shows that transcriptome SSR markers exhibit high-interspecific transferability (Wei et al., 2011; Che et al., 2014). Using the MISA Perl script, a total of 17,789 non-redundant unigenes (11.95%) containing 19,860 SSRs were identified from 148,817 unigenes of sturgeon transcriptome, with 3434 of the sequences containing more than one SSR. The 17,789 unigenes were composed of 17,083 singletons (96.03%) and 706 distinct clusters (0.97%). Among 19,860 SSRs, the most abundant type of the repeat motif were di-nucleotide repeats (10,658; 53.67%), followed by tri- (7706; 38.80%), tetra- (1460; 7.35%), penta- (21; 0.11%), and hexa-nucleotide (15; 0.08%) repeat units. The length distribution of SSRs based on the number of repeat units are summarized in Table 3. The most common SSR motif types among the di-nucleotide repeats were TA/AT (2689; 13.54%), followed by GT/TG (2564; 12.91%), AC/CA (2047; 10.31%), and CA/AG (1904; 9.59%). The most common SSR motif types among the tri-nucleotide repeats were ATA/TAA/AAT (1562; 7.87%), followed by TAT/ATT/TTA (1452; 7.31%) and GGA/CAG/AGC (1025; 5.16%). All the other motif types were uncommon (2321) comprising 11.69% of the total. The detailed results of SSR motif types are exhibited in Figure 2.
Table 2. Summary of Acipenser schrenckii transcriptome sequencing reads assembled de novo by the Trinity program.
Index Number Total unigenes 148,817 Total base 121,698,536 Total singletons 145,449 Total unigene clusters 3368 N50 1599 N90 292 Maximum length 26,789 Minimum length 201 GC content (%) 44.1
Table 3. Length distribution of SSRs based on the number of repeat units.
Repeat number Motif length Total Di- Tri- Tetra- Penta- Hexa-
5 3249 1367 10 2 4628 6 3469 2935 91 2 6 6503 7 2176 1487 1 2 1 3667 8 1730 34 2 1 1767 9 1699 1 5 1705 10 1313 1 1314 11 258 1 259 12 13 2 15 13 1 1 >14 1 1 Total 10,658 7706 1460 21 15 19,860
Function annotation analysis by GO, COG and KEGG
All unigenes were compared with non-redundant nucleotide sequences and protein databases in NCBI using BLASTx and BLASTp at an E-value <10-5. A total of 46,865 non-redundant transcripts of 148,817 unigenes, which matched the Nr database, were annotated. The function of all 46,865 annotated unigenes were further analyzed using GO, KOG, and KEGG.

7Transcriptome of Amur sturgeon
©FUNPEC-RP www.funpecrp.com.brGenetics and Molecular Research 15 (2): gmr.15027999
Figure 2. Type distribution of SSRs motif for Acipenser schrenckii.
The GO system provides gene function classification and research background, and divides GO terms into three categories, including biological process, cellular component, and molecular function. In the present study, a total of 24,862 unigenes were assigned to GO terms based on BLAST matches to proteins with known functions. Among the non-redundants, 20,631 sequences were assigned to 7899 terms in biological process, 20,195 sequences to 1060 terms in cellular component, and 20,338 sequences to 2833 terms in molecular function. Many unigenes were assigned to more than one GO term. For example, in the biological process category, the number of GO terms ranged from 1 to 132 for each unigene, from 1 to 26 in the cellular component category, and from 1 to 30 in molecular function. The distribution relationships of all annotated unigenes were analyzed to determine enriched GO terms by calculating super-geometry in GO categories. The results showed that 52 function groups were significantly enriched, including 20 molecular functions, 12 biological process, and 20 cellular component groups (Figure 3).
Figure 3. Top enriched GO categories annotated for assembled unigenes in Acipenser schrenckii. A total of 52 GO terms were displayed, including 20 molecular function groups, 12 biological process, and 20 cellular component.

8X.J. Zhang et al.
©FUNPEC-RP www.funpecrp.com.brGenetics and Molecular Research 15 (2): gmr.15027999
In addition, we compared all unigenes with the KOG eukaryote database and found a total of 38,436 unigenes mapped into 49,363 known proteins in the database. General knowledge of all the mapped unigenes from analyzing function distribution characteristics were understood in A. schrenckii. The results showed that these mapped unigenes were classified into 25 functional categories based on their predicted functions. Among the 25 functional categories, a cluster for general function prediction only represents the largest group, followed by signal transduction mechanisms and cytoskeleton group. The clusters for nuclear structure, cell motility, and coenzyme transport and metabolism represent the smaller groups (Figure 4). Similar to the data in the GO categories, the total number of KOG sequences was 464,799 (>38,436), because each of the unigenes were involved in more than one of the KOG functional categories.
To better understand complex networks in regulation function, an enrichment analysis of KEGG pathway was performed. A total of 45,598 unigenes were matched to the KEGG pathway database and mapped onto 289 pathway groups. Among these, the 128 pathway groups from a total of 7737 unigenes were significantly enriched (P < 0.05) and were further summarized into six major classes: Human Diseases (2363; 30.54%), Organismal System (2248; 29.06%), Environmental Information Processing (1185; 15.32%), Cellular Processes (1050; 13.57%), Genetic Information Processing (712; 9.20%), and Metabolism (179; 2.31%). Detailed information on enriched KEGG pathway are given in Figure 5.
Figure 4. KOG function classification of assembled unigenes.
Identification of lncRNAs
Recent reports show that a significant proportion of noncoding RNAs could be revealed from transcriptomic data (Carninci et al., 2005; Katayama et al., 2005). lncRNAs as a key group of noncoding RNAs have gained wide attention. In the present study, we obtained 82,129 non-redundant unigenes as putative lncRNAs from sturgeon transcriptome through use of customized pipelines (Figure 6). Although lncRNA sequence tends to maintain the consensus secondary structure through compensatory base mutations, a total of 1341 lncRNAs can still be discovered by sequence similarity comparison in A. schrenckii conserved with other vertebrates, including 391 human ortholog and 943 mouse ortholog. As expected, the

9Transcriptome of Amur sturgeon
©FUNPEC-RP www.funpecrp.com.brGenetics and Molecular Research 15 (2): gmr.15027999
conservation of these lncRNAs was substantially lower, only 1.63%. Based on the analysis of the genomic location of conserved regions in the model organism, conserved lncRNA in sturgeon were classified into three categories: 72 lncRNAs, 283 mRNA like, and 986 other types. Detailed category information is summarized in Table 4.
Figure 5. Classification exhibition with pie chart by KEGG pathway-enrichment analysis.
Figure 6. Customed pipelines for the identification of sturgeon lncRNAs.
Table 4. Detailed information on putative lncRNAs conservation.
Noncoding RNA Number (%) Unigene type Number Organism Number lncRNA type Number Conserved lncRNAs 1341 (1.63%) Clusters 28 Homo sapiens 381 lincRNAs 72 mRNA like 283 Others 27 (0.03%) Singletons 1313 Mus musculus 943 Others 986

10X.J. Zhang et al.
©FUNPEC-RP www.funpecrp.com.brGenetics and Molecular Research 15 (2): gmr.15027999
DISCUSSION
High throughput transcriptome sequencing (RNAseq) has been widely applied in numerous areas of investigation, such as alternative splice variants, gene expression profiles, noncoding RNAs, and novel transcript identification (Huang and Marth, 2008; Morozova et al., 2009). Transcriptome analysis also provides an invaluable resource for non-model species, which are scarce in genomic information, such as Chinese salamander (Che et al., 2014) and Oriental river prawn (Jin et al., 2013). In the present study, we provide the transcriptome dataset from the critically endangered Amur sturgeon (A. schrenckii). In total, 148,817 non-redundant unigene sequences with the mean length of 1599 bp were assembled. Furthermore, all the unigenes were annotated with various known protein databases, and used to identify the SSRs and putative lncRNAs. The results should be meaningful for further investigation in many fields, including the evolution, conservation managements, and biological processes of sturgeon.
Among different sturgeon species chromosome numbers are variable and different degrees of ploidy were caused by genome duplication events (Ludwig et al., 2001). To date, genomic information of sturgeon species remains unknown, which is a negative factor for further investigation in numerous biological processes. Recently, related studies on transcriptome analysis in other sturgeon species have been conducted. For example, earlier studies on A. fulvescens (Hale et al., 2009) and A. naccarii (Vidotto et al., 2013) using Roche’s 454 platform and latest studies on A. sinensis (Yue et al., 2015) using the Illumina platform. In the sequencing of the three sturgeon species, gonad tissues (ovary and testis) were employed for transcriptome analysis, with brain tissues included in A. naccarii. The 86,027, 55,282, and 112,504 transcripts were assembled from A. sinensis, A. naccarii, and A. fulvescens, respectively. To acquire general genetic information from A. schrenckii, we used five major tissue types (brain, heart, liver, spleen, and muscle) in a pooled input sample used to perform transcriptome analysis by the Illumina Hiseq 2000 platform. The number of assembled transcripts from A. schrenckii was markedly higher than that of the other sturgeon species.
We generated a systematic annotation for all the unigenes de novo assembled transcriptome analysis from A. schrenckii using three authoritative function databases (GO, COG, and KEGG pathway). GO analysis indicated the 52 functional groups were significantly enriched (Figure 3). Comparison of enriched functional groups in A. schrenckii with those in A. fulvescens (Hale et al., 2009) revealed common GO terms, including 7 terms in molecular function, 2 in biological process and 6 in cellular component. Transcriptome data also shared similar characteristics in COG classification between A. schrenckii and A. sinensis, which showed that the unigenes involved in general function prediction only groups that were most abundant, while the unigenes participating in cell motility and nuclear structure were smaller groups. The KEGG pathway can provide a better understanding of complex networks in regulation function. In the present study, we identified 6 function categories as significant enrichment from all the 128 pathways (Figure 4). The other unmatched unigenes may represent novel genes whose functions have not yet been identified, which may play important roles in the growth and development of Amur sturgeon. However, further studies are required to elucidate these aspects. Collectively, the similarity and difference in functional annotation composition from the four sturgeon species could enrich and broaden variable genetic resources in sturgeon.
Another point of interest from transcriptome analysis is to identify noncoding RNAs. lncRNAs were first reported to have larger numbers than mammalian transcriptome, including

11Transcriptome of Amur sturgeon
©FUNPEC-RP www.funpecrp.com.brGenetics and Molecular Research 15 (2): gmr.15027999
human and mouse (Okazaki et al., 2002; Ota et al., 2004). Then, 1133 lncRNAs were systematically identified from zebrafish species (Pauli et al., 2012). Although they are generally lower in frequency in sequence conservation, these specific lncRNAs strongly suggest similar function conservation among different invertebrate species. For example, four evolutionary constrained mouse lncRNAs were shown to be conserved in sequence and expression between mouse, opossum, and chicken (Chodroff et al., 2010). Forty-three putative lncRNA sequences from chicken ESTs were found to share sequence homology with human, rat, and mouse transcripts (Hubbard et al., 2005). Twenty-nine detected lncRNAs in zebrafish showed high sequence and function conservation with other mammalian during embryonic development (Ulitsky et al., 2011). In this study, we also detected 1341 putatively conserved lncRNAs from A. schrenckii transcriptome based on sequence similarity aligned analysis, which showed that there was more than an 86.57% sequence fragment identity level with lncRNAs in the NONCODE database (Table 4). The sequence-conserved lncRNAs with other vertebrate species were only 1.63% of the total, which is much lower than that shown in related analysis (Basu et al., 2013). lncRNAs identified from sturgeon can provide a genetic resource to further investigate the mechanisms of biological processes. A total of 12,151 SSRs were identified from A. sinensis, in which 65.39% were a mono-nucleotide motif, which might be caused by sequencing. Therefore, only 4205 (34.61%) SSRs with di-, tri-, tetra-, and penta-motifs would be suitable for polymorphic microsatellite locus development (Yue et al., 2015). In the present study, we acquired much larger numbers of SSRs from A. schrenckii transcriptome than those of A. sinensis. The di-nucleotide repeat motif was the largest group in all the types, which accounted for 53.67% of 19,860 SSRs (Table 3). The dataset will contribute to the development of microsatellite markers for A. schrenckii to aid effective conservation of this critically endangered species.
Conflicts of interest
The authors declare no conflict of interest.
ACKNOWLEDGMENTS
Research supported by the Natural Science Fund of Guangdong Province (#2015A030313761), the Outstanding Youth Science and Technology Talent Fund of Guangdong Academy of Sciences (#rcjj201402), and the Funds for Environment Construction & Capacity Building of GDAS’ Research Platform (#xm2015081). We thank Mr. Wenhua Wu for helping with sturgeon sampling.
REFERENCES
Basu S, Müller F and Sanges R (2013). Examples of sequence conservation analyses capture a subset of mouse long non-coding RNAs sharing homology with fish conserved genomic elements. BMC Bioinformatics 14 (Suppl 7): S14.
Bemis WE, Findeis EK and Grande L (1997). An overview of Acipenseriformes. In Sturgeon Biodiversity and Conservation, 25-71.
Carninci P, Kasukawa T, Katayama S, Gough J, et al.; FANTOM Consortium; RIKEN Genome Exploration Research Group and Genome Science Group (Genome Network Project Core Group) (2005). The transcriptional landscape of the mammalian genome. Science 309: 1559-1563. http://dx.doi.org/10.1126/science.1112014

12X.J. Zhang et al.
©FUNPEC-RP www.funpecrp.com.brGenetics and Molecular Research 15 (2): gmr.15027999
Che R, Sun Y, Wang R and Xu T (2014). Transcriptomic analysis of endangered Chinese salamander: identification of immune, sex and reproduction-related genes and genetic markers. PLoS One 9: e87940. http://dx.doi.org/10.1371/journal.pone.0087940
Chodroff RA, Goodstadt L, Sirey TM, Oliver PL, et al. (2010). Long noncoding RNA genes: conservation of sequence and brain expression among diverse amniotes. Genome Biol. 11: R72. http://dx.doi.org/10.1186/gb-2010-11-7-r72
Conesa A, Götz S, García-Gómez JM, Terol J, et al. (2005). Blast2GO: a universal tool for annotation, visualization and analysis in functional genomics research. Bioinformatics 21: 3674-3676. http://dx.doi.org/10.1093/bioinformatics/bti610
Garg R, Patel RK, Tyagi AK and Jain M (2011). De novo assembly of chickpea transcriptome using short reads for gene discovery and marker identification. DNA Res. 18: 53-63. http://dx.doi.org/10.1093/dnares/dsq028
Grabherr MG, Haas BJ, Yassour M, Levin JZ, et al. (2011). Full-length transcriptome assembly from RNA-Seq data without a reference genome. Nat. Biotechnol. 29: 644-652. http://dx.doi.org/10.1038/nbt.1883
Hale MC, McCormick CR, Jackson JR and Dewoody JA (2009). Next-generation pyrosequencing of gonad transcriptomes in the polyploid lake sturgeon (Acipenser fulvescens): the relative merits of normalization and rarefaction in gene discovery. BMC Genomics 10: 203. http://dx.doi.org/10.1186/1471-2164-10-203
Hu J, Zhou X and Li J (2010). Development of novel EST-SSR markers for cucumber (Cucumis sativus) and their transferability to related species. Sci. Hortic. 125: 534-538. http://dx.doi.org/10.1016/j.scienta.2010.03.021
Huang W and Marth G (2008). EagleView: a genome assembly viewer for next-generation sequencing technologies. Genome Res. 18: 1538-1543. http://dx.doi.org/10.1101/gr.076067.108
Hubbard SJ, Grafham DV, Beattie KJ, Overton IM, et al. (2005). Transcriptome analysis for the chicken based on 19,626 finished cDNA sequences and 485,337 expressed sequence tags. Genome Res. 15: 174-183. http://dx.doi.org/10.1101/gr.3011405
Jin S, Fu H, Zhou Q, Sun S, et al. (2013). Transcriptome analysis of androgenic gland for discovery of novel genes from the oriental river prawn, Macrobrachium nipponense, using Illumina Hiseq 2000. PLoS One 8: e76840. http://dx.doi.org/10.1371/journal.pone.0076840
Katayama S, Tomaru Y, Kasukawa T, Waki K, et al.; RIKEN Genome Exploration Research Group; Genome Science Group (Genome Network Project Core Group); FANTOM Consortium (2005). Antisense transcription in the mammalian transcriptome. Science 309: 1564-1566. http://dx.doi.org/10.1126/science.1112009
Kong L, Zhang Y, Ye ZQ, Liu XQ, et al. (2007). CPC: assess the protein-coding potential of transcripts using sequence features and support vector machine. Nucleic Acids Res. 35: W345-9. http://dx.doi.org/10.1093/nar/gkm391
Li T, Wang S, Wu R, Zhou X, et al. (2012). Identification of long non-protein coding RNAs in chicken skeletal muscle using next generation sequencing. Genomics 99: 292-298. http://dx.doi.org/10.1016/j.ygeno.2012.02.003
Ludwig A, Belfiore NM, Pitra C, Svirsky V, et al. (2001). Genome duplication events and functional reduction of ploidy levels in sturgeon (Acipenser, Huso and Scaphirhynchus). Genetics 158: 1203-1215.
Morozova O and Marra MA (2008). Applications of next-generation sequencing technologies in functional genomics. Genomics 92: 255-264. http://dx.doi.org/10.1016/j.ygeno.2008.07.001
Morozova O, Hirst M and Marra MA (2009). Applications of new sequencing technologies for transcriptome analysis. Annu. Rev. Genomics Hum. Genet. 10: 135-151. http://dx.doi.org/10.1146/annurev-genom-082908-145957
Okazaki Y, Furuno M, Kasukawa T, Adachi J, et al.; FANTOM Consortium; RIKEN Genome Exploration Research Group Phase I & II Team (2002). Analysis of the mouse transcriptome based on functional annotation of 60,770 full-length cDNAs. Nature 420: 563-573. http://dx.doi.org/10.1038/nature01266
Ota T, Suzuki Y, Nishikawa T, Otsuki T, et al. (2004). Complete sequencing and characterization of 21,243 full-length human cDNAs. Nat. Genet. 36: 40-45. http://dx.doi.org/10.1038/ng1285
Ozsolak F and Milos PM (2011). RNA sequencing: advances, challenges and opportunities. Nat. Rev. Genet. 12: 87-98. http://dx.doi.org/10.1038/nrg2934
Pauli A, Valen E, Lin MF, Garber M, et al. (2012). Systematic identification of long noncoding RNAs expressed during zebrafish embryogenesis. Genome Res. 22: 577-591. http://dx.doi.org/10.1101/gr.133009.111
Richards VP, Suzuki H, Stanhope MJ and Shivji MS (2013). Characterization of the heart transcriptome of the white shark (Carcharodon carcharias). BMC Genomics 14: 697. http://dx.doi.org/10.1186/1471-2164-14-697
Senturk Akfirat F and Uncuoglu AA (2013). Genetic diversity of winter wheat (Triticum aestivum L.) revealed by SSR markers. Biochem. Genet. 51: 223-229. http://dx.doi.org/10.1007/s10528-012-9557-6
Tatusov RL, Fedorova ND, Jackson JD, Jacobs AR, et al. (2003). The COG database: an updated version includes eukaryotes. BMC Bioinformatics 4: 41. http://dx.doi.org/10.1186/1471-2105-4-41
Ulitsky I, Shkumatava A, Jan CH, Sive H, et al. (2011). Conserved function of lincRNAs in vertebrate embryonic development despite rapid sequence evolution. Cell 147: 1537-1550. http://dx.doi.org/10.1016/j.cell.2011.11.055
Vidotto M, Grapputo A, Boscari E, Barbisan F, et al. (2013). Transcriptome sequencing and de novo annotation of the
13Transcriptome of Amur sturgeon
©FUNPEC-RP www.funpecrp.com.brGenetics and Molecular Research 15 (2): gmr.15027999
critically endangered Adriatic sturgeon. BMC Genomics 14: 407. http://dx.doi.org/10.1186/1471-2164-14-407Wei W, Qi X, Wang L, Zhang Y, et al. (2011). Characterization of the sesame (Sesamum indicum L.) global transcriptome
using Illumina paired-end sequencing and development of EST-SSR markers. BMC Genomics 12: 451. http://dx.doi.org/10.1186/1471-2164-12-451
Yang SS, Tu ZJ, Cheung F, Xu WW, et al. (2011). Using RNA-Seq for gene identification, polymorphism detection and transcript profiling in two alfalfa genotypes with divergent cell wall composition in stems. BMC Genomics 12: 199. http://dx.doi.org/10.1186/1471-2164-12-199
Young RS, Marques AC, Tibbit C, Haerty W, et al. (2012). Identification and properties of 1,119 candidate lincRNA loci in the Drosophila melanogaster genome. Genome Biol. Evol. 4: 427-442. http://dx.doi.org/10.1093/gbe/evs020
Yuan L, Zhang X, Li L, Jiang H, et al. (2014). High-throughput sequencing of microRNA transcriptome and expression assay in the sturgeon, Acipenser schrenckii. PLoS One 9: e115251. http://dx.doi.org/10.1371/journal.pone.0115251
Yue H, Li C, Du H, Zhang S, et al. (2015). Sequencing and De Novo Assembly of the Gonadal Transcriptome of the Endangered Chinese Sturgeon (Acipenser sinensis). PLoS One 10: e0127332. http://dx.doi.org/10.1371/journal.pone.0127332
Zhang J, Liang S, Duan J, Wang J, et al. (2012). De novo assembly and characterisation of the transcriptome during seed development, and generation of genic-SSR markers in peanut (Arachis hypogaea L.). BMC Genomics 13: 90. http://dx.doi.org/10.1186/1471-2164-13-90
Zhang X, Wu W, Li L, Ma X, et al. (2013). Genetic variation and relationships of seven sturgeon species and ten interspecific hybrids. Genet. Sel. Evol. 45: 21. http://dx.doi.org/10.1186/1297-9686-45-21