TRANSCRIPTIONAL PROFILING ENABLES … · aggressive behaviour. Adrenocortical tumours are often...
35
1 TRANSCRIPTIONAL PROFILING ENABLES MOLECULAR CLASSIFICATION OF ADRENOCORTICAL TUMOURS Cecilia Laurell 1*# , David Velázquez-Fernández 2* , Kristina Lindsten 3 , Christofer Juhlin 2 , Ulla Enberg 2 , Janos Geli 2 , Anders Höög 4 , Magnus Kjellman 2 , Joakim Lundeberg 1 , Bertil Hamberger 2 , Catharina Larsson 2 , Peter Nilsson 1# , Martin Bäckdahl 2 1 School of Biotechnology, KTH - Royal Institute of Technology, Stockholm, Sweden. 2 Department of Molecular Medicine and Surgery, Karolinska Institutet, Stockholm, Sweden. 3 Department of Cell and Molecular Biology, Karolinska Institutet, Stockholm, Sweden. 4 Department of Oncology-Pathology, Karolinska Institutet, Stockholm, Sweden. * The two first authors contributed equally. # Corresponding authors; email: [email protected] and [email protected]; Fax: +46 8 5537 8481 Running title: Classification of adrenocortical tumours Total word count: 6317 Page 1 of 35 Accepted Preprint first posted on 1 May 2009 as Manuscript EJE-09-0068 Copyright © 2009 European Society of Endocrinology.
-
Upload
phungthien -
Category
Documents
-
view
221 -
download
0
Transcript of TRANSCRIPTIONAL PROFILING ENABLES … · aggressive behaviour. Adrenocortical tumours are often...

1
TRANSCRIPTIONAL PROFILING ENABLES MOLECULAR CLASSIFICATION
OF ADRENOCORTICAL TUMOURS
Cecilia Laurell1*#
, David Velázquez-Fernández2*
, Kristina Lindsten3, Christofer Juhlin
2, Ulla
Enberg2, Janos Geli
2, Anders Höög
4, Magnus Kjellman
2, Joakim Lundeberg
1, Bertil
Hamberger2, Catharina Larsson
2, Peter Nilsson
1#, Martin Bäckdahl
2
1 School of Biotechnology, KTH - Royal Institute of Technology, Stockholm, Sweden.
2 Department of Molecular Medicine and Surgery, Karolinska Institutet, Stockholm, Sweden.
3 Department of Cell and Molecular Biology, Karolinska Institutet, Stockholm, Sweden.
4 Department of Oncology-Pathology, Karolinska Institutet, Stockholm, Sweden.
* The two first authors contributed equally.
# Corresponding authors; email: [email protected] and [email protected]; Fax: +46 8 5537 8481
Running title: Classification of adrenocortical tumours
Total word count: 6317
Page 1 of 35 Accepted Preprint first posted on 1 May 2009 as Manuscript EJE-09-0068
Copyright © 2009 European Society of Endocrinology.

2
Abstract
Objective: Tumours in adrenocortex are common human tumours. Malignancy is however
rare, the yearly incidence being 0.5 - 2 per million inhabitants, but associated with a very
aggressive behaviour. Adrenocortical tumours are often associated with altered hormone
production with a variety of clinical symptoms. The aggressiveness of carcinomas together
with the high frequency of adenomas, calls for a deeper understanding of the underlying
biological mechanisms and an improvement of the diagnostic possibilities.
Methods: Microarray gene expression analysis was performed in tumours of adrenocortex
with emphasis on malignancy as well as hormonal activity. The sample set consisted of 17
adenomas, eleven carcinomas and four histological normal adrenocortexes. RNA from these
was hybridized according to a reference design on microarrays harbouring 29,760 human
cDNA clones. Confirmation was performed with quantitative RT-PCR and western blot
analysis.
Results: Unsupervised clustering to reveal relationships between samples based on the entire
gene expression profile resulted in two sub clusters; carcinomas and non-cancer specimens. A
large number of genes were accordingly found to be differentially expressed comparing
carcinomas to adenomas. Among these were IGF2, FGFR1 and FGFR4 in growth factor
signalling the most predominant and also the USP4, UBE2C and UFD1L in the ubiquitin-
proteasome pathway. Moreover, two subgroups of carcinomas were identified with different
survival outcome, suggesting that survival prediction can be made on the basis of gene
expression profiles. Regarding adenomas with aldosterone overproduction, OSBP and
VEGFB were among the most up regulated genes compared to the other samples.
Conclusions: Adrenocortical carcinomas are associated with a distinct molecular signature
apparent in their gene expression profiles. Differentially expressed genes were identified
associated with malignancy, survival as well as hormonal activity providing a resource of
Page 2 of 35

3
candidate genes for exploration of possible drug targets and diagnostic and prognostic
markers.
Page 3 of 35

4
Introduction
Adrenocortical tumors have a relatively high prevalence in the general population of up to 9
% in autopsy studies [1, 2]. However, malignancy is rare, the yearly incidence being 0.5 to 2
per million people, but with only 12 months mean survival time for patients with non-
resectable cancers [3-7]. The aggressiveness of carcinomas together with the high frequency
of adenomas, calls for a deeper understanding of the underlying biological mechanisms and
an improvement of the diagnostic possibilities.
Most adrenocortical tumours are detected incidentally with computed tomography (CT) or
magnetic resonance imaging (MRI), although some give clinical signs, associated with the
specific hormone over-expressed, e.g. aldosterone or cortisol. Adenoma development
sometimes leads to overproduction of one or a mixture of these hormones. Aldosterone
producing tumours (aldosteronomas) causes hypertension, while cortisol overproduction
induces Cushing’s syndrome. Adrenocortical carcinomas are often large and may therefore be
present with abdominal pain and weight loss, with or without a mixture of the different
hormones. The hormonal profiles associated with adrenocortical tumours makes hormonal
screening an appealing clinical approach for diagnosis and analyzes of steroid profiles may
also contribute to set the malignant diagnosis. As a result of the recent advances in the
bioimaging field and the more frequent use of CT and MRI, the number of detected tumours
is increasing. The main indication for adrenalectomy of tumours without hormone
overproduction is the size of the tumour based on CT and MRI. All tumours with a diameter
larger than 4 cm are, in most countries, recommended to be surgically resected [8].
Development of adrenocortical carcinoma is not well characterized. Comparative
hybridisation studies and allelotyping have shown that the number of genetic alterations
increases with tumour size as a sign of an overall altered genetic stability in the malignant
Page 4 of 35

5
tumours [4,5,9]. The most common genetic aberrations are gains on chromosome 4 and 5 and
losses on chromosome 11 and 17. Also in benign tumours have gains been observed, on the
long arm of chromosome 4 [10]. Mutations of TP53 as well as over expression of IGF2 due to
CpG island demethylation are shared features of malignant tumours [11].
Tumour classification based on microarray gene expression data has demonstrated promising
results for numerous cancer types with potential clinical applications [12-15]. There are
principally two categories of classification; unsupervised and supervised, which are used for
two different purposes. Unsupervised classification is mainly used for exploratory analysis,
clustering tumours into groups based on similarities of gene expression profiles. If the
resulting clusters have concordance with diagnosis or outcome the unsupervised clustering
method can be used as a diagnostic and prognostic tool. Supervised classification on the other
hand is always performed to create a diagnostic tool, which is to be used for discrimination of
new data. Development of the classifier is based on prior information of how tumour types are
connected to the appearance of gene expression profiles. This can be obtained by performing
microarray analysis on samples with well-established diagnosis and with long follow-up.
In a previous microarray study [16], we have shown that adrenocortical carcinomas have gene
expression signatures that can be distinguished from adenomas. In this report the sample size
has been increased and we further analyze transcriptional differences in subtypes of hormone
producing adrenocortical tumours, incidentalomas and normal adrenal cortex. Furthermore,
based on the gene expression profiles, we suggest candidates for potential markers for the
diagnosis of adrenocortical carcinoma. We also show that the carcinoma tumours cluster into
two separate groups correlated to survival time.
Page 5 of 35
6
Methods
Tissue samples: This study included 4 normal adrenal cortex samples and all together 28
sporadic adrenocortical tumours; 4 aldosteronomas, 5 cortisol producing adenomas (here
denoted as Cushing in figures and tables), 8 incidentalomas and 11 adrenocortical carcinomas.
Cases with incidentaloma did not exhibit hormonal overproduction as determined by urinary
and serum measurements. A subset of the tumours, 7 carcinomas and 13 adenomas, were
included in a previous study and the data has been integrated into this extended study [16]. All
cases were selected from a cohort of 250 patients operated at the Karolinska University
Hospital from 1986 to 2004 as described [16]. Excluded cases were those with adrenal
hyperplasia or tumours from the adrenal medulla. The tumour tissue analyzed contained more
than 70% tumour cells. Every patient had a clinical follow-up for at least 1,5 year. Diagnostic
criteria for malignancy were vascular invasion, invasion of surrounding organs and/or
presence of distant metastasis. In cases where these criteria were not fulfilled the
histopathological criteria proposed by Weiss was used [17]. Cases with high nuclear grade,
increased mitotic figures and tumour necrosis were suspected to be malignant. The
appearance of metastasis at follow up, or recurrences further facilitated the establishment of a
malignant diagnosis. Normal adrenal cortex samples were obtained from patients undergoing
nephrectomy for other reasons and used as normal references in the RNA analysis. Matching
normal adrenal cortex was obtained from four of the cases for western blot analysis. The
clinical and tumour characteristics are shown in table 1. The samples were obtained with
informed consent and the study of the tissue material was approved by the Ethical Committee
of the Karolinska University Hospital.
RNA extraction: A fresh frozen piece of approximately 100 mg was used for RNA extraction.
Representative sections from all specimens were subjected to histopathological evaluation for
Page 6 of 35

7
tumor representativity. Total RNA was extracted using Qiagen mini and midi preps kits for
RNA purification. RNA quantity and quality were assessed by ND-1000 spectrophotomer
(Nanodrop) and 2100 Bioanalyzer (Agilent Technologies).
Design of microarray experiments: We used a reference design where each sample was
hybridized in duplicates. Tumor samples were labeled with Cy5 and hybridized with Cy3
labeled commercially available Universal Human Reference RNA (UHRR) (Stratagene).
Microarray production: In-house manufactured cDNA microarrays with 29,760 cDNA
fragments representing 18,953 unique human UniGene IDs were used. The cDNA clones
originate from the sequence verified human clone collection, 97001.V, plates 1-310 (Research
Genetics). The microarrays were spotted onto Ultra GAPS slides (Corning) with a Qarray2
arrayer (Genetix) with 48 K2805 pins (Genetix). The complete protocols for preparation of
clones and printing together with a complete gene list can be found at www.ktharray.se and at
ArrayExpress (A-MEXP-114).
Target labelling: First strand cDNA target was generated by reverse transcription of 10 µg of
total RNA in a 30 µl reaction using 5 µg random hexamers (Operon), first-strand buffer (50
mM Tris-HCl, pH 8.3, 75 mM KCl, 3 mM MgCl2), 0.01 mM DTT, 400 units Superscript III
(Invitrogen), 2 mM d(A/G/C)TPs, 1.6 mM dTTP (Amersham Biosciences) and 0.4 mM
aminoallyl-dUTP (Sigma-Aldrich). Secondary structures of RNA and primers were removed
at 70°C during 10 minutes followed by 2 minutes of incubation on ice for primer annealing
before addition of the other reaction components. cDNA synthesis was performed during 2 h
at 42°C and terminated by addition of EDTA. The RNA was hydrolyzed in NaOH during 15
minutes incubation at 70°C followed by neutralization with HCl (final concentrations 20 mM,
Page 7 of 35

8
150 mM and 150 mM, respectively). The cDNA was purified using MinElute spin columns
(Qiagen GmbH) with the provided wash buffer replaced by 80% ethanol and the elution
buffer by 100 mM NaHCO3, pH 9.0. Monofunctional NHS-ester Cy3 or Cy5 fluorophores
(Amersham Biosciences) were coupled to the amino-allyl groups during a 30-minute
incubation at room temperature after which unincorporated ester groups were inactivated
through a hydroxylamine treatment (final concentration of 730 mM). The labelling reactions
were purified using MinElute spin columns. The complete protocol for target labelling can be
downloaded from www.ktharray.se. Extraction and labeling quality/quantity were assessed
with a by ND-1000 spectrophotometer (Nanodrop).
Hybridizations and scanning: The slides were prehybridised in 5X SSC, 0.1% SDS, and 1 %
BSA (Sigma-Aldrich) for 30 min in 42°C. The hybridisation buffer contained 50%
formamide, 5X SSC, 0.1% SDS, 10 µg COT-1 DNA (Invitrogen) and 5 µg tRNA (Sigma-
Aldrich). After hybridisations in chambers (Corning) for 18 h at 42°C the arrays were washed
according to Corning’s recommendations and scanned at 532 and 635 nm with 10-µm
resolution using a G2565BA DNA microarray scanner (Agilent Technologies).
Data analysis: Image analysis was performed in GenePix Pro 5.1 software (Axon instruments
Inc, CA, USA). Spots were removed from further analysis if more than 70 percent of
foreground pixels were below background intensity plus two standard deviations in both
channels or if the difference between ratio of medians and regression ratio exceeded 20
percent in one of the channels. After removal of low quality spots the remaining intensities
were print tip lowess normalized in the R environment for statistical computing [18] with the
aroma package [19]. To increase robustness considering the limited amount of patients, probe
signals were required to be present in at least one technical replicate for each patient to be
Page 8 of 35

9
considered in the further analysis (6063 probes representing 4843 unique UniGene IDs). An
exception was made in the comparison of aldosteronomas to all other samples where a
maximum of five missing values were allowed in non-aldosteronoma specimens (12059
probes representing 8880 unique UniGene IDs). An empirical Bayes statistics (B-test) for
ranking differentially expressed genes according to statistical significance was performed
with the Limma package [20]. Criteria for statistical significance in the supplementary data
files of differentially expressed genes were p < 0.001 and |log2 fold change|| > 1. The p-value
is the Benjamini and Hochberg false discovery rate. Fischer’s exact test was used for
enrichment analysis of Gene Ontology terms and chromosomal location among the 1000 most
significantly differentially expressed genes comparing malignant to non-malignant samples
with a significance level of p < 0.05. Clustering was performed with the stats and class
packages.
Quantitative Real Time PCR (qRT-PCR): In order to confirm the array findings we used a
two step TaqMan qRT-PCR analysis. Synthesis of cDNA from total RNA was performed
using the High-Capacity cDNA Archive kit (Applied Biosystems) on 0.5-1 µg of RNA from
each sample. The reaction was carried out in a GeneAmp PCR System 9700 thermal cycler
(Applied Biosystems), under the conditions of an initial hold phase of 25°C for 10 minutes,
followed by 2 hours at 37°C.
A 96 well plate was prepared for the TaqMan Gene Expression Assays (Applied Biosystems).
Every well contained 12.5 µl of TaqMan Universal master mix, 1.25 µl of primer plus probe
mix (Assays on Demand from Applied Biosystems), 6.25 µl of RNAse-free water and 5 µl of
cDNA or previously prepared dilutions (reference curve). Dilutions were prepared for 1:10,
1:100, 1:1000 and 1:10 000. Every sample and control well was analyzed in triplicates and the
reference genes in duplicates according to manufacturer’s recommendations. A non-template
Page 9 of 35

10
control well was used as negative control in every run. Wells were sealed with MicroAmp
Optical caps. Plates were loaded into the ABI PRISM 7700 sequence detection system
(Applied Biosystems). In order to select a reference gene for the quantification we used the
TaqMan Human Endogenous Control Plate. This evaluates the expression of 11 selected
reference genes, using qRT-PCR. The plate also features an internal positive control (IPC)
designed to detect the presence of PCR inhibitors in test samples. The explored genes were,
18S rRNA, acidic ribosomal protein, beta-actin, cyclophilin, GAPDH, phosphoglycerokinase,
b2-microglobulin, beta-glucoronidase, hypoxanthine ribosyl transferase, transcription factor
IID TATA binding protein and the transferrin receptor. The 18S rRNA gene was found to
have the most stable expression levels among all samples and was thereby chosen as the
reference gene to relate the transcript levels of the target genes. The genes analyzed with
qRT-PCR were: aldehyde dehydrogenase 1 family member A1 (ALDH1A1), insulin-like
growth factor II precursor (IGF2), ubiquitin specific peptidase 4 (USP4) and ubiquitin fusion
degradation protein 1 (UFD1L).
Western Blot Analysis
Frozen tissues were grounded into powder by mortaring on dry ice and subsequently
dissolved by sonication in a buffer containing 50 mM Tris (pH 7.4), 5 mM MgCl2, 250 mM
sucrose, 1 mM DTT and 1 mM ATP. The protein extracts were clarified by centrifugation and
the lysates were snap-frozen in liquid nitrogen and kept frozen until use. For Western blot
analysis 20 µg protein/sample was fractionated on SDS-PAGE 4-12% gradient gels
(Invitrogen), blotted on polyvinylidene difluoride membranes, blocked in PBS supplemented
with 5% skim milk and 0.1% Tween and probed with anti-Usp4 (C-term) antibody (Abgent),
diluted 1:500. After subsequent washings and incubation with Horseradish peroxidase-
conjugated goat anti-rabbit serum (Amersham Biosciences), the blots were developed by
Page 10 of 35

11
enhanced chemiluminescence (GE Healthcare). As positive control for the Usp4 antibody we
transfected human embryonic kidney cells (HEK) 293T cells with a plasmid expressing USP4
in fusion with green fluorescent protein (GFP) and harvested the cells for Western blot
analysis two days post-transfection.
Page 11 of 35

12
Results
Classification with unsupervised methods
Principal component analysis, hierarchical clustering, k-means clustering and self-organizing
maps were applied to the filtered set of 6,063 probes with expression values obtained in every
tissue sample analyzed. The carcinomas and the non-cancers clustered in separate groups with
the exception of carcinoma 2931 (figure 1). The discrepancy in gene expression is striking
and the malignant behaviour seems to be congruent and out rule other inter-individual
differences. Interestingly, the adenoma cluster fell into sub-groups, with all incidentalomas
represented in one group, all aldosteronomas in a second group and normal cortex and
Cushing adenomas mixed into a third.
Differential gene expression in cancers
A t-test moderated with an empirical Bayesian statistics was applied to test for differential
expression. When carcinomas, except case 2931, were compared to all other samples using
the criteria for statistical significance described in material and methods, significantly
differential expression was observed for around 300 transcripts, supplementary file 1A. The
50 most significantly over expressed and the 50 most significantly under expressed transcripts
are displayed in figure 2. In supplementary file 1B statistical data for all genes present in all
samples is displayed. IGF2, a well established gene over-expressed in adrenocortical cancer,
was the most up-regulated transcript. FGFR1 and FGFR4 were up-regulated growth factor
receptors.
Enrichment analysis and gene ontology classification of differentially expressed genes in
cancers
Enrichment analysis of chromosomal location of differentially expressed genes revealed that
over-expression on chromosome 5 and under expression on chromosome 2 and 1 were
Page 12 of 35

13
significant. To investigate which biological processes the differentially expressed genes were
involved in, Gene Ontology (GO) annotations were used. Enrichment analysis of the highest
ranked differentially expressed transcripts according to statistical significance comparing
carcinomas to all other samples showed that anti-apoptosis and cell cycle, were over
represented among genes with altered transcript levels (supplementary file 1C). A subset of
genes with GO annotation adhesion, mitosis or extra cellular location is presented in table 2
since these categories are of interest in the context of cancer development.
Verification by quantitative real time PCR
To confirm microarray results, four of the most significantly differentially expressed genes
were analyzed with quantitative real time PCR. qRT-PCR was performed for ALDH1A1,
IGF2, USP4 and UFD1L. This confirmed IGF2 as significantly over-expressed and
ALDH1A1 as significantly under-expressed in carcinomas (with the exception of sample
2931) compared to all other samples (figure 3). The differences were too small and the
variation was too high for USP4 and UFD1L to generate a significant difference. In average
the up regulation was 1.3 and 1.4 fold, respectively, in cancer versus non-cancer samples.
The corresponding values for IGF2 was 144-fold up-regulation and 12-fold down-regulation
of ALDH1A1. Ratios were calculated in a similar way for the array data by taking the average
of the ratio for those genes in the cancer samples versus the reference RNA and then divide
that with the corresponding ratio for the non-cancer samples. The corresponding fold over-
expression for USP4 and UFD1L was 44 and 32 respectively. The corresponding values for
IGF2 was 388-fold up-regulation and for ALDH1A1 11-fold down-regulation respectively.
Page 13 of 35
14
USP4 protein expression is increased in adrenocortical carcinomas
The microarray data described here indicate a significant overexpression of the
deubiquitinating enzyme USP4 (also known as UNP for ubiquitous nuclear protein) in
adrenocortical carcinomas compared to adenomas. To test if the increased transcription
correlates with elevated protein levels we prepared lysates from tumour biopsies and
performed western blot analysis using an anti-USP4 antibody (figure 4). A clear increase in a
couple of close migrating bands corresponding to the expected size of endogenous USP4 was
detected in the carcinoma samples as compared to normal reference. Smaller bands
(approximately 75 kDa) and additional weak bands reacting with the antibody may indicate
potential splice variants or cleavage products of USP4.
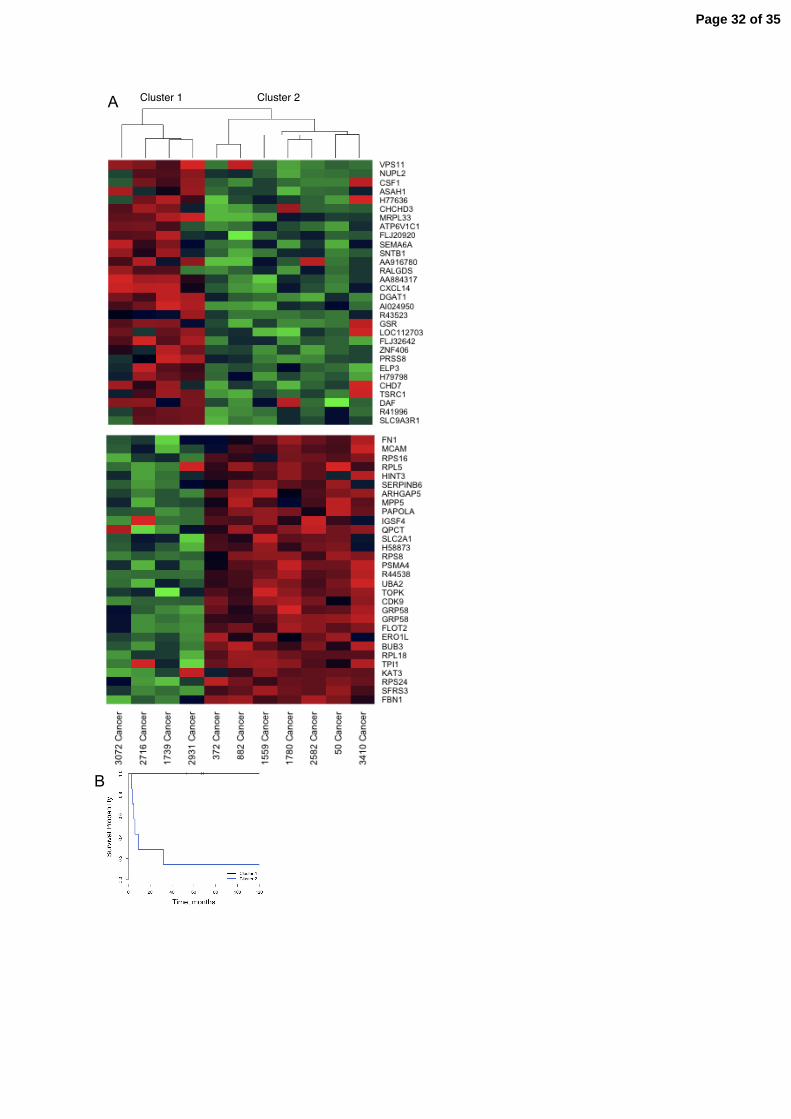
Survival analysis and gene expression in cancer tumours
In order to examine if the survival of cancer patients were reflected in the gene expression
patterns, cancer data was subject to hierarchical clustering using the entire filtered probe set
where each gene profile had been normalized to the same range. The resulting two subclusters
had different outcomes; one cluster contained patients with short survival (< 9 months) and
the other patients with long survival (> 67 months) suggesting that gene expression profiles
may be used for prediction of survival. In figure 5A the dendogram based on the entire probe
set is displayed together with the gene expression profiles of 30 up and 30 down regulated
genes. The Kaplan-Meier survival curves of the two subclusters are shown in figure 5B.
Differential expression associated with hormonal activity of benign tumours
The benign tumour sample set consisted of five Cushing, four aldosteronomas and eight non
hormonal overproducing incidentalomas. Comparing each subtype to the other samples we
could detect eleven genes with expression levels connected to aldosteronomas using the
Page 14 of 35

15
statistical criteria for differential expression described in material and methods (table 3). In
supplementary file 2A, data for all probes is shown. Differentially expressed genes were not
identified for the other subtypes. Among the dysregulated genes were, vascular endothelial
growth factor B (VEGFB) and oxysterol binding protein (OSBP). Comparison of
aldosteronomas versus incidentalomas revealed several significantly dysregulated genes as
detailed in supplementary file 2B. Mevalonate kinase (MVK) was up regulated in
aldosteronomas as well as peroxiredoxin 5 (PRDX5), while tumour necrosis factor receptor
super family 25 (TNFRSF25) was down regulated (Supplementary files 2B and C).
Discussion
It is important to elucidate the relation and differences between benign and malignant
adrenocortical tumours, both in terms of obtaining an increased understanding for the
underlying molecular mechanisms as well as to enhance possibilities for correct diagnosis and
prognosis for the individual patient. Previous studies have demonstrated that adrenocortical
carcinomas display specific and more numerous chromosomal and/or genetic alterations than
adenomas [4,5], which could suggest a characteristic malignant genotype. In a previous study
we showed that malignant gene expression profiles are distinguishable from those of benign
tumours [16]. In this extended study we also included normal adrenal cortex to ascertain that
the characteristics that separated cancers from benign tumours were associated with
malignancy and not present in normal adrenocortex. We found potentially useful expression
profiles which could enable differentiation between carcinomas and non-malignant
adrenocortical tissue (normal adrenocortex and adenomas), and furthermore between different
subclasses of adenomas. We could also show that in the malignant group tumours from
patients with long survival and tumours from patients with short survival fell into two
separate cluster groups.
Page 15 of 35

16
The IGF signalling pathway plays a major role in several cancer forms and is interesting
considering development of therapeutics and as a diagnostic approach. IGF2 was up regulated
in adrenocortical carcinomas in this study as in previous published gene expression profiling
studies on adrenocortical tumors [21-25]. Elevated expression levels of IGF2 has been
detected in several other cancer forms [26-28]. In a study of ovarian cancer, expression levels
of IGF2 have been demonstrated to be inversely correlated to survival [28]. Serum levels of
IGF2 have been proven to have biomarker potential for tumor staging of prostate cancer as a
complement to PSA [30]. IGF2 is thus a relatively general cancer marker but still has the
potential to become very useful to distinguish adrenocortical adenomas from carcinomas.
Several of the up-regulated genes in carcinomas, such as the deubiquitinating enzymes USP4
and USP38, the ubiquitin conjugating enzyme UBE2C, the small ubiquitin-like modifier
SUMO-1 and UFD1L are involved in the ubiquitination pathway (Figure 2). Posttranslational
modification by ubiquitin has emerged as a major regulatory event that is essential for cellular
processes such as cell cycle progression, signal transduction, transcriptional regulation, and
apoptosis [31]. USP4, which was among the most up-regulated genes is an enzyme of yet
unclear function, however its deregulation has previously been linked to cancer and USP4 has
been ascribed oncogenic [32, 33] as well as tumour suppressor functions [34] indicating that it
may be a multifunctional protein. USP4 has previously been reported to interact with the
retinoblastoma tumour suppressor, pRb, the pocket proteins, p107 and p130 [35, 36], the
ubiquitin ligase Ro52 [37] and the transmembrane G-coupled adenosine 2A receptor for
which it has been suggested to function to relax the endoplasmic reticulum quality control
mechanisms resulting in increased cell surface expression of the receptor [38]. The role of
USP4 in adrenocortical carcinomas is however still unexplored. UBE2C (also known as
UbcH10) is a ubiquitin conjugating enzyme involved in cell cycle regulation [39] and its over
Page 16 of 35

17
expression has been suggested to be a valid indicator of human cancers of various tissue
origin [40-42].
Differentially expressed genes in carcinomas showed overrepresentation for location on
chromosome 5 among genes up regulated in cancer, while down regulated genes were
enriched for chromosome 1 and 2. These observations overlap with those made with CGH
showing gains on chromosome 5 and losses on chromosome 2 in adrenocortical cancers [4].
As previously mentioned, we found an interesting cancer case (ID 2931), that surprisingly
clustered with normal cortex and adenomas in the unsupervised hierarchical clustering (figure
1). This patient had no metastasis at the time of surgery but received mitotane as adjuvant
chemotherapy. The patient is still alive 67 months after surgery without any evidence of
residual disease or metastasis. The tumor showed low proliferation with MIB-1/Ki-67, less
than 3% of activity. Interestingly, this case also showed gene expression levels similar to the
“normal or adenoma” pattern in the qRT-PCR for IGF2 and ALDH1A1 (figure 3).
Two recent studies have addressed the connection between gene expression levels and
prediction of survival [23,24]. Giordano et al could show that the cancer gene expression
signatures divided into two sub clusters with different survival outcome suggesting
microarrays as a prognostic tool. De Reyniès et al also found two sub clusters with different
survival outcomes. In addition, two specific genes (PINK1 and BUB1B) were selected as
biomarkers, which in combination could be used for prediction of survival. In our study two
sub clusters with different survival outcomes could be observed as well. Due to the limited
sample set size, we chose not to select any specific markers based on these. However we
could confirm that PINK1 and BUB1B also could be used as predictors for survival in our
cases (data not shown) although BUB3 was a better predictor than BUB1B. A weakness of the
Page 17 of 35

18
analysis in our study to take into consideration is that all diseased patients but one (372) are
females.
Regarding tumors with different hormonal activity, differences in expression patterns of genes
related to steroid hormone synthesis are of special interest. Several interesting genes involved
in intermediate metabolism were present on the array, such as the oxysterol binding protein
(OSBP) which was found to be up-regulated in aldosteronomas. This gene is involved in
sterol transport from lysosomes to the nucleus, down-regulating the expression of other genes
such as LDL-receptor, HMG-CoA reductase and HMG synthetase, involved in lipid synthesis.
An early enzyme in steroid synthesis is mevalonate kinase (MVK), which was up-regulated in
aldosteronomas compared to incidentalomas. Besides genes directly involved in hormonal
metabolism, many other genes were found to be differentially expressed in aldosteronomas,
among these VEGFB, adenosine deaminase (ADA), Inositol 1,3,4-triphosphate 5/6 kinase
(ITPK1), ubiquitin thiolesterase 1 (UCHL1), tumor necrosis factor receptor super family
member 25 (TNFRSF25), and the V-abl Abelson murine leukemia viral oncogene homolog 1
(ABL1) (supplementary file 2A and B).
Conclusions
Through the transcriptional profiling, different subtypes of functional adenomas and
carcinomas may be distinguished based on their specific molecular signature. This study
confirms and extends the findings of previous studies in this respect. Our utilization of a
whole genome cDNA microarray may serve as a complement to gene expression data
retrieved with Affymetrix high density microarrays and cDNA macroarrays. Further
investigation of the relevance of genes with subtype specific differential expression has the
potential to eventually lead to clinical breakthroughs together with the findings of the larger
studies recently published. Genes with expression levels connected to malignancy, survival
Page 18 of 35

19
and hormonal activity were detected in our data. Identification of these differentially
expressed genes may enhance our understanding of the molecular biology of adrenocortical
tumor development and its functional phenotype, and aid creating new diagnostic and
prognostic tools.
Acknowledgements
We thank Elisabet Ånfalk, Jia Jing Lee, Andrea Villablanca and Roberto Vázquez-Dávila for
technical expertise and assistance and and Annelie Waldén for microarray production.
Funding
This work was supported by Cancer Society in Stockholm, Gustav V Jubilee Foundation,
Swedish Research Council, Swedish Cancer Foundation, Stockholm, County Council and the
Consejo Nacional de Ciencia y Tecnología (CONACYT, México) and Göran Gustafsson
foundation for research in natural sciences and medicine.
Declaration of interest
We declare that there is no conflict of interest that could be perceived as prejudicing the
impartiality of the research reported.
C. Larsson holds a patent share for VEGFB.
Page 19 of 35

20
References
1. Hedeland H, Ostberg G, Hokfelt B: On the prevalence of adrenocortical adenomas in
an autopsy material in relation to hypertension and diabetes. Acta Med Scand 1968,
184(3):211-214.
2. Boushey RP, Dackiw AP: Adrenal cortical carcinoma. Curr Treat Options Oncol
2001, 2(4):355-364.
3. Dackiw AP, Lee JE, Gagel RF, Evans DB: Adrenal cortical carcinoma. World J Surg
2001, 25(7):914-926.
4. Kjellman M, Kallioniemi OP, Karhu R, Hoog A, Farnebo LO, Auer G, Larsson C,
Backdahl M: Genetic aberrations in adrenocortical tumors detected using comparative
genomic hybridization correlate with tumor size and malignancy. Cancer Res 1996,
56(18):4219-4223.
5. Kjellman M, Roshani L, Teh BT, Kallioniemi OP, Hoog A, Gray S, Farnebo LO,
Holst M, Backdahl M, Larsson C: Genotyping of adrenocortical tumors: very frequent
deletions of the MEN1 locus in 11q13 and of a 1-centimorgan region in 2p16. J Clin
Endocrinol Metab 1999, 84(2):730-735.
6. Sidhu S, Gicquel C, Bambach CP, Campbell P, Magarey C, Robinson BG, Delbridge
LW: Clinical and molecular aspects of adrenocortical tumourigenesis. ANZ J Surg
2003, 73(9):727-738.
7. Volante M, Buttigliero C, Greco E, Berruti A, Papotti M: Pathological and molecular
features of adrenocortical carcinoma: an update. J Clin Pathol 2008, 61(7):787-793.
8. Kendrick ML, Lloyd R, Erickson L, Farley DR, Grant CS, Thompson GB, Rowland
C, Young WF, Jr., van Heerden JA: Adrenocortical carcinoma: surgical progress or
status quo? Arch Surg 2001, 136(5):543-549.
Page 20 of 35

21
9. Herbet M, Feige JJ, Thomas M: Insights into the role of genetic alterations in
adrenocortical tumorigenesis. Mol Cell Endocrinol 2008.
10. Koch CA, Pacak K, Chrousos GP: The molecular pathogenesis of hereditary and
sporadic adrenocortical and adrenomedullary tumors. J Clin Endocrinol Metab 2002,
87(12):5367-5384.
11. Libe R, Bertherat J: Molecular genetics of adrenocortical tumours, from familial to
sporadic diseases. Eur J Endocrinol 2005, 153(4):477-487.
12. Golub TR, Slonim DK, Tamayo P, Huard C, Gaasenbeek M, Mesirov JP, Coller H,
Loh M, Downing JR, Caligiuri MA et al: Molecular Classification of Cancer: Class
Discovery and Class Prediction by Gene Expression. Science 1999, 286:531 - 537.
13. Perou CM, Sorlie T, Eisen MB, van de Rijn M, Jeffrey SS, Rees CA, Pollack JR, Ross
DT, Johnsen H, Akslen LA et al: Molecular portraits of human breast tumours. Nature
2000, 406(6797):747-752.
14. Sorlie T, Tibshirani R, Parker J, Hastie T, Marron JS, Nobel A, Deng S, Johnsen H,
Pesich R, Geisler S et al: Repeated observation of breast tumor subtypes in
independent gene expression data sets. Proc Natl Acad Sci U S A 2003, 100(14):8418-
8423.
15. Hedenfalk I, Duggan D, Chen Y, Radmacher M, Bittner M, Simon R, Meltzer P,
Gusterson B, Esteller M, Kallioniemi OP et al: Gene-expression profiles in hereditary
breast cancer. N Engl J Med 2001, 344(8):539-548.
16. Velazquez-Fernandez D, Laurell C, Geli J, Hoog A, Odeberg J, Kjellman M,
Lundeberg J, Hamberger B, Nilsson P, Backdahl M: Expression profiling of
adrenocortical neoplasms suggests a molecular signature of malignancy. Surgery
2005, 138(6):1087-1094.
Page 21 of 35
22
17. Weiss, LM, MedeirosLJ, Vickery ALJr Pathological features of prognostic significans
in adrenocortical carcinoma. Am J Surg Pathol 1989, 13:202-206.
18. R-Development-Core-Team: R: A Language and Environment for Statistical
Computing. 2005.
19. Bengtsson H: aroma - An R Object-oriented Microarray Analysis environment. 2005.
20. Smyth GK: Linear Models and Empirical Bayes Methods for Assessing Differential
Expression in Microarray Experiments. Statistical Applications in Genetics and
Molecular Biology 2004, 3(1):article 3.
21. Slater E, Diehl S, Langer P, Samans B, Ramaswamy A, Zielke A, Bartsch D: Analysis
by cDNA microarrays of gene expression patterns of human adrenocortical tumors.
European Journal of Endocrinology 2006, 154(4):587-598.
22. de Fraipont F, El Atifi M, Cherradi N, Le Moigne G, Defaye G, Houlgatte R,
Bertherat J, Bertagna X, Plouin P, Baudin E et al: Gene expression profiling of human
adrenocortical tumors using complementary deoxyribonucleic Acid microarrays
identifies several candidate genes as markers of malignancy. Journal of Clinical
Endocrinological Metabolism 2005, 90(3):1819-1829.
23. Giordano TJ, Thomas DG, Kuick R, Lizyness M, Misek DE, Smith AL, Sanders D,
Aljundi RT, Gauger PG, Thompson NW et al: Distinct transcriptional profiles of
adrenocortical tumors uncovered by DNA microarray analysis. Am J Pathol 2003,
162(2):521-531.
24 Giordano T, Kuick R, Else P, Gauger P, Vinco M, Bauersfeld J, Sanders D, Thomas
D, Doherty G, Hammer G. Molecular Classification and Prognostication of
Adrenocortical Tumors by Transcriptome Profiling. Clin Cancer Res 2009;15(2)
25 de Reyniès A, Assié G, David S, Tissier F, Groussin F, Dousset B, Bertagna X,
Claueser E, Bertherat J. Gene Expression Profilling Reveals a New Classification of
Page 22 of 35

23
Adrenocortical Tumors and Identifies Molecular Predictors of Malignancy and
Survival. Journal of Clinical Oncology, 2009, 27:1108-1115.
26. Nosho K, Yamamoto H, Takamaru H, Hamamoto Y, Goto A, Yoshida Y, Arimura Y,
Endo T, Hirata K, Imai K: A case of colorectal carcinoma in adenoma analyzed by a
cDNA array. Int J Colorectal Dis 2005, 20(3):287-291.
27. Wrobel G, Roerig P, Kokocinski F, Neben K, Hahn M, Reifenberger G, Lichter P:
Microarray-based gene expression profiling of benign, atypical and anaplastic
meningiomas identifies novel genes associated with meningioma progression. Int J
Cancer 2005, 114(2):249-256.
28. Li H, Zhang N: [Study on the expression and genomic imprinting status of insulin-like
growth factor 2 gene in hepatocellular carcinoma]. Zhonghua Gan Zang Bing Za Zhi
2004, 12(6):347-349.
29. Sayer R, Lancaster J, Pittman J, Gray J, Whitaker R, Marks J, Berchuck A: High
insulin-like growth factor-2 (IGF-2) gene expression is an independent predictor of
poor survival for patients with advanced stage serous epithelial ovarian cancer.
Gynecoligal Oncology 2005, 96(2):355-361.
30. Trojan L, Bode C, Weiss C, Mayer D, Grobholz R, Alken P, Michel M: IGF-II serum
levels increase discrimination between benign prostatic hyperplasia and prostate
cancer and improve the predictive value of PSA in clinical staging. European Urology
2006, 49(2):286-292.
31. Glickman MH, Ciechanover A: The ubiquitin-proteasome proteolytic pathway:
destruction for the sake of construction. Physiol Rev 2002, 82(2):373-428.
32. Gray DA, Inazawa J, Gupta K, Wong A, Ueda R, Takahashi T: Elevated expression of
Unph, a proto-oncogene at 3p21.3, in human lung tumors. Oncogene 1995,
10(11):2179-2183.
Page 23 of 35

24
33. Gupta K, Chevrette M, Gray DA: The Unp proto-oncogene encodes a nuclear protein.
Oncogene 1994, 9(6):1729-1731.
34. Frederick A, Rolfe M, Chiu MI: The human UNP locus at 3p21.31 encodes two
tissue-selective, cytoplasmic isoforms with deubiquitinating activity that have reduced
expression in small cell lung carcinoma cell lines. Oncogene 1998, 16(2):153-165.
35. Blanchette P, Gilchrist CA, Baker RT, Gray DA: Association of UNP, a ubiquitin-
specific protease, with the pocket proteins pRb, p107 and p130. Oncogene 2001,
20(39):5533-5537.
36. DeSalle LM, Latres E, Lin D, Graner E, Montagnoli A, Baker RT, Pagano M, Loda
M: The de-ubiquitinating enzyme Unp interacts with the retinoblastoma protein.
Oncogene 2001, 20(39):5538-5542.
37. Di Donato F, Chan EK, Askanase AD, Miranda-Carus M, Buyon JP: Interaction
between 52 kDa SSA/Ro and deubiquitinating enzyme UnpEL: a clue to function. Int
J Biochem Cell Biol 2001, 33(9):924-934.
38. Milojevic T, Reiterer V, Stefan E, Korkhov VM, Dorostkar MM, Ducza E, Ogris E,
Boehm S, Freissmuth M, Nanoff C: The ubiquitin-specific protease Usp4 regulates the
cell surface level of the A2A receptor. Mol Pharmacol 2006, 69(4):1083-1094.
39. Rape M, Kirschner MW: Autonomous regulation of the anaphase-promoting complex
couples mitosis to S-phase entry. Nature 2004, 432(7017):588-595.
40. Berlingieri MT, Pallante P, Guida M, Nappi C, Masciullo V, Scambia G, Ferraro A,
Leone V, Sboner A, Barbareschi M et al: UbcH10 expression may be a useful tool in
the prognosis of ovarian carcinomas. Oncogene 2007, 26(14):2136-2140.
41. Ieta K, Ojima E, Tanaka F, Nakamura Y, Haraguchi N, Mimori K, Inoue H, Kuwano
H, Mori M: Identification of overexpressed genes in hepatocellular carcinoma, with
Page 24 of 35

25
special reference to ubiquitin-conjugating enzyme E2C gene expression. Int J Cancer
2007.
42. Okamoto Y, Ozaki T, Miyazaki K, Aoyama M, Miyazaki M, Nakagawara A: UbcH10
is the cancer-related E2 ubiquitin-conjugating enzyme. Cancer Res 2003,
63(14):4167-4173.
Page 25 of 35

26
Legends to figures
Figure 1. Unsupervised clustering of gene expression profiles in the entire sample set based
on all microarray features. Principal component analysis reveals sample similarities and
shows that the gene expression is tumor type specific (left).The same observation can be made
with hierarchical clustering using Euclidean distances and average linkage (right).
Figure 2. The most significantly differentially expressed genes are congruent dysregulated in
cancers. Expression profiles of the 50 most significantly up regulated (top) and down
regulated (bottom) genes are displayed comparing cancer patients to non-cancer patients. The
color scale ranges from red to green analogous to from over- to underexpression. In
supplementary files 1A and B, fold changes and p-values are given.
Figure 3. Verification by qRT-PCR. Relative expression levels of A) IGF2 and B) ALDH1A1.
The array data are displayed as filled squares on the left axes as log2 ratios versus the
common reference RNA and the real time PCR data as open squares on the right axes as ratios
in relation to 18S rRNA.
Figure 4. Usp4 protein levels are increased in adrenocortical carcinomas compared to
adenomas. Western blot analysis using an anti-USP4 antibody showing increased expression
of USP4 protein in adrenocortical carcinomas as compared to adenomas. Underlined are
paired samples of tumour (T) and normal adrenal cortex (N) from the same patient. An
additional smaller product reacting with the USP4 antibody shows increased expression is
carcinomas (asterisk).
Page 26 of 35

27
Figure 5. A) Hierarchical clustering of cancers based on the entire filtered probe set results in
two subclusters; cluster 1 and cluster 2. A subset of 30 plus 30 genes with differential
expression are displayed beneath. B) Kaplan-Meier survival curves displays longer survival
times for cluster 1 cases as compared to cluster 2 cases.
Supplementary files
Supplementary file 1A. Differentially expressed genes in cancers compared to non-cancers,
ranked according to statistical significance (cut off: |log fold change| > 1, adjusted p-value <
0.001).
Supplementary file 1B. Differentially expressed genes in cancers compared to non-cancers,
ranked according to statistical significance based on features present in all samples in at least
one replicate.
Supplementary file 1C. Enrichment analysis with EASE of Gene Ontology Biological
Processes in the top 1000 features ranked according to statistical signicance of the differential
expression comparing cancers to all other samples. GO terms are ordered according to
Benjamini adjusted p-value.
Supplementary file 2A. Differentially expressed genes in aldosteronomas compared to all
other samples, ranked according to statistical significance. Missing values were not allowed in
aldosteronomas, but to a maximum of five in the other samples.
Supplementary file 2B. Differentially expressed genes in aldosteronomas compared to
incidentalomas, ranked according to statistical significance.
Supplementary file 2C. Differentially expressed genes in aldosteronomas compared to
Cushing adenomas, ranked according to statistical significance. Missing values were not
allowed in aldosteronomas, but to a maximum of five in the other samples.
Page 27 of 35

-40 -20 0 20
-50
-40
-30
-20
-10
010
First Principal Component
Sec
ond
Prin
cipa
l Com
pone
nt
CancerAdenomaNormal
2931
882
Can
cer
1206
Cus
hing
3374
Cus
hing
4232
Cus
hing
4166
Nor
mal
4539
Cus
hing
4149
Nor
mal
2931
Can
cer
3234
Nor
mal
5179
Nor
mal
885
Cus
hing
1077
Ald
oste
rono
ma
1196
Ald
oste
rono
ma
501
Ald
oste
rono
ma
1105
Ald
oste
rono
ma
2414
Inci
dent
alom
a17
64 In
cide
ntal
oma
3669
Inci
dent
alom
a11
80 In
cide
ntal
oma
1191
Inci
dent
alom
a29
15 In
cide
ntal
oma
2302
Inci
dent
alom
a37
93 In
cide
ntal
oma
1739
Can
cer
2716
Can
cer
1780
Can
cer
372
Can
cer
50 C
ance
r30
72 C
ance
r15
59 C
ance
r25
82 C
ance
r34
10 C
ance
r
Page 28 of 35

Page 29 of 35

33
Figure 3
Page 30 of 35

Page 31 of 35
Cluster 1 Cluster 2 A B
Page 32 of 35

Table 1. Clinical data of analyzed cases.
Case no
Histopathological Diagnosis Subtype Age Sex Metastasis
Survival (months)
a
Weight (g)
Size (cm)
50 Cancer Cancer 63 F Liver and
Bone 6DoD
1500 20
372 Cancer Cancer 78 M No 3DoD
203 15
882 Cancer Cancer 72 F No 5DoD
85 7
1559 Cancer Cancer 72 M Lung 120 1036 11
1739 Cancer Cancer 40 F No 120 2350 13
1780 Cancer Cancer 56 F Liver and
Lungs 9DoD
309 9
2582 Cancer Cancer 54 F Liver 4DoD
1339 15
2716 Cancer Cancer 68 M No 69 1420 15
2931 Cancer Cancer 52 M No 67 660 11
3072 Cancer Cancer 68 M Liver 53 660 12
3410 Cancer Cancer 84 F Liver 32DoD
1700 19
885 Adenoma Cushing 38 F - 151 12 3
1206 Adenoma Cushing 63 F - 146 51 6
3374 Adenoma Cushing 66 F - 50 14 2
4232 Adenoma Cushing 35 F - 20 26 4
4539 Adenoma Cushing 42 F - 18 28 4
501 Adenoma Aldosteronoma 50 F - 181 na 2
1077 Adenoma Aldosteronoma 47 M - 144 na 3
1105 Adenoma Aldosteronoma 29 F - 143 9 2
1196 Adenoma Aldosteronoma 79 F - 112* 7 2
1180 Adenoma Incidentaloma 63 F - 140 36 5
1191 Adenoma Incidentaloma 63 M - 140 32 4
1764 Adenoma Incidentaloma 42 F - 110 17 3
2302 Adenoma Incidentaloma 64 F - 86 26 4
2414 Adenoma Incidentaloma 63 F - 84 22 4
2915 Adenoma Incidentaloma 66 M - 61 22 4
3669 Adenoma Incidentaloma 54 F - 31 29 4
3793 Adenoma Incidentaloma 59 F - 28 19 3
3234 Adrenal Normal 81 M - - - -
4149 Adrenal Normal 36 F - - - -
4166 Adrenal Normal 85 M - - - -
5179 Adrenal Normal 76 M - - - -
a) Time between surgery and follow up
Dod) Dead of Disease *) Dead
Page 33 of 35

Table 2. Genes with significant differential expression in cancer in the Gene Ontology categories adhesion, mitosis and extracellular location
Acc UGCluster Name Symbol Log Ratio
Adhesion
AA455997 Hs.75081 Adenomatosis polyposis coli APC 0,79
AA034051 Hs.75081 Adenomatosis polyposis coli APC 1,05
AA490462 Hs.439463 AE binding protein 1 AEBP1 1,37 -
R41787 Hs.129340 Cadherin 13, H-cadherin (heart) CDH13 3,94
W49619 Hs.334131 Cadherin 2, type 1, N-cadherin (neuronal) CDH2 3,06 -
AA598507 Hs.1640 Collagen, type VII, alpha 1 COL7A1 0,64
AA012944 Hs.8867 Cysteine-rich, angiogenic inducer, 61 CYR61 1,45 -
AA777187 Hs.8867 Cysteine-rich, angiogenic inducer, 61 CYR61 1,01 -
H44785 Hs.443518 Dystonin DST 1,23
AA704323 Hs.8117 Erbb2 interacting protein ERBB2IP 0,79
AA115902 Hs.2799 Hyaluronan and proteoglycan link protein 1 HAPLN1 1,99
AA663440 Hs.286229 Plexin C1 PLXNC1 1,14 -
W86145 Hs.409546 Rho GTPase activating protein 5 ARHGAP5 0,65
AI364513 Hs.349656 Scavenger receptor class B, member 2 SCARB2 0,55
AA776891 Hs.349656 Scavenger receptor class B, member 2 SCARB2 0,60
AA449715 Hs.15154 Sushi-repeat-containing protein, X-linked SRPX 1,29 -
AA464532 Hs.164226 Thrombospondin 1 THBS1 2,34 -
N58107 Hs.2257 Vitronectin (serum spreading factor, somatomedin B) VTN 1,52 -
Mitosis
H90902 Hs.534403 CDC23 (cell division cycle 23, yeast, homolog) CDC23 1,13
R20737 Hs.534403 CDC23 (cell division cycle 23, yeast, homolog) CDC23 1,12
N35067 Hs.404501 Cell division cycle 2-like 5 (cholinesterase-related cell division controller) CDC2L5 0,46
AI291082 Hs.404501 Cell division cycle 2-like 5 (cholinesterase-related cell division controller) CDC2L5 0,55
N64731 Hs.386198 Echinoderm microtubule associated protein like 4 EML4 0,75 -
AA430032 Hs.350966 Pituitary tumor-transforming 1 PTTG1 1,07
AI362866 Hs.350966 Pituitary tumor-transforming 1 PTTG1 0,95
H73968 Hs.9329 TPX2, microtubule-associated protein homolog TPX2 0,78
R80790 Hs.93002 Ubiquitin-conjugating enzyme E2C UBE2C 1,55
AA430504 Hs.93002 Ubiquitin-conjugating enzyme E2C UBE2C 1,53
AA599145 Hs.13512 ZW10 homolog, centromere/kinetochore protein ZW10 1,62 -
Extracellular
AA700054 Hs.3416 Adipose differentiation-related protein ADFP 2,00 -
AA701963 Hs.75313 Aldo-keto reductase family 1, member B1 (aldose reductase) AKR1B1 2,69 -
AA991590 Hs.268571 Apolipoprotein C-I APOC1 3,26 -
AA873159 Hs.268571 Apolipoprotein C-I APOC1 3,22 -
T70891 Hs.110675 Apolipoprotein E APOE 2,27 -
AA101875 Hs.434488 Chondroitin sulfate proteoglycan 2 (versican) CSPG2 0,84 -
AA012944 Hs.8867 Cysteine-rich, angiogenic inducer, 61 CYR61 1,45 -
AA777187 Hs.8867 Cysteine-rich, angiogenic inducer, 61 CYR61 1,01 -
AI382562 Hs.121150 Taxilin DKFZp451J0118 0,65 -
H44785 Hs.443518 Dystonin DST 1,23
N79484 Hs.81071 Extracellular matrix protein 1 ECM1 0,67 -
H17615 Hs.11494 Fibulin 5 FBLN5 2,56 -
AA417274 Hs.433827 Follistatin-like 3 (secreted glycoprotein) FSTL3 0,94 -
W81526 Hs.113882 Gamma-aminobutyric acid (GABA) A receptor, delta GABRD 0,66
AA115902 Hs.2799 Hyaluronan and proteoglycan link protein 1 HAPLN1 1,99
N74623 Hs.251664 Insulin-like growth factor 2 (somatomedin A) IGF2 8,04
N54596 Hs.251664 Insulin-like growth factor 2 (somatomedin A) IGF2 6,58
N54596 Hs.251664 Insulin-like growth factor 2 (somatomedin A) IGF2 6,47
AA598601 Hs.450230 Insulin-like growth factor binding protein 3 IGFBP3 2,15
AA447781 Hs.406475 Lumican LUM 1,75 -
AA071473 Hs.153647 Matrilin 2 MATN2 1,41 -
H22922 Hs.371768 Manic fringe homolog (Drosophila) MFNG 1,09 -
R72075 Hs.172816 Neuregulin 1 NRG1 0,63 -
AA086038 Hs.410477 Phospholipase A2 receptor 1, 180kDa PLA2R1 2,17 -
R38933 Hs.274404 Plasminogen activator, tissue PLAT 0,78 -
AA485893 Hs.78224 Ribonuclease, RNase A family, 1 (pancreatic) RNASE1 2,26 -
R45235 Hs.118684 Stromal cell-derived factor 2 SDF2 0,57 -
R33439 Hs.24640 Semaphorin /A SEMA7A 1,20
R51912 Hs.12409 Somatostatin SST 0,93
AA085319 Hs.25590 Stanniocalcin 1 STC1 0,66
AA464532 Hs.164226 Thrombospondin 1 THBS1 2,34 -
AA099153 Hs.245188 Tissue inhibitor of metalloproteinase 3 TIMP3 1,78 -
AA479202 Hs.245188 Tissue inhibitor of metalloproteinase 3 TIMP3 2,12 -
N58107 Hs.2257 Vitronectin (serum spreading factor, somatomedin B) VTN 1,52 -
Table 2. Genes with significant differential expression in carcinomas versus non-malignant
samples in the Gene Ontology categories of adhesion, mitosis and extracellular location.
Page 34 of 35
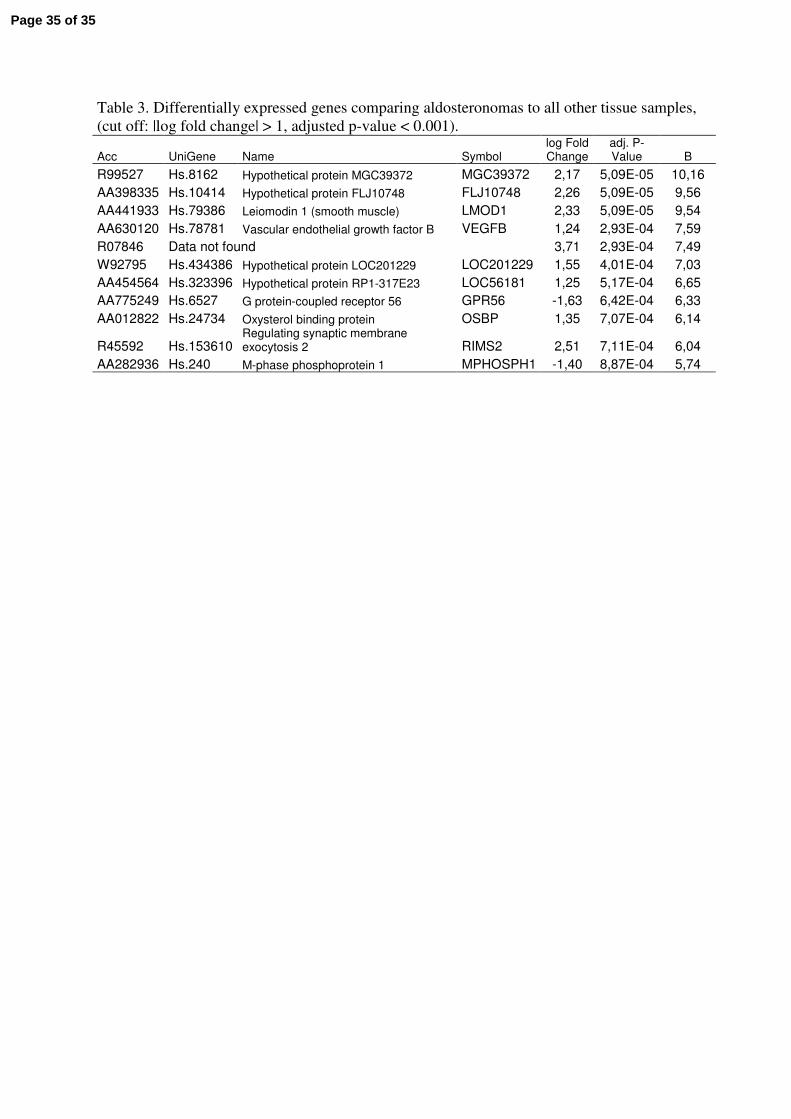
Table 3. Differentially expressed genes comparing aldosteronomas to all other tissue samples,
(cut off: |log fold change| > 1, adjusted p-value < 0.001).
Acc UniGene Name Symbol log Fold Change
adj. P-Value B
R99527 Hs.8162 Hypothetical protein MGC39372 MGC39372 2,17 5,09E-05 10,16
AA398335 Hs.10414 Hypothetical protein FLJ10748 FLJ10748 2,26 5,09E-05 9,56
AA441933 Hs.79386 Leiomodin 1 (smooth muscle) LMOD1 2,33 5,09E-05 9,54
AA630120 Hs.78781 Vascular endothelial growth factor B VEGFB 1,24 2,93E-04 7,59
R07846 Data not found 3,71 2,93E-04 7,49
W92795 Hs.434386 Hypothetical protein LOC201229 LOC201229 1,55 4,01E-04 7,03
AA454564 Hs.323396 Hypothetical protein RP1-317E23 LOC56181 1,25 5,17E-04 6,65
AA775249 Hs.6527 G protein-coupled receptor 56 GPR56 -1,63 6,42E-04 6,33
AA012822 Hs.24734 Oxysterol binding protein OSBP 1,35 7,07E-04 6,14
R45592 Hs.153610 Regulating synaptic membrane exocytosis 2 RIMS2 2,51 7,11E-04 6,04
AA282936 Hs.240 M-phase phosphoprotein 1 MPHOSPH1 -1,40 8,87E-04 5,74
Page 35 of 35