Transcriptional bursting is intrinsically caused by...
10
ARTICLE Received 16 Jun 2016 | Accepted 1 Nov 2016 | Published 7 Dec 2016 Transcriptional bursting is intrinsically caused by interplay between RNA polymerases on DNA Keisuke Fujita 1,2 , Mitsuhiro Iwaki 1,2 & Toshio Yanagida 1,2 Cell-to-cell variability plays a critical role in cellular responses and decision-making in a population, and transcriptional bursting has been broadly studied by experimental and theoretical approaches as the potential source of cell-to-cell variability. Although molecular mechanisms of transcriptional bursting have been proposed, there is little consensus. An unsolved key question is whether transcriptional bursting is intertwined with many transcriptional regulatory factors or is an intrinsic characteristic of RNA polymerase on DNA. Here we design an in vitro single-molecule measurement system to analyse the kinetics of transcriptional bursting. The results indicate that transcriptional bursting is caused by interplay between RNA polymerases on DNA. The kinetics of in vitro transcriptional bursting is quantitatively consistent with the gene-nonspecific kinetics previously observed in noisy gene expression in vivo. Our kinetic analysis based on a cellular automaton model confirms that arrest and rescue by trailing RNA polymerase intrinsically causes transcriptional bursting. DOI: 10.1038/ncomms13788 OPEN 1 Laboratory for Cell Dynamics Observation, Quantitative Biology Center, RIKEN, 6-2-3, Furuedai, Suita, Osaka 565-0874, Japan. 2 Soft Biosystem Group, Laboratories for Nanobiology, Graduate School of Frontier Biosciences, Osaka University, 1-3 Yamadaoka, Suita, Osaka 565-0871, Japan. Correspondence and requests for materials should be addressed to K.F. (email: [email protected]) or to T.Y. (email: [email protected]). NATURE COMMUNICATIONS | 7:13788 | DOI: 10.1038/ncomms13788 | www.nature.com/naturecommunications 1
Transcript of Transcriptional bursting is intrinsically caused by...
ARTICLE
Received 16 Jun 2016 | Accepted 1 Nov 2016 | Published 7 Dec 2016
Transcriptional bursting is intrinsically caused byinterplay between RNA polymerases on DNAKeisuke Fujita1,2, Mitsuhiro Iwaki1,2 & Toshio Yanagida1,2
Cell-to-cell variability plays a critical role in cellular responses and decision-making in a
population, and transcriptional bursting has been broadly studied by experimental and
theoretical approaches as the potential source of cell-to-cell variability. Although molecular
mechanisms of transcriptional bursting have been proposed, there is little consensus. An
unsolved key question is whether transcriptional bursting is intertwined with many
transcriptional regulatory factors or is an intrinsic characteristic of RNA polymerase on DNA.
Here we design an in vitro single-molecule measurement system to analyse the kinetics of
transcriptional bursting. The results indicate that transcriptional bursting is caused by
interplay between RNA polymerases on DNA. The kinetics of in vitro transcriptional bursting
is quantitatively consistent with the gene-nonspecific kinetics previously observed in noisy
gene expression in vivo. Our kinetic analysis based on a cellular automaton model confirms
that arrest and rescue by trailing RNA polymerase intrinsically causes transcriptional bursting.
DOI: 10.1038/ncomms13788 OPEN
1 Laboratory for Cell Dynamics Observation, Quantitative Biology Center, RIKEN, 6-2-3, Furuedai, Suita, Osaka 565-0874, Japan. 2 Soft Biosystem Group,Laboratories for Nanobiology, Graduate School of Frontier Biosciences, Osaka University, 1-3 Yamadaoka, Suita, Osaka 565-0871, Japan. Correspondence andrequests for materials should be addressed to K.F. (email: [email protected]) or to T.Y. (email: [email protected]).
NATURE COMMUNICATIONS | 7:13788 | DOI: 10.1038/ncomms13788 | www.nature.com/naturecommunications 1
Genetically identical cells in an identical environmentbehave differently, leading to significant consequences inmany biological process from bacterial decision-making
to mammalian development1–4. The well-known potentialsource of this cell-to-cell variability is a noisy messenger RNAproduction in transcription, which is the so-called ‘transcriptionalbursting’, and this mechanism has been broadly studied bytheoretical and experimental approaches. According to thetheoretical studies, transcriptional bursting can be explained bya two-state model of gene regulation, where a gene switchesbetween on and off states at constant rates (kon and koff) andmRNA is produced at a constant rate (kT) in the on-state5. Inexperimental studies, single-molecule fluorescence in situhybridization (FISH) data demonstrated the gene-nonspecifictrend between mean and a variety of mRNA distributions inindividual cells6,7. This gene-nonspecific trend in a bacterial cellhas been observed in many eukaryotic cells including mammaliancells8. However, there is no clear molecular model to explain thetranscriptional bursting in spite of advanced understanding of thekinetics in a cell. Recent studies of the molecular mechanismshave shown that supercoiling accumulation on a constrainedDNA9 and modulation of the promoter structure10 affect thekinetics of transcriptional bursting. These different modelssuggest a complicated mechanism intertwined with manytranscriptional regulatory factors in a cell.
Here we design a bottom-up approach to examine whethertranscriptional bursting requires such a complicated molecularmechanism. Our results show transcriptional bursting occurswith the minimum components of bacterial transcription,suggesting an intrinsic molecular mechanism of transcriptionalbursting. Based on the kinetic analysis, we propose thattranscriptional bursting is intrinsically caused by interplaybetween RNA polymerases (RNAPs) on DNA. Our analysis canquantitatively explain the gene-nonspecific kinetics previouslyobserved in noisy gene expression in vivo6.
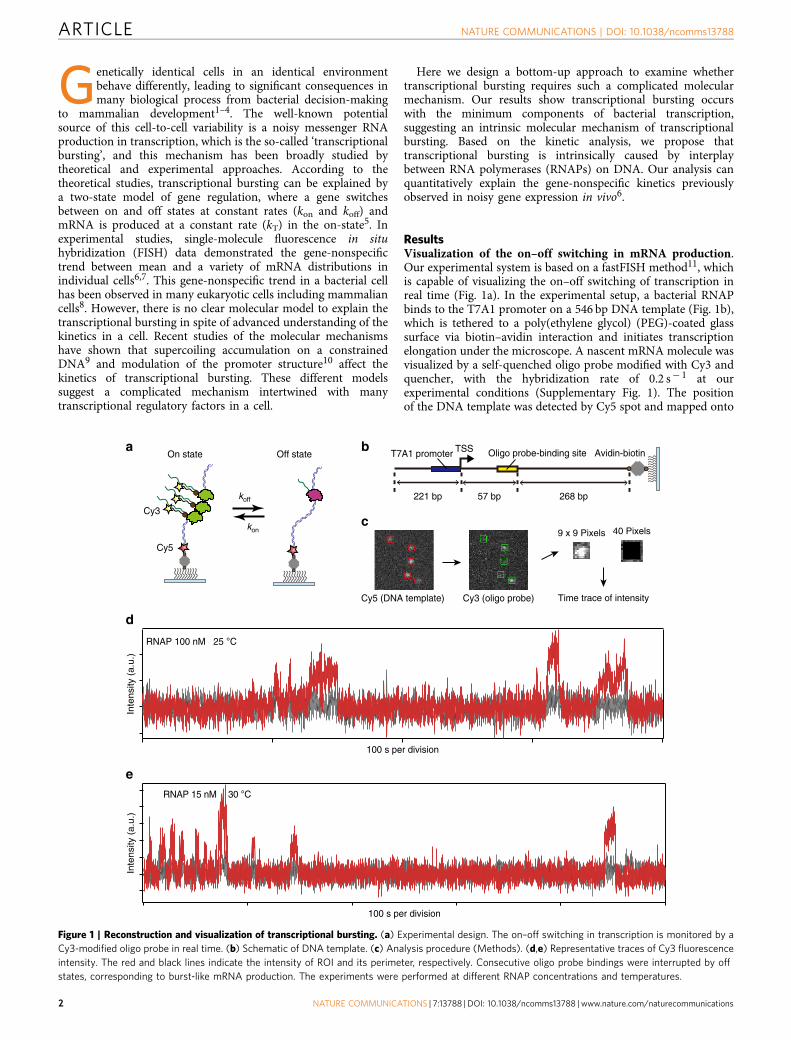
ResultsVisualization of the on–off switching in mRNA production.Our experimental system is based on a fastFISH method11, whichis capable of visualizing the on–off switching of transcription inreal time (Fig. 1a). In the experimental setup, a bacterial RNAPbinds to the T7A1 promoter on a 546 bp DNA template (Fig. 1b),which is tethered to a poly(ethylene glycol) (PEG)-coated glasssurface via biotin–avidin interaction and initiates transcriptionelongation under the microscope. A nascent mRNA molecule wasvisualized by a self-quenched oligo probe modified with Cy3 andquencher, with the hybridization rate of 0.2 s� 1 at ourexperimental conditions (Supplementary Fig. 1). The positionof the DNA template was detected by Cy5 spot and mapped onto
100 s per division
Inte
nsity
(a.
u.)
RNAP 15 nM
RNAP 100 nM 25 °C
T7A1 promoter Avidin-biotinTSS
57 bp
Oligo probe-binding site
268 bp221 bp
kon
koff
baOff stateOn state
Cy3 (oligo probe)Cy5 (DNA template) Time trace of intensity
40 Pixels9 x 9 Pixelsc
e
d
Inte
nsity
(a.
u.)
100 s per division
Cy5
Cy3
30 °C
Figure 1 | Reconstruction and visualization of transcriptional bursting. (a) Experimental design. The on–off switching in transcription is monitored by a
Cy3-modified oligo probe in real time. (b) Schematic of DNA template. (c) Analysis procedure (Methods). (d,e) Representative traces of Cy3 fluorescence
intensity. The red and black lines indicate the intensity of ROI and its perimeter, respectively. Consecutive oligo probe bindings were interrupted by off
states, corresponding to burst-like mRNA production. The experiments were performed at different RNAP concentrations and temperatures.
ARTICLE NATURE COMMUNICATIONS | DOI: 10.1038/ncomms13788
2 NATURE COMMUNICATIONS | 7:13788 | DOI: 10.1038/ncomms13788 | www.nature.com/naturecommunications
Cy3 channel (Fig. 1c). By calculating the background-correctedfluorescence intensity of Cy3 at the position of the DNA templatein each recording frame (Methods), we obtained time traces ofmRNA production at different RNAP concentrations andtemperatures. The experiments were performed at thenucleotide concentration of 100[NTP] (1 mM GTP and UTP,500mM ATP and 250 mM CTP), to correct for the biasedtranscription rate for each nucleotide species12. Surprisingly, thetime traces show burst-like mRNA production, suggesting off-states during transcription even in the simplest in vitrotranscription system (Fig. 1d,e).
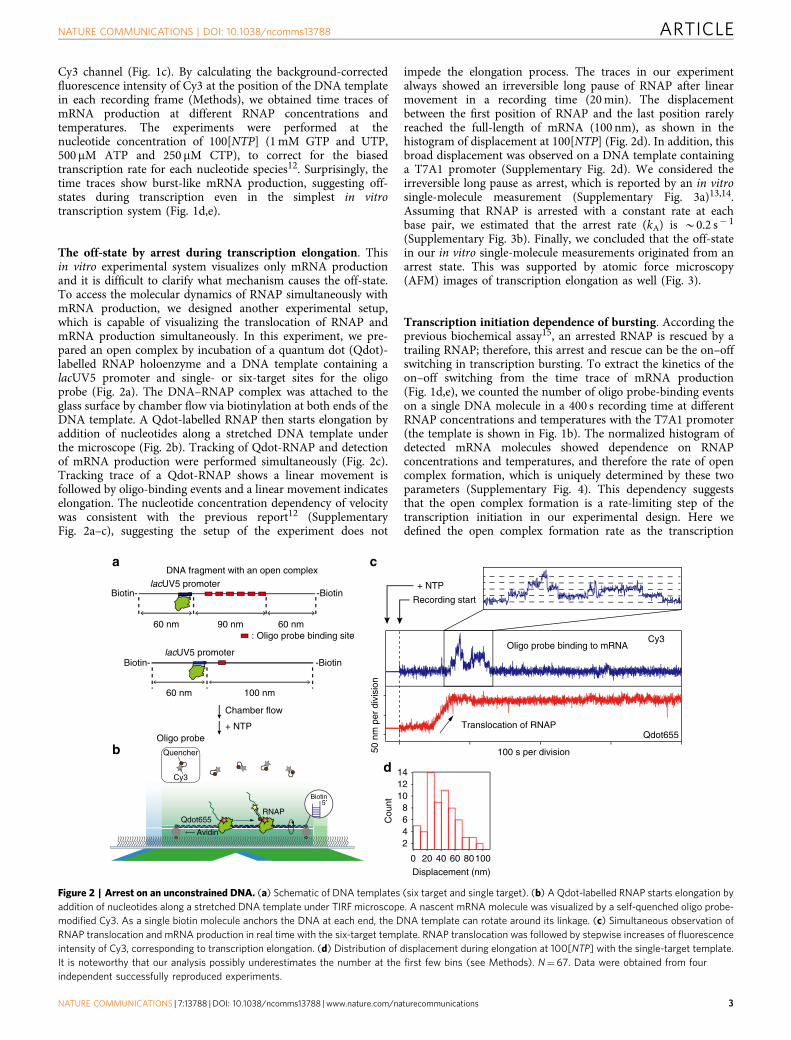
The off-state by arrest during transcription elongation. Thisin vitro experimental system visualizes only mRNA productionand it is difficult to clarify what mechanism causes the off-state.To access the molecular dynamics of RNAP simultaneously withmRNA production, we designed another experimental setup,which is capable of visualizing the translocation of RNAP andmRNA production simultaneously. In this experiment, we pre-pared an open complex by incubation of a quantum dot (Qdot)-labelled RNAP holoenzyme and a DNA template containing alacUV5 promoter and single- or six-target sites for the oligoprobe (Fig. 2a). The DNA–RNAP complex was attached to theglass surface by chamber flow via biotinylation at both ends of theDNA template. A Qdot-labelled RNAP then starts elongation byaddition of nucleotides along a stretched DNA template underthe microscope (Fig. 2b). Tracking of Qdot-RNAP and detectionof mRNA production were performed simultaneously (Fig. 2c).Tracking trace of a Qdot-RNAP shows a linear movement isfollowed by oligo-binding events and a linear movement indicateselongation. The nucleotide concentration dependency of velocitywas consistent with the previous report12 (SupplementaryFig. 2a–c), suggesting the setup of the experiment does not
impede the elongation process. The traces in our experimentalways showed an irreversible long pause of RNAP after linearmovement in a recording time (20 min). The displacementbetween the first position of RNAP and the last position rarelyreached the full-length of mRNA (100 nm), as shown in thehistogram of displacement at 100[NTP] (Fig. 2d). In addition, thisbroad displacement was observed on a DNA template containinga T7A1 promoter (Supplementary Fig. 2d). We considered theirreversible long pause as arrest, which is reported by an in vitrosingle-molecule measurement (Supplementary Fig. 3a)13,14.Assuming that RNAP is arrested with a constant rate at eachbase pair, we estimated that the arrest rate (kA) is B0.2 s� 1
(Supplementary Fig. 3b). Finally, we concluded that the off-statein our in vitro single-molecule measurements originated from anarrest state. This was supported by atomic force microscopy(AFM) images of transcription elongation as well (Fig. 3).
Transcription initiation dependence of bursting. According theprevious biochemical assay15, an arrested RNAP is rescued by atrailing RNAP; therefore, this arrest and rescue can be the on–offswitching in transcription bursting. To extract the kinetics of theon–off switching from the time trace of mRNA production(Fig. 1d,e), we counted the number of oligo probe-binding eventson a single DNA molecule in a 400 s recording time at differentRNAP concentrations and temperatures with the T7A1 promoter(the template is shown in Fig. 1b). The normalized histogram ofdetected mRNA molecules showed dependence on RNAPconcentrations and temperatures, and therefore the rate of opencomplex formation, which is uniquely determined by these twoparameters (Supplementary Fig. 4). This dependency suggeststhat the open complex formation is a rate-limiting step of thetranscription initiation in our experimental design. Here wedefined the open complex formation rate as the transcription
d
Displacement (nm)
Cou
nt
1412108642
100806040200
Biotin5′
Cy3
RNAPQdot655
Avidin
Oligo probe
Quencher 50 n
m p
er d
ivis
ion
Recording start
+ NTP
b
ca
Chamber flow
+ NTP
DNA fragment with an open complex
60 nm 100 nm
Biotin- -Biotin
: Oligo probe binding site60 nm60 nm 90 nm
lacUV5 promoter
lacUV5 promoter
Qdot655Translocation of RNAP
Biotin- -Biotin
100 s per division
Oligo probe binding to mRNACy3
Figure 2 | Arrest on an unconstrained DNA. (a) Schematic of DNA templates (six target and single target). (b) A Qdot-labelled RNAP starts elongation by
addition of nucleotides along a stretched DNA template under TIRF microscope. A nascent mRNA molecule was visualized by a self-quenched oligo probe-
modified Cy3. As a single biotin molecule anchors the DNA at each end, the DNA template can rotate around its linkage. (c) Simultaneous observation of
RNAP translocation and mRNA production in real time with the six-target template. RNAP translocation was followed by stepwise increases of fluorescence
intensity of Cy3, corresponding to transcription elongation. (d) Distribution of displacement during elongation at 100[NTP] with the single-target template.
It is noteworthy that our analysis possibly underestimates the number at the first few bins (see Methods). N¼67. Data were obtained from four
independent successfully reproduced experiments.
NATURE COMMUNICATIONS | DOI: 10.1038/ncomms13788 ARTICLE
NATURE COMMUNICATIONS | 7:13788 | DOI: 10.1038/ncomms13788 | www.nature.com/naturecommunications 3
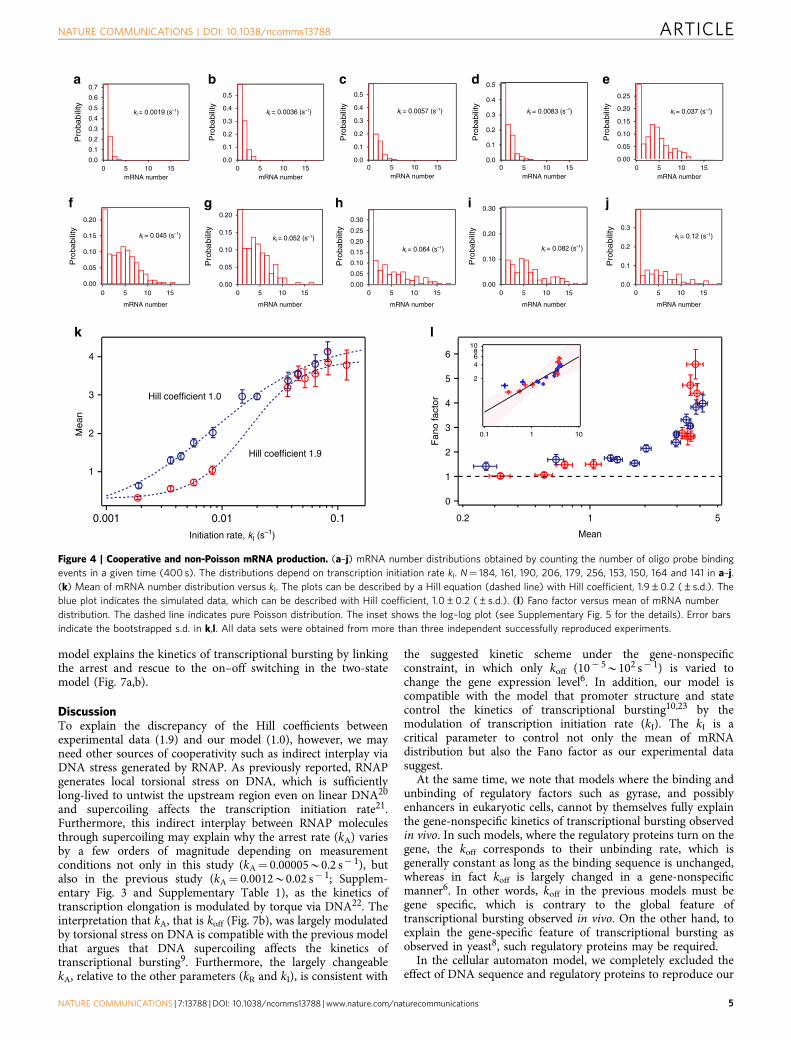
initiation rate. Figure 4a–j shows the histograms of detectedmRNA molecules at the different transcription initiation rates. Atlow initiation rates the histograms can be described by a Poissondistribution, whereas at high initiation rates the histogramsdeviate from a Poisson distribution. This deviation from aPoisson distribution is characterized by a zero peak and thisso-called ‘Poisson with zero spike’ distribution of mRNA copynumber is observed in vivo as well9. We evaluated the initiationrate dependency of the mean and the Fano factor (the ratiobetween the variance and the mean) for the distributions. TheFano factor indicates the deviation from a Poisson distributionand it equals 1 for a Poisson distribution. As the plots show(Fig. 4k,l), the mean increases with transcription initiation rateand the Fano factor increases with mean. An increase of the meanwith transcription initiation rate can be described by a Hillequation with coefficient 1.9±0.2 (±s.d.), suggestingcooperativity in transcription. Furthermore, in the relationshipbetween the Fano factor and mean, we found that the Fano factorchanges as the mean to the power 0.71±0.25 (±s.d.) (Fig. 4l andSupplementary Fig. 5), which is consistent with the mean to thepower 0.64 observed on single-molecule FISH data in vivo6. Thisconsistency supports the interpretation that the arrest and rescuecorrespond to the on–off switching in transcriptional burstingand underlie the gene-nonspecific constraint in transcriptionalbursting of bacteria, and possibly eukaryotic cells8.
Analysis of bursting by the cellular automaton model.To describe the trend between the mean and the Fano factorby the molecular dynamics of RNAP (arrest and rescue), weperformed a simulation based on a cellular automaton model(Fig. 5 and Supplementary Software 1)16,17. In the model, a DNA
template was represented by 325 boxes aligned in one dimensionfrom 30 (left)-end to 50 (right)-end, with the end of the oligo-binding site at box 57 (Fig. 1b) and where RNAP movesaccording to the following rules: RNAP moves unidirectionallyfrom left to right. When the space between two adjacent RNAPsis o15 boxes, the situation is regarded as a collision. The 15boxes were estimated by analogy of eukaryotic RNAP collision18,considering the smaller interaction between bacterial RNAP andDNA during elongation. If no collision occurs, RNAP moves tothe next box at a rate of kF/(kFþ kA) or RNAP enters an arreststate at a rate of kA/(kFþ kA). In this model, one simulation timeis consistent with 1/kF¼ 100 ms. Arrest state is rescued bypushing of a trailing RNAP (collision) at a rate of kR. WhenRNAP moves from the 71th and 72th box, the 57th box of thenascent mRNA is ‘exposed’ and the mRNA is ‘visualized’ andcounted (here we assumed that 14 boxes of the nascent mRNAare protected by RNAP19). RNAP appears in the first box at a rateof kI. The kA and kR in the model were decided by comparisonwith the mean and Fano factor of the experimental distribution atkI¼ 0.045 s� 1 (Fig. 4f and Supplementary Fig. 6). The trend wasreproduced when kA and kR were 0.05 and 0.003 s� 1, respectively(Fig. 4l and Supplementary Figs 6 and 7). On the other hand, inthe plot of mean and initiation rate, the simulated data wasdescribed with a Hill coefficient, 1.0±0.2 (±s.d.) and was notable to reproduce the cooperativity (Fig. 4k). Furthermore,we estimated that kA is 0.00005 s� 1 more than enough toreproduce transcriptional bursting in vivo based on the cellularautomaton model (Fig. 6 and Supplementary software 2) as kR isfixed at 0.003 s� 1, corresponding to kon¼ 0.003 s� 1 andkoff¼ 0.0004 s� 1 in the two-state model. These parameters arecomparable to the reported value in vivo6. Thus, our simple
DNA wrapping in the elongation complex
DNA
Clustered RNAPs
e
a
b c
T7A1 promoter +38 +1,217lacZ (1 – 1,179)
380 nm80 nm
d
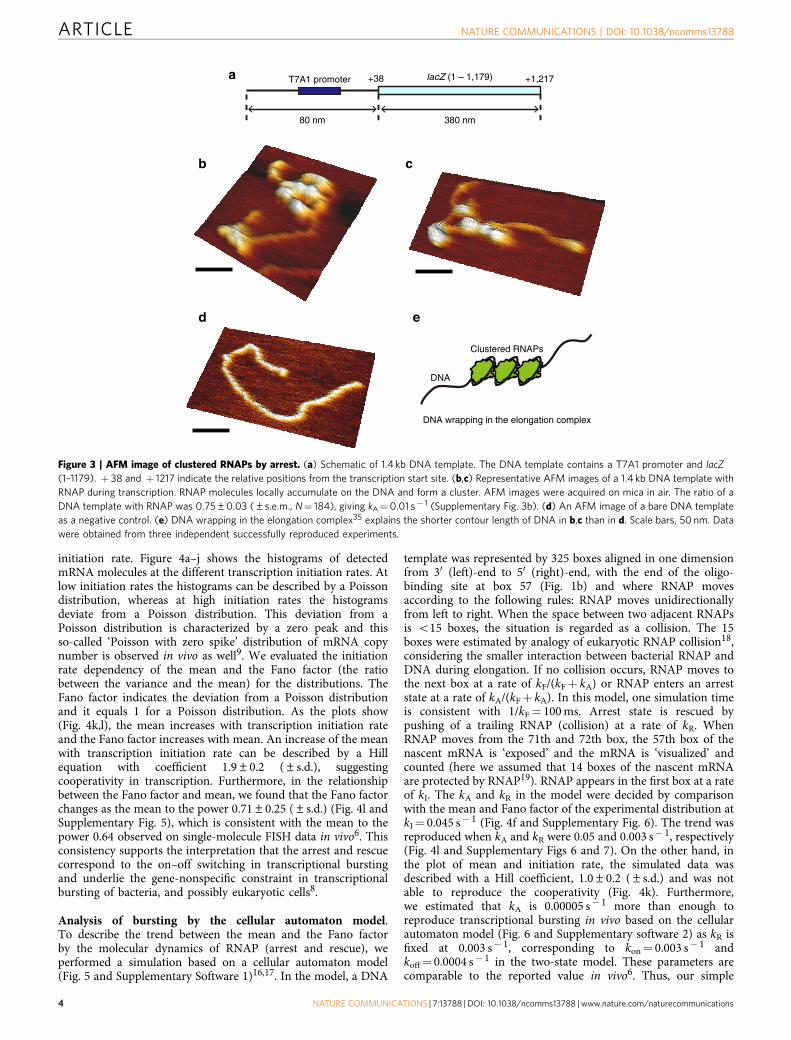
Figure 3 | AFM image of clustered RNAPs by arrest. (a) Schematic of 1.4 kb DNA template. The DNA template contains a T7A1 promoter and lacZ
(1–1179). þ 38 and þ 1217 indicate the relative positions from the transcription start site. (b,c) Representative AFM images of a 1.4 kb DNA template with
RNAP during transcription. RNAP molecules locally accumulate on the DNA and form a cluster. AFM images were acquired on mica in air. The ratio of a
DNA template with RNAP was 0.75±0.03 (±s.e.m., N¼ 184), giving kA¼0.01 s� 1 (Supplementary Fig. 3b). (d) An AFM image of a bare DNA template
as a negative control. (e) DNA wrapping in the elongation complex35 explains the shorter contour length of DNA in b,c than in d. Scale bars, 50 nm. Data
were obtained from three independent successfully reproduced experiments.
ARTICLE NATURE COMMUNICATIONS | DOI: 10.1038/ncomms13788
4 NATURE COMMUNICATIONS | 7:13788 | DOI: 10.1038/ncomms13788 | www.nature.com/naturecommunications
model explains the kinetics of transcriptional bursting by linkingthe arrest and rescue to the on–off switching in the two-statemodel (Fig. 7a,b).
DiscussionTo explain the discrepancy of the Hill coefficients betweenexperimental data (1.9) and our model (1.0), however, we mayneed other sources of cooperativity such as indirect interplay viaDNA stress generated by RNAP. As previously reported, RNAPgenerates local torsional stress on DNA, which is sufficientlylong-lived to untwist the upstream region even on linear DNA20
and supercoiling affects the transcription initiation rate21.Furthermore, this indirect interplay between RNAP moleculesthrough supercoiling may explain why the arrest rate (kA) variesby a few orders of magnitude depending on measurementconditions not only in this study (kA¼ 0.00005B0.2 s� 1), butalso in the previous study (kA¼ 0.0012B0.02 s� 1; Supplem-entary Fig. 3 and Supplementary Table 1), as the kinetics oftranscription elongation is modulated by torque via DNA22. Theinterpretation that kA, that is koff (Fig. 7b), was largely modulatedby torsional stress on DNA is compatible with the previous modelthat argues that DNA supercoiling affects the kinetics oftranscriptional bursting9. Furthermore, the largely changeablekA, relative to the other parameters (kR and kI), is consistent with
the suggested kinetic scheme under the gene-nonspecificconstraint, in which only koff (10� 5B102 s� 1) is varied tochange the gene expression level6. In addition, our model iscompatible with the model that promoter structure and statecontrol the kinetics of transcriptional bursting10,23 by themodulation of transcription initiation rate (kI). The kI is acritical parameter to control not only the mean of mRNAdistribution but also the Fano factor as our experimental datasuggest.
At the same time, we note that models where the binding andunbinding of regulatory factors such as gyrase, and possiblyenhancers in eukaryotic cells, cannot by themselves fully explainthe gene-nonspecific kinetics of transcriptional bursting observedin vivo. In such models, where the regulatory proteins turn on thegene, the koff corresponds to their unbinding rate, which isgenerally constant as long as the binding sequence is unchanged,whereas in fact koff is largely changed in a gene-nonspecificmanner6. In other words, koff in the previous models must begene specific, which is contrary to the global feature oftranscriptional bursting observed in vivo. On the other hand, toexplain the gene-specific feature of transcriptional bursting asobserved in yeast8, such regulatory proteins may be required.
In the cellular automaton model, we completely excluded theeffect of DNA sequence and regulatory proteins to reproduce our
Pro
babi
lity
Pro
babi
lity
Pro
babi
lity
Pro
babi
lity
kI = 0.0019 (s–1)
kI = 0.045 (s–1) kI = 0.052 (s–1)
kI = 0.064 (s–1) kI = 0.082 (s–1)
kI = 0.12 (s–1)
kI = 0.0083 (s–1) kI = 0.037 (s–1)kI = 0.0057 (s–1)kI = 0.0036 (s–1)
k
a0.7
0.6 0.5
0.4
0.3
0.2
0.1
0.0
0.5
0.4
0.3
0.2
0.1
0.0
0.25
0.20
0.15
0.10
0.05
0.00
0.5
0.4
0.3
0.2
0.1
0.0
0.5
0.4
0.3
0.2
0.1
0.0
0.00 0.00
0.05 0.05
0.10 0.10
0.15 0.15
0.20
0.0
0.1
0.2
0.3
0.00
0.10
0.30
0.20
0.00
0.05
0.10
0.15
0.20
0.25
0.300.20
0 05 510 10mRNA number
mRNA number mRNA number mRNA number mRNA number mRNA number
mRNA number mRNA number mRNA number mRNA number15
0 5 10 15 0 5 10 15 0 5 10 15 0 5 10 15 0 5 10 15
0 5 10 15 0 5 10 15 0 5 10 1515
b c d e
f g h i j
l
Mea
n
Initiation rate, kI (s–1)
Hill coefficient 1.0
Hill coefficient 1.9
Mean
Fan
o fa
ctor
Pro
babi
lity
Pro
babi
lity
Pro
babi
lity
Pro
babi
lity
Pro
babi
lity
Pro
babi
lity
6
5
4
3
2
1
0
0.2 1 5
10864
2
0.1 1 10
4
3
2
1
0.001 0.01 0.1
Figure 4 | Cooperative and non-Poisson mRNA production. (a–j) mRNA number distributions obtained by counting the number of oligo probe binding
events in a given time (400 s). The distributions depend on transcription initiation rate kI. N¼ 184, 161, 190, 206, 179, 256, 153, 150, 164 and 141 in a–j.
(k) Mean of mRNA number distribution versus kI. The plots can be described by a Hill equation (dashed line) with Hill coefficient, 1.9±0.2 (±s.d.). The
blue plot indicates the simulated data, which can be described with Hill coefficient, 1.0±0.2 (±s.d.). (l) Fano factor versus mean of mRNA number
distribution. The dashed line indicates pure Poisson distribution. The inset shows the log–log plot (see Supplementary Fig. 5 for the details). Error bars
indicate the bootstrapped s.d. in k,l. All data sets were obtained from more than three independent successfully reproduced experiments.
NATURE COMMUNICATIONS | DOI: 10.1038/ncomms13788 ARTICLE
NATURE COMMUNICATIONS | 7:13788 | DOI: 10.1038/ncomms13788 | www.nature.com/naturecommunications 5

a
b c d
Number of mRNA
Pro
babi
lity
Number of mRNA
Pro
babi
lity
kA= 0.05 (s–1) (if not pushed)
kR= 0.003 (s–1) (if pushed)
kF= 10 (s–1) (fixed)
711 72 326
kI
kRDetection
Pushing Detach
Transcription initiation
kFn n+1
kAkR
ArrestkI= 0.082 (s–1)kI= 0.045 (s–1)
0.25
0.20
0.15
0.10
0.05
0.00151050
0.200.150.100.050.00
151050
0.30
0.20
0.10
0.00151050
0.30
0.25
0.20
0.15
0.10
0.05
0.00151050
15
Figure 5 | A stochastic cellular automaton model of transcription. (a,b) Schematic of a stochastic cellular automaton model. A DNA template was
represented by 325 boxes aligned in one dimension from 30 (left) end to 50 (right) end. RNAP represented by a ball, moves according to the rule as follows:
RNAP moves unidirectionally from left to right. When the space between two adjacent RNAPs is o15 boxes, the situation is regarded as a collision. If no
collision occurs, RNAP moves to the next box at a rate of kF/(kFþ kA) or RNAP enters an arrest state (red ball) at a rate of kA/(kFþ kA). In this model, one
simulation time is consistent with 1/kF¼ 100 ms. Arrest state is rescued by pushing of a trailing RNAP (collision) at a rate of kR. According to the actual
DNA template (Fig. 1b), when RNAP moves from the 71th and 72th box, the nascent mRNA is ‘visualized’ and counted. RNAP appears in the first box at a
rate of kI. (c,d) mRNA number distributions obtained by the number of counted mRNAs in 400 s. N¼ 1,250 for c and N¼ 250 for d. For comparison, the
inset shows the experimental data corresponding to the same value of kI.
koff= 0.0004 (s–1)
koff= 0.0004 (s–1)
kon= 0.003 (s–1)
kon= 0.003 (s–1)
kA= 0
kI= 0.2 (s–1)kD= 0.016 (s–1)
kA= 0.00005 (s–1)
kA= 0
kA= 0.00005 (s–1)
kR= 0.003 (s–1)
2,000 s per division
mR
NA
cop
y nu
mbe
r
2,000 s per division
mR
NA
cop
y nu
mbe
r
mRNA copy number
Pro
babi
lity
mRNA copy number
Pro
babi
lity
On time (s)Off time (s)
Cum
ulat
ive
prob
abili
ty
Cum
ulat
ive
prob
abili
ty
a f g
b
c
d
e
1 1,600kD
mRNA DegradationTranscription initiation Pushing
Off On
20
15
10
5
0
40
30
20
10
0
1.0
0.8
0.6
0.4
0.2
0.01,5001,0005000
1.0
0.8
0.6
0.4
0.2
0.06,0004,0002,0000
0.12
0.10
0.08
0.06
0.04
0.02
0.0020151050
0.14
0.12
0.10
0.08
0.06
0.04
0.02
0.0020151050
Figure 6 | Transcriptional bursting caused by arrest and its rescue. (a) A stochastic cellular automaton model with mRNA degradation. The length is
1,600 boxes, which is the average length of an operon in E. coli36. When RNAP moves to the last box, mRNA is produced. mRNA is degraded at the rate of
kD (0.016 s� 1 corresponding to a lifetime of 1 min). Except for the above, the rules are the same as Fig. 5. (b,c) Simulated mRNA copy number probability
distribution. Distributions can be described by a Poisson distribution (blue line) in b and without the first five bins in c. The bins above 25 (4%) are not
shown for simplicity in c. N¼98,398 in b and N¼ 1,998,379 in c, corresponding to the simulation time. (d,e) Simulated time trace of mRNA copy number.
Even at a low arrest rate (kAB0.00005 s� 1), the trace shows a stochastic switching between on state (the number of mRNA40) and off state (the
number of mRNA¼0). (f,g) Cumulative frequency of dwell time for the on and off state in c. Dwell times were fit to a single exponential function. The
calculated parameters, kon and koff are 0.0029±0.00002 s� 1 and 0.00044±0.00001 s� 1 (±s.d.), respectively.
ARTICLE NATURE COMMUNICATIONS | DOI: 10.1038/ncomms13788
6 NATURE COMMUNICATIONS | 7:13788 | DOI: 10.1038/ncomms13788 | www.nature.com/naturecommunications

in vitro data, especially the trend between Fano factor and mean.However, we cannot fully rule out such effects by our in vitroexperiments alone. Specifically, the sequence dependence of arrestrate during elongation was not fully examined, because ourin vitro experiment (Fig. 2) does not have sufficient spatialresolution to discuss the arrest position in the context ofsequence. However, the quantitative consistency between oursimulated and experimental data, and between our in vitro dataand the previous in vivo data (Fig. 4l and Supplementary Fig. 5)suggests that the arrest–rescue process intrinsic to RNAP andDNA is the dominant source of transcriptional bursting inbacteria.
Our model argues that, although DNA supercoiling andpromoter state modulate the kinetics of transcriptional burstingthrough kA and kI, interplay between RNAP molecules under-lies the gene-nonspecific constraint (Fig. 7c). This mechanismmay seem too simple to explain the molecular mechanism of
transcriptional bursting and its gene-nonspecific feature ineukaryotic cells in addition to bacteria. Although transcriptionis a complicated system intertwined with many regulatoryfactors, especially in eukaryotic cells, we note that the multi-subunit RNAPs such as RNAP, which play the central role intranscription of all organisms, are highly conserved and,presumably, the regulation of the elongation process wasachieved earlier in evolution than the initiation process24.Furthermore, a recent study suggested that gene regulationevolved, because it increases gene expression noise and benefitsan organism as a result25. We believe that becausetranscriptional bursting (gene expression noise), which leadsto cell-to-cell variability, benefits an organism withoutregulation of initiation, it is plausible that our model is themost evolutionarily primitive mechanism associated withelongation that is responsible for the gene-nonspecific kineticsseen in contemporary organisms.
Arrest
Rescue
PushingkR
ArrestkF
n n+1
kA = 0.00005 – 0.2 (s–1)(associated with koff)
kR (~kon) = 0.003 (s–1)
koff = 10–5~102 (s–1)
kon = 10–3~10–2 (s–1)
kT = 0.2 (s–1)
kD = 0.006 – 0.019 (s–1)
kR
kA
Elongation
Off statekT
kon
koff
On state mRNAkD
φ
Arrest
Off state
On state
Transcriptional bursting
kI
kF
RescuekR (~kon)
kA (associated with koff)
Off time On timeOn time
c
a
b
Figure 7 | Arrest-pushing model for transcriptional bursting. (a) Two-state model of transcription. The relevant kinetic parameters were calculated from
the data of an single-molecule FISH (smFISH) experiment in bacteria6. (b) Two-state model based on single-molecule kinetics of RNAP. Arrested RNAP is
rescued by pushing from a trailing RNAP corresponding to on–off switching in the two state model. (c) The gene-nonspecific constraint in transcriptional
bursting of bacteria. DNA supercoiling and promoter structure modulate the kinetics of transcriptional bursting via transcription arrest rate (kA) and
initiation rate (kI), respectively.
NATURE COMMUNICATIONS | DOI: 10.1038/ncomms13788 ARTICLE
NATURE COMMUNICATIONS | 7:13788 | DOI: 10.1038/ncomms13788 | www.nature.com/naturecommunications 7

MethodsDNA constructs. In kinetic measurements by fastFISH (Figs 1 and 4), we used thefollowing sequence as a 546 bp DNA template containing a single-target site of theoligo probe.
50-CCACAACGGTTTCCCTCTAGAAATAATTTTGTTTAACTTTAAGAAGGAGATATACATAaaagacgccttgttgttagccataaagtgataacctttaatcattgtctttattaatacaactcactataaggagagacaacttaaagagacttaaaagattaatttaaaatttatcaaaaagagtattgacttaaagtctaacctataggatacttacagccatcgagagggacacggcgaatagccatcccaatcgacaCCCTATCCCTTATCTTAACCACTCCAATTACATACACCTTTCAAAACTTCAAACTTCAAACTTCAAACTTCAAACTTCAAACTTCAAACTTCAAACTTCAAACTTCAAACTTCAAACCACCGTTGATATATCCCAATGGCTGCATTTCAAAACTTCAAACTTCAAACTTCAAACTTCAAACTTCAAACTTCAAACTTCAAACTTCAAACTTCAAACTTCAAACTGCAGCTGGATATTACGGCCTTTTTAAAGACCGTAAAGAAAAATAAGCACAAGTTTTATCCGGC-30-(Bio).
In the above sequence, lower case letters indicate the T7A1 promoter region(� 163 to þ 38 from the transcription start site represented by the bold typed a).An underline indicates the oligo probe-binding site. The template sequence fromthe oligo probe-binding site to the 30-end (downstream region) is the same as in theoriginal report11. The self-quenched oligo probe is 50-/Cy3/GTTAAGATAAGGGATAGGG/RQ/-30 (synthesized by Integrated DNATechnologies, Coralville, IA). RQ indicates Iowa Black RQ. To construct s templateDNA fragment, we inserted the extended promoter region and the downstreamregion between the NdeI and HindIII sites in pT7-7. The DNA templates wereprepared by PCR from the plasmid with
50-CCACAACGGTTTCCCTCTAG-30 and50-/5Bio/G/Cy5/CCGGATAAAACTTGTGC-30 (synthesized by Integrated
DNA Technologies).See Supplementary Fig. 8a,b for the structures of the modifications.In the Qdot tracking experiment with fastFISH (Fig. 2), we used the two kinds
of DNA template containing six-target sites and single-target of the oligo probe.Six-target template (641 bp): 50-CCACAACGGTTTCCCTCTAGAAATAAT
TTTGTTTAACTTTAAGAAGGAGATATACATAtaatgcagctggcacgacaggtttctatgcttccggctcgtataatgtgtggaattgtgagcggataacaatttcacacaggaaacagctatggaccgcaagcttCCCTATCCCTTATCTTAACCACTCCAATTACATACACCCCCTATCCCTTATCTTAACCACTCCAATTACATACACCCCCTATCCCTTATCTTAACCACTCCAATTACATACACCCCCTATCCCTTATCTTAACCACTCCAATTACATACACCCCCTATCCCTTATCTTAACCACTCCAATTACATACACCAGCTTCCCTATCCCTTATCTTAACCACTCCAATTACATACACCTTTCAAAACTTCAAACTTCAAACTTCAAACTTCAAACTTCAAACTTCAAACTTCAAACTTCAAACTTCAAACTTCAAACCACCGTTGATATATCCCAATGGCTGCAGCTG GATATTACGGCCTTTTTAAAGACCGTAAAGAAAAATAAGCACAAGTTTTATCCGGC-30 .
In the above sequence, lower case letters indicate the lacUV5 promoter region(� 131 to þ 53 from the transcription start site represented by the bold typed a).Six underlines indicate the oligo probe-binding sites.
Single-target template (517 bp):50-CCACAACGGTTTCCCTCTAGAAATAATTTTGTTTAACTTTAA
GAAGGAGATATACATAtaatgcagctggcacgacaggtttcccgactggaaagcgggcagtgagcgcaacgcaattaatgtgagttagctcactcattaggcaccccaggctttacactttatgcttccggctcgtataatgtgtggaattgtgagcggataacaatttcacacaggaaacagctatgCCCTATCCCTTATCTTAACCACTCCAATTACATACACCTTTCAAAACTTCAAACTTCAAACTTCAAACTTCAAACTTCAAACTTCAAACTTCAAACTTCAAACTTCAAACTTCAAACCACCGTTGATATATCCCAATGGCTGCATTTCAAAACTTCAAACTTCAAACTTCAAACTTCAAACTTCAAACTTCAAACTTCAAACTTCAAACTTCAAACTTCAAACTGCAGCTGGATATTACGGCCTTTTTAAAGACCGTAAAGAAAAATAAGCACAAGTTTTATCCGGC-30
In the above sequence, lower case letters indicate the lacUV5 promoter region(� 131 to þ 41 from the transcription start site represented by the bold typed a).Single underline indicates the oligo probe-binding sites. We prepared the templatesfor biotinylation at the both ends by PCR with
50-/5Bio/CCACAACGGTTTCCCTCTAG-30 and50-/5Bio/GCCGGATAAAACTTGTGC-30 .See Supplementary Fig. 8c for the structure of the biotin modification.In AFM imaging (Fig. 3), we used a 1.4 kb DNA template containing a T7A1
promoter and lacZ (1-1179 when 1 indicates the first nucleotide of the gene)(Fig. 3a). The upstream region from lacZ is the same as the DNA template infastFISH experiment. We prepared the templates by PCR with
50-CCACAACGGTTTCCCTCTAG-30 and50-ATAATGCGAACAGCGCAC-30 .PCR-amplified DNA fragments were purified by Wizard PCR Preps DNA
Purification System (Promega). The sequence of the DNA template region inplasmids was verified by sequencing. Except as otherwise noted, the primers weresynthesized by Hokkaido System Science Co., Ltd, Japan.
Protein expression and purification. For the fastFISH and AFM imagingexperiment, we used Escherichia coli RNAP holoenzyme purchased from NewEngland Biolabs. For the Qdot-tracking experiment, we designed the plasmid forco-overexpression of tagged E. coli RNAP subunits26. To construct the plasmid, weinserted the tandem genes of rpoA-rpoB-rpoC-rpoZ between the NdeI and HindIIIsites in pT7-7 by In-Fusion Cloning Kit (Clontech). The genes were provided by
NBRP-E. coli at NIG (National Institute of Genetics, Japan). HaloTag(DHA, Promega) and His-tag fragments were attached to the 30-end of rpoC.The Plasmid was transformed into BL21 lDE3. A single colony was inoculated into1 litre of Luria-Bertani liquid medium (LB) containing 100 mg ml� 1 ampicillin at37 �C until OD600 reached 0.3–0.5. The protein production was induced by theaddition of isopropyl-b-D-thiogalactoside to 0.2 mM and cells were grownovernight at 23 �C. Cells were collected by centrifugation (5 min, 5,800 g, 4 �C),rinsed with PBS and stored at � 80 �C. To proceed with protein purification,pellets were resuspended in 80 ml lysis buffer (40 mM Tris-Cl pH 8.0, 100 mMNaCl, 10 mM EDTA and 15 mM 2-mercaptoethanol) and protease inhibitor(Roche) was added. Cells were disrupted by sonication, cleared by centrifugation(30 min, 15,300 g, 4 �C) and filtrated by the 0.22 mm syringe filter (Millipore). Theprotein was purified by using 5 ml HiTrap Heparin HP, 5 ml HisTrap HP andMono Q 5/50 GL, all purchased from GE Healthcare27. Briefly, the cleared lysatewas loaded on a 5 ml Heparin column equilibrated in buffer A (40 mM Tris-Cl pH8.0, 1 mmM EDTA, 5% glycerol and 1 mM 2-mercaptoethanol) containing 100 mMNaCl. The column was washed with buffer A containing 300 mM NaCl and elutedwith buffer A containing 600 mM NaCl. The buffer of the elutant was changed tobuffer B (20 mM Tris-Cl pH 8.0 and 500 mM NaCl) containing 5 mM Imidazole by5 ml HiTrap Desalting (GE Healthcare). The sample was loaded onto 5 ml HisTrapHP, washed with buffer B containing 20 mM Imidazole and eluted by buffer Bcontaining 100 mM Imidazole. The buffer of the elutant was changed to buffer Acontaining 50 mM NaCl by 5 ml HiTrap Desalting. The sample was loaded ontoMono Q 5/50 GL and eluted by buffer A with 0.05–1 M NaCl gradient. The bufferof the eluted RNAP core enzyme was changed to storage buffer (40 mM Tris-Cl pH8.0, 100 mM NaCl, 0.1 mM EDTA, 50% glycerol and 1 mM dithiothreitol) througha 100 kDa MWCO filter (Amicon Ultra, Millipore) and stored at � 80 �C. TherpoD (s70) gene was inserted in pT7-7 with amino terminus His tag. The Plasmidwas transformed into BL21 lDE3. Cells were collected and disrupted as describedabove. The protein was purified by using TALON Metal Affinity Resin (Clontech)according to the product manual. The buffer of the eluted s70 was changed to thestorage buffer through a 50 kDa MWCO filter (Amicon Ultra, Millipore) andstored at � 80 �C.
Single-molecule microscopy. The fluorescent images were recorded by anOlympus IX71 inverted microscope. In the fastFISH experiment, illumination wasprovided by 532 and 640 nm laser light (Coherent). The lasers were combined intoone fibre output by OBIS Galaxy (Coherent). The laser light was expanded to adiameter of 8 mm and focused by a 400 mm focal-length lens into the back focalplane of the objective (Olympus, � 60, numerical aperture¼ 1.49, oil). Thefluorescent photons were collected with a electron-multiplying charge-coupleddevice (CCD) camera (Andor, DV887ECS-BV). The effective pixel size was 74 nm.The laser was steered by a piezo mirror (Physik Instrumente) and reflectedby a dichroic mirror (FF01-577/690-25, Semrock) just below the objective lens.A dual-view apparatus (Hamamatsu Photonics) equipped with dichroic mirrors(Asahi Spectra) and emission filters (FF01-562/40-25, Semrock) was put in theCy3 channel. In the Qdot-imaging experiment with fastFISH, illumination wasprovided by 488 and 532 nm laser light (Coherent). Other optics were the same asdescribed above. To maintain the temperature in the chamber, we warmed theobjective by a lens heater (TP-LH, Tokai Hit Co., Ltd, Japan).
Single-molecule assay. The fluorescence imaging experiments were performedinside a sample chamber assembled with a PEG-coated glass. The PEG-coated glasswas prepared as follows. Coverslips were cleaned by low-pressure plasma for 5 minwith a plasma system (Zepto, Diener Electronic, Germany). The coverslips werethen placed into a freshly prepared 3% solution of N-2-(aminoethyl)-3-amino-propyl-trimethoxysilane (KBM-603, Shin-Etsu Chemical, Japan) in acetone for45 min with gentle shaking. The amine-modified coverslips were then rinsed withMilliQ and dried by an air blower. A 20 ml drops of 200 mg ml� 1 PEG mixturesolution (NHS-PEG-biotin and NHS-PEG were mixed at the ratio of 1:200 anddissolved in 0.45 M K2SO4 and 0.1 M NaHCO3 pH 9.0) was squeezed between twocoverslips and incubated for 30 min at 30 �C. The NHS-PEG-biotin (SUNBRIGHTBI-050TS, molecular weight¼ 5,000 Da) and NHS-PEG (SUNBRIGHT ME-50HS,molecular weight¼ 5,000 Da) were purchased from NOF Corporation, Japan28.PEG-coated coverslips were rinsed with MilliQ and dried by an air blower. To capunreacted amine groups, the PEG-coated coverslips were squeezed with a 20 mldrop of Sulfo-NHS-Acetate solution (5 mg Sulfo-NHS-Acetate (Pierce) dissolved in120 ml of 0.1 M NaHCO3) for 10 min at room temperature11. The amine-cappedcoverslips were rinsed with MilliQ, dried by an air blower andstored at –80 �C under dry conditions. The sample chamber was assembled bysandwiching two pieces of double-sided tape between a non-treated coverslip and aPEG-coated coverslip.
All in vitro transcription assays were performed in transcription buffer(50 mM Tris-HCl pH 8.0, 100 mM KCl, 8 mM MgCl2 and 0.1 mM EDTA) at thenucleotide concentration of 100[NTP] (1 mM GTP and UTP, 500 mM ATP and250 mM CTP) to correct for the biased transcription rate for nucleotide species12.To tether a DNA to the biotinylated PEG glass surface, 50 mg ml� 1 avidin solutionwas added into a sample chamber and incubated for 3 min. After washing thechamber by transcription buffer, 1–2 nM DNA template was added and washedagain by transcription buffer. In fastFISH experiment (Figs 1 and 4), single-
ARTICLE NATURE COMMUNICATIONS | DOI: 10.1038/ncomms13788
8 NATURE COMMUNICATIONS | 7:13788 | DOI: 10.1038/ncomms13788 | www.nature.com/naturecommunications

molecule observations were performed at 25±0.5 �C or 30±0.5 �C in transcriptionbuffer containing 1 mM Trolox, 0.05% Tween, NTP and an oxygen scavengersystem (0.11 mg ml� 1 glucose oxidase, 18 mg ml� 1 catalase and 2.3 mg ml� 1
glucose). The fastFISH experiment was performed in 50 nM self-quenched oligoprobe, in which a hybridization rate is 0.2 s� 1 at 25 �C (Supplementary Fig. 1).In Qdot-tracking experiment with fastFISH (Fig. 2), a DNA template containing alacUV5 or T7A1 promoter was incubated with a Qdot-labelled RNAP and sigma70, to form an open complex in a test tube. Observations were performed at25±0.5 �C in transcription buffer containing 0.05% Tween, NTP and an oxygenscavenger system (0.11 mg ml� 1 glucose oxidase, 18 mg ml� 1 catalase,2.3 mg ml� 1 glucose and and 0.5% 2-mercaptoethanol). All single-moleculeobservations were performed within 30 min. At least, the data within 30 minhave shown no time dependency.
AFM imaging. AFM images were acquired on mica in air. The mica was pretreatedby incubation of 10 mM MgCl2 for 5 min. The mica was then rinsed with MilliQand dried by an air blower. Before acquisition of AFM images, in vitro transcriptionwas performed at the concentration of 10–20 nM DNA and 100 nM RNAP intranscription buffer for 30 min at room temperature. The reaction solution wasdiluted to 1–2 nM DNA in 100[NTP] deposition buffer (20 mM HEPES-KOHpH 7.8, 40 mM KCl, 10 mM MgCl2 and 1 mM 2-mercaptoethanol) and added tofreshly cleaved mica. After incubation for 2 min, the mica was rinsed with MilliQand dried by an air blower. AFM imaging was performed with a NanoWizard 3(JPK Instruments, Germany) operating in AC mode. Silicon cantilevers(OMCL-AC160TS) were purchased from Olympus. Images of 512� 512 pixelswere acquired with a scan size of o3 mm at a scan rate of two lines per second.
Data analysis. Images of 512� 512 pixels were acquired by commercial software(Andor, SOLIS Software) at 10 Hz acquisition rate. In the fastFISH experiment, thepositions of Cy5-labelled DNA and Qdot-labelled RNAP were decided by using atwo-dimensional Gaussian distribution fitting29 or radial symmetry-based particlelocalization30. The positions of DNA or RNAP were mapped onto Cy3 channelby the single-molecule high-resolution colocalization (SHREC) method31–33. In thesingle-molecule high-resolution colocalization (SHREC) method, before theexperiment, fluorescent beads (Ultra Rainbow Fluorescent particles, 0.2 mm,Spherotech) were immobilized onto the glass surface and imaged by a electron-multiplying CCD camera through the Cy3 and Cy5 channels of the dual-viewapparatus. The positions of the images on the camera were decided and a gridpattern of the paired positions was obtained by moving the bead using a piezo stage(Physik Instrumente). The ‘cp2tform’ command of MATLAB (MathWorks)produces a transformation structure by using the grid pattern. The ‘tforminv’command of MATLAB maps the positions of Cy5 onto the Cy3 channel by usingthe transformation structure. To acquire the fluorescent intensity time course ofoligo probe at the decided position, the averaged intensity of a 9� 9 pixels regionof interest (ROI) was calculated in each frame. For background correction, theaveraged intensity of perimeter around the ROI was calculated and subtractedfrom the averaged intensity of the ROI34. The above data processing was performedwith a laboratory-written programme in MATLAB. To obtain mRNA numberdistributions in Fig. 4a–j, the number of mRNA detections in 400 s was counted.The sample sizes in Fig. 4a–j and Supplementary Fig. 7 were evaluated for sufficientsize based on the error bars in Fig. 4k,l. The judgement of signal and noise is finallybased on visual inspection after defining the threshold (more than two timesthe s.d. of the background noise) in each time trace. We excluded traces showingunclear or multistep changes of fluorescence intensity in the analysis, because thesetraces do not monitor single-molecule events. In the Qdot-tracking experiment,the stage drift was corrected by tracking Qdots nonspecifically binding to theglass surface. The Qdots binding to the surface nonspecifically were distinguishedbased on an identity of the trace. The trace of stage drift was calculated byaveraging traces of at least three nonspecifically bound Qdots. Theseanalyses were performed with a laboratory-written programme in LabVIEW(National Instruments). As we excluded traces of nonspecifically binding Qdotfrom the analysis based on visual inspection, we cannot rule out the possibility thatour analysis missed the traces of active Qdot-labelled RNAPs, which are arrested atthe region adjacent to the promoter (o20 nm).
Fitting by a Hill equation. The plots in Fig. 4k were fit to the following equation,
m ¼ mmin þ mmax �mminð Þ= 1þ khalf
kI
� �n� �ð1Þ
Here, m is the mean of mRNA number distribution, mmin and mmax are itsminimum and maximum, respectively, kI is transcription initiation rate, khalf isthe rate when m equals (mmax�mmin)/2 and n is the Hill coefficient.
The experimental data (red plot in Fig. 4k) were fit with mmin¼ 0.3±0.1,mmax¼ 3.9±0.1, khalf¼ 0.017±0.002 and n ¼ 1.9±0.2. The simulated data(blue plot in Fig. 4k) were fit with mmin¼ � 0.14±0.27, mmax¼ 4.4±0.3,khalf¼ 0.0086±0.0012 and n ¼ 1.0±0.2 (±s.d.).
Data availability. The data that support the findings of this study are availablefrom K.F. on request.
References1. Raj, A. & van Oudenaarden, A. Nature, nurture, or chance: stochastic gene
expression and its consequences. Cell 135, 216–226 (2008).2. Eldar, A. & Elowitz, M. B. Functional roles for noise in genetic circuits. Nature
467, 167–173 (2010).3. Golding, I. Decision making in living cells: lessons from a simple system.
Annu. Rev. Biophys. 40, 63–80 (2011).4. Li, G. W. & Xie, X. S. Central dogma at the single-molecule level in living cells.
Nature 475, 308–315 (2011).5. Munsky, B., Neuert, G. & van Oudenaarden, A. Using gene expression noise to
understand gene regulation. Science 336, 183–187 (2012).6. So, L. H. et al. General properties of transcriptional time series in Escherichia
coli. Nat. Genet. 43, 554–560 (2011).7. Taniguchi, Y. et al. Quantifying E. coli proteome and transcriptome with single-
molecule sensitivity in single cells. Science 329, 533–538 (2010).8. Sanchez, A. & Golding, I. Genetic determinants and cellular constraints in
noisy gene expression. Science 342, 1188–1193 (2013).9. Chong, S., Chen, C., Ge, H. & Xie, X. S. Mechanism of transcriptional bursting
in bacteria. Cell 158, 314–326 (2014).10. Jones, D. L., Brewster, R. C. & Phillips, R. Promoter architecture dictates cell-to-
cell variability in gene expression. Science 346, 1533–1536 (2014).11. Zhang, Z., Revyakin, A., Grimm, J. B., Lavis, L. D. & Tjian, R. Single-molecule
tracking of the transcription cycle by sub-second RNA detection. Elife 3, e01775(2014).
12. Abbondanzieri, E. A., Greenleaf, W. J., Shaevitz, J. W., Landick, R. & Block, S. M.Direct observation of base-pair stepping by RNA polymerase. Nature 438,460–465 (2005).
13. Davenport, R. J., Wuite, G. J., Landick, R. & Bustamante, C. Single-moleculestudy of transcriptional pausing and arrest by E. coli RNA polymerase. Science287, 2497–2500 (2000).
14. Forde, N. R., Izhaky, D., Woodcock, G. R., Wuite, G. J. & Bustamante, C.Using mechanical force to probe the mechanism of pausing and arrest duringcontinuous elongation by Escherichia coli RNA polymerase. Proc. Natl Acad.Sci. USA 99, 11682–11687 (2002).
15. Epshtein, V. & Nudler, E. Cooperation between RNA polymerase molecules intranscription elongation. Science 300, 801–805 (2003).
16. Ohta, Y., Kodama, T. & Ihara, S. Cellular-automaton model of the cooperativedynamics of RNA polymerase II during transcription in human cells. Phys. Rev.E 84, 041922 (2011).
17. Wolfram, S. A New Kind of Science (Wolfram Media, Inc, Champaign, IL,2002).
18. Saeki, H. & Svejstrup, J. Q. Stability, flexibility, and dynamic interactions ofcolliding RNA polymerase II elongation complexes. Mol. Cell 35, 191–205(2009).
19. Korzheva, N. et al. A structural model of transcription elongation. Science 289,619–625 (2000).
20. Kouzine, F., Liu, J., Sanford, S., Chung, H. J. & Levens, D. The dynamicresponse of upstream DNA to transcription-generated torsional stress.Nat. Struct. Mol. Biol. 11, 1092–1100 (2004).
21. Revyakin, A., Ebright, R. H. & Strick, T. R. Promoter unwinding and promoterclearance by RNA polymerase: detection by single-molecule DNAnanomanipulation. Proc. Natl Acad. Sci. USA 101, 4776–4780 (2004).
22. Ma, J., Bai, L. & Wang, M. D. Transcription under torsion. Science 340,1580–1583 (2013).
23. Sepulveda, L. A., Xu, H., Zhang, J., Wang, M. & Golding, I. Measurement ofgene regulation in individual cells reveals rapid switching between promoterstates. Science 351, 1218–1222 (2016).
24. Werner, F. & Grohmann, D. Evolution of multisubunit RNA polymerases inthe three domains of life. Nat. Rev. Microbiol. 9, 85–98 (2011).
25. Wolf, L., Silander, O. K. & van Nimwegen, E. Expression noise facilitates theevolution of gene regulation. Elife 4, e05856 (2015).
26. Artsimovitch, I., Svetlov, V., Murakami, K. S. & Landick, R. Co-overexpressionof Escherichia coli RNA polymerase subunits allows isolation and analysis ofmutant enzymes lacking lineage-specific sequence insertions. J. Biol. Chem.278, 12344–12355 (2003).
27. Svetlov, V. & Artsimovitch, I. Purification of bacterial RNA polymerase: toolsand protocols. Methods Mol. Biol. 1276, 13–29 (2015).
28. Yokota, H. et al. Single-molecule visualization of binding modes of helicase toDNA on PEGylated surfaces. Chem. Lett. 38, 308–309 (2009).
29. Yildiz, A. et al. Myosin V walks hand-over-hand: single fluorophore imagingwith 1.5-nm localization. Science 300, 2061–2065 (2003).
30. Parthasarathy, R. Rapid, accurate particle tracking by calculation of radialsymmetry centers. Nat. Methods 9, 724–726 (2012).
31. Nishikawa, S. et al. Switch between large hand-over-hand and small inchworm-like steps in myosin VI. Cell 142, 879–888 (2010).
32. Churchman, L. S., Okten, Z., Rock, R. S., Dawson, J. F. & Spudich, J. A. Singlemolecule high-resolution colocalization of Cy3 and Cy5 attached to
NATURE COMMUNICATIONS | DOI: 10.1038/ncomms13788 ARTICLE
NATURE COMMUNICATIONS | 7:13788 | DOI: 10.1038/ncomms13788 | www.nature.com/naturecommunications 9

macromolecules measures intramolecular distances through time. Proc. NatlAcad. Sci. USA 102, 1419–1423 (2005).
33. Churchman, L. S. & Spudich, J. A. Colocalization of fluorescent probes:accurate and precise registration with nanometer resolution. Cold Spring Harb.Protoc. 2012, 141–149 (2012).
34. Revyakin, A. et al. Transcription initiation by human RNA polymerase IIvisualized at single-molecule resolution. Genes Dev. 26, 1691–1702 (2012).
35. Rivetti, C., Codeluppi, S., Dieci, G. & Bustamante, C. Visualizing RNAextrusion and DNA wrapping in transcription elongation complexes ofbacterial and eukaryotic RNA polymerases. J. Mol. Biol. 326, 1413–1426 (2003).
36. Salgado, H. et al. RegulonDB v8.0: omics data sets, evolutionary conservation,regulatory phrases, cross-validated gold standards and more. Nucleic Acids Res.41, D203–D213 (2013).
AcknowledgementsWe thank Ido Golding, David Priest and Jen-Chien Chang for commenting on earlierversions of the manuscript. We thank Kylius Wilkins for reading the manuscript. Wethank members of the Yanagida laboratory for providing help with experiments. Wethank NBRP-E. coli at National Institute of Genetics for providing plasmids. The workwas supported by RIKEN.
Author contributionsK.F. conceived the idea, prepared the samples, designed and carried out the experimentsand the simulations, and wrote the manuscript. All authors discussed the results and themanuscript.
Additional informationSupplementary Information accompanies this paper at http://www.nature.com/naturecommunications
Competing financial interests: The authors declare no competing financialinterests.
Reprints and permission information is available online at http://npg.nature.com/reprintsandpermissions/
How to cite this article: Fujita, K. et al. Transcriptional bursting is intrinsically causedby interplay between RNA polymerases on DNA. Nat. Commun. 7, 13788doi: 10.1038/ncomms13788 (2016).
Publisher’s note: Springer Nature remains neutral with regard to jurisdictional claims inpublished maps and institutional affiliations.
This work is licensed under a Creative Commons Attribution 4.0International License. The images or other third party material in this
article are included in the article’s Creative Commons license, unless indicated otherwisein the credit line; if the material is not included under the Creative Commons license,users will need to obtain permission from the license holder to reproduce the material.To view a copy of this license, visit http://creativecommons.org/licenses/by/4.0/
r The Author(s) 2016
ARTICLE NATURE COMMUNICATIONS | DOI: 10.1038/ncomms13788
10 NATURE COMMUNICATIONS | 7:13788 | DOI: 10.1038/ncomms13788 | www.nature.com/naturecommunications