Training Seminar: Sampling and Estimation in Agricultural...
76
GS Training and Outreach Workshop on Agricultural Surveys Training Seminar: Sampling and Estimation in Agricultural Surveys Cristiano Ferraz 24 October 2016
Transcript of Training Seminar: Sampling and Estimation in Agricultural...

GS Training and Outreach Workshop on Agricultural Surveys
Training Seminar:
Sampling and Estimation in Agricultural Surveys
Cristiano Ferraz 24 October 2016
Sampling and Estimation in Agricultural Surveys
http://gsars.org/wp-content/uploads/2016/02/MSF-010216-web.pdf
Download a free copy of the Handbook at:

Sampling and Estimation in Agricultural Surveys
Objective:To provide the participants the opportunity to get in touch with key-concepts and practical aspects of designing a sample to generate agriculture estimates.

Sampling and Estimation in Agricultural Surveys
Overview:
• Agricultural Surveys: Challenging features• Typical Frames in Ag-Surveys• Single Frame Surveys• Multiple Frame Designs• Dual Frame Survey
Sampling and Estimation in Agricultural Surveys
Agricultural Surveys: Challenging Features
• Covers a large spectrum of subjects• There is a great variety of variables of interest

Sampling and Estimation in Agricultural Surveys
Agricultural Surveys: Challenging Features
• Often a multi-subject/multi-purpose survey• Suffers influence from nature and culture

Sampling and Estimation in Agricultural Surveys
Agricultural Surveys: Challenging Features
• Require periodicity

Sampling and Estimation in Agricultural Surveys
Typical Frames in Agriculture:
• List Frames• Area Frames• Dual Frames• Multiple Frames

Sampling FRAME
A Sampling Frame can be defined as a reference system composed by a set of materials, devices or coordinates that identifies and provides access to samplingunits, so that a sample can be selected andits elements can be reached.
What is a Sampling Frame?
Sampling and Estimation in Agricultural Surveys

Sampling FRAME
This type of frame is recognized by the main characteristic of listing its components. Examples of list frames include: • a list of farmers from a country or region; • a list of associates from a cooperative
association; • a list of beneficiaries of a type of government
policy program, etc.
What is a List Frame?
Sampling and Estimation in Agricultural Surveys

Sampling FRAME
Area frames are used to geographically cover a target population. Typical area frames use technological devices to identify and to provide access (coordinates) to well defined segments of lands.
What is an Area Frame?
Sampling and Estimation in Agricultural Surveys

Sampling FRAME
Sampling FRAME
Household Survey
Agricultural Survey
Sampling FRAME
Sampling FRAME
Grain Survey
Livestock Survey
What is a Master Sampling Frame?
Sampling and Estimation in Agricultural Surveys

MASTERSAMPLING
FRAME
Household Survey
Agricultural Survey
Grain Survey
Livestock Survey
A Master Sampling Frame is a unique Sampling Frame System from which samples for different surveys can be selected, each one using its own probability sample design. Used in this way, Master Frames can be an efficient tool to integrate surveys.
What is a Master Sampling Frame?
Sampling and Estimation in Agricultural Surveys

MASTERSAMPLING
FRAME
Agricultural Survey: T1
Agricultural Survey: T3
Agricultural Survey: T2
Agricultural Survey: T4
A Master Sampling Frame can also be used to select samples for the same survey at different points in time. Used in this way, Master Frames provide the sampling support to longitudinal, and panel type surveys.
Sampling and Estimation in Agricultural Surveys
What is a Master Sampling Frame?

Sampling and Estimation in Agricultural Surveys
While in many cases there is a one-to-one relationship between the agriculturalholding, the household, and the land parcel, it is not always that this happens.
Challenge:Master Sampling Frames for Agriculture Surveys must satisfy the needs of three statistical units: • the farm or agricultural holding; • the household; and • the land.

Sampling and Estimation in Agricultural Surveys

Single Frame Surveys:
Basic fundamental concepts:• Population or target
population• Subpopulation• Frame and Sampled
Population• Sampling unit• Observation unit• Reporting unit
Sampling and Estimation in Agricultural Surveys

Sistema de Produção de Gado de Leite do Agreste Meridional de Pernambuco
Sampling and Estimation in Agricultural Surveys

Sistema de Produção de Gado de Leitedo Agreste Meridional de Pernambuco
Sampling and Estimation in Agricultural Surveys
Population or Target Population:
Sistema de Produção de Gado de Leitedo Agreste Meridional de Pernambuco
Sampling and Estimation in Agricultural Surveys
Subpopulation:
• Multi-purpose aspects of agricultural surveys may requireestimates for subpopulations of interest.
• These are specific subsets of elementary units for whichinferences are required.
• For example, inference for the subpopulation of milkproducers that have received technical support from localgovernmental agencies could be necessary.

Sistema de Produção de Gado de Leitedo Agreste Meridional de Pernambuco
Sampling and Estimation in Agricultural Surveys
Frame and Sampled Population:
Target population: set of all milk producers from the Agreste Meridional de Pernambuco - AMPE
Frame: List of all milk producers from AMPE that sells their milk to a given Industry
FRAME: 95% coverage level

Sistema de Produção de Gado de Leitedo Agreste Meridional de Pernambuco
Sampling and Estimation in Agricultural Surveys
Sampling Unit, Observation Unit and Reporting Unit:

Sampling and Estimation in Agricultural Surveys
Survey error = sampling error + non-sampling error
Sample Surveys
Census
Sampling errorNon-sampling error
Non-sampling error

Sampling and Estimation in Agricultural Surveys

Sampling and Estimation in Agricultural Surveys
Sampling and Estimation in Agricultural Surveys
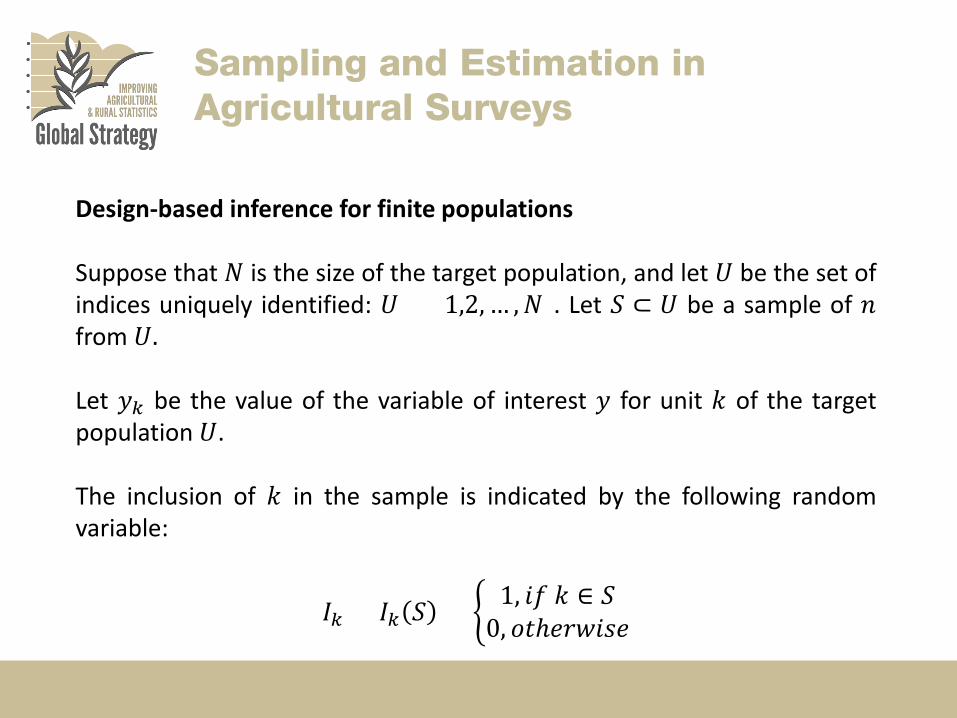
Design-based inference for finite populations
Suppose that 𝑁𝑁 is the size of the target population, and let 𝑈𝑈 be the set ofindices uniquely identified: 𝑈𝑈 = {1,2, … ,𝑁𝑁}. Let 𝑆𝑆 ⊂ 𝑈𝑈 be a sample of 𝑛𝑛from 𝑈𝑈.
Let 𝑦𝑦𝑘𝑘 be the value of the variable of interest 𝑦𝑦 for unit 𝑘𝑘 of the targetpopulation 𝑈𝑈.
The inclusion of 𝑘𝑘 in the sample is indicated by the following randomvariable:
𝐼𝐼𝑘𝑘 = 𝐼𝐼𝑘𝑘 𝑆𝑆 = � 1, 𝑖𝑖𝑖𝑖 𝑘𝑘 ∈ 𝑆𝑆0, 𝑜𝑜𝑜𝑜𝑜𝑜𝑜𝑜𝑜𝑜𝑜𝑖𝑖𝑜𝑜𝑜𝑜

Sampling and Estimation in Agricultural Surveys
𝐼𝐼𝑘𝑘~𝐵𝐵𝑜𝑜𝑜𝑜𝑛𝑛𝑜𝑜𝐵𝐵𝐵𝐵𝐵𝐵𝑖𝑖(𝜋𝜋𝑘𝑘)
In general, when sampling from finite populations,
𝐶𝐶𝑜𝑜𝐶𝐶(𝐼𝐼𝑘𝑘 , 𝐼𝐼𝑙𝑙) = 𝜋𝜋𝑘𝑘𝑙𝑙 − 𝜋𝜋𝑘𝑘 𝜋𝜋𝑙𝑙
𝑉𝑉𝑉𝑉𝑜𝑜(𝐼𝐼𝑘𝑘) = 𝜋𝜋𝑘𝑘(1 − 𝜋𝜋𝑘𝑘)
𝐸𝐸(𝐼𝐼𝑘𝑘) = 𝜋𝜋𝑘𝑘

Sampling and Estimation in Agricultural Surveys
The randomization role:
Probability sampling designs determine the exact distribution of 𝐼𝐼𝑘𝑘 ,providing the sample inclusion probabilities:
𝜋𝜋𝑘𝑘 = 𝑃𝑃 𝐼𝐼𝑘𝑘 = 1 ; 𝜋𝜋𝑘𝑘𝑙𝑙= 𝑃𝑃 𝐼𝐼𝑘𝑘𝐼𝐼𝑙𝑙 = 1 .
Probability sampling designs require that all 𝜋𝜋𝑘𝑘>0.

Sampling and Estimation in Agricultural Surveys
Design-based inference for finite populations
Probability sampling designs determine the exact distribution of 𝐼𝐼𝑘𝑘 ,providing the sample inclusion probabilities:
𝜋𝜋𝑘𝑘 = 𝑃𝑃 𝐼𝐼𝑘𝑘 = 1 ; 𝜋𝜋𝑘𝑘𝑙𝑙= 𝑃𝑃 𝐼𝐼𝑘𝑘𝐼𝐼𝑙𝑙 = 1 .
Probability sampling designs require that all 𝜋𝜋𝑘𝑘>0.
• First-order inclusion probability

Design-based inference for finite populations
Probability sampling designs determine the exact distribution of 𝐼𝐼𝑘𝑘 ,providing the sample inclusion probabilities:
𝜋𝜋𝑘𝑘 = 𝑃𝑃 𝐼𝐼𝑘𝑘 = 1 ; 𝜋𝜋𝑘𝑘𝑙𝑙= 𝑃𝑃 𝐼𝐼𝑘𝑘𝐼𝐼𝑙𝑙 = 1 .
Probability sampling designs require that all 𝜋𝜋𝑘𝑘>0.
Sampling and Estimation in Agricultural Surveys
• Second-order inclusion probability

Sampling and Estimation in Agricultural Surveys
Parameter and estimator:
Given a probability sampling design, a unifying result, due to Horvitz andThompson (1952) ensures unbiased estimation of parameters such asmeans, totals and percentages. Lets focus on the problem of estimatinga population total (parameter):
𝑌𝑌 = �𝑘𝑘∈𝑈𝑈
𝑦𝑦𝑘𝑘
The Horvitz-Thompson estimator for 𝑌𝑌 is given by:
�𝑌𝑌 = �𝑘𝑘∈𝑆𝑆
𝑦𝑦𝑘𝑘𝜋𝜋𝑘𝑘

Sampling and Estimation in Agricultural Surveys
The variance of the Horvitz-Thompson estimator can be written as:
𝑉𝑉𝑉𝑉𝑜𝑜𝑝𝑝 �𝑌𝑌 = ∑𝑘𝑘∈𝑈𝑈∑𝑙𝑙∈𝑈𝑈(𝜋𝜋𝑘𝑘𝑙𝑙 − 𝜋𝜋𝑘𝑘𝜋𝜋𝑙𝑙)𝑦𝑦𝑘𝑘𝜋𝜋𝑘𝑘
𝑦𝑦𝑙𝑙𝜋𝜋𝑙𝑙
In addition, an unbiased estimate of this variance may be obtained using:
�𝑉𝑉𝑉𝑉𝑜𝑜𝑝𝑝 �𝑌𝑌 = �𝑘𝑘∈𝑆𝑆
�𝑙𝑙∈𝑆𝑆
(𝜋𝜋𝑘𝑘𝑙𝑙−𝜋𝜋𝑘𝑘𝜋𝜋𝑙𝑙)𝜋𝜋𝑘𝑘𝑙𝑙
𝑦𝑦𝑘𝑘𝜋𝜋𝑘𝑘
𝑦𝑦𝑙𝑙𝜋𝜋𝑙𝑙

Frame and sample design:
An important characteristic of frames is the nature of its sampling unit.On one hand, it is possible to identify either LIST or AREA frames. On theother, it is possible to identify:
• Type A: Frames with sampling units as elements of the population;• Type B: Frames with sampling units as sets of elements of the
population.
Availability of type A frames allows for direct element sampling designsto be used.
Sampling and Estimation in Agricultural Surveys

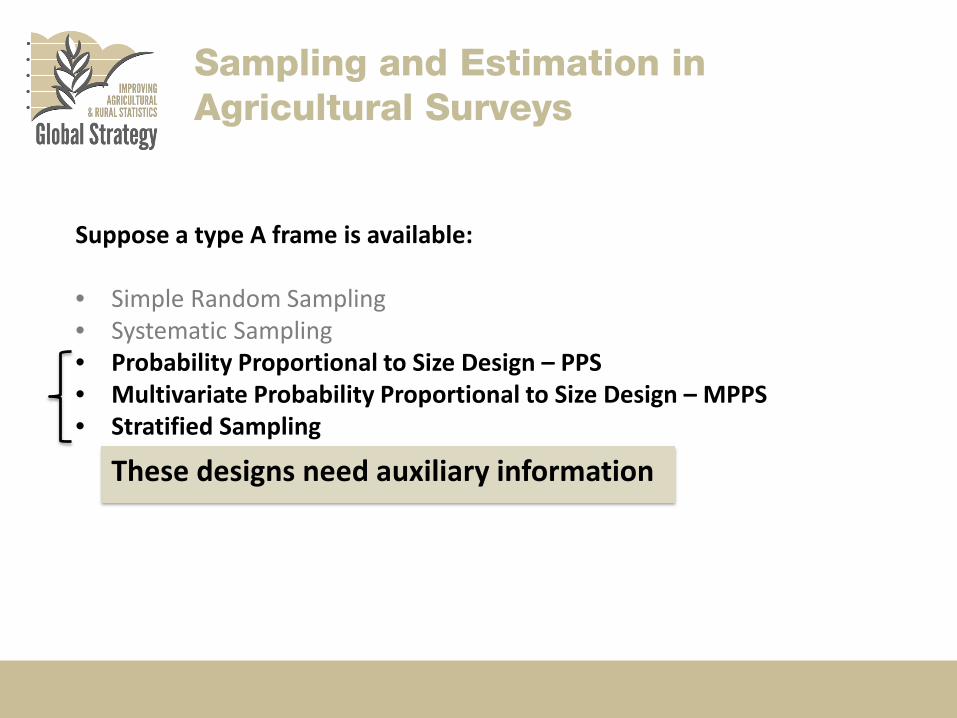
Suppose a type A frame is available:
• Simple Random Sampling• Systematic Sampling• Probability Proportional to Size Design – PPS• Multivariate Probability Proportional to Size Design – MPPS• Stratified Sampling
Sampling and Estimation in Agricultural Surveys
Suppose a type A frame is available:
• Simple Random Sampling• Systematic Sampling• Probability Proportional to Size Design – PPS• Multivariate Probability Proportional to Size Design – MPPS• Stratified Sampling
Sampling and Estimation in Agricultural Surveys
These designs need auxiliary information

Sampling and Estimation in Agricultural Surveys
Simple Random Sampling
Samples selected from a population of size N according to a simple randomsampling design have a pre-assigned size n, and are such that theprobability of selecting a given sample s is
𝑃𝑃 𝑜𝑜 = 𝑁𝑁𝑛𝑛
−1
In a simple random sample, the first and second order inclusionprobabilities are
𝜋𝜋𝑘𝑘 =𝑛𝑛𝑁𝑁
𝑉𝑉𝑛𝑛𝑎𝑎 𝜋𝜋𝑘𝑘𝑙𝑙 =𝑛𝑛(𝑛𝑛 − 1)𝑁𝑁(𝑁𝑁 − 1)

Sampling and Estimation in Agricultural Surveys
Systematic Sampling
Suppose that a sample of size n is to be selected from a population of size Nusing a systematic sampling design. First, a sample interval, given by
𝑉𝑉 =𝑁𝑁𝑛𝑛
is calculated. Suppose that a is an integer number. Then, a sample of one israndomly selected from the first a elements identified by the frame.Thereafter, every a-th element of the frame is also included in the sample.

Sampling and Estimation in Agricultural Surveys
In systematic sampling, the inclusion probabilities are
𝜋𝜋𝑘𝑘 =𝑛𝑛𝑁𝑁
𝑉𝑉𝑛𝑛𝑎𝑎 𝜋𝜋𝑘𝑘𝑙𝑙 = �𝑛𝑛𝑁𝑁
, 𝑖𝑖𝑖𝑖 𝑘𝑘 𝑉𝑉𝑛𝑛𝑎𝑎 𝐵𝐵 𝑉𝑉𝑜𝑜𝑜𝑜 𝑖𝑖𝑛𝑛 𝑜𝑜𝑜𝑜𝑜 𝑜𝑜𝑉𝑉𝑠𝑠𝑠𝑠𝐵𝐵𝑜𝑜
0, 𝑜𝑜𝑜𝑜𝑜𝑜𝑜𝑜𝑜𝑜𝑜𝑖𝑖𝑜𝑜𝑜𝑜

Sampling and Estimation in Agricultural Surveys
Probability Proportional to Size Sampling (PPS)
In the previous examples, each population unit had the same chance ofbeing selected, regardless of the method of selection or the populationunit’s actual size.
If a measure of size (relevance) can be attached to each unit, a probability-proportional-to-size (PPS) sample can be drawn.

Sampling and Estimation in Agricultural Surveys
The following example is used to illustrate PPS sampling:
Name Measure of Size Accumulated Measure
1 10 10
2 1 11
3 4 15
4 15 30
5 5 35

Sampling and Estimation in Agricultural Surveys
The following example is used to illustrate Systematic PPS sampling:
Name Measure of Size Accumulated Measure
1 10 10
2 1 11
3 4 15
4 15 30
5 5 35

Sampling and Estimation in Agricultural Surveys
Multivariate probability-proportional-to-size (MPPS)The same example as that described for the PPS, with two available measurements of size, follows:
Name Measure 1 Measure 2 Improved Accumulated
of Size of Size Size Measure Measure
1 10 8 10 10
2 1 2 2 12
3 3 4 4 16
4 15 10 15 31
5 5 19 19 50

Sampling and Estimation in Agricultural Surveys
Multivariate probability-proportional-to-size (MPPS)
Suppose that there are J ≥ 2 variables of interest (items),each having at least one auxiliary variable that can beused as a measurement of size. Let 𝑥𝑥𝑗𝑗𝑘𝑘 be the value ofthe size measure j for element k in a given f frame. Letalso
𝑋𝑋𝑗𝑗 = �𝑘𝑘∈𝑓𝑓
𝑥𝑥𝑗𝑗𝑘𝑘
be the total of the auxiliary variable j over frame f.

Sampling and Estimation in Agricultural Surveys
Multivariate probability-proportional-to-size (MPPS)
In addition, let 𝑛𝑛𝑗𝑗 be the sample size needed for the variable of interest j.Then, the inclusion probability under an MPPS design is given by
𝜋𝜋𝑘𝑘𝑓𝑓 = 𝑠𝑠𝑖𝑖𝑛𝑛 1,𝑠𝑠𝑉𝑉𝑥𝑥 𝑛𝑛𝑗𝑗
𝑥𝑥𝑗𝑗𝑘𝑘𝑋𝑋𝑗𝑗
, 𝑗𝑗 = 1,2 … 𝐽𝐽
The remaining steps for selecting the sample are identical to PPS sampling.
Stratified Sampling
In stratified sampling, the population is first divided into subgroups calledstrata, in a process called stratification. Then, elements are sampled fromeach stratum (subgroup) on the basis of a given probability sample design,such as simple random sampling.
Stratification can be used for several purposes, but each requires someinformation on the sample units. Sometimes, stratification is used whenestimates are to be made for subpopulations of interest, such as geographicor administrative areas or rare items.
Sampling and Estimation in Agricultural Surveys

Suppose a type B frame is available:
• Cluster Sampling• Two-stage Sampling
Sampling and Estimation in Agricultural Surveys

Cluster Sampling
The main characteristic of cluster sampling is that the sampling unit is acluster of units.
To select a cluster sample, a simple random sample of clusters is taken andeach unit in the selected clusters is investigated.
Systematic can also be used to select a cluster sample.
Sampling and Estimation in Agricultural Surveys

Two-stage Sampling
Two-stage sampling is the sampling procedure that results when eachselected cluster is subsampled for population elements.
Suppose that 50 farms clustered into 15 villages are to be surveyed.
Suppose further that it is decided to select five villages at random, obtain alisting of all farms within each selected village, and then select two farmsfrom within each village. In this case, each farm has a chance of appearing inthe sample at least once with each of the other farms, and the overall samplesize and survey workload can thus be controlled.
Sampling and Estimation in Agricultural Surveys

Sampling and Estimation in Agricultural Surveys
Cochran (1977) suggests a survey planning according to the following general topics:
I. Identification of the goals of the survey;II. Definition of the target population;III. Definition of the variables of interest and the data to be
collected;IV. Identification of the desired degree of precision;V. Selection of the data collection instrument;VI. Identification of a frame;VII. Design of the sample;
Sampling and Estimation in Agricultural Surveys
Cochran (1977) suggests a survey planning according to the following general topics:
VIII. Pre-test;IX. of the sample and collection of the data / organization of
the fieldwork;X. Data description and analysis;XI. Summary of the obtained information and
recommendations for future surveys.

Sampling and Estimation in Agricultural Surveys
Cochran (1977) suggests a survey planning according to the following general topics:
I. Identification of the goals of the survey;II. Definition of the target population;III. Definition of the variables of interest and the data to be
collected;IV. Identification of the desired degree of precision;V. Selection of the data collection instrument;VI. Identification of a frame;VII. Design of the sample;
Sampling Design
The choice of sample design depends on the type of the frame and theavailability of auxiliary information.
Example:
Sampling and Estimation in Agricultural Surveys

Sampling and Estimation in Agricultural Surveys
Multiple Frame Design
Population

Sampling and Estimation in Agricultural Surveys

Sampling and Estimation in Agricultural Surveys
Multiple Frame Design
PopulationFrame 1

Sampling and Estimation in Agricultural Surveys
Multiple Frame Design
PopulationFrame 1
Frame 2

Sampling and Estimation in Agricultural Surveys
Multiple Frame Design
PopulationFrame 1
Frame 2
Frame 3

Sampling and Estimation in Agricultural Surveys
Multiple Frame Design
PopulationFrame 1
Frame 2
Frame 3
Frame 4

Sampling and Estimation in Agricultural Surveys
Multiple Frame Design
PopulationFrame 1
Frame 2
Frame 3
Frame 4
S1

Sampling and Estimation in Agricultural Surveys
Multiple Frame Design
PopulationFrame 1
Frame 2
Frame 3
Frame 4
S1S2

Sampling and Estimation in Agricultural Surveys
Multiple Frame Design
PopulationFrame 1
Frame 2
Frame 3
Frame 4
S1S2
S3

Sampling and Estimation in Agricultural Surveys
Multiple Frame Design
PopulationFrame 1
Frame 2
Frame 3
Frame 4
S1S2
S3
S4

Sampling and Estimation in Agricultural Surveys
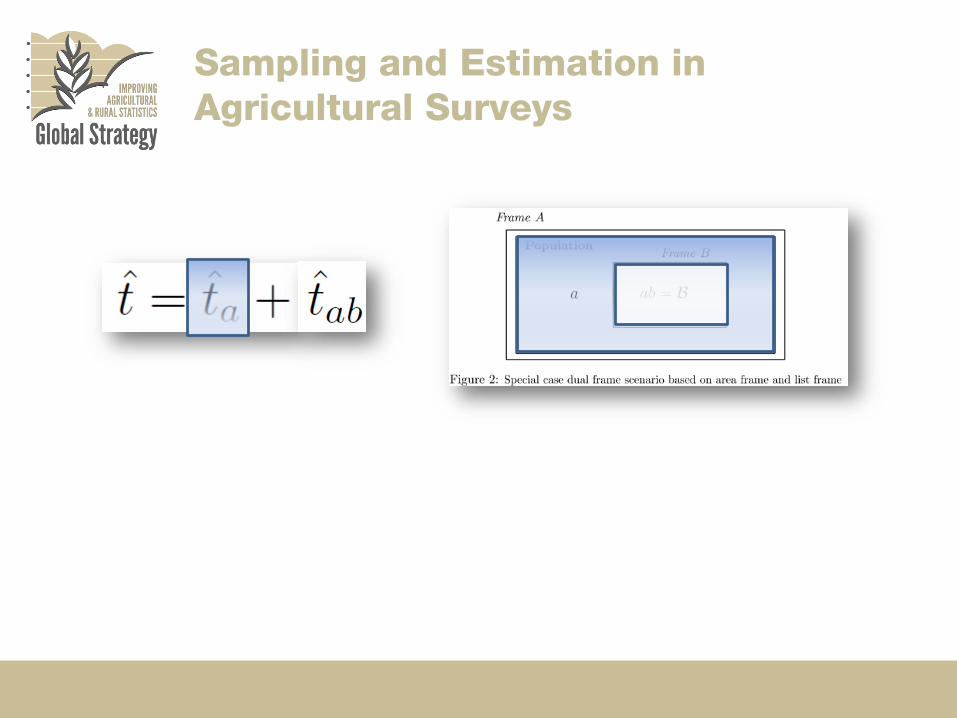
Dual Frame Design
• Very flexible approach • Can accommodate a variety of estimators
• Compromise solution for dealing with disadvantages of area and list frames
• Accommodates the advantages of area and list frames

Sampling and Estimation in Agricultural Surveys

Sampling and Estimation in Agricultural Surveys
Sampling and Estimation in Agricultural Surveys

Sampling and Estimation in Agricultural Surveys

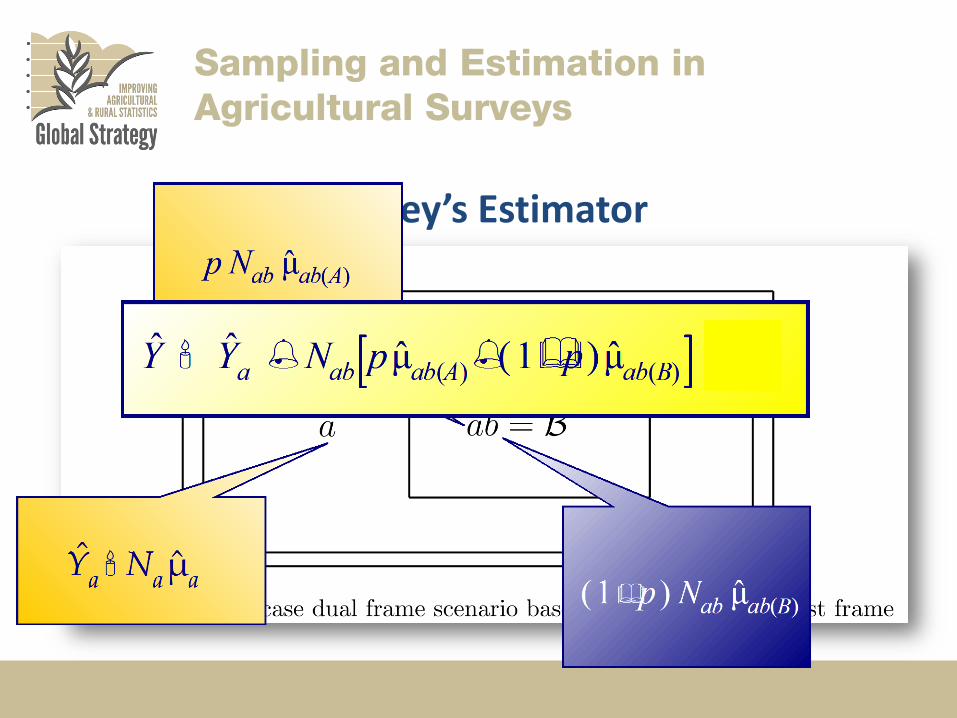
Hartley’s Estimator
Sampling and Estimation in Agricultural Surveys

Hartley’s Estimator
Sampling and Estimation in Agricultural Surveys

Hartley’s Estimator
Sampling and Estimation in Agricultural Surveys
Hartley’s Estimator
Sampling and Estimation in Agricultural Surveys

Sampling and Estimation in Agricultural Surveys
Dual Frame Assumptions:1. Completness2. Identifiability
Population

Sampling and Estimation in Agricultural Surveys
Dual Frame Assumptions:1. Completness2. Identifiability
Population
Area Frame provides full coverage

Sampling and Estimation in Agricultural Surveys
Dual Frame Assumptions:1. Completness2. Identifiability
PopulationList Frame
Area Frame Sample

Sampling and Estimation in Agricultural Surveys
Dual Frame Assumptions:1. Completness2. Identifiability
PopulationList Frame
Area Frame Sample
Area Frame Sampled Elements Identified at List Frame

Thank YouCristiano FerrazUniversidade Federal de PernambucoDepartamento de EstatísticaCAST – Computational Agriculture Statistics [email protected] | [email protected]
Sampling and Estimation in Agricultural Surveys