Training Module Making Landslide Potential Map and Banjir ... · Training Module Making Landslide...
20
Training Module Making Landslide Potential Map and Banjir Bandang Hazard Map 1 I. Data Preparation At this part, it will be shown the stages of process on preparing all types of data which required in making of landslide potential and banjir bandang hazard map. I.1. Digitize landslide region and micro-topography using satellite image Step 1. Open ArcMap 1) Run ArcMap . 2) Window of “ArcMap - Getting Started” will open. At this window, click New Maps Blank Map then click OK. 3) ArcMap’s workspace will appear. At toolbar Standard, click Add Data button. Window of Add Data will appear. At the part of Look in, move the pointer to folder: Data source for training. 4) Double click to folder “01 Satellite image”, then choose file “citra satelit.tif”. Click Add button.
Transcript of Training Module Making Landslide Potential Map and Banjir ... · Training Module Making Landslide...
Training Module Making Landslide Potential Map and Banjir Bandang Hazard Map
1
I. Data Preparation
At this part, it will be shown the stages of process on preparing all types of data which required in
making of landslide potential and banjir bandang hazard map.
I.1. Digitize landslide region and micro-topography using satellite image
Step 1. Open ArcMap
1) Run ArcMap .
2) Window of “ArcMap - Getting Started” will open. At this window, click New Maps Blank
Map then click OK.
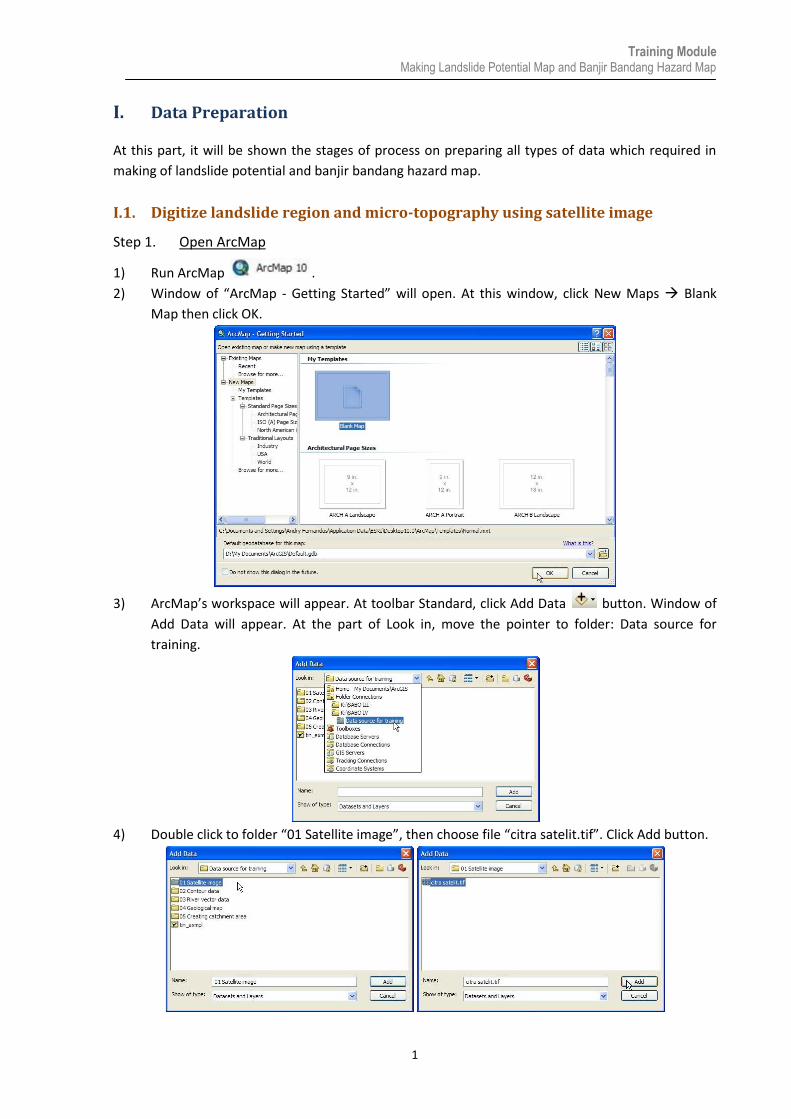
3) ArcMap’s workspace will appear. At toolbar Standard, click Add Data button. Window of
Add Data will appear. At the part of Look in, move the pointer to folder: Data source for
training.
4) Double click to folder “01 Satellite image”, then choose file “citra satelit.tif”. Click Add button.
Training Module Making Landslide Potential Map and Banjir Bandang Hazard Map
2
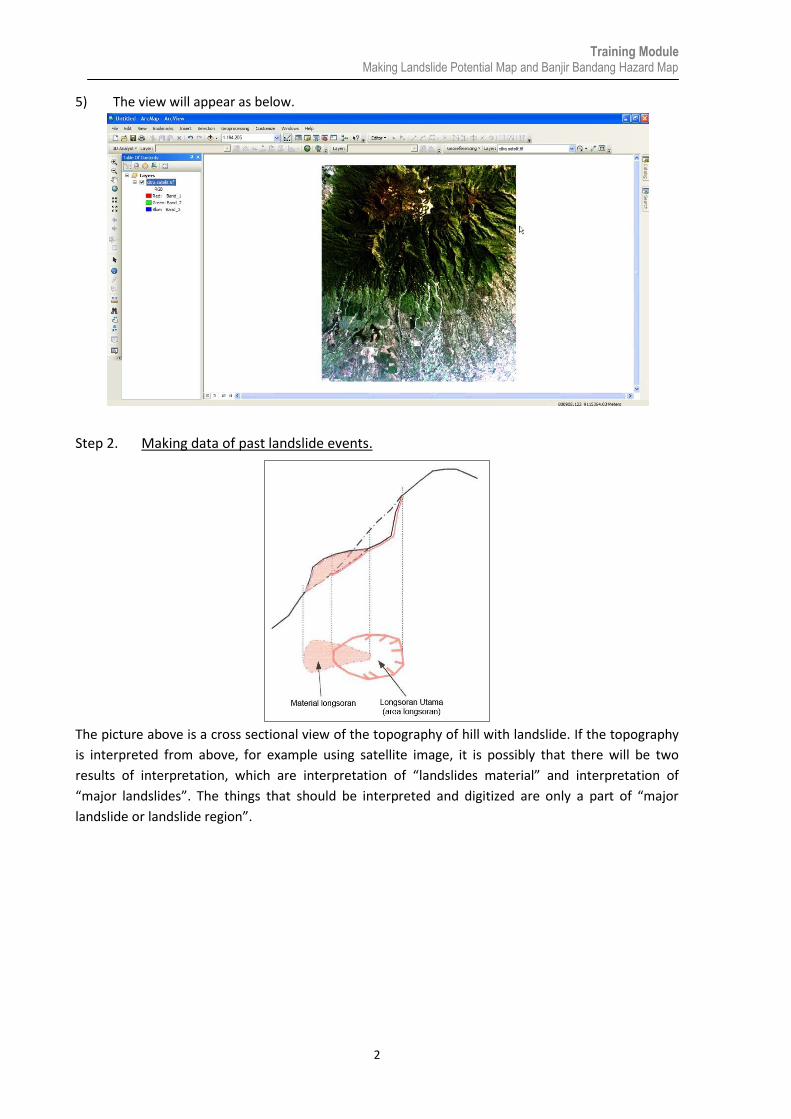
5) The view will appear as below.
Step 2. Making data of past landslide events.
The picture above is a cross sectional view of the topography of hill with landslide. If the topography
is interpreted from above, for example using satellite image, it is possibly that there will be two
results of interpretation, which are interpretation of “landslides material” and interpretation of
“major landslides”. The things that should be interpreted and digitized are only a part of “major
landslide or landslide region”.

Training Module Making Landslide Potential Map and Banjir Bandang Hazard Map
3
1) At ArcMap workspace, move cursor to Catalog button. And the Catalog window will appear
automatically.
2) Click symbol + at the Folder Connections, symbol + at Data source for training, and choose the
folder: 01 Satellite Image.
3) Right click on the folder: 01 Satellite image, move cursor to New, then click Shapefile.

Training Module Making Landslide Potential Map and Banjir Bandang Hazard Map
4
4) At Create New Shapefile window, at text box Name, fill in: “area longsoran masa lalu” and at
text box Feature Type, fill in: Polygon.
5) To choose the coordinate and projection system of a spatial data, click Edit button at Create
New Shapefile window.
6) At the Spatial Reference Properties window, click Select button.
7) At Browse for Coordinate System window, follow the steps as shown in the folder below:
Projected Coordinate System UTM WGS 1984 Southern Hemisphere.

Training Module Making Landslide Potential Map and Banjir Bandang Hazard Map
5
8) Select “WGS 1984 UTM Zone 49S”, then click Add button at Browse for Coordinate System
window, click OK button at Spatial Reference Properties window, and click OK at Create New
Shapefile window.
All of spatial data that use in this training module are using UTM 49S system coordinate
(Jember area) with WGS 1984 system projection.
9) A new shapefile will automatically enter to the ArcMap workspace.
10) To make or edit spatial data, we need Editor tool. If ArcMap workspace does not have toolbar
Editor yet, right click on blank random area at ArcMap workspace, then click Editor.
11) Then Editor toolbar will appear as below. This toolbar can be placed in specific locations in
ArcMap workspace, in order to make ArcMap workspace more properly.
Training Module Making Landslide Potential Map and Banjir Bandang Hazard Map
6
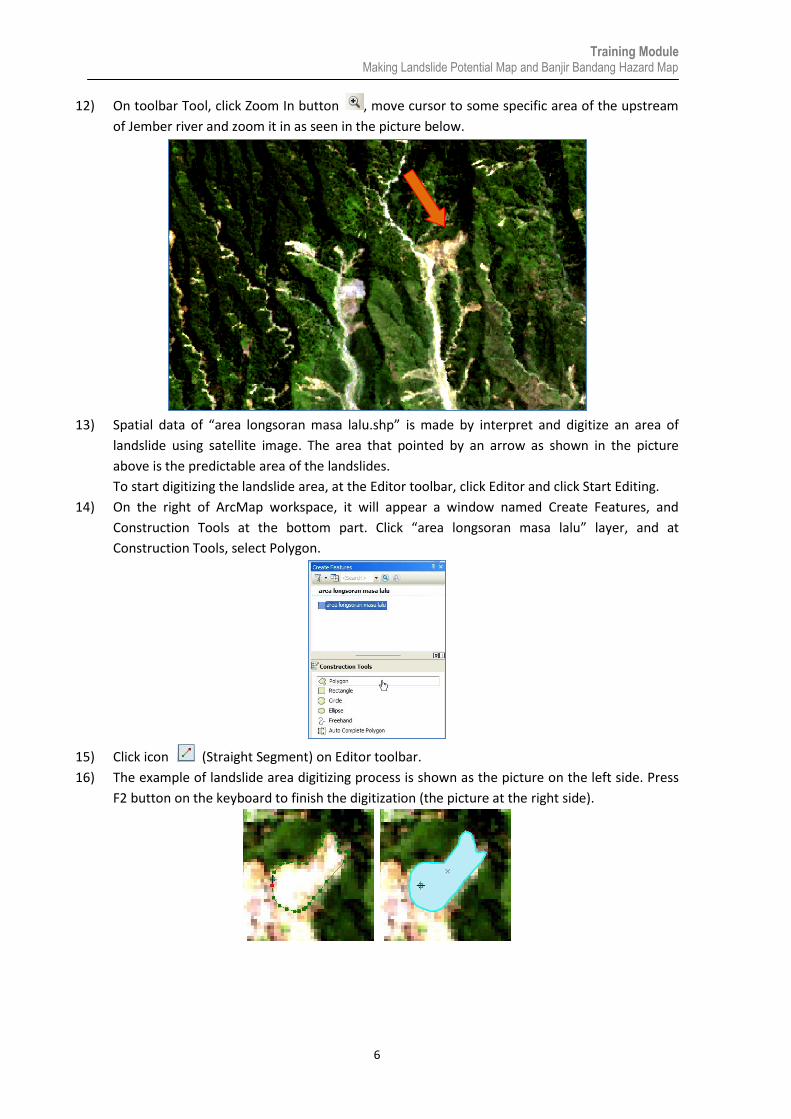
12) On toolbar Tool, click Zoom In button , move cursor to some specific area of the upstream
of Jember river and zoom it in as seen in the picture below.
13) Spatial data of “area longsoran masa lalu.shp” is made by interpret and digitize an area of
landslide using satellite image. The area that pointed by an arrow as shown in the picture
above is the predictable area of the landslides.
To start digitizing the landslide area, at the Editor toolbar, click Editor and click Start Editing.
14) On the right of ArcMap workspace, it will appear a window named Create Features, and
Construction Tools at the bottom part. Click “area longsoran masa lalu” layer, and at
Construction Tools, select Polygon.
15) Click icon (Straight Segment) on Editor toolbar.
16) The example of landslide area digitizing process is shown as the picture on the left side. Press
F2 button on the keyboard to finish the digitization (the picture at the right side).

Training Module Making Landslide Potential Map and Banjir Bandang Hazard Map
7
17) Do the interpretation and digitization process of landslide area for the whole scope of study
area by using satellite image.
18) If the interpretation and digitization process of landslide area is done, click Editor button, click
Save Edits button, then click stop Editing. By this time, all of the digitized data are already
stored in the “area longsoran masa lalu.shp” data.
19) To change the data view of “area longsoran masa lalu.shp”, right click on “area longsoran masa
lalu” layer, then click Properties.
20) On Layer Properties window, click Symbology tab. Click Symbol button which shown as below.
Training Module Making Landslide Potential Map and Banjir Bandang Hazard Map
8
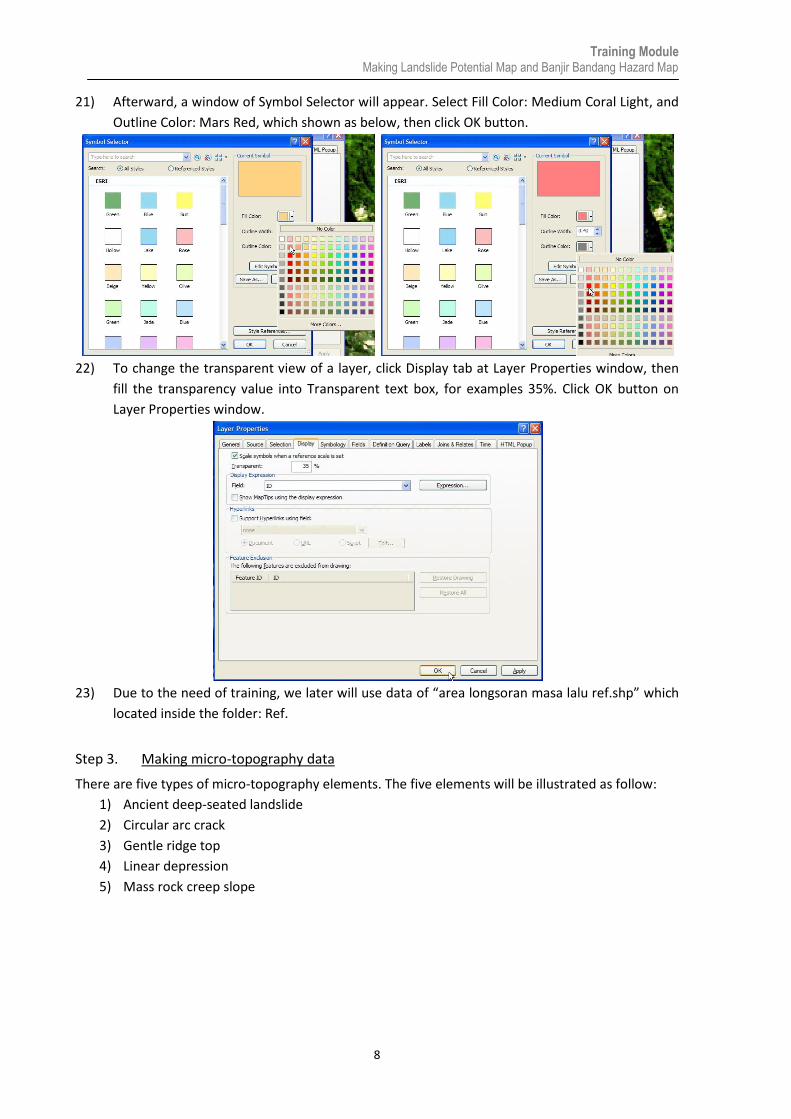
21) Afterward, a window of Symbol Selector will appear. Select Fill Color: Medium Coral Light, and
Outline Color: Mars Red, which shown as below, then click OK button.
22) To change the transparent view of a layer, click Display tab at Layer Properties window, then
fill the transparency value into Transparent text box, for examples 35%. Click OK button on
Layer Properties window.
23) Due to the need of training, we later will use data of “area longsoran masa lalu ref.shp” which
located inside the folder: Ref.
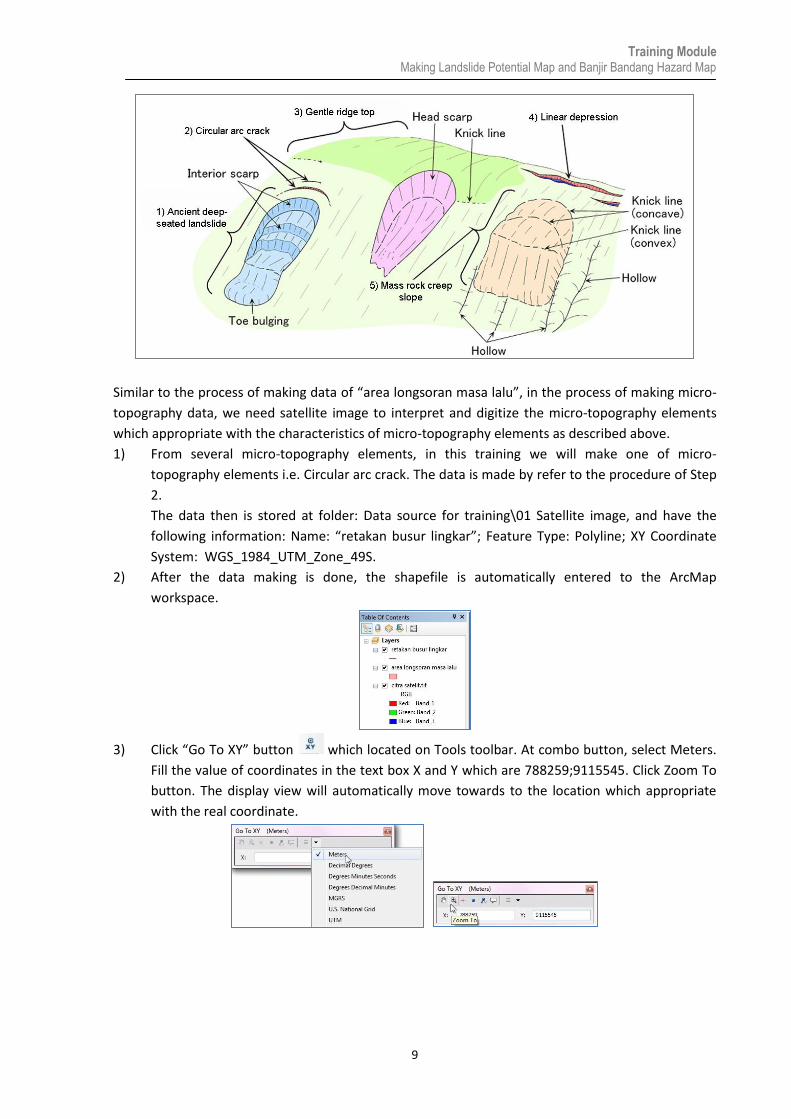
Step 3. Making micro-topography data
There are five types of micro-topography elements. The five elements will be illustrated as follow:
1) Ancient deep-seated landslide
2) Circular arc crack
3) Gentle ridge top
4) Linear depression
5) Mass rock creep slope
Training Module Making Landslide Potential Map and Banjir Bandang Hazard Map
9
Similar to the process of making data of “area longsoran masa lalu”, in the process of making micro-
topography data, we need satellite image to interpret and digitize the micro-topography elements
which appropriate with the characteristics of micro-topography elements as described above.
1) From several micro-topography elements, in this training we will make one of micro-
topography elements i.e. Circular arc crack. The data is made by refer to the procedure of Step
2.
The data then is stored at folder: Data source for training\01 Satellite image, and have the
following information: Name: “retakan busur lingkar”; Feature Type: Polyline; XY Coordinate
System: WGS_1984_UTM_Zone_49S.
2) After the data making is done, the shapefile is automatically entered to the ArcMap
workspace.
3) Click “Go To XY” button which located on Tools toolbar. At combo button, select Meters.
Fill the value of coordinates in the text box X and Y which are 788259;9115545. Click Zoom To
button. The display view will automatically move towards to the location which appropriate
with the real coordinate.

Training Module Making Landslide Potential Map and Banjir Bandang Hazard Map
10
4) On Tool toolbar, click Zoom In button , and zoom in as below.
5) To start the digitization of circular arc crack, on Editor toolbar, click Editor and click Start
Editing.
6) If there is more than one layer on the Table of Contents, the Start Editing window will
automatically appear. The upper of Start Editing window shows some of layers that can be
edited and located at the Table of Contents, whereas the bottom shows the location of folders
which contains the layers.
Select “retakan busur lingkar” layer then click OK.
[Another options is by doing double click on “retakan busur lingkar” layer]
7) At the right side of the ArcMap workspace, a window of Create Features and Construction
Tools will be appeared. Click “retakan busur lingkar” layer, and click Line at Construction Tools.
Training Module Making Landslide Potential Map and Banjir Bandang Hazard Map
11
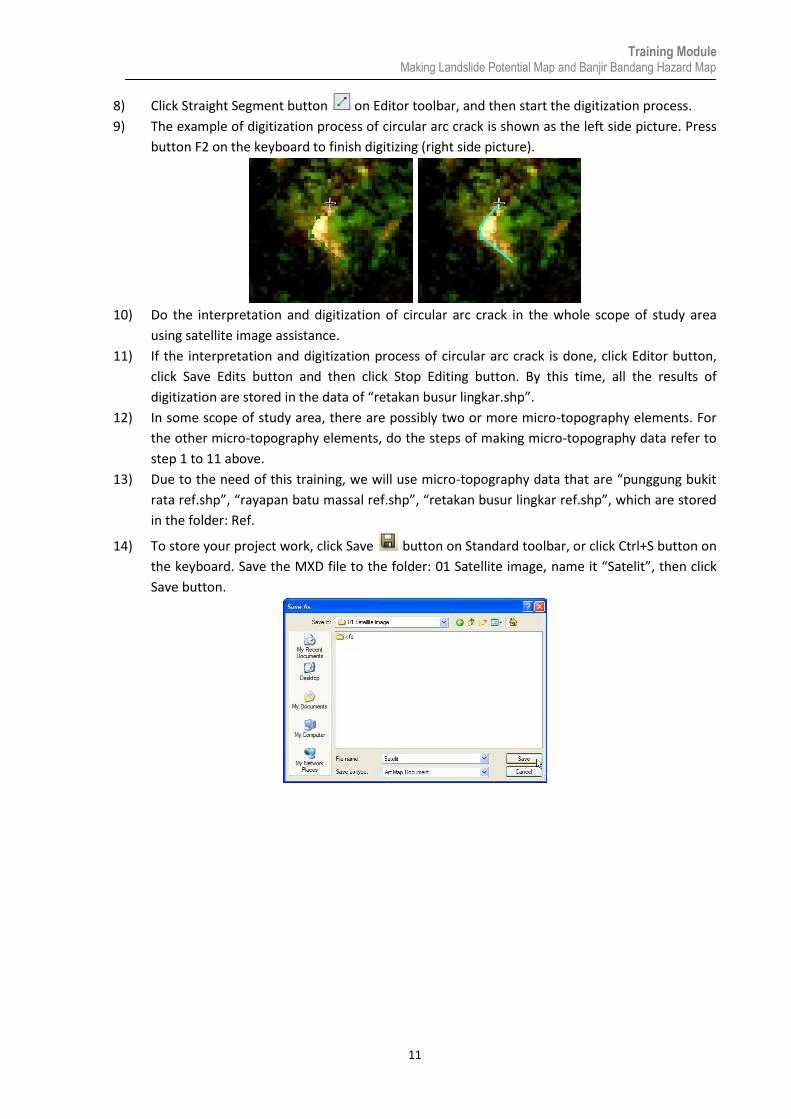
8) Click Straight Segment button on Editor toolbar, and then start the digitization process.
9) The example of digitization process of circular arc crack is shown as the left side picture. Press
button F2 on the keyboard to finish digitizing (right side picture).
10) Do the interpretation and digitization of circular arc crack in the whole scope of study area
using satellite image assistance.
11) If the interpretation and digitization process of circular arc crack is done, click Editor button,
click Save Edits button and then click Stop Editing button. By this time, all the results of
digitization are stored in the data of “retakan busur lingkar.shp”.
12) In some scope of study area, there are possibly two or more micro-topography elements. For
the other micro-topography elements, do the steps of making micro-topography data refer to
step 1 to 11 above.
13) Due to the need of this training, we will use micro-topography data that are “punggung bukit
rata ref.shp”, “rayapan batu massal ref.shp”, “retakan busur lingkar ref.shp”, which are stored
in the folder: Ref.
14) To store your project work, click Save button on Standard toolbar, or click Ctrl+S button on
the keyboard. Save the MXD file to the folder: 01 Satellite image, name it “Satelit”, then click
Save button.
Training Module Making Landslide Potential Map and Banjir Bandang Hazard Map
12
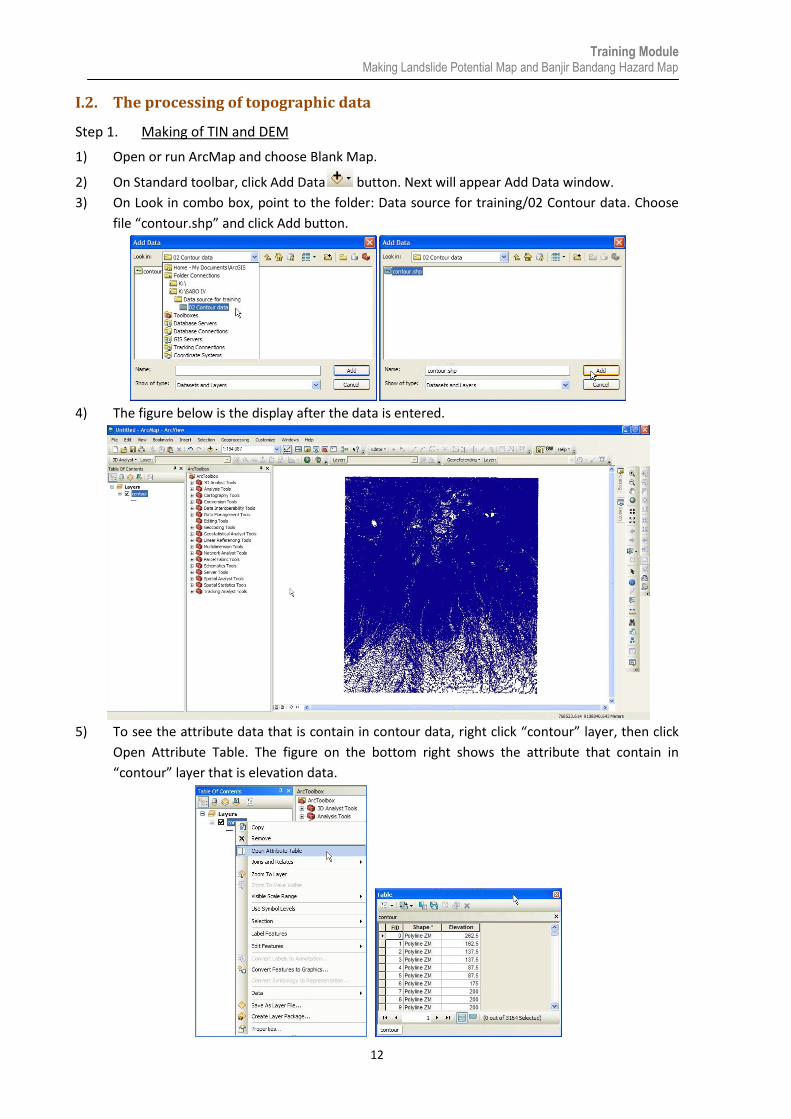
I.2. The processing of topographic data
Step 1. Making of TIN and DEM
1) Open or run ArcMap and choose Blank Map.
2) On Standard toolbar, click Add Data button. Next will appear Add Data window.
3) On Look in combo box, point to the folder: Data source for training/02 Contour data. Choose
file “contour.shp” and click Add button.
4) The figure below is the display after the data is entered.
5) To see the attribute data that is contain in contour data, right click “contour” layer, then click
Open Attribute Table. The figure on the bottom right shows the attribute that contain in
“contour” layer that is elevation data.
Training Module Making Landslide Potential Map and Banjir Bandang Hazard Map
13
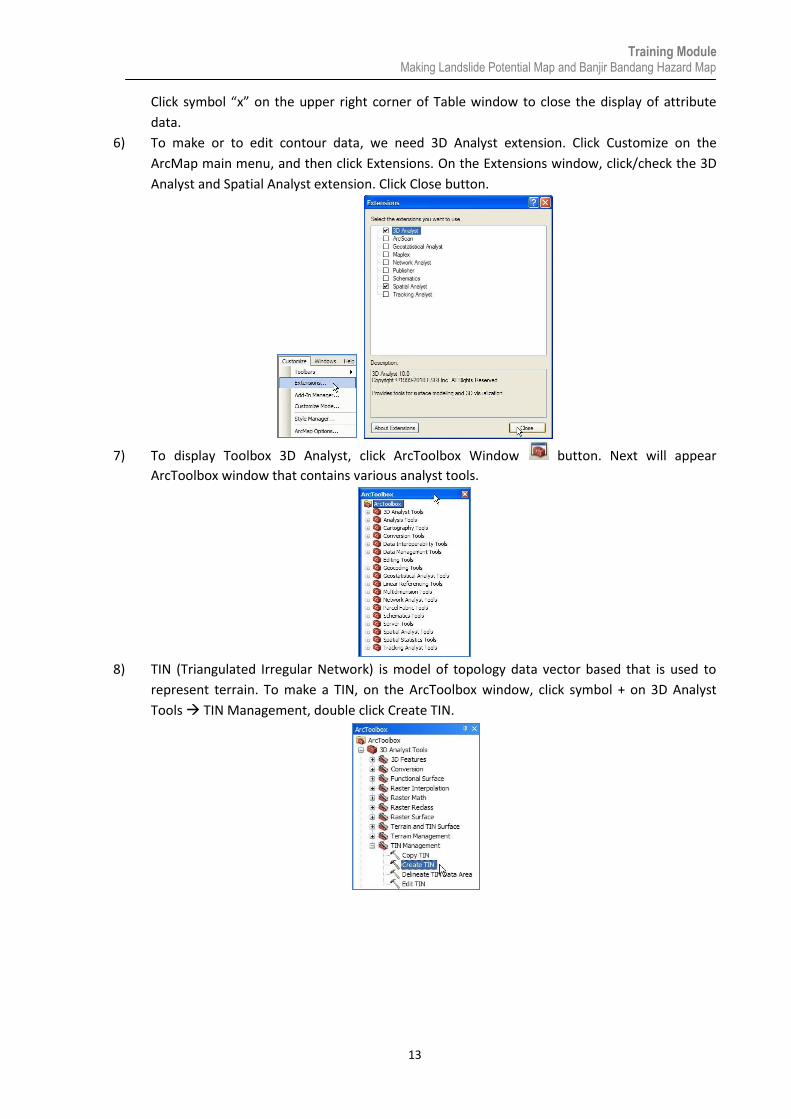
Click symbol “x” on the upper right corner of Table window to close the display of attribute
data.
6) To make or to edit contour data, we need 3D Analyst extension. Click Customize on the
ArcMap main menu, and then click Extensions. On the Extensions window, click/check the 3D
Analyst and Spatial Analyst extension. Click Close button.
7) To display Toolbox 3D Analyst, click ArcToolbox Window button. Next will appear
ArcToolbox window that contains various analyst tools.
8) TIN (Triangulated Irregular Network) is model of topology data vector based that is used to
represent terrain. To make a TIN, on the ArcToolbox window, click symbol + on 3D Analyst
Tools TIN Management, double click Create TIN.

Training Module Making Landslide Potential Map and Banjir Bandang Hazard Map
14
9) Next will appear Create TIN window.
10) Click button on the Output TIN text box. Next will appear Output TIN window.
11) On Look in combo box, point to the folder: Data source for training/02 Contour data. On the
Name text box, write “tin”, and then click Save button.
12) Click button on the Spatial Reference text box, on Create TIN window. Next will appear
Spatial Reference Properties window.
Click Import button. Next will appear Browse for Dataset window.
Training Module Making Landslide Potential Map and Banjir Bandang Hazard Map
15
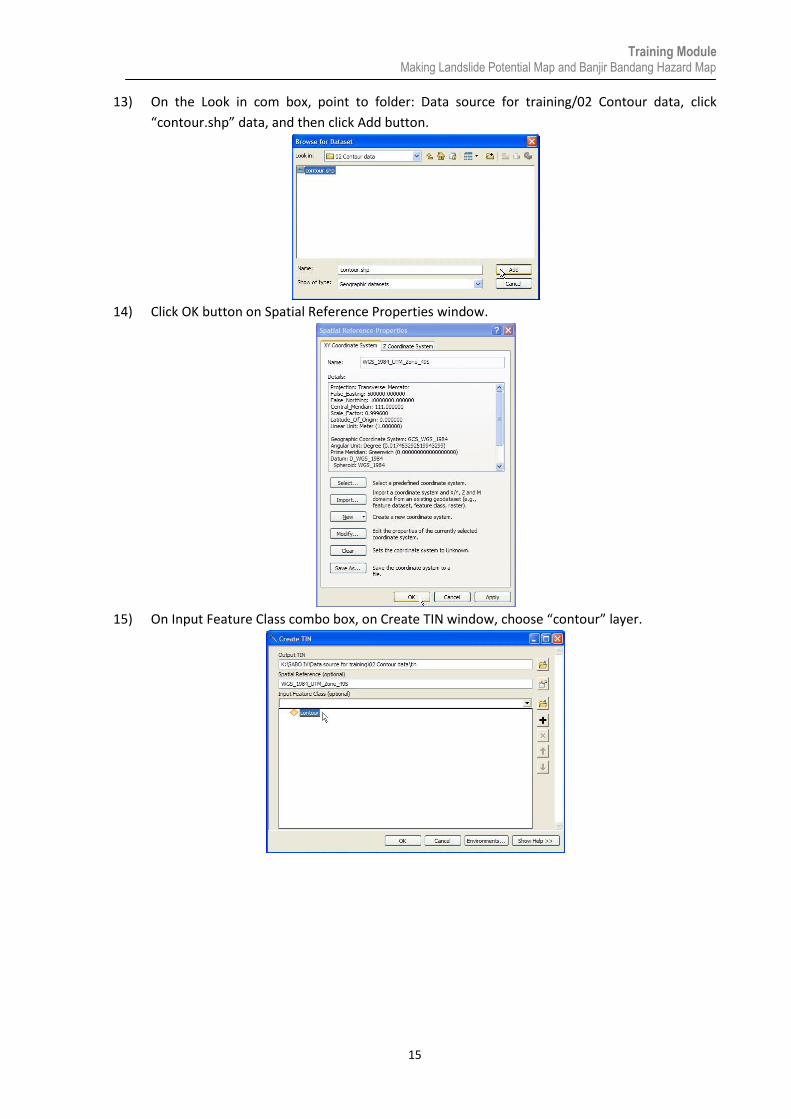
13) On the Look in com box, point to folder: Data source for training/02 Contour data, click
“contour.shp” data, and then click Add button.
14) Click OK button on Spatial Reference Properties window.
15) On Input Feature Class combo box, on Create TIN window, choose “contour” layer.
Training Module Making Landslide Potential Map and Banjir Bandang Hazard Map
16
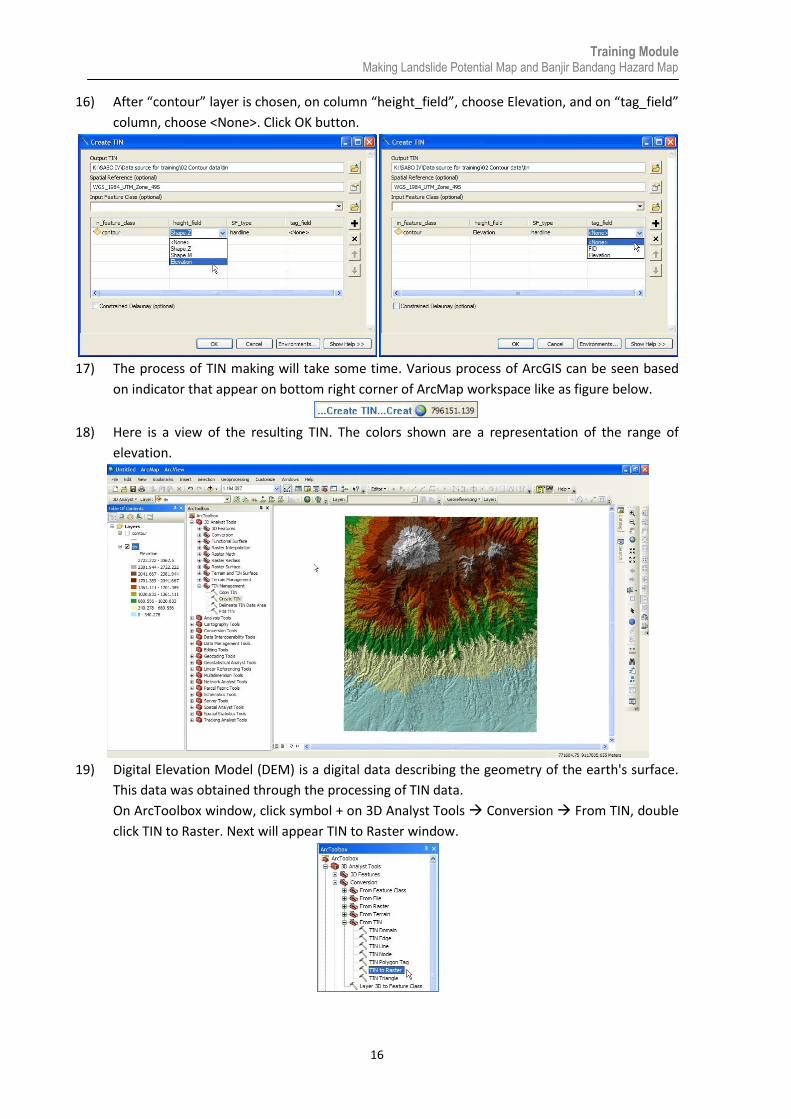
16) After “contour” layer is chosen, on column “height_field”, choose Elevation, and on “tag_field”
column, choose <None>. Click OK button.
17) The process of TIN making will take some time. Various process of ArcGIS can be seen based
on indicator that appear on bottom right corner of ArcMap workspace like as figure below.
18) Here is a view of the resulting TIN. The colors shown are a representation of the range of
elevation.
19) Digital Elevation Model (DEM) is a digital data describing the geometry of the earth's surface.
This data was obtained through the processing of TIN data.
On ArcToolbox window, click symbol + on 3D Analyst Tools Conversion From TIN, double
click TIN to Raster. Next will appear TIN to Raster window.
Training Module Making Landslide Potential Map and Banjir Bandang Hazard Map
17
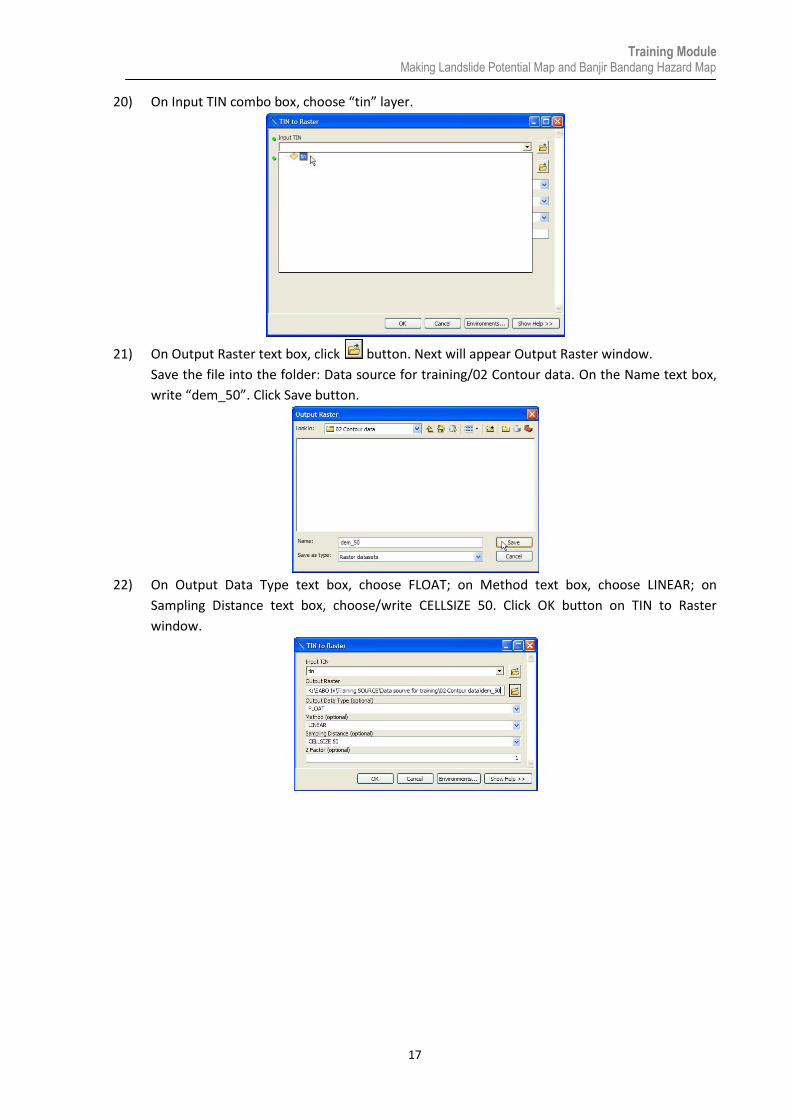
20) On Input TIN combo box, choose “tin” layer.
21) On Output Raster text box, click button. Next will appear Output Raster window.
Save the file into the folder: Data source for training/02 Contour data. On the Name text box,
write “dem_50”. Click Save button.
22) On Output Data Type text box, choose FLOAT; on Method text box, choose LINEAR; on
Sampling Distance text box, choose/write CELLSIZE 50. Click OK button on TIN to Raster
window.

Training Module Making Landslide Potential Map and Banjir Bandang Hazard Map
18
23) We need two DEM with different pixel size that are 50m and 10m. Therefore, do the
procedures refer to steps 19 – 22, but change the value of Sampling Distance become CELLSIZE
10, and then give the name as “dem_10”.
Below is a view of the resulting DEM data.
Step 2. Making hillshade view
1) To making hillshade vies, on Arc Toolbox window, click symbol + on 3D Analyst Tools Raster
Surface, and then double click Hillshade.
2) Next will appear Hillshade window. On Input raster combo box, choose “dem_10” layer.
Training Module Making Landslide Potential Map and Banjir Bandang Hazard Map
19
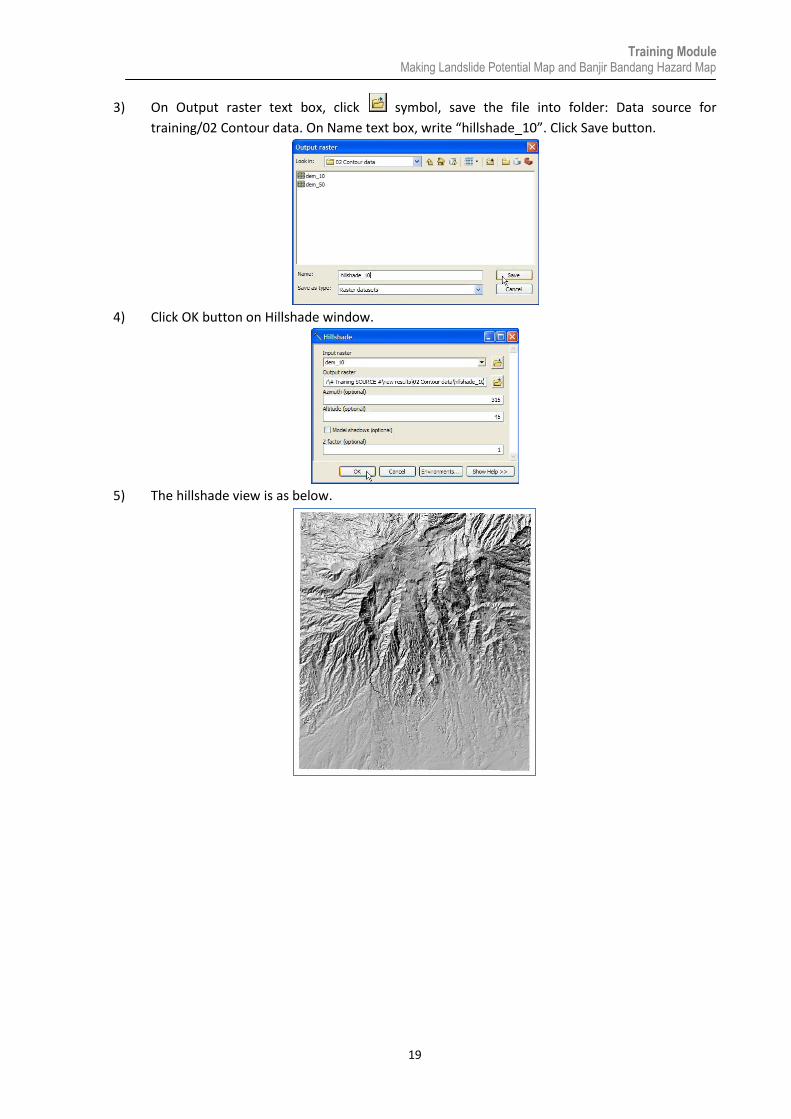
3) On Output raster text box, click symbol, save the file into folder: Data source for
training/02 Contour data. On Name text box, write “hillshade_10”. Click Save button.
4) Click OK button on Hillshade window.
5) The hillshade view is as below.
Training Module Making Landslide Potential Map and Banjir Bandang Hazard Map
20
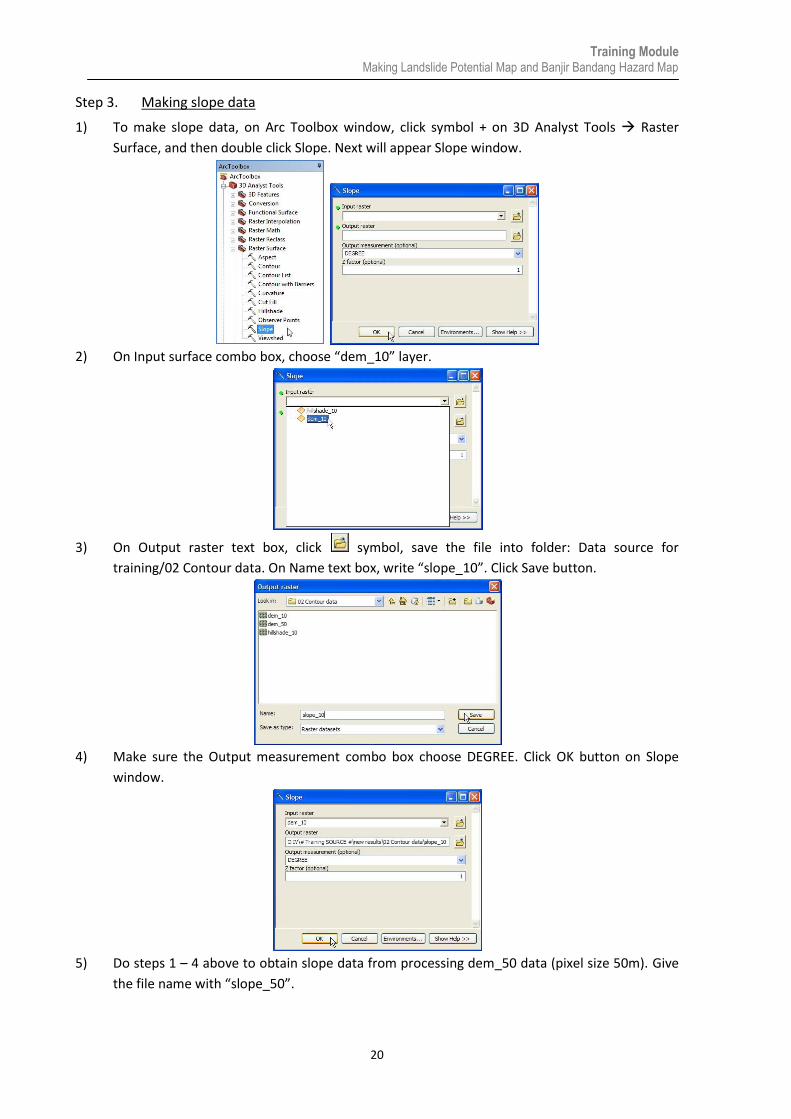
Step 3. Making slope data
1) To make slope data, on Arc Toolbox window, click symbol + on 3D Analyst Tools Raster
Surface, and then double click Slope. Next will appear Slope window.
2) On Input surface combo box, choose “dem_10” layer.
3) On Output raster text box, click symbol, save the file into folder: Data source for
training/02 Contour data. On Name text box, write “slope_10”. Click Save button.
4) Make sure the Output measurement combo box choose DEGREE. Click OK button on Slope
window.
5) Do steps 1 – 4 above to obtain slope data from processing dem_50 data (pixel size 50m). Give
the file name with “slope_50”.