Training Manual on Geographic Information Systems
55
Training Manual on Geographic Information Systems ii
Transcript of Training Manual on Geographic Information Systems
Training Manual on Geographic Information Systems
ii
Training Manual on Geographic Information Systems
iii
CLIMATE CHANGE COMMISSION
The Climate Change Commission, an independent and autonomous body that has the same status as that of a national government agency, is under the Office of the President of the Philippines. It is the lead policy-making body of the government which is tasked to coordinate, monitor, and evaluate programs and action plans of the government relating to climate change pursuant to the provisions of the Republic Act No. 9729 or the Climate Change Act as amended by Republic Act No. 10174 or the People’s Survival Fund.
GLOBAL GREEN GROWTH INSTITUTE
The Global Green Growth Institute (GGGI) is a new international organization committed to strong, inclusive green growth. GGGI assists developing and emerging countries with integrating their ambitions for strong economic performance and environmental sustainability with the goal of bringing about poverty reduction, job creation, social inclusion, and climate change mitigation and adaptation. Headquartered in Seoul, GGGI was established by treaty in June 2012 at the United Nations Rio+20 Conference by an initial group of eighteen nations who share the organization's vision. To date, there are a total of 24 Member Countries who joined the organization. GGGI has a diverse portfolio of programs in developing countries around the world. These in-country programs, together with global products and services, focus on delivering results through an integrated approach of evidence based green growth planning and implementation aligned to countries' development priorities. The organization also focuses on knowledge development and management activities which build a strong theoretical and empirical basis for green growth, while providing concrete options and guidance for policymakers; as well as building the conditions for public and private green infrastructure investments.

Training Manual on Geographic Information Systems
iv
PREFACE The Philippines is highly vulnerable to the impacts of climate change. As witnessed through the devastation from typhoons Yolanda (2013), Glenda (2014), and Lando (2015), millions of Filipinos were affected and communities incurred costly damages and forced to rebuild. In anticipation of stronger typhoons hitting the country, climate change adaptation and mitigation is vital to the development and preparedness of Local Government Units (LGUs) and the people they serve. The methodologies and tools offered in this publication are intended to raise national awareness and competence among national and local government institutions, civil society, private sector, and communities. This publication provides information outlining mechanisms on how to develop capacities of decision makers, local planners and trainers in integrating science-based assessments into policies, plans, and programs to make communities adaptive and resilient to climate risks. This manual is one of the many references that the users may utilize in developing their respective development plans. The Climate Change Commission (CCC) is grateful to our partner, the Global Green Growth Institute (GGGI) – Philippines for providing the needed technical assistance in the development of this manual together with the technical team composed of individuals from the Resources, Environment, and Economics Center for Studies, Inc. (REECS).

Training Manual on Geographic Information Systems
v
Disclaimer This paper is a joint output of the Climate Change Commission (CCC) of the Government of the Philippines and the Global Green Growth Institute (GGGI) – Philippines. Neither the two parties nor any of its employees, nor any of its contractors, subcontractors or their employees, makes any warranty, express or implied, or assumes any legal liability or responsibility for the accuracy, completeness, or any third party’s use or the results of such use of any information, apparatus, product, or process disclosed, or represents that its use would not infringe privately owned rights. Reference herein to any specific commercial product, process, or service by trade name, trademark, manufacturer, or otherwise, does not necessarily constitute or imply its endorsement, recommendation, or favoring by the CCC and GGGI – Philippines or their contractors or subcontractors. The views and opinions of authors expressed herein do not necessarily state or reflect those of the CCC and GGGI – Philippines. Past performance is no guarantee of future results. Training Manual on Geographic Information Systems [electronic resource] / Published by the Climate Change Commission – Manila and the Global Green Growth Institute – Seoul: 2016. Includes bibliographical references ISBN 978-621-95649-1-5: Not for Sale

Training Manual on Geographic Information Systems
vi
Contents
PREFACE ............................................................................................................................. iv
Disclaimer ............................................................................................................................. v
I. Training Design .............................................................................................................. 1
1.1. Overview of the Manual .......................................................................................... 1
1.2. Learning Objectives ................................................................................................ 1
1.3. Expected Outputs ................................................................................................... 1
1.4. Criteria for Selection of Participants ........................................................................ 2
1.5. Length of Session ................................................................................................... 3
1.6. Course Methodology ............................................................................................... 4
1.7. Resource Requirements ......................................................................................... 5
1.8. Course Content ....................................................................................................... 5
1.9. Training Activity Flow .............................................................................................. 7
II. Toolkits .......................................................................................................................... 9
2.1. PowerPoint presentations ....................................................................................... 9
2.2. Case Study: Maribojoc, Bohol ................................................................................. 9
2.3. Exercises/ Practice Sets ....................................................................................... 19
III. Frequently Asked Questions (FAQs) ........................................................................ 44
IV. Capacity Assessment Tool ....................................................................................... 46
4.1. Pre-Training Assessment ...................................................................................... 46
4.2. Post Training Assessment .................................................................................... 47
V. Reading Materials/ References .................................................................................... 48

Training Manual on Geographic Information Systems
1
I. Training Design
1.1. Overview of the Manual
The mapping component of the Communities for Resilience (CORE) approaches and mainstreaming climate resilience and green growth in the larger set of local government units (LGUs) can be vastly improved with the available instruments, hardwares, and softwares. Over the last decade, the availability, accessibility, and ease of use of mapping technologies, especially with regard to Geographic Information Systems (GIS) technologies, have totally evolved in different picture and capacity. GIS technology is very dynamic. It is now considered a scientific approach to the fundamental issues raised by its use. As a new field of science, its key role in natural resources management, hazard and vulnerability assessment, land use management and classification, is evident in ensuring ecologically stable and climate-resilient local communities. Thus, GIS is a useful tool for the academe, decision makers, and local planners with respect to CORE Initiative projects. In the context of ecotowns as showcases of climate-resilient green growth, this manual will capture the basics of GIS and its processing techniques, along with spatial analysis, hazard assessment, land capability classification and land change modelling.
1.2. Learning Objectives
At the end of the training program, the participants will be able to:
• Demonstrate and guide LGUs in utilizing GIS during their respective CORE Capacity Development trainings;
• Explain the different techniques of spatial analysis in relation to CORE approaches; and
• Demonstrate the use of GIS in land use and land cover change analysis, and vulnerability assessment in light of the CORE Framework.
1.3. Expected Outputs
At the end of the training program, the participant trainers are expected to deliver the following outputs:
LGU’s ability to apply knowledge in GIS that can be used in their localities;
Decision makers’ creation of Climate Change Adaptation- Disaster Risk Reduction (CCA- DRR) policies, in which GIS can be also applied, and
GIS’ integration into the project proposals to be developed by local planners when applying for funding.

Training Manual on Geographic Information Systems
2
1.4. Criteria for Selection of Participants
Screening Parameters
Prospective Trainee
as Trainers
Local Managers and Decision-
makers
Local Technical Working
Group/Planner
Capacity to Train/ Educational Background
Must have experience in teaching/handling subjects related to: a. ENRA and NRA: natural resource assessment (includes forestry, fisheries, agriculture, marine and coastal, energy) and accounting, climate change impacts and disaster risk reduction management and rural development planning b. GIS and Vulnerability Assessment: forestry, agriculture, information technology, environmental science, biodiversity, disaster risk reduction management, climate change modelling, geography and rural development planning c. Project development and Financial Literacy: all subjects mentioned above, as all participants will attend this training session. Extensive knowledge in rural development planning is a plus.
Not necessary for decision makers
Capacity to train is not pre-requisite; Educational background: College graduate
Aptitude Have conducted trainings in the past
Not a prerequisite Have prior experience in planning or LGU assessments
Current and future functions in the workplace/relevant work experience
Must have been or presently engage with local government units in either extension
Have direct decision making authority on plans and programs of
Directly involved in either planning, environment, disaster

Training Manual on Geographic Information Systems
3
Screening Parameters
Prospective Trainee
as Trainers
Local Managers and Decision-
makers
Local Technical Working
Group/Planner
program of local planning projects
the local government unit;
management planning
With higher level of familiarity with local landscape, land use planning including local government programs and its regulatory elements
Decides or provides clear guidance on allocation of fund for the local government unit
Participated as member of technical working group in either land use planning, disaster planning, coastal resources management or solid waste management, and waste water management.
Experience Had prior training or experience in climate change adaptation and mitigation; vulnerability assessment; knowledge in GIS software
(Not required) Had prior training or experience in climate change adaptation and mitigation; some quantitative analysis skills
Other Prerequisites
Not retiring in the next six years
Not retiring in the next six years
Not retiring in the next six years; not job order holder or contractual employee of the LGU
1.5. Length of Session
For each topic in GIS, the ideal length of session in minutes is proposed below.
Topics Covered
Length of Sessions (mins)
From GIS Technology to Geomatics 10
Data Structure and Spatial Analysis 20
Transformation of paper maps to digital themes
Analytical cartography vs. spatial analysis
Common coordinate system, datums and projections, data structure and spatial analysis
GIS, Hazards and Disasters 90
GIS-based mapping and hazard assessment
Different types of hazards related to climate change

Training Manual on Geographic Information Systems
4
Topics Covered
Length of Sessions (mins)
Different steps in hazard mapping and assessment
GIS for Land Use Decision Making 30
Land capability classification and zoning
Land use planning issues
GIS for Local Governance 15
Community-based GIS
Poverty-mapping techniques
Land Change Modelling 15
Case Study: The case of Maribojoc, Bohol 300
1.6. Course Methodology
Different approaches will be employed to the topics covered during the training. While there will be lectures for all the topics, some involve exercises to measure the learning of the participants, and presentation of case studies to demonstrate the application of GIS in ecotown sites.
Topics Covered
Objectives Approach
From GIS Technology to Geomatics
At the end of the session, participants should have learned the history and origin of GIS.
Lecture/discussion using power point presentation
Data Structure and Spatial Analysis
At the end of the session, participants should have described the common coordinate systems, datums and projections, data structures and spatial analysis.
Lecture/discussion using power point presentation Transformation of paper maps
to digital themes
Analytical cartography vs. spatial analysis
Common coordinate systems, datums and projections, data structure and spatial analysis
GIS, Hazards, and Disasters At the end of the session, participants should have demonstrated the use of GIS in vulnerability assessment.
Lecture/discussion using power point presentation
GIS-based mapping and hazard assessment
Different types of hazards related to climate change
Different steps in hazard mapping and assessment
GIS for Land Use Decision Making
At the end of the session, participants should have learned land capability classification techniques.
Lecture/discussion using power point presentation
Land capability classification and zoning
Land use planning issues
GIS for Local Governance
Community- based GIS

Training Manual on Geographic Information Systems
5
Topics Covered
Objectives Approach
Poverty mapping techniques At the end of the session, participants should have learned community-based mapping techniques.
Lecture/discussion using power point presentation
Land change Modelling At the end of the session, participants should have acquired skills in land use and land cover change analysis.
Lecture /discussion using power point presentation
Case Study At the end of the session, participants should have demonstrated the use of GIS in CORE Initiave projects
Practical exercises
1.7. Resource Requirements
The following equipment are needed during the conduct of the GIS training:
Laptop/ netbook, preferably with window-based operating system
Universal serial bus (USB) or flash drives
LCD projector for PowerPoint presentations
Scratch papers and pens for exercises
GIS software (i.e., ArcGIS, IDRISI, or QGIS)
Google Earth Pro
Datasets (Shape files)
1.8. Course Content
The session on GIS contains the following topics: From GIS technology to Geomatics
This section traces the GIS operational definition and how this technology evolved into a new field of scientific endeavor that we now call Geomatics.
Data structure and spatial analysis
This section provides a brief discussion on the transformation of paper maps to digital themes with the advent of computers. A comparison is given between analytical cartography and spatial analysis. Discussions on common coordinate systems, datums and projections, data structures and spatial analysis is explored.
GIS, Hazards and Disasters
This part describes a GIS-based mapping and assessment to determine the area’s vulnerability to climate hazards. The assessment is undertaken by determining inherently sensitive areas brought by topography and their

Training Manual on Geographic Information Systems
6
exposure. Vulnerability or hazard maps will be prepared to show which areas in a municipality are highly susceptible to the adverse impacts of changing climate.
Of the many different types of hazards related to climate change, 1) flood, 2) drought, and 3) landslides are selected for assessment in the CORE approaches. In addition, this section intends to present different steps in hazard mapping and assessment related to the determination of exposed elements, analysis of population exposed to hazards, and the spatial extent to hazards.
GIS for Land Use Decision Making
One of the objectives of this module is to describe the land capability classification and zoning, which can be used by LGUs in prescribing appropriate management prescriptions and activities. These become necessary when addressing continuously varying quantitative spatial properties typical to land use planning. The advantage of homogenous land units resulting from land classification procedure allows the land to be allocated in a rational manner. The allocation of land units depends on the capability as well as suitability to a specific land use. Land use zones are delineated based on land capability. Thus, the output zonation and the indicative land uses are intended to provide a scientific basis for allocating the lands in the municipalities for various uses.
GIS for Local Governance
Local government units are probably the most effective players in mainstreaming the CORE Initiative. LGUs are at the frontline owing to their presence in various activities and developments in the area. In addition, LGUs are the operative entities that can sustain efforts at protecting and restoring forests and natural resources. Compared to other government agencies with similar concerns, LGUs have the ‘home advantage.’ Thus, having a GIS unit to handle the spatial databank of the organization is desirable. It is important to emphasize that GIS is a tool for better decision-making. This section describes a community-based GIS, and poverty mapping techniques in developing updated baseline information that can be used as basis for a systematic and organized rehabilitation and development of a certain locality.
Land Change Modelling
This part displays the different time window of land covers that are of interest in the change analyses conducted in the previous ecotown projects. These are valuable take-off points in mapping and visualizing existing land covers, as well as transition from other categories. Determining the land use and land cover change provide the basis for formulating corresponding restoration or reforestation interventions in the communities in particular, and the ecosystem in general.
As such this section shares a menu of viable land change modeling techniques, which participants can consider and use in the mapping their localities.

Training Manual on Geographic Information Systems
7
1.9. Training Activity Flow The CORE Capacity Development Training of Trainers is conducted in three batches. Each batch follows the training program presented below.
Time
Activity
Content
Responsible Unit
DAY 1 (PLENARY)
7:30- 8:00 AM Registration of participants Training secretariat
8:00- 8:30 AM
Preliminaries
National anthem
Welcome remarks
Climate Change Commission
(CCC)
Introduction of participants House rules
Training facilitator
8:30- 8:40 AM Overview and objectives of Training of Trainers Global Green
Growth Institute (GGGI)
8:40- 9:00 AM
CCC programs and initiatives
Orientation on the CORE Initiative and
the Ecotown Framework, and its
components
CCC
9:00- 9:30 AM
Ecotown Capacity Development and Support
Ecotown Project
Introduction on support Ecotown Project and its objectives and
activities
GGGI
9-30- 9:45 AM Open Forum
9:45- 10:15 AM Snacks/ Pre-test on all
modules
10:15- 12:00 NN Basics of
Ecotown/Communities Resilience (CORE)
Ecotown/CORE framework and its
components
CORE Component team leader
12:00- 1:15 PM Lunch
1:15- 4:45 PM
Project development (PD) Part 1
Project development cycle, project development
procedures and steps
Project Development
expert
4:45- 5:00 PM Open forum
5:00 PM End of day 1 sessions
DAY 2 (Breakout/Parallel sessions)
7:30 AM Registration Training secretariat
8:00- 8:30 AM
Recap Breakout session
mechanics
Training facilitator
8:30- 12:00 NN
Breakout session 1:
Natural Resource Assessment (NRA)/
Environment and Natural
Introduction to NRA NRA expert

Training Manual on Geographic Information Systems
8
Time
Activity
Content
Responsible Unit
Resources Accounting (ENRA)
Breakout session 2: Vulnerability & Risk
Assessment (VRA) and Geographic Information
System (GIS)
Introduction to Vulnerability and Risk Assessment
(VRA)
Regional and Local Climate Change
Vulnerability Assessment
Expert
12:00- 1:15 PM Lunch
1:15 – 5:00 PM
Breakout session 1 (continuation):
ENRA
Foundation of ENRA and Valuation Approaches
ENRA expert
Breakout session 2: VRA and GIS
Principles, concepts, and frameworks in
VA
VRA expert
5:00 PM End of day 2 sessions
DAY 3 (Breakout/ Parallel sessions)
7:30 AM Registration Training secretariat
8:00- 12:00 NN
Breakout session 1: ENRA
Developing Municipal ENRA; Development of
physical account; Social Accounting
Approach to generating Municipal Accounts estimating
generating gross value added
ENRA expert
Breakout session 2: VRA and GIS
Fundamentals of GIS, data structure, and spatial analysis, GIS-based mapping
and assessment, and uses of GIS
GIS expert
12:00-1:15 PM Lunch
1:15- 5:00 PM
Breakout session 1 (continuation):
NRA and ENRA
ENRA and climate change; use of NRA and ENRA for local CC mitigation and
adaptation planning
ENRA expert
Breakout session 2:
VRA and GIS Workshop on
VRA/GIS GIS expert
5:00 PM End of day 3 sessions
DAY 4 (PLENARY SESSIONS)
7:30 AM Registration Training secretariat
8:00- 12:00 NN
Financial literacy Funding windows
and financial mechanisms
Financial literacy expert
12:00- 1:15 PM Lunch

Training Manual on Geographic Information Systems
9
Time
Activity
Content
Responsible Unit
1:15- 5:00 PM Project development
Workshop: Project proposal
preparation; Presentation of
workshop outputs
Project development
expert
5:00 PM End of day 4 sessions
DAY 5 (PLENARY SESSION)
8:00 AM Registration Training secretariat
8:30- 12:30 NN Continuation of session:
Project development
Workshop: Project proposal
preparation; Presentation of
workshop outputs
Project development
expert
12:30- 1:30 PM Lunch
1:30- 2:30 PM Open forum
2:00- 2:30 PM Post-test by topic/group
2:30- 3:00 PM
After activity review (AAR): Comments and
recommendations on the training
Participants will be asked on what they
liked, do not like, and suggestions to
improve module content, format, and
delivery
Training facilitator
3:00- 3:45 PM Next stops CCC
3:45- 4:00 PM Closing session CCC
II. Toolkits
2.1. PowerPoint presentations
PowerPoint presentations on GIS, which are attached as separate materials will be shared to all the participants of the CORE Convergence Initiative Capacity Development Project. The presentations are also made available electronically through the repository online account officially administered by the Climate Change Commission (CCC). 1
2.2. Case Study: Maribojoc, Bohol
2.2.1. Brief Profile: The Municipality of Maribojoc
Maribojoc is a coastal town located at the southwestern portion of the Province of aohol, Philippines, famous for its Punta Cruz Historical Watchtower, the old Holy Cross
1 Slide presentations of all the CORE Modules can be accessed at Dropbox: https://www.dropbox.com/home/CCC%20-
%20Training%20of%20Trainers%20(TOT)

Training Manual on Geographic Information Systems
10
Church, the scenic Maribojoc Bay, the panoramic mountain ranges, the emerging Abatan River Tour, and its hospitable and peace-loving people. Maribojoc is bounded on the northeast by the Municipality of Antequera, on the northwest by the Municipality of Loon, on the southwest by the Bohol Strait and on the southeast by the Abatan watershed. The Abatan River is the main drainage system that provides freshwater to the town of Maribojoc. 2.2.2. The Climate Profile
Baseline climate Based on Modified Corona’s Classification System, the area has a Type IV climate, which is characterized by more or less evenly distributed rainfall throughout the year. The climate is influenced by southwest originating monsoons, and is relatively dry from March to May. The wet season is from June to December, with mean monthly rainfall averaging about 30 mm to 305 mm. The wettest months are October and November.
Bohol is frequently visited by typhoons or cyclones. A total of 20 tropical cyclones passed within 50 km of the watershed between 1948 and 2009. Bohol often experiences erratic and extreme weather events. On average, the area is visited by 3 typhoons per year. It is during November and December when the most number of cyclones would cross the province, whereas the months of July to September are almost free of tropical cyclones. Climate scenario for Bohol in 2020 and 2050 In order to assess future vulnerabilities of forestry and other key sectors based on climate scenarios, projections of future changes in temperature and rainfall in 2020 and 2050, prepared by the Philippine Atmospheric, Geophysical, Astronomical and Space Administration (PAGASA) are used. The outputs of the model runs for the observed monthly, and changes in the monthly rainfall both in 2020 and 2050, are used in the vulnerability assessments in all sectors.
2.2.3. Hazard Assessment A GIS-based mapping and assessment are conducted to determine the area’s vulnerability to climate hazards. The assessment is undertaken by determining inherently sensitive areas brought by topography and its exposure. Vulnerability or hazard maps are prepared to show which areas in the watershed or even municipality require immediate attention to minimize the adverse impacts of changing climate. The assessment made use of simulated hazard maps derived from overlay analyses associated with different variables based on the observed and projected climate scenarios. Hazard mapping and assessment are conducted using seven different steps. The first five steps relate to the determination of exposed elements and analysis of population exposed to hazards, whereas the two last steps cover the analysis of spatial extent to hazards:

Training Manual on Geographic Information Systems
11
1. Data Collection
An exhaustive collection, examination and analysis of existing documents are conducted. The GIS geodatabase used in the overlay analysis is derived from the information contained in the sources and satellite data.
Table 1. Available datasets for the assessment
Layer
Description Source
Municipal boundary Extent of assessment PPDO of Bohol; NAMRIA
Fault lines Fault lines of the Philippine Islands PHILVOCS
Geology Soil morphology FAO datasets; BSWM
Soil series/ Soil texture
Soil series map BSWM (1965; 2005)
Barangay Barangay map PPDO of Bohol; NAMRIA; www.philgis.org
DEM Digital Elevation Model of the Philippines
ASTER-GDEM
River River networks within the area NAMRIA-DENR; PPDO of Bohol
Standardized Precipitation Index
Computed based on monthly average rainfall
Derived
Land cover 2010 Land Cover Map NAMRIA-DENR
Vegetative Index Derived from land satellite 8 imageries
www.earthexplorer.usgs.gov
Rainfall Daily rainfall data Tagbilaran Weather Station; PAGASA
Population Density Based on 2010 population distribution by barangay
National Statics Office
Watershed shape Based on sub-watersheds shape Interpolated from DEM
2. Coordination with various stakeholders
Planning field activities with relevant stakeholders of the LGU and related agencies, including identifying key informants, respondents, and field guides.
3. Site reconnaissance
Ocular surveys are undertaken to familiarize with prevailing conditions in the area.

Training Manual on Geographic Information Systems
12
4. Collection and validation of spatial information
Field data gathering and ground trothing surveys conducted in coordination with LGUs, especially the (Municipal Environment and Natural Resource Officer) MENRO and concerned local communities.
5. Preparation of GIS-based hazard mapping and assessment
Hazard assessments can be conducted based on different factors and their relative weights.
2.2.4. Spatial Assessment of Exposure to Hazard
Flood susceptibility (a. observed, b. 2020s period, and c. 2050s period) based on the medium-range emission scenario (A1B) in Maribojoc, Bohol Flood is commonly defined as an overflow of water onto normally dry land. It is also described as the inundation of a normally dry area caused by rising water in existing river networks and waterways. In this assessment, flood scenarios are generated given physical factors, vegetative conditions, and rainfall amounts based on PRECIS model with a scenario in the 2020s and 2050s periods.
a.

Training Manual on Geographic Information Systems
13
b
c

Training Manual on Geographic Information Systems
14
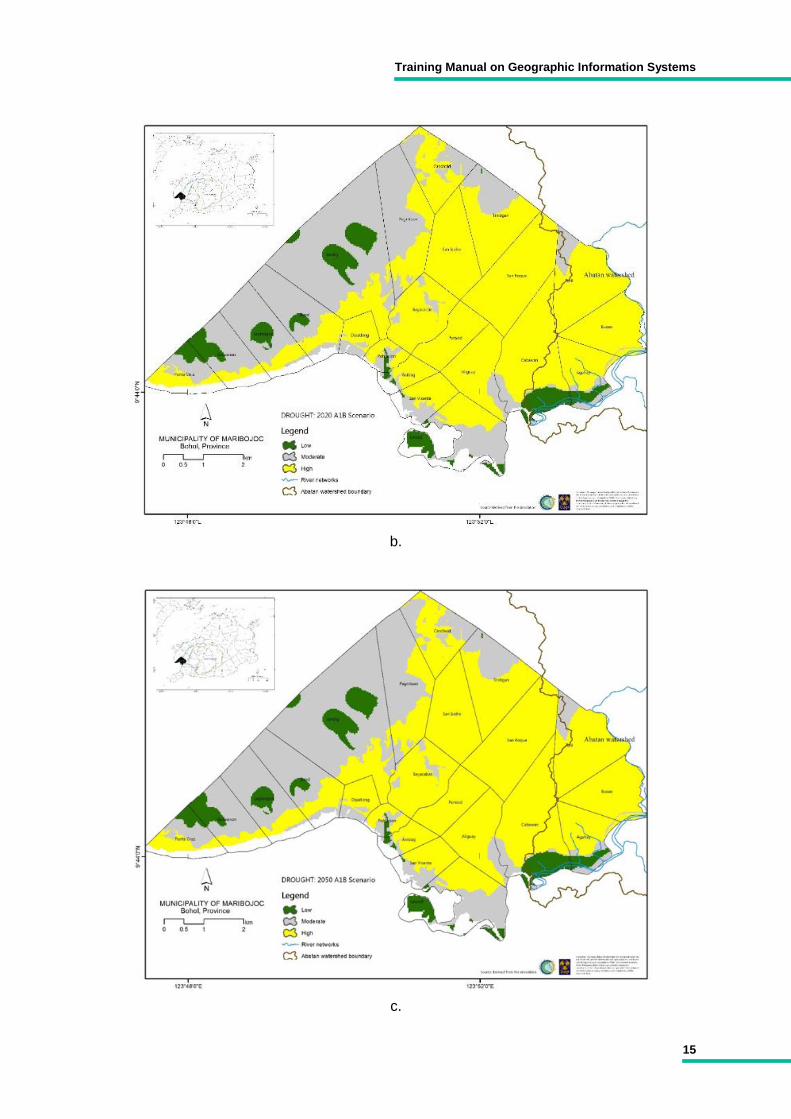
The assigned colors represent specific categories and translate into susceptibilities. In short, it is the possibility of floods covered by each colored representation. However, susceptibility flooding, if any cannot be equated with floodwaters. In particular, the blue color suggests the areas covered are highly susceptible to flooding at any given event. Although it is categorized in one single category, this does not mean that the entire town will be under flooding all at the same time at any given event, but rather depending on the magnitude of rainfall and influence of associated factors. Drought vulnerability (a. observed, b. 2020s period, and c. 2050s period) based on the medium-range emission scenario (A1B) in Maribojoc, Bohol The vulnerability to drought is assessed primarily based on precipitation exposure, influence, and distribution. As a whole, drought in Bohol province would take place from January to May. Results of simulation show that the months of January and May are regarded to be nearly normal (0 to -1), and months of February to April are considered as moderately dry (-1.0 to -1.5). The remaining months are definitely under wet season, which would exhibited a very wet index during October to November. Essentially, the computed SPI can effectively represent the amount of rainfall over a given time scale, with the advantage that it provides not only information on the amount of rainfall, but also gives an indication of how this amount fares relative to the normal.
a.
Training Manual on Geographic Information Systems
15
b.
c.
Training Manual on Geographic Information Systems
16
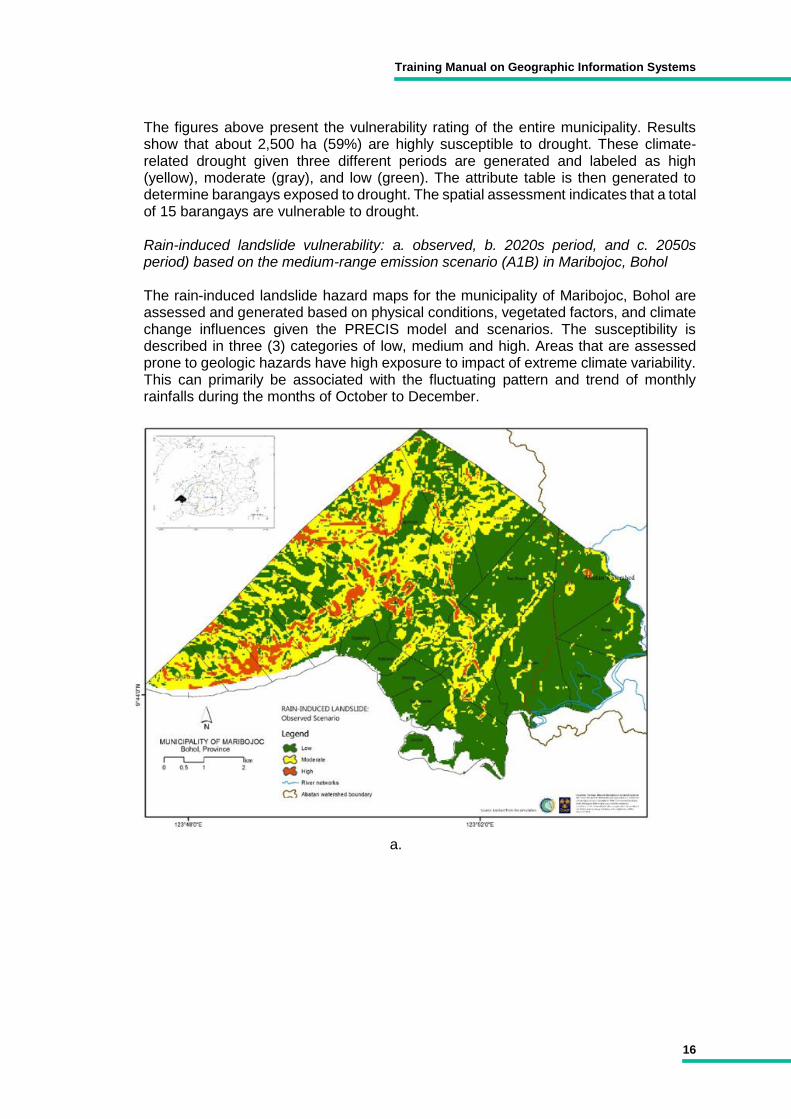
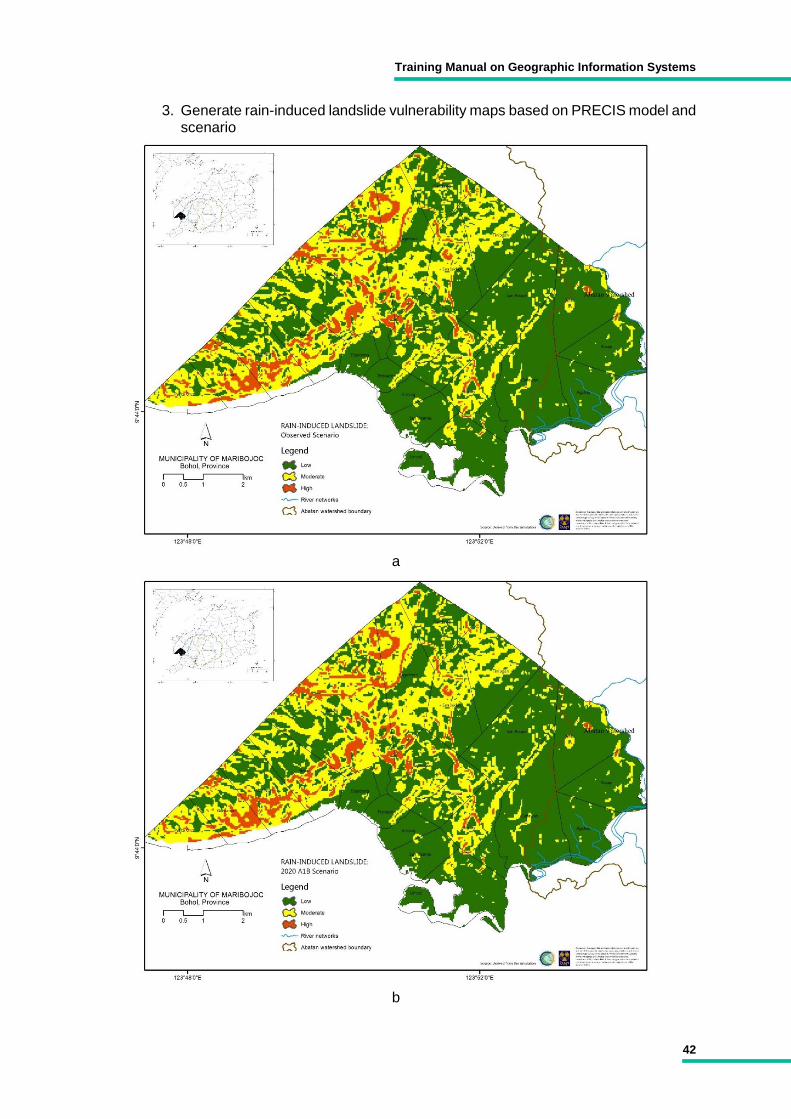
The figures above present the vulnerability rating of the entire municipality. Results show that about 2,500 ha (59%) are highly susceptible to drought. These climate-related drought given three different periods are generated and labeled as high (yellow), moderate (gray), and low (green). The attribute table is then generated to determine barangays exposed to drought. The spatial assessment indicates that a total of 15 barangays are vulnerable to drought. Rain-induced landslide vulnerability: a. observed, b. 2020s period, and c. 2050s period) based on the medium-range emission scenario (A1B) in Maribojoc, Bohol The rain-induced landslide hazard maps for the municipality of Maribojoc, Bohol are assessed and generated based on physical conditions, vegetated factors, and climate change influences given the PRECIS model and scenarios. The susceptibility is described in three (3) categories of low, medium and high. Areas that are assessed prone to geologic hazards have high exposure to impact of extreme climate variability. This can primarily be associated with the fluctuating pattern and trend of monthly rainfalls during the months of October to December.
a.

Training Manual on Geographic Information Systems
17
b.
c.

Training Manual on Geographic Information Systems
18
Portions of nine (9) barangays are found as highly vulnerable areas. Most of these areas are apparent in the fragmented mountainous western portions of the town. Landslide-prone areas are evident in barangays of Bood, Guiwanon, Jandig, Lagtangon, Pagnitoan, and Punta Cruz under the observed and 2020s periods. However, a portion of four (4) barangays (i.e., Aliguay, Bayacabac, Punsod, and San Isidro) would also be susceptible under the 2050s scenario period. It must be noted that this susceptibility level involves a portion only and not the entire barangay. The incidence of landslide usually happens in steep slopes along roadsides. This natural event generally occurs during heavy and continuous rains. 2.2.5. Land Capability Classification
The assessment used the land capability evaluation tool in conducting adaptive capacity assessment. Land capability evaluation is a strategic planning tool in integrating climate change. The tool was used as part of a vulnerability assessment under the MDG-F 1656 project for the purpose of developing an integrated watershed management plan. The tool is patterned after the vulnerability assessment (VA) framework by observing the process of problem identification, implementation, and assessment, following the steps of Land Capability Classification Process.
The figure above describes the land capability classification of the municipality of Maribojoc, Bohol. About 40% of the town can be classified as protection areas, while the remaining 60% can be categorized as production areas. Stream buffer areas are essential for the rivers that serve as filters to incoming sediments and other pollutants. These buffers that are supposed to be covered with vegetation are also excellent protection of the streamflow against excessive solar exposure to keep water temperature at ideal level. Stream buffer areas that are

Training Manual on Geographic Information Systems
19
currently covered with mangrove (35 ha), annual crop (12 ha), and built-up (11 ha) or otherwise have inadequate vegetation, must be targeted for re-vegetation using mangrove species. The multiple use system that is envisioned for the area is the multi-storey system. This will provide income generation opportunities for farmers and at the same time enhance the ability of the area to remain ecologically stable. Potentially, the areas that can be devoted for multiple use development include areas that are currently having perennial crop (650 ha), shrubs (190 ha), and mangrove forest (50 ha). Unlimited production areas for settlement and commercial purposes consist mostly of areas that are currently used for the same purposes. As the town’s population continuously grows, the settlement and community areas may expand only to production areas immediately adjacent to the existing areas. By no means, the areas for settlement and community purposes should be permitted to extend in multiple use or even in the protection areas, as this will likely compromise the ecological and environmental integrity of the area.
2.3. Exercises/ Practice Sets
a. GIS – Mapping Exercise: Instructions
Do the following:
1. This exercise shall be accomplished together with your selected partner in the training.
2. Each participant must have installed a GIS software either commercial or open source.
3. Copy the provided datasets of the Maribojoc, Bohol in your hard disk. 4. Perform, analyze, and generate land use change, land capability classification,
and vulnerability assessment of the given municipality.
b. Brief Profile: The Municipality of Maribojoc
Maribojoc is a coastal town located at the southwestern portion of the Province of Bohol, Philippines, famous for its Punta Cruz Historical Watchtower, the old Holy Cross Church, the scenic Maribojoc Bay, the panoramic mountain ranges, the emerging Abatan River Tour, and its hospitable and peace-loving people.
Maribojoc is bounded on the northeast by the Municipality of Antequera, on the northwest by the Municipality of Loon, on the southwest by the Bohol Strait, and on the southeast by the Abatan Watershed. The Abatan River is the main drainage system that provides freshwater to the town of Maribojoc.

Training Manual on Geographic Information Systems
20
2.3.1. Practice # 1: Determine the area coverage of different barangays in Maribojoc, Bohol
Table 2. List of barangays in the Municipality of Maribojoc, Bohol
Barangay
Estimated Area (ha) Percent of total area
Agahay 172.14 3.24
Aliguay 205.82 3.87
Anislag 76.97 1.45
Bayacabac 216.37 4.07
Bood 264.15 4.97
Busao 206.34 3.88
Cabawan 410.88 7.73
Candavid 209.19 3.94
Dipatlong 82.00 1.54
Guiwanon 195.86 3.69
Jandig 729.64 13.73
Lagtangon 254.68 4.79
Lincod 289.82 5.45
Pagnitoan 341.44 6.43
Poblacion 62.33 1.17
Punsod 143.25 2.70
Punta Cruz 151.89 2.85
San Isidro 243.29 4.58
San Roque 357.05 6.72
San Vicente 125.32 2.36
Tinibgan 290.04 5.46
Toril 285.78 5.38
Total 5314.26 100
c. The Climate Profile
Baseline climate
Based on Modified Corona’s Classification System, the area has a Type IV climate, which is characterized by more or less evenly distributed rainfall throughout the year (Agpaoa et al., 1975). The climate is influenced by southwest originating monsoons, and is relatively dry from March to May. The wet season is from June to December with mean monthly rainfall of about 30 mm to 305 mm. The wettest months are October and November (Table 1).
Bohol is frequently visited by typhoons or cyclones. A total of 20 tropical cyclones passed within 50 km of the watershed between 1948 and 2009. Bohol often experiences erratic and extreme weather events. On average, the area is visited by 3 typhoons per year. It is during November and December when the most number of cyclones cross the province, whereas the months of July to September are almost free of tropical cyclones.

Training Manual on Geographic Information Systems
21
Table 3. Mean monthly rainfall based on based on Tagbilaran Weather Station (2004 - 2010)
Year/ Mo
2004 2005 2006 2007 2008 2009 2010 Average Minimum Maximum
JAN 64.4 26.2 95.7 185.5 264.7 67.1 100.4 114.9 26.2 264.7
FEB 97.7 1.3 130.7 25.1 202.8 190.3 20.9 95.5 1.3 202.8
MAR 79.3 78.8 183.6 31.8 236.5 160.8 31.2 114.6 31.2 236.5
APR 12.4 60.1 41.5 26.2 107.1 174.6 89.5 73.1 12.4 174.6
MAY 185.5 42.9 66.8 124.1 179.2 113 47.3 108.4 42.9 185.5
JUN 148 137.5 125 244.1 294 163.2 148.8 180.1 125 294
JUL 116.6 133.1 103.6 141.3 155.3 116.5 164.3 133.0 103.6 164.3
AUG 109.4 129.5 111.5 50.5 241 30.6 137.8 115.8 30.6 241
SEP 109.4 81.3 72.6 154.2 131.1 74.2 206.5 118.5 72.6 206.5
OCT 102.1 92.5 140.5 214.6 176.2 22.7 305.1 150.5 22.7 305.1
NOV 111.5 204.7 170 161.3 120.9 294.6 140.6 171.9 111.5 294.6
DEC 73.2 269.6 157.9 170.4 164.3 56.6 282.6 167.8 56.6 282.6
Total 1210 1258 1399 1529 2273 1464 1675 1544
Climate scenario for Bohol in 2020 and 2050
In order to assess future vulnerabilities of forestry and other key sectors based on climate scenarios, projections of future changes in temperature and rainfall in 2020 and 2050 prepared by PAGASA using PRECIS model, will be used. In this assessment, the medium-range scenario is with a planning horizon of up to 2050. Outputs of the model under the A1B and A2 scenarios will only diverge after 2050 due to the long lifetime of greenhouse gases. The outputs of the model run for the observed months, and changes in the monthly rainfall both in 2020 and 2050 will be used in the vulnerability assessments in all sectors (Figure 1).
Figure 1. Projected Change in the Mean Monthly Temperature (°C) under Medium-range Emission Scenario (A1B) of Tagbilaran City, Bohol
The numerical values of the estimated observed (1971-2000) change, and projected values of mean monthly temperatures in °C in 2020 (2006-2035) and 2050 (2036-2065) under the medium range emission scenario are presented in Table 2.

Training Manual on Geographic Information Systems
22
Table 4. Estimated changes in average monthly temperature by 2020 and 2050
Layer/ Factor
Classification
Relative Weights Layer/ Factor
Relative Weights
Layer/ Factor
Classification Relative Weights
Jan 26.5 1 1.8 27.6 28.4
Feb 26.6 1 2.1 28.1 29.2
Mar 27.1 1.2 2.4 29.2 30.4
Apr 28 1.3 2.3 30 31
May 28.7 1.1 2.3 29.5 30.7
Jun 28.4 1.1 2 29.3 30.2
July 28.2 1 2 29.5 30.5
Aug 28.5 0.9 1.8 29.2 30.1
Sept 28.3 1 1.9 28.9 29.8
Oct 27.9 1 2 28.5 29.5
Nov 27.5 0.8 1.9 27.8 28.9
Dec 27 0.9 1.9 23.6 24.6
On the other hand, Figure 2 presents the projected change in monthly average rainfall (mm) under the medium-range emission scenario (A1B) in 2020 and 2050. Table 3 shows the estimated mean monthly rainfall (1971 – 2000), and the corresponding projected changes in 2020 and 2050 under the medium-range emission scenario (A1B) in Tabilaran City, Bohol. The climate datasets extended its influences within the municipality of Maribojoc.
Figure 2. Projected monthly rainfall change under Medium-range Emission Scenario (A1B) in Tagbilaran City, Bohol
Training Manual on Geographic Information Systems
23
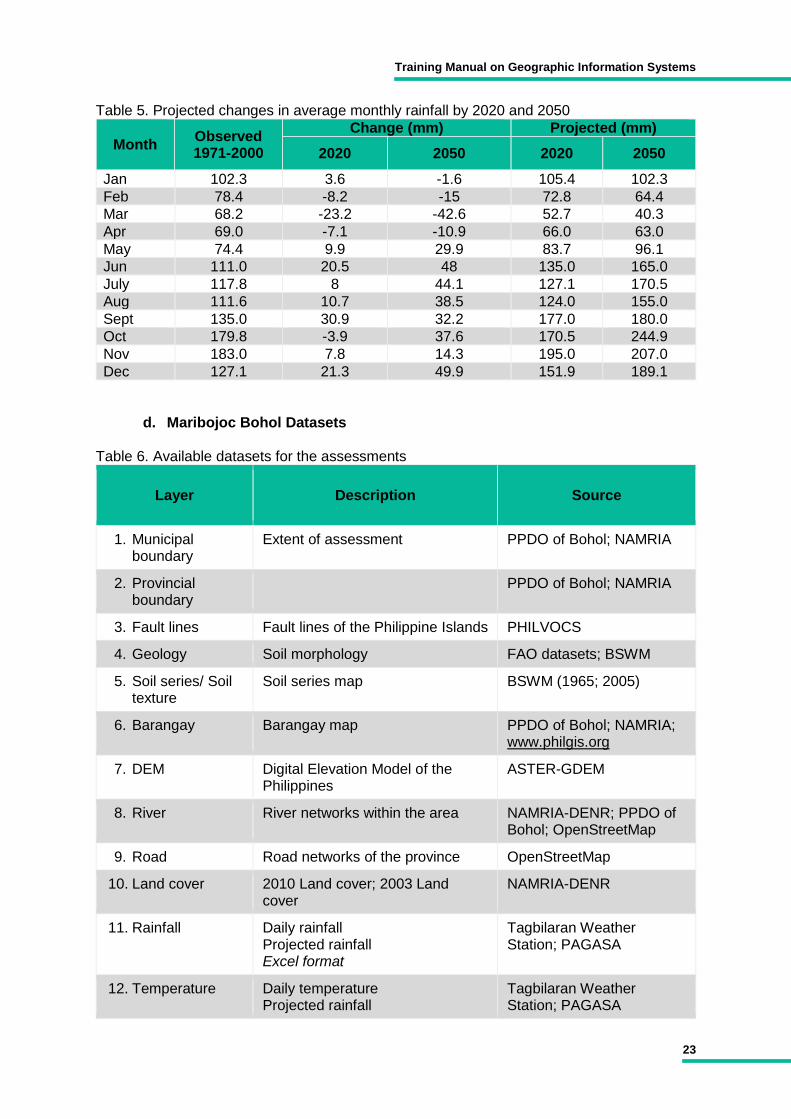
Table 5. Projected changes in average monthly rainfall by 2020 and 2050
Month
Observed 1971-2000
Change (mm) Projected (mm)
2020 2050 2020 2050
Jan 102.3 3.6 -1.6 105.4 102.3
Feb 78.4 -8.2 -15 72.8 64.4
Mar 68.2 -23.2 -42.6 52.7 40.3
Apr 69.0 -7.1 -10.9 66.0 63.0
May 74.4 9.9 29.9 83.7 96.1
Jun 111.0 20.5 48 135.0 165.0
July 117.8 8 44.1 127.1 170.5
Aug 111.6 10.7 38.5 124.0 155.0
Sept 135.0 30.9 32.2 177.0 180.0
Oct 179.8 -3.9 37.6 170.5 244.9
Nov 183.0 7.8 14.3 195.0 207.0
Dec 127.1 21.3 49.9 151.9 189.1
d. Maribojoc Bohol Datasets
Table 6. Available datasets for the assessments
Layer
Description Source
1. Municipal boundary
Extent of assessment PPDO of Bohol; NAMRIA
2. Provincial boundary
PPDO of Bohol; NAMRIA
3. Fault lines Fault lines of the Philippine Islands PHILVOCS
4. Geology Soil morphology FAO datasets; BSWM
5. Soil series/ Soil texture
Soil series map BSWM (1965; 2005)
6. Barangay Barangay map PPDO of Bohol; NAMRIA; www.philgis.org
7. DEM Digital Elevation Model of the Philippines
ASTER-GDEM
8. River River networks within the area NAMRIA-DENR; PPDO of Bohol; OpenStreetMap
9. Road Road networks of the province OpenStreetMap
10. Land cover 2010 Land cover; 2003 Land cover
NAMRIA-DENR
11. Rainfall Daily rainfall Projected rainfall Excel format
Tagbilaran Weather Station; PAGASA
12. Temperature Daily temperature Projected rainfall
Tagbilaran Weather Station; PAGASA
Training Manual on Geographic Information Systems
24
Layer
Description Source
Excel format
13. Population Density
Based on 2010 population distribution by barangay
National Statics Office
14. Watershed shape
Based on sub-watersheds shape Interpolated from DEM
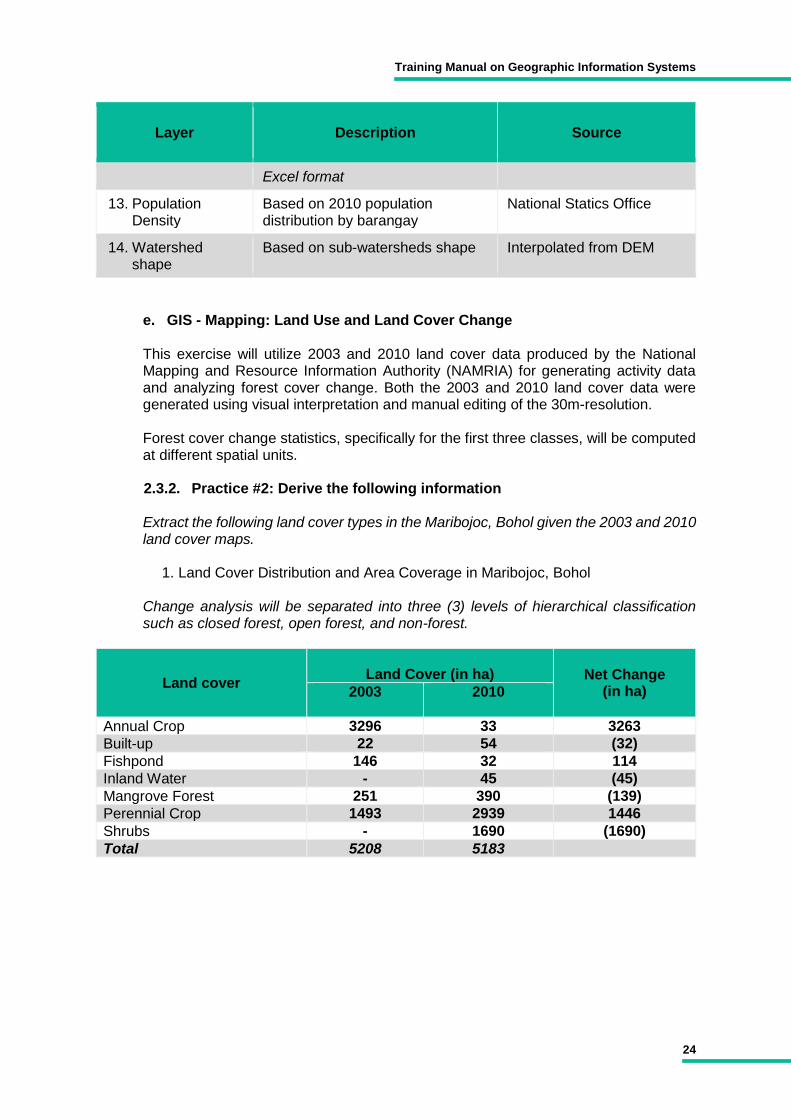
e. GIS - Mapping: Land Use and Land Cover Change
This exercise will utilize 2003 and 2010 land cover data produced by the National Mapping and Resource Information Authority (NAMRIA) for generating activity data and analyzing forest cover change. Both the 2003 and 2010 land cover data were generated using visual interpretation and manual editing of the 30m-resolution. Forest cover change statistics, specifically for the first three classes, will be computed at different spatial units. 2.3.2. Practice #2: Derive the following information Extract the following land cover types in the Maribojoc, Bohol given the 2003 and 2010 land cover maps.
1. Land Cover Distribution and Area Coverage in Maribojoc, Bohol
Change analysis will be separated into three (3) levels of hierarchical classification such as closed forest, open forest, and non-forest.
Land cover
Land Cover (in ha) Net Change
(in ha) 2003
2010
Annual Crop 3296 33 3263
Built-up 22 54 (32)
Fishpond 146 32 114
Inland Water - 45 (45)
Mangrove Forest 251 390 (139)
Perennial Crop 1493 2939 1446
Shrubs - 1690 (1690)
Total 5208 5183

Training Manual on Geographic Information Systems
25
2. Computation of Change Analysis by Category
Category
Between 2003 and 2010
2003
2010
Net Change
Closed forest 0 0 0
Open forest 0 0 0
Non-forest 0 0 0
Transition analysis will be categorized into three classes: (1) closed forest to non-forest; (2) closed forest to open forest; and (3) open forest to non-forest.
3. Estimated Forest Degradation and Deforestation in Maribojoc, Bohol
Transition
(2003-2010 datasets) Remarks
From To Area (ha) Annual (ha/yr)
Closed forest Open forest 0 0 Forest degradation
Closed forest Non-forest 0 0
Forest loss (deforestation) Open forest Non-forest 0
f. GIS - Mapping: Land Capability Classification
1. Generation of Soil Erosion Potential
Soil erosion potential (SEP) can be estimated given the relationship of rainfall (R), soil (K), slope (S), plant cover and farming techniques (C), and erosion control practices (P). SEP is computed using the equation below. The C will be excluded because it can easily be altered by the activities of man.
𝑆𝐸𝑃 = 𝑅 × 𝐾 × 𝑆
Each factor is classified into five (5) categories ranging from very low to very high classes. The different factors are described below:
Layer/ Factor
Classes/ Ranges
Relative weights
Annual Rainfall, mm
<500 1
500 – 1000 2
1000 – 1500 3
1500 – 2000 4
>2000 5
Slope (% ranges)
<8 1
8 – 18 2
18 – 30 3
30 – 50 4
>50 5

Training Manual on Geographic Information Systems
26
Layer/ Factor
Classes/ Ranges
Relative weights
Soil Type
Sand clay, Silty clay, Clay 1
Clay loam; Sandy clay loam; Silty clay loam;
2
Loam; Silt loam; Silt 3
Sandy loam 4
Sand, loamy sand 5
2. Creation of Soil Loss Tolerance
Soil loss tolerance limit of a watershed is a common expression of SEP estimates. The T value is an expression of the maximum soil loss that an area can sustain without regressing in productivity permanently or temporarily. It is a function of the rate of soil accumulation in an area that is dependent on the slope of an area. Hence, the slope can be reclassified according to its soil loss tolerable limits:
Prescribed soil loss tolerance in the area.
Slope
Soil Loss Tolerance (ton/ha)
0 - 3 12
3 - 8 10
8 - 18 8
18 - 30 6
30 – 50 4
>50 2
3. Determination of Soil Erosion Index
The computation of soil erosion index (SEI) is essential to standardize SEP estimates. As it is, the SEP per se when directly used as indicator of sensitivity or susceptibility of an area to soil erosion, does not capture the full weight of slope as a determinant of soil erosion in an area. Hence, the equation is as follows:
𝑆𝐸𝐼 = 𝑆𝐸𝑃
𝑆𝐿𝑇
4. Land capability classification
Land capability classification is derived based on soil erosion index and other criteria. Five (5) major zones are identified in the area. The classification and management prescriptions are intended to provide a scientific basis for allocating the lands to various uses. Protection Areas
Protection areas are designated mainly for the conservation of biodiversity; conservation of soil and water; protection of unique habitats, vegetation, geologic formation and landscape, and areas of socio-cultural values; and

Training Manual on Geographic Information Systems
27
minimizing climate-related and other natural risks and hazards associated with soil erosion, landslides, and floods.
Stream Buffer Areas
The banks of rivers and streams, and the shores of the seas throughout their entire length and within a zone of 3 m in urban areas, 20 m in agricultural areas, and 40 m in forest areas, along their margins, are subject to easement of public use in the interest of recreation, navigation, float age, fishing and salvage. This provision is mandated by law (Section 17, Presidential Decree [PD] 705) and is pursuant to the provisions of the Water Code.
Production Areas
The production zone is made up of lands that are suited for intensive land uses such as farming, multiple use forestry, and other uses requiring disturbance of the soil and other resources found in the area.
Multiple Use Zone
The multiple use system that is envisioned for the area is the multi-storey system.
Limited Production Zone
Limited production zone can be allocated as agricultural areas that are classified within alienable and disposable lands.
Unlimited Production Zone
Areas for settlement and commercial purposes consist mostly of areas that are currently used for the same purposes.
5. Land capability classification Criteria
Class
Land Classification SEI Considerations
I PROTECTION AREAS
IA Strict Protection Zone
>3 All remaining natural forests; Areas with high erosion potential Slope >50% All key biodiversity areas All areas categorized as SAFDZ All areas above 1,000 masl (DENR, 1991)
IB Protection Buffer Zone
Banks of rivers and streams and the shores of the seas throughout their entire length and within a zone of 3 m in urban areas, 20 m in agricultural areas and 40 m in forest areas, along their margins. (PD 705, Section 17 and pursuant to the provisions of the Water Code)
II PRODUCTION AREAS
0 - 3
IIA Unlimited Production Zone
0 - 1 Built-up areas Slope less than 18%
IIB Multiple Use Zone 1 - 2 Open brushland and grass land areas

Training Manual on Geographic Information Systems
28
Class
Land Classification SEI Considerations
Slope less than 18%
IIC Limited Production Zone
2 - 3 Slope less than 18%
2.3.3. Practice #3. Generate Land Capability Classification
1. Prescribed land capability classification and its hazard limitations and management prescriptions
Class
Land
Classification
Management Prescriptions
Area (ha) Hazard
Considerations
1 PROTECTION AREAS (40%)
1A Strict Protection
Zone Conservation of
biodiversity; 1825 Landslide
1B Stream Buffer
Zone soil and water conservation;
142 Flooding
2 PRODUCTION AREAS (60%)
2A Unlimited
Production Zone
Planting of annual and perennial crops such corn,
banana, rice, yum, and other high value crops;
Settlement can be allowed
1698 Flooding Drought
2B
Multiple Use Zone
Multi-storey timber (Kakauate) and fruit tree
plantations (Mango), agroforestry can be allowed with suitable soil and water
conservation measures
883 Flooding Drought
2C Limited Production
Zone
Multi-storey timber, fruit tree plantations, and
coconut plantations are suitable in this area
419 Flooding Drought
2. Prescribed land capability classification map for the Municipality of Maribojoc,
Bohol

Training Manual on Geographic Information Systems
29
3. Area distribution of the land capability classification based on 2010 land cover
Land Cover (2010)
Protection areas (ha)
Production areas (ha)
Protection zone
Stream Buffer Zone
Unlimited Production
Multiple Use Zone
Limited Production Zone
Built up 11 1 33 5 3
Mangrove forest 35 39 195 49 14
Fishpond - 4 23 3 1
Inland water 1 7 23 5 1
Annual crop 12 - 11 5 5
Shrubs 1210 27 106 190 157
Perennial crop 607 68 1354 651 251
g. GIS - Mapping: Vulnerability Assessment
1. Flood Hazard Assessment
Each factor is classified into five (5) categories ranging from very low to very high classes. The different factors are described below:
A. SENSITIVITY
SENSITIVITY
Layer/ Factor
Classes/ Ranges
Relative weights
Elevation (ranges in m asl)
>150 1
80 – 150 2
40 – 80 3
20 – 40 4
<20 5
Slope (% ranges)
>30 1
18 – 30 2
8 – 18 3
3 – 8 4
0 – 3 5
Soil Series Fine sand 1
Sandy loam; Fine sandy loam 2
Loam; Sandy clay loam; Sandy clay; Silty clay; Silt loam
3
Silty clay loam; Clay loam 4
Clay 5
Land cover Closed forest 1

Training Manual on Geographic Information Systems
30
SENSITIVITY
Layer/ Factor
Classes/ Ranges
Relative weights
(categories)
Open forest; Plantation 2
Shrubs; Natural grassland 3
Agricultural/Cultivated; Pasture land; Built-up
4
Bare; Water bodies; Inland water; Mangrove forest
5
Rainfall (Annual, mm)
<1500 1
1500 - 2000 2
2000 - 2500 3
2500 - 3000 4
>3000 5
B. EXPOSURE
EXPOSURE
Layer/ Factor
Classes/ Ranges
Relative weights
Proximity to streams and rivers (buffer ranges in m)
<100 5
100 – 200 4
200 – 300 3
300 – 500 2
>500 1
Watershed shape (ratio; descriptive)
<0.25 (almost elongated) 1
0.25 – 0.40 2
0.40 – 0.60 3
0.60 – 0.80 4
>0.80 (almost circular) 5
Frequency of flooding
None 1
Once 2
2x 3
3x 4
>4x 5

Training Manual on Geographic Information Systems
31
C. ADAPTIVE CAPACITY
ADAPTIVE CAPACITY
Layer/ Factor
Classes/ Classification
Relative weights
Updated maps of flood prone areas
Fully updated 1
Partially updated 3
Not updated 5
Availability of annual historical flood data
Available 1
Partially available 3
Not available 5
Access to flood forecasting information
Accessible 1
Partially accessible 3
Not accessible 5
Warning system and evacuation routes
Warning system operational and evacuation routes identified
1
Warning system operational and evacuation routes partially
identified 2
Warning system not fully operational
3
Warning system not operational 4
None 5
Based on the overlay analyses of these factors, the flood vulnerability map can be generated given the following equation:
𝑉𝑢𝑙𝑛𝑒𝑟𝑎𝑏𝑖𝑙𝑖𝑡𝑦 =𝑆𝑒𝑛𝑠𝑖𝑡𝑖𝑣𝑖𝑡𝑦 × 𝐸𝑥𝑝𝑜𝑠𝑢𝑟𝑒
𝐴𝑑𝑎𝑝𝑡𝑖𝑣𝑒 𝐶𝑎𝑝𝑎𝑐𝑖𝑡𝑦
Flood hazard maps for 2020 and 2050 can be generated based on the projected mean annual frequency of days with rainfall of at least 100 mm.
Suggested scale and color for flood vulnerability assessment.
Scale
Vulnerability Index Assigned Color
<2.8 Low Green
2.8 – 3.5 Moderate Grey
>3.5 High Blue
Training Manual on Geographic Information Systems
32
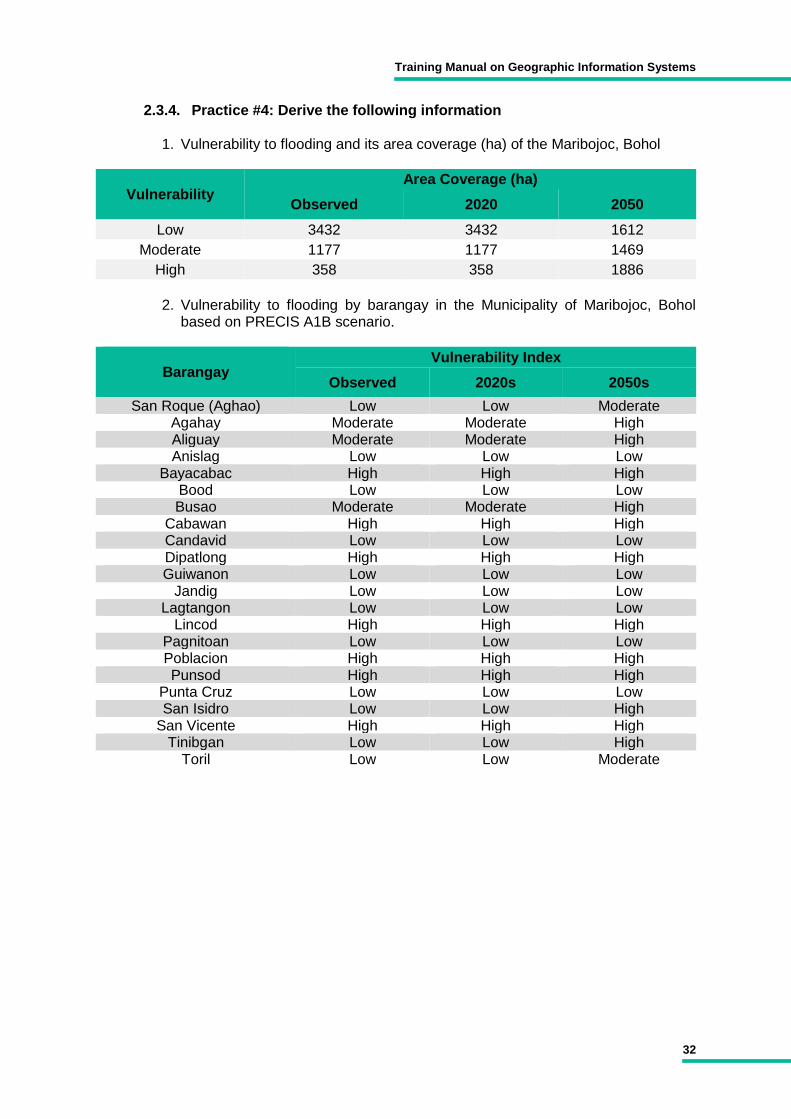
2.3.4. Practice #4: Derive the following information
1. Vulnerability to flooding and its area coverage (ha) of the Maribojoc, Bohol
Vulnerability
Area Coverage (ha)
Observed 2020 2050
Low 3432 3432 1612
Moderate 1177 1177 1469
High 358 358 1886
2. Vulnerability to flooding by barangay in the Municipality of Maribojoc, Bohol
based on PRECIS A1B scenario.
Barangay
Vulnerability Index
Observed 2020s 2050s
San Roque (Aghao) Low Low Moderate Agahay Moderate Moderate High Aliguay Moderate Moderate High Anislag Low Low Low
Bayacabac High High High Bood Low Low Low Busao Moderate Moderate High
Cabawan High High High Candavid Low Low Low Dipatlong High High High Guiwanon Low Low Low
Jandig Low Low Low Lagtangon Low Low Low
Lincod High High High Pagnitoan Low Low Low Poblacion High High High Punsod High High High
Punta Cruz Low Low Low San Isidro Low Low High
San Vicente High High High Tinibgan Low Low High
Toril Low Low Moderate

Training Manual on Geographic Information Systems
33
3. Generate flood vulnerability maps based on PRECIS model and scenario.
a.
b.

Training Manual on Geographic Information Systems
34
c.
Drought Hazard Assessment Vulnerability to drought is the relationship of susceptibility to physical factors, exposure to climatic factors, and adaptability to anthropogenic factors. Basically, each factor is assigned a relative weight according to their influence.
All factors followed the same scaling factor procedure to assess and map out vulnerable areas. Drought hazard maps for observed, 2020, and 2050 periods would be generated based on different factors and their relative weights.
Suggested scale and color for drought assessment.
Scale
Vulnerability Index Assigned Color
<2.8 Low Green
2.8 – 3.5 Moderate Grey
>3.5 High Yellow
Summary of the classified ranges for the different layers/factors considered in the drought vulnerability.

Training Manual on Geographic Information Systems
35
A. SENSITIVITY
SENSITIVITY
Layer/ Factor Classes/Ranges Relative weights
Annual Rainfall
<800 1 800 – 1200 2
1200 – 1600 3 1600 – 200 4
>2000 5
Number of dry months (Alternate indicator)
1 1 2 2 3 3 4 4
>4 5
Number of dry days (dry spell/drought) (Alternate indicator)
<3 days 1 4 – 6 2 7 – 9 3
10 - 12 4 >12 days 5
Proximity within the existing irrigation canals and rivers (buffer ranges in m)
0-250 1 250-500 2 500-1000 3
2000-3000 4 >3000 5
Types of rivers and streams
None 5 Ephemeral 4 Intermittent 3
Semi-perennial 2 Perennial 1
Number of hot days (max temperature with >35 ºC
<1 day 1 1 – 7 2 8 – 14 3
15 – 21 4 >21 days 5
B. EXPOSURE
EXPOSURE
Layer/ Factor Classes/ Ranges Relative weights
Population Density (person/ha) by barangays
<10 1 10 -50 2
50 - 100 3 100 - 500 4
>500 5
Extent of production areas/SAFDZs over total land areas (%)
<10 1 10 -20 2 20 - 30 3 30 - 40 4
>40 5

Training Manual on Geographic Information Systems
36
C. ADAPTIVE CAPACITY
ADAPTIVE CAPACITY
Layer/ Factor Classes/Ranges Relative weights
Availability of small – scale irrigation program
Available 1
Partially available 3
Not available 5
Water impounding or rain harvesting facilities
Available 1
Partially available 3 Not available 5
Maps of drought prone areas
Available 1 Partially available 3
Not available 5
Access to drought forecasting information and early warning system
Available 1 Partially available 3
Not available 5
2.3.5. Practice #5: Derive the following information
1. Vulnerability to drought and area coverage (ha) of Maribojoc, Bohol.
Vulnerability
Area Coverage (ha)
Observed
2020
2050
Low 313 313 313
Moderate 1734 1734 1734
High 2920 2920 2920
2. Vulnerability to drought by barangay in the Municipality of Maribojoc, Bohol
based on PRECIS A1B scenario.
Barangay
Vulnerability Index
Observed
2020s
2050s
San Roque (Aghao) High High High Agahay High High High Aliguay High High High Anislag High High High
Bayacabac High High High Bood Moderate Moderate Moderate Busao High High High
Cabawan High High High Candavid High High High Dipatlong High High High Guiwanon Moderate Moderate Moderate
Jandig Moderate Moderate Moderate Lagtangon Moderate Moderate Moderate
Lincod Moderate Moderate Moderate Pagnitoan Moderate Moderate Moderate Poblacion High High High

Training Manual on Geographic Information Systems
37
Barangay
Vulnerability Index
Observed
2020s
2050s
Punsod High High High Punta Cruz Moderate Moderate Moderate San Isidro High High High
San Vicente High High High Tinibgan High High High
Toril High High High
3. Generate drought vulnerability maps based on PRECIS model and scenario.
a

Training Manual on Geographic Information Systems
38
b
c
Training Manual on Geographic Information Systems
39
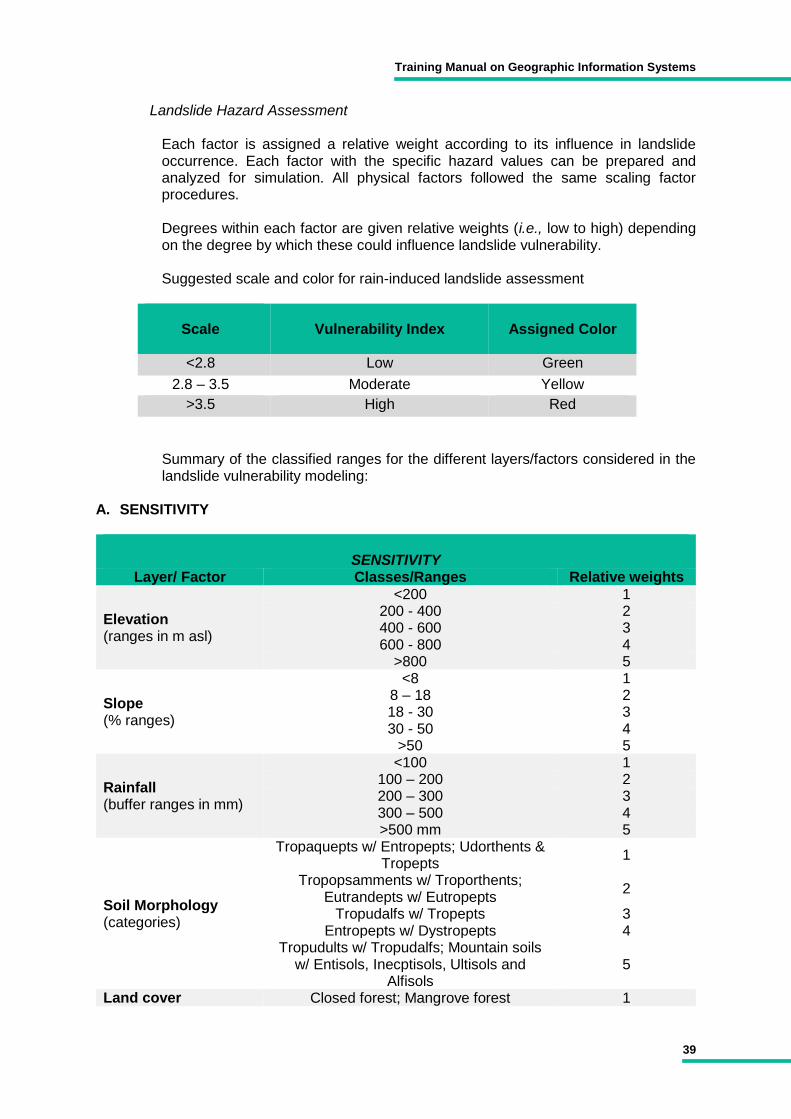
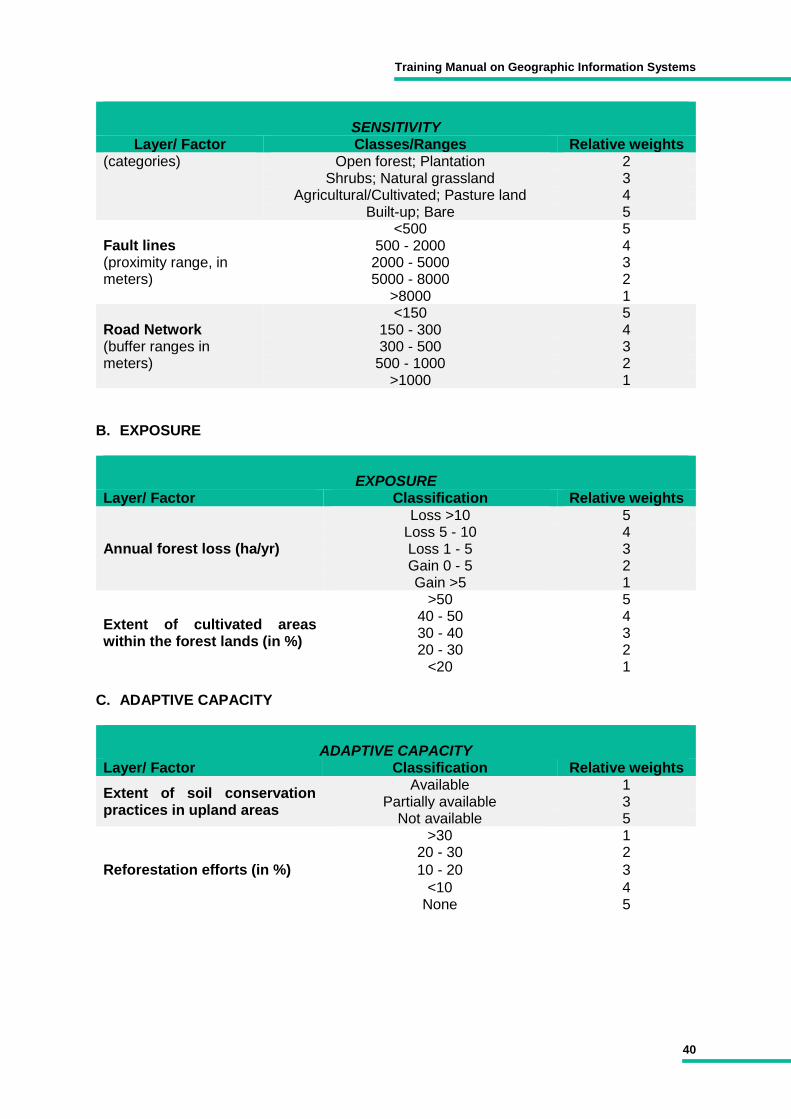
Landslide Hazard Assessment
Each factor is assigned a relative weight according to its influence in landslide occurrence. Each factor with the specific hazard values can be prepared and analyzed for simulation. All physical factors followed the same scaling factor procedures. Degrees within each factor are given relative weights (i.e., low to high) depending on the degree by which these could influence landslide vulnerability. Suggested scale and color for rain-induced landslide assessment
Scale
Vulnerability Index Assigned Color
<2.8 Low Green
2.8 – 3.5 Moderate Yellow
>3.5 High Red
Summary of the classified ranges for the different layers/factors considered in the landslide vulnerability modeling:
A. SENSITIVITY
SENSITIVITY
Layer/ Factor Classes/Ranges Relative weights
Elevation (ranges in m asl)
<200 1 200 - 400 2 400 - 600 3 600 - 800 4
>800 5
Slope (% ranges)
<8 1 8 – 18 2 18 - 30 3 30 - 50 4
>50 5
Rainfall (buffer ranges in mm)
<100 1 100 – 200 2 200 – 300 3 300 – 500 4 >500 mm 5
Soil Morphology (categories)
Tropaquepts w/ Entropepts; Udorthents & Tropepts
1
Tropopsamments w/ Troporthents; Eutrandepts w/ Eutropepts
2
Tropudalfs w/ Tropepts 3 Entropepts w/ Dystropepts 4
Tropudults w/ Tropudalfs; Mountain soils w/ Entisols, Inecptisols, Ultisols and
Alfisols 5
Land cover Closed forest; Mangrove forest 1
Training Manual on Geographic Information Systems
40
SENSITIVITY
Layer/ Factor Classes/Ranges Relative weights (categories) Open forest; Plantation 2
Shrubs; Natural grassland 3 Agricultural/Cultivated; Pasture land 4
Built-up; Bare 5
Fault lines (proximity range, in meters)
<500 5 500 - 2000 4 2000 - 5000 3 5000 - 8000 2
>8000 1
Road Network (buffer ranges in meters)
<150 5 150 - 300 4 300 - 500 3
500 - 1000 2 >1000 1
B. EXPOSURE
EXPOSURE
Layer/ Factor Classification Relative weights
Annual forest loss (ha/yr)
Loss >10 5 Loss 5 - 10 4 Loss 1 - 5 3 Gain 0 - 5 2 Gain >5 1
Extent of cultivated areas within the forest lands (in %)
>50 5 40 - 50 4 30 - 40 3 20 - 30 2
<20 1 C. ADAPTIVE CAPACITY
ADAPTIVE CAPACITY
Layer/ Factor Classification Relative weights
Extent of soil conservation practices in upland areas
Available 1 Partially available 3
Not available 5
Reforestation efforts (in %)
>30 1 20 - 30 2
10 - 20 3
<10 4 None 5

Training Manual on Geographic Information Systems
41
2.3.6. Practice #6: Derive the following information
1. Vulnerability to rain-induced landslide and area coverage (ha) of Maribojoc, Bohol.
Vulnerability
Area Coverage (ha)
Observed 2020 2050
Low 3061 3061 2388
Moderate 1599 1599 1761
High 335 335 846
2. Vulnerability to rain-induced landslide by barangay in the Municipality of Maribojoc, Bohol based on PRECIS A1B scenario.
Barangay
Vulnerability Index
Observed 2020s 2050s
San Roque (Aghao) Low Low Low Agahay Low Low Low Aliguay Moderate Moderate High Anislag Low Low Low
Bayacabac Moderate Moderate High Bood High High High Busao Low Low Moderate
Cabawan Low Low Low Candavid Low Low Moderate Dipatlong Low Low Low Guiwanon High High High
Jandig High High High Lagtangon High High High
Lincod Low Low Low Pagnitoan High High High Poblacion Low Low Low Punsod Low Low High
Punta Cruz High High High San Isidro Moderate Moderate High
San Vicente Low Low Low Tinibgan Moderate Moderate Moderate
Toril Low Low Low
Training Manual on Geographic Information Systems
42
3. Generate rain-induced landslide vulnerability maps based on PRECIS model and scenario
a
b

Training Manual on Geographic Information Systems
43
c

Training Manual on Geographic Information Systems
44
III. Frequently Asked Questions (FAQs)
The buildup of this section was based on the conduct of three batches of CORE Convergence Forum Training of Trainers, as well as the pilot-testing of the modules with select higher educational institutions (HEIs).
1. How updated are the maps are that can be downloaded from the internet?
Answer: Year 2010 for the forest cover. For small scale maps, satellite images can be downloaded, then ask someone knowledgeable in GIS to do a remote sensing analysis.
2. Clarification about the formula on VRA (which formula?): What is the
difference of the GIS formula vs. VRA Formula? Answer: Susceptibility deals more on the physical aspects. Mathematically, the formula for GIS accounts other factors.
3. In terms of zoning, what can be advised in coordinating with other officials?
Answer: In our country’s case, we only look on biophysical. In our zoning, municipalities are required to have CLUP for budgeting.
4. In generating maps, do we consider National Greening Program (NGP),
policies, and industrialization since it is predicted that these will have a great impact in the future? Answer: Yes it is considered. Adaptive capacity is included in the handout (and was also explained to the participants).
5. When it rains, higher elevations affect flooding. If the watershed gets
destroyed, will that cause flooding in lowlands? Answer: Yes, the case of Ormoc (flood occurred without rains) serves as the evidence.
6. In scaling of values, if the value is exactly 500, where should it be classified?
Answer: It should be classified under “500 and above” category, since classifying must not break, or else the data will be unorganized or the map not generated.
7. Can buffer be used in Quantum software?
Answer: Yes, but there is a repetition in the process.
8. What is the best advice in using barangay data? Answer: Barangay data available online when validated on the ground are sometimes not accurate. Therefore, it is best to gather data directly from barangay officials since they know more about their area and its boundary.

Training Manual on Geographic Information Systems
45
9. How do we acquire the same data for Iloilo?
Answer: Data can be requested in Philippine Atmospheric, Geophysical and Astronomical Services Administration (PAGASA), as it can also give data other than the PRECIS model. For other data sets, you can visit www. philgis.gov.ph to access the shapefiles of the provinces.
10. Can the number of data available change the map?
Answer: Yes. But data manipulation in GIS must be based on expert judgment. For instance, once can perform multi-criteria analysis and evidence- based approaches since provinces have different rainfall patterns.
11. Can the VRA results be adjusted after data collection?
Answer: Yes, using expert judgment. For instance, consider ground control points.
12. Does the Philippines have a geo-hazard maps in which we can see small
areas prone to landslide and floods? Answer: Yes. For such cases, the Mines and Geosciences Bureau of the Department of Environment and Natural Resources (DENR) is responsible in generating maps. They can also provide locative information of sink holes, fault lines, etc.
13. How can we effectively analyze land cover?
Answer: There are lots of other contributing factors in rating the land cover. This can be effectively done by analyzing the soil type, slope, and formation.

Training Manual on Geographic Information Systems
46
IV. Capacity Assessment Tool
4.1. Pre-Training Assessment
1. It is a component of GIS that pertains to various computer programs that provide the functions and tools needed to store, analyze, and display geographic information.
a. Data c. Software b. Hardware d. Method
2. This data structure is represented in a grid or pixel that is referenced to some coordinate
system. a. Geometric c. Vector b. Attribute d. Raster
3. A set of tools for collecting, storing, retrieving, transforming, and displaying spatial data
from the real world for a particular set of purpose a. Remote Sensing c. Geographic Information System b. Global Positioning System d. Engineering
4. This is an earth-centered datum that is commonly used as the reference coordinate system
of GPS. a. Luzon 1911 c. WGS 84 b. PRS 1992 d. Clarke 1866
5. It is a type of attribute data that describes attribute values that are ordered from high to
low. a. Nominal c. Ordinal b. Ratio d. Interval
6. Space-based radio systems that provide three-dimension position, velocity, and time, 24
hours a day, in all weather, to suitably equip users anywhere in the world a. Remote Sensing c. Geographic Information System b. Global Positioning System d. Engineering
7. The mathematical system by which the spherical surface of the earth is transferred to the
plane surface of the map c. Grid c. Geographic values d. Projection d. Scale
8. It expresses the relationship between a distance on the map and the distance on the
ground measured in the same unit. a. Grid c. Geographic values b. Projection d. Scale
9. A reduced and simplified graphical representation of a part or parts of the earth’s surface on a plane
a. Google Earth c. GSP Finder b. Map d. Elevation
10. It measures distance from 0º to 90º north and south of the equator
a. Meridian c. Longitude b. Latitude d. Equator

Training Manual on Geographic Information Systems
47
4.2. Post Training Assessment
1. It is a component of GIS that pertains to various computer programs that provide the functions and tools needed to store, analyze, and display geographic information.
a. Data c. Software b. Hardware d. Method
2. This data structure is represented in a grid or pixel that is referenced to some coordinate
system. a. Geometric c. Vector b. Attribute d. Raster
3. A set of tools for collecting, storing, retrieving, transforming, and displaying spatial data
from the real world for a particular set of purpose. a. Remote Sensing c. Geographic Information System b. Global Positioning System d. Engineering
4. This is an earth-centered datum that is commonly used as the reference coordinate system
of GPS. a. Luzon 1911 c. WGS 84 b. PRS 1992 d. Clarke 1866
5. It is a type of attribute data that describes attribute values that are ordered from high to
low. a. Nominal c. Ordinal b. Ratio d. Interval
6. Space-based radio systems that provide three-dimension position, velocity, and time, 24
hours a day, in all weather, to suitably equip users anywhere in the world. a. Remote Sensing c. Geographic Information System b. Global Positioning System d. Engineering
7. The mathematical system by which the spherical surface of the earth is transferred to the
plane surface of the map. a. Grid c. Geographic values b. Projection d. Scale
8. It expresses the relationship between a distance on the map and the distance on the
ground measured in the same unit. a. Grid c. Geographic values b. Projection d. Scale
9. A reduced and simplified graphical representation of a part or parts of the earth’s surface
on a plane. a. Google Earth c. GSP Finder b. Map d. Elevation
10. It measures distance from 0º to 90º north and south of the equator.
a. Meridian c. Longitude b. Latitude d. Equator

Training Manual on Geographic Information Systems
48
V. Reading Materials/ References
Arizapa J.L., Combalicer E.A. and Tiburan C.L. Jr. 2015. Landslide Susceptibility Assessment and Mapping of Pagsanjan-Lumban Watershed Using GIS and Analytical Hierarchy Process. Ecosystem & Development Journal 5(2): 15-24. Bantayan N.C., Ong S.C.A. and Palijon A.M. 2000. Charting Landscapes the GIS Way. In: GEO Asia Pacific. December 1999/January 2000 Isuue. 21-25. Bantayan N.C., Combalicer E.A., Tiburan, C.L., Barua, L.B., and Dida, J.J.V. 2015. GIS in the Philippines Principles and Applications in Forestry and Natural Resources. UPLB. 168p. Burrough P.A. 1986. Principles of geographic information system for land resources assessment. Oxford: Claredon Press. pp. 1-12. Carter J.R. 1989. On defining the geographic information system. In Ripple, W. J. (ed.). Fundamentals of geographic information systems: a compendium. ASPRS/ACSM, Fall Claursel, Virginia. CFSHD-DAP. 2015. Vulnerability and Adaptation Assessment in Eastern Samar (Revised Initial Assessment Report). 177p. Cruz, R. V. O., Lasco, R. D., Pulhin, J. M., Pulhin, F. B., and Garcia, K. B. 2005. Assessment of Climate Change Impacts, Vulnerability and Adaptation: Water Resources of Pantabangan-Carranglan Watershed. Environmental Forestry Programme. College of Forestry and Natural Resources. University of the Philippines Los Baños. Laguna. Philippines. Assessments of Impacts and Adaptations to Climate Change (AIACC), AIACC-AS21 Working Paper_N09, a joint project of START, the Third World Academy of Sciences, and the UN Environment Programme. De Asis, A. 1998. A GIS-aided soil erosion potential based solution to UP Land Grant allocation problem. MS Thesis. UPLB, College, Laguna, Phil. 86 pp. DENR Administrative Order 2008-26. Quezon City, Philippines DENR-R4. 2013. Watershed Characterization and Vulnerability Assessment of the San Juan River Watershed. Volume 1. Calamba City. 156p. Eastman, R. 1997. User’s guide for IDRISI for Windows. Clark Univ., Worcester, USA. pp. 18-95. EDC. 2012. EDC Water Balance Assessment Report. Ortigas, Manila. 59p. Fisher P.F. and Lindenberg R.E. 1989. On Distinctions among Cartography, Remote Sensing, and Geographic Information Systems. Photogrammetric Engineering and Remote Sensing 55 (10): 1431-1434. Food and Agricultural Organizations of the United Nations (FAO). 2003. The Digital Soil Map of the World (Version 3.6), Rome, Italy.
Training Manual on Geographic Information Systems
49
Itami R. and Rauling R. 1993. SAGE introductory guidebook. Digital Land Research, Australia. pp. 1-4. Mabbutt J.A. 1968. Review of Concepts of Land Classification. In Land Evaluation. A paper of a CSIRO symposium, Edited by GA Steward. Canberra: MacMillan. 11-28. Nearing M.A., Lane L.I. and Lopez V.L. 1994. Modeling Soil Erosion. In soil erosion research methods. Edited by Lal R. Delray Beach: St. Lucie Press. Plaster, E.J. 2003. Soil Science and Management. 4th Ed. NY: Clifton Park. Presidential Decree # 705. 1975. Revised Forestry Code of the Philippines. Republic Act No. 8371. An Act for Indigenous People’s Rights. Manila, Philippines Republic Act No. 10121. Philippine Disaster Risk Reduction and Management Act of 2010. Manila, Philippines USAID-DENR, 2015. Baseline Assessment: Vulnerability Assessment of Northern Sierra Madre Natural Park (A Technical Report). Philippines Biodiversity and Watersheds Improved for Stronger Economy and Ecosystem Resilience (B+WISER) Program. USAID-DENR, 2015. Baseline Assessment: Vulnerability Assessment of Quinali “A” Watershed (A Technical Report). Philippines Biodiversity and Watersheds Improved for Stronger Economy and Ecosystem Resilience (B+WISER) Program. USAID-DENR, 2015. Baseline Assessment: Vulnerability Assessment of Mt Kitanglad Natural Park (A Technical Report). Philippines Biodiversity and Watersheds Improved for Stronger Economy and Ecosystem Resilience (B+WISER) Program. USAID-DENR, 2015. Baseline Assessment: Vulnerability Assessment of the Bago Watershed (A Technical Report). Philippines Biodiversity and Watersheds Improved for Stronger Economy and Ecosystem Resilience (B+WISER) Program. Wischmeier W.H. and Smith D.D. 1978. Predicting rainfall erosion losses. Agric. Handbook, 537. Woodridge D. 1990. Manual on land-use survey and capability classification for upland watersheds. ASEAN-US Watershed Project, Coll., Lag., Philippines

50